what's new in performance toolkit for vm in version 5.1 · figure 2 shows an existing vmprf...
TRANSCRIPT

What's new in Performance Toolkitfor VM in Version 5.1.0
June 2004
Table of Contents
Page 22About the authors . . . . . . . . . . . . . . . . . . . . . . . . . . . . . . . . . . . . . . . . . . . . .Page 21Where to find more information . . . . . . . . . . . . . . . . . . . . . . . . . . . . . .Page 16New Linux support . . . . . . . . . . . . . . . . . . . . . . . . . . . . . . . . . . . . . . . . . . . . . .Page 13Creating PERFKIT files similar to VMPRF . . . . . . . . . . . . . . . . . . . . . . . . . . . . . . .Page 3The MASTER file, input files, and output files . . . . . . . . . . . . . . . . . . . . . . . . . . . . .Page 2
PERFKIT batch processing and its relation to VM PerformanceReporting Facility . . . . . . . . . . . . . . . . . . . . . . . . . . . . . . . . . . . . . . . . . . . . . .
Page 2What’s new in Performance Toolkit for VM in V510 . . . . . . . . . . . . . . . . . . . .
What's new in Performance Toolkit for VM in Version 5.1.0TOC
What’s new in Performance Toolkit for VM in V5.1.0Performance Toolkit for VM™ is a pre-installed, priced optional feature of z/VM® that wasintroduced with z/VM 4.4.0 and is based on the FCON/ESA offering. Performance Toolkit forVM is a full-screen operator’s console and performance monitoring program that includes theability to view performance data from z/VM systems from the Web. This article focuses onfunction added with the z/VM 5.1.0 level of Performance Toolkit for VM (FL510). Theprimary objectives of this level of Performance Toolkit for VM are:
• Providing function similar to the VM Performance Reporting Facility• Support for newly-available monitor data from Linux®.
PERFKIT batch processing and its relation to VM Performance Reporting FacilityPrinted reports and performance history files have traditionally been created by programsthat process monitor data saved to disk or tape in batch mode using products like IBM’s VMPerformance Reporting Facility (VMPRF). Performance Toolkit for VM is designed to processCP monitor data directly from the monitor saved segment (MONDCSS), allowing you toanalyze the system’s performance in real time. Printed reports and performance history filescan be produced by Performance Toolkit for VM as a byproduct of normal real timeoperation without the overhead of first saving the monitor data in a disk or tape file for laterbatch processing.
However, there are times when you need to process a monitor data file saved on disk or tape,either for detailed analysis of a problem on your system or for analysis of data obtained fromanother VM system. Performance Toolkit for VM currently provides the interactive monitordata scan mode (MONSCAN) which allows you to view the saved monitor data as if you wereusing Performance Toolkit for VM in real time. The menus and screens appear the same, but reports are limited to those derived from the saved monitor data.
With Performance Toolkit for VM FL510, a second method, operation in batch mode, allowsyou to process the saved monitor data using a set of control input and output files to createreports and performance history files. If you are familiar with VMPRF, you will findsimilarities in the way batch mode is controlled in Performance Toolkit for VM. However,there are differences and it is recommended you migrate your existing VMPRF reports andperformance history files to Performance Toolkit for VM.
Invoke Performance Toolkit for VM batch mode by issuing the PERFKIT command witheither the BATCH option or the VMPRF option. To ease the migration from VMPRF, theVMPRF option is provided as an aid to assist you in converting your VMPRF control files and
What's new in Performance Toolkit for VM in Version 5.1.0Page 2
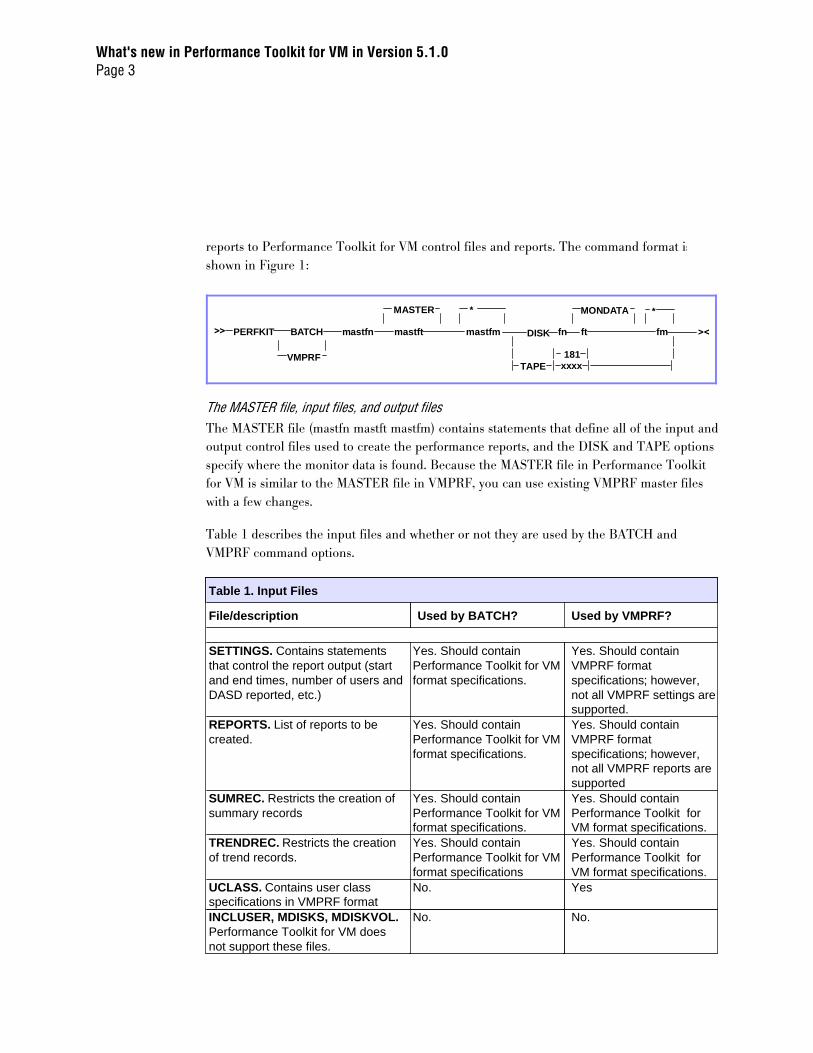
reports to Performance Toolkit for VM control files and reports. The command format isshown in Figure 1:
The MASTER file, input files, and output filesThe MASTER file (mastfn mastft mastfm) contains statements that define all of the input andoutput control files used to create the performance reports, and the DISK and TAPE optionsspecify where the monitor data is found. Because the MASTER file in Performance Toolkitfor VM is similar to the MASTER file in VMPRF, you can use existing VMPRF master fileswith a few changes.
Table 1 describes the input files and whether or not they are used by the BATCH andVMPRF command options.
No.No.INCLUSER, MDISKS, MDISKVOL.Performance Toolkit for VM doesnot support these files.
YesNo.UCLASS. Contains user classspecifications in VMPRF format
Yes. Should contain Performance Toolkit forVM format specifications.
Yes. Should contain Performance Toolkit for VMformat specifications
TRENDREC. Restricts the creationof trend records.
Yes. Should contain Performance Toolkit forVM format specifications.
Yes. Should contain Performance Toolkit for VMformat specifications.
SUMREC. Restricts the creation ofsummary records
Yes. Should containVMPRF formatspecifications; however,not all VMPRF reports aresupported
Yes. Should contain Performance Toolkit for VMformat specifications.
REPORTS. List of reports to becreated.
Yes. Should containVMPRF formatspecifications; however,not all VMPRF settings aresupported.
Yes. Should containPerformance Toolkit for VMformat specifications.
SETTINGS. Contains statementsthat control the report output (startand end times, number of users andDASD reported, etc.)
Used by VMPRF?Used by BATCH?File/description
Table 1. Input Files
What's new in Performance Toolkit for VM in Version 5.1.0Page 3
PERFKIT BATCH mastfn mastft mastfm DISK fn ft fm>> ><
VMPRF
MASTER * MONDATA *
181TAPE xxxx

Table 2 describes the output files created by the BATCH and VMPRF command options
YesYesTREND. Created when specified in the MASTER file and contains trendrecords. Different from trend records created by VMPRF. In VMPRF, thetrend records are specified in the REPORTS file and begin withTREND_. In Performance Toolkit for VM, all trend records are createdwhenever the TREND file is specified in the MASTER file. Becauserequesting all trend records can cause large and detailed files, theTRENDREC file specifications allow you to specify only the records youwant created. Additional record creation can be restricted for recordsrelated to users and devices.
YesYesSUMMARY. Created when specified in the MASTER file and containssummary records. Different from summary records created by VMPRF.In VMPRF, the summary records are specified in the REPORTS file andbegin with SUMMARY_. In Performance Toolkit for VM, all summaryrecords are created whenever the SUMMARY file is specified in theMASTER file. Because requesting all summary records can cause largeand detailed files, the SUMREC file specifications allow you to specifyonly the records you want created. Additional record creation can berestricted for records related to users and devices.
YesYesRUNFILE. Contains detailed information on the most recent batch run.The information includes informational, error and warning messages,monitor data used, notices of which files were used during processing, alisting of input and output file specifications, and the commands used tocontrol the report output. Any existing RUNFILE will be replaced witheach batch invocation. The contents of this file are similar to the contentsof the file in VMPRF.
YesYesLISTING. Contains the reports specified in the REPORTS file. The firstpage contains a table of contents that shows the reports listed in the filefollowed by the reports in the order they were specified in the REPORTSfile. Interim reports are an exception: those reports are appended to theend of the reports for the overall reporting period. The interim reports arelisted together with their own table of contents for each interim interval.All of the reports in the REPORTS file are Performance Toolkit for VMreports even when the VMPRF option is specified.
YesYesLOG. Keeps a running log of PERFKIT BATCH or VMPRF invocations.Each invocation adds entries to the file that includes the start and endtime for each run, the CPU consumption, and the return code. If the filealready exists, new entries are appended to the end of the file. Thecontents of this file are similar to the contents of the file in VMPRF.
Used byVMPRF?
Used byBATCH?
File/description
Table 2. Output Files
What's new in Performance Toolkit for VM in Version 5.1.0Page 4

YesNoFCXEQUIV. This file contains a list of equivalent Performance Toolkit forVM reports for the VMPRF reports specified in the REPORTS file. Youcan use this file to assist you in creating a new REPORTS file for usewith the BATCH option. The FCXEQUIV file is written to the user’sA-disk and the file name for the FCXEQUIV file will be the same as theREPORTS file name specified in the MASTER file.
To help you in understand how to convert your existing VMPRF files, consider the followingexample:
Figure 2:********************************Sample Master File********************************
***Input Parameter Files***SETTINGS VMPRF SETTINGS *REPORTS VMPRF REPORTS *UCLASS VMPRF UCLASS *
***Not Supported in Performance Toolkit for VM****INCLUSER*MDISKS*MDISKVOL
***OUTPUT FILES***LISTING VMPRF LISTING BLOG VMPRF LOG BRUNFILE VMPRF RUNFILE B
Figure 2 shows an existing VMPRF MASTER file executed using the VMPRF option of thePERFKIT command. The SETTINGS, REPORTS, and UCLASS files processed duringexecution represent existing VMPRF control files containing information in a formatexpected by VMPRF. An ‘*’ in column 1 indicates a comment causing that line to be ignored.
The next three figures show examples of existing VMPRF SETTINGS, REPORTS, andUCLASS files and are discussed throughout the example.
What's new in Performance Toolkit for VM in Version 5.1.0Page 5

The sample VMPRF SETTINGS file contains:
Figure 3:*************************************************************** VMPRF SETTINGS (Parameter Settings) file*************************************************************** SYSTEM "VMPRF sample" SYSTEMID ZVM430 BYTIME 5 minutes INTERIM 5 minutes SDATE 05/22/1996 EDATE 01/01/2000 STIME 10:00:00 ETIME 12:00 REPORTUSERS 100 reportdasd 100
The sample VMPRF REPORTS file contains:
Figure 4:************************************ Report Selection File***********************************
** Reports REPORT_TABLE_OF_CONTENTS MONITOR_DATA MONITOR_SETTINGS_BY_EVENT SYSTEM_SUMMARY_BY_TIME SYSTEM_SUMMARY2_BY_TIME SYSTEM_CONFIGURATION USER_RESOURCE_UTIL DEVICE_CONFIGURATION
** Summary records SUMMARY_SYSTEM SUMMARY_PROCESSOR
** Trend records TREND_SYSTEM TREND_PROCESSOR
What's new in Performance Toolkit for VM in Version 5.1.0Page 6

The sample VMPRF UCLASS file contains:
Figure 5:******************************* User Classes****************************** EVRYBODYMAINT MAINT
When you execute the command:
PERFKIT VMPRF SAMPLE MASTER B DISK ZVM430 MONDATA D
The VMPRF LOG, VMPRF RUNFILE, and VMPRF LISTING files are created on the B-disk.In addition the VMPRF FCXEQUIV file is created on the A-disk.
The VMPRF LOG file contains:
Figure 6:
25 Apr 2004 22:08:03 PERFKIT Version FL510 at Fix Level 00 25 Apr 2004 22:08:03 PERFKIT Arguments passed for VMPRF emulation: 25 Apr 2004 22:08:03 PERFKIT VMPRF SAMPLE MASTER B DISK ZVM430 MONDATA 25 Apr 2004 22:08:03 PERFKIT Reduction Started 25 Apr 2004 22:08:06 PERFKIT Vtime=.12, Ttime=.20, Connect time 3 sec. 25 Apr 2004 22:08:06 PERFKIT Reduction Completed, Rc= 4
The contents of the VMPRF LOG file in Figure 6 is similar to the information produced byVMPRF. Included in the file is the level of Performance Toolkit for VM, the argumentspassed to the PERFKIT command, the time the command took to execute, and the returncode.
A partial VMPRF LISTING file is shown in Figure 7 and contains the reports generated. Thetable of contents within the listing file shows the Performance Toolkit for VM reports created.The rest of the VMPRF LISTING file is not shown, but contains the actual reports. Inaddition, following the reports listed in the table of contents, are the interim reports created,which are also not shown.
Figure 7: Partial Contents of the VMPRF LISTING File
FCXTOC Run 2004/04/25 22:08:06 Table of Contents PERFKIT Reports in Order of Appearance From 2002/01/22 10:37:27 To 2002/01/22 11:55:33 For 4686 Secs 01:18:06 VMPRF sample
What's new in Performance Toolkit for VM in Version 5.1.0Page 7

_______________________________________________________________________ Rpt ID Report Description Page From Time To Time FCX155 Count and Size of Processed Monitor Records 1 10:37:33 - 11:55:33FCX149 Monitor Settings: Initial and Changed 3 10:37:33 - 11:55:33FCX225 System Performance Summary by Time 4 10:37:33 - 11:55:33FCX239 Processor Performance Summary by Time 5 10:37:33 - 11:55:33FCX180 System Configuration, Initial and Changed 6 10:37:27 - 11:55:33FCX112 General User Resource Utilization 7 10:37:33 - 11:55:33 FCX131 I/O Device Configuration 8 ----------- - 11:55:33
Notice that a VMPRF FCXEQUIV file was created on the A-disk. Figure 8 shows the contentsof this file, which contains a list of the Performance Toolkit for VM report names used tocreate the LISTING file.
Figure 8: Contents of the VMPRF FCXEQUIV File
MONDATAMONSETSYSSUMLGPROCSUMSYSCONFUSER (SORT TCPUDEVCONF
The final output file created is the VMPRF RUNFILE file. When converting from VMPRF toPerformance Toolkit for VM, this file contains useful information. In the file you will finddetailed information on the most recent batch mode execution. This information includes:
• Informational, error, and warning messages• Information on the monitor data used• Notice of which files were used during processing• Listing of the input and output file specifications• FCONTROL subcommands used to control the report output.
For clarity, the VMPRF RUNFILE has been divided into sections with explanations after eachsection in the file.
Figure 9: First section of the VMPRF RUNFILE
25 Apr 2004 22:26:07 PERFKIT Version FL510 at Fix Level 0025 Apr 2004 22:26:07 PERFKIT Arguments passed for VMPRF emulation:25 Apr 2004 22:26:07 PERFKIT VMPRF SAMPLE MASTER B DISK ZVM430 MONDATA
What's new in Performance Toolkit for VM in Version 5.1.0Page 8

The first three lines of the VMPRF RUNFILE show the level of Performance Toolkit for VMand the arguments passed on the PERFKIT command.
The next four sections detail the processing of the MASTER file and the three input filesspecified within the MASTER file. The information in these sections can be used to convertyour VMPRF format files to Performance Toolkit for VM format.
Figure 10: Processing of the SAMPLE MASTER File
22:26:07 * Processing MASTER file 'SAMPLE MASTER B'SAMPLE MASTER B: ************************************************************SAMPLE MASTER B: *SAMPLE MASTER B: * Sample MASTER fileSAMPLE MASTER B: *SAMPLE MASTER B: ************************************************************SAMPLE MASTER B: *** Input Parameter Files ***SAMPLE MASTER B: SETTINGS VMPRF SETTINGS *SAMPLE MASTER B: REPORTS VMPRF REPORTS *SAMPLE MASTER B: UCLASS VMPRF UCLASS *SAMPLE MASTER B: *** Not Supported in Performance Toolkit for VM ***SAMPLE MASTER B: *INCLUSERSAMPLE MASTER B: *MDISKSSAMPLE MASTER B: *MDISKVOLSAMPLE MASTER B: *** Output Files ***SAMPLE MASTER B: LISTING VMPRF LISTING BSAMPLE MASTER B: LOG VMPRF LOG BSAMPLE MASTER B: RUNFILE VMPRF RUNFILE B22:26:07 =Basic=> FC SET SUMREC FCONX SUMREC *22:26:07 =Basic=> FC SET TRENDREC FCONX TRENDREC *22:26:07 =Basic=> FC SET REPFILID VMPRF LISTING B22:26:07 =Basic=> FC TRACE RESET ONFCXCMK603I RESET trace activated
Beginning with the line ‘* Processing MASTER file ‘SAMPLE MASTER B’ you see the entireSAMPLE MASTER file. Following the MASTER file are four FC or FCONTROL commands.These are the commands passed to the batch processing and indicate the names of the filesused. You do not need to specify these commands because they are generated automaticallyduring processing. Note that the SUMREC and TRENDREC file specifications are set to thedefaults (FCONX SUMREC and FCONX TRENDREC), because they were not specified in theMASTER file.
What's new in Performance Toolkit for VM in Version 5.1.0Page 9

Figure 11: Processing of the SETTINGS File
22:26:07 * Processing SETTINGS file 'VMPRF SETTINGS *' VMPRF SETTINGS *: ************************************************************ VMPRF SETTINGS *: * VMPRF SETTINGS *: * VMPRF SETTINGS (Parameter Settings) file VMPRF SETTINGS *: * VMPRF SETTINGS *: ************************************************************ VMPRF SETTINGS *: * VMPRF SETTINGS *: system "VMPRF sample"22:26:07 =Basic=> FC SET SYSTEM VMPRF sample VMPRF SETTINGS *: systemid ZVM43022:26:07 =Basic=> FC SET SYSTEMID ZVM430 VMPRF SETTINGS *: bytime 5 minutes22:26:07 =Basic=> FC SET BYTIME 5 MIN VMPRF SETTINGS *: interim 5 minutes22:26:07 =Basic=> FC SET INTERIM 5 MIN VMPRF SETTINGS *: sdate 05/22/1996FCXBAF651I VMPRF Parameter SDATE not supported VMPRF SETTINGS *: edate 01/01/2000FCXBAF651I VMPRF Parameter EDATE not supported VMPRF SETTINGS *: stime 10:00:00 VMPRF SETTINGS *: etime 12:00 VMPRF SETTINGS *: reportusers 10022:26:07 =Basic=> FC SET MAXUSERS 100 VMPRF SETTINGS *: reportdasd 10022:26:07 =Basic=> FC SET MAXDEVS 10022:26:07 =Basic=> FC SET PAGESIZE 6022:26:07 * SETTINGS file processing completed with RC 4
The next section, beginning with the line ‘* Processing the SETTINGS file ‘VMPRF SETTINGS *’, contains the entire SETTINGS file along with a description of how the file wasprocessed. Here you see each VMPRF setting and the actual Performance Toolkit for VM FCcommand issued. To convert your VMPRF format SETTINGS file to the format expected inPerformance Toolkit for VM, you would use the FC commands in this section.
For example:
‘SYSTEM “VMPRF sample”
Would appear in a Performance Toolkit for VM SETTINGS file as:
‘FC SET SYSTEM VMPRF sample’
Also included in this section are messages indicating VMPRF settings that are no longervalid: in this case, the SDATE and EDATE settings. Finally, since VMPRF supported certain
What's new in Performance Toolkit for VM in Version 5.1.0Page 10

default values for some of the settings values, you might also see FC commands that allowyou to maintain these default values in your reports in Performance Toolkit for VM. In theexample, such a command is the FC SET PAGESIZE 60 command. Also note that theSTIME and ETIME settings appear to be ignored, though they are not; these settings arediscussed later. At the end of this section you see the SETTINGS file completed with areturn code of 4. The return code of 4 is indicated because the SDATE and EDATE settingsare no longer supported.
Figure 12: Processing of the REPORT File
22:26:07 * Processing REPORTS file 'VMPRF REPORTS *' VMPRF REPORTS *: ****************************************************************** VMPRF REPORTS *: * Report Selection File: VMPRF REPORTS * VMPRF REPORTS *: ****************************************************************** VMPRF REPORTS *: ** Reports VMPRF REPORTS *: REPORT_TABLE_OF_CONTENTS VMPRF REPORTS *: MONITOR_DATA VMPRF REPORTS *: MONITOR_SETTINGS_BY_EVENT VMPRF REPORTS *: SYSTEM_SUMMARY_BY_TIME VMPRF REPORTS *: SYSTEM_SUMMARY2_BY_TIME VMPRF REPORTS *: SYSTEM_CONFIGURATION VMPRF REPORTS *: USER_RESOURCE_UTIL VMPRF REPORTS *: DEVICE_CONFIGURATION VMPRF REPORTS *: ** Summary records VMPRF REPORTS *: SUMMARY_SYSTEM FCXBAF659I SUMMARY record creation controlled by SUMREC control file VMPRF REPORTS *: SUMMARY_PROCESSOR VMPRF REPORTS *: ** Trend records VMPRF REPORTS *: TREND_SYSTEM FCXBAF659I TREND record creation controlled by TRENDREC control file VMPRF REPORTS *: TREND_PROCESSOR22:26:07 * Equivalent reports file VMPRF FCXEQUIV A built22:26:07 =Basic=> FC SET REPORTS VMPRF FCXEQUIV A22:26:07 * REPORTS file processing completed with RC 0
Following the processing of the SETTINGS file is the information on the processing of theREPORTS file. Here you will find a listing of the contents of your REPORTS file and anyinformation on reports no longer supported. One area where Performance Toolkit for VMdiffers from VMPRF is in the area of summary and trend records. In VMPRF you specifiedthe creation of summary and trend records by listing the individual records you want created.They are indicated by a report name beginning with either SUMMARY_ or TREND_. InPerformance Toolkit for VM, these report names are ignored. Summary and trend records arecreated only if you provide the SUMMARY and TREND output file specifications in theMASTER file. If you specify SUMMARY and TREND outputs, all summary and trend recordsare created. Summary and trend files can become large and contain detailed information that
What's new in Performance Toolkit for VM in Version 5.1.0Page 11
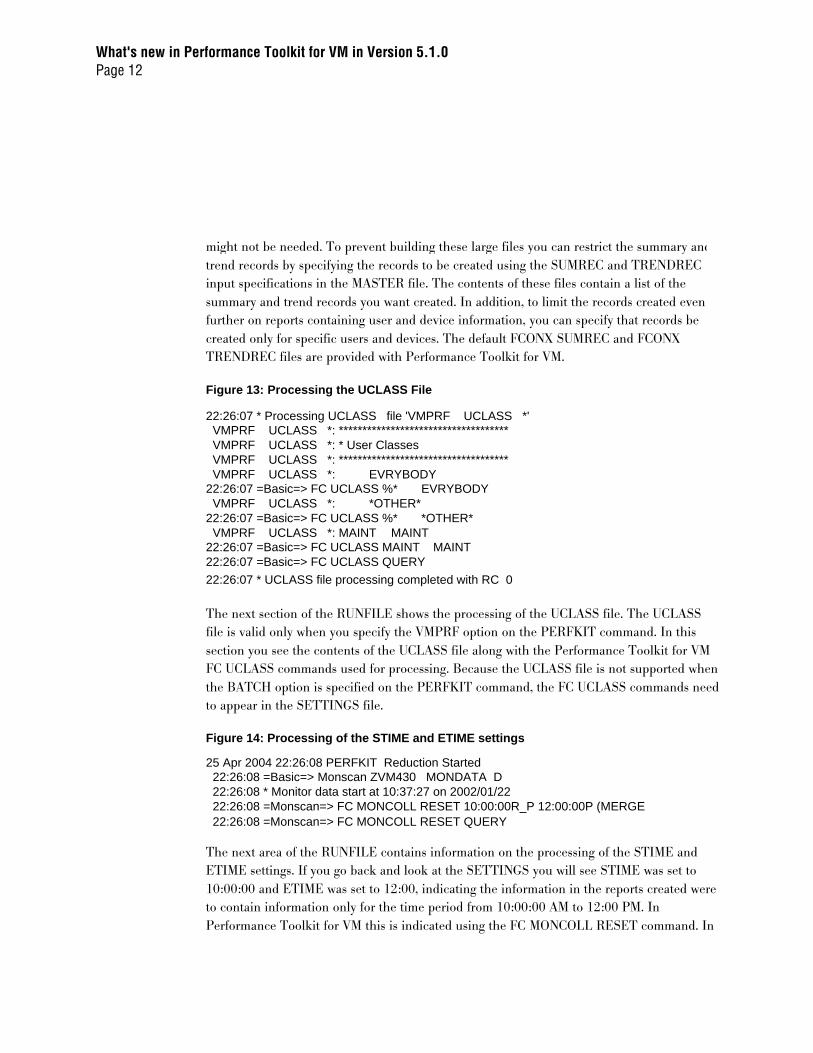
might not be needed. To prevent building these large files you can restrict the summary andtrend records by specifying the records to be created using the SUMREC and TRENDRECinput specifications in the MASTER file. The contents of these files contain a list of thesummary and trend records you want created. In addition, to limit the records created evenfurther on reports containing user and device information, you can specify that records becreated only for specific users and devices. The default FCONX SUMREC and FCONXTRENDREC files are provided with Performance Toolkit for VM.
Figure 13: Processing the UCLASS File
22:26:07 * Processing UCLASS file 'VMPRF UCLASS *' VMPRF UCLASS *: ************************************ VMPRF UCLASS *: * User Classes VMPRF UCLASS *: ************************************ VMPRF UCLASS *: EVRYBODY22:26:07 =Basic=> FC UCLASS %* EVRYBODY VMPRF UCLASS *: *OTHER*22:26:07 =Basic=> FC UCLASS %* *OTHER* VMPRF UCLASS *: MAINT MAINT22:26:07 =Basic=> FC UCLASS MAINT MAINT22:26:07 =Basic=> FC UCLASS QUERY
22:26:07 * UCLASS file processing completed with RC 0
The next section of the RUNFILE shows the processing of the UCLASS file. The UCLASS file is valid only when you specify the VMPRF option on the PERFKIT command. In thissection you see the contents of the UCLASS file along with the Performance Toolkit for VMFC UCLASS commands used for processing. Because the UCLASS file is not supported whenthe BATCH option is specified on the PERFKIT command, the FC UCLASS commands needto appear in the SETTINGS file.
Figure 14: Processing of the STIME and ETIME settings
25 Apr 2004 22:26:08 PERFKIT Reduction Started 22:26:08 =Basic=> Monscan ZVM430 MONDATA D 22:26:08 * Monitor data start at 10:37:27 on 2002/01/22 22:26:08 =Monscan=> FC MONCOLL RESET 10:00:00R_P 12:00:00P (MERGE 22:26:08 =Monscan=> FC MONCOLL RESET QUERY
The next area of the RUNFILE contains information on the processing of the STIME andETIME settings. If you go back and look at the SETTINGS you will see STIME was set to10:00:00 and ETIME was set to 12:00, indicating the information in the reports created wereto contain information only for the time period from 10:00:00 AM to 12:00 PM. InPerformance Toolkit for VM this is indicated using the FC MONCOLL RESET command. In
What's new in Performance Toolkit for VM in Version 5.1.0Page 12
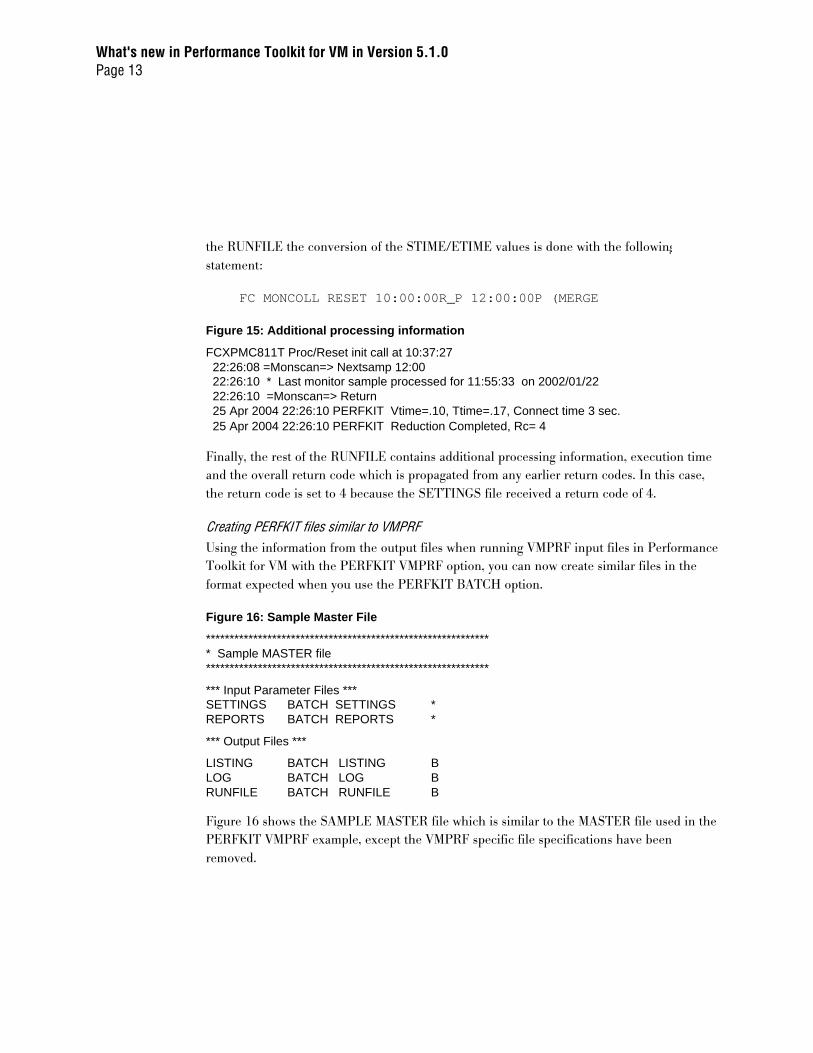
the RUNFILE the conversion of the STIME/ETIME values is done with the followingstatement:
FC MONCOLL RESET 10:00:00R_P 12:00:00P (MERGE
Figure 15: Additional processing information
FCXPMC811T Proc/Reset init call at 10:37:27 22:26:08 =Monscan=> Nextsamp 12:00 22:26:10 * Last monitor sample processed for 11:55:33 on 2002/01/22 22:26:10 =Monscan=> Return 25 Apr 2004 22:26:10 PERFKIT Vtime=.10, Ttime=.17, Connect time 3 sec. 25 Apr 2004 22:26:10 PERFKIT Reduction Completed, Rc= 4
Finally, the rest of the RUNFILE contains additional processing information, execution timeand the overall return code which is propagated from any earlier return codes. In this case,the return code is set to 4 because the SETTINGS file received a return code of 4.
Creating PERFKIT files similar to VMPRFUsing the information from the output files when running VMPRF input files in PerformanceToolkit for VM with the PERFKIT VMPRF option, you can now create similar files in theformat expected when you use the PERFKIT BATCH option.
Figure 16: Sample Master File
************************************************************ * Sample MASTER file ************************************************************
*** Input Parameter Files *** SETTINGS BATCH SETTINGS * REPORTS BATCH REPORTS *
*** Output Files ***
LISTING BATCH LISTING B LOG BATCH LOG B RUNFILE BATCH RUNFILE B
Figure 16 shows the SAMPLE MASTER file which is similar to the MASTER file used in thePERFKIT VMPRF example, except the VMPRF specific file specifications have beenremoved.
What's new in Performance Toolkit for VM in Version 5.1.0Page 13

Figure 17: Sample BATCH SETTINGS File
********************************************** * BATCH SETTINGS (Parameter Settings) file
**********************************************
FC SET SYSTEM "VMPRF sample" FC SET SYSTEMID ZVM430 FC SET BYTIME 5 minutes FC SET INTERIM 5 minutes FC MONCOLL RESET 10:00:00R_P 12:00:00P (MERGE FC SET MAXUSERS 100 FC SET MAXDEVS 100FC SET PAGESIZE 60FC UCLASS %* EVRYBODYFC UCLASS %* *OTHER*FC UCLASS MAINT MAINT
Figure 17 shows the contents of the BATCH SETTINGS file. It contains the FC commandsfound in the VMPRF RUNFILE we discussed earlier.
Figure 18: Sample BATCH REPORTS File
************************************ Report Selection File: ***********************************
** Reports MONDATAMONSETSYSSUMLGPROCSUMSYSCONFUSER (SORT TCPUDEVCONF
The BATCH REPORTS file is shown in Figure 18. The file contains the Performance Toolkitfor VM report names. The reports listed in this file are the same as the reports found in theVMPRF FCXEQUIV file produced using the PERFKIT VMPRF option. In fact, this file couldhave been created by simply renaming the VMPRF FCXEQUIV file.
Now when we execute the command:
PERFKIT BATCH SAMPLE MASTER B DISK ZVM430 MONDATA D
The BATCH LOG, BATCH RUNFILE, and BATCH LISTING files are created on the B-disk.The BATCH LOG file and the BATCH LISTING file will look similar to the output filescreated earlier. The BATCH RUNFILE is shown below in Figure 19.
What's new in Performance Toolkit for VM in Version 5.1.0Page 14

Figure 19: Content of the BATCH RUNFILE (1 of 3)
26 Apr 2004 11:24:52 PERFKIT Version FL510 at Fix Level 0026 Apr 2004 11:24:52 PERFKIT Arguments passed for BATCH mode processing:26 Apr 2004 11:24:52 PERFKIT BATCH SAMPLE MASTER B DISK ZVM430 MONDATA D 11:24:52 * Processing MASTER file 'SAMPLE MASTER B' SAMPLE MASTER B: ************************************************************ SAMPLE MASTER B: * SAMPLE MASTER B: * Sample MASTER file SAMPLE MASTER B: * SAMPLE MASTER B: ************************************************************ SAMPLE MASTER B: *** Input Parameter Files *** SAMPLE MASTER B: SETTINGS BATCH SETTINGS * SAMPLE MASTER B: REPORTS BATCH REPORTS * SAMPLE MASTER B: *** Output Files *** SAMPLE MASTER B: LISTING BATCH LISTING B SAMPLE MASTER B: LOG BATCH LOG B SAMPLE MASTER B: RUNFILE BATCH RUNFILE B
Figure 19: Content of the BATCH RUNFILE (2 of 3)
11:24:52 =Basic=> FC SET SUMREC FCONX SUMREC *11:24:52 =Basic=> FC SET TRENDREC FCONX TRENDREC *11:24:52 =Basic=> FC SET REPFILID BATCH LISTING B11:24:52 =Basic=> FC TRACE RESET ON
FCXCMK603I RESET trace activated 11:24:52 * Processing SETTINGS file 'BATCH SETTINGS *' BATCH SETTINGS *: ********************************************** BATCH SETTINGS *: * BATCH SETTINGS *: * BATCH SETTINGS (Parameter Settings) file BATCH SETTINGS *: * BATCH SETTINGS *: ********************************************** BATCH SETTINGS *: * BATCH SETTINGS *: FC SET SYSTEM "VMPRF sample" 11:24:52 =Basic=> FC SET SYSTEM "VMPRF sample" BATCH SETTINGS *: FC SET SYSTEMID ZVM430 11:24:52 =Basic=> FC SET SYSTEMID ZVM430 BATCH SETTINGS *: FC SET BYTIME 5 minutes 11:24:52 =Basic=> FC SET BYTIME 5 minutes BATCH SETTINGS *: FC SET INTERIM 5 minutes 11:24:52 =Basic=> FC SET INTERIM 5 minutes BATCH SETTINGS *: FC MONCOLL RESET 10:00:00R_P 12:00:00P (MERGE 11:24:52 =Basic=> FC MONCOLL RESET 10:00:00R_P 12:00:00P (MERGE BATCH SETTINGS *: FC SET MAXUSERS 100 11:24:52 =Basic=> FC SET MAXUSERS 100 BATCH SETTINGS *: FC SET MAXDEVS 100 11:24:52 =Basic=> FC SET MAXDEVS 100 BATCH SETTINGS *: FC SET PAGESIZE 60 11:24:52 =Basic=> FC SET PAGESIZE 60
What's new in Performance Toolkit for VM in Version 5.1.0Page 15

BATCH SETTINGS *: FC UCLASS %* EVRYBODY 11:24:52 =Basic=> FC UCLASS %* EVRYBODY BATCH SETTINGS *: FC UCLASS %* *OTHER* 11:24:52 =Basic=> FC UCLASS %* *OTHER* BATCH SETTINGS *: FC UCLASS MAINT MAINT 11:24:52 =Basic=> FC UCLASS MAINT MAINT 11:24:52 * SETTINGS file processing completed with RC 0 11:24:52 * Processing REPORTS file 'BATCH REPORTS *' BATCH REPORTS *: *********************************** BATCH REPORTS *: * REPORT SELECTION FILE: BATCH REPORTS *: *********************************** BATCH REPORTS *: ** REPORTS BATCH REPORTS *: MONDATA BATCH REPORTS *: MONSET BATCH REPORTS *: SYSSUMLG BATCH REPORTS *: PROCSUM BATCH REPORTS *: SYSCONF BATCH REPORTS *: USER (SORT TCPU BATCH REPORTS *: DEVCONF 11:24:52 =Basic=> FC SET REPORTS BATCH REPORTS *
11:24:52 * REPORTS file processing completed with RC 0
Figure 19: Content of the BATCH RUNFILE (3 of 3)
16 Apr 2004 11:24:52 PERFKIT Reduction Started11:24:52 =Basic=> Monscan ZVM430 MONDATA D 11:24:52 * Monitor data start at 10:37:27 on 2002/01/22 11:24:52 =Monscan=> FC MONCOLL RESET QUERY FCXPMC811T Proc/Reset init call at 10:37:27 11:24:53 =Monscan=> Nextsamp 12:00 11:24:55 * Last monitor sample processed for 11:55:33 on 2002/01/22 11:24:55 =Monscan=> Return 26 Apr 2004 11:24:55 PERFKIT Vtime=.10, Ttime=.17, Connect time 3 sec. 26 Apr 2004 11:24:55 PERFKIT Reduction Completed, Rc= 0
The examples above have shown a simple migration from VMPRF to Performance Toolkit forVM using the new batch mode processing. You can find additional information in Chapter 4of z/VM Performance Toolkit when the FL510 level of the code is available.
New Linux supportWith Performance Toolkit for VM, you can display the VM/ESA® view of Linux systemsrunning on VM and through the RMF™ PM interface look at detailed performance data fromthe Linux system. Using this approach does cause some overhead on the Linux system,including waking the system up if it is idle. With Performance Toolkit for VM FL510, you canview high level performance data from the Linux systems running on z/VM that is providedby the Linux machines through z/VM’s CP MONITOR data. This data is collected by z/VM in
What's new in Performance Toolkit for VM in Version 5.1.0Page 16

the same way that data from other applications like TCP/IP and Shared File System iscollected. This data is collected by the Linux machine and placed where z/VM can access it.This reduces the need to wake up the Linux machine unless you to need to look at the Linuxmachine in more detail. Once you have access to Performance Toolkit for VM (from the Webor from VM), use option 21 from the performance selection menu to view the VM view of allusers running on the VM system. This display provides a line for each user that is createdfrom the monitor data. To look at more detailed performance data for a given user, place thecursor on the user ID and press the Enter key (or click from the Web). This provides datafrom the VM internal control blocks for that user.
Figure 20: VM user detailed performance data display
Figure 20 shows the VM view of the Linux machine. To look at the Linux view, use option 29from the performance selection screen to reach the Linux selection screen.
What's new in Performance Toolkit for VM in Version 5.1.0Page 17
FCX115 CPU 2064 SER 51524 Interval 03:16:14 - 03:16:45 Perf. Monitor
Detailed data for user LXM00001 Total CPU : 4.5% Storage def. : 500MB Page fault rate: .0/sSuperv. CPU : 1.5% Resident <2GB: 35988 Page read rate : .0/sEmulat. CPU : 3.0% Resident >2GB: 90717 Page write rate: .0/sVF total : ....% Proj. WSET : 126678 Pgs moved >2GB>: .0/sVF overhead : ....% Reserved pgs : 0 Main > XSTORE : .0/sVF emulation: ....% Locked pages : 10 XSTORE > main : .0/sVF load rate: ..../s XSTORE dedic.: 0MB XSTORE > DASD : .0/sI/O rate : 5.6/s XSTORE pages : 0 SPOOL pg reads : .0/sDASD IO rate: 5.6/s DASD slots : 0 SPOOL pg writes: .0/sUR I/O rate : .0/s IUCV X-fer/s : .0/s MDC insert rate: .0/sDiag. X'98' : .0/s Share : 3000 MDC I/O avoided: .0/s*BLOCKIO : .0/s Max. share : ... ...
Proc. %CPU %CP %EM %VECT %VOHD %VEMU VLD/S IO/S Status
00 1.2 .4 .8 ..,. ..,. ..,. ..,. 5.5 ESA,P03,IOWT 01 1.2 .4 .8 ..,. ..,. ..,. ..,. .0 ESA,P03,PSWT 02 .8 .2 .5 ..,. ..,. ..,. ..,. .1 ESA,P03,IOWT03 1.3 .4 .9 ..,. ..,. ..,. ..,. .1 ESA,P03,IOWT

Figure 21: Linux selection display
The top entry leads to the selection screen for detailed Linux performance data that isobtained from the RMF PM interface. To use the RMF PM interface, you must provide the IPaddress for each Linux machine in the FCONX LINUXUSR file on the PERFSVM machinewhere Performance Toolkit for VM is running. The Linux name must match the Linux userID. The other entries are for the high level data that is obtained from the monitor data. Theother entries include:
• Linux CPU data• Linux Memory data• Linux Network data
What's new in Performance Toolkit for VM in Version 5.1.0Page 18

Figure 22: Linux CPU display
The Linux CPU display has one line per Linux system that is providing monitor data. If youneed to look at the detailed data you can place the cursor on that system and press the Enterkey to access the RMF PM data or from the Web click on the Linux system.
Figure 23: Linux CPU detailed display
What's new in Performance Toolkit for VM in Version 5.1.0Page 19
FCX230 CPU 9672 SER 15585 Interval 01:33:00 - 01:34:00 Perf. Monitor
Linux CPU Utilization for System LXM00001 _____ . . . . . . <--- Percent CPU Utilization ----> <-Accumulated (s)->
Processor Total User Kernel Nice Idle TotTm UserTm KernTm>>Mean>> 0.70 0.06 0.64 0 99.29 --- --- ---cpu0 0.78 0.06 0.71 0 99.21 --- --- ---cpu1 0.73 0.18 0.54 0 99.26 --- --- ---cpu2 0.48 0 0.48 0 99.51 --- --- ---cpu3 0.86 0.01 0.84 0 99.13 --- --- ---
Process Name syslogd.293 0.78 0 0.78 0 --- 3657 36.08 3621nmbd.499 0.46 0.03 0.43 0 --- 9166 1649 7517apachegat.29502 0.3 ... 0.3 ... --- 353.9 1.48 352.5gengat.29511 0.3 ... 0.3 ... --- 498.0 1.37 496.7procgat.29517 0.23 ... 0.23 ... --- 370.7 13.47 357.2httpd.464 0.18 0 0.18 0 --- 953.6 18.3 935.3kupdate.3 0.16 0 0.16 0 --- 603.9 ... 603.9filegat.29508 0.06 ... 0.06 ... --- 89.36 0.21 89.15

Through using the RMF PM interface, Performance Toolkit for VM uses the IP address fromthe FCONX LINUXUSR file to access the detailed data from this Linux machine. The dataincludes process level information.
Figure 24: Linux MEMORY display
The Linux MEMORY display has one line per Linux system that is providing monitor data.RMF PM data can be accessed in the same way as for the CPU data.
What's new in Performance Toolkit for VM in Version 5.1.0Page 20

Figure 25: Linux NETWORK display
The Linux NETWORK display has one line of network information for each Linux system.You can also access the RMF PM data by selecting the entry.
You can use Performance Toolkit for VM to see the performance data for your Linux systemfrom the VM perspective and from the Linux perspective. You can also view only high levelinformation or view more detailed information for both the VM and the Linux data.
Where to find more information On the Web
• The Performance Toolkit for VM Web page: www.vm.ibm.com/related/perfkit
Publications
• The Performance Toolkit for VM manual: z/VM Performance Toolkit, SC24-6136
What's new in Performance Toolkit for VM in Version 5.1.0Page 21

About the authorsPatty Rando is currently working as a software engineer with the z/VM developmentorganization in the US. For the last 17, years she has been involved primarily in the area ofCMS development and service and recently joined the z/VM Performance team. She attendedBinghamton University and has a Masters Degree in Computer Science.
Bruce Dailey is currently working as a software engineer with the z/VM developmentorganization in the U.S. For the last ten years, he has been the lead developer and changeteam for many VM performance products. He has a degree in mathematics from IllinoisInstitute of Technology and Computer and Information Science from Syracuse University. Hehas also written and presented on using CMS PIPELINES with SQL/DS.
What's new in Performance Toolkit for VM in Version 5.1.0Page 22

Copyright IBM Corporation 2004
IBM Corporation
Marketing Communications, Server GroupRoute 100
Somers, NY 10589
U.S.A.
Produced in the United States of America
06/04
All Rights Reserved
IBM, IBM logo, e-business logo, Performance Toolkit for VM, RMF, VM/ESA, and z/VM are trademarks or
registered trademarks of International Business Machines Corporation of the United States, other countries or
both.
Linux is a trademark of Linus Torvalds in the United States, other countries or both.
UNIX is a registered trademark of The Open Group in the United States and other countries.
Intel is a trademark of Intel Corporation in the United States, other countries or both.
Other company, product and service names may be trademarks or service marks of others.
Information concerning non-IBM products was obtained from the suppliers of their products or their publishedannouncements. Questions on the capabilities of the non-IBM products should be addressed with the suppliers.
IBM hardware products are manufactured from new parts, or new and serviceable used parts. Regardless, ourwarranty terms apply.
IBM may not offer the products, services or features discussed in this document in other countries, and the
information may be subject to change without notice. Consult your local IBM business contact for information onthe product or services available in your area.
All statements regarding IBM’s future direction and intent are subject to change or withdrawal without notice, andrepresent goals and objectives only.
Performance is in Internal Throughput Rate (ITR) ratio based on measurements and projections using standard
IBM benchmarks in a controlled environment. The actual throughput that any user will experience will varydepending upon considerations such as the amount of multiprogramming in the user’s job stream, the
I/O configuration, the storage configuration, and the workload processed. Therefore, no assurance can be given
that an individual user will achieve throughput improvements equivalent to the performance ratios
stated here.
GM13-0637-00
What's new in Performance Toolkit for VM in Version 5.1.0Page 23