what's new in code composer studio development tools · pdf fileapplication report...
TRANSCRIPT

Application ReportSPRAA07C–October 2006
What's New in Code Composer Studio Development Toolsv 3.3
........................................................................................................................................ DSP SDS
ABSTRACT
This application report highlights new features and functionality in the Code ComposerStudio™ (CCStudio) Integrated Development Environment (IDE) v. 3.3. Unlike 3.2(which offers support for the DM644x and C64x+ device families), version 3.3 supportsmultiple device families. Several of the new debug options from the 3.2 version are nowavailable for all platforms.
Topic .................................................................................................. Page
1 Installing the 3.3 Version ............................................................. 22 Supported Devices and Simulators ............................................... 23 IDE Property Manager ................................................................. 44 Status Bar.................................................................................. 55 Register Window Changes........................................................... 66 New Breakpoint Manager............................................................. 77 New Cache Management Tools .................................................... 98 Tool for Reporting Exceptions on C64x+ Devices ......................... 119 Adding Globals to the Watch Window ......................................... 1210 C6000 Functional Simulators Interrupt Latency Detection
Feature .................................................................................... 1311 Displaying Software Pipeline Loops (SPLOOP) in the
Disassembly Window ................................................................ 1312 MMU Page Table Viewer............................................................. 1413 Memory Load/Save Utility .......................................................... 1414 New Debug Menu Items ............................................................. 1515 Troubleshooting Emulator Errors................................................ 1516 IDE Changes............................................................................. 15
SPRAA07C–October 2006 What's New In Code Composer Studio Development Tools v 3.3 1Submit Documentation Feedback
www.ti.com
1 Installing the 3.3 Version
1.1 The 3.3 Package
1.2 System Requirements
2 Supported Devices and Simulators
Installing the 3.3 Version
Version 3.3 is the latest production release of the CCStudio Integrated Development Environment. Theinstall is provided on a single CDROM and supports all TI catalog production DSP and SOC processors.The installation is a full installation and is not a patch or service pack to any previous installations. Bydefault, the 3.3 version CD installs in a separate directory from the 3.2 version, so there are nodependencies between versions. For more information using the IDE and exploring the new features, seethe Code Composer Studio Development Tools v3.3 Getting Started Guide (SPRU509).
Minimum Requirements:• 500 MHz or higher Pentium compatible CPU• 128 MB of RAM• 600 MB of free hard disk space• SVGA (800 X 600) display• Internet Explorer (5.0 or later)
Recommended:• 2 GHz or higher Pentium-compatible CPU• 512 MB of RAM• 16-bit color
Supported Operating Systems:• Windows 2000 Service Pack 4• Windows XP Home Service Pack 1 & 2• Windows XP Pro Service Pack 1 & 2
CCStudio v3.3 supports the following platforms:
• ARM Platforms
– ARM11- VPOM2420 Platform Simulator, VPOM2430 Platform Simulator– ARM7- VPOM2420 Platform Simulator, Big Endian, Little Endian, XDS510, XDS560 Emulators– ARM9 Simulator, Big Endian, Little Endian, XDS510, XDS560 Emulators– ARM925 Simulator, Little Endian– ARM926EJ-S Simulator, Little Endian
• C2000 Platforms
– F240 XDS510, XDS560 Emulators– F2401 XDS510, XDS560 Emulators– F2402 XDS510, XDS560 Emulators– F2403 XDS510, XDS560 Emulators– F2406 XDS510, XDS560 Emulators– F2407 XDS510, XDS560 Emulators– F241 XDS510, XDS560 Emulators– F243 XDS510, XDS560 Emulators– C27xx Cycle Accurate Simulator, XDS510, XDS560 Emulators– F2810 Device Simulator, XDS510, XDS560 Emulators– F2812 Device Simulator, XDS510, XDS560 Emulators
2 What's New In Code Composer Studio Development Tools v 3.3 SPRAA07C–October 2006Submit Documentation Feedback
www.ti.com
Supported Devices and Simulators
– F28xx Cycle Accurate Simulator, Simulator Tutorial
• C5000 Platforms
– C5401, C5402, C5403, C5404, C5406, C5407, C5409 Device Simulators– C541, C542, C543, C545, C545lp, C546, C548, C549 Device Simulators– C5410, C5416, C5420 Device Simulators– C5401 XDS510, XDS560 Emulators– C5402 XDS510, XDS560 Emulators– C5404 XDS510, XDS560 Emulators– C5407 XDS510, XDS560 Emulators– C55xx Functional Simulator– C55xx Rev 3.0 Functional Simulator, Cycle Accurate Simulator
• C6000 Platforms
– C6201 Device Simulator Little Endian, Big Endian– C6202 Device Simulator Little Endian, Big Endian– C6203 Device Simulator Little Endian, Big Endian– C6204 Device Simulator, Little Endian, Big Endian– C6205 Device Simulator, Little Endian, Big Endian– C620x XDS510, XDS560 Emulators– C6211 Device Cycle Accurate Simulator, Little Endian, Big Endian– C621x XDS510, XDS560 Emulators– C62xx CPU Cycle Accurate Simulator, Little Endian– C62xx CPU Cycle Accurate Simulator, Big Endian– C6216[Compiled] Device Functional Simulator, Little Endian, Big Endian– C64+ CPU Cycle Accurate Simulator, Little Endian, Big Endian– C64+ Cycle Accurate Simulator, Little Endian, Big Endian– C6455 Simulator (with VCP & TCP) Big Endian, Little Endian– C6455 XDS510, XDS560 Emulator with ICEPICK_C– DM6443 Cycle Accurate Simulator, Little Endian– DM6443 XDS510, XDS560 Emulator with ICEPICK_C– DM6446 Cycle Accurate Simulator, Little Endian– DM6446 XDS510, XDS560 Emulator with ICEPICK_C– TCI6482 Simulator (with RSA, VCP & TCP) Big Endian, Little Endian– TCI6482 XDS510, XDS560 Emulator with ICEPICK_C– C6411 Device Cycle Accurate Simulator, Little Endian, Big Endian– C6412 Device Cycle Accurate Simulator, Little Endian, Big Endian– C6414 Device Cycle Accurate Simulator, Little Endian, Big Endian– C6414, 15, 16 Rev1.0x XDS510, XDS560 Emulators– C6415 Device Cycle Accurate Simulator, Little Endian, Big Endian– C6416 Device Cycle Accurate Simulator, Little Endian, Big Endian– C64xx- VPOM2430 Platform Simulator– C64xx CPU Cycle Accurate Simulator, Little Endian, Big Endian– C64xx XDS510, XDS560 Emulators– C6416[Compiled] CPU Functional Simulator, Little Endian, Big Endian– DM642 Device Cycle Accurate Simulator, Little Endian, Big Endian– C6701 Device Simulator, Little Endian, Big Endian– C670x XDS510, XDS560 Emulators– C6711 Device Cycle Accurate Simulator, Little Endian, Big Endian– C6712 Device Cycle Accurate Simulator, Little Endian, Big Endian– C6713 Device Cycle Accurate Simulator, Little Endian, Big Endian– C671x XDS510, XDS560 Emulators– C672x CPU Simulator, Little Endian
SPRAA07C–October 2006 What's New In Code Composer Studio Development Tools v 3.3 3Submit Documentation Feedback
www.ti.com
3 IDE Property Manager
IDE Property Manager
– C672x XDS510, XDS560 Emulators– C67xx CPU Cycle Accurate Simulator, Little Endian, Big Endian
• OMAP Platforms
– OMAP- VPOM2420 Platform Simulator– OMAP- VPOM2430 Platform Simulator– OMAP1510 ES2 XDS510, XDS560 Emulators– OMAP1610 XDS510, XDS560 Emulators– OMAP1710 XDS510, XDS560 Emulators– OMAP2420 XDS510, XDS560 Emulators– OMAP310 XDS510, XDS560 Emulators– OMAPV1030 XDS560 Emulator
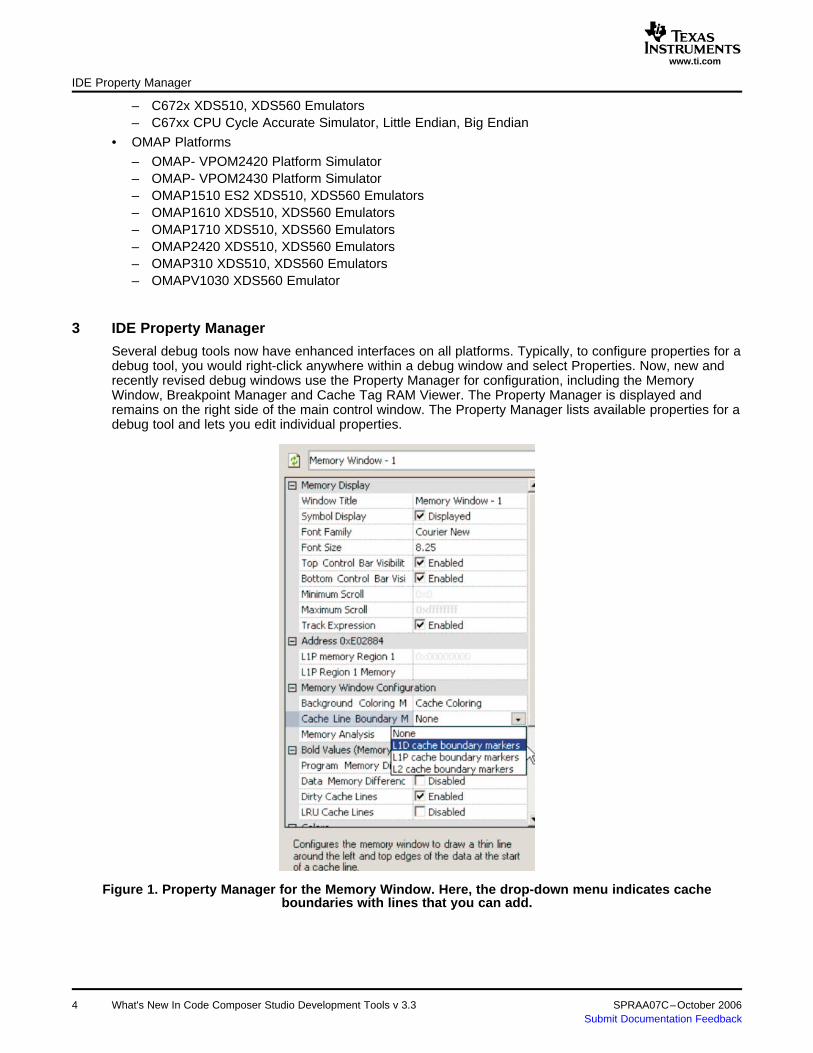
Several debug tools now have enhanced interfaces on all platforms. Typically, to configure properties for adebug tool, you would right-click anywhere within a debug window and select Properties. Now, new andrecently revised debug windows use the Property Manager for configuration, including the MemoryWindow, Breakpoint Manager and Cache Tag RAM Viewer. The Property Manager is displayed andremains on the right side of the main control window. The Property Manager lists available properties for adebug tool and lets you edit individual properties.
Figure 1. Property Manager for the Memory Window. Here, the drop-down menu indicates cacheboundaries with lines that you can add.
4 What's New In Code Composer Studio Development Tools v 3.3 SPRAA07C–October 2006Submit Documentation Feedback
www.ti.com
4 Status Bar
Status Bar
New and recently revised debug windows use the Property Manager for configuration, including theMemory Window, Breakpoint Manager and Cache Tag RAM Viewer. Often the Property Manager mayduplicate functionality already present in the debug window itself. However, the Property Manager allowsyou to see all the configured properties for a particular window (or element of a window) at a singleglance. In the Breakpoint Manager Property Window, editing certain properties such as Action will causeadditional options to be displayed for further editing.
Highlighting individual elements within a debug window lets you configure specific instances or elements.For example, in the Breakpoint Manager (Section 6), each row corresponds to a different breakpoint.Highlighting one row in the Breakpoint Window reveals properties for that specific breakpoint in theProperty Manager. Highlighting a different row reveals those for a different breakpoint. To view theproperty window, right-click anywhere in the Breakpoint Manager, Memory Window, or Cache Tag RAMViewer windows and select Properties from the context menu, or select View→Property Window.
New options were added to the status bar that is displayed at the bottom of the CCStudio applicationwindow. In addition to the normal target connect messages, there is also a basic status indicator. The leftside of the status indicator shows if the target is running or not. The right side of the status indicator turnsyellow to indicate that the target was recently halted. This occurs when you manually halt the process, orwhen CCStudio temporarily halts the target to carry out another internal process. The indicator will turngrey after a few seconds.
The status bar will also show messages about the current options used by CCStudio:• Process Mode (ARM processors only): The status bar displays the name of the current mode used by
the executed process. The options are:
– ARM – Indicates that the process is in the ARM mode.– THUMB – Indicates that the process is in the Thumb mode.
• Endianness: The status bar denotes the Endianness sequencing method being used with either LE forLittle Endian or BE for Big Endian.
• Jazelle Indicator: The word JAVA is displayed in the status bar when Jazelle is enabled.• MMU Indicator (ARM processors only): The status bar displays either MMU Off or MMU On to indicate
the status of the Memory Management Unit (MMU) mode. Note: This feature is available for ARM 9and ARM 11 targets.
• Privileges (ARM processors only): The status bar indicates the privilege mode for the application bydisplaying either USER mode or SUPERVISOR mode.
• Task Level Debugging Indicator: The status bar indicates the status of Task Level Debugging (TLD) bydisplaying TLD when TLD has been enabled on the device. Note: TLD support is not available for alloperating systems.
• Descriptions: The center of the status bar displays text which describes the actions of individual menucommands and toolbar items as you hold the mouse cursor over them, and the path of the activesource file window. The right area of the status bar shows the line and column position of the cursorwhen viewing a source file.
• Profile Clock: The Profile Clock is displayed on the right side of the status bar, if it has been enabled.See the Application Code Tuning Online Help for more information.
SPRAA07C–October 2006 What's New In Code Composer Studio Development Tools v 3.3 5Submit Documentation Feedback

www.ti.com
5 Register Window Changes
5.1 Creating Custom Register Groups
5.2 Bitfield View
Register Window Changes
The Register Window now uses a two-panel window display that appears at the bottom of the main controlwindow when you select one of the registers from the View menu. The left panel consists of logical groupsof registers; the right panel consists of individual registers that belong to this logical group. Clicking on aregister type/group on the left panel shows registers of that particular type. Clicking the mouse on theregister value on the right lets you edit (or even copy) its value.
Figure 2. Register Window. This two panel display puts registers into logical categories and customgroups. Highlighting the category on the left lets you view (and edit) individual values on the right.
In addition, you can create custom groups of registers to view only the registers most likely to be ofinterest for a project. To do this, right-click anywhere within the Register Window, select the CustomizeRegister Group item from the context menu, and create a custom group. After you create a group withregisters, the new custom group will appear in the Register Window's left panel. Clicking on the group'sname displays the associated registers.
Figure 3. Customizing Register Groups. Grouping individual registers in a custom group provides easyaccess to the important registers in the Register Window.
Some registers can also be expanded to show the individual bits for that register. This option is onlyavailable for some devices. To enter bitfield mode, right-click on the register window and select Tree Viewfrom the context menu. Any registers that support a bitfield will have a small + sign next to them. Thesecan be expanded to view the bitfield. The value for each bit can be edited by double-clicking on the value.Any edited values will appear in red.
What's New In Code Composer Studio Development Tools v 3.36 SPRAA07C–October 2006Submit Documentation Feedback

www.ti.com
6 New Breakpoint Manager
6.1 Different User Interface
6.2 Associating Actions with Breakpoints
6.3 Merging Probe Point Functionality into the Breakpoint Manager
6.4 Breakpoint Groups and Configurations
New Breakpoint Manager
The interface for creating and configuring breakpoints has changed substantially. In previous IDEversions, to configure a breakpoint, you needed to open a separate dialog and follow a complex series ofsteps. The new Breakpoint Manager interface lets you do all the steps within a single window that can beleft open throughout the debugging process. To open the Breakpoint Manager, select Breakpoints fromthe Debug menu.
The Breakpoint Manager lists breakpoints as rows on a table and lets you configure them by clicking themouse on a column in that row. (You can also configure individual breakpoints by opening up the PropertyManager.) You can also customize your view, save/load breakpoint configurations, and sort columns. TheBreakpoint Manager uses colors and icons to denote the status and type of a particular breakpoint.
Figure 4. Breakpoint Manager. Note the icons on each breakpoint row: question mark (conditionalbreakpoints), check boxes (enable/disable), blue triangle underneath the circle (non-halt action).
By using the drop-down menu on the Action column, you can associate a breakpoint with a particularaction: Halt Target, Update All Windows, Execute GEL Command, Refresh a Window, Enable/Disable aGroup and Perform File I/O.
Previous versions of CCStudio IDE used the term probe point when referring to a point you coulddesignate to update a debug window or perform read/write actions on a file. This functionality still exists;however, probe points in this version will be treated by the Breakpoint Manager as another type ofbreakpoint with different actions. If you click on the appropriate cell under the Action column, a series ofdrop-down options appear.
You can still associate a data input/output file with the breakpoint as you did before (by clicking File →FileI/O). With the new Breakpoint Manager, you can also do this by clicking on the Action column for abreakpoint and selecting the Perform File I/O drop-down option.
You can create custom filters by creating breakpoint groups. For example, suppose that some breakpointsare triggered only under certain circumstances (i.e., they are conditional breakpoints). You could put allthe conditional breakpoints into a group, so only one type of breakpoint would be visible.
To create a custom breakpoint group, click on the Create/Filter Breakpoint Groups icon at the top of theBreakpoint Manager column. After you click it, a new dialog will let you add new breakpoints. You canthen assign an individual breakpoint to a group by clicking on the appropriate column and selecting thedesired group from the drop-down list.
SPRAA07C–October 2006 What's New In Code Composer Studio Development Tools v 3.3 7Submit Documentation Feedback

www.ti.com
6.5 C64x Simulator Watchpoints
6.6 C55x Hardware Breakpoints
New Breakpoint Manager
Figure 5. Creating a Breakpoint Group. Create a custom group and then add breakpoints to it.
Watchpoints halt simulation when an access is made to a targeted memory location. The access could befrom the CPU or from the DMA (if supported by the particular device configuration). Debug reads andwrites to memory locations do not cause watchpoints to trigger. Watchpoints are supported by thefollowing configurations:• C64xx CPU Cycle Accurate Simulator• C6416 Device Functional Simulator
To use this option, you must load a project and open the Breakpoint Manager by selecting Debug →Breakpoints. In the Breakpoint Manager, select New Watchpoint from the dropdown menu next to the NewItem icon in the toolbar. The New Watchpoint dialog will open. Enter a location for the watchpoint and anevent to break on. Location can be specified either as an absolute memory address, or a symbol name.For example, to create a watchpoint on a global variable defined in a .c file as:int IntegerA;You would specify the watchpoint location as:&IntegerA
You can choose from the following events:
• Memory Read• Memory Write• All Access Types
Choose an event and click OK. The Breakpoint Manager will show your new watchpoint. See the onlinehelp for Watchpoints for more information on modifying existing watchpoint properties or halting the targeton these breakpoints.
For C55x emulators, you have multiple additional options under the New Item menu in the BreakpointManager. For instance, you can create a new hardware breakpoint, watchpoint, or counter. These optionsare supported on all C55x emulation devices included in the CCStudio IDE. To use the options, you mustload a project and open the Breakpoint Manager by selecting Debug → Breakpoints. In the BreakpointManager, select the dropdown menu next to the New Item icon in the toolbar. There will be four optionsvisible: Software Breakpoint, Hardware Breakpoint, Hardware Watchpoint, or Hardware Counter. Choosingone of the hardware items opens a new parameters dialog for you to input basic information for theselected item. For hardware breakpoints, you can choose the location from the parameter dialog. Forhardware watchpoints, you can choose the location and the access type (read, write, etc.). For counters,you can choose whether you would like to count cycles or events. If you choose event, the menu will showmultiple event types under the dropdown menu for Event. See your hardware documentation for moreinformation on these events.
What's New In Code Composer Studio Development Tools v 3.38 SPRAA07C–October 2006Submit Documentation Feedback

www.ti.com
7 New Cache Management Tools
7.1 Enhanced Memory Window
7.1.1 New Functionality
7.1.2 Managing Cache with the New Memory Window
New Cache Management Tools
When using a hierarchical memory architecture, handling cache coherency issues can be a challenge.Generally if multiple devices, such as the CPU or peripherals, share the same cacheable memory region,cache and memory can become incoherent. In the past it has been hard to pinpoint cache coherencyproblems, but this IDE version contains two tools designed specifically to make it easier to spot and solvecache coherency problems.
The new memory window contains several new functions. Select View→Memory to display the memorywindow.
Drop-down boxes make the memory window easier to configure. For example, you can use a drop-downmenu to set the memory formatting style or appearance.
A new combo box on top left lets you search for specific memory addresses, or you can even track aspecific expression if an expression is entered. By using the right arrow buttons, you can also set ascrolling range for the window and have better control over how finely you can scroll down in the window.
The Property Manager associated with the Memory Window lets you control color, font, and symboldisplays.
You can now edit/change specific memory values by clicking on a cell's contents. A message bar (on thebottom left) informs you of any potential error messages.
The Memory Window also lets you switch between views of multiple targets/cores on the fly. A drop-downmenu on the top right of the Memory Window lets you switch target views quickly. If you have loaded morethan one device through Code Composer Setup, the drop-down box will let you view memories of othercores without needing to open up another Control Window. This option is helpful if you are usingperipherals that share memory with another core.
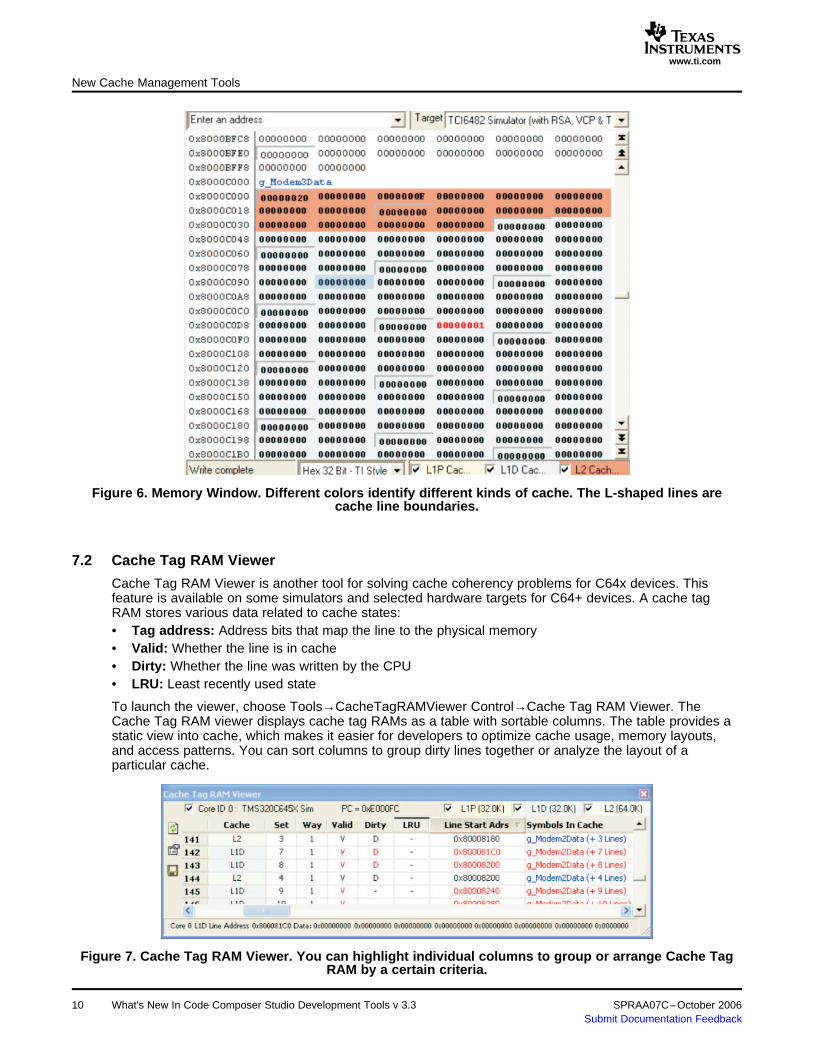
The Memory Window can now help manage cache problems by bypassing cache for devices that usecache. This feature is available on some simulators and selected hardware targets for C64+ devices.Checkboxes on the bottom let you bypass caches to inspect memory as seen by external entities. If allboxes are checked, the memory window will show memory values from the highest memory levelcontaining the address. You can also assign different colors for different kinds of cache, which allows youto quickly view the active cache at any given memory address.
SPRAA07C–October 2006 What's New In Code Composer Studio Development Tools v 3.3 9Submit Documentation Feedback
www.ti.com
7.2 Cache Tag RAM Viewer
New Cache Management Tools
Figure 6. Memory Window. Different colors identify different kinds of cache. The L-shaped lines arecache line boundaries.
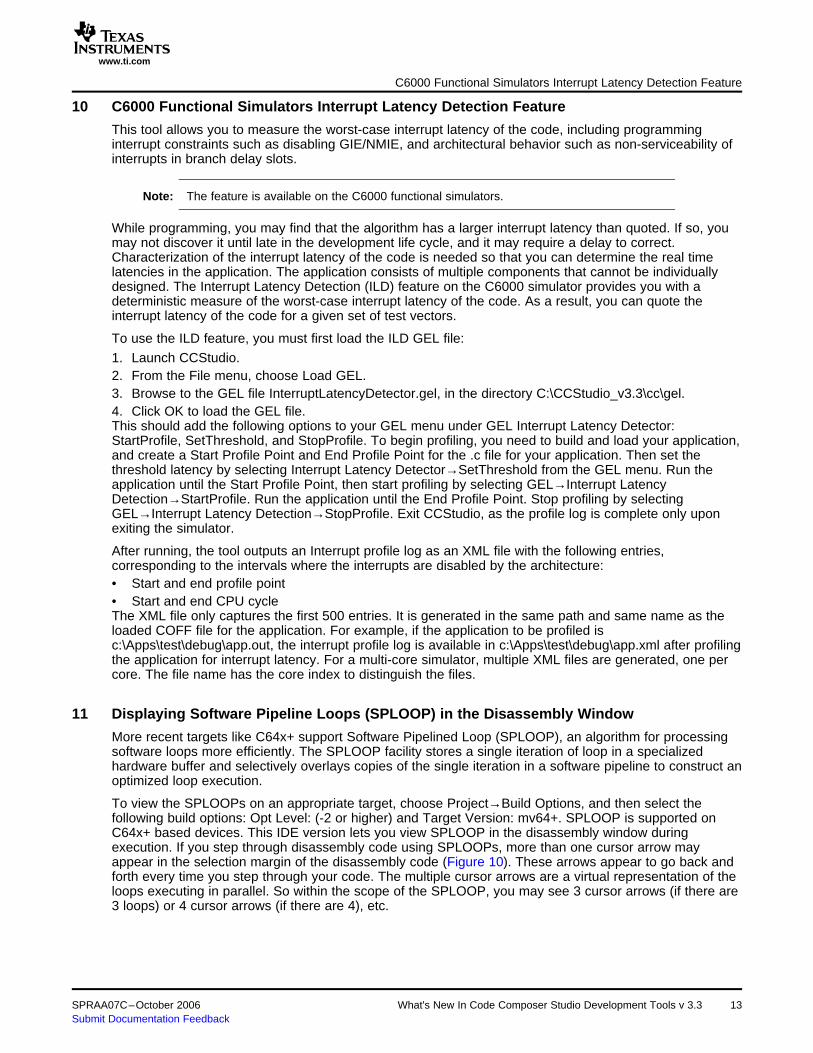
Cache Tag RAM Viewer is another tool for solving cache coherency problems for C64x devices. Thisfeature is available on some simulators and selected hardware targets for C64+ devices. A cache tagRAM stores various data related to cache states:• Tag address: Address bits that map the line to the physical memory• Valid: Whether the line is in cache• Dirty: Whether the line was written by the CPU• LRU: Least recently used state
To launch the viewer, choose Tools→CacheTagRAMViewer Control→Cache Tag RAM Viewer. TheCache Tag RAM viewer displays cache tag RAMs as a table with sortable columns. The table provides astatic view into cache, which makes it easier for developers to optimize cache usage, memory layouts,and access patterns. You can sort columns to group dirty lines together or analyze the layout of aparticular cache.
Figure 7. Cache Tag RAM Viewer. You can highlight individual columns to group or arrange Cache TagRAM by a certain criteria.
10 What's New In Code Composer Studio Development Tools v 3.3 SPRAA07C–October 2006Submit Documentation Feedback

www.ti.com
7.2.1 Tracking and Viewing Cache Changes
8 Tool for Reporting Exceptions on C64x+ Devices
Tool for Reporting Exceptions on C64x+ Devices
By setting properties in the Property Manager window, you can observe changes in your cache tags. Ifyou enable certain properties, the viewer will show only dirty or changed cache lines or memorydifferences. Another option lets you log changes to the Output Window.
The Cache Tag RAM viewer allows you to ensure that key functions and data structures are resident incache and not being bumped from cache (either entirely or partially). Conflicts are indicated when addressranges or symbols associated with these functions are only partly displayed or when the cache set holdingthem contains different data. When you hover your mouse over a cache line, the viewer indicates whethera particular cache line contains the same symbol.
Figure 8. Cache Conflict Indicators. The tooltip indicates that the symbol on address 0x80004380 haschanged, indicating a cache conflict.
Exceptions are used to signal programs. For example, exceptions resulting from memory protection orsecurity violations inform the developer that there are problems with memory maps or bad pointers (CPUor DMA).
If your device supports exceptions, you can configure exception reporting by selectingDebug→Exceptions. An option dialog will open, check the feature marked Enable Exception Handling onthe bottom left to view and choose exception types. The Exception Reporting tool provides preconfiguredreporting options (such as Report Internal Exceptions, Report dropped CPU interrupts and Report MemoryProtection Faults). You can also customize which exceptions to report.
SPRAA07C–October 2006 What's New In Code Composer Studio Development Tools v 3.3 11Submit Documentation Feedback

www.ti.com
9 Adding Globals to the Watch Window
Adding Globals to the Watch Window
Figure 9. Exception Reporting Tool. This tool lets you select exceptions you wish to be reported to theOutput Window. It comes with preconfigured reports.
If the tool reports an exception, the CPU will halt and display a message in the output window. At thatpoint, you can view this information and decide whether to terminate the application (and reset the CPU)or let an exception handler deal with it and continue. Having access to these exception reports increasesflexibility and potentially saves development time.
The Watch Window now allows you to watch file static and global variables. To use this option, you mustload a program and open the Watch Window. Right click on the window and select the Add Globals toWatch option from the context menu. The Add Globals to Watch dialog has a list of all the file static orglobal variables currently defined for the loaded program. This dialog also shows the scope for eachvariable. Choose a variable by clicking in the checkbox and selecting the Add to Watch button. Select andadd as many expressions as needed, and then click Close to return to the Watch window. The selectedexpressions will appear in the Watch tab. Scope information is shown as part of the variable name(example syntax: 'lowlev.c'::init). If the loaded symbols change and a static expression added to the watchwindow is no longer defined, the Watch window will display an error message.
What's New In Code Composer Studio Development Tools v 3.312 SPRAA07C–October 2006Submit Documentation Feedback
www.ti.com
10 C6000 Functional Simulators Interrupt Latency Detection Feature
11 Displaying Software Pipeline Loops (SPLOOP) in the Disassembly Window
C6000 Functional Simulators Interrupt Latency Detection Feature
This tool allows you to measure the worst-case interrupt latency of the code, including programminginterrupt constraints such as disabling GIE/NMIE, and architectural behavior such as non-serviceability ofinterrupts in branch delay slots.
Note: The feature is available on the C6000 functional simulators.
While programming, you may find that the algorithm has a larger interrupt latency than quoted. If so, youmay not discover it until late in the development life cycle, and it may require a delay to correct.Characterization of the interrupt latency of the code is needed so that you can determine the real timelatencies in the application. The application consists of multiple components that cannot be individuallydesigned. The Interrupt Latency Detection (ILD) feature on the C6000 simulator provides you with adeterministic measure of the worst-case interrupt latency of the code. As a result, you can quote theinterrupt latency of the code for a given set of test vectors.
To use the ILD feature, you must first load the ILD GEL file:
1. Launch CCStudio.2. From the File menu, choose Load GEL.3. Browse to the GEL file InterruptLatencyDetector.gel, in the directory C:\CCStudio_v3.3\cc\gel.4. Click OK to load the GEL file.This should add the following options to your GEL menu under GEL Interrupt Latency Detector:StartProfile, SetThreshold, and StopProfile. To begin profiling, you need to build and load your application,and create a Start Profile Point and End Profile Point for the .c file for your application. Then set thethreshold latency by selecting Interrupt Latency Detector→SetThreshold from the GEL menu. Run theapplication until the Start Profile Point, then start profiling by selecting GEL→Interrupt LatencyDetection→StartProfile. Run the application until the End Profile Point. Stop profiling by selectingGEL→Interrupt Latency Detection→StopProfile. Exit CCStudio, as the profile log is complete only uponexiting the simulator.
After running, the tool outputs an Interrupt profile log as an XML file with the following entries,corresponding to the intervals where the interrupts are disabled by the architecture:• Start and end profile point• Start and end CPU cycleThe XML file only captures the first 500 entries. It is generated in the same path and same name as theloaded COFF file for the application. For example, if the application to be profiled isc:\Apps\test\debug\app.out, the interrupt profile log is available in c:\Apps\test\debug\app.xml after profilingthe application for interrupt latency. For a multi-core simulator, multiple XML files are generated, one percore. The file name has the core index to distinguish the files.
More recent targets like C64x+ support Software Pipelined Loop (SPLOOP), an algorithm for processingsoftware loops more efficiently. The SPLOOP facility stores a single iteration of loop in a specializedhardware buffer and selectively overlays copies of the single iteration in a software pipeline to construct anoptimized loop execution.
To view the SPLOOPs on an appropriate target, choose Project→Build Options, and then select thefollowing build options: Opt Level: (-2 or higher) and Target Version: mv64+. SPLOOP is supported onC64x+ based devices. This IDE version lets you view SPLOOP in the disassembly window duringexecution. If you step through disassembly code using SPLOOPs, more than one cursor arrow mayappear in the selection margin of the disassembly code (Figure 10). These arrows appear to go back andforth every time you step through your code. The multiple cursor arrows are a virtual representation of theloops executing in parallel. So within the scope of the SPLOOP, you may see 3 cursor arrows (if there are3 loops) or 4 cursor arrows (if there are 4), etc.
SPRAA07C–October 2006 What's New In Code Composer Studio Development Tools v 3.3 13Submit Documentation Feedback

www.ti.com
12 MMU Page Table Viewer
13 Memory Load/Save Utility
MMU Page Table Viewer
Figure 10. Software Pipelining Loop (SPLOOP) in the Disassembly Window. The SPLOOP begins at thebreakpoint (depicted as a red circle). When loops are executing in parallel, multiple cursor arrows will
appear to move.
The MMU Page Table Viewer tool is a new option for CCStudio on ARM 9 and ARM 11 (v5 MMUconfiguration only) devices that allows you to visualize how the Memory Management Unit (MMU)translates virtual memory to physical memory (see the Virtual and Physical Memory topic in the onlinehelp for more information on memory and MMUs). The MMU Page Table Viewer allows you to accuratelyvisualize the address translation tables and configuration of the MMU. It decodes the two level page tablehierarchy of the MMU, displaying the logical to physical memory mapping and the page frame attributes.The Page Table Viewer has a flexible XML driven display, which supports ARM 9 and ARM 11 MMU pagetables. The Viewer display can be set to either automatically or manually update, and when sorted bylogical address, only the visible page table entries are read from the target. However, the Viewer iscurrently only supported for emulation, and there is no visualization of cached Translation LookasideBuffer (TLB) page table entries. Note: The MMU Page Table Viewer currently provides visibility into theARM v5 MMU. It does not support the ARM v6 MMU.
Previous versions of CCStudio supported data file formats in either a COFF output file (.out) or aCCStudio data file (.dat). This tool allows you to support raw binary data transfers, and also allows forfaster download speeds. This new option is available for ARM and C5000 targets. It has been optimized totake advantage of the newer emulation capabilities of the XDS560 to allow improvements of datadownload speeds (host to target), as well as additional improvements in speed regardless of emulator.There is also an option to perform byte swapping for every 16-bit word during the data transfer. You canuse the Write file to memory tab to load a file, and the Save memory to file tab to save a file.
To load a file on the target, type the full path of the file, or use the Browse button to select it. Select anaddress and a page and click Write. The writing process can be canceled at any time by clicking CancelThe plug-in also displays the progress of the operation. The destination address can be a physicaladdress or the address of a symbol. The page combo is disabled for targets that have only one memorypage. To save data from the target to a file type the full path of the file, or use the Browse button to selectit. Select an address, page and size and click Save memory. The writing process can be canceled at anytime by clicking Cancel. The plug-in also displays the progress of the operation.
What's New In Code Composer Studio Development Tools v 3.314 SPRAA07C–October 2006Submit Documentation Feedback

www.ti.com
14 New Debug Menu Items
14.1 Low Power Run
14.2 Advanced Resets
14.3 Halt on Reset
15 Troubleshooting Emulator Errors
16 IDE Changes
New Debug Menu Items
The Debug menu has three new items:
This is the same as a normal run, except that the target is not prevented from going into low power mode(sleep mode). If power is lost, the lower left corner of the CCStudio window will display a message. Losingpower may cause breakpoints to be lost. After a halt, all breakpoints will be verified, and disabled if theyare no longer present.
In addition to the default reset option (Reset CPU), you may have a choice of alternate resets dependingon your target. These are defined differently on each target; your target documentation will describe anynew resets that are available through this menu item.
When selected, the target will halt after a reset (inside the reset vector). Otherwise, the target will run.Some user-initiated resets will not necessarily run the target immediately, this is more for an external resetor when running and executing a reset. This value is undetermined until the target is connected. If youhave hardwired this state in the hardware after a power up, the value will not be correct until it isconnected. You can force a change on the target even when it is not connected.
We have added a new section to the online help under Customer Support called TroubleshootingEmulator Errors. This section describes some of the emulation related error messages that can begenerated by CCStudio, as well as some possible options to avoid or resolve the issue. The list isordered by the error number and contains errors generated at the GTI, OTI, and PTI levels. Scan levelerrors are not included. Clicking on an error will take you to the description and possible resolution for thaterror.
Note that support for CodeSizeTune, Peripheral Context Display (PCD), and the CSL graphic userinterface has been removed in this version of CCStudio. For more information about CSL or to find out ifCSL is supported by your device, check your device product folder on www.ti.com, or contact the ProductInformation Center (http://www-k.ext.ti.com/sc/technical-support/product-information-centers.htm).
Also, the OMAP System DMA and Interrupt Controller registers have been moved from the Tools menu tothe View→Registers menu option for OMAP processors.
SPRAA07C–October 2006 What's New In Code Composer Studio Development Tools v 3.3 15Submit Documentation Feedback

IMPORTANT NOTICE
Texas Instruments Incorporated and its subsidiaries (TI) reserve the right to make corrections, modifications,enhancements, improvements, and other changes to its products and services at any time and to discontinueany product or service without notice. Customers should obtain the latest relevant information before placingorders and should verify that such information is current and complete. All products are sold subject to TI’s termsand conditions of sale supplied at the time of order acknowledgment.
TI warrants performance of its hardware products to the specifications applicable at the time of sale inaccordance with TI’s standard warranty. Testing and other quality control techniques are used to the extent TIdeems necessary to support this warranty. Except where mandated by government requirements, testing of allparameters of each product is not necessarily performed.
TI assumes no liability for applications assistance or customer product design. Customers are responsible fortheir products and applications using TI components. To minimize the risks associated with customer productsand applications, customers should provide adequate design and operating safeguards.
TI does not warrant or represent that any license, either express or implied, is granted under any TI patent right,copyright, mask work right, or other TI intellectual property right relating to any combination, machine, or processin which TI products or services are used. Information published by TI regarding third-party products or servicesdoes not constitute a license from TI to use such products or services or a warranty or endorsement thereof.Use of such information may require a license from a third party under the patents or other intellectual propertyof the third party, or a license from TI under the patents or other intellectual property of TI.
Reproduction of information in TI data books or data sheets is permissible only if reproduction is withoutalteration and is accompanied by all associated warranties, conditions, limitations, and notices. Reproductionof this information with alteration is an unfair and deceptive business practice. TI is not responsible or liable forsuch altered documentation.
Resale of TI products or services with statements different from or beyond the parameters stated by TI for thatproduct or service voids all express and any implied warranties for the associated TI product or service andis an unfair and deceptive business practice. TI is not responsible or liable for any such statements.
Following are URLs where you can obtain information on other Texas Instruments products and applicationsolutions:
Products Applications
Amplifiers amplifier.ti.com Audio www.ti.com/audio
Data Converters dataconverter.ti.com Automotive www.ti.com/automotive
DSP dsp.ti.com Broadband www.ti.com/broadband
Interface interface.ti.com Digital Control www.ti.com/digitalcontrol
Logic logic.ti.com Military www.ti.com/military
Power Mgmt power.ti.com Optical Networking www.ti.com/opticalnetwork
Microcontrollers microcontroller.ti.com Security www.ti.com/security
Low Power Wireless www.ti.com/lpw Telephony www.ti.com/telephony
Video & Imaging www.ti.com/video
Wireless www.ti.com/wireless
Mailing Address: Texas Instruments
Post Office Box 655303 Dallas, Texas 75265
Copyright 2006, Texas Instruments Incorporated