what we’ve learned - practical farmers
TRANSCRIPT

[email protected] 515-232-5661
Sarah Carlson
Practical Farmers of Iowa
Strategic Initiatives Director
Maximizing Cover Crops:
What We’ve Learned
from 10 Years of
Cover Crop Research
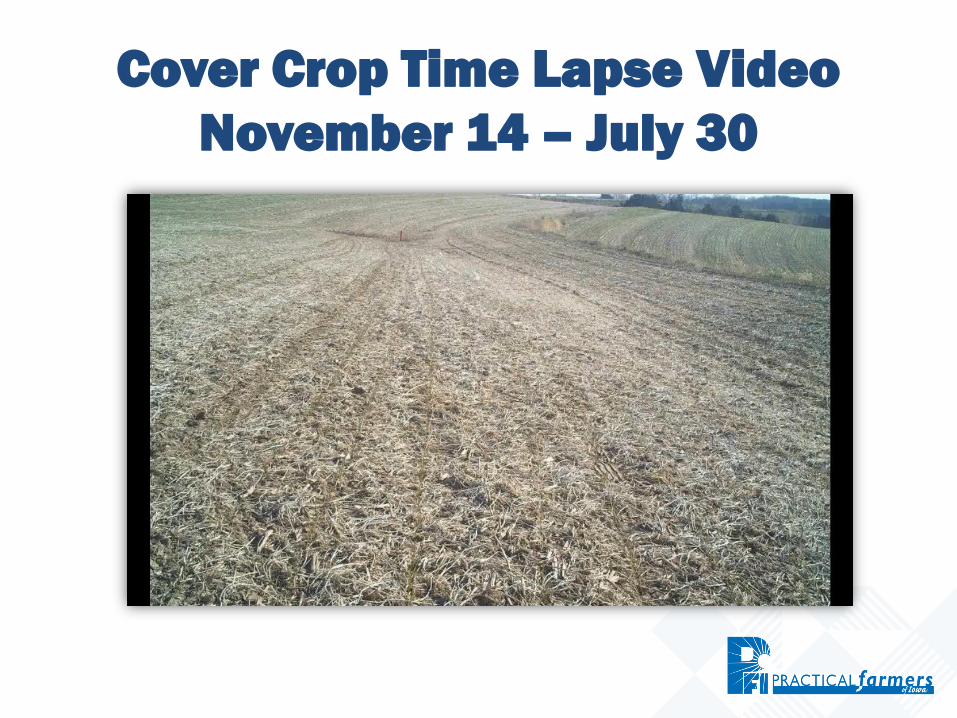
Cover Crop Time Lapse Video
November 14 – July 30

Equipping farmers to build resilient
farms and communities.
Member-led, non-profit organization 3,400 members

Barriers
to reaching
goals

Soil Nitrate Production vs. Crop Nitrate Uptake
In the shaded areas, the soil produces nitrate,
but there is no crop to use it.
As a result, some nitrate is lost to waterways.
March February
Rate of soil
nitrate
production
from native
soil organic
matter
Rate of corn or
soybean nitrate
uptake
The majority of nitrate used by
corn and soybean comes from
soil nitrate production. Corn gets
the difference from fertilizer
while soybean gets the difference
from legume fixation of
atmospheric nitrogen.

Adds
Cover
Crops
20132011 2012Farmer’s
Tile
YR 2
Cover
Crops
4R,
No-till
Not
Enough

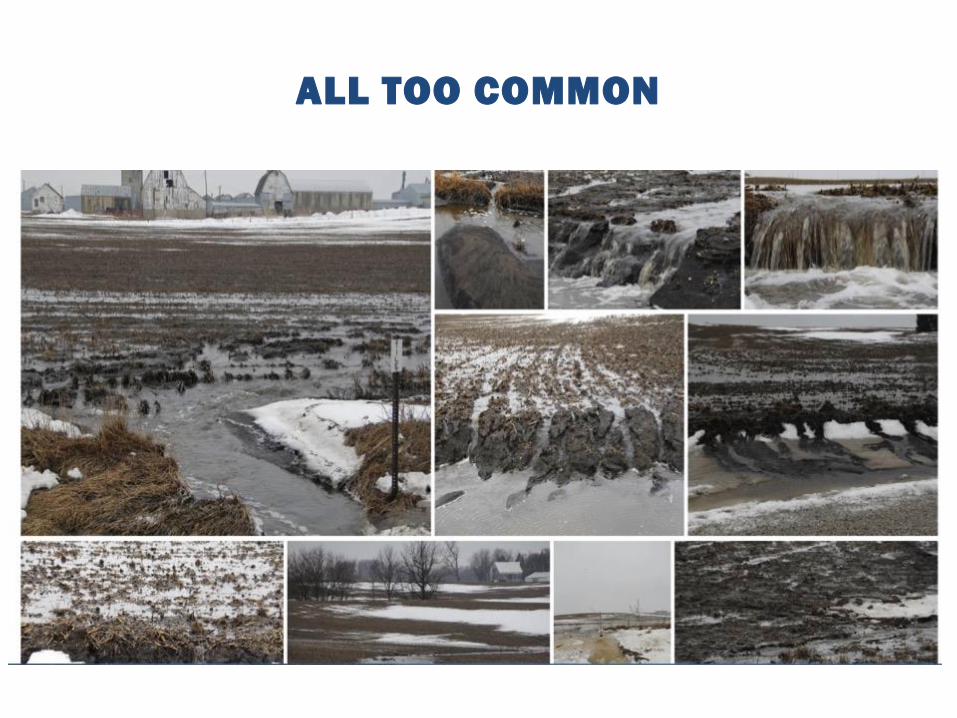
ALL TOO COMMON


WIN – PFI Corn/Soybean
Farmer Members
(~1400/3300)
73% Use/Added Cover Crops
50% Use/Added Small Grains

WIN – Private Cover Crop Cost Share
Low-Carbon CornSustainable Soy
GOALS26,000 A of cover crop scaling to
188,000 A by 2023

WIN – Crop Insurance Premium Discount
• Three Year Pilot
• $5/A of cover crop discounted from crop
insurance premium
• Year 1 165,000A signed up
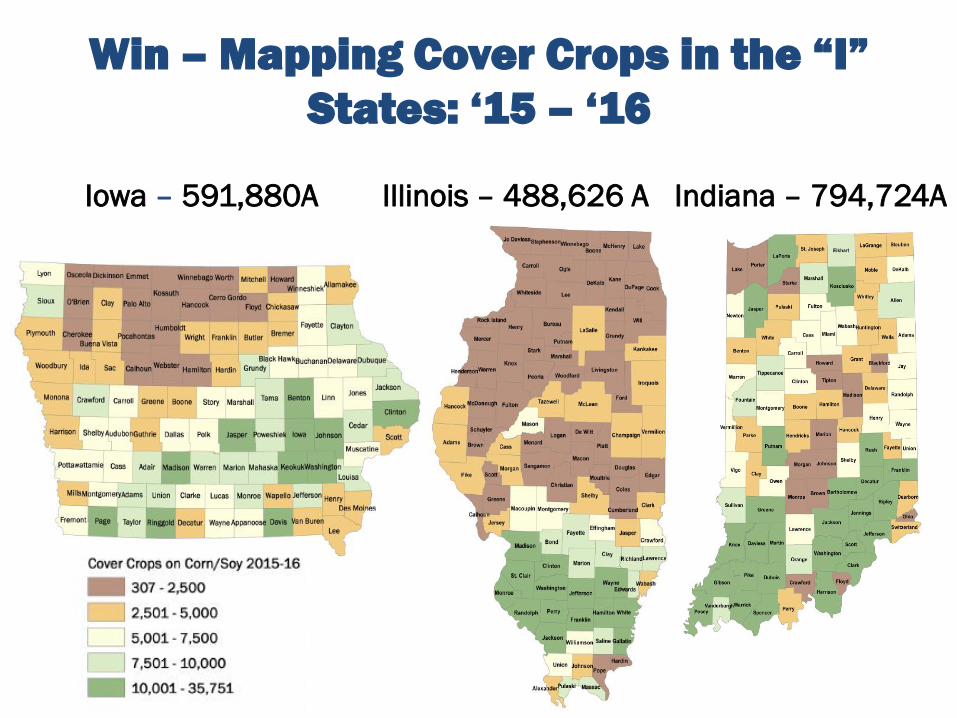
Iowa – 591,880A Illinois – 488,626 A Indiana – 794,724A
Win – Mapping Cover Crops in the “I”
States: ‘15 – ‘16

Win – Cover Crops Acres
760,000 A statewide in 2017
0
200,000
400,000
600,000
800,000
2011 2012 2013 2014 2015 2016 2017
Co
ver
Cro
ps
Acr
es
Total Acres (ILF Estimate 2014-2017)
Cost Share Acres (State and Federal)

Iowa Cover
Crop Acres
2015 – 2016
Iowa Rented
Farmland, 2012

“$30-$35/A cover crop cost protects
a $5000-$10,000/A asset.”
- Iowa farmer new to cover crops
Final NCR-SARE Project Report:
https://projects.sare.org/project-reports/lnc15-375/

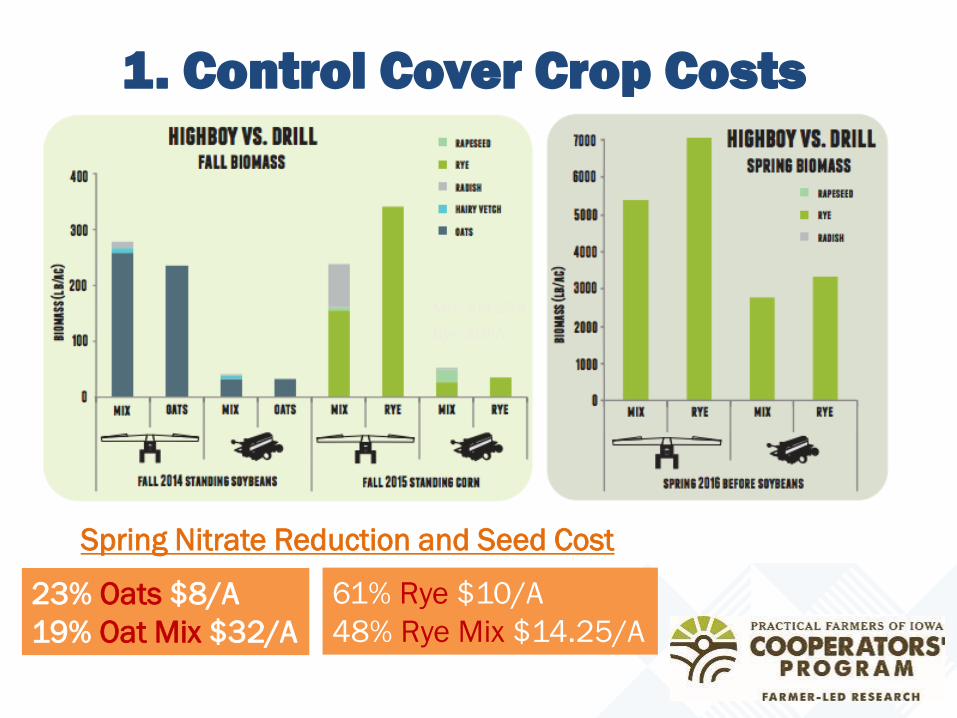
1. Control Cover Crop Costs
2. Control Herbicide Costs
3. Avoid Cover Crop Establishment Failures
4. Avoid Redundant Expenses
5. Avoid Corn Yield Drag
6. Realize Soybean Yield Gains
7. Feed Cover Crops
Make Cover Crops Pay on your FarmFarmer-led Research Results from PFI’s Cooperators Program

54COOPERATORS TOOK PART IN 77RESEARCH TRIALS
IN 2018
Mix: $14.25/A
Rye: $10/A
1. Control Cover Crop Costs
61% Rye $10/A
48% Rye Mix $14.25/A
23% Oats $8/A
19% Oat Mix $32/A
Spring Nitrate Reduction and Seed Cost

•49 cover crop entries
•10-16 locations
•5 years
GRASS:
Cereal RyeBRASSICAS:
Rapeseed
LEGUMES:
Hairy Vetch
Cover Crop
Variety Trial

*60” wide corn spacing accommodates all

2. Control Herbicide Costs
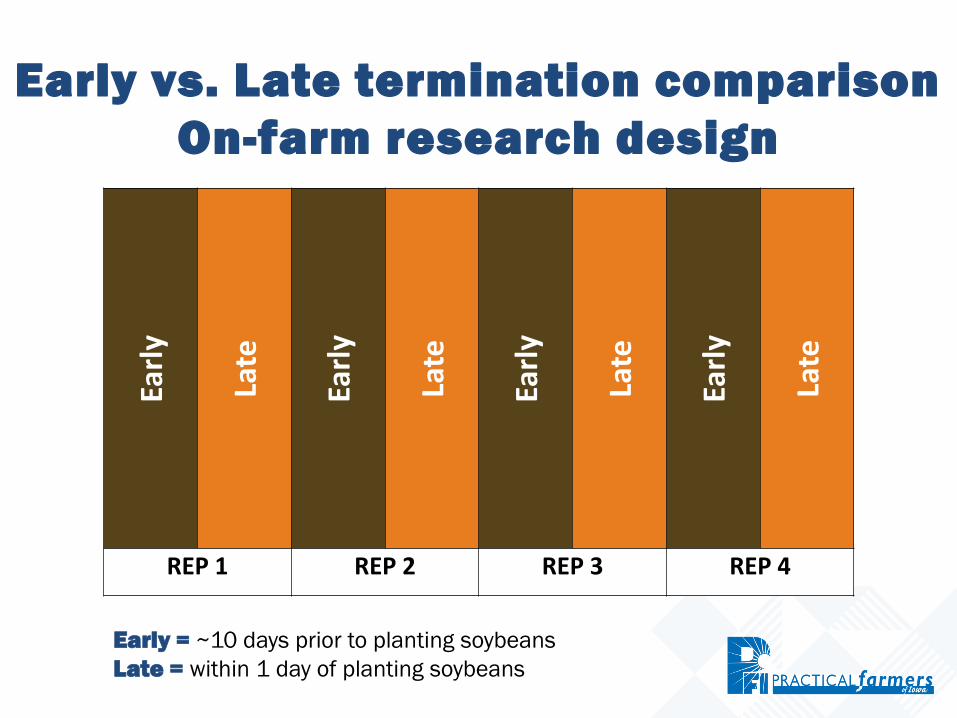
Earl
y
Late
Earl
y
Late
Earl
y
Late
Earl
y
Late
REP 1 REP 2 REP 3 REP 4
Early vs. Late termination comparison
On-farm research design
Early = ~10 days prior to planting soybeans
Late = within 1 day of planting soybeans

Seeding soybeans into >7,000lb/ac cc


$30+$40+
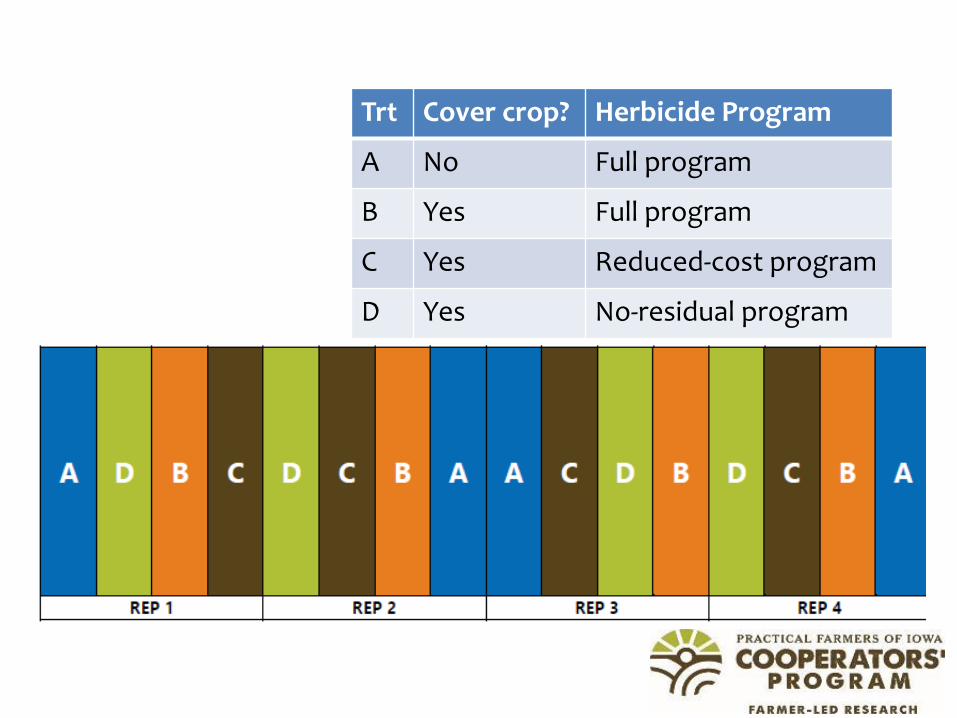
Trt Cover crop? Herbicide Program
A No Full program
B Yes Full program
C Yes Reduced-cost program
D Yes No-residual program

Treatment Cost ($/ac)
Revenue ($/ac)*
ROI($/ac)
No-cover, full program 35.48 693.60 658.12
Cover, full program 66.73 667.59 600.86
Cover, reduced program
55.93 693.60 637.67
Cover, no-residual 44.60 693.60 649.00
*Soybean price = $8.67/bu (Nov. 13)

3. Avoid Cover Crop Failures
• Check herbicide label for potential carryover & grazing restriction
• Cereal rye only affected by 2x Dual II Magnum
• Vetch, lentil, and radish affected by:
– Balance Flexx, Corvus, & Hornet
• Atrazine, Callisto, & Laudis caused no injury

Armstrong, et al., Illinois State University
4. Avoid Redundant ExpensesFall Nitrogen Stabilizer vs. Cover Crop

5. Avoid Corn Yield Drag

12 participating farmers
from 2008 – 2018

*
*
*
*
*
*
*
*
-50
-40
-30
-20
-10
0
10
20
30
20
09
Je
ffer
son
20
10
Co
on
Rap
ids
20
10
Har
lan
20
18
Co
on
Rap
ids
20
17
Je
ffer
son
20
12
Co
on
Rap
ids
20
10
Clu
tie
r 1
20
10
New
Mar
ket
20
14
Co
on
Rap
ids
20
16
Co
on
Rap
ids
20
11
Har
lan
20
10
Clu
tie
r 2
20
11
Je
ffer
son
20
14
Kal
on
a
20
10
Wes
t C
hes
ter
20
15
Ho
lste
in
20
14
Wes
t C
hes
ter
20
16
Pla
infi
eld
20
12
Pla
infi
eld
20
12
Wes
t C
hes
ter
20
09
Co
nra
d
20
11
Ho
lste
in
20
13
Ho
lste
in
20
18
Pla
infi
eld
20
15
Je
ffer
son
20
12
Clu
tie
r 1
20
11
Kal
on
a
20
16
Wes
t C
hes
ter
20
18
Wes
t C
hes
ter
20
13
Kal
on
a
20
14
Pla
infi
eld
20
09
Har
lan
20
14
New
Mar
ket
20
12
New
Mar
ket
20
09
Gre
enfi
eld
20
11
Fo
rt D
od
ge
20
14
Clu
tie
r
20
18
New
Mar
ket
20
16
New
Mar
ket
bu
she
ls p
er
acre
Yield drag from cover crop (5/39)
*P ≤ 0.10
Yield neutral (31/39)
Yield advantage from cover crop (3/39)

Apply Sufficient N at Planting


Reduce Corn Seedling Disease Potential

Camelina showed no increased Pythium incidence

*
*
* * * **
* *
*
-20
-15
-10
-5
0
5
10
15
20
20
13
Co
on
Rap
ids
20
11
Wes
t C
hes
ter
20
09
Pla
infi
eld
20
15
Co
on
Rap
ids
20
16
Ho
lste
in
20
17
Wes
t C
hes
ter
20
15
Pla
infi
eld
20
12
Kal
on
a
20
16
Je
ffer
son
20
12
Fo
rt D
od
ge
20
18
Je
ffer
son
20
11
New
Mar
ket
20
10
Je
ffer
son
20
13
Clu
tie
r 1
20
12
Je
ffer
son
20
09
Co
on
Rap
ids
20
11
Pla
infi
eld
20
17
Pla
infi
eld
20
10
Ho
lste
in
20
15
Wes
t C
hes
ter
20
13
Pla
infi
eld
20
13
New
Mar
ket
20
15
Kal
on
a
20
12
Ho
lste
in
20
15
New
Mar
ket
20
10
Kal
on
a
20
10
Har
lan
20
11
Clu
tie
r 1
20
17
New
Mar
ket
bu
she
ls p
er
acre
Yield drag from cover crop (2/29)
*P ≤ 0.10
Yield neutral (19/29)
Yield advantage from cover crop (8/29)
6. Improve Soybean Yield

Cover crops and soil health• Tea Bag
• Soil Decomposition Index
Dr. Marshall McDaniel, ISU
Teresa Middleton, ISU
Green tea
(easy to decompose)
Red tea
(difficult to decompose)
• Index = • % red tea decomp.
• % green tea decomp.

Cover crops and soil health
• The closer to 1.00, the healthier the soil.
• Soil under the cover crop was better able to decompose the red tea
(e.g., more microbial activity).
0.41
0.33
0
0.1
0.2
0.3
0.4
0.5
Cover No-cover
Soil Health Index -- Stout Farm

Photo: Fernando Miguez
7. Feed Cover Crop
https://www.extension.iastate.edu/agdm/crop
s/xls/a1-91economicsofcovercrops.xlsx

If we want to turn this….into this
cover crops need to pay today!
Get Started:
• https://www.card.iastate.edu/conservation/
• Join Practical Farmers of Iowa
• Attend PFI Annual Conference at Scheman
January 18–19, 2019
• [email protected] or 515-232-5661

Cover Crop Decision Tree