what we've learned from the credit crisis - milken...
TRANSCRIPT

1
What We've Learned From the Credit Crisis
Tuesday, April 28, 200911:00 AM -
12:15 PM
Speakers:Alexander Friedman, Chief Financial Officer, Bill & Melinda Gates FoundationJames Gellert, President and CEO, Rapid Ratings InternationalBruce Kasman, Chief U.S. Economist, JPMorgan
ChaseJames McCaughan, CEO, Principal Global Investors LLCGary Shilling, President, A. Gary Shilling & Co.
ModeratorCharles Van Vleet, Director, Portfolio Investments, United Technologies Corp.

2
U.S. consumer credit trends down
Annualized percent changes in consumer credit
-10-505
1015202530
1952 1956 1960 1964 1968 1972 1976 1980 1984 1988 1992 1996 2000 2004 2008
Percent
Note: Shaded columns denote periods of recession.Sources: Federal Reserve, Milken
Institute.
.

3
Credit then and now
Source: Federal Reserve.
Financial Sector
3%
1958Total debt: $661.2 billion
Government44%
Nonfinancial Business sector
26%
Households27%
2008Total debt: $50,734 billion
Households27%
Financial sector34%
Government17%
Nonfinancial Business sector
22%
4
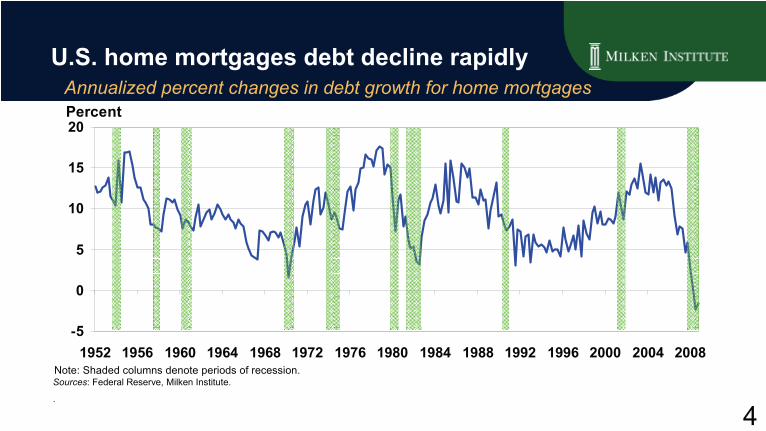
U.S. home mortgages debt decline rapidly Annualized percent changes in debt growth for home mortgages
-5
0
5
10
15
20
1952 1956 1960 1964 1968 1972 1976 1980 1984 1988 1992 1996 2000 2004 2008
Percent
Sources: Federal Reserve, Milken
Institute.
.
Note: Shaded columns denote periods of recession.
5
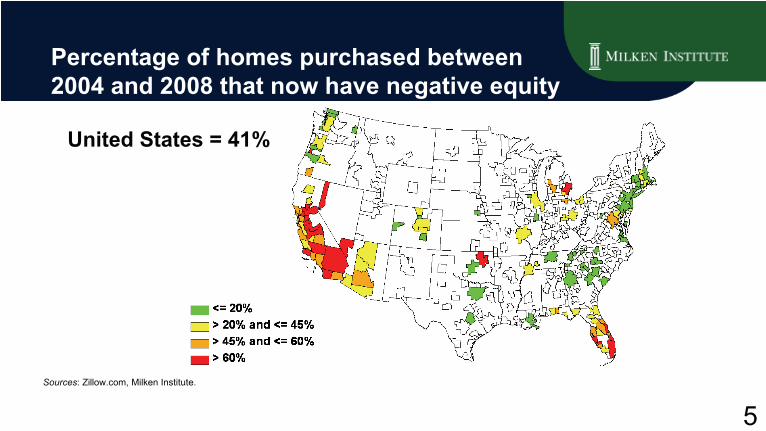
Percentage of homes purchased between 2004 and 2008 that now have negative equity
Sources: Zillow.com, Milken Institute.
United States = 41%

6
Financial stocks take big hits
Note: Bear Stearns stock price is to May 2008. Countrywide stock
price is to June 2008. Merrill Lynch and Wachovia stock prices are to December 2008.Sources: Bloomberg, Milken Institute.
-99.9-99.9-98.9-98.8-98.6
-94.3-90.3-90.0-87.5-87.2
-82.7-66.3
-60.0-46.8-45.0
Lehman BrothersWashington MutualFreddie MacFannie MaeAIGBear StearnsWachoviaCountrywideMerrill LynchBank of AmericaUBSMorgan StanleyWells FargoGoldman SachsJPMorgan & Chase
Percentage change in stock price, Dec. 2006-March 2009
1,446
1,070
461364
2006 2007 2008 2009 March
Total loss in market value: $1,081 billion from December 2006 to March 2009
Total market capitalization of these selectedfinancial institutions, US$ billions

7
Federal Reserve has little maneuvering room
Sources: Federal Reserve, Milken Institute.
0.00.51.01.52.02.53.03.54.04.5
01 02 03 04 05 06 07 08 09 10 11 12 01 02 03 04
Percent
Effective federal funds rate
Target federal funds rateApr. 30, 2008: 2%Oct. 8, 2008: 1.5%Oct. 29, 2008: 1%Dec. 16, 2008: 0-0.25%
2008 2009
8
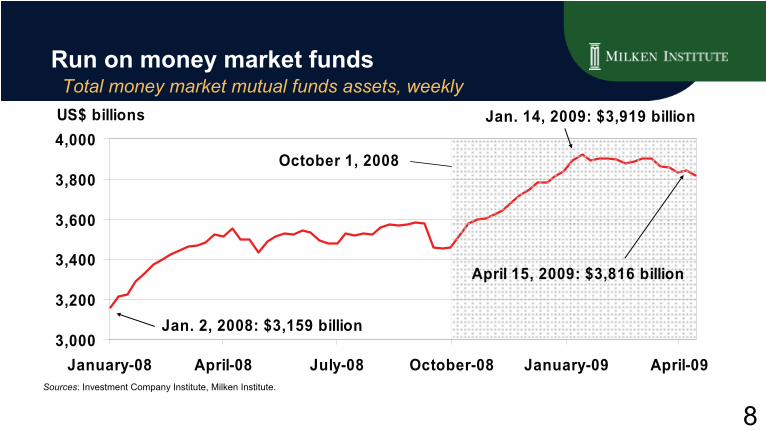
Run on money market funds
Total money market mutual funds assets, weekly
Sources: Investment Company Institute, Milken Institute.
3,000
3,200
3,400
3,600
3,800
4,000
January-08 April-08 July-08 October-08 January-09 April-09
US$ billions Jan. 14, 2009: $3,919 billion
April 15, 2009: $3,816 billion
October 1, 2008
Jan. 2, 2008: $3,159 billion

9
Market for liquidity freezes
30-day commercial paper yield spreads over 1-month Treasury
Sources: Federal Reserve, Milken Institute.
0
100
200
300
400
500
600
January-07 July-07 January-08 July-08 January-09
Asset-backed commercial paperFinancial commercial paper
AA rated, daily, basis points The Fed announced Commercial Paper Funding Facility (CPFF) on Oct. 7, 2008

10
Commercial paper outstanding declines substantially Outstanding asset-backed and unsecured commercial paper
Sources: Federal Reserve, Milken Institute.
0.5
0.7
0.9
1.1
1.3
Jan-04 Jul-04 Jan-05 Jul-05 Jan-06 Jul-06 Jan-07 Jul-07 Jan-08 Jul-08 Jan-09
Asset-backed commercial paperNon-asset-backed commercial paper
US$ trillions August 8, 2007: $1.2 trillion
April 15, 2009: $681 billionJan. 7, 2004: $659 billion

11Source:
Bloomberg.
Credit spreads for corporate bonds in the U.S.
Corporate bond spreads started to narrow
Credit spread for high-yield bond
Credit spread for investment-grade bond rated AAA
0
500
1,000
1,500
2,000
Mar2006
Jun2006
Sep2006
Dec2006
Mar2007
Jun2007
Sep2007
Dec2007
Mar2008
Jun2008
Sep2008
Dec2008
Mar2009
Basic points, spread over 10-year Treasury
12
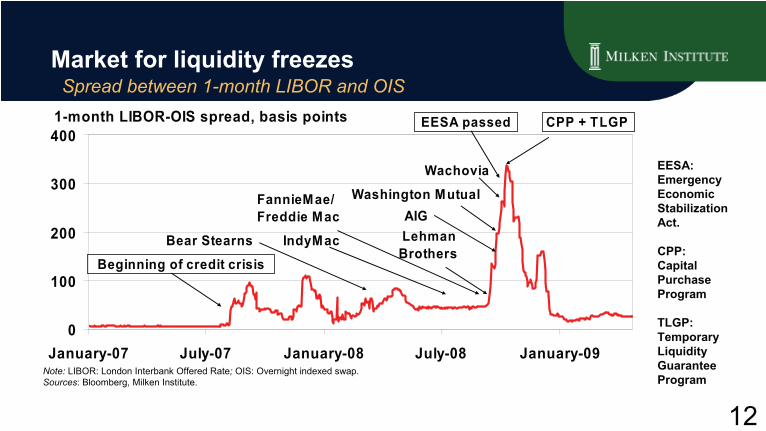
Market for liquidity freezes
Spread between 1-month LIBOR and OIS
Note: LIBOR:
London Interbank
Offered Rate; OIS: Overnight indexed swap.Sources: Bloomberg, Milken Institute.
0
100
200
300
400
January-07 July-07 January-08 July-08 January-09
1-month LIBOR-OIS spread, basis points
Bear Stearns IndyMac
FannieMae/Freddie Mac
Lehman Brothers
Wachovia
Washington Mutual AIG
CPP + TLGPEESA passed
Beginning of credit crisis
EESA: Emergency Economic Stabilization Act.
CPP: Capital Purchase Program
TLGP: Temporary Liquidity Guarantee Program

13
TED Spread reached historical high in 2008
Monthly, January 1985—March 2009
Sources: Bloomberg, Milken Institute.
0
50
100
150
200
250
300
350
1985 1988 1991 1994 1997 2000 2003 2006 2009
November 1987: 255 bps
September 2008: 315 bps
Average since 1985: 59 bps
Basis points
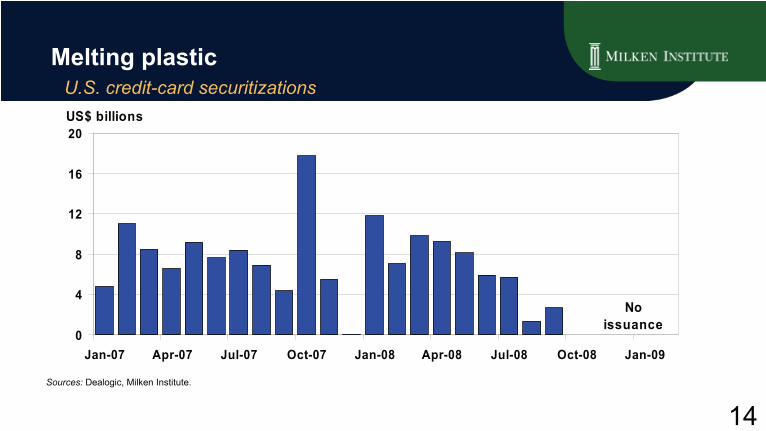
14
Melting plastic
U.S. credit-card securitizations
Sources:
Dealogic, Milken
Institute.
0
4
8
12
16
20
Jan-07 Apr-07 Jul-07 Oct-07 Jan-08 Apr-08 Jul-08 Oct-08 Jan-09
US$ billions
No issuance

15
Credit drought Issuance of asset-backed securities in the U.S.
Sources:
Dealogic, Milken
Institute.*Through Mar. 5, 2009
0.0
0.2
0.4
0.6
0.8
1.0
1.2
1996 1997 1998 1999 2000 2001 2002 2003 2004 2005 2006 2007 2008 2009*
US$ trillions
$2.1 billion

16
Comeback
U.S. corporate-bond volume, high-yield and investment-grade
Sources:
Dealogic, Milken
Institute.
0
40
80
120
160
Jan-07 Apr-07 Jul-07 Oct-07 Jan-08 Apr-08 Jul-08 Oct-08 Jan-09
US$ billions

17
Counterparty risk increases
Note: Counterparty Risk index averages the market spreads of the
credit default swaps (CDS) of fifteen major credit derivatives dealers, including ABN Amro, Bank of America, BNP Paribas, Barclays Bank, Citigroup, Credit Suisse, Deutsche Bank, Goldman Sachs Group, HSBC, Lehman Brothers, JPMorgan Chase, Merrill Lynch, Morgan Stanley, UBS, and Wachovia. Sources:
Datastream, Milken Institute.
0
100
200
300
400
500
600
700
07/2007 09/2007 11/2007 01/2008 03/2008 05/2008 07/2008 09/2008 11/2008 01/2009 03/2009
Average CDS spread, basis points
Bear Stearns acquired
Government announces support for Fannie Mae and Freddie Mac
Lehman Brothers files for bankruptcy and Merrill Lynch acquired
AIG rescuedCitigroup agreed to buy Wachovia
October 10, 2008: 607 bps March 10, 2009: 573 bps

18
Rising risk: The credit default swap market roughly doubled each year from June 2001
through Oct. 2008
0.6 0.9 1.6 2.2 2.7 3.8 5.4 8.412.4
17.126.0
34.4
45.5
62.254.6
47.0
0
10
20
30
40
50
60
70
June2001
Dec.2001
June2002
Dec.2002
June2003
Dec.2003
June2004
Dec.2004
June2005
Dec.2005
June2006
Dec.2006
June2007
Dec.2007
June2008
Oct.2008
Notional amount of credit default swaps outstanding, US$ trillions
Source: International Swaps and Derivatives Association, Milken
Institute.

19
Participants in credit derivative market March 2007
Source: Bank for International Settlements.
CDS buyers of protection
Miscellaneous1%
Banks and dealers (Trading
portfolios)33%
Loan portfolios7%
Insurers 18%
Hedge funds31%
Mutual funds3%
Corporations2%
Pension funds5%
CDS sellers of protection
Miscellaneous1%
Banks and dealers (Trading
portfolios)39%
Loan portfolios20%
Insurers 6%
Hedge funds28%
Mutual funds2%
Corporations2%
Pension funds2%

20
Losses/write-downs, capital raised by
financial institutions worldwide
Sources: Bloomberg, Milken
Institute.
US$ billions, through April 10, 2009 Loses/Write-downs Capital raisedWachovia, United States 101.9 11Citigroup, United States 88.3 109.3AIG, United States 87.3 91.7Freddie Mac, United States 81.6 51.6Fannie Mae, United States 71.3 30.8Merrill Lynch, United States 55.9 29.9UBS, Switzerland 50.6 32.1Washington Mutual, United States 45.3 12.1Bank of America, United States 42.7 78.5HSBC, United Kingdom 42.2 23.7Others 621 633.2Grand total 1,288.1 1,103.9
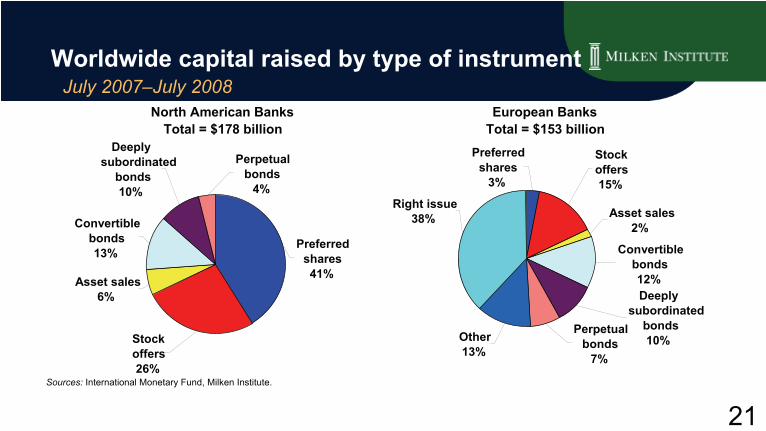
21
Worldwide capital raised by type of instrument
July 2007–July 2008
Sources:
International Monetary Fund, Milken
Institute.
Preferred shares
3%
Stock offers15%
Asset sales2%
Convertible bonds12%Deeply
subordinatedbonds10%
Perpetual bonds
7%
Other13%
Right issue38%
European BanksTotal = $153 billion
Preferred shares41%
Perpetual bonds
4%
Deeply subordinated
bonds10%
Convertible bonds13%
Asset sales6%
Stock offers26%
North American BanksTotal = $178 billion

22
Worldwide capital raised by source July 2007–July 2008
Sources:
International Monetary Fund, Milken
Institute.
Public investors
69%
Other institutionalinvestors
24%
Sovereign wealth funds
7%
January 2008–July 2008Total = $300 billion
Sovereign wealth funds60%
Public investors
12%
Other institutionalinvestors
28%
July 2007–December 2007Total = $56 billion
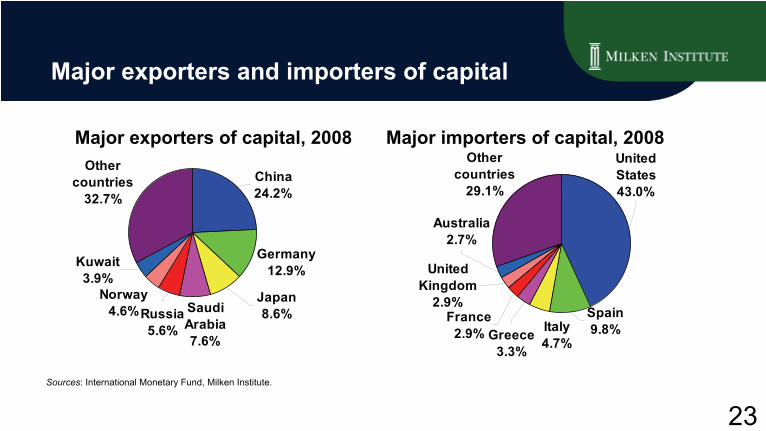
23
Major exporters and importers of capital
Sources: International Monetary Fund, Milken
Institute.
Major exporters of capital, 2008 Major importers of capital, 2008
Germany12.9%
Norway4.6%
Other countries
32.7%China24.2%
Saudi Arabia7.6%
Japan8.6%Russia
5.6%
Kuwait3.9%
United States43.0%
Greece3.3%
Italy4.7%
France2.9%
Australia2.7%
Spain9.8%
United Kingdom
2.9%
Other countries
29.1%
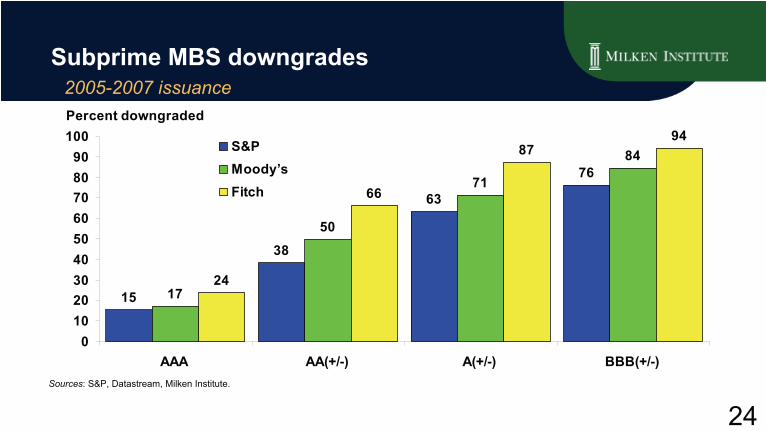
24
Subprime MBS downgrades
2005-2007 issuance
15
38
63
76
17
50
71
84
24
66
8794
0102030405060708090
100
AAA AA(+/-) A(+/-) BBB(+/-)
S&PMoody’sFitch
Percent downgraded
Sources: S&P, Datastream, Milken
Institute.

25
Leverage ratio for commercial banks
02468
101214161820
1896 1905 1914 1923 1932 1941 1950 1959 1968 1977 1986 1995 2004
Asset/capital ratio
Average, 1896 - 2008: 11.0x
1945: 18.2x 1979: 17.4x
1932: 6.2x
2008: 10.6x
1896: 3.6x
Sources: FDIC, Milken
Institute.

26
Leverage ratios of selected financial firms December 2008
9.3
10.6
11.1
31.6
26.2
21.5
67.9
0 10 20 30 40 50 60 70 80
Credit unions
Commercial banks
Saving institutions
Brokers/hedge funds
Federal Home Loan Banks
Fannie Mae
Freddie Mac
Leverage ratio, total assets/common equity
Note: Leverage ratios for
Freddie Mac and Fannie Mae are as of June 2008. The two institutions have negative common equities as of December 2008.Sources: FDIC, FHL Banks Office of Finance, National Credit Union Administration, Freddie Mac, Fannie Mae, Milken Institute.
(June 2008)
(June 2008)(June 2008)

27
What We’ve Learned from the Credit Crisis
James GellertPresident and CEO, Rapid Ratings
International
28
In Credit Ratings, the more things changed, the more they stayed the same…“The Commission shall conduct a study of the role and function of
credit rating agencies”
regarding “any impediments to the accurate appraisal by credit rating agencies of the financial resources and risks of issuers of securities”
–
Section 702 of Sarbanes-Oxley Act of 2002
The purpose is “to improve ratings quality for the protection of investors and in the public interest by fostering accountability, transparency, and competition in the credit rating agency industry”
–
Credit Rating Agency Reform Act of 2006
“Rating agency performance in the area of [structured products], has shaken investor confidence to its core“
–
SEC Chairman Nancy Schapiro
at the Roundtable to Examine Oversight of Credit Rating Agencies, April 15, 2009
29
Credit Ratings are woven into the fabric of the markets
“The story of the credit rating agencies is a story of a colossal
failure. The credit rating agencies occupy a special place in our financial markets. Millions of investors rely on them for
independent objective assessments. The rating agencies broke this bond of trust, and Federal regulators ignored the warning signs and did nothing to protect the public.”
--
Henry Waxman, Chairman of the House Oversight Committee, October 22, 2008
This “special place”
is:•in the Path Dependence of credit market professionals’
workflow norms •at least 8 Federal statutes, 41 regulations, over 100 state acts
and regulations, through LIBOR markets and myriad loan agreements, corporate policies, fiduciary charters, etc. •And, more recently, the Federal Reserve’s signal to the market that the Big 3 rating agencies are primus inter pares
or first among equals:“I write to express my deep concern about the ratings eligibility
criteria for the Federal Reserve’s anticipated $1 trillion lending initiative….[and] the Federal Reserve’s policy of preferring Standard & Poor’s, Moody’s Investor Services and Fitch Ratings…. The Federal Reserve should not be favoring large market participants, whose mistakes helped precipitate the current crisis…”
--
CT Attorney General Richard Blumenthal in a letter to Ben Bernanke
on April 6, 2009

30
What’s being done: more regulation –
not less
SEC, IOSCO and other international initiatives
Various bills floating through Congress
SEC review of rating agencies for transparency, conflicts, compliance, etc., and evaluation of ratings references in SEC regulations
“It is imperative that the Commission adopt its proposal to address the oligopoly in the rating industry and the overreliance
on NRSRO ratings by removing the regulatory requirements embedded in numerous SEC rules”
--
SEC Commissioner Kathleen L. Casey, Feb. 6, 2009
Nevertheless, the winds of change are for more regulation --
not less
31
Potential ratings market changes
Disallowing the Issuer-Paid revenue model? Unlikely
Removal from regulations? Unlikely
Anti-trust action against the Issuer-Paid agencies? Unlikely
New market structure? Possible. Various options being discussed:•Soft-Dollar type pool to pay agencies by bond buyer designation•Bill to include one Subscriber-Paid and one Issuer-Paid agency•Rotating agencies •Investor-Owned Credit Rating Agency (IOCRA) •New oversight entity

32
What we’re seeing at Rapid Ratings
Buy-Side, Sell-Side and Corporations (for customer, supplier and vendor risk management) are all experiencing:
•
Dissatisfaction with the status quo –
market players have learned they cannot rely on the Big 3, but they cannot escape them completely
•
Greater openness to alternative ratings approaches and desire for “accurate”
and “actionable”
ratings
•
More focus from outside directors, audit committees, CEO/CFOs on
counterparty risk management
•
Greater desire to find uncorrelated risk management perspectives
•
All parties watching the regulatory response to ratings for guidance. And not enough concern about the pending corporate refinancings

33
What we’re seeing at rapid ratings continued
As one example of an early warning on the way down…
…but no recovery in sight…
US Homebuilders
34
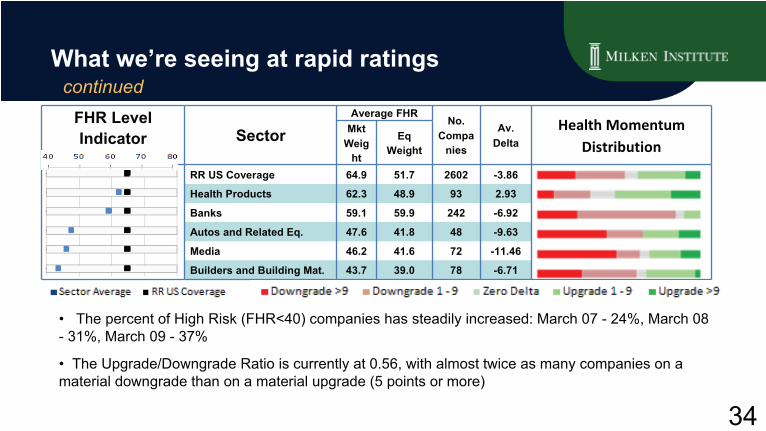
What we’re seeing at rapid ratings continued
FHR Level Indicator Sector
Average FHRNo.
Compa
nies
Av.Delta
Health Momentum
DistributionMkt
Weig
ht
Eq
Weight
RR US Coverage 64.9 51.7 2602 -3.86
Health Products 62.3 48.9 93 2.93
Banks 59.1 59.9 242 -6.92
Autos and Related Eq. 47.6 41.8 48 -9.63
Media 46.2 41.6 72 -11.46
Builders and Building Mat. 43.7 39.0 78 -6.71
•
The percent of High Risk (FHR<40) companies has steadily increased: March 07 -
24%, March 08 -
31%, March 09 -
37%
•
The Upgrade/Downgrade Ratio is currently at 0.56, with almost twice as many companies on a material downgrade than on a material upgrade (5 points or more)

35
Can the system be fixed in time?
Source: ML Indices: (1998 -
2010 Maturities calculated as at Jan 1 the prior year). (2010 -
2015 Maturities calculated as at Jan 1 2009). $ in Billions
The focus on accurate corporate ratings and information transparency for CLO and other ratings will be critical
High Yield Index Refinancing NeedsInvestment Grade Index Refinancing Needs
020406080
100120140
1998 2002 2006 2010 20140
50100150200250300350
1998 2002 2006 2010 2014
($ billion)
36
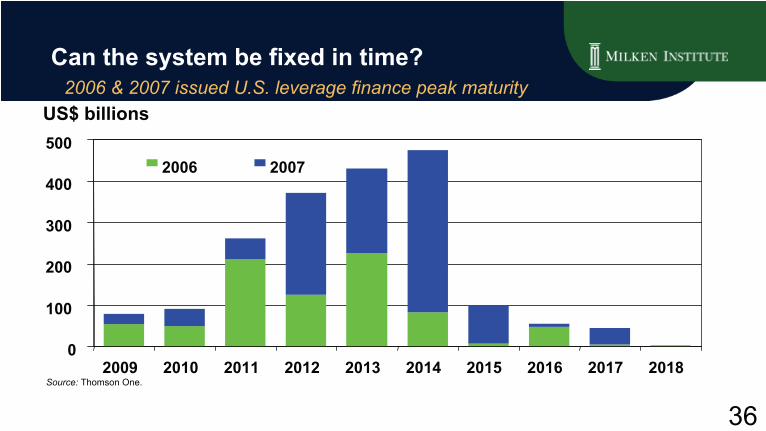
Can the system be fixed in time?
2006 & 2007 issued U.S. leverage finance peak maturity
Source:
Thomson One.
US$ billions
0
100
200
300
400
500
2009 2010 2011 2012 2013 2014 2015 2016 2017 2018
2006 2007
37
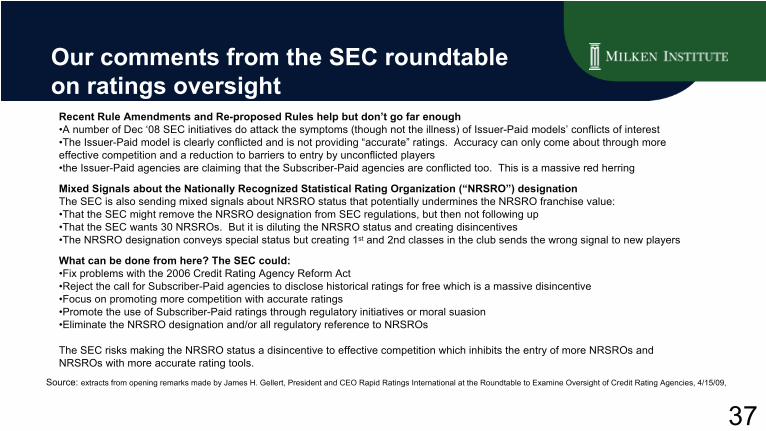
Our comments from the SEC roundtable on ratings oversight
Source: extracts from opening remarks made by James H. Gellert, President and CEO Rapid Ratings International at the Roundtable to Examine Oversight of Credit Rating Agencies, 4/15/09,
Recent Rule Amendments and Re-proposed Rules help but don’t go far enough•A number of Dec ‘08 SEC initiatives do attack the symptoms (though not the illness) of Issuer-Paid models’
conflicts of interest •The Issuer-Paid model is clearly conflicted and is not providing “accurate”
ratings. Accuracy can only come about through more effective competition and a reduction to barriers to entry by unconflicted
players•the Issuer-Paid agencies are claiming that the Subscriber-Paid agencies are conflicted too. This is a massive red herring
Mixed Signals about the Nationally Recognized Statistical Rating
Organization (“NRSRO”) designationThe SEC is also sending mixed signals about NRSRO status that potentially undermines the NRSRO franchise value:•That the SEC might remove the NRSRO designation from SEC regulations, but then not following up •That the SEC wants 30 NRSROs. But it is diluting the NRSRO status and creating disincentives•The NRSRO designation conveys special status but creating 1st
and 2nd classes in the club sends the wrong signal to new players
What can be done from here? The SEC could:•Fix problems with the 2006 Credit Rating Agency Reform Act •Reject the call for Subscriber-Paid agencies to disclose historical ratings for free which is a
massive disincentive•Focus on promoting more competition with accurate ratings•Promote the use of Subscriber-Paid ratings through regulatory initiatives or moral suasion•Eliminate the NRSRO designation and/or all regulatory reference to NRSROs
The SEC risks making the NRSRO status a disincentive to effective competition which inhibits the entry of more NRSROs
and NRSROs
with more accurate rating tools.
38
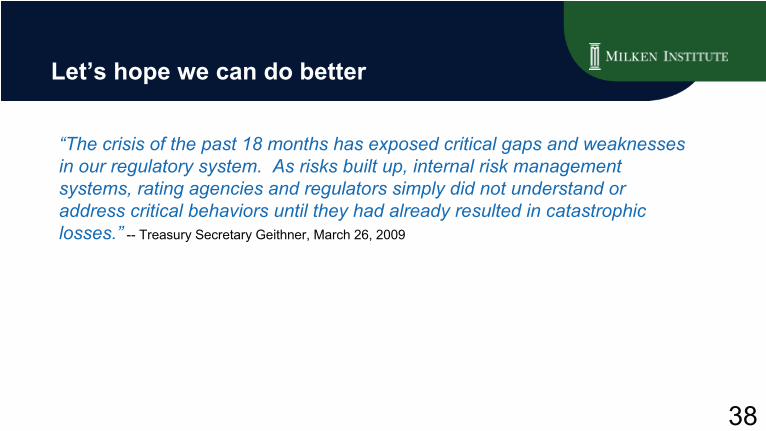
Let’s hope we can do better
“The crisis of the past 18 months has exposed critical gaps and weaknesses in our regulatory system.
As risks built up, internal risk management systems, rating agencies and regulators simply did not understand or address critical behaviors until they had already resulted in catastrophic losses.”
--
Treasury Secretary Geithner, March 26, 2009
39
What We’ve Learned from the Credit Crisis
James McCaughanChief Executive Officer
Principal Global Investors LLC

40
U.S. private debt
U.S. Private Debt% Nominal GDP
2008: 4Q: 175.5%
Source:
ISI Group.

41
U.S. private debt
Source:
ISI Group.

42
Japan consumer and NONFIN consumer debt
Source:
ISI Group.
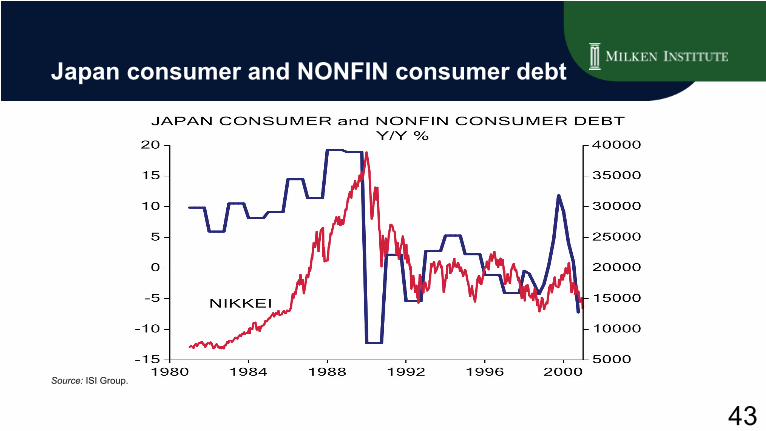
43
Japan consumer and NONFIN consumer debt
Source:
ISI Group.
44
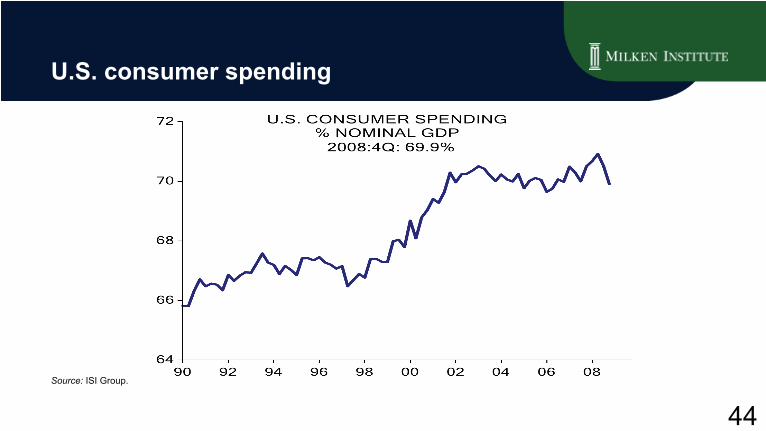
U.S. consumer spending
Source:
ISI Group.

45
U.S. saving rate
Source:
ISI Group.

46
U.S. saving rate
Source:
ISI Group.
U.S. SAVING RATEActual 2009:1Q 4.3%Forecast 2009:3Q 9.4%
-2
0
2
4
6
8
10
12
14
1965 1970 1975 1980 1985 1990 1995 2000 2005
47
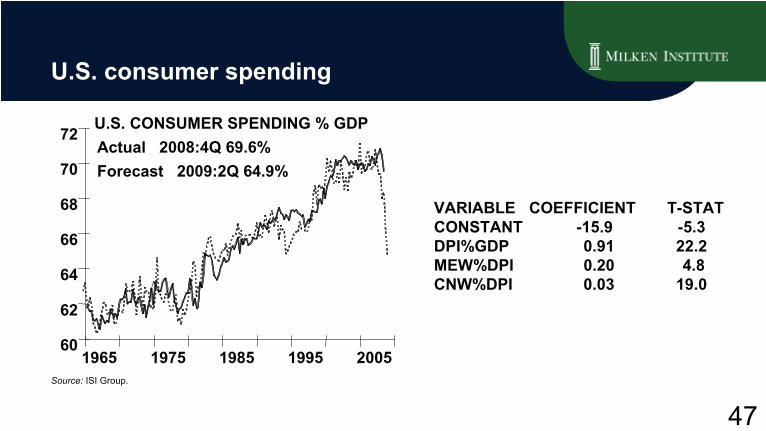
U.S. consumer spending
VARIABLE COEFFICIENT T-STAT CONSTANT
-15.9 -5.3 DPI%GDP
0.91 22.2 MEW%DPI
0.20 4.8 CNW%DPI
0.03 19.0
U.S. Consumer Spending % GDPActual 2008: 4Q 69.6%
Forecast 2009: 2Q 64.9%
Source:
ISI Group.
U.S. CONSUMER SPENDING % GDPActual 2008:4Q 69.6%Forecast 2009:2Q 64.9%
60
62
64
66
68
70
72
1965 1975 1985 1995 2005
48
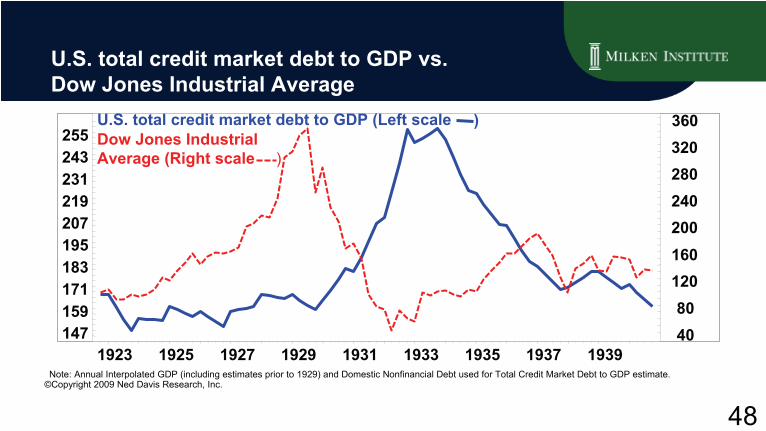
U.S. total credit market debt to GDP vs. Dow Jones Industrial Average
147 159 171 183 195 207 219 231 243 255
Note: Annual Interpolated GDP (including estimates prior to 1929) and Domestic Nonfinancial Debt used for Total Credit Market Debt to GDP estimate.
4080
120 160 200 240 280 320 360 ) U.S. total credit market debt to GDP (Left scale
Dow Jones Industrial Average (Right scale )
1923 1925 1927 1929 1931 1933 1935 1937 1939©Copyright 2009 Ned Davis Research, Inc.
49
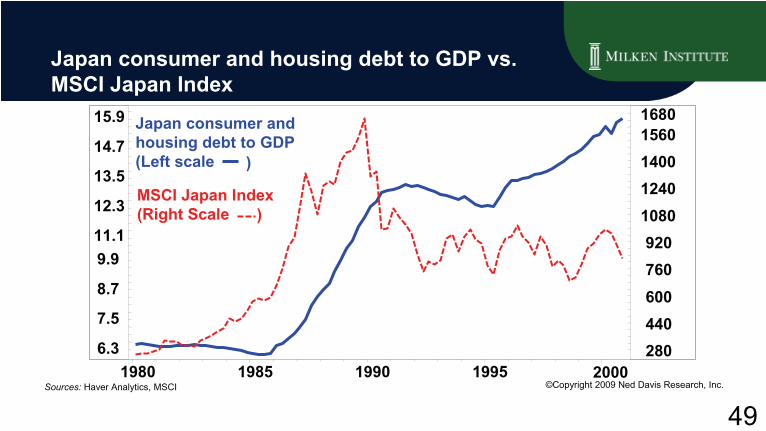
Japan consumer and housing debt to GDP vs. MSCI Japan Index
6.3
7.5
8.7
9.9 11.1
12.3
13.5
14.7
15.9
280 440 600 760 920
10801240140015601680Japan consumer and
housing debt to GDP (Left scale )
MSCI Japan Index (Right Scale )
1980 1985 1990 1995 2000©Copyright 2009 Ned Davis Research, Inc. Sources:
Haver
Analytics, MSCI

50
Private domestic non-financial debt to GDP vs. Dow Jones Industrial Average
132
140
148
156
164
172
180
188
25003500450055006500750085009500
10500 11500 12500 13500 Private domestic non-financial debt to GDP (Left Scale )
Dow Jones Industrial Average (Right scale )
1990 1992 1994 1996 1998 2000 2002 2004 2006 2008©Copyright 2009 Ned Davis Research, Inc.

51
13500
U.S. total credit market debt to GDP vs. Dow Jones Industrial Average
228 240 252 264 276 288 300 312 324 336 348 360
25003500450055006500750085009500
10500 11500 12500
U.S. total credit market debt to GDP (Left scale ) Dow Jones Industrial Average (Right scale )
1990 1992 1994 1996 1998 2000 2002 2004 2006 2008©Copyright 2009 Ned Davis Research, Inc.

52
Japan government debt to GDP vs. MSCI Japan Index
MSCI Japan Index (Right scale
3440465258647076828894
100
280 400 520 640 760 880
100011201240136014801600Japan government debt to GDP
(Left scale )
)
1980 1985 1990 1995 2000©Copyright 2009 Ned Davis Research, Inc. Sources:
Haver
Analytics, MSCI

53
What We’ve Learned from the Credit Crisis
Gary ShillingPresident
A. Gary Shilling & Co.

54
NASDAQ Index
Source: Yahoo Finance.
Jan-80 Dec-83 Nov-87 Nov-91 Oct-95 Oct-99 Oct-03 Oct-070500
1,0001,5002,0002,5003,0003,5004,0004,5005,0005,500
05,001,0001,5002,0002,5003,0003,5004,0004,5005,0005,500
Last Point 04/16/09: 1670

55
Real Quality-Adjusted home prices
Source:
Robert Shiller.
1890 1910 1930 1950 1970 199060
80
100
120
140
160
180
200
220
60
80
100
120
140
160
180
200
220
Avg: 1946 -1998=111
Last point 4Q 08: 137

56
ABX BBB-
Index
07-1
Source:
Markit
Ltd./UBS.
Jan-07 Jun-07 Nov-07 Apr-08 Aug-08 Jan-090102030405060708090
100
0102030405060708090100
Last point 04/16/09: 2.35
57
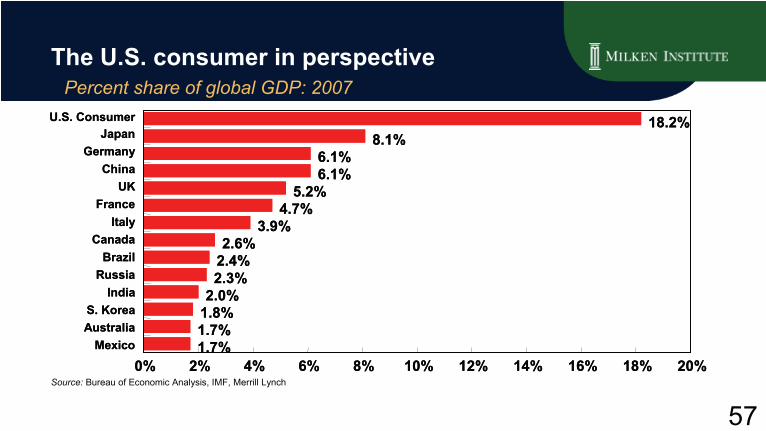
The U.S. consumer in perspective
Percent share of global GDP: 2007
Source:
Bureau of Economic Analysis, IMF, Merrill Lynch
U.S. ConsumerJapan
GermanyChina
UKFrance
ItalyCanada
BrazilRussia
IndiaS. KoreaAustralia
Mexico
18.2%8.1%
6.1%6.1%
5.2%4.7%
3.9%2.6%
2.4%2.3%
2.0%1.8%1.7%1.7%
0% 2% 4% 6% 8% 10% 12% 14% 16% 18% 20%
U.S. ConsumerJapan
GermanyChina
UKFrance
ItalyCanada
BrazilRussia
IndiaS. KoreaAustralia
Mexico
18.2%8.1%
6.1%6.1%
5.2%4.7%
3.9%2.6%
2.4%2.3%
2.0%1.8%1.7%1.7%
0% 2% 4% 6% 8% 10% 12% 14% 16% 18% 20%
58
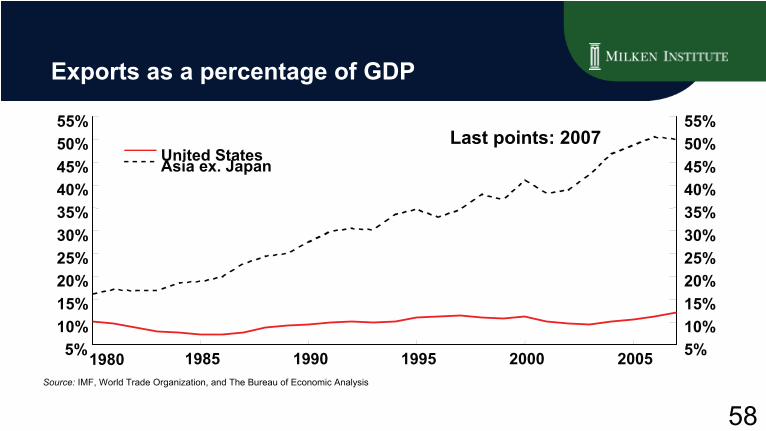
Exports as a percentage of GDP
Source:
IMF, World Trade Organization, and The Bureau of Economic Analysis
1980 1985 1990 1995 2000 2005
Last points: 2007
5%10%15%20%25%30%35%40%45%50%55%
5%10%15%20%25%30%35%40%45%50%55%
United StatesAsia ex. Japan
59
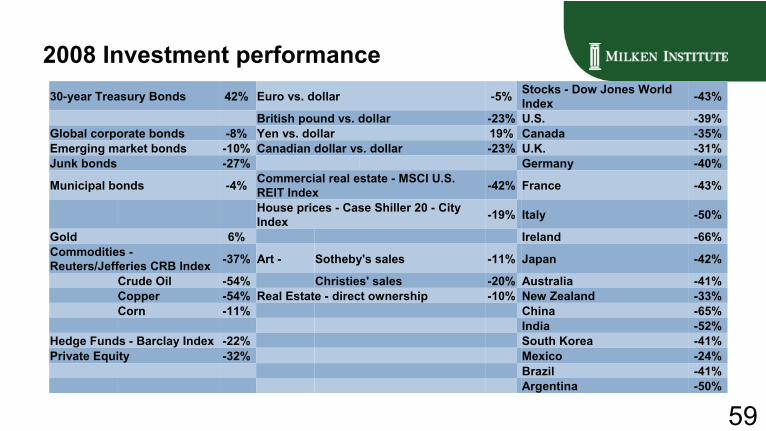
30-year Treasury Bonds 42% Euro vs. dollar -5% Stocks -
Dow Jones World Index -43%
British pound vs. dollar -23% U.S. -39%Global corporate bonds -8% Yen vs. dollar 19% Canada -35%Emerging market bonds -10% Canadian dollar vs. dollar -23% U.K. -31%Junk bonds -27% Germany -40%
Municipal bonds -4% Commercial real estate -
MSCI U.S. REIT Index -42% France -43%
House prices -
Case Shiller
20 -
City Index -19% Italy -50%
Gold 6% Ireland -66%Commodities -
Reuters/Jefferies CRB Index -37% Art - Sotheby's sales -11% Japan -42%
Crude Oil -54% Christies' sales -20% Australia -41%Copper -54% Real Estate -
direct ownership -10% New Zealand -33%Corn -11% China -65%
India -52%Hedge Funds -
Barclay Index -22% South Korea -41%Private Equity -32% Mexico -24%
Brazil -41%Argentina -50%
2008 Investment performance
60
1953 1957 1961 1965 1969 1973 1977 1981 1985 1989 1993 1997 2001 20050%
20%
40%
60%
80%
100%
120%
140%
0%
20%
40%
60%
80%
100%
120%
140%
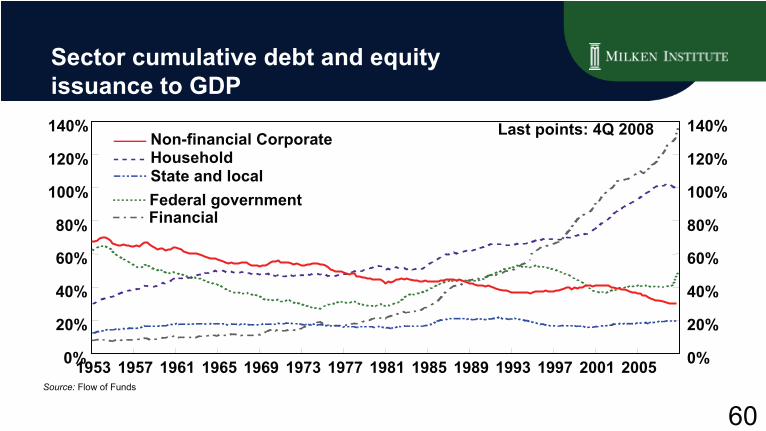
Sector cumulative debt and equity issuance to GDP
Source:
Flow of Funds
Non-financial CorporateHouseholdState and localFederal governmentFinancial
Last points: 4Q 2008
61
1983 1988 1993 1998 2003 200820%25%30%35%40%45%50%55%60%65%70%
20%25%30%35%40%45%50%55%60%65%70%
Total
Mortgage Only
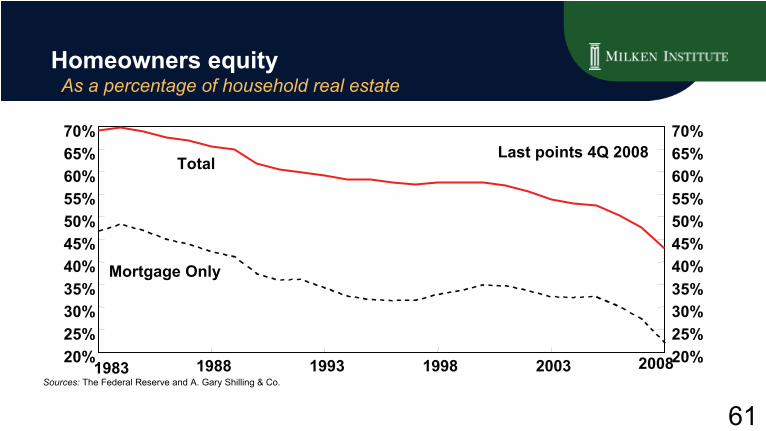
Homeowners equity
As a percentage of household real estate
Last points 4Q 2008
Sources:
The Federal Reserve and A. Gary Shilling & Co.
62
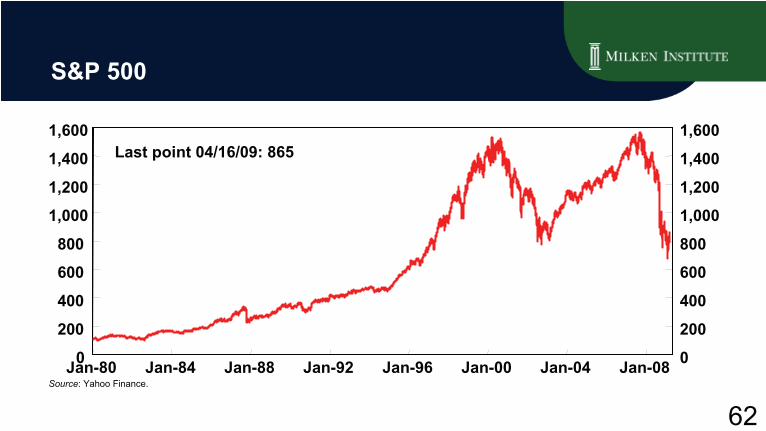
S&P 500
Source: Yahoo Finance.Jan-80 Jan-84 Jan-88 Jan-92 Jan-96 Jan-00 Jan-04 Jan-080
200
400
600
800
1,000
1,200
1,400
1,600
0
200
400
600
800
1,000
1,200
1,400
1,600Last point 04/16/09: 865

63
Jan-59 May-67 Sep-75 Jan-84 May-92 Sep-00 Jan-09-4-202468
10121416
-4-20246810121416
U.S. personal saving rate
Seasonally adjusted annual rate
Last Point Feb. 09: 4.2%
Source:
Bureau of Economic Analysis.

64
1959 1964 1969 1974 1979 1984 1989 1994 1999 200460%
62%
64%
66%
68%
70%
72%
60%
62%
64%
66%
68%
70%
72%
Consumer spending
As a percentage of GDP
Last Point 4Q 08: 69.6%
Source:
Bureau of Economic Analysis.
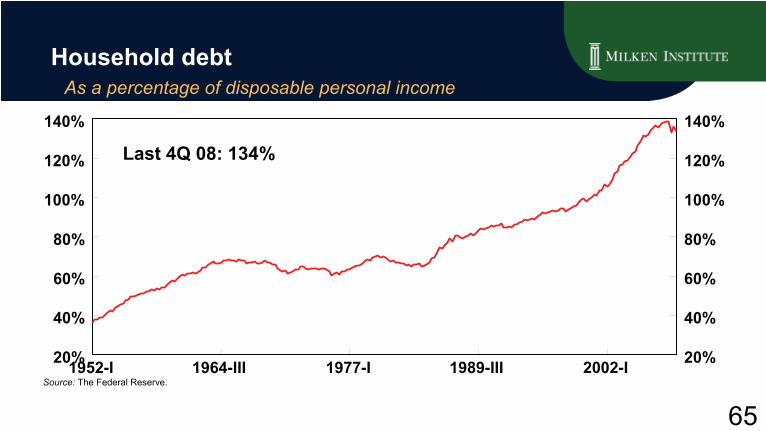
65
1952-I 1964-III 1977-I 1989-III 2002-I20%
40%
60%
80%
100%
120%
140%
20%
40%
60%
80%
100%
120%
140%
Household debt As a percentage of disposable personal income
Last 4Q 08: 134%
Source:
The Federal Reserve.