what subway ridership reveals about life and standard of living in boston and shanghai in 2010 -...
TRANSCRIPT

What Subway Ridership Reveals About Life and Standard Of
Living In Boston and Shanghaiin 2010 - 2014
Paul Mikulskis
Introduction
We will look at the transportation statistics or the subway in Shanghai and in Boston and see what it can reveal about the lifestyle and the living standards about the two cities.

Percentage of Subway Riders, Beiijing
Subway ridership Beiijing Subway ridership in boston
17%
Percentage of Subway riders, Boston
48%
Percentage of Subway Riders, Shanghai
What can this tell us about the two cities?

Reasons why subway ridership might be much higher in Shanghai:
• Not as abundant population that can afford cars
• Bigger traffic jams, more inefficient to drive
• Differences in the quality of transit system, some may ride the bus more
http://johnrieber.com/2013/07/24/chinas-mob-alert-worlds-most-crowded-subways-ever/
1.) Difference in Size
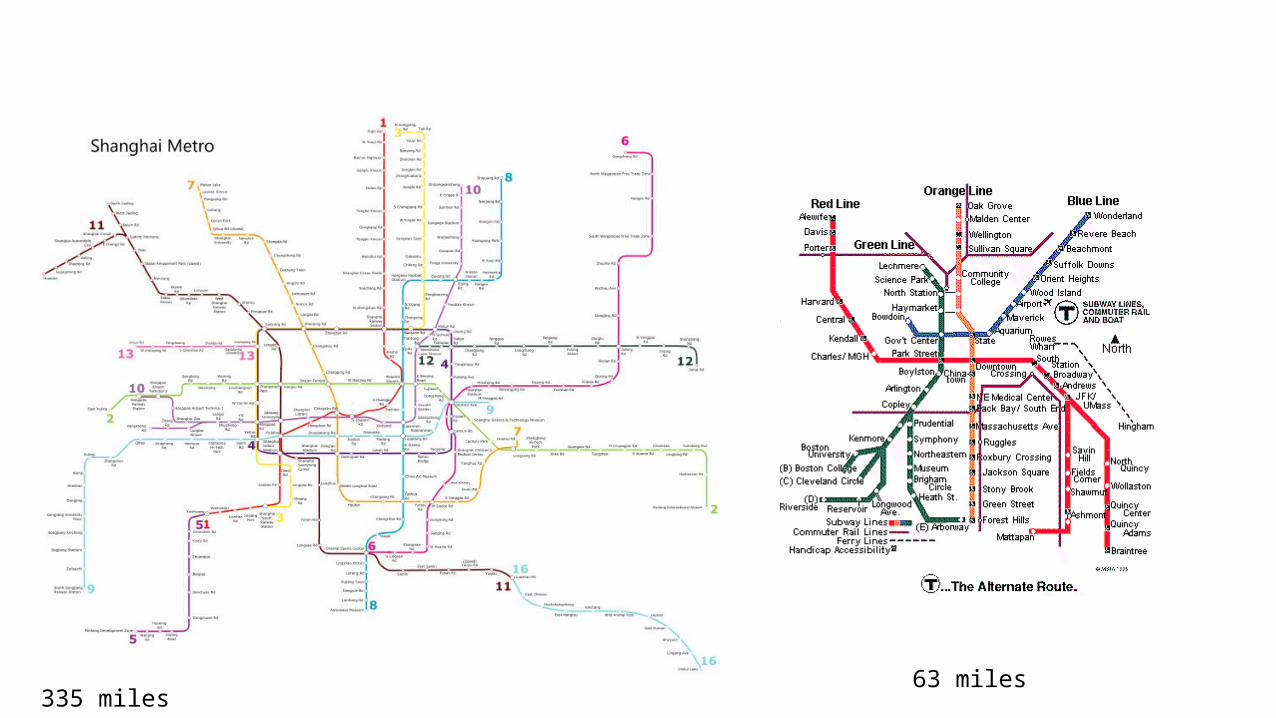
335 miles63 miles

2.) Costs
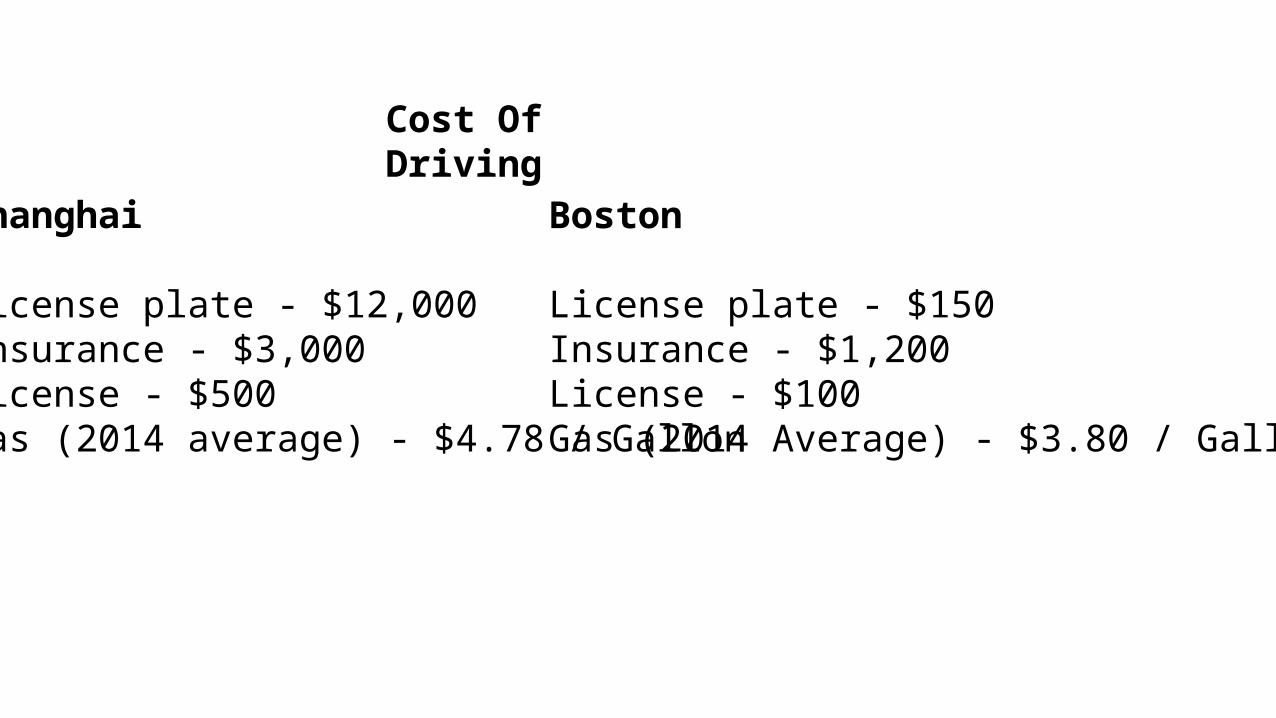
Cost Of Driving
Shanghai
License plate - $12,000Insurance - $3,000License - $500Gas (2014 average) - $4.78 / Gallon
Boston
License plate - $150Insurance - $1,200License - $100Gas (2014 Average) - $3.80 / Gallon

So How much does it cost per mile to drive?
Shanghai
License plate - $12,000Gas - $(4.78) x (200,000)Drivers License $500 x(2)Insurance - $(10.8) x (3,000)
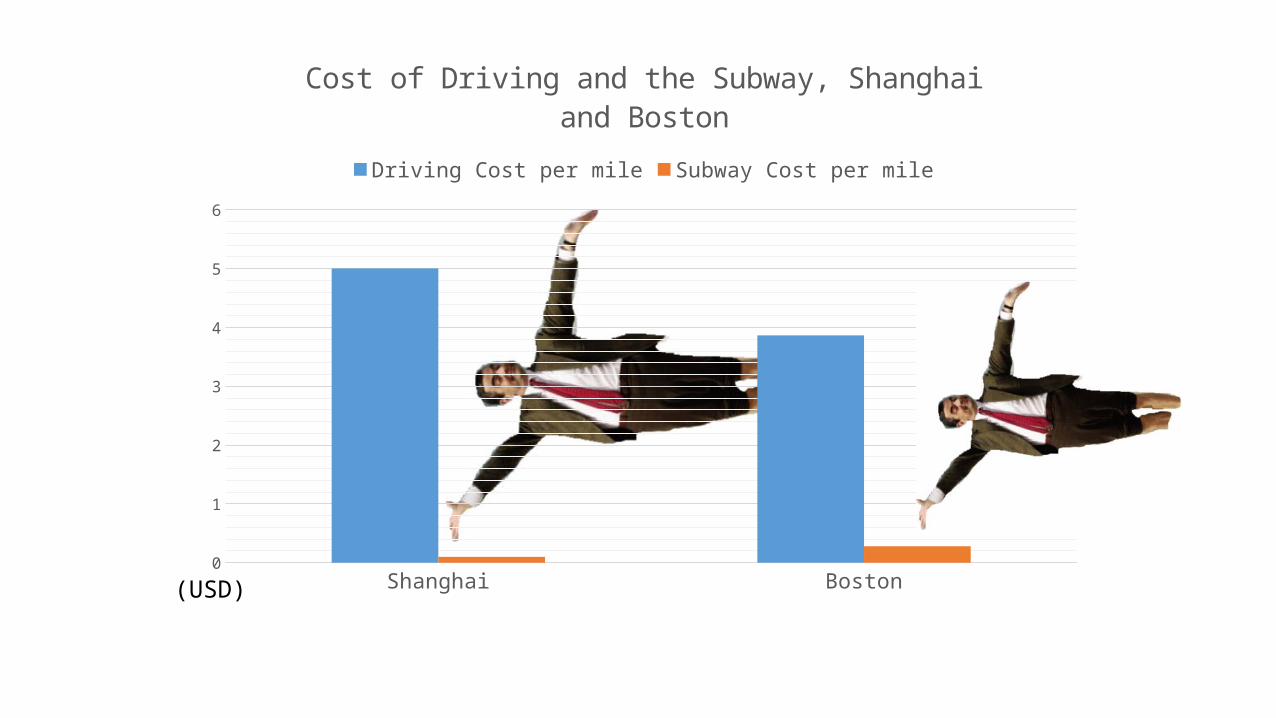
Total = $5.007 per mile
Facts• Average car lifetime: 10.8 years• Average Mileage for 10.8 years is 200,000 Miles• Both cities need license renewal two times over that 10.8 year period
Boston
License plate - $150Gas - $(3.80) x (200,000)Drivers License $100 x (2)Insurance - $(10.8) x (1,200)
Total = $3.86655 per mile

Cost Of Subway
Shanghai
For a trip that is up to 3.7 miles = 3 yuan ($0.45)For a trip up to 6.8 miles = 4 yuan ($0.65)
Average cost per mile = $0.10
Boston
Any trip = $2.50Average MBTA subway length = 8.9 miles
Average cost per mile = $0.28

Shanghai Boston0
1
2
3
4
5
6
Cost of Driving and the Subway, Shanghai and Boston
Driving Cost per mile Subway Cost per mile
(USD)

Our Measurement Unit
Shanghai Boston0
1
2
3
4
5
6
Cost of Driving and the Subway, Shanghai and Boston
Driving Cost per mile Subway Cost per mile
(USD)

This much difference

Shanghai Boston
1450
7
3203
4
GDP Per Capita (2012)
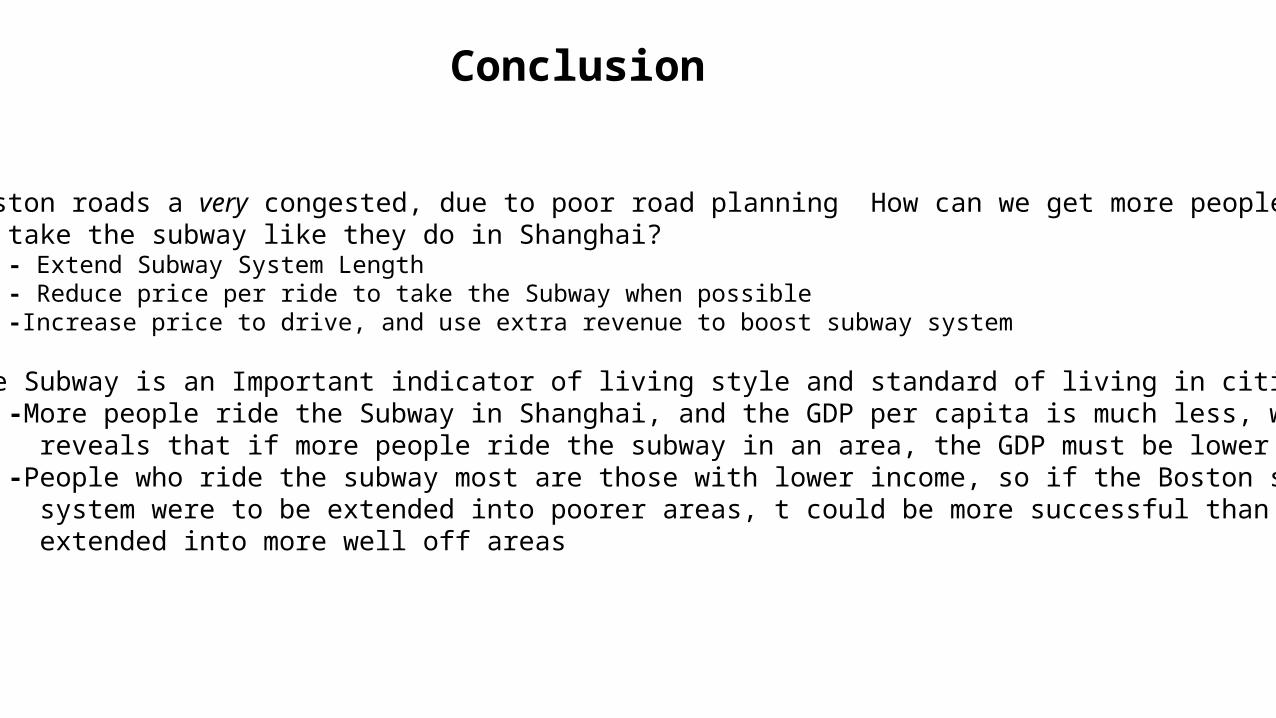
Conclusion
Boston roads a very congested, due to poor road planning How can we get more peopleTo take the subway like they do in Shanghai?
- Extend Subway System Length- Reduce price per ride to take the Subway when possible-Increase price to drive, and use extra revenue to boost subway system
The Subway is an Important indicator of living style and standard of living in cities.-More people ride the Subway in Shanghai, and the GDP per capita is much less, which reveals that if more people ride the subway in an area, the GDP must be lower-People who ride the subway most are those with lower income, so if the Boston subway system were to be extended into poorer areas, t could be more successful than if it were extended into more well off areas

Retrived from http://www.subwaydcw.com/subway-logo.jpeg
Shanghai Metro. (2014, September 27). Retrieved September 29, 2014.Retrieved from http://en.wikipedia.org/wiki/Shanghai_Metro
List of Massachusetts locations by per capita income. (2014, September 27). Retrieved September 29, 2014.Retrieved from http://en.wikipedia.org/wiki/List_of_Massachusetts_locations_by_per_capita_income
List of Chinese administrative divisions by GDP per capita. (2014, September 22). Retrieved September 29, 2014.Retrieved from http://en.wikipedia.org/wiki/List_of_Chinese_administrative_divisions_by_GDP_per_capita
China's Mob VIDEO! World's Most Crowded Subways EVER! (n.d.). Retrieved September 29, 2014.Retrieved from http://johnrieber.com/2013/07/24/chinas-mob-alert-worlds-most-crowded-subways-ever/
Massachusetts Bay Transportation Authority. (2014, September 29). Retrieved September 29, 2014. retrieved from http://en.wikipedia.org/wiki/Massachusetts_Bay_Transportation_Authority
MBTA Report 2010. (n.d.). Retrieved September 29, 2014 retrieved from http://www.mbta.com/uploadedfiles/documents/2014%20BLUEBOOK%2014th%20Edition.pdf.
Works Cited
Retrieved from http://i.dailymail.co.uk/i/pix/2014/05/28/article-2641834-000C5C1C000004B0-909_634x484.jpg