what is the optimal panel size in primary care? a
TRANSCRIPT

4
August 2019
Prepared for: Department of Veterans Affairs Veterans Health Administration Health Services Research & Development Service Washington, DC 20420
Prepared by: Evidence Synthesis Program (ESP) Center West Los Angeles VA Medical Center Los Angeles, CA Paul G. Shekelle, MD, PhD, Director
What is the Optimal Panel Size in Primary Care? A Systematic Review
Authors: Principal Investigator:
Paul G. Shekelle, MD, PhD
Co-Investigators: Neil M. Paige, MD, MSHS Eric A. Apaydin, PhD, MPP, MS Jeremy D. Goldhaber-Fiebert, PhD
Research Associates: Selene S. Mak, PhD, MPH Isomi M. Miake-Lye, PhD Meron M. Begashaw, MPH Jessica M. Beroes-Severin, BS
Evidence Synthesis Program
4

Panel Size Evidence Synthesis Program
i
PREFACE
The VA Evidence Synthesis Program (ESP) was established in 2007 to provide timely and accurate syntheses of targeted healthcare topics of importance to clinicians, managers, and policymakers as they work to improve the health and healthcare of Veterans. These reports help:
· Develop clinical policies informed by evidence; · Implement effective services to improve patient outcomes and to support VA clinical practice
guidelines and performance measures; and · Set the direction for future research to address gaps in clinical knowledge.
The program is comprised of 4 ESP Centers across the US and a Coordinating Center located in Portland, Oregon. Center Directors are VA clinicians and recognized leaders in the field of evidence synthesis with close ties to the AHRQ Evidence-based Practice Center Program and Cochrane Collaboration. The Coordinating Center was created to manage program operations, ensure methodological consistency and quality of products, and interface with stakeholders. To ensure responsiveness to the needs of decision-makers, the program is governed by a Steering Committee comprised of health system leadership and researchers. The program solicits nominations for review topics several times a year via the program website.
Comments on this evidence report are welcome and can be sent to Nicole Floyd, Deputy Director, ESP Coordinating Center at [email protected].
Recommended citation: Shekelle PG, Paige NM, Apaydin EA, Goldhaber-Fiebert JD, Mak SS, Miake-Lye IM, Begashaw MM, Beroes-Severin JM, What is the Optimal Panel Size in Primary Care?: A Systematic Review. Washington, DC: Evidence Synthesis Program, Health Services Research and Development Service, Office of Research and Development, Department of Veterans Affairs. VA ESP Project: #05-226; 2019. Available at: https://www.hsrd.research.va.gov/publications/esp/reports.cfm.
This report is based on research conducted by the Evidence Synthesis Program (ESP) Center located at the Los Angeles VA Medical Center, Los Angeles, CA, funded by the Department of Veterans Affairs, Veterans Health Administration, Health Services Research and Development. The findings and conclusions in this document are those of the author(s) who are responsible for its contents; the findings and conclusions do not necessarily represent the views of the Department of Veterans Affairs or the United States government. Therefore, no statement in this article should be construed as an official position of the Department of Veterans Affairs. No investigators have any affiliations or financial involvement (eg, employment, consultancies, honoraria, stock ownership or options, expert testimony, grants or patents received or pending, or royalties) that conflict with material presented in the report.

Panel Size Evidence Synthesis Program
ii
ACKNOWLEDGMENTS
This topic was developed in response to a nomination by Karin Nelson, Director of the Office of Primary Care's Analytics Team (PCAT) and Primary Care Physician, for the purpose of supporting policy decisions in the Office of Primary Care regarding panel sizes for primary care providers. The scope was further developed with input from the topic nominators (ie, Operational Partners), the ESP Coordinating Center, the review team, and the technical expert panel (TEP).
In designing the study questions and methodology at the outset of this report, the ESP consulted several technical and content experts. Broad expertise and perspectives were sought. Divergent and conflicting opinions are common and perceived as healthy scientific discourse that results in a thoughtful, relevant systematic review. Therefore, in the end, study questions, design, methodologic approaches, and/or conclusions do not necessarily represent the views of individual technical and content experts.
The authors gratefully acknowledge Roberta Shanman, MLS and the following individuals for their contributions to this project:
Operational Partners
Operational partners are system-level stakeholders who have requested the report to inform decision-making. They recommend Technical Expert Panel (TEP) participants; assure VA relevance; help develop and approve final project scope and timeframe for completion; provide feedback on draft report; and provide consultation on strategies for dissemination of the report to field and relevant groups.
Karin Nelson, MD, MSHS Director of the Office of Primary Care's Analytics Team, Primary Care Physician VA Puget Sound Health Care System Technical Expert Panel (TEP)
To ensure robust, scientifically relevant work, the TEP guides topic refinement; provides input on key questions and eligibility criteria, advising on substantive issues or possibly overlooked areas of research; assures VA relevance; and provides feedback on work in progress. TEP members are listed below:
Steve Pizer, PhD Partnered Evidence-Based Policy Resource Center VA Boston Healthcare System Research & Development Kevin Dorrance, MD, FACP Docsnap, TransformCare, Inc., Uniformed Services University of the Health Sciences Lisa V. Rubenstein, MD, MSPH, FACP Professor of Medicine and Public Health VA Greater Los Angeles and UCLA

Panel Size Evidence Synthesis Program
iii
Director, VA HSRD Center for Implementation Practice and Research Support Senior Scientist, RAND Todd Wagner, PhD Director, Health Economics Resource Center Associate Director, Center for Innovation to Implementation VA Palo Alto Health Care System Associate Professor, Department of Surgery, Stanford University School of Medicine Peer Reviewers
The Coordinating Center sought input from external peer reviewers to review the draft report and provide feedback on the objectives, scope, methods used, perception of bias, and omitted evidence. Peer reviewers must disclose any relevant financial or non-financial conflicts of interest. Because of their unique clinical or content expertise, individuals with potential conflicts may be retained. The Coordinating Center and the ESP Center work to balance, manage, or mitigate any potential nonfinancial conflicts of interest identified.

Panel Size Evidence Synthesis Program
iv
TABLE OF CONTENTS
ACKNOWLEDGMENTS ........................................................................................................... II EXECUTIVE SUMMARY .......................................................................................................... 1
Introduction ................................................................................................................................. 1 Methods ...................................................................................................................................... 1
Data Sources and Searches ..................................................................................................... 2 Study Selection ....................................................................................................................... 2 Data Abstraction and Quality Assessment .............................................................................. 2 Data Synthesis and Analysis ................................................................................................... 2
Results ......................................................................................................................................... 2 Results of Literature Search .................................................................................................... 2 Summary of Results for Key Questions .................................................................................. 2
Discussion ................................................................................................................................... 4 Key Findings and Strength of Evidence ................................................................................. 4
Certainty of Evidence for the Effect of Panel Size on Aims of Healthcare ................................ 4 Certainty of Evidence for Risk-adjustment ................................................................................ 5
Applicability ........................................................................................................................... 5 Research Gaps/Future Research.............................................................................................. 5 Conclusions ............................................................................................................................. 6
Abbreviations Table .................................................................................................................... 6 EVIDENCE REPORT .................................................................................................................. 7 INTRODUCTION......................................................................................................................... 7
Determining the Right Size Panel ............................................................................................... 7 METHODS .................................................................................................................................... 9
Topic Development ..................................................................................................................... 9 General Considerations ............................................................................................................... 9 Search Strategy ........................................................................................................................... 9 Study Selection ......................................................................................................................... 10 Data Abstraction ....................................................................................................................... 10 Quality Assessment ................................................................................................................... 10 Data Synthesis ........................................................................................................................... 10 Rating the Body of Evidence .................................................................................................... 10 Peer Review .............................................................................................................................. 11
RESULTS .................................................................................................................................... 12
Literature Flow ......................................................................................................................... 12 Figure 1: Literature Flow Chart ................................................................................................ 12 Key Question 1A: How should panel size be determined for a primary care provider? .......... 13 Key Question 1B: What is the optimal size of a patient panel in primary care? ...................... 13
Hypothesis-testing Studies of Panel Size .............................................................................. 13 Certainty of Evidence ............................................................................................................... 17
Modeling Studies to Determine Panel Size........................................................................... 19 Toolkits ................................................................................................................................. 24

Panel Size Evidence Synthesis Program
v
Key Question 1C: Is there evidence to suggest that MDs, NPs, and PAs should have different panel sizes? ............................................................................................................................... 24 Key Question 1D: Is there evidence from large health systems in terms of setting and maintaining panel sizes? ........................................................................................................... 24 Key Question 2: Should primary care panel sizes be risk-adjusted for patient complexity? If yes, how should risk adjustment be accomplished? ................................................................. 24 Certainty of Evidence for Risk-adjustment .............................................................................. 25
SUMMARY AND DISCUSSION .............................................................................................. 26
Summary of Evidence by Key Question ................................................................................... 27 Key Question 1A: How should panel size be determined for a primary care provider? ...... 27 Key Question 1B: What is the optimal size of a patient panel in primary care? .................. 27 Key Question 1C: Is there evidence to suggest that MD, NP and PAs should have different panel sizes? ........................................................................................................................... 28 Key Question 1D: Is there evidence from large health systems in terms of setting and maintaining panel sizes? ....................................................................................................... 28 Key Question 2: Should primary care panel sizes be risk-adjusted for patient complexity? If yes, how should risk adjustment be accomplished? .............................................................. 28
Limitations ................................................................................................................................ 28 Applicability of Findings to the VA Population ................................................................... 29
Research Gaps/Future Research ............................................................................................... 29 Conclusions ............................................................................................................................... 30
REFERENCES ............................................................................................................................ 31 APPENDIX A. SEARCH STRATEGIES ................................................................................. 34 APPENDIX B. PEER REVIEW COMMENTS/AUTHOR RESPONSES ............................ 37 APPENDIX C. CITATIONS FOR EXCLUDED STUDIES................................................... 40 APPENDIX D. EVIDENCE TABLE ........................................................................................ 43 APPENDIX E. MODELING STUDIES EVIDENCE TABLE ............................................... 51
Panel Size Evidence Synthesis Program
1
EXECUTIVE SUMMARY
INTRODUCTION In 2009, the Veterans Health Administration Handbook 1101.02 established a baseline panel size of 1,200 patients for a full-time physician in a Patient Aligned Care Team (PACT). This number could be adjusted up or down based on availability of support staff, the number of examination rooms, and patient complexity. After adjustment for these factors, panels ranged from 1,000 to 1,400. Veterans Health Administration (VHA) Directive 1406 reaffirmed both the baseline panel numbers and adjustment parameters.
Determining the right or optimal panel size for a full-time physician and team is a complex undertaking, balancing the demands of the system (patient access to care, clinical effectiveness or quality, patient experience, and cost) with the needs of the provider team (physician/team satisfaction, adequate time for care, and avoidance of physician/team burnout).
The standard method for determining panel size has been a function of multiplying a provider’s available slots each day by the number of days in clinic divided by the average number of visits each patient will make each year. But this method does not account for the tasks that occur outside of traditional face-to-face clinical visit, including patient communication (letter writing, telephone calls, emails, and form completion), test follow-up, panel management activities, and care coordination.
To help inform an expert panel that will consider issues about determining VA primary care panel size, we were asked to conduct a systematic review of the literature.
METHODS This topic was developed in response to a nomination by Karin Nelson, Director of the Office of Primary Care's Analytics Team (PCAT) and Primary Care Physician. Key questions were then developed with input from the topic nominator, the ESP Coordinating Center, the review team, and the technical expert panel (TEP).
The Key Questions were:
KQ1A. How should panel size be determined for a primary care provider?
KQ1B. What is the optimal size of a patient panel in primary care?
KQ1C. Is there evidence to suggest that MDs, NPs, and PAs should have different panel sizes?
KQ1D. Is there evidence from large health systems in terms of setting and maintaining panel sizes?
KQ2. Should primary care panel sizes be risk-adjusted for patient complexity? If yes, how should risk adjustment be accomplished?

Panel Size Evidence Synthesis Program
2
Data Sources and Searches
We conducted searches in PubMed from inception to 03/08/2019, Web of Science from inception to 03/10/2019, and Scopus and Embase from inception to 03/08/2019. We also searched the gray literature using Google.
Study Selection
There was no restriction on study design, but publications must have presented research with original data that tested a hypothesis (eg, the association between panel size and an outcome of interest) or with the description of a model to calculate panel size, or be a toolkit to help determine panel size.
Data Abstraction and Quality Assessment
We abstracted data on the following: practitioner type, study design, sample size (number of practices), panel size range, other factors, and outcomes of interest. We considered outcomes of interest to be the 6 Institute of Medicine (IOM) aims for health care improvement (safe, effective, patient-centered, timely, efficient, equitable) and added to this the aim of reducing provider burnout.
Data Synthesis and Analysis
We did not use quality assessment per se, because all but 1 of the included hypothesis-testing studies were observational and cross-sectional in design, which have limited ability to support causal inferences and are therefore considered to be low-quality evidence. The remaining studies are modeling studies, for which there is no generally accepted tool for assessing quality. However, we narratively discuss the strengths and limitations of the models in addition to their findings. The observational studies were too clinically heterogeneous to support meta-analysis; hence our synthesis is narrative. We used criteria similar to those proposed by the Grading of Recommendations Assessment, Development and Evaluation (GRADE) working group to assess the certainty of evidence.
RESULTS Results of Literature Search
We identified 448 potentially relevant citations, and 14 additional articles from reference-mining the included studies, for a total of 462 articles whose titles were screened. A total of 30 publications were identified at full-text review as meeting initial inclusion criteria. This included 16 hypothesis-testing studies that assessed the association of panel size with an outcome of interest, 11 studies of models, and 3 toolkits.
Summary of Results for Key Questions
Key Question 1A: How should panel size be determined for a primary care provider?
“How should…” is a question for policymakers that requires value judgments that balance multiple factors, and as such is not something that can be answered by an evidence review. In the remaining sections we describe the evidence policymakers can use when making judgments about how should panel size be determined.

Panel Size Evidence Synthesis Program
3
Key Question 1B: What is the optimal size of a patient panel in primary care?
Questions about optimization require that an outcome be chosen to be optimized. Since the important outcome may differ among stakeholders, we included in this section the evidence of the association of panel size with the 6 IOM aims of health care, plus the aim of reducing provider burnout.
There is a modest literature of observational studies, all but 1 being cross-sectional, that assess the relationship between panel size and outcomes of interest. The greatest number of studies assess the IOM aim of timely care, either as access or continuity. In general, these studies found variable access results, some reporting better access, others reporting worse access. Continuity seems to be little affected. There were fewer studies assessing the association between panel size and clinical quality and between panel size and patient experience (3 studies each). In general, these studies showed negative statistically significant relationships of modest size, or no statistically significant relationship, between increasing panel size and various measures of clinical quality and patient experience. One study reported 1 clinical quality measure that had better performance associated with increased panel size. No study assessed the relationship between panel size and cost. One study found a cross-sectional relationship between increased panel size and physician burnout. We did not identify any studies assessing the association of panel size and patient safety or equity.
We identified 4 groups of studies that built and assessed models for determining panel size. The modeling studies have varied in how they used or estimated important variables, such as predictors of patient demand, the source of the estimates for those predictors of demand, whether the demand is stochastic or not, and the optimization technique used. All models are optimizing some measure of access or continuity, and have either explicitly or implicitly assumed that other aims for health care improvement, such as clinical quality or patient experience, are equivalent with changes in panel size. A consistent finding from the modeling studies is that the optimal panel size for measures of access changes when patient factors are considered.
Key Question 1C: Is there evidence to suggest that MDs, NPs, and PAs should have different panel sizes?
We found no empirical evidence to inform this question in the published or gray literature. Key Question 1D: Is there evidence from large health systems in terms of setting and maintaining panel sizes?
We identified no evidence per se on this topic. We identified only 2 US-based studies and 1 study from the English National Health Service, but none of these discussed how panel sizes are set or maintained.
Key Question 2: Should primary care panel sizes be risk-adjusted for patient complexity? If yes, how should risk adjustment be accomplished?
A consistent finding of the modeling studies is that the optimal panel size for measures of access is sensitive to risk adjustment for patient complexity. Which method of adjustment – which has varied from a simple method that includes age, gender, and insurance status to a complex method that includes many patient health status and prior utilization variables collected from the

Panel Size Evidence Synthesis Program
4
electronic health record – is “better” has not been tested in head-to-head comparisons, other than to conclude that even the simple method is an improvement over a method that considers just age and gender.
DISCUSSION Key Findings and Strength of Evidence
The evidence about the effect of panel size on the Institute of Medicine aims for health care improvement is surprisingly thin, given the importance of primary care panel size to all models of population-based care. The evidence consists of a handful of cross-sectional studies that assess associations of panel size with clinical quality, patient experience, access, and continuity, and show variable, no, or negative associations of increasing panel size on these outcomes of interest. By their design these studies cannot support conclusions about increasing panel size being the cause of any differences in outcomes. These studies at best act as a signal that there might be causal relationships between larger panel size and worse clinical quality and worse patient experience. The remainder of the evidence consists of a handful of studies that try and model what should be an optimal panel size, where “optimal” is defined exclusively by access. The modeling studies make the assumption that every additional patient added to a panel is going to be delivered with equal quality and patient-centeredness regardless of the number added. The cross-sectional studies we identified provide a signal that this assumption may not be correct. What does seem clear from the modeling studies is that simple models developed years ago, which basically take the number of visits made by existing patients and the number of appointment slots available to determine the panel size, can be improved. Not all patients require the same amount of time, and risk-adjusting methods tested vary from simple (age and gender) to complex (number of health care conditions, number of medications, and more). Furthermore, the resources available to the primary care provider influence how many patients can be cared for, as well as resources like the number of rooms available to see patients, the ability to delegate tasks to advanced practice providers, and the availability of clinical staff such as RN managers. Lastly, since the early models were developed there has been a plethora of new developments in health care that will influence how many patients can be cared for, such as the rise of non-face-to-face visits, telehealth, and the use of secure messaging, along with a much greater load of information the primary care provider needs to process, and be accountable for.
Certainty of Evidence for the Effect of Panel Size on Aims of Healthcare
Outcome Number of studies
Study limitations
Consistency Direction of effect Overall Certainty of Evidence
Safe 0 N/A N/A N/A Very Low Effective (Clinical quality)
3 Serious Mostly consistent
No association or negative association of modest size
Low
Patient centered
3 Serious Inconsistent No association or negative associations of modest size
Low
Timely (Access, including Continuity)
8 Serious Inconsistent Variable Low

Panel Size Evidence Synthesis Program
5
Efficient (including Cost)
0 N/A N/A N/A Very Low
Equitable 0 N/A N/A N/A Very Low Provider burnout
1 Serious N/A Increased physician burnout with panel sizes higher than 1,200
Very Low
Certainty of Evidence for Risk-adjustment
Outcome Number of studies
Study limitations
Consistency Direction of effect Overall Certainty of Evidence
Access 5 Not serious Consistent Better optimization when panel sizes are adjusted for case mix
Moderate
Access 2 Not serious Consistent Risk adjustment that includes clinical conditions is better than risk adjustment with just age and sex in optimizing access
Moderate
Applicability
Four of the studies identified were done in VA populations and therefore are directly relevant to VA. However, even these studies use VA data that are 5-10 years old. Primary care delivery in VA has been changing rapidly (for example, PACT), suggesting that the results of these VA studies may already be out of date.
Research Gaps/Future Research
A substantial amount of research is needed before declarations of what constitutes an “optimal” panel size in primary care can claim to be evidence-based. These needs include VA-based studies of associations – longitudinal if possible, cross-sectional if necessary – of differences in panel size and IOM aims other than access, plus provider burnout. Existing VA data in Strategic Analytics for Improvement and Learning (SAIL) and Patient Centered Management Module (PCMM) could be leveraged for this. Even better, causal evidence could come from experimental changes in panel size on clinical quality, access, patient experience, etcetera, and burnout. This would involve intentional changes in panel size – say an increase or decrease by 20% – being applied to existing primary care physician (PCP) panels, and then a comparison being made of outcomes to practitioners whose panel sizes remained unchanged. A third line of research could focus on risk adjustment. VA patients tend to be more complex than non-VA patients, but the variation in complexity has been less well-studied.
More fundamentally, evidence is needed about the appropriate visit frequency or follow-up time, and format (face-to-face, video or telephone, or secure messaging), for patients with chronic conditions. Most currently used visit frequencies or follow-up times (such as a visit frequency of twice a year for a patient with well-controlled diabetes and hypertension) are based on historical

Panel Size Evidence Synthesis Program
6
norms, are variable between physicians, and lack evidence that the particular frequency produces better outcomes than some other frequency. Thus, panel size calculations that take a provider’s current patients and uses their prior year’s number of visits in order to calculate what size panel the provider can care for simply perpetuate historical provider-specific variability in visit frequency. Having evidence that a particular frequency produces better outcomes will help break through this endogenous reasoning.
Conclusions
The evidence about the effect of panel size on the IOM aims for health care improvement is thin. The few studies available provide a signal that increasing panel size may have an association with modest worsening of clinical quality and patient experience. Several modeling studies exist, but all model only the effect of panel size on access to care, and assume that other IOM aims are constant with increasing panel size. Modeling studies support the policy that risk-adjustment and practice-level variables influence the optimal panel size for access. Current recommendations regarding primary care panel size are based more on historical experience than on evidence.
ABBREVIATIONS TABLE Computerized Patient Record System CPRS Evidence Synthesis Program ESP Grading of Recommendations Assessment, Development and Evaluation GRADE Hierarchical Conditions Categories HCC Institute of Medicine IOM Medical Group Management Association MGMA Patient Aligned Care Team PACT Patient Centered Management Module PCMM Primary Care Physician PCP Relative Value Unit RVU Strategic Analytics for Improvement and Learning SAIL 12-Item Short Form Health Survey SF-12 Survey of Healthcare Experiences of Patients SHEP Technical Expert Panel TEP Third Next Available Appointment TNAA Usual Provider Continuity Index UPC Veterans Health Administration VHA

Panel Size Evidence Synthesis Program
7
EVIDENCE REPORT
INTRODUCTION
In 2009, the Veterans Health Administration Handbook 1101.02 established a baseline panel size of 1,200 patients for a full-time physician in a Patient Aligned Care Team (PACT). This number could be adjusted up or down based on availability of support staff, the number of examination rooms, and patient complexity. After adjustment for these factors, panels ranged in size from 1,000 to 1,400 patients. Veterans Health Administration (VHA) Directive 1406 reaffirmed both the baseline panel numbers and adjustment parameters.1
The emergence of the 1,200-patient panel size was based on historical averages at the time, but appears to have its genesis in data collected in 2004 by Huang and colleagues, which noted an average full-time VA physician panel size of 1,265 patients.2 In contrast, in a 2003 study of US physicians, the non concierge-based average panel size was 2,300 patients.3
Determining the right or optimal panel size for a full-time physician and team is a complex undertaking, balancing the demands of the system (patient access to care, clinical effectiveness or quality, patient experience, and cost) with the needs of the provider team (physician/team satisfaction, adequate time for care, and avoidance of physician/team burnout).
The standard method for determining panel size has been a function of multiplying a provider’s available slots each day by the number of days in clinic divided by the average number of visits each patient will make each year. But this method does not account for the tasks that occur outside of traditional face-to-face clinical visit, including patient communication (letter writing, telephone calls, emails, and form completion), test follow-up, panel management activities, and care coordination.
The VA’s patient population tends to be older and sicker than the average patient panel in other systems. Veterans have a higher disease burden, including a higher prevalence of diabetes mellitus, obesity, hypertension, and depression. Patients with a higher disease burden and larger list of prescriptions will likely be higher utilizers, placing heavier higher demand on their care teams.
DETERMINING THE RIGHT SIZE PANEL The importance of the primary care physician (PCP) is well documented. Starfield and colleagues note “six mechanisms, alone and in combination, may account for the beneficial impact of primary care on population health. They are (1) greater access to needed services, (2) better quality of care, (3) a greater focus on prevention, (4) early management of health problems, (5) the cumulative effect of the main primary care delivery characteristics, and (6) the role of primary care in reducing unnecessary and potentially harmful specialist care.” At the heart of primary care is the primary care provider and panel of patients that he or she cares for (often with the help of a team).4
In order for this pairing to be successful, patients need access to their primary care provider, which manifests as a timely appointment – to be seen when they want to be seen. Having an

Panel Size Evidence Synthesis Program
8
open slot day-of is the gold standard, but many systems have also implemented secure messaging, e-visits, and telemedicine to improve access for patients.
More than any other provider group, primary care providers are highly evaluated on a number of quality of care measures. The Healthcare Effectiveness Data and Information Set performance measures and admission rates for ambulatory care sensitive conditions are either fully or partially attributed to PCPs. Some systems use these measures to calculate salary components. The effect of panel size on these performance metrics is one of the subjects of this review.
Ultimately, PCPs want to provide high-quality, comprehensive care to their panel of patients. The difficulty in determining the right size panel, to ensure that providers have the time to do all their tasks, is a problem that has yet to be solved. External factors like physician shortages contribute to the problem when systems suggest that panel sizes need to be increased to cover more patients in the face of inadequate numbers of PCPs. Such processes will undoubtedly contribute to burnout by not allowing providers sufficient time to perform all of their required tasks.
In the era of big data and the electronic health record it is possible to start the process of determining the right size panel by calculating the complexity and demand of the patient population that the provider is caring for. Current workload could be monitored in real time and adjustments could be made as to the closing or opening of a panel to new patients. Additional inputs into these determinations include access parameters like the third next available appointment, patient waiting times, perceived access, and patient satisfaction. Quality metrics could be monitored to provide feedback to providers and determine if providers have adequate time for population management. The final input could be continuous monitoring of provider satisfaction and emotional stress in to order to intervene early to prevent provider burnout. Preventing provider burnout has implications on recruitment and retention of the next generation of primary care providers.

Panel Size Evidence Synthesis Program
9
METHODS
TOPIC DEVELOPMENT This topic was developed in response to a nomination by Karin Nelson, Director for the Office of Primary Care Analytics and primary care physician. Key questions were then developed with input from the topic nominator, the ESP Coordinating Center, the review team, and the technical expert panel (TEP).
The Key Questions were:
KQ1A. How should panel size be determined for a primary care provider?
KQ1B. What is the optimal size of a patient panel in primary care?
KQ1C. Is there evidence to suggest that MDs, NPs, and PAs should have different panel sizes?
KQ1D. Is there evidence from large health systems in terms of setting and maintaining panel sizes?
KQ2. Should primary care panel sizes be risk-adjusted for patient complexity? If yes, how should risk adjustment be accomplished?
This review was not registered in PROSPERO because it is not about a health care intervention.
GENERAL CONSIDERATIONS For this topic, we expected that potentially relevant evidence might be found in the gray literature, and so added gray literature searches to our normal PubMed, Web of Science, Scopus, and Embase searches. We did not consider this the kind of topic for which the Cochrane database was particularly relevant so did not search it. We did not expect this evidence to consist of randomized trials and therefore had no study design inclusion or exclusion criteria, other than that it be a hypothesis-testing study or model to calculate panel size that was explicit about its methods and its findings. Key question requests like “what is the optimal size…” require that there be an outcome measure that is being optimized. However, the choice of outcome measure may be different for different stakeholders, and therefore we did not restrict ourselves to one measure (such as access to care). We used the Institute of Medicine (IOM) framework for quality health care as our source of potential measures that could be considered for optimization.5 The IOM framework has 6 aims: safe, effective (which we operationalized to include clinical quality), patient-centered (which included patient experience measures), timely (which we operationalized to include access and continuity), efficient (which we operationalized to include cost), and equitable. To these 6 aims we included the aim of reducing provider burnout.
SEARCH STRATEGY We conducted searches in PubMed from inception to 03/08/2019, Web of Science from inception to 03/10/2019, and Scopus and Embase from inception to 03/08/2019. The searches used “panel size” and “primary health care” as the set of terms. See Appendix A for complete search strategy. We also searched the gray literature, starting with terms like “primary care panel

Panel Size Evidence Synthesis Program
10
size” in a Google search and then also using the Google-generated search terms “Medical Group Management Association (MGMA) panel size,” “primary care panel size benchmark,” “patient panel size worksheet,” “Kaiser Permanente primary care panel size,” “risk adjusted panel size,” and “primary care practice size.” We looked at the first 20 hits for each search.
STUDY SELECTION 3 team members working independently screened the titles of retrieved citations. For titles deemed relevant by at least 1 person, abstracts were then screened independently in triplicate by team members. All disagreements were reconciled through group discussion. Full-text review was conducted in duplicate by 2 independent team members, with any disagreements resolved through discussion. There was no restriction on study design but publications must have presented research with original data that tested a hypothesis (eg, the association between panel size and an outcome of interest) or with the description of a model to calculate panel size, or be a toolkit to help determine panel size.
DATA ABSTRACTION Data extraction was completed in duplicate. All discrepancies were resolved with full group discussion. We abstracted data on the following: practitioner type, study design, sample size (number of practices), panel size range, other factors, and outcomes of interest. We considered outcomes of interest to be the 6 Institute of Medicine aims for health care improvement (safe, effective, patient-centered, timely, efficient, equitable) and added to this the aim of reducing provider burnout.
QUALITY ASSESSMENT We did not use quality assessment per se, in the sense of a standard tool like the Cochrane Risk of Bias tool. This was because all but 1 of the included hypothesis-testing studies were observational and cross-sectional in design, which we state have limited ability to support causal inferences. Therefore, based on this 1 factor alone the evidence is not coming from high-quality studies. The remaining studies are modeling studies, for which there is no generally accepted tool (such as the Cochrane Risk of Bias tool for randomized trials) to assess model quality. However, we narratively discuss the strengths and limitations of the models in addition to their findings.
DATA SYNTHESIS The observational studies were too clinically heterogeneous to support meta-analysis; hence, our synthesis is narrative.
RATING THE BODY OF EVIDENCE We used criteria similar to those proposed by the Grading of Recommendations Assessment, Development and Evaluation (GRADE) working group.6 GRADE assesses the certainty of the evidence based of the assessment of the following domains: risk of bias, imprecision, inconsistency, indirectness, and publication bias. This results in categories as follows:
High: We are very confident that the true effect lies close to that of the estimate of the effect.

Panel Size Evidence Synthesis Program
11
Moderate: We are moderately confident in the effect estimate. The true effect is likely to be close to the estimate of the effect, but there is a possibility that it is substantially different.
Low: Our confidence in the effect estimate is limited. The true effect may be substantially different from the estimate of the effect.
Very low: We have very little confidence in the effect estimate. The true effect is likely to be substantially different from the estimate of effect.
PEER REVIEW A draft version of the report was reviewed by our technical experts. Reviewer comments and our responses are documented in Appendix B.

Panel Size Evidence Synthesis Program
12
RESULTS
LITERATURE FLOW We identified 448 potentially relevant citations, and found 14 additional articles during reference mining, for a total of 462 articles whose titles were screened. Of these, 385 titles were excluded for lack of relevance to the topic, and 77 were included for abstract screening. From these, a total of 38 abstracts were excluded. Excluded abstracts were categorized as not about panel size (n=17), no original data (n=2), background (n=3), unavailable (n=8), no outcome of interest (n=2), systematic review (n=2), about residents (n=1), not research (n=2), and not about primary care (n=1). This left 60 publications for full-text review, of which 30 publications were excluded for the following reasons: background (n=15), duplicate (n=2), non-systematic review (n=1), not about panel size (n=9), unavailable (n=1), commentary (n=1), and not a predictor (n=1). A full list of studies excluded at full-text review is included in Appendix C. A total of 30 publications were identified at full-text review as meeting initial inclusion criteria. (See Figure 1 below for literature flow.) This included 16 studies hypothesis-testing articles that assessed the association of panel size with an outcome of interest, 11 studies of models, and 3 toolkits. Descriptions of the hypothesis-testing studies and modeling studies are available in the Evidence Tables D and E (Appendix D and Appendix E).
Figure 1: Literature Flow Chart

Panel Size Evidence Synthesis Program
13
KEY QUESTION 1A: How should panel size be determined for a primary care provider? “How should…” is a question for policymakers that requires value judgments that balance multiple factors, and as such is not something that can be answered by an evidence review. In the remaining sections we describe the evidence policymakers can use when making judgments about how should panel size be determined.
KEY QUESTION 1B: What is the optimal size of a patient panel in primary care? As noted above, questions about optimization require an outcome be chosen to be optimized. Since the important outcome may differ among stakeholders, we discuss here the evidence of the association of panel size with the 6 Institute of Medicine (IOM) aims of health care, plus the aim of reducing provider burnout.
We identified 4 groups of articles. The first group were hypothesis-testing studies for which the primary explanatory variable was panel size and the dependent variable was 1 or more of our outcomes of interest. The second group of studies were hypothesis-testing studies of some other explanatory variable on outcomes of interest, for which the investigators also assessed panel size. We distinguished these 2 groups by whether or not “panel size” (or another word that the authors then defined as panel size, such as “provider workload”) appeared in the title of the paper. If it did, then we considered the study to be a hypothesis-testing study in the first group. If not, we classified the article as belonging to the second group. The third group of studies were those that built models to determine panel size. The fourth group of articles were toolkits. These were not included as evidence per se, since they do not present results of an assessment of panel size on an outcome of interest, but are included as being potentially of interest.
Hypothesis-testing Studies of Panel Size
We identified 10 studies that had as their stated primary purpose an evaluation of panel size on an outcome of interest. Nine of these studies were cross-sectional studies, and as such have very limited ability to make causal inferences (meaning that differences in panel size are the cause of any differences in observed outcomes). The ninth study is a pre/post study of a new method of constructing panel sizes based on patient characteristics.7 Four of the studies were from VA,8-11 1 study was from Canada,12 and the remaining 5 studies were from academic health centers.7,13-16 The mean or median panel size in 4 of the studies was similar to what is current in VA (panel size = 1,200). In 2 studies the mean panel size was substantially below this value,13,16 in 3 studies the lower end of the range of panel sizes was about 1,200 (with upper limits 2, 3, or even 4 times that),7,12,15 and in 1 VA study the actual panel size was reported as being above or below the “optimal” panel size.9
We now discuss the evidence according to the IOM aims plus our added aim of provider burnout.
Safe
No study assessed the relationship between panel size and measures of patient safety.

Panel Size Evidence Synthesis Program
14
Effective (Clinical Quality)
3 studies assessed the association of panel size on measures of clinical quality.12,15,17 In a VA study based on data from 2004, Stefos and colleagues8 used multivariable logistic regression to assess the association between panel size (mean = 1206) with 8 measures of clinical quality collected as part of the External Peer Review Program (an independent assessment of VA clinical quality collected at that time mainly via chart review) across all VA. (Additional outcome variables included patient experience and waiting time, discussed below). A number of control variables were included in the model: practitioner type (physician vs non-physician), number of exam rooms, staff FTE, patient age greater than 65, gender, insurance status, distance of the patient to the treating facility, VA priority status, a measure of patient risk, and whether care was in a community-based clinic or other. The results of the multivariable analysis showed that increasing panel size was associated with statistically significantly lower standardized odds of a patient receiving appropriate pneumococcal vaccination and getting an alcohol misuse screen (adjusted odds ratios of 0.95, 95% confidence interval 0.91 to 0.99, and 0.94, 95 confidence interval CI 0.89 to 0.99, respectively). This translates to an estimated 5% decrease in vaccination and a 4% decrease in alcohol screen with an increase in mean panel size from 1,206 by 1 standard deviation to 1,566. Of the other 6 clinical quality measures, 4 had odds ratios of worse care that were not statistically significant (diabetes mellitus patients with A1c <9, hyperlipidemia screen, ischemic heart disease full lipid profile, and diabetes retinal exam), 2 clinical quality measures had an odds ratio of 1.0 (colorectal cancer screen and hypertension blood pressure less than 140/90), and no measures had an odds ratio of better quality with increasing panel size.
In a study from the Family Medicine department of the Mayo Clinic, Angstman and colleagues15 assessed the relationship between panel size for 36 clinicians with a composite measure of clinical quality for patients with diabetes (an all-or-none composite of control of A1c, blood pressure, and lipids; additional outcome variables included patient experience, access, and cost, discussed below). The adjusted panel size ranged from 1,876 to 4,828. The analysis was multivariable and adjusted for patient differences using the Hierarchical Conditions Categories (HCC). These authors found increasing panel size negatively associated with diabetes clinical quality (p = 0.03).
The third study12 in this group was from Ottawa, Canada, and assessed the relationship between panel size for 4,195 physicians and measures of cancer screening, chronic disease management, admissions for ambulatory care sensitive conditions, and emergency department visits (additional outcome variables assessed were continuity and comprehensiveness, discussed below). These authors excluded from their analysis any clinician with a panel size below 1,200, so panel sizes ranged from 1,200 to more than 3,600. Analyses were adjusted for patient complexity using the Adjusted Clinical Group system. The analysis found that the likelihood of being up-to-date on screening for cervical, breast, or colorectal cancer decreased modestly but statistically significantly as panel size increased (for example from 45.6% screened for colorectal cancer in the lowest panel size practices to 44.4% screening in the highest panel size practices). Six measures of performance for patients with diabetes showed no statistically significant differences across panel sizes. The likelihood of getting an echocardiogram in a patient with heart failure statistically significantly increased with increasing panel size (from 69.4% to 75.5%). Admissions for ambulatory care-sensitive conditions statistically significantly increased with increasing panel sizes (by 1.25 admissions per 10,000 patients) while emergency

Panel Size Evidence Synthesis Program
15
department visits decreased (from 19.5 to 17.4 per 100 patients). Authors also note that in their fully adjusted model, a panel size of less than 1,600 was associated with a 6.8-point (95% confidence interval 3.1 to 10.6) increase on a 100-point quality scale.
Patient-centered
Three studies assessed the association of panel size on patient-centered care, generally measured as patient experience or patient satisfaction.8,9,15 Two of these studies have already been described in the section, above, on Effective (Clinical Quality). In the study by Stefos and colleagues,8 using 2004 VA data, in the multivariable analysis increasing panel size was associated with worse patient satisfaction, as measured by a response of “very good” or “excellent” to the question “All things considered, are you satisfied with your care?”, although this did not quite reach the conventional level of statistical significance (adjusted odds ratio = 0.96, 95% confidence interval 0.92 to 1.00). In the study by Angstman and colleagues from Mayo Clinic, patient satisfaction, as measured by the top box score in the Avatar patient satisfaction survey, was not associated with differences in panel size.15 The third study in this group was another study from VA, using data from 2006-2007. In this study, Mohr and colleagues assessed workload, defined as panel size, with 3 measures of patient experience: complaints, provider time availability during the visit, and overall quality of the visit, all taken from the VA Survey of Healthcare Experiences of Patients (SHEP).9 In their multivariable analysis, they controlled for patient characteristics (including age, sex, race, ethnicity, health status as measured by the 12-Item Short Form Health Survey (SF-12), urban versus rural status, teaching hospital status, FTE per clinic, and RN staff per clinic). Workload (panel size) was statistically significantly associated with more patient complaints (adjusted odds ratio = 1.71), worse provider time availability (adjusted odds ratio = 0.61), and fewer positive ratings of overall quality of visit (linear regression estimate = -0.20). Another focus of this analysis was the effect of what the authors term “relational climate”, taken from a 3-item scale in the VA All Employee Survey, about cooperation and respect. The authors found a moderating effect of relational climate in 2 of their 3 analyses.
Timely (Access)
Eight of the 9 studies assessed timeliness of care, either measured as access or continuity. In a 2013 study of VA primary care providers in patient-aligned care teams (PACT), Katz and colleagues used multivariable regression to examine the relationship between panel size (median = 1178) and several measures of actual and relational continuity of primary care.10 In their models, authors controlled for patient demographics, disability status, 22 chronic medical and psychiatric conditions, number of primary care clinic visits, provider full-time equivalent, provider participation in a PACT Learning Collaborative, and usual site of care. They found no significant relationships between panel size and the Usual Provider Continuity Index (UPC), the Modified Continuity Index, or survey measures of shared decision-making. However, increasing panel size was weakly associated with excellent patient-reported interpersonal communication (OR=1.007).
Also in 2013, Mittelstadt and colleagues found that panel size (mean = 577) among 63 providers in the Oregon Health & Sciences University Department of Family Medicine outpatient clinics was not significantly associated with the UPC.13 Their multivariable model contained measures of provider clinic frequency (half-day clinic sessions per month), patient load (ratio of panel size

Panel Size Evidence Synthesis Program
16
to clinic frequency), years in practice, provider type, and a provider type by patient load interaction.
Next, Kamnetz and colleagues published a study in 2018 evaluating the effect of panel weighting (panel size range: 1,244-2,315 [preweighting]; 949-2,705 [postweighting]) on access among 112 primary care providers in the University of Wisconsin system.7 After weighting panels by patient age, sex, and insurance type (Medicare, Medicaid or other), total number of active patients increased (by 2%), but the number of patients who strongly agreed that an appointment in general internal or family medicine was available when needed also significantly increased (from 70%-75% depending on clinic to 75%-80%; p < .05).
In another 2018 study by Margolius and colleagues, a multivariable analysis of the relationship between third next available appointment (TNAA) and panel size (mean = 1,146) was conducted using data from 114 primary care providers in the Ohio MetroHealth System.14 After controlling for provider full-time equivalents, and number of providers per site, the authors found that TNAA was positively related to panel size (r = 0.22, p = .032).
Francis and colleagues assessed the number of clinics and panel size on continuity in medical resident clinics.16 This study used data from the Southern Illinois School of Medicine teaching clinics, where the mean panel size was 54 patients, and found in multivariable analysis that patient continuity decreased by 1.4% for every 10 additional patients in the medical resident’s panel. This study is of marginal relevance to VA non-teaching clinic care, but could be applicable to setting panel sizes in VA teaching clinics.
The last 3 studies have been previously described in the section on Effective (Clinical Quality). In the study by Stefos and colleagues using VA data, 1 standard deviation increase in panel size was associated with a 2.04 day increase in waiting time (difference between the date scheduled for a primary care appointment and the actual date seen in clinic), but this was not statistically significant.8 The study by Angstman and colleagues from the Mayo Clinic found that increasing panel size was statistically significantly associated with longer times to the third next available appointment (p < .01).15 In the study from Ottawa, Canada, Dahrouge and colleagues found a shallow, statistically significant U-shaped curvilinear relationship between deciles of panel size and continuity, starting out at 78% of visits with the same provider at the smallest panel size decile, rising to high of 79.3% in the middle decile, and then falling again to a low of 76.7% in the highest decile of panel size.12
Efficient (Including Cost)
We did not identify any studies that assessed efficiency or cost. One study assessed the relationship between panel size and found no statistically significant effect of panel size on cost of care, as measured by per member per month charges.15 However, charges are not a good measure of cost so it was not included here as evidence.
Equitable
No study assessed the relationship between panel size and measures of equitable care.

Panel Size Evidence Synthesis Program
17
Provider Burnout
One cross-sectional study assessed panel size as a primary explanatory variable for physician burnout.11 This study assessed 1,517 VA primary care physicians (response rate = 32.9%) who responded to an online survey about their work experience, then linked these data to VA data on primary care workload. Panel overcapacity was defined as having a panel size greater than 1,200 patients adjusted by the number of half-days of clinic worked per week. Physician burnout was measured using a single item self-report measure from the Physician Worklife Study rating the level of burnout on a 5-point scale. In univariate analyses, physician burnout was statistically significantly higher in respondents who had panel sizes overcapacity than those at or undercapacity (53.3% versus 48.0%). In a multivariable analysis controlling for other aspects of practice – such as whether or not their primary care team was fully staffed or working extended hours, the degree of clinic staff turnover, and average patient comorbidity – panel overcapacity had an increased adjusted odds ratio of burnout (adjusted odds ratio = 1.19, 95% confidence interval 1.01 to 1.40).
There were 2 studies in the next group that did include panel size as 1 variable among many that were tested for associations with provider burnout18,19 (see below).
Summary of Hypothesis-testing Studies of Panel Size
There is a modest literature of observational studies, all but 1 being cross-sectional, that assess the relationship between panel size and outcomes of interest. The greatest number of studies assess the IOM aim of timely care, either as access or continuity. In general, these studies found variable access results, some reporting better access, others reporting worse - access. Continuity seems to be little affected. There were fewer studies assessing the association between panel size and clinical quality and between panel size and patient experience (3 studies each). In general, these studies showed negative statistically significant relationships of modest size, or no statistically significant relationship, between increasing panel size and various measures of clinical quality and patient experience. One study reported 1 clinical quality measure that had better performance associated with increased panel size. No study assessed the relationship between panel size and cost. One study found a cross-sectional relationship between increased panel size and physician burnout. We did not identify any studies assessing the association of panel size and patient safety or equity.
Certainty of Evidence
Outcome Number of studies
Study limitations
Consistency Direction of effect Overall Certainty of Evidence
Safe 0 N/A N/A N/A Very Low Effective (Clinical quality)
3 Serious Mostly consistent
No association or negative association of modest size
Low
Patient-centered
3 Serious Inconsistent No association or negative associations of modest size
Low
Timely (Access, including Continuity)
8 Serious Inconsistent Variable Low

Panel Size Evidence Synthesis Program
18
Efficient (including Cost)
0 N/A N/A N/A Very Low
Equitable 0 N/A N/A N/A Very Low Provider burnout
1 Serious N/A Increased physician burnout with panel sizes higher than 1,200
Very Low
Hypothesis-testing Studies of Other Questions that Include Panel Size as an Explanatory Variable
We identified 6 studies that were about other questions, but which reported the results of tests of the association of panel size with an outcome of interest. The first of these was from Canada and was focused on the effects of changes in payment (from fee-for-service to salaried or capitation) on the delivery of preventive care services.20 This cross-sectional study included 137 primary care practices, about equal numbers of which were in 1 of 4 models of payment (capitation was split into “new” and “established”). The proportion of panel sizes under 1,600 varied from 43% to 85%, depending on payment model. A panel size of less than 1,600 patients was, along with other factors like the use of an electronic reminder system, and the presence of at least 1 female physician, associated with better score on a set of 6 measures (influenza vaccination; cervical, breast, and colorectal cancer screening; visual impairment screening; and auditory impairment screening). The second study, presented in abstract form only, concerned the relationship between physician productivity measures and patient experience.21 It assessed 14,587 patients cared for by 156 physicians in 13 primary care practices within the Massachusetts General Hospital practice network, and used data from the Consumer Assessment of Healthcare Providers and Systems as the outcome. The abstract contains 1 line of text, stating “however, increasing panel size was associated with better performance on the communication composite (beta 0.023, p=0.001)”. No additional information relevant to this is presented. Two studies assessed aspects of access. One of these was a modeling study assessing the relationship between overbooking and no-show rates.22 In this model, panel size was added as a control variable, since “panel size...directly affects appointment delay”. One conclusion of the model is that “there is a critical panel size range (with and without overbooking) in which both the patient show-up rate and the clinic’s expected profit decreases as the panel size increases.” The second of these access-related studies assessed factors associated with emergency department use in 2 geographic areas of England.23 A multivariable analysis found that lower practice size was associated with an increase in use of the emergency department. Lastly, 2 studies assessed aspects of provider burnout. The first of these, presented only in abstract form, notes that “inbox message volumes…account for over an hour of additional work per day” for primary care physicians, and assessed the effect of several variables, including panel size, on inbox volume.19 This study found, for 86 PCPs in 19 practices in MetroHealth, that panel size was positively associated with an increase in the number of daily messages (along with patient income and number of days worked in clinic). We included this study in the section on provider burnout because that is how it was framed by the authors, in that their results indicate “the need to ensure sufficient time for health care teams…to address patient care issues that occur outside of the face-to-face visit”. The last of these studies, also presented only in abstract form, assessed the cross-sectional association of panel size and a single item of physician burnout in 1,685 primary care practices in 7 regions of the US.18 Although a number of variables were associated with burnout (such as more years in practice and rural location), clinician panel size and patients seen

Panel Size Evidence Synthesis Program
19
per week were not statistically significantly associated with burnout, although no data were presented beyond that narrative text.
Summary of Studies of Other Questions that Include Panel Size
We draw no conclusions from these studies, because they either: are reported only in abstract form and the data available are insufficient to assess it; they concern contexts not relevant to VA primary care (English general practices with very large panel sizes); are cross-sectional in design; use a binary classification of panel size at 1,600 (far above what VA uses as a typical panel size); and have a high likelihood of publication bias for studies like these (in that they would only report panel size if they had a “positive” finding).
Modeling Studies to Determine Panel Size
We identified 11 studies that created and evaluated models to determine how to optimize panel size in primary care.24-34 However, some of the studies are about the same or similar models, so we considered these as 4 distinct models (details of which are presented in Appendix E):
1. UCSF: Altschuler 201224; Rajkomar 201628
2. Mayo Clinic: Balasubramanian 200729; Balasubramanian 201025; Ozen 201327; Rossi 201831; Balasubramanian 201633; Balasubramanian 201334
3. Columbia: Green 200726
4. Florida: Zacharias 201730
The last article we identified (from the gray literature) was a PowerPoint presentation32 that examined the effects of various factors when added to a “standard” panel size model calculator (probably similar to what was proposed by Murray and Davies35), but is not about calculating optimal panel sizes per se. This PowerPoint presentation concludes that a number of variables, some of them beyond the standard model, can influence panel size calculations, including work hours, workload balance, attribution, no-visit and non-billable encounters, the availability of advance practice providers, and ancillary services. This PowerPoint presentation reports that patient acuity (or comorbidity or risk) “plays a small but perceptible role in observed panel size calculations” for the primary care provider.
Before commenting specifically on the remaining articles, we describe a logic model that underlies the motivations for optimizing panel size. We do so as this then enables us to comment on how each of the articles provide evidence for the various parts of the logic model – and hence where gaps remain – and also to highlight how assumptions in the articles themselves may be important in interpreting their results in light of the goals of optimizing panel size.
Logic Model
Elements that will be important in determining optimal panel size include:
1. Patient Demand for PCP Visits and Other Non-Face-to-Face PCP Services/Effort: Demand is a complex function of patient underlying need, the correct recognition of the need by the patient, knowledge gained both via provider advice and other sources, the

Panel Size Evidence Synthesis Program
20
perceived costs and burdens of attempting to make and attend an appointment or use other services, and the perceived benefits of attending an appointment or using other services.
2. Supply of Available PCP Appointments and Time for Other Non-to-Face PCP Services/Effort: Supply is a complex function of panel size, clinic organization in terms of number and length of available appointments, availability of alternative and complementary non-face-to-face services, type and size of team surrounding the PCP, willingness/availability to handle overflow, and non-clinical demands on staff time.
3. Outcomes: Outcomes include a range of benefits and costs which depend on whether different types of patients are seen and what services they receive when seen (and/or receive services in a non-face-to-face manner) with varying degrees of delay and the degree of burden and burnout of PCPs and other staff in order to achieve a given level of supply at a given panel size and case-mix. The likelihood of positive health outcomes is often proxied by a set of measures surrounding the receipt of appropriate and timely services depending on a patient’s underlying diagnoses/health condition. Additionally, patient experience is taken as an important outcome. There appear to be fewer proxy measures for PCP/staff-related outcomes.
4. Value: Involves the combination of a range of benefits and costs to determine whether, in net, panel size (conditional on other organizational features) is worth the costs. Implicitly or explicitly, this implies that acceptable trade-offs must be understood/specified.
We now proceed to a review of these studies.
How Do Studies Model Patient Demand?
Studies use predicted patient demand based on their own analyses of PCP data sets or taken from prior published literature. Some predictions are the same (average) for all patients, while others make predictions conditional on age, sex, or other relevant clinical characteristics. Some studies allow for heterogeneity of demand both across and within patient types as well as stochastic variation in demand.
Importantly, all estimates are made based on purely observational analyses that do not consider change in demand as a function of changes in patient characteristics, panel size, or organization features. Likewise, no studies incorporate potential modification of demand as a patient behavioral response to changes in panel size or other organizational features. The implication of this is that all studies assume that individual patient demand will not change as panel size and other organization features are optimized or changed.
What Features of Supply Do Studies Consider?
Studies take various approaches in terms of thinking about how total supply/needed supply can be controlled. All studies consider panel size, some studies consider strategies involving altering case-mix across PCPs within multi-provider practices, and some studies consider various team organizations that include PCPs and other health care professionals who can act at PCP extenders.

Panel Size Evidence Synthesis Program
21
Supply is most typically thought of as patient appointment slots with the implicit assumption generally that all appointments are of the same length. Some studies relax this assumption and allow for heterogeneity of appointment length and also consider complementary supply of non-face-to-face services.
What Outcomes Do Studies Consider?
Most studies operate under the assumption that all (or the vast majority) of appointments should be offered on the day of the patient call, consistent with various articles by Berwick and colleagues.36 This implies that 1 of the main outcomes is ensuring that supply is equal to or greater than demand for appointments that the percentage of days where demand exceeds supply is small, so that backlog is controllable.
Some studies also consider patient waiting time when they arrive at a crowded clinic to receive a same-day appointment.
No studies explicitly consider what services are delivered during appointments (or via non-face-to-face means). Implicitly, this assumes that regardless of organization all necessary/indicated services are delivered within the confines of each appointment. Even though studies often model heterogeneity of demand for appointment as a function of patient age, sex, other clinical characteristics, and/or past usage, they do not consider how supply/lack of supply of appointments may have differentially large benefits/costs for different types of patients. These modeling choices imply that the benefits gained/harms averted by each incremental step towards satisfying patient demand are equal to all other steps. In addition, some studies consider various team organizations.
Do Studies Consider Value?
Almost all studies match patient demand to supply without explicitly considering the costs of alternative panel sizes or other organizational structures. This choice supposes that meeting patient demand provides benefits that are much larger than the costs, and hence that maximizing this outcome (and/or closely related outcomes) is the same as maximizing value.
One study explicitly – albeit in abstract terms – attaches costs and rewards (benefits) for the outcomes it considers as a function of panel size and combines these in an optimization framework. Presumably the reward for satisfying each demanded appointment (incidentally not dependent on patient type) is a monetization of the health gains and other benefits that come from a timely appointment.
What Approaches Do Studies Use to Conduct Their Analyses/Optimizations?
Some studies consider the total number of work hours that a PCP has available. They typically divide this total into appointment sizes of a fixed length and then determine (given average demand per patient) how many patients could be in the panel.
Other studies use various optimization techniques (analytical approximations or numerical optimization) to find panel sizes, case-mix changes, etcetera, that satisfy the objective(s) they are trying to achieve (eg, low chance that demanded appointments exceed supply of appointments in a given day; short within-clinic waiting times for patients).

Panel Size Evidence Synthesis Program
22
Findings from Modeling Studies
With the above considerations kept in mind, we now review the findings of the modeling studies.
One of the earliest such modeling studies was published by Green and colleagues in 2007.26 The authors describe 6 steps:
1. Identifying the current panel size
2. Estimating the daily visit rate per patient
3. Fixing the number of daily appointment slots
4. Calculating the current overflow frequency
5. Setting the target overflow frequency
6. Computing the panel size based on the target flow frequency
This model was developed in the context of Advanced Access, a model of care which tries to ensure that all patients get seen on the day they present for care. In sample calculations, the authors present the calculated panel size under assumptions about the number of daily appointment slots (20 or 24) and an overflow frequency of 5%, 10%, or 15%. For example, for the 20 slot per day example (which still exceeds the number of slots in most VA primary care practices), with an overflow frequency set low (5%) the calculated panel size was 1,879. With the overflow frequency set high (20%) the calculated panel size was 2,279.
Another early model was published by Balasubramanian, who along with colleagues has published variations and improvements on it over the years.25,29 In the first such study, Balasubramanian, Banerjee, and Gregg used data from the primary care clinics at the Mayo Clinic at Rochester to optimize panels on 2 measures of access (the average time a patient waits to see a provider and the number of a patient’s visits that are to his or her own provider) and 1 measure of resource use (the amount of additional capacity needed to be added for each period). The authors reported that their model only used age and gender for case mix adjustment, and they had plans for including more variables to better capture variations in demand. Subsequent versions of their model27,34 included more sophisticated case mix adjustment, such as the presence of various chronic conditions, and resulted in better optimization when applied to provider panels of about 1,000 patients, in terms of smoothing out imbalances in demand and improving access. These results led the authors to conclude “we have shown that case-mix is an important consideration in primary care.” Although they concluded that their adjustments would improve access and continuity, in this study they did not recommend an optimal panel size. They did however provide a framework for future development of simulation and optimization modeling to consider differences in demand between patient groups and to address the new changes in team-based care. They also noted that it remained to be evaluated what impact these changes would have on quality of care. In this group’s most recent study,31 they further attempted to refine their demand estimation by retrospectively quantifying patterns of face-to-face visits and care coordination events (emergency department visits). They were able to predict the number of weekly appointments needed for panel sizes of 1,500 and 2,000 patients. They stated that it is difficult to quantify the care coordination events, which are often spread across

Panel Size Evidence Synthesis Program
23
email, chart reviews, telephone calls, conversations, and huddles. They also conclude “As our results confirm…there is no one size fits all to the question [of what is the optimal panel size]. Each physician or care team is likely to have a different size depending on a variety of factors such as case mix, practice style, and available capacity.”
Rajkomar and colleagues also tried to improve the demand calculation by using electronic health record data to classify patients into phenotypes based on the number of their encounters (visits, telephone, electronic messaging, and care coordination).28 This allowed them to weight panels based on patient demand and complexity. They concluded that these phenotypes could predict future primary care utilization. With this information, panel sizes could be decreased for more complex patients, or higher utilizers could be spread over different panels. The authors noted that their model did not answer the question of what the “right” weight panel size should be for a given health system.
Lastly, Altschuler and colleagues used a completely different method to calculate optimal panel size.24 Rather than take existing data about real patients and their prior demand for care, Altschuler and colleagues estimated the work required to deliver primary care by taking existing published estimates of the time needed to provide preventative care as defined by the US Preventive Services Task Force grade A and B recommendations, the time needed to deliver chronic care for 10 common conditions, and the time needed to deliver acute care, and then calculated how many patients a primary care provider could deliver this care to given a certain number of hours worked per year. They did this calculation for 4 different assumptions of the amount of care that could be delegated to other providers, such as nurse practitioners, registered nurses, pharmacists, and health educators. In the non-delegated model, they determined that a provider could care for a panel of 983 patients. In a fully delegated model, that number could increase to 1,947. Intermediate amounts of delegation produced numbers between these 2 extremes. Of note, their calculations were based on an average case mix, and times per service were estimated and not derived from time-motion studies. In their discussion, the authors stated that VA’s delegated model with a panel size of 1,200 was “reasonable” because the patient population in the VA system is older and has more chronic illnesses than in their modeled analysis.
One additional study used modeling, but this study is discussed elsewhere in this report. Kamnetz and colleagues also used modeling to improve optimal panel sizes by adding insurance status to the age and gender variables used for case mix adjustments.7 They used insurance status (Medicare, Medicaid, Other) as “a proxy for patient complexity”. Since this study then assessed in a pre-post fashion the effect of this change in method to calculate panel size, it is discussed above in the “hypothesis-testing” studies section.
Summary of Modeling Studies
The modeling studies have varied in how they used or estimated important variables, such as predictors of patient demand, the source of the estimates for those predictors of demand, whether the demand is stochastic or not, and the optimization technique used. All models are optimizing some measure of access or continuity, and have either explicitly or implicitly assumed that other aims for health care improvement, such as clinical quality or patient experience, are equivalent with changes in panel size. A consistent finding from the modeling studies is that the optimal panel size for measures of access changes when patient factors are considered.

Panel Size Evidence Synthesis Program
24
Toolkits
We identified 3 documents that were not hypothesis-testing studies of panel size, but nonetheless seemed of interest as they present toolkits to help practices determine their optimal panel size.
These include:
Family Practice Management Panel Size: How Many Patients Can One Doctor Manage?—This toolkit uses the model developed by Murray and Davies.35 It states that the variables that influence panel size are the number of patients seen per day, the number of days the provider is available per year, and the average number of visits per patient per year. It then provides weights to adjust panel size by the patient age and gender.
University of California, San Francisco Toolkit for Empanelment in Teaching Clinics.37—This discusses issues particular to teaching clinics with rotating medical trainees. The underlying structure, though, appears to be based on the Murray and Davies model.
CP3 Population Health Toolkit38—This toolkit was created for Federally Qualified Health Centers.
KEY QUESTION 1C: Is there evidence to suggest that MDs, NPs, and PAs should have different panel sizes? We found no empirical evidence to inform this question in the published or gray literature. KEY QUESTION 1D: Is there evidence from large health systems in terms of setting and maintaining panel sizes? We identified no evidence per se on this topic. The only evidence from large US health systems we identified were 2 studies (previously discussed) that assessed the cross-sectional association of panel size with access and clinical quality, one study from the Mayo Clinic and the other from MetroHealth in Ohio. But neither study discussed how panel sizes are set or maintained. We note this information must exist; it is just likely not published, and therefore it would require written requests or interviews with the relevant officials from large health systems. One additional study came from the English National Health Service, which assessed the association of panel size with emergency department use (discussed above), but again it did not discuss how panel sizes are set or maintained.23
KEY QUESTION 2: Should primary care panel sizes be risk-adjusted for patient complexity? If yes, how should risk adjustment be accomplished? This has already been discussed in the section on modeling studies, above. A consistent finding of the modeling studies is that the optimal panel size for measures of access is sensitive to risk adjustment for patient complexity. Which method of adjustment – which has varied from a simple method that includes age, gender and insurance status to a complex method that includes many patient health status and prior utilization variables collected from the electronic health record – is “better” has not been tested in head-to-head comparisons, other than to conclude that even the simple method is an improvement over a method that considers just age and gender. This conclusion is supported by the results of a comparison of age-sex weighting with weighting

Panel Size Evidence Synthesis Program
25
that includes conditions, as measured by Episode Treatment Groups. Chung and colleagues evaluated workload using relative value unit (RVU) data among both pediatric and adult panels. Typical panel size in their study ranged from 203 to 2,220, with an average of 959.39 They found that a patient’s clinical conditions better accounted for differences in workload than did age and gender. They did not determine an optimal panel size, but they concluded that weighting of patients is important because the heterogeneity of individual provider panels needs to be accounted for when determining panel size.
Certainty of Evidence for Risk-adjustment
Outcome Number of studies
Study limitations
Consistency Direction of effect Overall Certainty of Evidence
Access 5 Not serious Consistent Better optimization when panel sizes are adjusted for case mix
Moderate
Access 2 Not serious Consistent Risk adjustment that includes clinical conditions is better than risk adjustment with just age and sex in optimizing access
Moderate

Panel Size Evidence Synthesis Program
26
SUMMARY AND DISCUSSION
The evidence about the effect of panel size on the Institute of Medicine aims for health care improvement is surprisingly thin, given the importance of primary care panel size to all models of population-based care. The evidence consists of a handful of cross-sectional studies that assess associations of panel size with clinical quality, patient experience, access and continuity, and show variable, no, or negative associations of increasing panel size on these outcomes of interest. One additional cross-sectional study found an association between larger panel size and physician burnout. By their design these studies cannot support conclusions about increasing panel size being the cause of any differences in outcomes. These studies at best act a signal that there might be causal relationships between larger panel size and worse clinical quality, worse patient experience, and provider burnout. The remainder of the evidence consists of a handful of studies that try and model what should be an optimal panel size, where “optimal” is defined exclusively by access. The modeling studies make the assumption that every additional patient added to a panel is going to be delivered with equal quality and patient-centeredness regardless of the number. The cross-sectional studies we identified provide a signal that this assumption may not be correct. What does seem clear from the modeling studies is that simple models developed years ago, which basically take the number of visits made by existing patients and the number of appointment slots available to determine the panel size, can be improved. Not all patients require the same amount of time, and risk-adjusted methods tested vary from simple (age and gender) to complex (number of health care conditions, number of medications, and more). Furthermore, the resources available to the primary care provider influence how many patients can be cared for – resources such as the number of rooms available to see patients, the ability to delegate tasks to advanced practice providers, and the availability of clinical staff such as RN managers. Lastly, since the early models were developed there has been a plethora of new developments in health care that will influence how many patients can be cared for, such as the rise of non-face-to-face visits, telehealth, and the use of secure messaging, along with a much greater load of information the primary care provider needs to process, and be accountable for. An incomplete list of the non-face-to-face tasks that any assessment of provider capacity includes:
1. Non-face-to-face interactions (with patients) a. Telephone calls b. E-visits or telemedicine c. Secure messaging or email communication d. Medication refills e. Opioid Initiative f. Results letters
2. Complex Care Coordination a. Care in the Community review/coordination b. Coordination with subspecialty clinics c. MISSION Act (consult placement and expanded care coordination)

Panel Size Evidence Synthesis Program
27
3. Form Completion a. State disability b. DMV forms c. Aid and Attendance d. In support of letters e. Dental clearance f. Pre-op evaluation g. Death certificates
These non-face-to-face tasks take up an increasing amount of clinician time. One study, although it is already based on data nearly 4 years old, followed 57 physicians in 4 practices over approximately 1 month in 2015, and recorded the time it took for various tasks.40 This study concluded that for every hour in direct clinical face time with patients, almost 2 additional hours are needed to complete electronic health record and desk work, and that physicians spend 1-2 hours per evening doing additional computer and clerical work. This burden of work outside of the standard “appointment slot” is further supported by data from Farber and colleagues, who found that a full-time PCP would spend an extra 7.8 hours of time per week outside of scheduled appointments caring for their patient panel.41 Doerr and colleagues similarly noted that in caring for a VA patient panel, PCPs added an additional 7.9 hours of work per week between visits.42 Baron studied his own practice over 1 year and determined, when averaged over the whole panel, each patient in the panel generated 2.0 face-to-face visits, 2.6 telephone calls, 1.3 prescription refills outside of a visit, 1.8 emails, 2.1 laboratory reports, 1.2 imaging reports, and 1.5 reviews of a consultation.43
SUMMARY OF EVIDENCE BY KEY QUESTION Key Question 1A: How should panel size be determined for a primary care provider?
We cannot answer this question with an evidence review, since “how should…” is a question for policymakers.
Key Question 1B: What is the optimal size of a patient panel in primary care?
There is a modest literature of observational studies, all but 1 being cross-sectional, that assess the relationship between panel size and outcomes of interest. The greatest number of studies assess the IOM aim of timely care, either as access or continuity. In general, these studies found variable access results, some reporting better access, others reporting worse access. Continuity seems to be little affected. There were fewer studies assessing the association between panel size and clinical quality and between panel size and patient experience (3 studies each). In general, these studies showed negative statistically significant relationships of modest size, or no statistically significant relationship, between increasing panel size and various measures of clinical quality and patient experience. One study reported 1 clinical quality measure that had better performance associated with increased panel size. Only 1 study assessed the relationship between panel size and cost and found no statistically significant association. We did not identify any studies assessing the association of panel size as the primary explanatory variable and patient

Panel Size Evidence Synthesis Program
28
safety and equity. One study found an association between higher panel size and physician burnout.
The modeling studies identified have varied in how they used or estimated important variables, such as predictors of patient demand, the source of the estimates for those predictors of demand, whether the demand is stochastic or not, and the optimization technique used. All models are optimizing some measure of access or continuity, and have either explicitly or implicitly assumed that other aims for health care improvement, such as clinical quality or patient experience, are equivalent with changes in panel size. A consistent finding from the modeling studies is that the optimal panel size for measures of access changes when patient complexity is considered.
Key Question 1C: Is there evidence to suggest that MD, NP and PAs should have different panel sizes?
We found no empirical evidence to inform this question in the published or gray literature.
Key Question 1D: Is there evidence from large health systems in terms of setting and maintaining panel sizes?
We identified no evidence per se on this topic. The only evidence from large health systems we identified were 2 studies that assessed the cross-sectional association of panel size with access and clinical quality, one study from the Mayo Clinic and the other from MetroHealth in Ohio. But neither study discussed how panel sizes are set or maintained. We note this information must exist; it is just likely not published, and therefore it would require written requests or interviews with the relevant officials from large health systems. One additional study came from the English National Health Service, which assessed the association of panel size with emergency department use, but again did not discuss how panel sizes are set or maintained.
Key Question 2: Should primary care panel sizes be risk-adjusted for patient complexity? If yes, how should risk adjustment be accomplished?
A consistent finding of the modeling studies is that the optimal panel size for measures of access is sensitive to risk adjustment for patient complexity. Which method of adjustment – varying from a simple method that includes age, gender, and insurance status to a complex method that includes many patient health status and prior utilization variables collected from the electronic health record – is “better” has not been tested in head-to-head comparisons, other than to conclude that even the simple method is an improvement over a method that considers just age and gender.
LIMITATIONS The primary limitation to this review is the paucity of hypothesis-testing studies on the subject. Cross-sectional studies such as those identified in this review have only a very limited ability to support causal conclusions. A second limitation is the possibility of publication bias, particularly for studies where panel size was not the primary explanatory variable, but was something tested as part of a multivariable regression analysis. Such situations have been shown to be prone to publication bias, as investigators only report the results for secondary variables that they consider

Panel Size Evidence Synthesis Program
29
to be “interesting.” For the association of panel size with access, results were heterogeneous, further limiting the ability to draw conclusions.
Applicability of Findings to the VA Population
Four of the studies identified were done in VA populations and therefore are directly relevant to VA. However, even these studies use VA data that are 5-10 years old, and primary care delivery in VA has been changing rapidly (for example, PACT), suggesting that the results of these VA studies may already be out of date. It is also important to note that many non-VA studies assume that beneficiaries of a commercial insurance plan or Medicare will primarily use that insurance. This is not necessarily the case in the VA, as Veterans receive care in the VA as an entitlement, not as an insurance benefit. It is therefore possible that they also have another primary insurer, and another primary care physician. How this may influence VA primary care provider panel sizes is unclear.
RESEARCH GAPS/FUTURE RESEARCH A substantial amount of research is needed before declarations of what constitutes an “optimal” panel size in primary care can claim to be evidence-based. VA is well-positioned to conduct this research, due to the existing availability of its rich sources of data. First, more evidence needs to be accumulated about the effect of changes in panel size on the IOM aims other than access. One first step is assessing this within VA by using clinical quality and patient experience outcomes that are collected as part of Strategic Analytics for Improvement and Learning (SAIL) – for example, the individual measures of cancer screening, vaccination, tobacco use, diabetes and hypertension, and the patient experience measures taken from SHEP. Primary care panel size could be collected from the Patient Centered Management Module (PCMM) (in other words, not the SAIL star rating itself, but the unweighted values for the clinical quality and patient experience measures). Analyses could be either cross-sectional, or even longitudinal. The unit of analysis could be at the facility level (as SAIL is currently reported, and would then use average PCP panel size) but would ideally be at the individual PCP level within facility, which would require the SAIL measures at the individual provider level. This would require more resources, but nevertheless these data are already being collected routinely within VA and therefore no new apparatus for data collection or system manipulation is needed. A next step up from this would be an assessment of experimental changes in panel size on clinical quality, access, patient experience, etcetera, and burnout. This would involve intentional changes in panel size – say an increase or decrease of 20% – being applied to existing PCP panels, and then a comparison being made of outcomes to practitioners whose panel sizes remained unchanged, using a difference-in-difference analysis, at the end of 1 year. A third line of research could focus on risk adjusting. It is a consistent finding in the modeling studies that risk adjusting improves optimization of access, but the question is which approach works best in VA populations. For example, we could hypothesize that the variability in case mix is larger for the non-VA populations that have been the subject of these studies than it is for VA populations, in which case risk adjustment may make less difference in VA primary care clinics. One way to start is to take the risk adjustment models developed by Rajkomar and colleagues and use VA data from CPRS to see how what proportion of patients fall into their 7 phenotypes.28 It may turn out that the great majority of VA patients are clustered in their highest-use phenotypes, in which case the added value of risk adjustment diminishes. Lastly, primary care provider burnout is a priority in VA and non-VA health care systems, and the effect of changes in panel size on burnout need evaluation.
Panel Size Evidence Synthesis Program
30
More fundamentally, evidence is needed about the appropriate visit frequency or follow-up time, and format (face-to-face, video or telephone, or secure messaging), for patients with chronic conditions. Most currently used visit frequencies or follow-up times (such as a visit frequency of twice a year for a patient with well-controlled diabetes and hypertension) are based on historical norms, are variable between physicians, and lack evidence that the particular frequency produces better outcomes than some other frequency. Thus, panel size calculations that take a provider’s current patients and uses their prior year’s number of visits in order to calculate what size panel the provider can care for simply perpetuate historical provider-specific variability in visit frequency. Having evidence that a particular frequency produces better outcomes will help break through this endogenous reasoning.
In addition, the nationwide adoption of the team-based PACT model may have fundamentally changed the panel capacity that providers are able to manage. Historical panel size norms from several decades ago, like the target panel size of 1,200 patients, may no longer be relevant to current VA practice. Additional research on the relationship between panel size and PACT team-based care is needed.
CONCLUSIONS The evidence about the effect of panel size on the Institute of Medicine aims for health care improvement is surprisingly thin, given the importance of primary care panel size to all models of population-based care. The few studies available provide a signal that increasing panel size may have an association with modest worsening of clinical quality and patient experience. Several modeling studies exist, but all model only the effect of panel size on access to care, and assume that other IOM aims are constant with increasing panel size. Modeling studies support the policy that risk-adjustment and practice-level variables influence the optimal panel size for access. Current recommendations regarding primary care panel size are based more on historical experience than on evidence.

Panel Size Evidence Synthesis Program
31
REFERENCES
1. Patient Centered Management Module (PCMM) for Primary Care. 2017. 2. Huang PY, Yano EM, Lee ML, Chang BL, Rubenstein LV. Variations in nurse
practitioner use in Veterans Affairs primary care practices. Health services research. 2004;39(4 Pt 1):887-904.
3. Alexander GC, Kurlander J, Wynia MK. Physicians in retainer ("concierge") practice. A national survey of physician, patient, and practice characteristics. Journal of general internal medicine. 2005;20(12):1079-1083.
4. Starfield B, Shi L, Macinko J. Contribution of primary care to health systems and health. Milbank Q. 2005;83(3):457-502.
5. Quality AfHRa. Six Domains of Health Care Quality. 2018; http://www.ahrq.gov/talkingquality/measures/six-domains.html. Accessed 5/7/2019.
6. group Gw. 2014; http://www.gradeworkinggroup.org/. Accessed 5/7/2019. 7. Kamnetz S, Trowbridge E, Lochner J, Koslov S, Pandhi N. A Simple Framework for
Weighting Panels Across Primary Care Disciplines: Findings From a Large US Multidisciplinary Group Practice. Quality management in health care. 2018;27(4):185-190.
8. Stefos T, Burgess JF, Jr., Mayo-Smith MF, et al. The effect of physician panel size on health care outcomes. Health services management research. 2011;24(2):96-105.
9. Mohr DC, Benzer JK, Young GJ. Provider Workload and Quality of Care in Primary Care Settings Moderating Role of Relational Climate. Medical care. 2013;51(1):108-114.
10. Katz DA, McCoy K, Sarrazin MV. The Relationship between Pcp Panel Size and Continuity of Va Primary Care. Journal of general internal medicine. 2013;28:S219-S219.
11. CD H, JA S, Clinton WL, et al. The Association of Team-Specific Workload and Staffing with Odds of Burnout Among VA Primary Care Team Members. J Gen Intern Med. 2017;32(7):760-766.
12. Dahrouge S, Hogg W, Younger J, Muggah E, Russell G, Glazier RH. Primary Care Physician Panel Size and Quality of Care: A Population-Based Study in Ontario, Canada. Annals of family medicine. 2016;14(1):26-33.
13. Mittelstaedt TS, Mori M, Lambert WE, Saultz JW. Provider practice characteristics that promote interpersonal continuity. Journal of the American Board of Family Medicine : JABFM. 2013;26(4):356-365.
14. Margolius D, Gunzler D, Hopkins M, Teng K. Panel Size, Clinician Time in Clinic, and Access to Appointments. Annals of family medicine. 2018;16(6):546-548.
15. Angstman KB, Horn JL, Bernard ME, et al. Family Medicine Panel Size with Care Teams: Impact on Quality. Journal of the American Board of Family Medicine : JABFM. 2016;29(4):444-451.
16. Francis MD, Zahnd WE, Varney A, Scaife SL, Francis ML. Effect of number of clinics and panel size on patient continuity for medical residents. Journal of graduate medical education. 2009;1(2):310-315.
17. Bredfeldt CE, Compton-Phillips AL, Snyder MH. Effects of between visit physician-patient communication on Diabetes Recognition Program scores. International journal for quality in health care : journal of the International Society for Quality in Health Care. 2011;23(6):664-673.
Panel Size Evidence Synthesis Program
32
18. Edwards ST, Marino M, Balasubramanian BA, et al. Burnout among primary care providers and staff in small to medium sized primary care practices: Early findings from evidence now. Journal of general internal medicine. 2017;32(2):S132.
19. Margolius D, Siff J, Teng K, Einstadter D, Gunzler D, Bolen S. What factors contribute to inbox volume in primary care? Journal of general internal medicine. 2018;33(2):398.
20. Dahrouge S, Hogg WE, Russell G, et al. Impact of remuneration and organizational factors on completing preventive manoeuvres in primary care practices. CMAJ : Canadian Medical Association journal = journal de l'Association medicale canadienne. 2012;184(2):E135-143.
21. Ward CE, Ashburner JM, Chang Y, Atlas SJ. Relationship between patient experience of care and physician productivity measures. Journal of general internal medicine. 2012;27:S296.
22. Zeng B, Zhao H, Lawley M. The impact of overbooking on primary care patient no-show. IIE Transactions on Healthcare Systems Engineering. 2013;3(3):147-170.
23. Baker R, Bankart MJ, Rashid A, et al. Characteristics of general practices associated with emergency-department attendance rates: a cross-sectional study. BMJ quality & safety. 2011;20(11):953-958.
24. Altschuler J, Margolius D, Bodenheimer T, Grumbach K. Estimating a reasonable patient panel size for primary care physicians with team-based task delegation. Annals of family medicine. 2012;10(5):396-400.
25. Balasubramanian H, Banerjee R, Denton B, Naessens J, Stahl J. Improving clinical access and continuity through physician panel redesign. Journal of general internal medicine. 2010;25(10):1109-1115.
26. Green LV, Savin S, Murray M. Providing timely access to care: what is the right patient panel size? Joint Commission journal on quality and patient safety. 2007;33(4):211-218.
27. Ozen A, Balasubramanian H. The impact of case mix on timely access to appointments in a primary care group practice. Health care management science. 2013;16(2):101-118.
28. Rajkomar A, Yim JW, Grumbach K, Parekh A. Weighting Primary Care Patient Panel Size: A Novel Electronic Health Record-Derived Measure Using Machine Learning. JMIR medical informatics. 2016;4(4):e29.
29. Balasubramanian H, Banerjee R, Gregg M, Denton BT. Improving primary care access using simulation optimization. In: Proceedings of the 2007 Winter Simulation Conference, Vols 1-5. New York: Ieee; 2007:1473-1479.
30. Zacharias C, Armony M. Joint Panel Sizing and Appointment Scheduling in Outpatient Care. Manage Sci. 2017;63(11):3978-3997.
31. Rossi M, Balasubramanian H. Panel Size, Office Visits, and Care Coordination Events: A New Workload Estimation Methodology Based on Patient Longitudinal Event Histories. MDM Policy & Practice. 2018;3(2).
32. D G. Determination of primary care panel size in a value based compensation health care delivery environment. In:2013.
33. Balasubramanian H, Denton BT, Lin QM. Managing physician panels in primary care. In: Handbook of Healthcare Delivery Systems. CRC Press; 2016:10.
34. Balasubramanian H, Muriel A, Ozen A, Wang L, Gao X, Hippchen J. Capacity Allocation and Flexibility in Primary care. In. International Series in Operations Research and Management Science. Vol 184: Springer New York LLC; 2013:205-228.
35. Murray M, Davies M, Boushon B. Panel size: how many patients can one doctor manage? Family practice management. 2007;14(4):44-51.

Panel Size Evidence Synthesis Program
33
36. Murray M, Berwick DM. Advanced access: reducing waiting and delays in primary care. Jama. 2003;289(8):1035-1040.
37. Gupta R, M K. Toolkit for empanelment in teaching clinics. 2018. 38. Newman S, Nguyen D, Fisher T, O'Brien M, Leibig-Shepherd C, D H. CP3 population
health toolkit. 2017. 39. Chung S, Eaton LJ, Luft HS. Standardizing primary care physician panels: is age and sex
good enough? . The American journal of managed care. 2012;18(7):e262-268. 40. Sinsky C, Colligan L, Li L, et al. Allocation of Physician Time in Ambulatory Practice:
A Time and Motion Study in 4 Specialties. Ann Intern Med. 2016;165(11):753-760. 41. Farber J, Siu A, Bloom P. How much time do physicians spend providing care outside of
office visits? Ann Intern Med. 2007;147(10):693-698. 42. Doerr E, Galpin K, Jones-Taylor C, et al. Between-Visit Workload in Primary Care.
Journal of general internal medicine. 2010;25(12):1289-1292. 43. Baron RJ. What's keeping us so busy in primary care? A snapshot from one practice. N
Engl J Med. 2010;362(17):1632-1636.

Panel Size Evidence Synthesis Program
34
APPENDIX A. SEARCH STRATEGIES
DATABASE SEARCHED & TIME PERIOD COVERED: PubMed - From inception to 3/8/2019 LANGUAGE: English SEARCH STRATEGY: "panel size" ===================================================================== DATABASE SEARCHED & TIME PERIOD COVERED: WEB OF SCIENCE Indexes=SCI-EXPANDED, SSCI, A&HCI, CPCI-S, CPCI-SSH, BKCI-S, BKCI-SSH, ESCI, CCR-EXPANDED, IC – From inception to 3/10/2019 LANGUAGE: English SEARCH STRATEGY #1: "panel size" Refined by: WEB OF SCIENCE CATEGORIES: ( MEDICINE GENERAL INTERNAL OR HEALTH CARE SCIENCES SERVICES OR PRIMARY HEALTH CARE OR HEALTH POLICY SERVICES OR MEDICAL INFORMATICS OR PEDIATRICS OR ENGINEERING BIOMEDICAL OR GERIATRICS GERONTOLOGY OR GERONTOLOGY OR INFECTIOUS DISEASES OR MEDICINE RESEARCH EXPERIMENTAL ) SEARCH STRATEGY #2: Cited searches on the following articles: 1. 2017. Hausmann, L. R. M., A. Canamucio, S. Gao, A. L. Jones, S. Keddem, J. A. Long and R. Werner. "Racial and Ethnic Minority Concentration in Veterans Affairs Facilities and Delivery of Patient-Centered Primary Care." Popul Health Manag 20(3): 189-198. 2. 2016. Rajkomar, A., J. W. Yim, K. Grumbach and A. Parekh. "Weighting Primary Care Patient Panel Size: A Novel Electronic Health Record-Derived Measure Using Machine Learning." JMIR Med Inform 4(4): e29. 3. 2016. Hirozawa, A. M., M. E. Montez-Rath, E. C. Johnson, S. A. Solnit, M. J. Drennan, M. H. Katz and R. Marx. "Multivariate Risk Adjustment of Primary Care Patient Panels in a Public Health Setting: A Comparison of Statistical Models." J Ambul Care Manage 39(4): 333-42. 4. 2016. Dahrouge, S., W. Hogg, J. Younger, E. Muggah, G. Russell and R. H. Glazier. "Primary Care Physician Panel Size and Quality of Care: A Population-Based Study in Ontario, Canada." Ann Fam Med 14(1): 26-33.

Panel Size Evidence Synthesis Program
35
5. 2016. Angstman, K. B., J. L. Horn, M. E. Bernard, M. M. Kresin, E. W. Klavetter, J. Maxson, F. B. Willis, M. L. Grover, M. J. Bryan and T. D. Thacher. "Family Medicine Panel Size with Care Teams: Impact on Quality." J Am Board Fam Med 29(4): 444-51. 6. 2013. Weiss, J. M., M. A. Smith, P. J. Pickhardt, S. A. Kraft, G. E. Flood, D. H. Kim, E. Strutz and P. R. Pfau. "Predictors of colorectal cancer screening variation among primary-care providers and clinics." Am J Gastroenterol 108(7): 1159-67. 7. 2013. Ozen, A. and H. Balasubramanian. "The impact of case mix on timely access to appointments in a primary care group practice." Health Care Manag Sci 16(2): 101-18. 8. 2012. Mohr, D. C. and G. J. Young. "Slack resources and quality of primary care." Med Care 50(3): 203-9. 9. 2012. Dahrouge, S., W. E. Hogg, G. Russell, M. Tuna, R. Geneau, L. K. Muldoon, E. Kristjansson and J. Fletcher. "Impact of remuneration and organizational factors on completing preventive manoeuvres in primary care practices." Cmaj 184(2): E135-43. 10. 2011. Stefos, T., J. F. Burgess, Jr., M. F. Mayo-Smith, K. L. Frisbee, H. B. Harvey, L. Lehner, S. Lo and E. Moran. "The effect of physician panel size on health care outcomes." Health Serv Manage Res 24(2): 96-105. 11. 2010. Balasubramanian, H., R. Banerjee, B. Denton, J. Naessens and J. Stahl. "Improving clinical access and continuity through physician panel redesign." J Gen Intern Med 25(10): 1109-15. 12. 2009. Hogg, W., S. Dahrouge, G. Russell, M. Tuna, R. Geneau, L. Muldoon, E. Kristjansson and S. Johnston. "Health promotion activity in primary care: performance of models and associated factors." Open Med 3(3): e165-73. 13. 2009. Francis, M. D., W. E. Zahnd, A. Varney, S. L. Scaife and M. L. Francis. "Effect of number of clinics and panel size on patient continuity for medical residents." J Grad Med Educ 1(2): 310-5. 14. 2008. Dobscha, S. K., K. Corson, J. A. Flores, E. C. Tansill and M. S. Gerrity. "Veterans affairs primary care clinicians' attitudes toward chronic pain and correlates of opioid prescribing rates." Pain Med 9(5): 564-71. 15. 2007. Green, L. V., S. Savin and M. Murray. "Providing timely access to care: what is the right patient panel size?" Jt Comm J Qual Patient Saf 33(4): 211-8. DATABASE SEARCHED & TIME PERIOD COVERED: Scopus – inception-3/8/2019 LANGUAGE: English

Panel Size Evidence Synthesis Program
36
SEARCH STRATEGY #1: TITLE-ABS-KEY ("panel size") AND LIMIT-TO ( SUBJAREA , "MEDI" ) OR LIMIT-TO ( SUBJAREA , "SOCI" ) AND EXCLUDE ( SUBJAREA , "BIOC" ) OR EXCLUDE ( SUBJAREA , "ENGI" ) OR EXCLUDE ( SUBJAREA , "AGRI" ) OR EXCLUDE ( SUBJAREA , "COMP" ) OR EXCLUDE ( SUBJAREA , "ARTS" ) STRATEGY #2: Scopus – inception-3/10/2019 Cited searches on the above-listed 15 articles ===================================================================== DATABASE SEARCHED & TIME PERIOD COVERED: Embase – inception-3/8/2019 LANGUAGE: English SEARCH STRATEGY: 'panel size' AND ‘primary care’

Panel Size Evidence Synthesis Program
37
APPENDIX B. PEER REVIEW COMMENTS/AUTHOR RESPONSES
Question Reviewer comment Authors’ response Are there any published or unpublished studies that we may have overlooked?
Yes - Helfrich CD, Simonetti J, Clinton WL, Wood GB, Taylor L, Schectman G, Stark R, Fihn SD, Nelson KM*. The Association of Team-Specific Workload and Staffing with Odds of Burnout Among VA Primary Care Team Members. 2017; J Gen Intern Med. 32 (7): 760–766. Has information on staffing, panel size overcapacity and burnout.
Thank you for this! We have now included this study in our analysis.
Yes - Hannah Neprash did her dissertation on a related area. See http://scholar.harvard.edu/files/hannahneprash/files/neprash_jmp_november2016.pdf Hannah is now an assistant professor at UMN. https://directory.sph.umn.edu/bio/sph-a-z/hannah-neprash
This is an interesting dissertation, but it does not relate directly to panel size. We therefore did not add it to our review. However, Dr. Neprash is an expert in this area, and we will bring to the Coordinating Center the suggestion to contact her.
Additional suggestions or comments can be provided below. If applicable, please indicate the page and line numbers from the draft report.
See comments and corrections inserted in document attached.
Thank you for these comments and corrections. They are now addressed in-text.
Page 8 "The emergence of the 1,200 patient panel is somewhat of a mystery" could be changed to "The emergence of the 1,200 patient panel size was based on historical means at the time" Page 17 "this study is of marginal relevance to VA non-teaching clinic care" could include the point that it would be relevant to teaching clinics panel sizes.
Thank you for these comments! We have now made these changes to the text.
This is fairly comprehensive review of the primary care panel size question across clinical, health services and operations research literature. It is well written; it is not a mere summary, but advances empirically grounded judgments on the existing literature and what is missing. I am not aware of any important studies that have been omitted. The conclusions are sound and correctly point out that causal relationships between panel size and key outcomes such as clinical quality, patient experience, access and continuity have not yet been measured. In fact, this is a massive gap in the literature and it exists because techniques such as randomized control trials and longitudinal studies are are probably difficult to implement in the primary care setting. The authors correctly state that risk adjustment is key while considering panel size, as is the increasingly dominant role of non face to face work. The section on future research offers promise that the gaps in the literature could be addressed through research at VA.
Thank you for your comments!

Panel Size Evidence Synthesis Program
38
The goal of this report is to review the scientific evidence behind primary care providers panel metrics. These metrics are used for a variety of functions from deciding when to hire more providers to creating bonuses (penalties) for high (low) performing providers. The reviewers combed through the literature finding 462 potential articles. Most articles were excluded upon further review and the final sample included 29, as shown in figure 1. Typically most syntheses grade the quality of the evidence or weight the meta-analytic results with the sample size. The authors acknowledge that this was not done here as all of the articles were observational or modeling exercises. I offer some comments and below: 1. The authors do a nice job explaining the rationale for panel size and the adoption of panel metrics in VA. The authors might want to explain that panel metrics in commercial health care plans may be measuring a different denominator than VA panels. In commercial plans, a patient can only have 1 primary insurer. That is not the case in the VA. Because VA coverage is an entitlement, not a benefit, a Veteran can be in a commercial plan and also have a primary care provider in VA. In fact, most older Veterans are enrolled in Medicare with a substantial number in Medicare Advantage. When dually covered, the Veterans can choose to use the VA or non-VA providers. This has implications for panel management in VA that is rarely discussed. But it is worth noting that the underlying denominator may be different. 2. On page 15, the authors review some existing papers and generally note that higher panel sizes were associated with worse outcomes (effectiveness). If possible, I would encourage the authors to report marginal effects. The odd ratios are not that informative. In addition, readers need to understand if there are thresholds as well as the levels of uncertainty. They do a little of this on the study from Ottawa, but greater details here would be very helpful. Possibly a table of these outcomes would be helpful. 3. Page 17, the authors review 1 study that measured efficiency. It should be noted that charges is not a good measure of costs or efficiency. There is good reason to argue that this study should be ignored and that this area hasn’t been studied well at all. 4. I would encourage the authors to connect with Hannah Neprash, if they haven’t done so yet. She did her dissertation on this issue and has evaluated a natural experiment that might provide causal estimates. She is now an assistant professor
1. Great point. We now address dual eligibility in the Applicability to the VA section in the Discussion on pg. 31. 2. Thank you for this comment. We have now added the marginal effects in text for the Stefos and Dahrouge (Ottawa) papers. Angstman and colleauges did not provide enough data to calculate marginal effects. 3. We now note that charges are not a good measure of costs or efficiency in the Results. 4. We will bring to the Coordinating Center the suggestion to contact Dr. Neprash for her expertise on the subject. Thank you for your comments!

Panel Size Evidence Synthesis Program
39
at Minnesota. In summary, the authors do a very good job reviewing the literature. The lack of evidence on this topic is rather shocking given how these metrics are used for management.

Panel Size Evidence Synthesis Program
40
APPENDIX C. CITATIONS FOR EXCLUDED STUDIES
Background (n=15)
1. Panel size expansion in the medical home. 2010.
2. Patient Centered Management Module (PCMM) for Primary Care. 2017.
3. Facilitating Panel Management. 2018.
4. Bavafa H, Hitt LM, Terwiesch C. The Impact of E-Visits on Visit Frequencies and Patient Health: Evidence from Primary Care. Manage Sci. 2018;64(12):5461-5480.
5. Chamblee J, S R. Using patient panel as a principle element in primary care physician compensation. 2018.
6. Chien AT, Kyle MA, Peters AS, et al. The degree to which practice configuration, size, and composition change while practices establish Teams. Journal of general internal medicine. 2017;32(2):S335.
7. Chung S, Eaton LJ, Luft HS. Standardizing primary care physician panels: is age and sex good enough? . The American journal of managed care. 2012;18(7):e262-268.
8. Edwards ST, Marino M, Balasubramanian BA, et al. Burnout Among Physicians, Advanced Practice Clinicians and Staff in Smaller Primary Care Practices. Journal of general internal medicine. 2018;33(12):2138-2146.
9. Huang PY, Yano EM, Lee ML, Chang BL, Rubenstein LV. Variations in nurse practitioner use in Veterans Affairs primary care practices. Health services research. 2004;39(4 Pt 1):887-904.
10. Hulshof P, Vanberkel, PT , Boucherie, RJ , Hans, EW, van Houdenhoven, M , van Ommeren, JKC Analytical models to determine room requirements in outpatient clinics. OR Spectrum. 2012;34(2):391-405.
11. Improvement IoH. Manage Panel Size and Scope of Practice.
12. Kivlahan C, C S. Identifying the Optimal Panel Sizes for Primary Care Physicians. 2018.
13. Kivlahan C, Pellegrino K, Grumbach K, et al. Calculating primary care panel size. 2017.
14. S S. How many patients can a primary care physician care for? 2014.
15. Virani SS, Akeroyd JM, Ramsey DJ, et al. Health Care Resource Utilization for Outpatient Cardiovascular Disease and Diabetes Care Delivery Among Advanced Practice Providers and Physician Providers in Primary Care. Popul Health Manag. 2018;21(3):209-216.

Panel Size Evidence Synthesis Program
41
Duplicate (n=2)
1. Balasubramanian H, Denton B, M L. Managing physician panels in primary care. In. Handbook of healthcare delivery systems2011.
2. Mayo-Smith MF, Frisbee K, Harvey C, Stefos T, Burgess J, Miller M. Relationship of primary care panel size and healthcare outcomes in the VA. Journal of general internal medicine. 2006;21:123-123.
Non-Systematic Review (n=1)
1. Ahmadi-Javid A, Jalali Z, Klassen KJ. Outpatient appointment systems in healthcare: A review of optimization studies. Eur J Oper Res. 2017;258(1):3-34.
Not about Panel Size (n=9)
1. Cheung A, Stukel TA, Alter DA, et al. Primary Care Physician Volume and Quality of Diabetes Care A Population-Based Cohort Study. Ann Intern Med. 2017;166(4):240-+.
2. Devlin RA, Hogg W, Zhong JW, Shortt M, Dahrouge S, Russell G. Practice size, financial sharing and quality of care. BMC Health Serv Res. 2013;13.
3. Ellis R, Ash A, J F. “Good‐Enough” Risk Adjustment Models for Physician Payment and Performance Assessment. In:2015.
4. Huntley A, Lasserson D, Wye L, et al. Which features of primary care affect unscheduled secondary care use? A systematic review. BMJ Open. 2014;4(5):e004746.
5. Liu N, S Z. Panel size and overbooking decisions for appointment-based services under patient no-shows. Prod Oper Manag. 2014;23(12):2209-2223.
6. Marx R, Drennan MJ, Johnson EC, Hirozawa AM, Tse WM, Katz MH. Assessing and increasing patient panel size in the public sector. Journal of public health management and practice : JPHMP. 2011;17(6):506-512.
7. Stempniewicz R, J C. Primary care panel size: Exploratory Analysis. 2015.
8. Wang JS, Lin SY, Sheu WH, Lee IT, Tseng LN, Song YM. Effects of patient volume on quality of outpatient diabetes care. Diabetes Res Clin Pract. 2009;84(2):e27-29.
9. Zantingea EM VP, de Bakkera DH. The workload of general practitioners does not affect their awareness of patients’ psychological problems. Pat Educ Counsel. 2007;67:93-99.
Unavailable (n=1)
1. Danforth KN, Slezak JM, Chen LH, et al. Risk factors for care-gaps in abnormal lab results follow-up within a large integrated health system. Diagnosis. 2017;4(4):eA118-eA119.

Panel Size Evidence Synthesis Program
42
Commentary (n=1)
1. Keller AO. Does team-based task delegation affect patient panel size for primary care providers? JAAPA-J Am Acad Physician Assist. 2015;28(6).
Not a Predictor (n=1)
1. Chien AT, Kyle MA, Peters AS, et al. Establishing Teams How Does It Change Practice Configuration, Size, and Composition? J Ambul Care Manag. 2018;41(2):146-155.

Panel Size Evidence Synthesis Program
43
APPENDIX D. EVIDENCE TABLE
Author, year Practitioner type
Study design Sample size (# of practices)
Panel size range Other factors Outcome (access, quality, patient experience, cost, continuity)
Outcomes of study
Angstman 201615
Department of Family Medicine at Mayo Clinic (MN)
Observational; Cross-sectional; Retrospective
36 physicians; 3 sites; 9 care teams
Range adjusted for FTE: 1,876-4,828; Mean adjusted for FTE: 2,959 (SD 629);
CMS-HCC complexity score
Access Quality
Access: Days until third next available appt (+) Quality: Cost of care ranking (/) Patient satisfaction (/) Percentage daily appointment fill rate (/) Physician quality ranking for diabetes (-)
Baker 2011 23 Primary care trusts in Leicester City and Leicestershire, UK
Cross-sectional 145 general practices; providers NR; patients NR
Median: 5,903, IQR: 3,122-9,682, years 2006/2007; 6,317, IQR: 3,344, 9,685, years 2007/2008
Deprivation; Practice size; Patient age; Patient race; Patient sex; Distance of the practice from the hospital; Patient satisfaction with telephone access to primary care
Access Emergency department attendance (-)
Dahrouge 201612
Primary care practices in Ontario, Canada
Observational; Cross-sectional; Retrospective
4,195 physicians
Range: 1,200-3,900 Number of physicians; Physician age; Physician sex; Foreign-trained physician indicator; Time since physician graduation; Practice
Continuity Quality
Continuity: Physician continuity of care (+) Quality:

Panel Size Evidence Synthesis Program
44
Author, year Practitioner type
Study design Sample size (# of practices)
Panel size range Other factors Outcome (access, quality, patient experience, cost, continuity)
Outcomes of study
group size; Practice rurality; Number of patients; Proportion of patients virtually rostered; Patient age; Patient sex; Proportion of recent immigrant patients; Patient rurality; Patient income quintile; Resource Utilization Band case mix measure
Asthma spirometry (/) Admissions for ambulatory-care sensitive conditions (+) Breast cancer screening (-) Cervical cancer screening (-) CHF ACEi/ARB prescription (/) CHF echocardiogram (+) Colorectal cancer screening (/) Diabetes ACEi/ARB prescription (/) Diabetes eye examination (/) Diabetes lipid test (/) Diabetes HbA1c test (/) Diabetes lipid-lowering agent prescription (/)
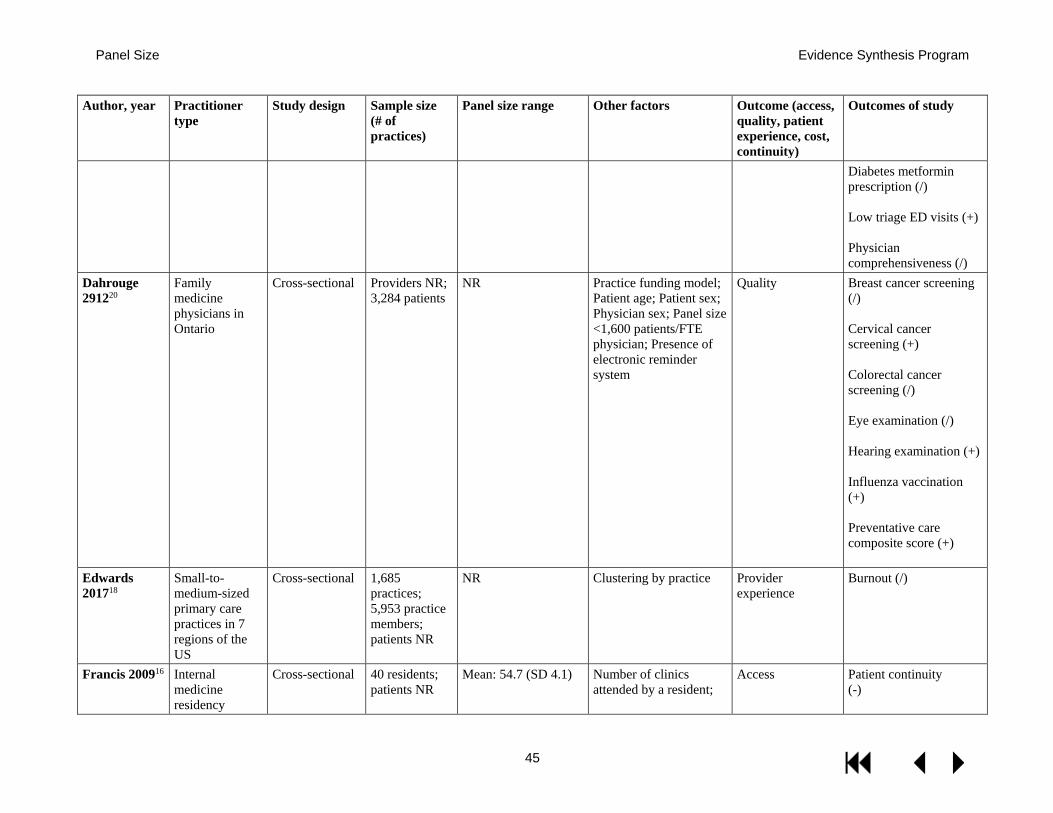
Panel Size Evidence Synthesis Program
45
Author, year Practitioner type
Study design Sample size (# of practices)
Panel size range Other factors Outcome (access, quality, patient experience, cost, continuity)
Outcomes of study
Diabetes metformin prescription (/) Low triage ED visits (+) Physician comprehensiveness (/)
Dahrouge 291220
Family medicine physicians in Ontario
Cross-sectional Providers NR; 3,284 patients
NR Practice funding model; Patient age; Patient sex; Physician sex; Panel size <1,600 patients/FTE physician; Presence of electronic reminder system
Quality Breast cancer screening (/) Cervical cancer screening (+) Colorectal cancer screening (/) Eye examination (/) Hearing examination (+) Influenza vaccination (+) Preventative care composite score (+)
Edwards 201718
Small-to-medium-sized primary care practices in 7 regions of the US
Cross-sectional 1,685 practices; 5,953 practice members; patients NR
NR Clustering by practice Provider experience
Burnout (/)
Francis 200916 Internal medicine residency
Cross-sectional 40 residents; patients NR
Mean: 54.7 (SD 4.1) Number of clinics attended by a resident;
Access Patient continuity (-)

Panel Size Evidence Synthesis Program
46
Author, year Practitioner type
Study design Sample size (# of practices)
Panel size range Other factors Outcome (access, quality, patient experience, cost, continuity)
Outcomes of study
program at Southern Illinois University
Attending physician fixed effects
Helfrich 201711
Primary care providers (primary care physicians; nurse practitioners; physician assistants), nurse care managers, clinical associates, and administrative clerks from a national VA sample
Cross-sectional 4,610: 1,517 PCPs; 1,276 nurses care managers; 1,164 clinical associates; 653 administrative clerks
NR; 31.6% of panels >1,200 (overcapacity)
Team staffed to the 3:1 ratio indicator; Working on multiple teams indicator; Last 12-month team turnover indicator; Average panel comorbidity; Working extended hours indicator; Respondent occupation; Duration of VA tenure; VA medical center (vs community-based outpatient clinic [CBOC]) indicator; Team random intercept; Clinic random intercept; Occupation-panel overcapacity interaction
Provider experience
Burnout (+)
Kamnetz 20187
Primary care physicians in the University of Wisconsin (UW) School of Medicine and Public Health, the UW Hospital and Clinics, and the UW Medical Foundation
Observational; Pre-post; Retrospective
112 physicians in 27 clinics
Range: 1,244-2,315(preweighting); 949-2,705 (postweighting)
Patient age; Patient sex; Patient insurance type
Access Panel weighting: Active patients (+) Appointment available when needed in family or general internal medicine (+)

Panel Size Evidence Synthesis Program
47
Author, year Practitioner type
Study design Sample size (# of practices)
Panel size range Other factors Outcome (access, quality, patient experience, cost, continuity)
Outcomes of study
Katz 201310 VA primary care providers; unspecified specialty
Cross-sectional Providers NR; 180,808 patients
Median: 1,178; IQR: 982– 1,295
Demographics; Disability status; Chronic medical and psychiatric conditions; Number of primary care clinic visits; Primary care FTE; PCP participation in a PACT Learning Collaborative; Usual site of care
Continuity Modified Continuity Index (/) Physician/patient communication (+) Physician/patient shared decision-making (/) Usual Provider Continuity Index (/)
Margolius 201814
Primary care providers in MetroHealth system (NE Ohio; 76% MDs)
Observational; Cross-sectional; Retrospective
114 providers; practices NR
Mean: 1,146 (SD 618) FTE; clinicians/site Access Days until third next available appt (+)
Margolius 201819
Nineteen practice sites in the MetroHealth System in Northeastern Ohio
Cross-sectional 86 primary care physicians; patients NR
NR PCP full time equivalents; Estimated average income of PCP’s panel
Provider experience
Inbox volume (+)
Mittelstaedt 201313
Primary care providers in OHSU Department of Family Medicine outpatient clinics (71% MDs)
Observational; Cross-sectional; Retrospective
63 providers; 4 clinics
Range: 65-1,377; Mean: 577.4 (SD 315.8)
Clinic frequency (half-day clinic sessions per month); Patient load (ratio of panel size to clinic frequency); Years in practice; Provider type; Provider type*patient load interaction
Continuity Usual Provider Continuity Index (/)

Panel Size Evidence Synthesis Program
48
Author, year Practitioner type
Study design Sample size (# of practices)
Panel size range Other factors Outcome (access, quality, patient experience, cost, continuity)
Outcomes of study
Mohr 20139 Primary care providers in VA (% physician NR)
Observational; Cross-sectional; Retrospective
Providers NR; 222 clinics
NR; Workload defined/reported as the ratio between actual panel size and optimal panel size
Patient age; Patient sex; Patient race; Patient ethnicity; Patient SF-12 score; Patient SHEP responses; Clinic rurality; Clinic hospital/community-based setting; Clinic geographic region; Clinic teaching hospital affiliation; Clinic years in operation; Clinic full-time equivalent employees; Clinic RNs per support staff
Access Patient experience Quality
Access: Workload: Patient-provider interaction time (-) Patient experience: Workload: Patient complaints (+) Quality: Workload: Overall visit quality (-) Workload relationship with complaints and interaction time only significant in low-relational working climates (vs. high-relational)
Stefos 20118 Primary care providers in VA (71-74% MDs)
All VA not otherwise specified
Mean panel size 1,168-1,206
Patient age; Patient gender; Patient insurance status; Patient VA priority status; Patient clinical risk; Clinical support staff; Adjusted exam rooms; Per primary care provider clinical FTE; Available support staff; Capital resources; Patient satisfaction;
Access Patient experience Quality
Access: Waiting time (+) Patient experience: Patient satisfaction (-) Quality: Alcohol Misuse Screen (-)

Panel Size Evidence Synthesis Program
49
Author, year Practitioner type
Study design Sample size (# of practices)
Panel size range Other factors Outcome (access, quality, patient experience, cost, continuity)
Outcomes of study
Distance in miles from VA facility; CBOC or not
AMI/Ischemic Heart Disease Full Lipid Profile (/) Colorectal Cancer Screen (/) Diabetes Mellitus, HbA1c <= 9 (/) Diabetes Mellitus Retinal Eye Exam (/) Hyper-lipidaemia Screen (-) Hyper-tension Diagnosis Blood Pressure <= 140/90 (/) Pneumococcal Immunizations (-)
Ward 201221 Physicians in primary care practices the Massachusetts General Hospital network; unspecified specialty
Cross-sectional 156 provider; 14,857 patients
NR Patient age; Patient sex; Patient insurance status; Patient race; Patient language; Patient education; Patient Charlson score
Access Patient experience
Access: Access composite score (/) Patient experience: Patient communication composite sore (+)

Panel Size Evidence Synthesis Program
50
Author, year Practitioner type
Study design Sample size (# of practices)
Panel size range Other factors Outcome (access, quality, patient experience, cost, continuity)
Outcomes of study
Time spent with patient (/)
Note: (+) indicates a significant positive association between outcome and increasing panel size, (-) indicates a significant negative association with increasing panel size, and (/) indicates no association. Predictors other than panel size are specified when appropriate.

Panel Size Evidence Synthesis Program
51
APPENDIX E. MODELING STUDIES EVIDENCE TABLE
Article Predictors of Patient Demand
Demand Primary Estimates/ Source
Demand Stochastic?
Decision Variables
Outcomes Value Optimization/ Technique
Other Notes
UCSF: Altschuler 201224
Chronic conditions for chronic services time; unconditional averages for preventive and acute services
Based on Duke studies (Yarnall 2009; Yarnall 2003; Ostbye 2005)
No Panel Size; Team Organization
Supply = Demand
No explicit calculation
Accounting: The authors computed the maximum panel size that could be handled by an FTE PCP within a non-team or various team organizations, given the following: average appointment time demand by chronic condition type; prevalence of chronic condition; average acute appointment time; average time to provide preventive services; and average percentage of time for these services that could be offloaded from the PCP under various team models
Assumes an average US patient case mix; Discussion mentions VA and perhaps needing lower panel sizes given the older patient population with more prevalent chronic conditions
UCSF: Rajkomar 201628
Age, sex, prior year demand patterns, etc
UCSF 2013-5 patients receiving care from
N/A None None None Prediction only: They develop a relatively complex statistical model to
They split their data to have training data (70%) and test data (30%)

Panel Size Evidence Synthesis Program
52
Article Predictors of Patient Demand
Demand Primary Estimates/ Source
Demand Stochastic?
Decision Variables
Outcomes Value Optimization/ Technique
Other Notes
PCPs within academic health system
predict patient demand for visits and other non-face-to-face services, which they use to reweight current panel sizes based on this predicted patient heterogeneity
Mayo: Balasubramanian 200729
Age, sex Mayo Clinic Primary care practice data 2004-2006 (39 PCP panels)
Yes Panel size and case mix
Appointment wait times; Redirection to another PCP; Daily appointment overage
Outcomes (all negative) are valued as costs, with total cost being minimized
Panel Design Genetic Algorithm
Authors claim that they likely do better than Green for situations where variance around predicted demand for patient categories is relatively high (ie, when demand is hard to predict). Essentially, the authors state that stochastic surges in demand will occur and will not be absorbed well in panel sizes/ appointment slots as suggested by Green. This happens because the surges will happen more frequently than

Panel Size Evidence Synthesis Program
53
Article Predictors of Patient Demand
Demand Primary Estimates/ Source
Demand Stochastic?
Decision Variables
Outcomes Value Optimization/ Technique
Other Notes
there is excess capacity to quickly absorb of the backlog of demand. The backlog will then propagate and grow. Supply is also not very flexible, because unused appointments from 1 day cannot be moved forward to another day’s capacity.
Mayo: Balasubramanian 201025
Age, sex, chronic conditions
Mayo Clinic Primary Care practice data 2004-2006 (39 PCP panels)
Yes Panel size and case mix
Appointment wait times; Redirection to another PCP
Not stated but appears to be a similar cost minimization for (negative) outcomes like 2007 paper
Stochastic Linear Programming
Also considers increased panel sizes; Their limitations section notes many of the behavioral responses around demand and supply, and the potential importance of patient/PCP matching
Mayo: Ozen 201327
Chronic conditions Mayo Clinic Primary Care practice data 2004-2006 (39 PCP panels)
Yes Panel size and case mix
Overflow Frequency
Integer Non-Linear Programming
Instead of specifying a trade-off between PCP/patient continuity and total panel size, they

Panel Size Evidence Synthesis Program
54
Article Predictors of Patient Demand
Demand Primary Estimates/ Source
Demand Stochastic?
Decision Variables
Outcomes Value Optimization/ Technique
Other Notes
optimize without allowing redirection and show how many fewer patients can be empaneled if continuity is required; they also consider at what clinical capacity physicians are working and expected overflow
Mayo: Rossi 201831
None explicitly, statistical sampling based on empirical distribution of actual data
MEPS 2011 N/A None None None Prediction only: They use a set of statistical sampling techniques on patient-level longitudinal data that predicts weekly demand for a variety of PCP office and non-office services that require PCP coordination and then suggest that normal PCPs with panels of 2,000 will struggle to meet demand
The main extension from the prior work, aside from considering more broadly representative distributions of patient demand, is to jointly model expected demands on PCP time from both appointments as well as other types of encounters that demand PCP time for coordination
Columbia: Green 200732
Unconditional average
Based on prior studies by practice type (adult
No Panel Size; Daily Appointment Slots
Supply = Demand; Low frequency of overflow
No explicit calculation
Based on assumptions about distribution of demanded
They are looking at an advanced access model (patients should be able to

Panel Size Evidence Synthesis Program
55
Article Predictors of Patient Demand
Demand Primary Estimates/ Source
Demand Stochastic?
Decision Variables
Outcomes Value Optimization/ Technique
Other Notes
PCP; pediatrician)
appointments (binomial), number available daily slots, and a suitably low targeted overflow fraction, they compute a panel size for which demand is satisfied and the overflow fraction does not exceed the target
get same-day appointments)
Florida: Zacharias 201730
None (could in principle but study is entirely mathematical/simulation)
None Yes Panel size; Daily appointment slots
Appointments delivered, cost of delayed appointments, cost of patient waiting, overtime costs
Outcomes are combined and reward is maximized
Diffusion approximations and other techniques used to provide analytical solutions that are then illustrated in simulation
Allow for more patient behaviors like deciding not to use care when the appointment backlog is too long; they show that in their model advanced access (same-day appointment offering) will be optimal generally; They have a small example applied to an MRI clinic to determine a panel size that the clinic could handle under assumption about the relative

Panel Size Evidence Synthesis Program
56
Article Predictors of Patient Demand
Demand Primary Estimates/ Source
Demand Stochastic?
Decision Variables
Outcomes Value Optimization/ Technique
Other Notes
costs/benefits of their outcomes
South Florida: Zeng 201322
None explicitly stated; parameters derived from actual data
Public mental health clinic at the Johns Hopkins Bayview Medical Center in Baltimore, MD
No Panel size; overbooking status
Appointment delay; office delay; Daily clinic profit; Patient show-up probability
Not stated Prediction only