what is science? science is a system of knowledge and the methods you use to find that knowledge. it...
TRANSCRIPT

WHAT IS SCIENCE?
Science is a system of knowledge and the methods you use to find that knowledge. It begins with curiosity and ends with discovery.

INTERDEPENDENCE
• Technology: The use of knowledge to solve practical problems
• The advances in technology often lead to future scientific discoveries. We say that science and technology are interdependentinterdependent. Advances in one (science or technology) lead to advances in the other.

BRANCHES OF SCIENCEMAJOR BRANCHES OF NATURAL SCIENCE
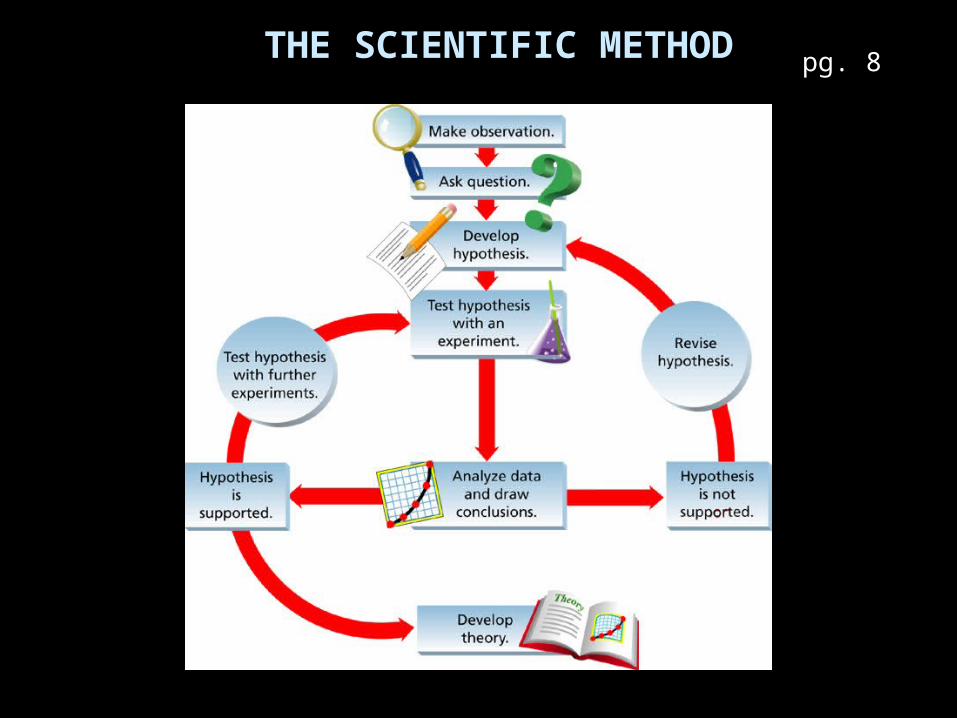
SCIENTIFIC METHODTHE SCIENTIFIC METHOD pg. 8
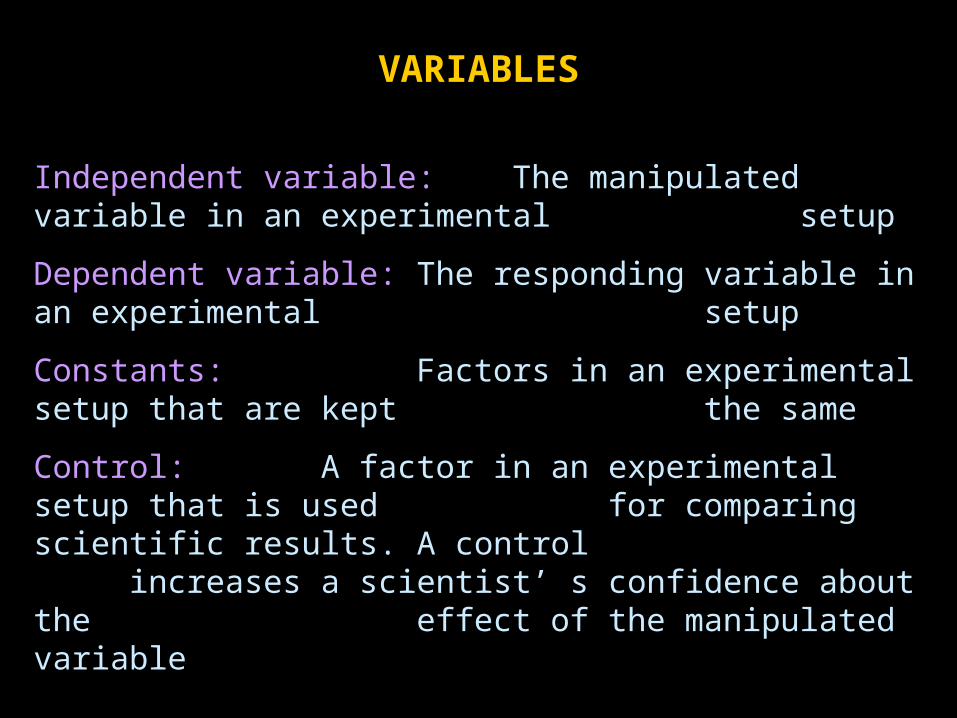
VARIABLES
Independent variable: The manipulated variable in an experimental setup
Dependent variable: The responding variable in an experimental setup
Constants: Factors in an experimental setup that are kept the same
Control: A factor in an experimental setup that is used for comparing scientific results. A control increases a scientist’ s confidence about the effect of the manipulated variable

EXPERIMENTAL DESIGN
Experimental group: The part of the experiment that contains the independent variable
Control group: The part of the experiment that does not contain an independent variable. It is used to compare data from the experimental group

A CONTROLLED EXPERIMENT
• A controlled experiment isolates all other variables except the independent and dependent variable.
EXAMPLE:
Kevin added 5g of the same pesticide to one tomato plant, 10g to another, 20g to a third, and nothing to the fourth.
• What was Kevin’s problem?
• What was Kevin’s hypothesis?
• What is the independent variable?
• What is the dependent variable?
• Identify the constants
• What is the purpose of the fourth plant?
Does pesticide affect insects?
If I increase the amount of pesticide, then the plant will have less insects
Amount of pesticide
Number of insects
Brand of pesticide, type of plant
It was the control group
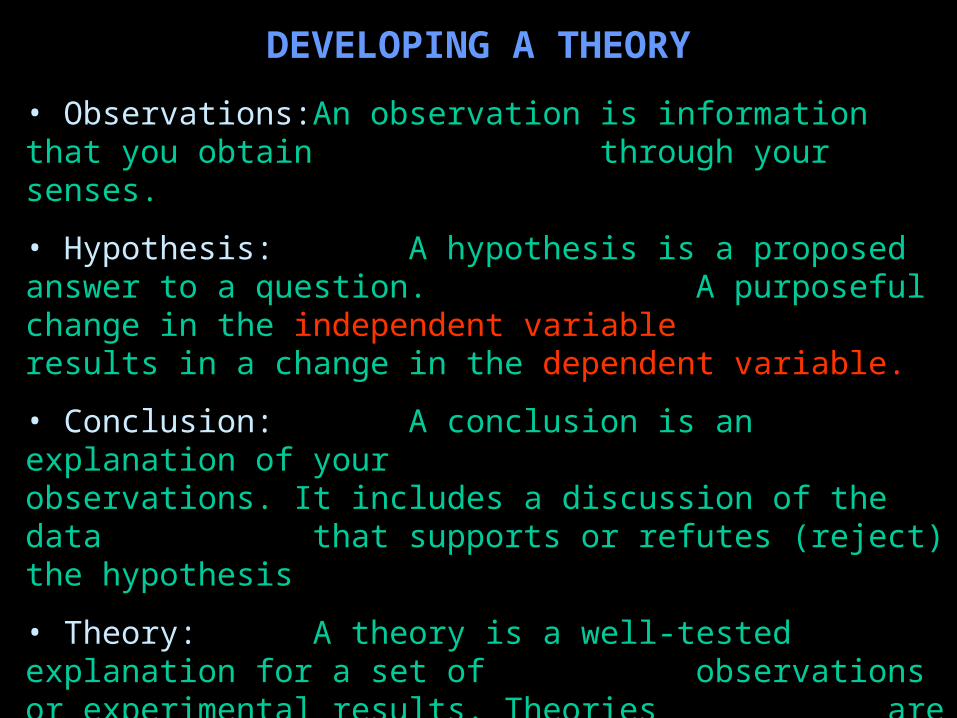
DEVELOPING A THEORY
• Observations: An observation is information that you obtain through your senses.
• Hypothesis: A hypothesis is a proposed answer to a question.A purposeful change in the independent variableresults in a change in the dependent variable.
• Conclusion: A conclusion is an explanation of your observations. It includes a discussion of the datathat supports or refutes (reject) the hypothesis
• Theory: A theory is a well-tested explanation for a set ofobservations or experimental results. Theories are never proven. They can be refined to include new observations
• Communication Well tested hypotheses should be published to the scientific community for review.
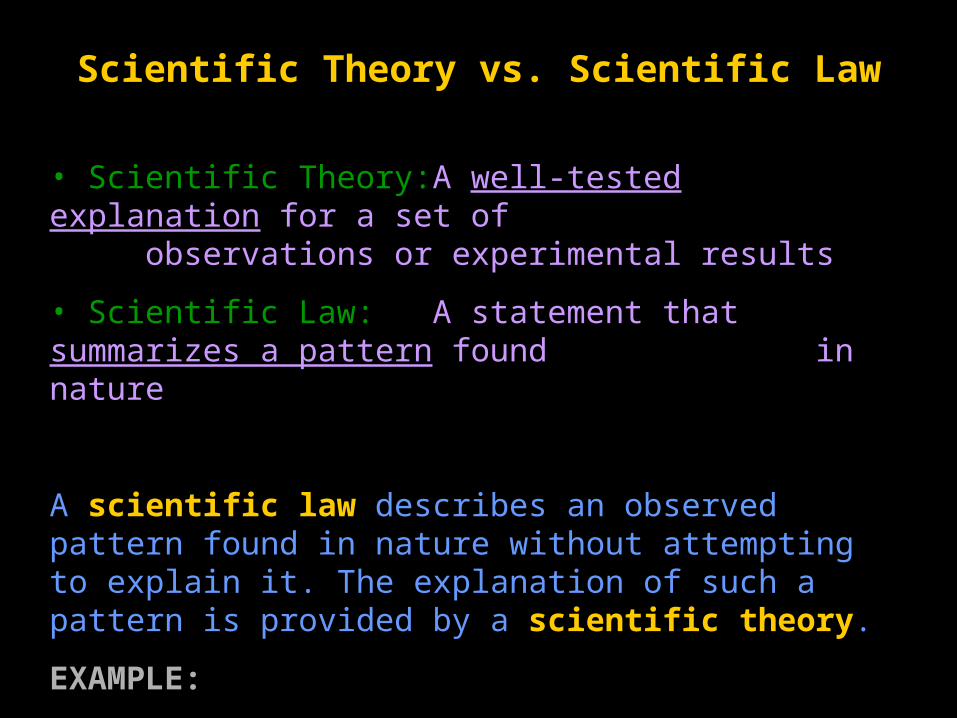
Scientific Theory vs. Scientific Law
• Scientific Theory: A well-tested explanation for a set of observations or experimental results
• Scientific Law: A statement that summarizes a pattern found in nature
A scientific law describes an observed pattern found in nature without attempting to explain it. The explanation of such a pattern is provided by a scientific theory.
EXAMPLE:
Newton’s Law of gravity describes how two objects attract each other. There is no current theory that explains how gravity works.

Scientists use a set of measuring units called the International System of Units, or SI. It is a revised version of the metric system. By adhering to one system of units, scientists can readily interpret one another’s measurements.
ggram

BASE UNITSLength Meter m
Mass Kilogram kg
Time Seconds s
Temperature Kelvin k
DERIVED UNITSArea Square
meterm2
Volume Cubic meter m3
Density g/m3
Speed m/s
Kilo K Thousand 1,000
Hecto h One hundred
100
Deka dka Ten 10
Base Base One 1
Deci d Tenth .1
Centi c Hundredth .01
Milli m Thousandth .001
SI PREFIXES

THE METRIC SYSTEM
The metric system is based on units of ten. Therefore, it is very easy to convert between units by simply moving the decimal to the right or to the left.

DIMENSIONAL ANALYSIS
Conversions between metric prefixes requires a unit factor. A unit factor is a ratio between two units that is equal to 1. Because it is equal to 1, multiplying a measurement by a unit factor changes the measurements units but does not change its value
A unit factor is a fraction in which the numerator and the denominator both represent the same measurement.
100 cm
1 m= same measurement
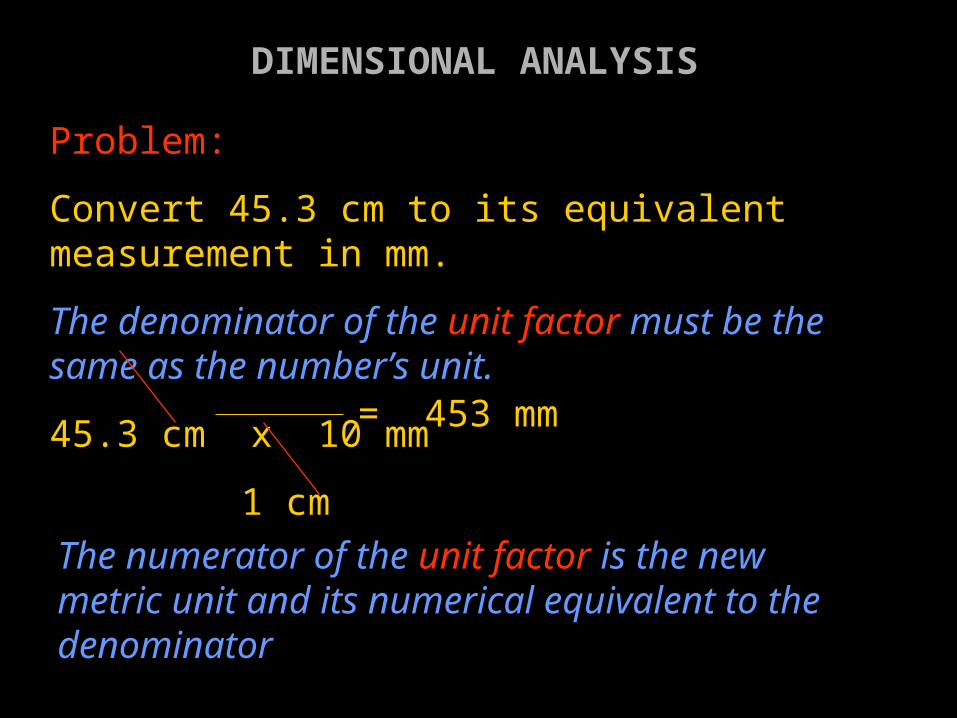
Problem:
Convert 45.3 cm to its equivalent measurement in mm.
The denominator of the unit factor must be the same as the number’s unit.
45.3 cm x 10 mm
1 cm = 453 mm
The numerator of the unit factor is the new metric unit and its numerical equivalent to the denominator
DIMENSIONAL ANALYSIS
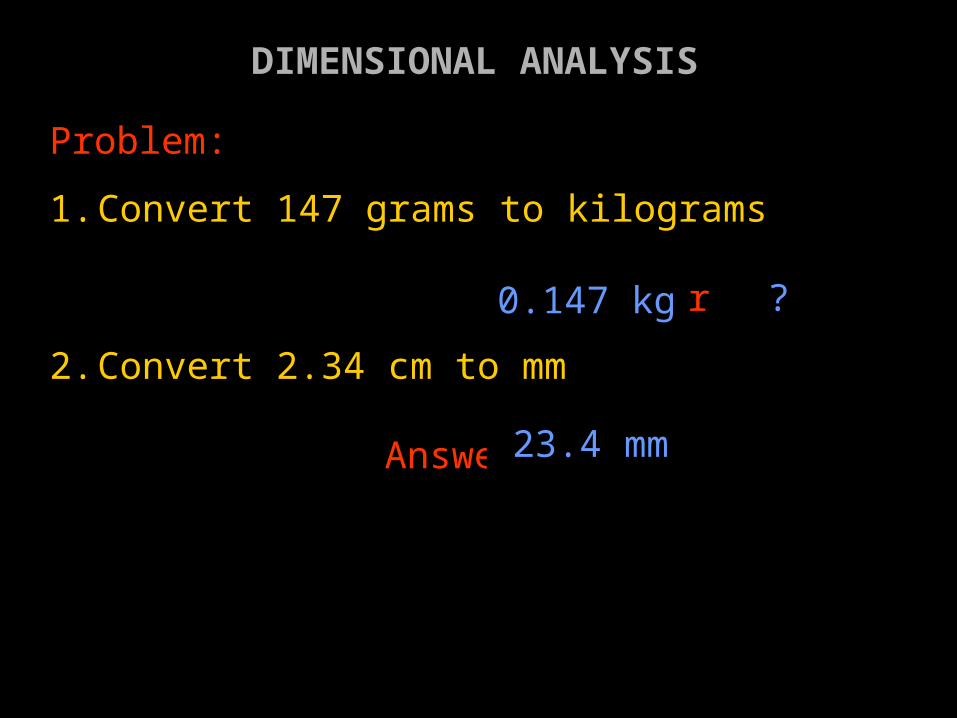
Problem:
1. Convert 147 grams to kilograms
Answer ?
2. Convert 2.34 cm to mm
Answer ?
0.147 kg
23.4 mm
DIMENSIONAL ANALYSIS

Problem:
1 km2 is how many square meters?
Because 1km2 = 1 km x 1 km, you need to multiply the measurement you are converting from by two unit factors. Notice that the original unit cancels the units in the unit factors.
1 km2 x 1000 m x 1000 m
1 km 1 km = 1, 000, 000 m2
DIMENSIONAL ANALYSIS

Problem:
Convert 3 cm2 to square meters
Answer ?0.0003 m2
DIMENSIONAL ANALYSIS

Change the speed of 72.4 miles per hour to its equivalent in feet per second
49.
36 fe
et/s
ec
0.0
0000
38 fe
et/s
ec
106
.2 fe
et/s
ec
0.8
23 fe
et/s
ec
25% 25%25%25%1. 49.36 feet/sec
2. 0.0000038 feet/sec
3. 106.2 feet/sec
4. 0.823 feet/sec

The density of mercury is 13.6 g/ml. What is the mass of 43 ml of mercury?
585
gra
ms
0.3
2 gra
ms
3.1
6 gra
ms
3.1
6 m
L
25% 25%25%25%1. 585 grams
2. 0.32 grams
3. 3.16 grams
4. 3.16 mL

Convert 5.25 mm3 to its equivalent in m3
525
0 m
3
0.0
0525
m3
0.0
0000
0005
25 m
3
525
0000
000.
0 m
3
25% 25%25%25%1. 5250 m3
2. 0.00525 m3
3. 0.00000000525 m3
4. 5250000000.0 m3
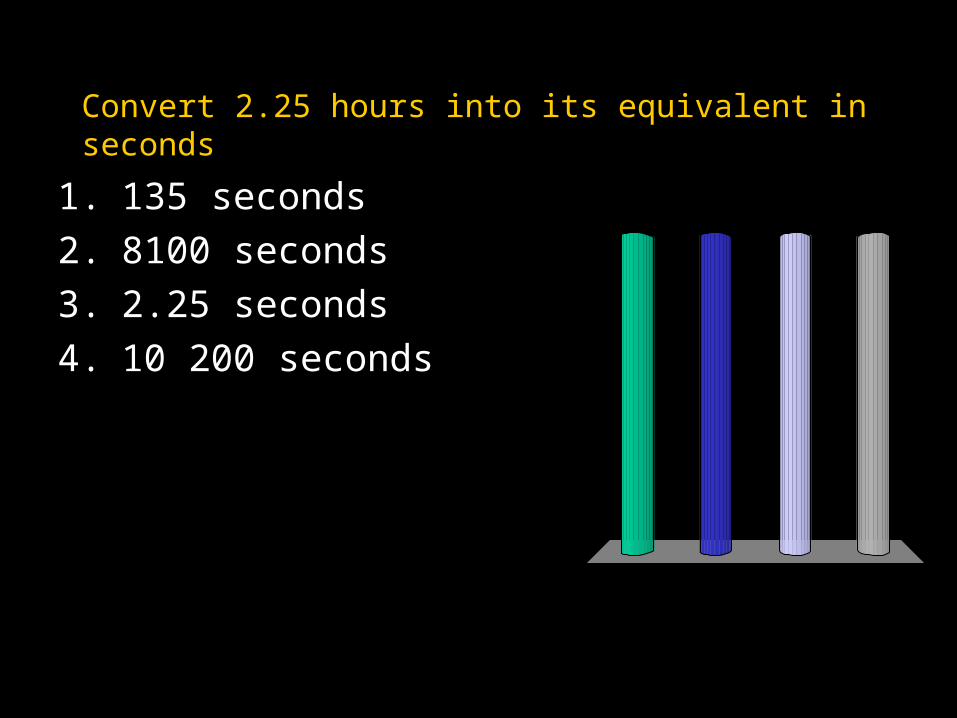
Convert 2.25 hours into its equivalent in seconds
135
sec
onds
810
0 se
conds
2.2
5 se
conds
10
200
seco
nds
25% 25%25%25%1. 135 seconds
2. 8100 seconds
3. 2.25 seconds
4. 10 200 seconds

SCIENTIFIC NOTATIONSCIENTIFIC NOTATION
Scientific notation is used to make very large numbers and very small numbers manageable. All numbers in scientific notation are expressed as two numbers multiplied together. The first number to the left of the decimal is between 1 and 10. The second number is expressed as a power of 10, which represents the number and direction the decimal was moved.
167000000000.0 m/s
1.67 x 10¹¹ m/s
To achieve a number of 10 or less, the decimal was moved 11 places to the left. The positive 11 indicates that moving 11 places to the right will result in the original number.
SCIENTIFIC NOTATIONSCIENTIFIC NOTATION
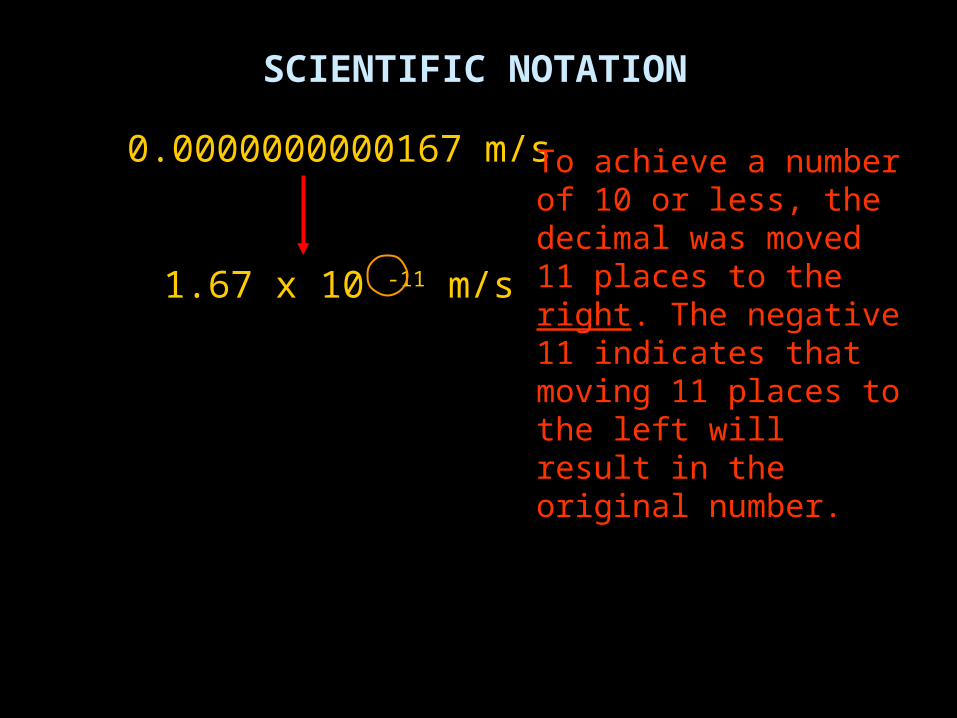
0.0000000000167 m/s
1.67 x 10 -11 m/s
To achieve a number of 10 or less, the decimal was moved 11 places to the right. The negative 11 indicates that moving 11 places to the left will result in the original number.
ADDITION AND SUBTRACTION WITH ADDITION AND SUBTRACTION WITH SCIENTIFIC NOTATIONSCIENTIFIC NOTATION
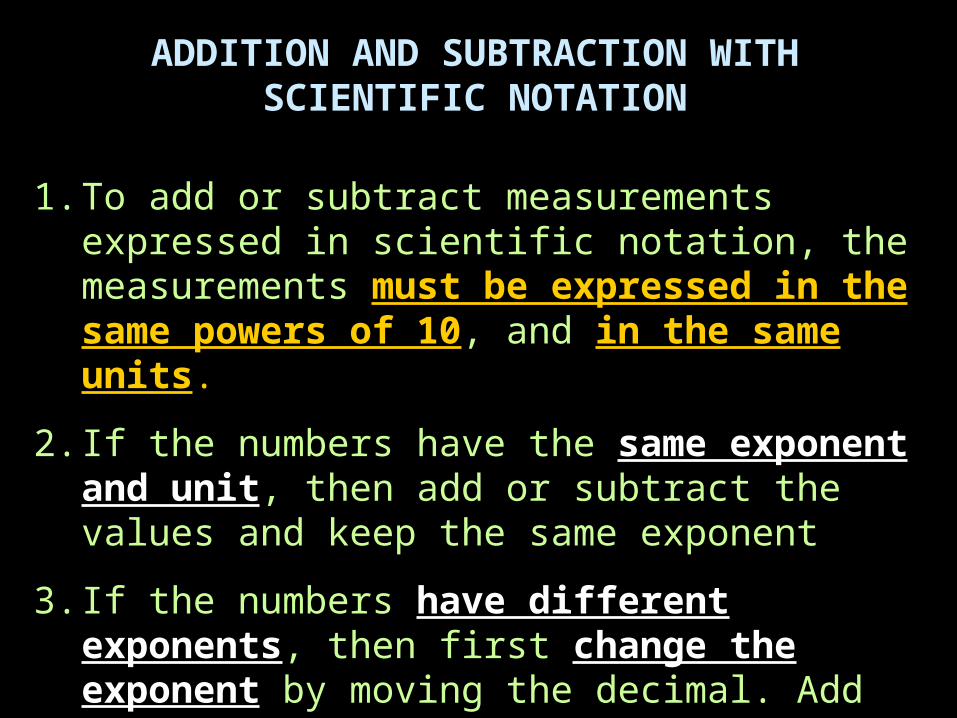
1. To add or subtract measurements expressed in scientific notation, the measurements must be expressed in the same powers of 10, and in the same units.
2. If the numbers have the same exponent and unit, then add or subtract the values and keep the same exponent
3. If the numbers have different exponents, then first change the exponent by moving the decimal. Add or subtract the values, and record your answer in correct scientific notation format.

ADDITION AND SUBTRACTION WITH ADDITION AND SUBTRACTION WITH SCIENTIFIC NOTATIONSCIENTIFIC NOTATION
0.23 x 10⁶
+ 4.32 x 10⁶
4.55 x 10⁶
7.57 x 10⁴ 0.0757 x 10⁶
+ 6.85 x 10⁶ + 6.85 x 10⁶
6.93 x 10⁶
If the powers of ten are the same, then continue to add or subtract.
If the powers of ten are different, then you must first make them the same by moving the decimal, then continue to add or subtract

MULTIPLICATION AND DIVISION WITH MULTIPLICATION AND DIVISION WITH SCIENTIFIC NOTATIONSCIENTIFIC NOTATION
3.6 x 105
x 1.3 x 10-3
4.7 x 10²
4.01 x 10⁷ 1.5 x 10³
5 + -3 = 2
= 2.7 x 1047 – 3 = 4
When multiplying scientific notation you addadd the exponents. When dividing with scientific notation you subtractsubtract the exponents.

PRECISION AND ACCURACYPRECISION AND ACCURACY
Precision describes the degree of exactness of a measurement. Therefore, an instrument that has the smallest scale produces the most precise measurement.
Accuracy describes how well the results of an experiment agree with the standard or known value.

PRECISION AND ACCURACYPRECISION AND ACCURACY
More Precision
Less Precision
Examine the two meter sticks shown. In example the level of certaintycertainty is 0.1 m. The digit that follows is the uncertain estimated digit. In example the level of certainty is .01 m. Example has a greater level of precision.
AA
BB
AA
BBBB

UNCERTAINTYUNCERTAINTY
When making measurements, we often have to estimate the last digit as the above example illustrates. The 8 represents a level of uncertainty. Someone else might read the same measurement as 0.129 or 0.127m.
When a measurement is exact as in the above example (0.30m), it is sometimes necessary to place a “zero” at the end. The zero states that the measurement is not (0.29 or 0.31). It is EXACTLY three tenths of a meter long “0.30m”. Placing a zero at the end of a measurement reduces the uncertainty in that measurement.

PRECISION AND ACCURACY
The estimated value represents the level of uncertainty. If the number “2” was replaced with a “zero”, then “45.870” would be an exact measurement.
SIGNIFICANT FIGURESSIGNIFICANT FIGURES
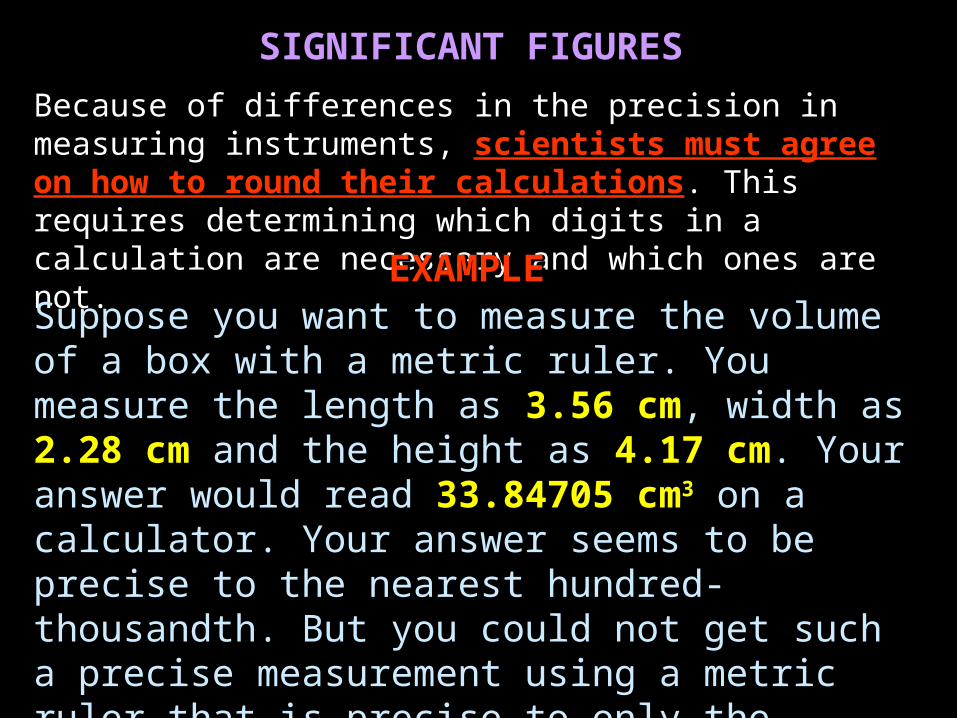
Because of differences in the precision in measuring instruments, scientists must agree on how to round their calculations. This requires determining which digits in a calculation are necessary and which ones are not.
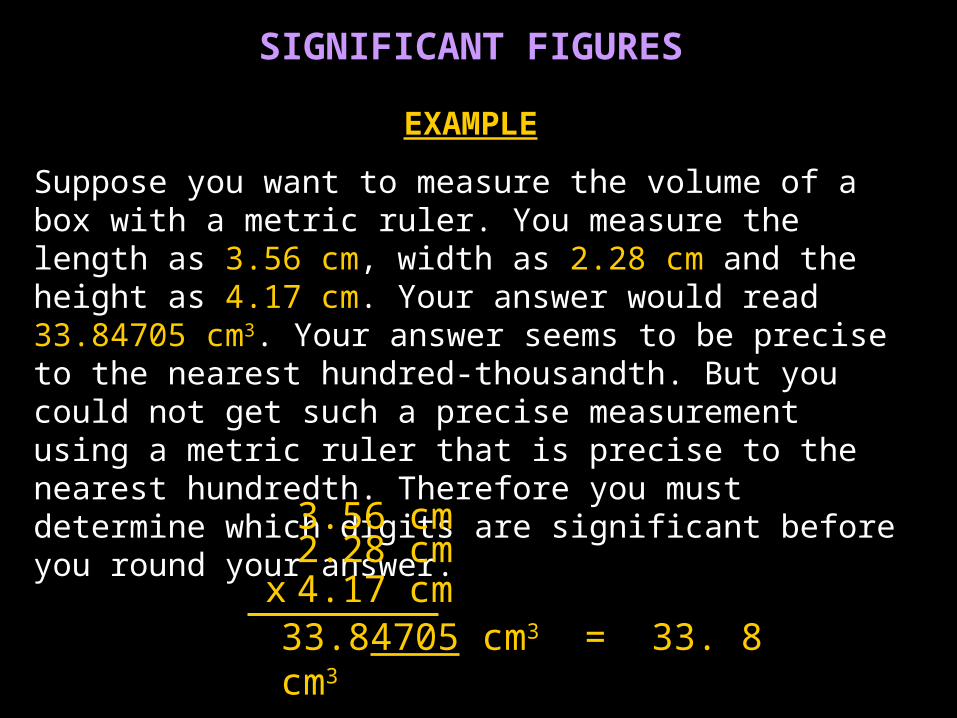
Suppose you want to measure the volume of a box with a metric ruler. You measure the length as 3.56 cm, width as 2.28 cm and the height as 4.17 cm. Your answer would read 33.84705 cm3 on a calculator. Your answer seems to be precise to the nearest hundred-thousandth. But you could not get such a precise measurement using a metric ruler that is precise to only the nearest hundredth. Therefore you must determine which digits are significant before you round your answer.
EXAMPLEEXAMPLE

SIGNIFICANT FIGURES “RULES”SIGNIFICANT FIGURES “RULES”
Significant digits are the valid digits in a measurement that are significant. This includes all nonzero digits, zeros between digits, and zeros after a decimal point. Zeros used as placeholders are not significant.
A) 2.09 m B) 0.0067 m C) 1.00 x10⁶ m D) 45000 m
2323
Significant Figure Website
http://www.chemistry.ohio-state.edu/~grandine/teaching/Chem121/lectures/sigfigs/sigfigs.html

SIGNIFICANT FIGURESSIGNIFICANT FIGURES
ALTERNATE METHOD OF COUNTING SIG ALTERNATE METHOD OF COUNTING SIG FIG’SFIG’S
The A & P method is often used to determine what digits are significant in a number.
P = decimal (P)resent. If the decimal is present, then examine the number from left to right until you reach the first NON zero. All digits that follow are significant.
0.0679100 m = 6 significant figures
A = decimal (A)bsent. If the decimal is absent, then examine the number from right to left until you reach the first NON zero. All digits that follow are significant.
679100 m = 4 significant figures
SIGNIFICANT FIGURESSIGNIFICANT FIGURES
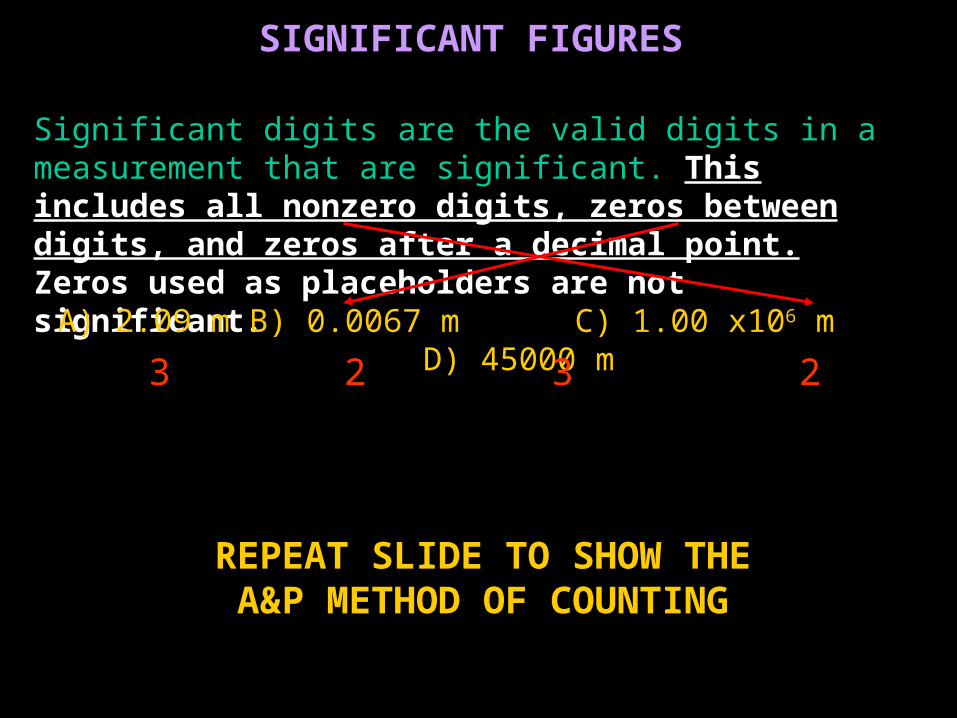
Significant digits are the valid digits in a measurement that are significant. This includes all nonzero digits, zeros between digits, and zeros after a decimal point. Zeros used as placeholders are not significant.
A) 2.09 m B) 0.0067 m C) 1.00 x10⁶ m D) 45000 m
2323
REPEAT SLIDE TO SHOW THE A&P METHOD OF COUNTING

RULES FOR ROUNDING NUMBERSRULES FOR ROUNDING NUMBERS
1. If the numbers to the right of the last significant digit is less than exactlyexactly 5, then round down
1. 224.340 rounded to 0.1 = 224.3
2. If the numbers to the right of the last significant digits is greater than exactlyexactly 5, then round up
1. 224.360 rounded to 0.1 = 224.4
2. 224.351 rounded to 0.1 = 224.4
Significant digits are the valid digits in a measurement
See page 12 in Hurlburt, R. (1994) Comprehending Behavioral Statistics, Brooks/Cole, Pacific Grove, CA
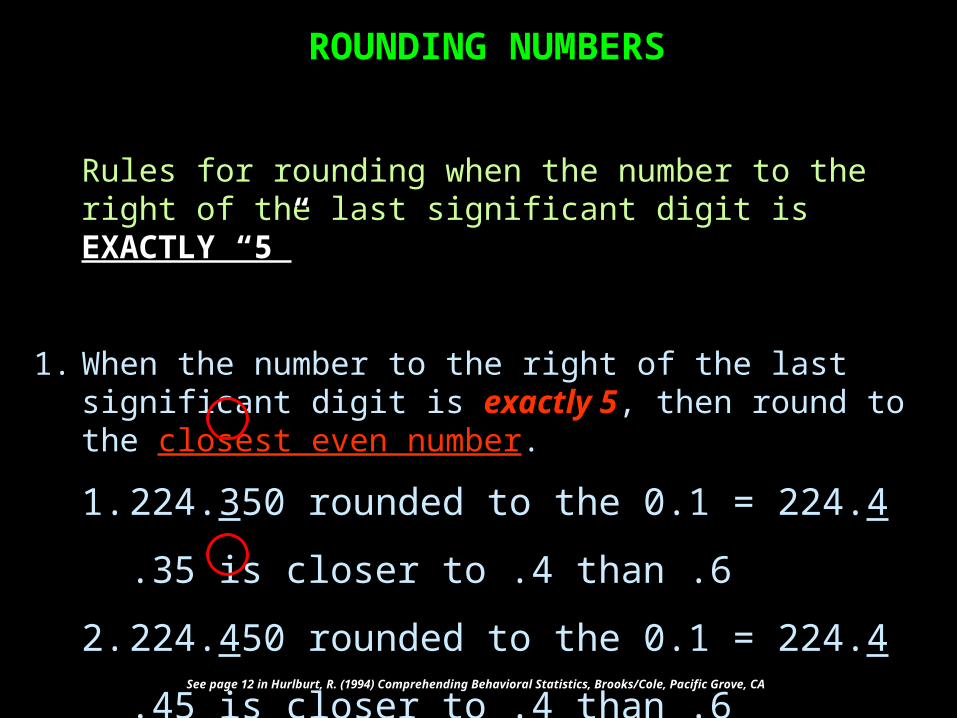
Rules for rounding when the number to the right of the last significant digit is EXACTLY “5”EXACTLY “5”
1. When the number to the right of the last significant digit is exactly 5exactly 5, then round to the closest even number.
1. 224.350 rounded to the 0.1 = 224.4
.35 is closer to .4 than .6
2. 224.450 rounded to the 0.1 = 224.4
.45 is closer to .4 than .6
ROUNDING NUMBERSROUNDING NUMBERS
See page 12 in Hurlburt, R. (1994) Comprehending Behavioral Statistics, Brooks/Cole, Pacific Grove, CA

SIGNIFICANT FIGURES
ADD AND SUBTRACT
3.75 m 2 decimal places+ 43.844 m 3 decimal places 47.594 m = 47.59 m
When combining measurements, your answer can never be more can never be more preciseprecise than the actual measurements. You must round your answer to the correct level of precision.
In addition and subtraction the answer is recorded to the least number of decimal places.
_ 8.055 m 3 decimal places 0.1748 m 4 decimal places 7.8802 m = 7.880 m

SIGNIFICANT FIGURES
MULTIPLY AND DIVIDE
In multiplication and division the rules for significant figures is slightly different.
1. Identify the measurement with the least number of significant figures, not decimal places as is the case with addition and subtraction.
2. Perform the operation and round your answer to the least number of significant figures.
3.22 cm 3 significant figuresx 4.1 cm 2 significant figures 13.202 cm2 = 13 cm2
3.651 m2
3.414 m/s=12.4645 m/s = 12.46 m/s
SIGNIFICANT FIGURES
EXAMPLE
Suppose you want to measure the volume of a box with a metric ruler. You measure the length as 3.56 cm, width as 2.28 cm and the height as 4.17 cm. Your answer would read 33.84705 cm3. Your answer seems to be precise to the nearest hundred-thousandth. But you could not get such a precise measurement using a metric ruler that is precise to the nearest hundredth. Therefore you must determine which digits are significant before you round your answer.
3.56 cm 2.28 cm4.17 cmx
33.84705 cm3 = 33. 8 cm3
GRAPHING
SECTION 1.4
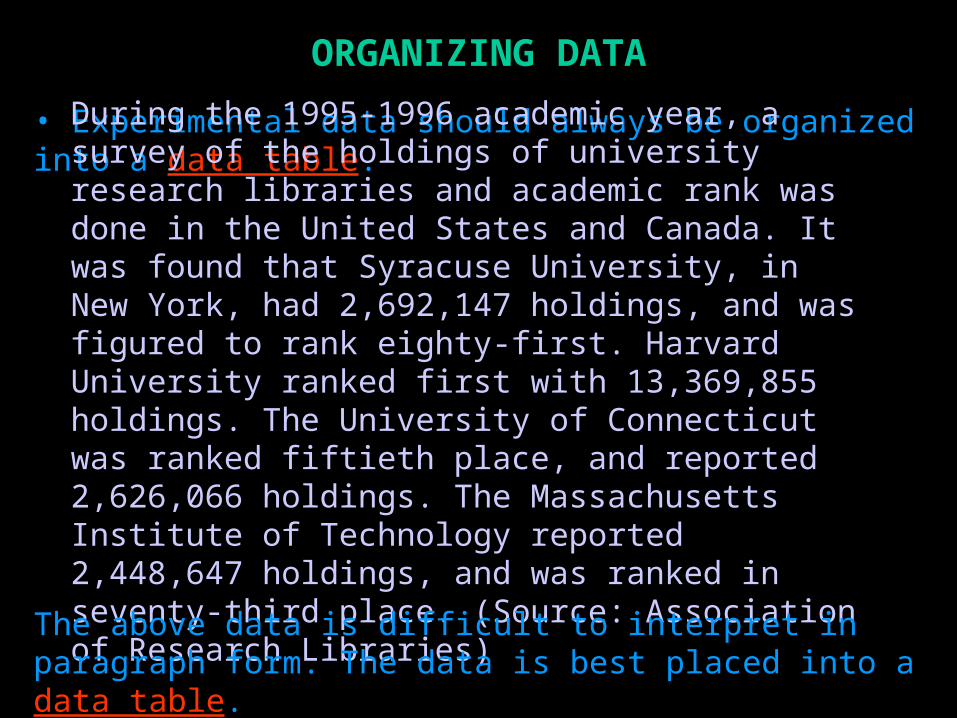
ORGANIZING DATA
• Experimental data should always be organized into a data table.
During the 1995-1996 academic year, a survey of the holdings of university research libraries and academic rank was done in the United States and Canada. It was found that Syracuse University, in New York, had 2,692,147 holdings, and was figured to rank eighty-first. Harvard University ranked first with 13,369,855 holdings. The University of Connecticut was ranked fiftieth place, and reported 2,626,066 holdings. The Massachusetts Institute of Technology reported 2,448,647 holdings, and was ranked in seventy-third place. (Source: Association of Research Libraries)
The above data is difficult to interpret in paragraph form. The data is best placed into a data table.

During the 1995-1996 academic year, a survey of the holdings of university research libraries and academic rank was done in the United States and Canada...
STEP #1
Identify the title information
HOLDINGS AND ACADEMIC RANK OF UNIVERSITY RESEARCH LIBRARIES IN
THE U.S. AND CANADA--1995-1996.
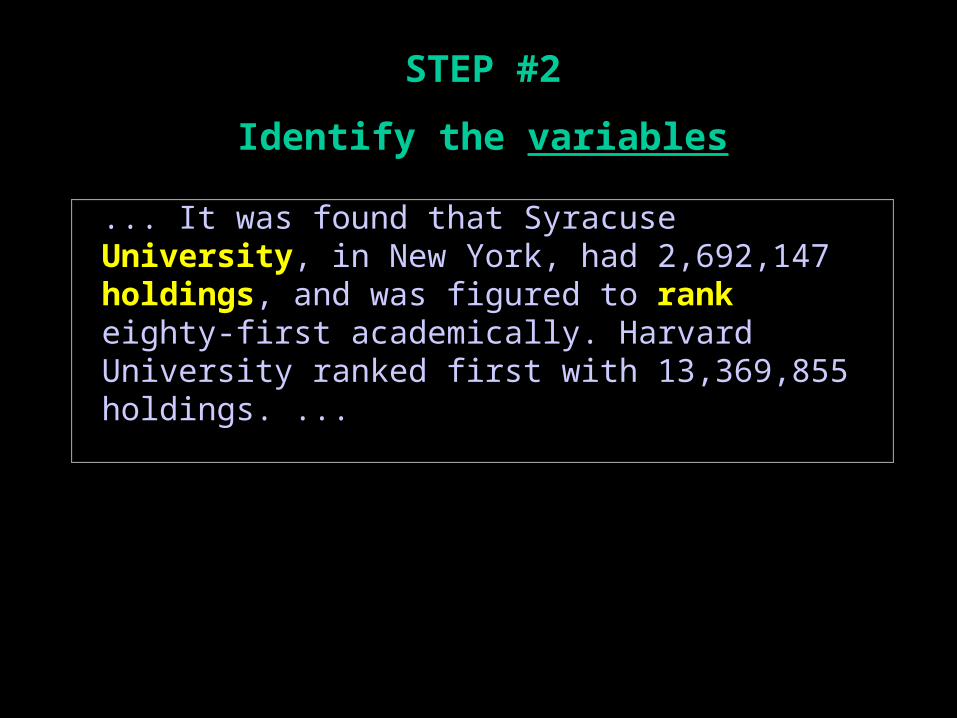
... It was found that Syracuse University, in New York, had 2,692,147 holdings, and was figured to rank eighty-first academically. Harvard University ranked first with 13,369,855 holdings. ...
STEP #2
Identify the variables
HOLDINGS AND RANK OF UNIVERSITY RESEARCH LIBRARIES IN
THE U.S. AND CANADA--1995-1996.
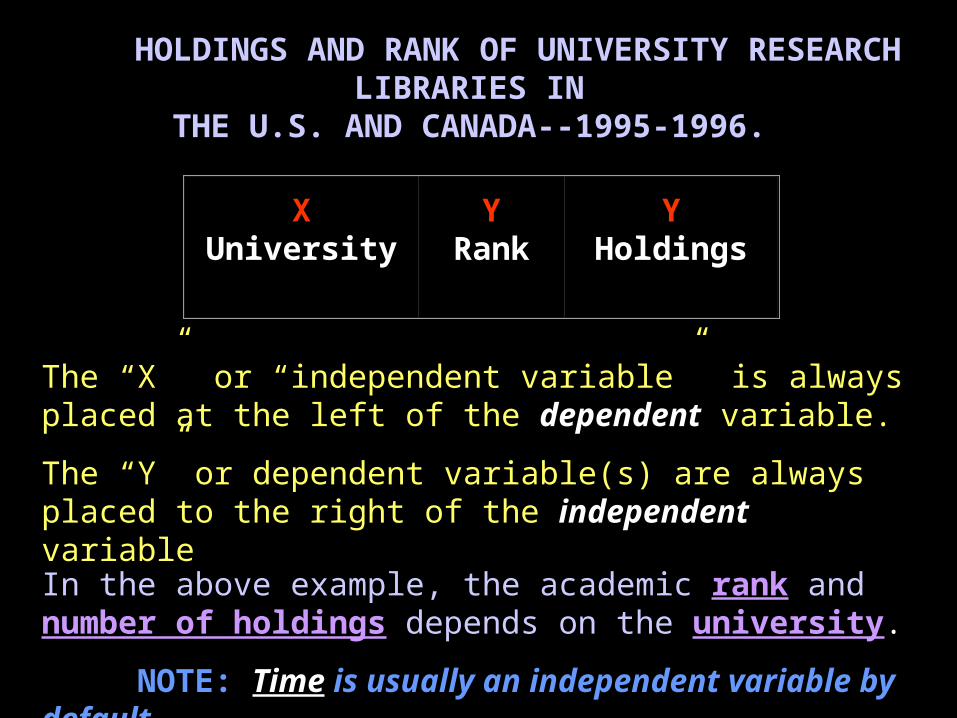
XUniversity
YRank
YHoldings
The “X” or “independent variable” is always placed at the left of the dependentdependent variable.
The “Y” or dependent variable(s) are always placed to the right of the independentindependent variable
In the above example, the academic rankrank and number of holdingsnumber of holdings depends on the universityuniversity.
NOTE: TimeTime is usually an independent variable by default

HOLDINGS AND RANK OF UNIVERSITY RESEARCH LIBRARIES IN
THE U.S. AND CANADA--1995-1996.
University Rank Holdings
Harvard Univ. 1 13,369,855
U. Connecticut 50 2,626,066
Mass. Inst. Tech. 73 2,448,647
Syracuse Univ. 81 2,692,147

Time (min) Soil Temperature ˚C
Heating of Soil
Heating of Water
Time (min) Water Temperature ˚C
X
Y
Y
X
Skills practice pg. 59

Time (min)
Temperature ˚C
Soil Water
Heating of Soil and WaterYX
Skills practice pg. 59
Here the two separate data tables from the previous slide have been combined. Notice that the table is consistent with the (x, y) format commonly seen in math class.

Heating and Cooling of Soil and Water
Time (min)
Heating Temperature ˚C Cooling Temperature ˚C
Soil Water Soil Water
X YY
You can also combine many aspects of an experiment. In the above data table, the heating and cooling effects on soil and water are recorded. The location of the variables shows that the table is consistent with basic math tables for plotting points on a graph (x, y).
Skills practice pg. 59
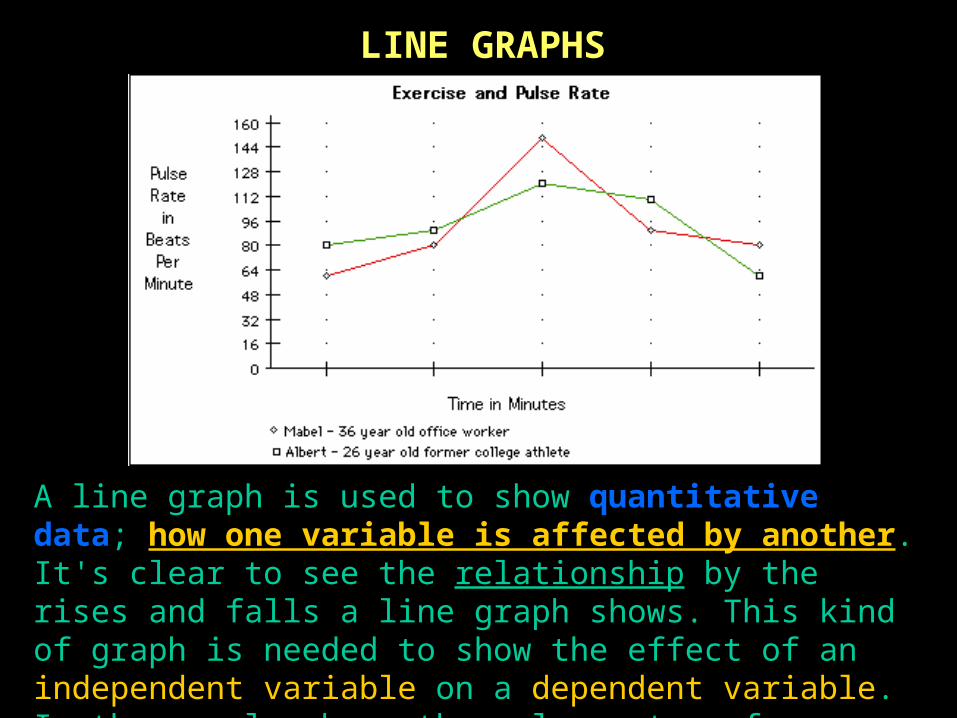
A line graph is used to show quantitative dataquantitative data; how one variable is affected by another. It's clear to see the relationship by the rises and falls a line graph shows. This kind of graph is needed to show the effect of an independent variable on a dependent variable. In the sample above the pulse rates of a young athlete and a middle-aged worker are compared over a period of time
LINE GRAPHS

LINE GRAPHS
There are two independent variables in the above example. Time by default, and the test subjects.
Timeminutes
Pulse RateBeats per minute
Mabel Albert

HEATING OF SOIL AND WATER
0
5
10
15
20
25
30
35
0 1 2 3 4 5 6 7 8 9 10
TIME (min)
TE
MP
ER
AT
UR
E (
Ce
lsiu
s)
SOIL
WATER
Skills practice pg. 59

A bar graph is used to show relationships between groups. Bar graphs are used to represent qualitative dataqualitative data. Qualitative data is extremely varied in nature. It includes virtually any information that can be captured that is not numerical. In the above example the brands of fertilizer are not related. Each brand represents its own separate category
BAR GRAPHS
Y
X
TITLE

Net Exports of Selected Nations
Country
X
Net Exports(in billions of
dollars)
Y Canada 10
France 12
Italy 36
Japan 142
Britain -22
U.S.A-132
Bar graphs can show negative data by extending the “Y” axis into the negative region. The graph is best read when turned horizontally.
Y
X

0
5
10
15
20
25
30
35
TE
MP
ER
AT
UR
E
SOIL WATER
SUBSTANCE
HEATING OF SOIL AND WATERF
INA
LF
INA
L
Skills practice pg. 59

LINEAR GRAPHS
Direct Relationship: A relationship in which the ratio (division or slope) of two variables is constant. A linear “straight line” graph results
Linear graphs: A graph that is represented by a straight line
LINEAR GRAPHS
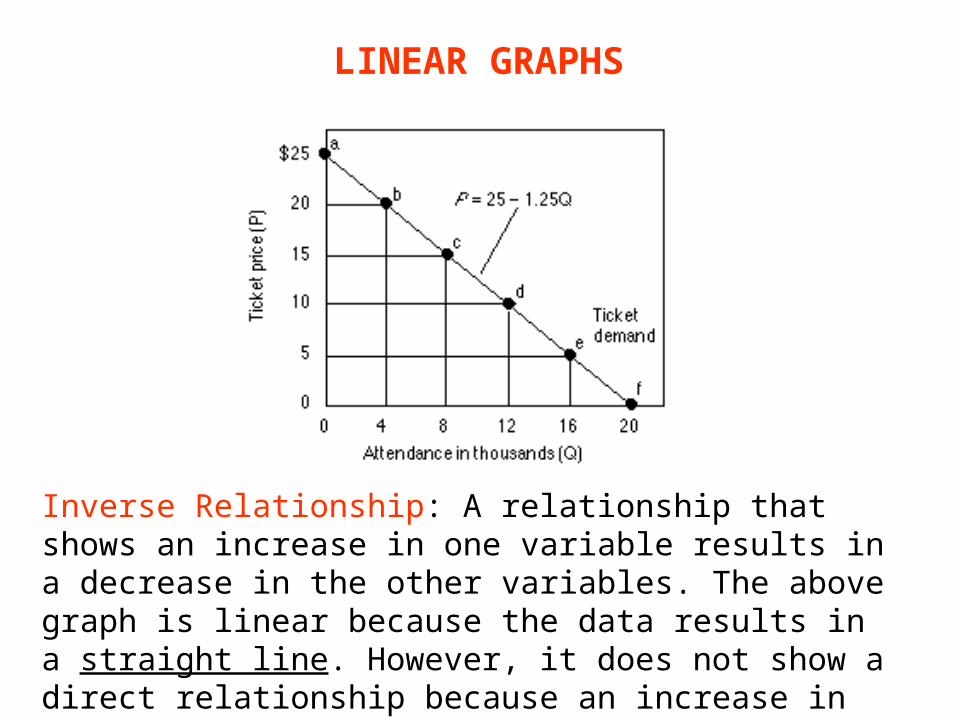
Inverse Relationship: A relationship that shows an increase in one variable results in a decrease in the other variables. The above graph is linear because the data results in a straight line. However, it does not show a direct relationship because an increase in one of the variables does NOT result in an increase in the other.

A circle graph is used to show how a part of something relates to the whole. This kind of graph is needed to show percentages effectively.