what is qla and where to find the data? - lambeth council · –the raise compatible qla data file...
TRANSCRIPT

What is QLA and where to find the data?
Key Stage 2 Question Level Analyses (QLA) for year 7 pupils
Making primary assessment data available to secondary schools for the
start of year 7

Question level analysis
• In 2015 and for the first time all Key Stage 2 tests have been electronically marked
• This includes all versions of tests for
– Reading
– Mathematics
– English grammar punctuation & spelling
• The question level data for these tests is available to secondary schools through NCA tools

Enabling RAISEonline • Schools download two files from NCA tools
– A Common Transfer File (CTF) of year 7 pupils (matched by their UPN)
– The RAISE compatible QLA data file for year 7 pupils
• The RAISEonline school administrator can then import first the CTF and then the QLA data file into RAISEonline using data management functionality
• The RAISEonline school administrator may set up other school users (subject leaders, heads of year, teachers etc) enabling them to access this information/analyses

QLA analyses available (English)
• KS2 reading 2015 paper
• KS2 reading level 6 2015 paper
• KS2 English grammar punctuation & spelling 2015 paper
• KS2 English grammar punctuation & spelling level 6 2015 paper
• KS2 EGPS (spelling section) 2015 paper
• KS2 EGPS (spelling section) level 6 2015 paper

English paper analyses
• All papers can be analysed by mark point across a cohort
• Reading can be analysed by assessment focus
• English grammar punctuation & spelling can be analysed by named reference/strand
• Pupil lists can be produced for each paper and from these individual pupil reports can be generated

QLA analyses available (mathematics)
• KS2 mental mathematics 2015 paper
• KS2 mathematics test A 2015 paper
• KS2 mathematics test B 2015 paper
• KS2 mathematics 2015 level 6 paper 1
• KS2 mathematics 2015 level 6 paper 2

Mathematics paper analyses
• All papers can be analysed by mark point across a cohort
• All papers can also be analysed by attainment target or topic
• Pupil lists can be produced for each paper and from these individual pupil reports can be generated
• These analyses allow teachers to identify strengths and possible areas for development for cohorts and individual pupils

How to get the data from NCA tools
Sourcing the two files for use with RAISEonline
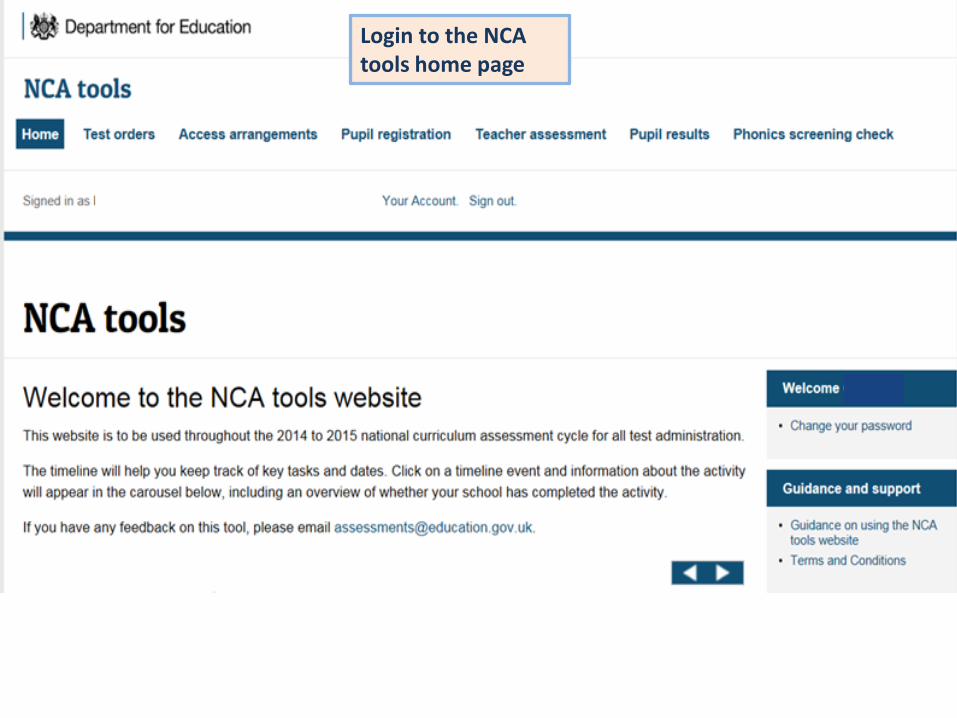
Login to the NCA tools home page

Click on ‘pupil results’

The school year 7 UPN list should be copied into the search box Note that you can only search for up to a limit of 300 UPNs at one time (if you have more than 300 pupils we suggest doing two separate downloads of the CTF and QLA data)

When you have added your UPN’s click on search

When the search is completed, records found and not found are displayed
Here are the download formats available. You will download a CTF file first.

This is an example of a common transfer file (CTF) which contains sensitive information. This will be used to populate RAISE with your current year 7 pupils. This will need to be saved to a safe, secure location ready for uploading to RAISEonline
Note that common transfer files are always in .xml format

Now download the ‘RAISE online upload spreadsheet’ which contains all the question level data for the matched pupils (as above)

This is an example of the RAISE upload file (.xls) which contains every question response for every pupil for all the tests they have taken at KS2 This will need to be saved to a safe, secure location ready for uploading to RAISEonline

How to import the QLA data into RAISEonline
Import two files, the CTF first (to populate the year 7 pupils) and the question level analyses file
second (to attach their KS2 year 6 QLA data)
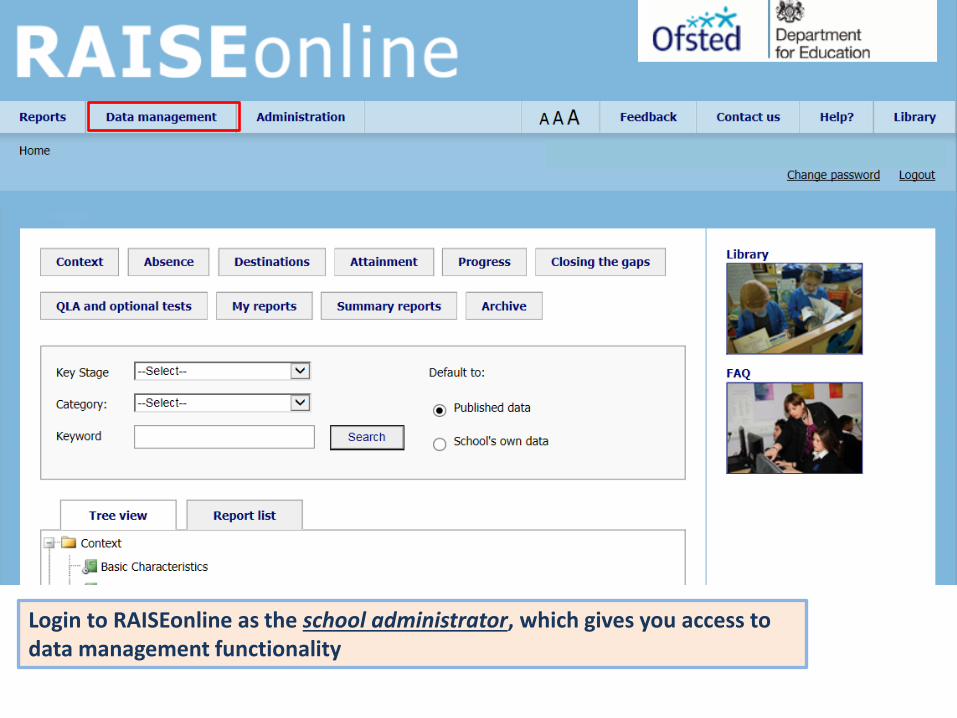
Login to RAISEonline as the school administrator, which gives you access to data management functionality

The data management screen
Click to import the CTF first

Uploading the CTF
Select 2014/2015 and QLA
Browse to the location of your CTF (which has a .xml file extension) and then click ‘upload file’
Pupils will be loaded into the academic year 2014/15 as year 6 pupils (as they were at the time of the test)

Large CTFs may take some time to upload. This message will change to show when the process is completed
When the upload has finished click ‘view report’ for any errors

This CTF file upload has been successful. The next stage is to run confirm updates.
This processes the data.

Return to the data management home page
where you will be prompted to click confirm updates
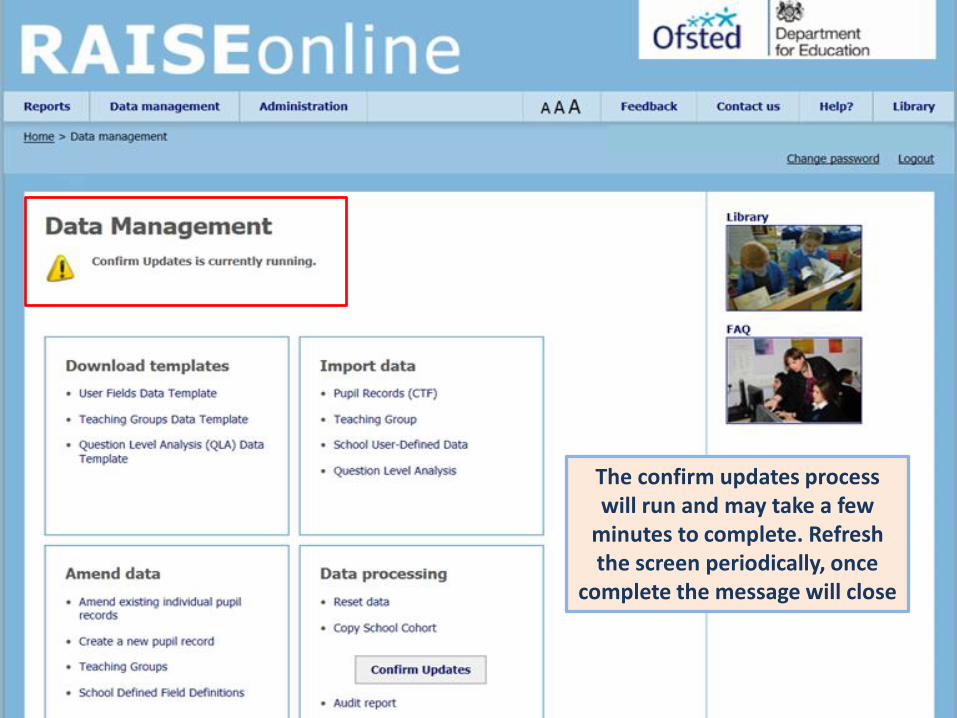
The confirm updates process will run and may take a few
minutes to complete. Refresh the screen periodically, once
complete the message will close

Uploading the RAISEonline question
level data file

Under import data click on ‘Question level analysis’

Browse to the location where you have saved the ‘RAISEonline
upload spreadsheet’ and click upload file

The RAISEonline upload spreadsheet will take a few moments to load. Once this is complete your data will be available for analyses

How to use RAISEonline question level analyses
Examples of analysing results

Selecting this option will open up all of the available question level analysis

Select the cohort that you want to analyse, academic year, subject and test paper

In the example above we have chosen the year 6 2014/15 cohort (this is the correct selection for secondary schools). We have then selected the subject ‘mathematics’ which has enabled the above selections of all papers and the individual papers

We have selected ‘Maths Level 6 Paper 1’ and within the breakdown we can choose attainment target, mark point or topic. Once the breakdown is selected we can choose the report type

We have selected ‘attainment target’ which enables two reports, either a pupil list or a school summary

Once all selections have been made ‘Display Report’ is enabled

The analysis above is by attainment target showing the percentage correct response for the school cohort in red alongside the national in chequered red. Clicking on the arrow above takes you to the second page of the report

The report options (subject, test paper, breakdown and gender) can all be changed here
This sections shows the attainment targets, how many marks were available for each of them, the school percentage correct response, the national percentage correct response, the difference between the two and the percentage attempted alongside the difference with the national. Using the breakdown option we can then drill down on this information to see the performance across topics

Topic information is displayed in the same way as attainment targets. A note at the bottom informs users that certain questions within this test relate more closely to the KS3 programme of study

Clicking on gender shows school and national data for boys and girls
The school data within the report can also be filtered by the census information (disadvantaged, SEN, Ethnicity etc) A school could also filter by school defined groups (intervention, booster etc) or teaching groups. These can be set up within the data management section. Clicking on ‘Related Analyses’ will allow users to navigate to a pupil list or markpoint report

Markpoint analyses show the school data for each individual item/question alongside the relevant national data Users can click on the arrows to sort the columns

This example has been sorted on the difference between the school and the national for each item/question In the example the % correct response for the school for this item (4b) is 20% whereas national is 68% (a difference of -48) Clicking on the question will take users to the question within the test script


National data is displayed for each of the topics and individual pupil data is listed below. Clicking on a pupils result takes us to an individual pupil report
Pupil list report

This information is available for all pupils that took the test. The radar graph shows the pupil performance in the topics against the national with the data displayed in the table below