what is physics? dictionary: “the study of matter, energy, and the interaction between them”...
TRANSCRIPT
What is Physics?
Dictionary:“the study of matter, energy, and the interaction between them”
Physics answers the questions 3 year olds ask – WHY??
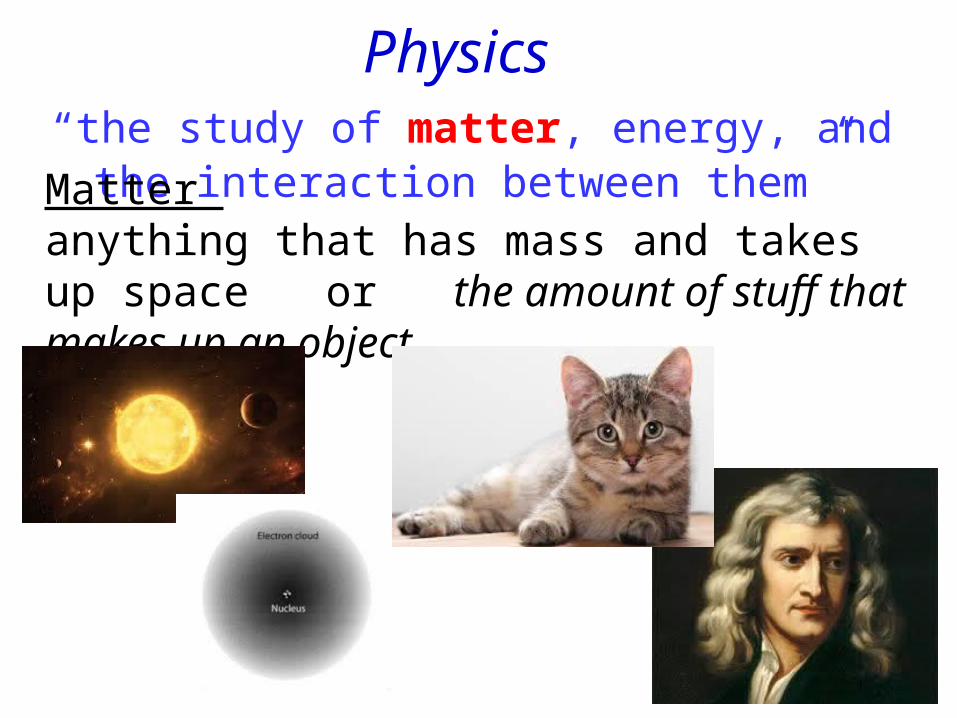
Physics “the study of matter, energy, and the
interaction between them”Matter anything that has mass and takes up space or the amount of stuff that makes up an object

Physics “the study of matter, energy, and the
interaction between them”
Energy - Ability or capacity to do work
Work – process of moving an object
Energy - Ability or capacity to move an object

Physics “the study of matter, energy, and the
interaction between them”

Physics “the study of matter, energy, and the
interaction between them”
Key concept of course
The source of all energy on Earth is the conversion of mass into energy
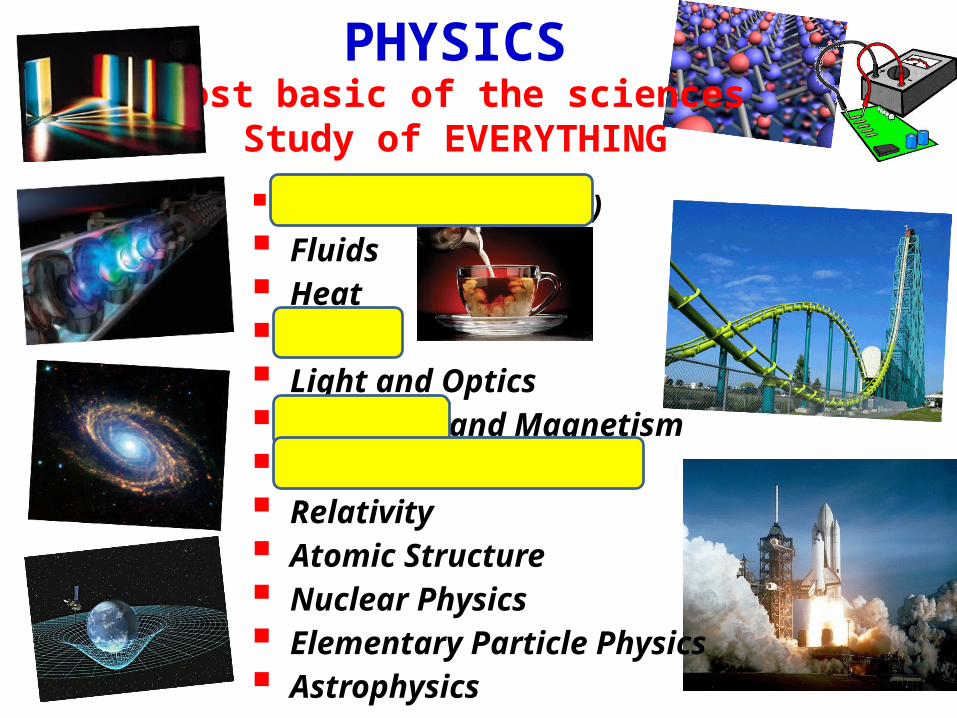
PHYSICSMost basic of the sciences
Study of EVERYTHING
Motion (mechanics) Fluids Heat Sound Light and Optics Electricity and Magnetism Waves and Oscillations Relativity Atomic Structure Nuclear Physics Elementary Particle Physics Astrophysics

Science is NOT just a mechanical process of
collecting facts and making theories
It is a CREATIVE PROCESS


SI base unitsQuantity SI unit symbol
Length meter mMass kilogram kgTime second s
Electric current ampere Atemperature kelvin K
Luminous intensity candela cdAmount of substance mole nol
Dimensions and units
All other units can be derived from the 7 base
units
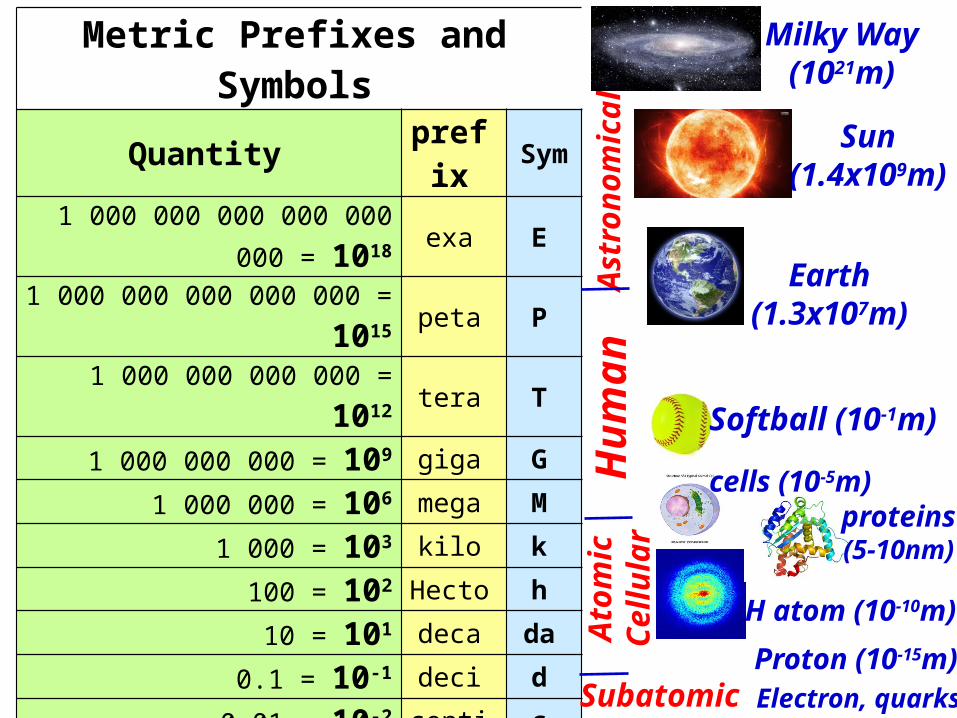
Metric Prefixes and SymbolsQuantity prefix Sym
1 000 000 000 000 000 000 = 1018 exa E1 000 000 000 000 000 = 1015 peta P
1 000 000 000 000 = 1012 tera T1 000 000 000 = 109 giga G
1 000 000 = 106 mega M1 000 = 103 kilo k
100 = 102 Hecto h10 = 101 deca da
0.1 = 10-1 deci d0.01 = 10-2 centi c
0.001 = 10-3 milli m0.000 001 = 10-6 micro m
0.000 000 001 = 10-9 nano n0.000 000 000 001 = 10-12 pico p
0.000 000 000 000 001 = 10-15 femto f0.000 000 000 000 000 001 = 10-18 atto a
H atom (10-10m)As
tron
omic
alH
uman
Atom
icCe
llula
r
SubatomicProton (10-15m)
Earth(1.3x10⁷m)
Sun(1.4x10⁹m)
Softball (10-1m)
Milky Way(1021m)
Electron, quarks
proteins(5-10nm)
cells (10-5m)

Scientific Notation: Used to express very large or very small numbers. Based on powers of 10
Examples:
20,000 = 2 x 10,000 = 2 x (10 x 10 x 10 x 10) = 2 x 10⁴
487,100,000 = 4.971 x 10⁸
0.000000582 = 5.82 x 10⁻⁷
move decimal left 8 times
move decimal right 7 times

Scientific Notation:
Try these
5.3 x 10-3 =
6.34 x 105 =
5.56 x 107 =
0.0053
634000
55600000
Try these
351000 =
0.00000877 =
3.51 x 10⁵
8.77 x 10⁻⁶

Rules for multiplication and division in Scientific Notation:
Multiplication1. Multiply
coefficients2. Add exponents
1211)38(38 106.11016)10)(82()108)(102( xxxxx
Division1. divide coefficients2. subtract exponents
5)38(3
8
3
8
103)10(310
10
2
6
)102(
)106(x
x
x

Express in Scientific Notation:
(5 x 10⁻⁵)(7 x 10¹⁰) =
(5 x 10⁻⁵)(8 x 10¹⁰) (4 x 10⁴) =
3.5 x 10⁶
1.6 x 10¹¹
5 x 10¹⁰
81 x 10-12
4
7
108
104
x
x
43)103( x

Dimensional Analysis
1 inch = 2.54 cm 1 cm = 10 mm
How many cm long is a 100 yard football field?
problem-solving method that uses the fact that any number or expression can be multiplied by one without changing its value
cmin
cmx
ft
inx
yd
ftyd 9144
1
54.2
1
12
1
3100

Dimensional Analysis1 inch = 2.54 cm 1 cm = 10 mm 5280ft = 1mi
1. A fish tank is 20in x 12in x 12in. What is its volume in mm3?
2. The speed of light is 3 x 10⁸ m/s. What is the speed of light in mph?
4.7 x 107 mm3
6.7 x 10⁸ mph

Being able to manipulate formulae to solve for a variable is an extremely important skill in Physics. It is done to isolate a single variable to make problem solving easier. The formulae below are a few used during the course. Manipulate the variables algebraically and solve for the variable indicated.
_________________,2
_________________,
_________________),(2
2
1
020
2
2
gg
LT
rr
mmGF
axxavv
g

The following are ordinary physics problems. Place the answer in scientific notation when appropriate and simplify the units.
Algebra Review
____________,sin50.10.25sin33.1
100.2
105.42
)32.0(
)106.9)(102.3()100.9(
2
2
2
3
2
2
999
o
s
kg
CmN
g
x
kgxT
m
CxCxxF

Right Triangle TrigonometryUsing the generic triangle
to the right, Right Triangle Trigonometry and Pythagorean Theorem solve the following. Your calculator
must be in degree mode.
a) q=55o and c=32m. Solve for a and b
b) a=250m and b=180m. Solve for θ and c.
SOHCAHTOA

Graphing and Analyzing Data

Variables
• Any factor that might affect the behavior of an experiment.
• Independent Variables– Factor that is changed or manipulated during the
experiments – Always plotted on the x-axis– Time is usually the independent variable
• Dependent Variables– Factor that depends on the independent variable– Always plotted on the y-axis

Collecting and Recording Data
• At least 6 data points are necessary for a good graph.
• Raw data is recorded in a data table immediately as it is collected in the lab.
• Independent variable should cover a range of at least 10 fold if possible (eg. 0.2 to 2.0 m)
• Data Table– Construct data table before collecting the data– Independent variable in leftmost column of
data table– Every column is labeled with the variable
name being measured with the units in parentheses• Values in table do not have units.
– All data should be recorded with appropriate sig figs to indicate the precision of measurement (Same number of decimal places in each column)

Preparing the Data
• Raw data might have to be “prepared” before graphing
• If multiple trials were done, average the trials together to determine a representative value.
• An entry in your formal table that is a result of a calculation must include an explanation of the column and a SAMPLE CALCULATION

Graphing Data • Purpose
Determine relationship between two variables
• Plot data as scatter graphs (do not connect the data points)
• Graphs
–Always include Title (in WORDS)DEPENDENT vs. INDEPENDENT variable
– Label each axis with the variable and the UNITS
– Recognize common relationships in graphs
– Connect the data points with a line/curve of best fit to show the relationship between variables

Graphing Data
0 2 4 6 8 100
5
10
15
20
m (kg)
F (
N)
Force Applied vs. Mass
Direct Relationsh
ip
Title(word
s)
Axes labeled with
variable symbols
(not words) and units
F=2m
Dependent variable
Independent variable

Graphical Analysis
• Four Basic Relationships– No relation– Linear Relations
and Direct Relationship– Square Relations– Inverse or Hyperbolic Relations
• Develop mathematical model– Equation of best fit to graphed data
tconsy tanbmxy
cbxaxy 2
x
ay
mxy