what is a “good” social network for a system?: the flow … of know-how for organizational...
TRANSCRIPT

WORKING PAPER #48
What is a “Good” Social Network for a System?: The Flow of Know-How for Organizational Change
Kenneth Frank Michigan State University
April 2014
The content of this paper does not necessarily reflect the views of The Education Policy Center or Michigan State University
What is a “Good” Social Network for a System?: The Flow of Know-How for Organizational Change
Author Information Kenneth Frank Michigan State University
Abstract
This study concerns how intra-organizational networks affect the implementation of policies and practices in organizations. In particular, we attend to the role of the informal subgroup or clique in cultivating and distributing locally adapted and integrated knowledge, or know-how. We develop two hypotheses based on the importance of intra-organizational coordination for an organization’s capacity for change. The first emphasizes the importance of distributing know-how evenly to potential recipient subgroups. The second emphasizes the importance of restricting know-how to flow from high know-how subgroups. We test our hypotheses with longitudinal network data in 21 schools, finding stronger support for the second hypothesis than the first. Our findings can help managers cultivate know-how flows to contribute to organizational change.

This work was supported in part by funds from the Education Policy Center at Michigan State University
1
What is a “Good” Social Network for a System?:
The Flow of Know-How for Organizational Change
Kenneth Frank
Michigan State University
INTRODUCTION
Implementation research focuses on how practice shapes the effects of policies
(Berman & McLaughlin, 1975; Cohen, Moffitt, & Goldin, 2007; Majone & Wildavsky,
1977; Werner, 2004). In the 1960s, implementation research focused principally on
whether policies were implemented as intended. But beginning in the 1970s,
implementation researchers began to document what practitioners know that policy makers
cannot and how practitioners use that know-how to change policy in practice.
Implementation research began to focus as well on the concerted efforts of local
implementers to make sense of policies through social interaction that shaped individuals’
decisions about how to respond to new policies (Weick, 1995; Weick, Sutcliffe, &
Obstfeld, 2005).
In the example in this study concerning educational policies, implementation is
especially dependent on the collective sensemaking of school personnel. Sensemaking is
critical because high level policy, at least historically, is only loosely coupled to classroom
practice (Bidwell, 1965; Meyer & Rowan, 1977; Weick, 1976). We recognize that in the
past decade accountability systems have tightened the relation between policy and practice

What is a “Good” Social Network for a System
2
by incentivizing new forms of coordination and collaboration among teachers and
administrators to share know-how that can improve student outcomes ( Spillane, Parise, &
Sherer, 2011). But even in this context, “learning supports” that include opportunities for
teachers to interact with one another are key for teachers to implement new policies and
programs (e.g., Cohen & Hill, 2001).
Though past research has pointed to the importance of facilitating interaction
among those who possess diverse forms of know-how (Schumpeter, 1934) and on reducing
transaction costs among dependent actors with common social contexts and cognitive
schema (Williamson, 1981), the structure and nature of interactions required to support
policy implementation is not well understood. Some accounts privilege the density of
interactions among individuals as an ideal, but maximizing interactions heightens
transaction costs associated with maintaining the network (Hislop, 2005). Other accounts
stress the importance of linkages between informal subgroups or cliques in which
interactions are concentrated, but do not specify which bridges are best to build. With
respect to what kinds of social interactions support policy implementation, “What is a good
network?” is at least partly an open question.
Example: The School as a Social System
The implementation of innovations in schools has proven vexing for reformers and
organizational theorists alike (Elmore, Peterson, and McCarthey 1996; Tyack and Cuban 1995).
Part of the challenge is due to the importance of local networks on teachers’ practices (e.g.,
Bidwell, 2000, 2001). This creates variability in practices that cannot be explained easily by
What is a “Good” Social Network for a System
3
factors external to a school. In this way schools are similar to other organizations whose workers
draw on networks to adapt innovations to local contexts (Bidwell and Kasarda, 1987).
Perhaps it is the importance of informal processes in schools that has prompted
organizational theorists to give considerable attention to schools (Bidwell and Kasarda, 1987;
Bolman and Heller, 1995; Perrow, 1986). In particular, schools have been used in the
development of theories of organizational control (Callahan, 1962), contingency (e.g.,
Greenfield, 1975), new institutionalism (Meyer and Rowan, 1977; Rowan, 1995) and social
capital (Bryk and Schneider, 2002; Spillane et al., 2003; Leana and Pil, 2006; Frank, Zhao and
Borman, 2004). We will return to this thread too discuss how our findings relate to other
organizations.
Some have taken the importance of the school as a social institution to focus on
educational and policy issues of curriculum (e.g., Schmidt et al., 2011), academic tracking (e.g.,
Gamoran, 1987; Oakes 1985), or testing (e.g., Hanushek and Raymond, 2005). But these foci do
not attend to the internal social dynamics of schools, especially of the school faculty (Bidwell,
2000, 2001). Such dynamics can have direct effects on teachers’ practices which are the primary
work activities in schools (e.g., Cohen, Raudenbush and Ball, 2003; O'Day, 2002).
In this study, we draw on the literature in business and management as well as sociology
to relate the internal social dynamics of the school personnel to the capacity of the school to
implement changes. In particular, we attend to the importance of emergent subgroups of teachers
as teams (Marschak and Radner, 1972; Reagans and Zuckerman, 2001; Reagans and McEvily
2003) that can locally adapt and integrate knowledge, creating what we refer to as know-how. In
turn, this know-how can be used by others members of their organization (e.g., Hansen, 1999;
Nahapiet and Ghoshal, 1998; Nonaka, 1994; Szulanski, 1996; Von Hippel, 1994).

What is a “Good” Social Network for a System
4
Anticipating our key results, we find that the more know-how flows from a restricted set
of subgroups, the greater the organizational change. In particular, schools are better able to
implement changes when only a few subgroups in the school are responsible for providing know-
how to the rest of the school. In contrast, there is no effect of the dispersion of know-how flows
to potential receiving subgroups on organizational change. Schools can implement innovations to
some degree even when some subgroups have more access to know-how than others. This
provides an initial glimpse into the relationships between the flow of know-how and
organizational change.
In the next section we describe the organizational context in which know-how is
created within subgroups and then flows between subgroups. We then describe how we
quantified the potential for know-how to flow and how we tested our hypotheses using
longitudinal social network data in 21 schools engaged in whole-school reform efforts
(e.g., including literacy, technology integration, using data to guide improvements to
instruction). We then present our results, including descriptive statistics, regression
analyses, graphical representations and sensitivity analyses. We discuss our results in
terms of the flows of know-how through social structures, implications for other
organizations, the role of the manager and we identify limitations.
BACKGROUND
The Organizational Context of the Flow of Know-How

What is a “Good” Social Network for a System
5
The flow of know-how is important in organizations such as schools which rely on
complex production involving extensive coordination, extensive local adaptation, or both
(Simon, 1965; Thompson, 1967; Williamson, 1981; Woodward, 1965). In schools, the
complexity is due to multiple forces: variability in student needs, which can influence decisions
about what and how to teach (e.g., Barr and Dreeben 1983; Delpit 1988); conflicts among
organizational demands that arise from policies enacted at different levels of organization (e.g.,
Bidwell and Kasarda 1987; Honig, 2006); varying levels of coherence among curriculum,
pedagogy, and assessments (Borman et al. 2003; Schmidt 2001); and from teachers’ unique
educational trajectories, which exposes them to varying educational approaches (Lortie 1975;
Coburn, 2004). As a result, teaching is complex because teachers must both adapt practices to
local contexts and coordinate with each other as they do so (Bidwell, 1965; Thompson, 1967;
Woodward, 1965; Zhao and Frank 2003).
Consider the teacher below describing a routine of explanation concerning the
implementation of a new pedagogy (Coburn and Russell 2008, page 218):
We talked about, like, the math message and the mental math and how to coordinate the two and that we should be linking the message to the initial onset of the mini lesson and how those two are connected and that that would get the children eventually into their individual work and that we should connect them and that the math messages is separated from the mental math after it’s done until we go back to it and use that as a lead in for the lesson.
Note that the new approach, math message, must be coordinated with the old, mental
math, creating a locally defined complex task. The complex task is then articulated and know-
how shared through the teachers’ talk pertaining to how to implement the new approach,
motivate the children, differentiate the approaches, and structure the lesson. Each of these tasks
depends on the local context defined by the students, curricula, and organizational context, which

What is a “Good” Social Network for a System
6
in this case included a math coach to whom the teacher was describing her interactions.
Consistent with the quote above (Coburn and Russell, 2008), the know-how teachers access from
one another has been shown to be essential for implementation of computer technology and
schoolwide reforms into teachers’ classroom practice (e.g., Frank, Zhao and Borman, 2004;
Frank et al., 2013; Frank et al., 2011; Penuel et al., 2012; Penuel et al, 2007).
Diffusion at the Level of the Social System
In this study, we extend the above findings from individual teachers to the level of the
organization by analyzing how interactions are shaped by subgroups. Here we define subgroups
by their concentrations of interactions among a set of actors. Less formally, subgroups can be
thought of as cliques. Within subgroups, dense interactions support knowledge sharing and
norms that are likely to create relatively homogenous action (Nonaka, 1994; Yasumoto, Uekawa,
and Bidwell, 2001). Therefore, we focus on interactions between subgroups which more likely
contribute to variation in the practices related to the implementation of an innovation. .
To gain intuition about how subgroups can shape diffusion within an organization,
consider Frank and Zhao’s (2005) graphical representations of the diffusion of teachers’ use of
technology through the intra-school networks in Westville School. Frank and Zhao began by
representing the social structure of close collegial ties (in response to the question: “who are your
closest colleagues in this school?”) within cohesive subgroups as in the crystallized sociogram
Figure 1. In Figure 1, each number represents a teacher or administrator, and the text following
the number indicates the grade in which the teacher teaches (e.g., G3 indicates grade 3, MG
indicates multiple grades, and GX indicates unknown grade). The subgroup boundaries were

What is a “Good” Social Network for a System
7
identified by Frank’s (1995, 1996) KliqueFinder algorithm and are represented by circles around
subsets of school personnel. The lines connecting pairs of personnel indicate that at least one
member of the pair listed the other as a close colleague (solid lines within subgroups, dotted lines
between subgroups).
Insert Figure 1 about here
The social structure represented in Figure 1 can be used to characterize the diffusion of
an innovation such as implementation of technology in the classroom. Just before the data in
Figure 1 were collected, Westville’s school district switched from the Macintosh to the Windows
platform. This created an organizational challenge for the school which did not have much
expertise in Windows. As an initial response, school administrators secured the re-assignment of
teacher 2, an expert in Windows, to Westville.
The challenge for the school was then to circulate teacher 2’s know-how. To understand
how teacher 2’s know-how flowed, consider Frank and Zhao’s (2005) Figure 2. In this Figure
actors and subgroups are located based on the pattern of close collegial ties in Figure 1. But the
lines now indicate talk and help with technology between time 1 (spring 2000) and time 2 (spring
2001). Furthermore, each actor’s identification number has been replaced with a dot
proportional to his or her use of technology in the classroom at time 1 (an * indicates no
information available). The ripples then represent increases in the use of technology from time 1
to time 2, with each ring corresponding to an increase of .2 standardized units.
Insert Figure 2 about here
Figure 2 shows how teacher 2’s know-how flowed first among the dense concentration of
close collegial ties within subgroup B, then to subgroup C through a specific bridging tie formed

What is a “Good” Social Network for a System
8
between teacher 2 and teacher 20, and then through teacher 20 to subgroup A. 1 Teacher 20’s
interactions with members of subgroup A were then associated with large changes in their
implementation of technology (as indicated by ripples around the three teachers who received
help from teacher 20). This emphasizes the value of resource flows that bridge between
subgroups for an organization’s capacity for change (Burt, 2005; Tsai, 2001).
Generating Hypotheses: Bridges to Where?
The previous analysis raises the question: From the system perspective, once a tie crosses
the subgroup boundary, with which others should it optimally form to support an organization’s
capacity for change? Should the ties between subgroups be uniformly distributed? If they
should be targeted, on what basis?
We develop two hypotheses, each of which stems from the fundamental dynamic of
classroom learning. In particular, learning is more effective when learners encounter a
1 While the diffusion of know-how throughout Westville elementary may appear a success, the organization was in fact extremely challenged because of its social structure. In particular, note that there were no close collegial ties between subgroup B containing most of the second grade teachers and subgroup A containing most of the third grade teachers. This subdivision reflected the history of the school – it was consolidated from two previous schools, with grade 2 teachers coming from one school and grade 3 teachers from another. Furthermore, the grades were assigned, for the most part, to separate wings of the school.
The lack of collegial ties between subgroups A and B created severe coordination challenges for the teachers which in turn created challenges for the students, especially as they transitioned from grade 2 to 3. It also created competition for resources. Although the challenges were overcome in the particular case of technology implementation via the bridging ties of actor 20, in general these challenges were not overcome, and Westville was reconfigured (to include only first grade) shortly after the time the data in Figures 1 and 2 were collected. This highlights the role of the organization in structuring the flow of resources which can ultimately be related to survival.

What is a “Good” Social Network for a System
9
coordinated set of teaching practices that is coherent with respect to instructional aims and
strategies (e.g., Newmann, Smith, Allensworth, & Bryk, 2001). This allows understanding to
build over time, and in relation to core ideas and practices in disciplines taught in school (e.g.,
National Research Council, 2007).
Because schools in the U.S. rarely are able to rely on hierarchical control of teaching
practices, teachers may have to informally communicate to coordinate. To do so, teachers will
need to access comparable levels of know-how they can draw on as a basis of communication
(Hansen, 1999; Szulansk, 1996) and to implement changes in practices (Bill & Melinda Gates
Foundation, 2012; Sun et al., 2013). In addition, teachers have limited time to communicate
about the details of their teaching; their descriptions of practice are often synoptic rather than
elaborated (Little, 2003). As a consequence, communication and coordination is easier when
teachers’ descriptions of practice are easily interpretable, because they signal shared beliefs and
approaches to teaching, as well as shared taken-for-granted contexts. We would expect that
communication and coordination would be difficult between subgroups of teachers immersed in
the language and practices of different approaches to instruction, such as phonics-based basic
skills instruction versus balanced literacy instruction, or between subgroups of teachers whose
teaching context is so different that miscommunication is likely when speaking about practice in
synoptic ways.
The preceding logic implies that at the level of an organization such as a school, the
efficiencies of coordination will be realized when each subgroup has equal access to sources of
know-how. Otherwise those subgroups that do not have access to the requisite know-how will
encounter difficulties in communicating about and implementing new practices, decreasing the
overall level of implementation of an innovation. This leads to the following formal hypothesis:

What is a “Good” Social Network for a System
10
H1: The more even the flow of know-how to potential recipient subgroups the greater will
be the systemic implementation of practices dependent on the know-how.
Our second hypothesis focuses on a different basis for coordination. In particular,
coordination may be achieved by limiting the number of intra-organizational sources that
influence teaching (Bidwell and Quiroz, 1991; Tsai, 2001). For formal governance this
limitation implies an oligarchy. But when locally adaptive practices are not easily formally
controlled, the limitation implies a restriction on the informal sources that provide the know-how
workers are likely to draw on to change their practices. The fewer sources that provide local
know-how, the more members of the organization will access similar know-how, allowing them
to communicate and coordinate their practices. All else being equal, it is better for one subgroup
to provide know-how to three other subgroups than for three different subgroups to provide the
know-how separately to each subgroup. Therefore our hypothesis relates the flow of know-how
from high-level implementers to organizational change. Formally:
H2: The more know-how is restricted to flow from subgroups with high levels of
know-how, the greater will be the systemic implementation of practices dependent on that
know-how.
This hypothesis relates to the general value of specialized units for creating knowledge
(Tsai, 2001). But in this case we emphasize that the units are emergent, and not formally
defined. Moreover, we identify their value as their capacity to insure the flow of high-
quality and consistent know-how to other subgroups in the system.

What is a “Good” Social Network for a System
11
Hypotheses 1 and 2 represent different conceptualizations of know-how. The first
hypothesis is based on the assumption that know-how can be accumulated in separate units
and then implemented by any subgroup accessing adequate know-how. The second is
based on the assumption that there may be a qualitative difference between the know-how
that can be provided by a high implementing subgroup versus the same number of units of
know-how provided by separate subgroups. In the discussion we will return to these
conceptualizations.
METHODS
Our methods section begins with a description of the collection of data from individual
teachers in 23 schools. The measures include sociometric items asking teachers to list their
closest colleagues. We then describe how we identified subgroups in each school from these
data. We then describe the measures we created of the potential flow of know-how from
teachers’ responses to questions about their implementation of their school-wide initiatives and
to questions about from whom they get help regarding implementation of their school-wide
initiatives. We present an analytical plan of regressing school-wide change in the initiative on the
measures of potential flow of know-how, and we explore covariates. We also describe the
graphical representations and sensitivity analyses we conducted.
Sample

What is a “Good” Social Network for a System
12
We began with a sample of school staff from 23 mostly elementary schools from a
single state in the U.S. Pacific West region. 2 Our sampling criteria increased the
probability we would observe how teachers’ interactions affected their implementation of
new practices related to the initiative. In particular, we sought to include schools that (1)
were engaged in a reform initiative intended to have a school-wide influence on teachers’
practices and (2) had distributed leadership across people and practices (Spillane, 2006),
evidenced by assignment of responsibility for the initiative to multiple actors in the school
and by allocation of time for teachers to meet regularly to discuss their school’s initiative.
The school-wide initiatives focused on a variety of different areas. The most
common focus was on the improvement of literacy instruction (n = 5). Other schools foci
included integrating technology into instruction (n = 4), improving the use of data to
inform instruction (n = 3), and fostering social and emotional development of students (n =
2). See Penuel et al., (2009) for further description of the school-wide initiatives.
In all but one case, the school-wide initiatives were defined at the school or district
level, rather than by a national whole-school reform model, although several local school-
wide initiatives were adapted from national models (Coburn, 2005). Such locally defined
school-wide initiatives are the most common type of school reform, and also the most
problematic with respect to implementation (Datnow and Stringfield, 2000). From a
theoretical standpoint, we viewed the diversity of these initiatives as an important resource
for generating robust theory.
We present the basic demographics for our schools in Table 1. Our sample of
schools is both similar to and different from the schools in the state as a whole. The sample
2 There were 12 elementary schools; 3 kindergarten through 8 schools; 3 middle schools; one 7-12 grade school; and two high schools.

What is a “Good” Social Network for a System
13
is similar in that it includes schools with a significant percentage of students who are
eligible for free and reduced price lunch and many schools with high levels of racial
diversity. Overall, the percentages of students eligible for free and reduced price lunches is
slightly lower (12%) than the state average for schools, and sample schools have slightly
higher (12%) percentages of White students than the state as a whole. But the differences
are modest, and our model of change in implementation controls for any characteristic of
the school that was fixed over time (see analytic strategy below).
Insert Table 1 about here
Procedures
We administered a questionnaire to all staff with responsibilities for classroom
teaching in fall 2004 (time 1) and again in spring 2005 (time 2). The survey included
sociometric items asking staff to indicate the others in the school whom they considered
close colleagues and who helped them implement the school-wide initiative. At each time
point, respondents also indicated how explicit they perceived the school-wide initiative to
be, how much the specific initiative had influenced their teaching practice, and how much
normative pressure they felt to implement the initiative in their classroom.
Teachers typically completed the survey in 20 to 30 minutes during a faculty
meeting. We provided an administrative assistant at the school with a postage-paid return
envelope for teachers who did not complete the survey when the researcher was on-site. In
addition, we provided an incentive to each school for a high response rate. The average
response rate within each school was 83.6% in fall 2004, and 80.4% in spring 2005 (with a
range across schools from 62% to 94% and a median of 85%).

What is a “Good” Social Network for a System
14
As indicated in Table 2, more than three-quarters of the respondents were female
and more than three-quarters of those surveyed were white, and the vast majority of faculty
members held a clear teaching credential (not an emergency or provisional credential).
These are consistent with national trends (United States Department of Labor, 2011).
Consistent with the ratio of elementary to secondary schools in the sample, the majority of
teachers taught at the elementary level. In addition to the statistics presented in Table 2, on
average, teachers in the sample reported having 13 years of classroom teaching experience
(standard deviation of 10), including 6.7 years (standard deviation of 6.6) at their current
school, and the median class size was 22 students.
Insert Table 2 Here
Dependent Variable: School Level Implementation of New Initiatives
Our primary dependent variable is based on responses to how the local school-wide
initiative affected the respondents’ teaching practices. These practices included the curricular
materials used, instructional strategies and activities, assessment strategies, standards and topics
covered, performance levels expected of students, complexity of work assigned, classroom
management techniques, student grouping methods, professional development sought, and roles
and responsibilities of students and teachers for learning (adapted from Bodilly, 1998). These
are the core professional practices of teaching. Teachers indicated whether they engaged in a
practice or not, were not sure, or that the practice was not targeted by the school-wide initiative.
The dependent variable was defined by the total number of practices which a teacher indicated
were affected by the initiative (α = .92). After computing the change in a teacher’s responses

What is a “Good” Social Network for a System
15
between time 1 and time 2, the final dependent measure was defined as the mean change score
for the teachers in a given school.

What is a “Good” Social Network for a System
16
Independent Variable: Measure of Entropy
Intuition. To test our hypotheses, we developed measures of the potential flows of
resources, such as know-how, through networks. Economists and demographers have generated
extensive measures of the distribution of resources in social systems (e.g., Gini, 1921; Reardon
and Firebaugh, 2002), but these measures are not directly functions of the network structure
through which resources flow. On the other hand, the social networks literature contains
extensive measures of the social structure of a system such as in terms of centralization (e.g.,
Freeman 1978/1979; Wasserman and Faust, 1994). But the measures do not account for the
location of specific resources in a network and therefore cannot relate the potential flows of
specific resources to systemic change.
Closer to our goal, Touvet and Harle (2001) and Bonachich and Bieninstock (2003)
examined structural characteristics of networks and the potential for resource flow. Similarly,
Ingram and Roberts (2000), Reagans and Zuckerman (2001), Reagans, McEvily and Zuckerman
(2004), Tsai (2001) and Yayavaram and Ahuja (2008) infer a link between network structure and
organizational performance. But these approaches do not directly relate organizational change
to the potential for resource flow through network structure. Instead they relate a static
distribution of resources to organizational change or reduce to explanations of resource flow in
terms of patterns in the social structure but not the location of resources in that structure. 3
To characterize the potential for resource flow through a social structure, we employ
Shannon’s (1948) measures of entropy of communication, which were adapted from measures of
3 This critique even applies to Yayavaram and Ahuja’s (2008) measure of decomposability (page 351), which is based on the structure of the network (see also Provan and Milward, 1995).

What is a “Good” Social Network for a System
17
entropy in the physical sciences. 4 Conceptually, Shannon’s entropy measures reflect the extent
to which a resource such as know-how has the potential to flow evenly over possible links in a
system. The more channels over which resources may flow, the greater the entropy in the system
because there is less certainty about the link over which any given resource will flow.
The intuition behind Shannon’s measures is that one first converts potential flows into the
probability that a resource will flow over a given link. These probabilities represent how flows
are distributed independent of the absolute levels of flow. Each potential flow contributes to the
overall measure of uncertainty inversely proportional to its probability – the smaller the
probability, the larger the contribution. When accumulated across flows, many small
probabilities translate into large values of uncertainty.(see technical appendix A for details).
Consider a hypothetical system in which there are only two links over which resources
could flow as shown in Figure 3. If the probabilities of flow both equal .5, entropy is at its
highest indicating maximum uncertainty over which link a resource will flow. Entropy then
declines symmetrically as the difference in the probabilities increases. Thus entropy has intuitive
appeal as a measure of the evenness of the flow over a network; it is highest when a resource
potentially flows evenly across possible links and declines as potential flow becomes
concentrated over particular links.
Insert Figure 3 Here
While Shannon’s measure of uncertainty has clear value for communications
engineers (Verdu, 1998), it has also been used to characterize the distribution of the flow
4 Shannon used the term entropy to relate his measures to Boltzmann's statistics from thermodynamics, which characterized the disorder of molecules.
What is a “Good” Social Network for a System
18
of resources in other systems, such as ecosystems (e.g., McCann, 2000; Ulanowicz, 1997;
Zorach and Ulanowicz, 2003). In the sociology and business literature, Burt (1998, 2000)
traces his measures of constraint through Coleman (1964) to Shannon’s indices. Relatively
recently, Reardon and O’Sullivan (2004) argued that measures of entropy are especially
valuable for their flexibility, ability to handle transfer (movements of individuals in the
social space), their scale-free quality, and their theoretical motivation from
communications. Furthermore, Dionisio, Menezes, and Mendes (2006) argued that
Shannon’s measures have several desirable properties, relative to variance, to characterize
dispersion or diversity in probabilities of flows. Given the advantages of measures of
entropy for characterizing resource flow through networks, we rephrase our hypotheses
relating potential resource flows to organizational change in terms of the evenness of the
distribution of know-how (entropy):
H1 [restated in terms of entropy]: The greater the entropy of the flow of know-how to
subgroups the greater will be the systemic implementation of behaviors dependent on that know-
how; and
H2 [restated in terms of entropy]: The less the entropy of potential flow of know-
how from subgroups the greater will be the systemic implementation of behaviors
dependent on that know-how.
Formal measure of entropy. Our key independent measures of entropy were functions of
two types of information from the surveys: interaction among teachers, and each teacher’s report

What is a “Good” Social Network for a System
19
of how much they implemented the school-wide initiative at time 1 – the more the teacher
implemented the school-wide initiative at time 1, the greater was the teacher’s know-how that
could be transmitted to others. We measured the interaction through which know-how could flow
from the question asking teachers to indicate who had helped them in the past twelve months
implement their primary school-wide initiative. We also asked teachers to indicate the frequency
of interaction with each provider of help -- once or twice a year, monthly, weekly, daily. To
approximate an interval scale we coded these according to their meaning in the context of the
typical school calendar. The calendar covers 9 months, roughly 40 weeks, and roughly 160 days.
Therefore the coding was once or twice a year = 1, monthly = 9, weekly = 40, daily = 160.
Following previous research (Penuel et al., 2009; Frank Zhao and Borman, 2004, Zhao
and Frank 2003), know-how is conceptualized in terms of the sets of practices teachers use to
implement particular reforms (e.g., Barley & Kunda, 2001; Brown and Duguid, 1991). This
know-how is specific to the school-wide initiative, and does not necessarily apply to other
aspects of teaching. For example if a school-wide initiative focused on language arts, then
know-how refers to how to implement the initiative in language arts instruction, and would be
independent of mathematics instruction.
Formally, let wi,i’ represent the potential flow of know-how as the product of the
frequency of help provided by teacher i’ to teacher i between time 1 and 2 and the know-how of
teacher i’ at time 1. For example, if Bob received help implementing a school-wide initiative
weekly (40 times in the past school year) from Jane, and Jane had implemented 6 aspects of the
school-wide initiative in her practices one year ago, then Bob’s potential access to know-how
through help received from Jane would be: wBob, Jane = 40 x 6 = 240.

What is a “Good” Social Network for a System
20
Given our focus on bridging ties, we attend to the variation in the flow of know-how
between subgroups (Hansen 1999; Reagans and McEvily, 2003; Reagans, McEvily and
Zuckerman, 2004; Reagans and Zuckerman, 2001; Burt, 1992; Yayavaram and Ahuja, 2008).
The measure of the flow of know-how between subgroups A and B, wA,B, is the sum of the wi,i’
between members of subgroups A and B, where subgroup A contains members who received
help from members of subgroup B. Continuing the previous example, assume Jane and Bob are
in different subgroups and Jane is the only member of her subgroup who helps members of
Bob’s subgroup. If Jane helps only one other member of Bob’s subgroup 10 times a year then
flow from Jane’s subgroup to Bob’s is 40 x 6 + 10 x 6 = 300.
The key to Shannon’s approach for defining a system level measure is to transform
absolute levels of flow as in wA,B to characterize the distribution of flow in terms of the
probability, p(A,B), of flow over a given link:
. (1)
Thus p(A,B) represents the probability that any given flow will occur over the AB link.
Drawing on Shannon’s approach, p(A,B) can be used to characterize the evenness of flow
across a system (see the technical appendix A for details and further motivation). First, the
probabilities are transformed according to: 5
. (2)
The p*(A,B) are then summed to construct the measure of entropy:
5 Although Shannon's equations were base 2 logarithm units, we chose the natural logarithm as a base, which
does not change any of the patterns in our theoretical examples or empirical results.

What is a “Good” Social Network for a System
21
. (3)
As shown in Figure 3, this entropy measure is at its peak when flow is equally likely over all
links.
Shannon proves (Shannon, 1948, pages 10-11 and appendix 2) that the form in (3)
multiplied by a constant, is the only form that is 1) a continuous function of p*; 2) is a monotonic
increasing function of the number of events of equal probability – entropy increases with an
increasing number of possible events; and 3) can be decomposed into successive choices.
In technical appendix A we deconstruct the measure of entropy to separately represent
the flow of resources to subgroups (hypothesis 1) from the flow of resources from subgroups
(hypothesis 2). In particular, to construct the measure for flow to subgroups we first calculated
the amount of help each subgroup received from others based on the sum of know-how received
by that subgroup from all other subgroups. Call this w.B . We then transformed the w.B to
probabilities as in (1), converted to p x ln(p) as in (2) and summed across all potential receiver
subgroups as in (3). We then used the feature that entropy increases monotonically with the
number of possible events to standardize the measures against a maximum number of flows in
each school. This is essential for evaluating the relationship between resource flow and systemic
function across different schools as we do in the next section. Similar calculations were used to
construct the measure of provider entropy, beginning by first measuring the amount of know-
how each subgroup provided to others based on the sum of know-how provided by that subgroup
to all other subgroups.

What is a “Good” Social Network for a System
22
Covariates
We considered covariates that are likely related to change in implementation of school-
wide initiatives, the distribution of know-how, or both.
Perceived explicitness of the school-wide initiative. Previous research has shown the
more well specified an initiative is, the more likely it will be implemented (Cohen and Ball,
2001). Perceived explicitness of the initiative was measured from the school mean of teachers’
responses to the following items: there is an overall plan that specifies what teachers need to be
doing in their classrooms in order to implement the school-wide initiative; there are clear
assessment techniques that identify progress in implementing the school-wide initiative; the
school-wide initiative is well specified; and most teachers know what they need to do for
implementation (scale: 1=strongly disagree; 2=disagree; 3=agree; 4=strongly agree; Cronbach’s
α=.87, items listed in order of correlation with the total).
Duration of the school-wide initiative. The distribution of know-how flows may be
confounded with the duration of the school-wide initiative because the longer an initiative has
been implemented the more potential sources of know-how there will be in the school.
Therefore we considered a control for the duration of the initiative in years (1-7) as measured
from principal reports.
Perceived pressure to implement the school-wide initiative. Initiatives may be more likely
to be implemented if there is perceived pressure to do so, regardless of know-how flows (Burt,
2005; Frank, Zhoa and Borman 2004). Therefore, we examined how our estimates changed after
controlling for perceived pressure to implement the initiative. The measure of perceived
pressure to implement the school-wide initiative was based on the mean of teachers’ responses to
the following items: most of the teachers in the school believe there is value in this school-wide
What is a “Good” Social Network for a System
23
initiative; and most of the teachers in the school would like to see the school-wide initiative
continue (scale: 1=strongly disagree; 2=disagree; 3=agree; 4=strongly agree; the items were
correlated at .79). Because perceived pressure may vary within the school, for example by
subgroup membership, we calculated a measure for both the individual teacher and for the mean
of the school.
School size. It may be that larger schools have more difficulty changing teaching
practices than small schools, for example as teachers in small schools are more likely to share a
sense of collective efficacy facilitating collaboration (Lee and Loeb, 2000). Therefore we
explored controls for school size in terms of number of employed teachers.
Structure of the Network. The distribution of know-how may depend directly on the
structure of a network. The most basic network measure is the density of ties, defined as the
proportion of possible ties between pairs of actors that were realized. But know-how flows
might also depend on the extent to which there is reciprocity (AB; BA) or transitivity
(AB, BC, AC) in a network. Reciprocity and transitivity are indicative of clustering
(Davis, 1970), potentially isolating sources of know-how needed for implementation.
Correspondingly, we also controlled for the extent to which ties were concentrated within
subgroups versus between subgroups. We constructed measures of each aspect network structure
for the closest colleague data used to define the subgroups as well as for the specific interactions
about the school-wide initiatives.

What is a “Good” Social Network for a System
24
Analytic Strategy
Following our theoretical focus on between subgroup interactions, the prologue for
our analysis was to identify cohesive subgroups in which collegial relations were
concentrated. We did so from the time 1 sociometric question regarding teacher’s closest
colleagues, a stable and enduring relationship (Frank and Yasumoto, 1998; Frank and
Zhao, 2005). Identifying subgroups within each school in our sample then required an
algorithm that could identify non-overlapping cohesive subgroups with a minimum of
subjective input or interpretation from the researcher (e.g., specification of the number of
subgroups, criteria defining subgroups). We used Frank’s (1995, 1996) KliqueFinder
network clustering algorithm for this purpose which has been employed in both the social
sciences (e.g., Frank and Yasumoto, 1998; Frank and Zhao, 2005; Yasumoto, Uekawa, and
Bidwell, 2001) and the natural sciences (e.g., Jaeger et al., 2010a, 2010b; Krause et al.,
2003; Krause et al., 2010). The algorithm maximizes within subgroup density relative to
between subgroup density. The criterion is also related to social network models such as
exponential random graph models and p2 (Frank 1995; Lazega and Van Duijn, 1997;
Snijders et al., 2006; Wasserman and Pattison, 1996).
Ultimately, we identified 115 subgroups (with 10 teachers unassigned) across 23
schools, with the average subgroup containing 3 to 4 teachers who responded to the survey
at time 1 and time 2 (subgroups contained other members who completed the time 1
sociometric questions but who did not complete the survey at time 2). We removed one
school from our sample because the concentration of close collegial relationships within
the subgroups was not great enough to reject a null hypothesis that there were no

What is a “Good” Social Network for a System
25
subgroups (p > .05, see Frank, 1995 for the Monte Carlo procedure and significance test
for the presence of subgroups).
At the school level we then calculated descriptive statistics and correlations among our
measures of entropy, and change in implementation of the initiative. To test our main hypotheses
we regressed change in mean level of implementation of the initiative on the measures of entropy
at the school level. For two time points of data using a dependent variable of change in behavior
is equivalent to a fixed effects analysis and therefore controls for any characteristic of schools
that were constant over time (Wooldridge, 2010). In technical appendix B we confirm our main
estimates using a multilevel model of teachers nested within schools (Raudenbush and Bryk,
2002), but we present school level regressions because our hypotheses are specified at the
organizational level. Furthermore, the descriptive analyses, graphical and sensitivity analyses we
present below are more interpretable in terms of a single level model (see Seltzer, Frank and
Kim, 2006, for the challenges in conducting our sensitivity analysis in multilevel models)6.
Because of the small sample of schools we attended carefully to school level outliers and
the distribution of residuals. In particular, we removed one school from our analysis because it
had an inexplicably large decline in implementation ( a value of -4 relative to a sample mean
across all the schools of -.13 and standard deviation of 1.15 and the next lowest value was -1.45;
including this school in our analyses roughly doubled the standard errors for all predictors using
OLS or HLM and reduced the R2 to zero); after removing this school, our final analytic sample
included 425 school personnel in 21 schools. To interpret inferences from our models, we plotted
6 See Raudenbush and Bryk’s (2002) discussion in chapters 3 and 5, in particular their comment (page 108) that a school level model yields unbiased estimates (although there may be some loss of efficiency relative to multilevel weighting according to sample size).

What is a “Good” Social Network for a System
26
change in implementation against our measures of entropy. Finally, we quantified the robustness
of our inference to potentially omitted confounding variables and sampling bias.
RESULTS
The Relationship between Entropy and Implementation of School-wide Initiatives
Table 3 shows the descriptive statistics for our dependent measure and our focal
independent measures as well as the correlations among them. The mean change in
implementation was positive (.056), but small relative to its standard deviation (.759). Thus some
schools increased their implementation of school-wide initiatives while others stayed stable or
decreased, reflecting the general difficulties in changing school behaviors on a large scale (e.g.,
Tyack and Cuban, 1995). Mean change in implementation was weakly correlated (and negative)
with potential receiver entropy, but strongly negatively correlated (-.654) with potential provider
entropy.
Insert Table 3 Here
Table 4 contains the results of the school level regression of mean change in
implementation of the school-wide initiative on the measures of entropy. The coefficient for
entropy of potential receivers was in the expected direction (hypothesis 1) but was smaller than
its standard error. There was little evidence to reject a null hypothesis of no relationship between
potential receiver entropy and implementation of the initiative. In contrast, hypothesis 2 was
supported; the greater the entropy with respect to potential providers, the less the increase in
implementation. The magnitude of the coefficient of −3.22 was more than three times its
standard error of .86 (using multilevel models via SAS proc mixed as per Singer, the estimate

What is a “Good” Social Network for a System
27
was −3.11 with standard error 1.09 – see technical appendix B for details).
The results for model 2 show the estimated effect of potential provider entropy was only
slightly smaller (.04 difference) when controlling for the empirically strongest covariate, the
duration of the initiative; importantly, controlling for the duration of the initiative had no effect
on our statistical or substantive inferences. The estimated effect of potential provider entropy
was larger when controlling for each of the other school level covariates and the standard errors
were larger (controlling for perceived pressure at the individual level, the estimated effect of
potential provider entropy was slightly smaller, −3.08, but with 25% larger standard error, 1.18,
and no change in inference). Therefore we use the more precise estimates in Table 4 as the basis
for our preliminary inference that the more restricted the potential flow of know-how from
subgroups with greater know-how, the greater was the implementation of the school-wide
initiative.
Insert Table 4 Here
To evaluate whether the relationship between potential provider entropy and mean
implementation of the school-wide initiative was roughly linear and systematic, consider
the plot of each school’s change in implementation against potential provider entropy
shown in Figure 4. The plot shows a clear linear relationship that cannot easily be
attributed to a single outlier. Thus we take the regression estimate as indicative of a
general, linear, trend.
Insert Figure 4 about here
What is a “Good” Social Network for a System
28
The Robustness of our Inference
Concerns about Omitted Variables (Internal Validity): Certainly organizational
histories, administrator characteristics, and specifics of the school-wide initiative could be
responsible for some of the trends we observed in our data. But we note that the
distribution of potential know-how flow from provider subgroups is related to change in
implementation of the school-wide initiative. Therefore any static aspect of a school that
was manifest at time 1 was controlled for (see Steiner et al., 2010, for the value of
controlling for prior measurements in approximating the results from randomized
experiments).
Nonetheless, one might raise the concern that unmeasured factors could be
responsible for change in implementation. While we cannot control for unobserved factors
in our model, we report what the characteristics of the unobserved factors would have to be
to invalidate our inference of an effect of the entropy of potential know-how flow on
change in implementation of the school-wide initiative. In particular, drawing on Frank
(2000) an omitted confounding variable would have to be correlated at .6 or higher both
with potential provider entropy and with change in implementation of the initiative to
invalidate our inference of an effect of potential provider entropy on mean change in
implementation of the school-wide initiative (assuming the two correlations are equal to
maximize the impact of the confounder).
Correlations of .6 are considered large by social science standards (Cohen and Cohen,
1983), especially to be associated with change in implementation. As a basis of comparison, the
years of duration of the school-wide initiative was our strongest covariate, correlated at -.16 with

What is a “Good” Social Network for a System
29
potential provider entropy and at -.18 with change in implementation. 7 Correspondingly, the
correlations associated with an unobserved confounder would have to be more than three times
greater than the correlations associated with the duration of the initiative to invalidate our
inference. Although our inference can still be challenged, we encourage researchers and policy
makers to discuss challenges to our inferences in the quantitative terms of the impact of a
confounder necessary to invalidate the inference.
Concerns about Omitted Variables (Internal Validity): There may also be concerns about
the external validity of the inference that potential provider entropy affects changes in
implementation because of our relatively small, purposeful, sample. In response, we quantify
how much of the estimated effect of potential provider entropy must be due to sampling bias to
invalidate our inference (Frank and Min, 2007). In particular, to invalidate our inference, one
would have to replace one third (about 7) of our schools with other schools in which there was
no effect (Frank, Maroulis, Duong and Kelcey, 2013). 8 Note that our sample differed from state
averages on % free and reduced lunch and % white by only 12%. Thus we would retain our
inference even if we replaced a few of the schools to make the sample demographics equivalent
to those for the state (and if there were no effect in the replacement schools). Furthermore, while
our inference may be due to sampling bias, we know of no nationally representative data set that
contains full sociometric and longitudinal required to estimate our models.
7 The negative signs offset each other – see Frank (2000).
8 This is about at the median of robustness for articles recently published in Edication, Evaluation, and Policy Analysis (Frank et al., 2013).

What is a “Good” Social Network for a System
30
DISCUSSION
What is a “good” network for an organization? We have examined the relationship
between the distribution of know-how that bridges between subgroups and systemic change. Our
key finding is that the more restricted the knowledge flows from potential provider subgroups,
the greater the organizational change (hypothesis 2). There was no evidence to infer a
relationship between the distribution of know-how to potential receivers and systemic change
(hypothesis 1). A good network is one in which, given overall levels of knowledge flow, the
subgroup sources from which knowledge flows are restricted.
Of course, receiving resources is important and systems work better when they have
greater amounts of just about any form of resource relevant to implementing change. But our
study is about how to best distribute a fixed set of resources, namely know-how. Our findings
speak to the coordination value of cultivating flows from a small number of specialized helpers
rather than from disparate others. In contrast, given a fixed amount of know-how to distribute,
there is no evidence that it is better to distribute evenly to all subgroups than to just a few.
We can interpret our findings in terms of the flows in Figure 2. The know-how flowed
almost exclusively from subgroups B and C, contributing to important changes in practices,
especially in subgroup A. But the know-how did not flow evenly throughout the school, as
subgroups D and E had little access to know-how. Nonetheless the common sources of know-
how allowed the teachers in subgroups A, B, and C to coordinate their practices enough to
generate increases in the school-level implementation of technology.
The literature on intra-subgroup interactions suggests two interpretations of our findings
relative to the conceptualizations of know-how we raised in introducing our hypotheses. First,

What is a “Good” Social Network for a System
31
through their interactions and own experiences, the members of a high implementing subgroup
may integrate sets of practices into regimes that can be more easily implemented by others than
can be discrete practices (Thomas-Hunt, Ogden, and Neale, 2003; Tsai, 2001). Second,
members of high implementing subgroups may learn to make their know-how more explicit as
they engage in interactions focused on a particular set of practices (Feld, 1981; Nonaka, 1994;
Yasumoto, Uekawa, and Bidwell, 2001). Either by integrating practices into a coherent whole or
learning to articulate their know-how, members of high implementing subgroups may add value
to the stock of know-how in their organizations, contributing to their organization’s overall
capacity to implement innovations.
Implications for Other Organizations
Based on the preceding analysis, our findings apply most directly to organizations that
share two characteristics of teaching. First, restricting the set of providers of know-how may
have greater value when practice not only requires local adaptation, but is complex in the sense
that practices or more valuable when integrated into regimes. This might apply, for example, for
integrated management of natural resources (e.g., Sayer and Campbell, 2003) or even in apparel
manufacturing in which patterns must be coordinated with fabric (Uzzi, 1996). In these
situations, those who have generated coherent regimes from sets of practices, for example
through frequent interactions with a small set of likeminded others, will add value to their
organization’s capacity to change. Second, restricting the set of providers of know-how may
have greater value when workers are not easily able to articulate their knowledge (Brown and

What is a “Good” Social Network for a System
32
Duguid, 1991). In these situations, those who have learned to articulate their knowledge through
frequent interactions will add value to convey to their organizations.
In other contexts, the distribution of resources to potential recipient subgroups may be the
more salient factor. These may occur when knowledge can be easily integrated into know-how.
Under these conditions, there is little loss of efficiency if subgroups access disparate sources of
knowledge and each subgroup integrates the components independently. For example, factory
workers may be able to easily integrate information about a new machine from one source and
safety gear from another – the information about patterns and materials is essentially additive,
and so the workers may benefit from having multiple sources for different types of information.
More generally, our study assumes production is complex, not hierarchically controlled,
and that the organization is essentially cooperative (Marschak and Radner, 1972 -- see
Williamson, 1981, on the function of the firm in internalizing potentially competitive behaviors).
In these cases know-how such as what flows through intra-organizational networks is relevant
for production. Our theory and findings will have less relevance to organizations that are
controlled through shared values (Wiener, 1988) or rules (Weber, 1922 [1947]). But even if
schools did not represent other organizations, education is a large industry. In the United States
there are approximately 2.6 million teachers in about 99,000 elementary schools such as those
featured in our study (United States Census: Statistical Abstract of the United States:
2007; National Center for Education Statistics, 2008).

What is a “Good” Social Network for a System
33
The Role of the Manager
At their broadest, our findings suggest that managers such as school principals and other
leaders should consider how to distribute existing resources through networks within a given
system (Spillane 2006). In particular, managers may seek to facilitate production in organizations
such as schools by identifying and cultivating a few potential subgroups as providers of know-
how and ensuring that those subgroups can convey their know-how to other subgroups
throughout the school. This could be accomplished by allocating resources to maximize
interactions with members of subgroups with the greatest know-how in a particular set of
practices. For example, administrators may release members of high know-how subgroups from
their routine obligations so they may engage in more interactions with members of other
subgroups.
In suggesting a role for managers, we do not conceive of the organization as a rational
system controlled by managers (e.g., Weber 1922 [1947]). Instead, we conceive of managers
establishing contexts for know-how sharing that contribute to productivity (e.g., Nahapiet and
Ghoshal, 1998; Williamson, 1981). The importance of the manager is emphasized by recent
findings in neuroscience and cognition indicating organizational members may seek out and
provide help from organizationally distant actors as they internalize norms (Srivastava and
Banaji 2011). And these norms, as well as opportunities facilitating collaboration, can be shaped
by managers.
While cultivating know-how flow from a few potential providers may seem
straightforward, it would not be without challenges (Nahapiet and Ghoshal, 1998). In the case of
schools, facilitating know-how flow from a small portion of subgroups may elevate the status of

What is a “Good” Social Network for a System
34
some teachers at the expense of others. While this may be the goal of an actor following Burt’s
(1992) strategy for gaining competitive advantage by engaging in bridging ties (see also Blau,
1967; Flynn et al., 2006), it goes against a strong egalitarian norm within the culture of schools
(Glidewell, Tucker, Todt, and Cox, 1983; Little, 1990; Tellez, 1992). Indeed, status is not always
easily conferred by other organizational members (Flynn and Lake, 2008).
In the particular case of schools, formal elevation of some teachers to “expert” status by
removing them from some regular classroom instruction may make them less aware of others’
contexts and increase their social distance from others (Anagnostopoulos et al., 2010). This could
dilute their know-how. Implied, it is not a simple matter of identifying know-how in an
organization and making those with know-how accessible to a wide range of others. Formal and
informal leaders must be thoughtful about cultivating know-how in a small proportion of high
implementing subgroups and then facilitating access to that know-how without losing the
benefits of shared contexts. For example, school principals can emphasize that different teachers
will be designated and drawn on in different areas, thus evening out the status associated with,
and distribution of, know-how over the long term.
This still leaves open the question as to why a teacher would help a member of another
subgroup. Perhaps because she believes the other’s performance will affect her own (Frank,
Zhao and Borman, 2004). For example, a third grade teacher seeking high performing students
might help a second grade teacher whose students she will inherit in the next near (Frank, Kim
and Belman, 2010). Alternatively, teachers who identify strongly with the collective of their
school might allocate their help evenly throughout the school. In this sense, identity with the
collective establishes a quasi-tie that spans across subgroup boundaries (Frank, 2009).
What is a “Good” Social Network for a System
35
Limitations
We consider two key limitations in our relatively novel analysis of longitudinal network
data in 21 separate organizations. The first is rooted in our measurement of the help one teacher
provides another. We need to know in more qualitative terms about the nature and content of
know-how flow through helping behavior together with its ultimate effects on practice. Helping
behavior is a complex phenomenon in social-psychological and organizational terms (Hansen,
1999). For example, linking know-how flow to changes in behavior depends on the one who
originally possesses tacit knowledge to articulate the knowledge, and then on the one who is
exposed to new knowledge to internalize it and change behavior (Schwartz et al., 2005). The
more we know about the actual content of the interactions between organizational members the
more we will know about how those interactions affect behavior (cf. Coburn and Russell, 2008;
Coburn and Woulfin, 2012; Nahapiet and Ghoshal, 1998).
Second, we have taken the social structure of an organization as given. But informal and
formal social structures are shaped as organizations learn and respond to external forces (e.g.,
Levitt and March 1988). Thus it would be valuable to know how relationships such as close
collegial ties or particular interactions such as those related to the flow of know-how change.
We suggest that the exploration of such interactions should begin with theories of how
individuals choose with whom to interact and share resources (for examples Frank, Kim and
Belman, 2010; Frank, 2009). From there one can build to the emergence of organizational level
structure through induction or simulation techniques such as agent based modeling (e.g.,
Wilensky and Resnick, 1999).

What is a “Good” Social Network for a System
36
Conclusion
What is a “good” network for an organization? Our answer is that it depends on how
resources for specific goals flow through the network. Therefore there is no single “good”
network. The value of the network will depend on its capacity to channel resources to support a
particular practice. Here we examined the distribution of resources by locating them relative to
network subgroups and then related potential flows to systemic change. This has generated the
finding that the more restricted are the sources of flows from subgroups the greater will be
systemic change. We have no doubt that other novel hypotheses and findings will emerge as
researchers attend to the relationship between potential resource flows and organizational
behavior.

What is a “Good” Social Network for a System
37
ON LINE TEHCNICAL APPENDIX A
Motivation for the Measure of Entropy (adapted from Shannon, 1948 and Cover and Thomas,
1991)
In this technical appendix we adapt Shannon’s measures of entropy to characterize the
uncertainty of potential know-how flow to and from subgroups. We then standardize the
measures for comparison across schools.
Formally, let n represent the number of possible links along which information could
flow. The larger the number of links, the greater the uncertainty. If the links have equal
probability of occurring, then uncertainty is proportional to 1/(probability of any given link). To
create an additive measure of uncertainty across multiple independent links, for each link take
the natural log of 1/probability, and then sum. Thus the combined uncertainty of links from A to
B and from B to C is Ln[1/p(A,B)] + Ln[1/p(B,C)]= Ln[p(A,B)-1] + Ln[p(B,C)-1]= −Ln[p(A,B)]
−Ln[p(B,C)]. Then, because each event is not equally likely to occur, weight the events by their
probability. This generates an expected value, or average: − p(A,B)Ln[p(A,B)] −
p(B,C)Ln[p(B,C)]. Summing across all pairs, entropy=
, as in the main text.
Deconstructing Resource Flow to Potential Receivers and from Potential Providers
The flow of resources across the network can be differentiated into a component based on
the aggregated flows to each potential receiver and from each potential provider. Formally, let
, and (A1)

What is a “Good” Social Network for a System
38
. (A2)
Note Epotential receivers and Epotential providers are differentiated by the terms over which they are
summed, B and A respectively, where subgroup A contains members who receive information
from potential providers who are members of subgroup B.
Standardizing Measures of Entropy for Comparison Across Systems
To standardize the measures of entropy across systems we leverage the fact that the
maxima of the entropy measures is well defined and interpretable. For example, the
Max(Epotential receivers) is the log of the number of potential receivers in that system. Defining
fAB to take a value of 1 if subgroup A receives resources from B, 0 otherwise then
( )potential receivers ABB A
Max E Ln f =
∑∑ . (A3)
We then use Max(Epotential receivers) to normalize Epotential receivers for comparison
across systems: Z(Epotential receivers)= Epotential receivers -Max(Epotential receivers). The term
Z(Epotential receivers) is then a function of the know-how flow to potential receivers relative to
the potential evenness of know-how flow to potential receivers. The more negative the
value, the more certainty about the location of know-how flow to a potential receiver
relative to the baseline maximum. We use this standardized measure in our regression
analyses. Similarly, we standardize the measures of potential providers.
What is a “Good” Social Network for a System
39
ON-LINE APPENDIX B
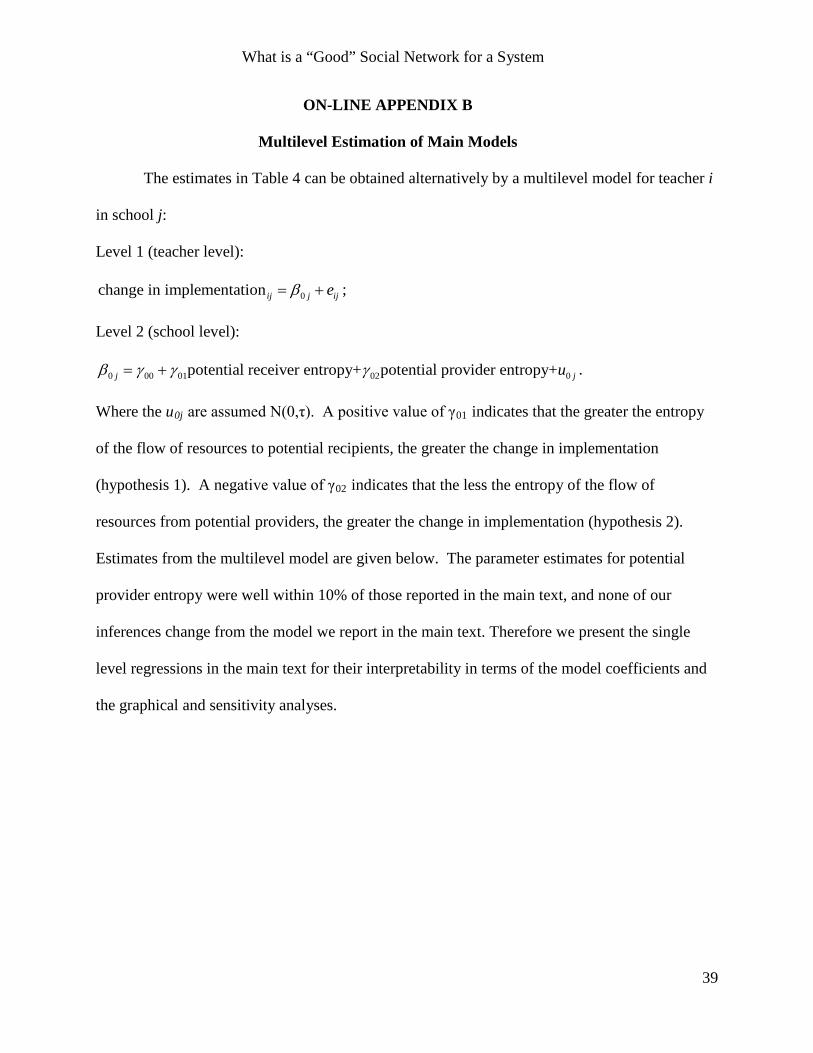
Multilevel Estimation of Main Models
The estimates in Table 4 can be obtained alternatively by a multilevel model for teacher i
in school j:
Level 1 (teacher level):
0change in implementation ij j ijeβ= + ;
Level 2 (school level):
0 00 01 02 0potential receiver entropy+ potential provider entropy+j juβ γ γ γ= + .
Where the u0j are assumed N(0,τ). A positive value of γ01 indicates that the greater the entropy
of the flow of resources to potential recipients, the greater the change in implementation
(hypothesis 1). A negative value of γ02 indicates that the less the entropy of the flow of
resources from potential providers, the greater the change in implementation (hypothesis 2).
Estimates from the multilevel model are given below. The parameter estimates for potential
provider entropy were well within 10% of those reported in the main text, and none of our
inferences change from the model we report in the main text. Therefore we present the single
level regressions in the main text for their interpretability in terms of the model coefficients and
the graphical and sensitivity analyses.

What is a “Good” Social Network for a System
40
Alternative to Table 4
Multilevel Regression of School Level Change in Implementation of the School-wide
Initiative on Measures of Entropy
Independent Variable Model 1 Model 2
(Potential
Confounding)
Intercept -.69
(.43)
-.53
(.49)
Potential receiver entropy 0.31
(0.93)
.21
(.94)
Potential provider entropy -3.11**
(1.09)
-3.12**
(1.09)
Duration of the school-wide
initiative
-.05
(.08)
Overall R2 15% .15%
* p < .05; ** p < .01. n=21 schools.
6% of the variance is at the school level in an unconditional model.

What is a “Good” Social Network for a System
41
References
Anagnostopoulos, D., Sykes, G., McCrory, R., Cannata, M., Frank, K.A. 2010. “Distinction, or Duty?
The Meaning of the National Board of Professional Teaching Standards for Teachers' Work and
Collegial Relations. American Journal of Education. v116 n3 p337-369.
Barley, S. R., and Kunda, G. 2001. Bringing work back in. Organization Science, 12(1), 76-95.
Barr, R., and R. Dreeben. 1983. How schools work. Chicago, IL: University of Chicago Press.
Berman, P., & McLaughlin, M. W. (1975). Federal programs supporting educational change,
Volume 4: The findings in review. Santa Monica, CA: RAND.
Bidwell, C. E. 1965. "The School as a Formal Organization." Pp. 972-1022 in The Handbook of
Organizations, edited by J. March. Chicago, IL: Rand McNally.
______. 2000. School as Context and Construction: A Social Psychological Approach to the Study of
Schooling," In Handbook for Sociology of Education. edited by Maureen T. Hallinan. New
York: Kluwer Academic/Plenum Publishers.
______. 2001. Analyzing Schools as Organizations: Long Term Permanence and Short Term Change.”
Sociology of Education, Extra Issue, 100-114.
Bidwell, C.E. and J.D. Kasarda. 1987. Structuring in Organizations: Ecosystem Theory
Evaluated. Greenwich, CT: JAI Press Inc.
Bidwell, Charles E. and Pamela A. Quiroz. 1991. "Organizational Control in the High School
Workplace: A Theoretical Argument." Journal of Research on Adolescence 1:211-29.
What is a “Good” Social Network for a System
42
Bill & Melinda Gates Foundation. 2012. Gathering feedback for teaching: Combining high-
quality observations with student surveys and achievement gains. Seattle, WA:
Blau, P. M.1967. Exchange and power in social life. New York: Wiley.
Bodilly, S. J. 1998. Lessons from New American Schools' scale-up phase. Santa Monica, CA:
RAND.
Bolman, L. G. and R. Heller. 1995. "School Administrators as Leaders." Pp. 315-58 in Images of
Schools, edited by S. Bacharach and B. Mundell. Thousand Oaks, CA: Corwin Press, Inc.
Bonacich, P., and E.J. Bienenstock, E. J. 2003. Balancing Efficiency and Vulnerability in Social
Networks. In R. Breiger, K. Carley, and P. Pattison (Eds.), Dynamic Social Network
Modeling and Analysis (Workshop Summary and Papers, pp. 253–264). Washington,
DC: The National Academies Press.
Borman, G.D., Hewes, G.M., Overman, L.T., and Brown, S. 2003. Comprehensive school
reform and achievement: A meta-analysis. Review of Educational Research, 73 (2), 125-
230.
Brown, J. S., & Duguid, P. 1991. Organizational learning and communities-of-practice: Toward
a unified view of working, learning, and innovation. Organization science, 2(1), 40-57.
Bryk, A.S. and Schneider, B. 2002. Trust in Schools. New York: Sage.
Burt, R. S. 1992. Structural holes: The social structure of competition. Cambridge, MA: Harvard
University Press.
Burt, R.S. 1998. The Gender of Social Capital. Rationality and Society 10: 5-46.
Burt, R. S. 2000. "The Network Structure of Social Capital," in B. M. Staw and R. I. Sutton: Research in
Organizational Behavior. Amsterdam; London and New York: Elsevier Science JAI, 2000, pp.
345-423.

What is a “Good” Social Network for a System
43
Burt, R.S. 2005. Brokerage and Closure. New York: Oxford University Press.
Callahan, R. E. 1962. Education and the Cult of Efficiency. Chicago: University of Chicago
Press.
Coburn, C. E. 2005. Shaping teacher sensemaking: School leaders and the enactment of reading
policy. Educational Policy, 19(3), 476-509.
Coburn, C. E., and J.L. Russell. 2008. District policy and teachers' social networks. Educational
Evaluation and Policy Analysis, 30(3), 203–235.
Coburn, C. E., and Woulfin, S. L. 2012. Reading coaches and the relationship between policy
and practice. Reading Research Quarterly, 47(1), 5-30.
Cohen, J., and P. Cohen, P. 1983. Applied Multiple Regression/Correlation Analysis for the
Behavioral Science. Hillsdale, NJ: Lawrence Erlbaum.
Cohen, D. K., Raudenbush, S. W., and D.L. Ball, D. L. 2003. Resources, instruction, and
research. Educational Evaluation and Policy Analysis, 25(2), 1–24.
Cohen, D. K., and Ball, D. L. 2001. Making change: Instruction and its improvement. Phi Delta
Kappan, 73–77.
Cohen, D. K., & Hill, H. C. 2001. Learning policy: When state education reform works. New
Haven, CT: Yale University Press.
Cohen, D. K., Moffitt, S. L., & Goldin, S. 2007. Policy and practice: The dilemma. American
Journal of Education, 113(4), 515-548.
Coleman, J. S. 1964 . Introduction of Mathematical Sociology. Glencoe, IL: Free Press.
Cover, T.M. and J.A. Thomas. 1991. Elements of Information Theory. John Wiley and Sons,
Inc. New York, NY.
What is a “Good” Social Network for a System
44
Datnow, A., and Stringfield, S. 2000. Working together for reliable school reform. Journal of
Education for Students Placed at Risk (JESPAR), 5(1 and 2), 183–204.
Davis, James A. 1970. “Clustering and Hierarchy in Interpersonal Relations: Testing Two Graph
Theoretical Models on 742 Sociomatrices. American Sociological Review, Vol. 35, No. 5,
pp. 843-851
Delpit, L. 1988. Other people's children: Cultural conflict in the classroom. New York: New
Press.
Dionisio, R. Menezes, and Mendes, D. 2006. “Entropy-Based Independence Test,” Nonlinear
Dynamics Volume 44, Numbers 1-4, pp. 351-357(7)
Elmore, R. F., Peterson, P. L., & McCarthey, S. J. (1996). Restructuring in the classroom: Teaching,
learning, and school organization. Jossey-Bass Inc., Publishers, 350 Sansome Street, San
Francisco, CA 94104; Web site: http://www. josseybass. com.
Feld, S. L. 1981. The focused organization of social ties. American Journal of Sociology, 86(5).
Flynn, F.J., and V. Lake, V. 2008. “If you need help, just ask”: Underestimating compliance
with direct requests for help. Journal of Personality and Social Psychology. Vol. 95, No.
1, 128–143.
Flynn, F., Reagans, R., Amanatullah, E., and Ames, D. 2006. Helping one's way to the top: Self-
monitors achieve status by helping others and knowing who helps whom. Journal of
Personality and Social Psychology, 91(6), 1123–1137.
Frank, K. A. 1995. Identifying cohesive subgroups. Social Networks, 17, 27–56.
__________. 1996. Mapping interactions within and between cohesive subgroups. Social Networks, 18,
93–11.
__________. 2000. Impact of a confounding variable on a regression coefficient. Sociological
Methods and Research, 29(2), 147–194.

What is a “Good” Social Network for a System
45
__________. 2009 Quasi-Ties: Directing Resources to Members of a Collective
American Behavioral Scientist. 52: 1613-1645.
Frank, K.A., Kim, C., and Belman, D. 2010. “Utility Theory, Social Networks, and Teacher
Decision Making.” Pages 223-242 in Alan J. Daly editor. Social Network Theory and
Educational Change. Cambridge: Harvard University Press.
Frank, K.A., Maroulis, S., Duong, M., and Kelcey, B. 2013. What would it take to Change an
Inference?: Using Rubin’s Causal Model to Interpret the Robustness of Causal
Inferences. Education, Evaluation and Policy Analysis. Vol 35: 437-460
Frank, K. A. and Min, K. 2007. Indices of Robustness for Sample Representation. Sociological
Methodology. Vol 37, 349-392. * co first authors.
Frank*, K.A., Penuel*, W.R., Sun, M. Kim, C., and Singleton, C. 2013. “The organization as a Filter of
Institutional Diffusion. Volume 115(1). Teacher’s College Record. *Authors listed
alphabetically – equal authorship.
Frank, K. A., and J. Y.Yasumoto. 1998. Linking action to social structure within a system: Social
capital within and between subgroups. American Journal of Sociology, 104(3), 642–686.
Frank, K. A., and Zhao, Y. 2005. Subgroups as a meso-level entity in the social organization of
schools. In L. Hedges and B. Schneider (Eds.), Social Organization of Schools: Book
honoring Charles Bidwell’s retirement (pp. 279–318). New York: Sage.
Frank, K. A., Zhao, Y., and Borman, K. 2004. Social capital and the diffusion of innovations
within organizations: Application to the implementation of computer technology in
schools. Sociology of Education, 77(2), 148–171.
What is a “Good” Social Network for a System
46
Frank, K.A., Zhao, Y., Penuel, W.R., Ellefson, N.C., and Porter, S. 2011. Focus, Fiddle and
Friends: Sources of Knowledge to Perform the Complex Task of Teaching. Sociology of
Education, Vol 84(2): 137-156.
Freeman, L.C. 1978/1979. Centrality in social networks: Conceptual clarification. Social
Networks, 1, 215–239.
Gamoran, A. 1987. The stratification of high school learning opportunities. Sociology of
Education, 60, 135-155.
Gini, C. 1921. “Measurement of Inequality of Incomes". The Economic Journal 31: 124–126.
Glidewell, J. C., Tucker, S., Todt, M., and S. Cox, S. 1983. Professional support systems: The
teaching profession. In A. Nadler, J. D. Fisher, and B. M. DePaulo (Eds.), New directions
in helping: Applied perspectives on help-seeking and receiving (Vol. 3, pp. 189–212).
New York: Academic Press.
Greenfield, T. B. 1975. "Theory About Organization: A New Perspective and Its Implications
for Schools." In Administrative Behavior in Education, edited by R. Campbell and R.
Gregg. London: Athlone.
Hansen, M. T. 1999. The search-transfer problem: The role of weak ties in sharing knowledge
across organization subunits. Administrative Science Quarterly, 44(1), 82–111.
Hanushek, E. A., and Raymond, M.E. 2005. Does school accountability lead to improved student
performance? Journal of Policy Analysis and Management. Vol 24 (2):297–327.
Hislop, D. 2005. The effect of network size on intra-network knowledge processes. Knowledge
Management Research and Practice, 3(4), 244-252.
Honig, M.I. 2006. Street-level bureaucracy revisited: Frontline district central office administrators as
boundary spanners in education policy implementation. Educational Evaluation and Policy

What is a “Good” Social Network for a System
47
Analysis 28(4), 357-383.
Ingram, P., and P.W. Roberts, P. W. 2000. Friendships among Competitors in the Sydney Hotel
Industry. American Journal of Sociology, 106(2), 387–423.
Jaeger-Miehls, A. L., Mason, D. M., Frank, K.A., Krause, A. E., Peacor, S.D., and Taylor, W.W.
2009. Invasive species impacts on ecosystem structure and function: A comparison of
Oneida Lake, New York, USA, before and after zebra mussel invasion. Ecological
Modeling.
Jaeger-Miehls, A. L., Mason, D. M., Frank, K.A., Krause, A. E., Peacor, S.D., and Taylor, W.W.
2009. Invasive species impacts on ecosysem structure and function: A comparison of the
Bay of Quinte, Canada, and Oneida Lake, USA, before and after zebra mussel invasion.
Ecological Modeling.
Krause, A., Frank, K.A., Mason, D.M., Ulanowicz, R.E. and Taylor, W.M. 2003.
“Compartments exposed in food-web structure.” Nature 426:282-285
Krause, A.E., Frank, K.A., Jones, M.L., Nalepa, T.F.,Barbiero, R.P., Madenjian, C.P., Agy,
M.,Evans, M.S., Taylor, W.W., Mason, D.M., Leonard, N.L. In Press. “Adaptations in a
Hierarchical Food Web of Southeastern Lake Michigan.” Ecological Modeling.
Lazega, E., and Van Duijin, M.A.J. 1997. Position in formal structure, personal characteristics
and choices of advisors in a law firm: A logistic regression model for dyadic network
data. Social Networks, 19, 375–397.
Leana, C.R., and Pil, F.K. 2003. Social Capital and Organizational Performance: Evidence from
Urban Public Schools. Organization Science, Vol 17(3): 353-366.
What is a “Good” Social Network for a System
48
Lee, V.E. & Loeb, S. 2000. School Size in Chicago Elementary Schools: Effects on Teachers'
Attitudes and Students' Achievement. American Educational Research Journal, 37 (1), 3-
31.
Levitt, B., and J.G. March, J. G. 1988. Organizational learning. Annual Review of Sociology, 14,
319-338.
Lin, N. 2001. Social capital: A theory of social structure and action. New York: Cambridge
University Press.
Little, J. W. 1990. The persistence of privacy: Autonomy and initiative in teachers' professional
relations. Teachers College Record, 91, 129–151.
Little, J. W. 2003. Inside teacher community: Representations of classroom practice. Teachers
College Record, 105(6), 913-945.
Lortie, D. 1975. Schoolteacher: A sociological study. Chicago: University of Chicago Press.
Majone, G., & Wildavsky, A. (1977). Implementation as evolution. Policy Studies Review, 2, 103-117.
Marschak, J. and Radner, R. 1972. Economic Theory of Teams. New Haven: Yale University
Press.
McCann, K. S. 2000. The diversity-stability debate. Nature, 405, 228-233.
Meyer, J. W., & Rowan, B. (1977). Institutionalized organizations: Formal structure as myth and
ceremony. American Journal of Sociology, 83(2), 340-363.
Nahapiet, J. and Ghoshal, S. 1998. Social Capital, Intellectual Capital, and the Organizational
Advantage. Academy of Management Review 23(2), 242-266.
National Center for Educational Statistics.
2008. http://nces.ed.gov/pubsearch/pubsinfo.asp?pubid=2009020

What is a “Good” Social Network for a System
49
National Research Council. 2007. Taking science to school: Learning and teaching science in
grades K-8. Washington, DC: National Academies Press.
Newmann, Fred M., Smith, BettsAnn, Allensworth, Elaine, and Bryk, Anthony S. (2001).
Instructional program coherence: What it is and why it should guide school improvement
policy. Educational Evaluation and Policy Analysis, 23(4): 297-321.
Nonaka, I. 1994. “A Dynamic Theory of Organizational Knowledge Creation.” Organization
Science. Vol 5(1): 14-37.
Oakes, J. 1985. Keeping track: How schools structure inequality. New Haven, CT: Yale
University Press.
O'Day, J. A. 2004. Complexity, accountability, and school improvement. In S. H. Fuhrman and R. F.
Elmore (Eds.), Redesigning accountability systems for education (pp. 15-43). New York:
Teachers College Press.
Ostrom E. 1990. Governing the Commons: the Evolution of Institutions for Collective Action.
Cambridge, MA: Cambridge Univ. Press.
Penuel, W. R., Fishman, B. J., Yamaguchi, R., and Gallagher, L.P. 2007. What makes
professional development effective? Strategies that foster curriculum implementation.
American Educational Research Journal, 44(4), 921–958.
Penuel, W. R., Riel, M., Krause, A., and Frank, K.A. 2009. Analyzing teachers' professional
interactions in a school as social capital: A social network approach. Teachers College
Record, 111(1).
Penuel, W.R., Sun, M., Frank, K.A., & Gallagher, H.A. 2012. Using social network analysis to
study how collegial interactions can augment teacher learning from external professional
development. American Journal of Education, 119(1), 103-136.

What is a “Good” Social Network for a System
50
Perrow, C. 1986. Complex organizations: A critical essay. New York: McGraw-Hill.
Provan, K.G. and Milward, H.B. 1995. A Preliminary Theory of Interorganizational Network
Effectiveness: A Comparative Study of Four Community Mental Health Systems.
Administrative Science Quarterly, 40, 1-33.
Raudenbush, S. W., and Bryk, A. S. 2002. Hierarchical linear models: Applications and data
analysis methods (2nd ed.). Thousand Oaks, CA: Sage.
Reagans, R., and McEvily, B. 2003. Network structure and knowledge transfer: The effects of
cohesion and range. Administrative Science Quarterly, 48(2), 240–267.
Reagans, R., McEvily, B. and Zuckerman, E. 2004. ”How to Make the Team? Social Networks
vs. Demography as Criteria for Designing Effective Teams” Administrative Science
Quarterly 49:101-133.
Reagans, R., and Zuckerman, E.W. 2001. Networks, diversity, and productivity: The social
capital of corporate RandD teams. Organization Science, 12(4), 502–517.
Reardon, S.F., and Firebaugh, G. 2002. "Measures of multigroup segregation." Sociological
Methodology 32:33- 67.
Reardon, S. F., and O'Sullivan, D. 2004. Measures of spatial segregation. Sociological
Methodology 34(1), 121–162.
Rowan, B. 1995. "The Organizational Design of Schools." Pp. 11-42 in Images of Schools,
edited by S.B. Bacharach and B. Mundell. Thousand Oaks, CA: Corwin Press, Inc.
Sayer, J. A., & Campbell, B. M. (2003). Research to integrate productivity enhancement,
environmental protection, and human development. Integrated natural resource
management. Linking productivity, the environment and development. CABI,
Wallingford, 1-14.

What is a “Good” Social Network for a System
51
Schmidt, W. H., Cogan, L. S., Houang, R. T., and McKnight, C. C. 2011. Content coverage
differences across districts/states: A persisting challenge for U.S. education policy.
American Journal of Education, 117(3), 399–427.
Schmidt, W. H. 2001. Defining teacher quality through content: Professional development
implications from TIMSS. In J. Rhoton and P. Bowers (Eds.), Professional development
planning and design (pp. 141–164). Arlington, VA: NSTA Press.
Schumpeter, J.A. 1934. The Theory of Economic Development. Cambridge, MA: Harvard
University Press
Schwartz, D. L., John D. Bransford, and D. Sears. 2005. Efficiency and innovation in transfer. In
Transfer of learning: Research and perspectives, ed.J. Mestre. Charlotte, NC:
Information Age Publishing, Inc.
Seltzer, M., Frank, K. & Kim, J. (2006). Studying the sensitivity of inferences to possible
unmeasured confounding variables in multisite evaluation studies. CSE Technical
Report. Los Angeles: Center for Research on Evaluation, Standards and Student Testing
(CRESST), UCLA.
Shannon, C. E. 1948. A mathematical theory of communication. The Bell System Technical
Journal, 27, 379–423.
Simon, H. 1965 . The architecture of complexity. In General Systems: Yearbook of the Society
for General Systems Vol. 10, pp. 63-76.
Snijders, Tom A.B., P. E. Pattison, G. L. Robins, and M. S. Handcock. 2006. New specifications
for exponential random graph models. Sociological Methodology 99-153.
Spillane, J. P.2006. Distributed leadership. San Francisco, CA: Jossey-Bass.

What is a “Good” Social Network for a System
52
Spillane, J. P., Hallett, T., & Diamond, J. B. 2003. Forms of capital and the construction of
leadership: Instructional leadership in urban elementary schools. Sociology of Education,
76(1), 1-17.
Spillane, J. P., Parise, L. M., & Sherer, J. Z. (2011). Organizational routines as coupling
mechanisms: Policy, school administration, and the technical core. American Educational
Research Journal, 48(3), 586-619.
Srivastava, S. B. and Banaji, M. R. 2011. Culture, Cognition, and Collaborative Networks in
Organizations. American Sociological Review, 76(2): 207-233
Steiner, P. M., Cook, T. D., and Shadish, W. R., Clark, M. H. 2010. The importance of covariate
selection in controlling for selection bias in observational studies. Psychological
Methods, 15(3), 250-267.
Sun, M., Garrison, A. L., Larson, C. J., & Frank, K. (forthcoming). Exploring colleagues’
professional influences on mathematics teachers’ learning. Teachers College Record.
Szulanski, G. 1996. Exploring internal stickiness: Impediments to the transfer of best
practice within the firm. Strategic Management Journal, 17, 17–43.
Szulanski, G. 1996. Exploring internal stickiness: Impediments to the transfer of best practice within the
firm. Strategic management journal,17, 27-43.
Tellez, K. 1992. Mentors By Choice, Not Design: Help-Seeking by Beginning Teachers. Journal
of Teacher Education, Vol. 43, No. 3, 214-221.
Thomas-Hunt, Melissa C., Tonya Y. Ogden, and Margaret A. Neale. "Who's really sharing?
Effects of social and expert status on knowledge exchange within groups." Management
science 49, no. 4 (2003): 464-477.
Thompson, J. D. 1967. Organizations in Action. New York: McGraw-Hill.

What is a “Good” Social Network for a System
53
Touvet, F. D. and Harle 2001. Network Resilience in Multilayer Networks: A Critical Review
and Open Issues. In Lecture Notes In Computer Science; Vol. 2093: Springer-
Verlag London, UK
Tsai, W. 2001. Knowledge transfer in intraorganizational networks: Effects of network position
and absorptive capacity on business unit innovation and performance. Academy of
Management Journal. Briarcliff Manor: Vol. 44, Iss. 5; p. 996-1004
Tyack, D., and Cuban, L. 1995. Tinkering toward utopia: A century of public school reform.
Cambridge, MA: Harvard University Press.
Ulanowicz, R. E. 1997. Ecology, the ascendent perspective. New York: Columbia University
Press.
United States Census: Statistical Abstract
2007. http://www.census.gov/compendia/statab/2007/2007edition.html
United States Department of Labor. 2011 “Employed persons by detailed occupation, sex, race,
and Hispanic or Latino ethnicity (http://www.bls.gov/cps/cpsaat11.pdf)
Uzzi, Brian. 1996. "The Sources and Consequences of Embeddedness for the Economic
Performance of Organizations: The Network Effect,"American Sociological Review,
1996, v61(4): 674-698.
Verdu, S. 1998. Fifty years of Shannon Theory. IEEE Transactions on Information Theory.
44(6), 2057–2078.
Von Hippel, E. 1994. “Sticky Information” and the Locus of Problem Solving: Implications for
Innovation. Management Science, Vol 40(4): 429-439.
Wasserman, S. and K. Faust 1994. Social Networks Analysis: Methods and Applications. New
York: Cambridge University.

What is a “Good” Social Network for a System
54
Wasserman, S., and P. Pattison. 1996. Logit models and logistic regressions for univariate and
bivariate social networks: I. An introduction to Markov graphs. Psychometrika, 61(3),
401–426.
Weber, M. 1947. The Theory of Social and Economic Organization. New York: Free Press.
Weick, K. E. 1976. Educational organizations as loosely coupled systems. Administrative
Science Quarterly, 21(1), 1-19.
Weick, K. E. 1995. Sensemaking in organizations. Thousand Oaks, CA: Sage.
Weick, K. E., Sutcliffe, K. M., & Obstfeld, D. 2005. Organizing and the process of sensemaking.
Organization Science, 16(4), 409-421.
Werner, A. (2004). A guide to implementation research. Washington, DC: The Urban Institute
Press.
Wiener, Y. (1988). Forms of value systems: Focus on organizational effectiveness and cultural
change and maintenance. Academy of management review, 13(4), 534-545.
Wilensky, U., and M. Resnick, M. 1999. Thinking in Levels: A Dynamic Systems Perspective to
Making Sense of the World. Journal of Science Education and Technology, 8(1): 3-19.
Williamson, O. E. 1981. "The Economics of Organization: The Transaction Cost Approach."
American Journal of Sociology 87(3).
Woodward, J. 1965. Industrial Organization: Theory and Practice. Oxford University Press
.United Kingdom.
Wooldridge, J. 2010. Econometric Analysis of Cross Section and Panel Data, second edition.
Cambridge, MA: MIT Press, 2010.
What is a “Good” Social Network for a System
55
Yasumoto, J. Y., Uekawa, K., and C. Bidwell, C. 2001. The collegial focus and student
achievement: Consequences of high school faculty social organization for students on
achievement in mathematics and science. Sociology of Education, 74, 181–209.
Yayavaram, S., and Gautam, A. 2008. Impact on the Usefulness of Inventions and Knowledge-
base Malleability. Administrative Science Quarterly, Vol. 53, No. 2. pp. 333-362.
Zhao, Y., and Frank, K. A. 2003. An ecological analysis of factors affecting technology use in
schools. American Educational Research Journal, 40(4), 807–840.
Zorach, A. C., and R.E. Ulanowicz, R. E. 2003. Quantifying the complexity of flow networks:
how many roles are there? Complexity. 8(3), 68–76.

What is a “Good” Social Network for a System
56
Table 1
Characteristics of Schools in the Sample
School Enrollment Percent
Free/Reduced Price Lunch
Native American Asian African
American Hispanic White Multiple Races
A 668 0.15% 0.3% 8% 2% 4% 84% 2% B 730 85.89% 0.0% 8% 10% 82% 0% 0% C 526 24.71% 0.0% 10% 3% 42% 40% 6% D 354 20.90% 0.9% 9% 3% 28% 52% 7% E 501 1.80% 0.3% 8% 1% 13% 58% 21% F 301 Missing 0.3% 8% 0% 7% 71% 14% G 527 18.79% 1.0% 13% 3% 68% 15% 0% H 1036 36.49% 0.9% 13% 10% 29% 43% 5% I 274 45.99% 0.0% 9% 23% 24% 32% 11% J 315 70.16% 0.0% 6% 66% 26% 1% 2% K 321 8.41% 0.6% 17% 4% 19% 55% 6% L 480 22.29% 0.4% 8% 1% 17% 65% 9% M 455 65.89% 0.8% 19% 3% 64% 10% 3% N 633 66.82% 0.1% 3% 1% 55% 37% 4% O 611 52.22% 0.0% 3% 0% 90% 6% 1% P 434 5.30% 0.7% 31% 2% 8% 58% 0% Q 784 8.29% 0.2% 11% 0% 10% 70% 8% R 771 100% 0.0% 19% 9% 67% 3% 2% S 526 49.81% 0.4% 2% 1% 69% 24% 4% T 1088 9.10% 0.4% 18% 17% 57% 7% 1% U 473 74.21% 0.0% 16% 2% 76% 4% 2% V 627 69.17% 0.0% 3% 7% 86% 2% 2% W 476 4.62% 0.8% 13% 1% 13% 52% 20% X Missing
SAMPLE AVERAGE 561 38.23% 0.4% 11.1% 7.4% 41.4% 34.2% 5.6% STATE AVERAGE 676 50.6% 0.7% 8.6% 6.5% 52.0% 26.1% 2.1%

What is a “Good” Social Network for a System
57
Table 2
Characteristics of Teachers in the Sample
N %
Gender
Male 73 17.2%
Female 352 82.8%
Race/Ethnicity
White 338 79.5%
African American 11 2.6%
Hispanic/Latino 43 10.1%
Asian 18 4.2%
Other/Unknown 15 3.5%
Certification Status
Provisional 57 13.4%
Emergency 5 1.2%
Clear 341 80.2%
National Board 9 2.1%
Missing 13 3.1%
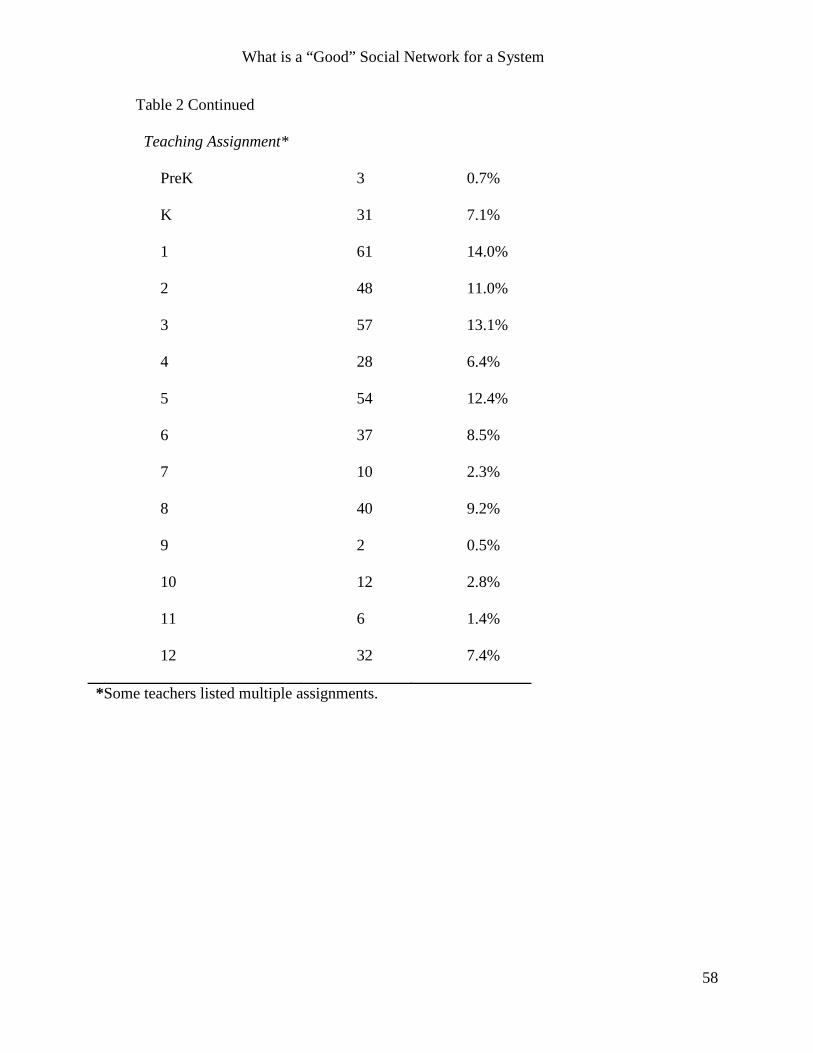
What is a “Good” Social Network for a System
58
Table 2 Continued
Teaching Assignment*
PreK 3 0.7%
K 31 7.1%
1 61 14.0%
2 48 11.0%
3 57 13.1%
4 28 6.4%
5 54 12.4%
6 37 8.5%
7 10 2.3%
8 40 9.2%
9 2 0.5%
10 12 2.8%
11 6 1.4%
12 32 7.4%
*Some teachers listed multiple assignments.

What is a “Good” Social Network for a System
59
Table 3
Correlations among Change in Level of Implementation of the School-wide Initiative
and Measures of Entropy
Change in implementation
of the school-wide initiative
Potential
receiver entropy
Potential provider
entropy
Potential receiver entropy -.059
Potential provider entropy -.654** .236
Mean .056 -.329 -.244
Std .759 .197 .160
* p < .05; ** p < .01; *** p < .01.

What is a “Good” Social Network for a System
60
Table 4
Regression of School Level Change in Implementation of the School-wide Initiative on
Measures of Entropy
Independent Variable Model 1 Model 2
(Potential
Confounding)
Intercept -.60
(.30)
-.44
(.35)
Potential receiver entropy 0.39
(0.70)
.28
(.71)
Potential provider entropy -3.22**
(.86)
-3.18**
(.87)
Duration of the school-wide
initiative
-.05
(.06)
R2
(adjusted R2)
.44
.38
.46
.37
* p < .05; ** p < .01. n=21 schools.

What is a “Good” Social Network for a System
61
Figure Captions
Figure 1: Crystallized Sociogram of Close Colleagues in Westville School
Figure 2. Talk about Technology Within and Between Subgroups at Westville including
Changes in Levels of Technology Use
Figure 3. Entropy: The Sum of Two Transformed Resource Flow Probabilities
Figure 4. Linear Trend between Potential Provider Entropy and Change in
Implementation of the School-wide Initiative

What is a “Good” Social Network for a System
62
Figure 1: Crystalized Sociogram of Close Colleagues in Westville School
B
C
D
E
-35
-25
-15
-5
5
15
25
35

What is a “Good” Social Network for a System
63
Figure 2. Talk about Technology Within and Between Subgroups at Westville including
Changes in Levels of Technology Use
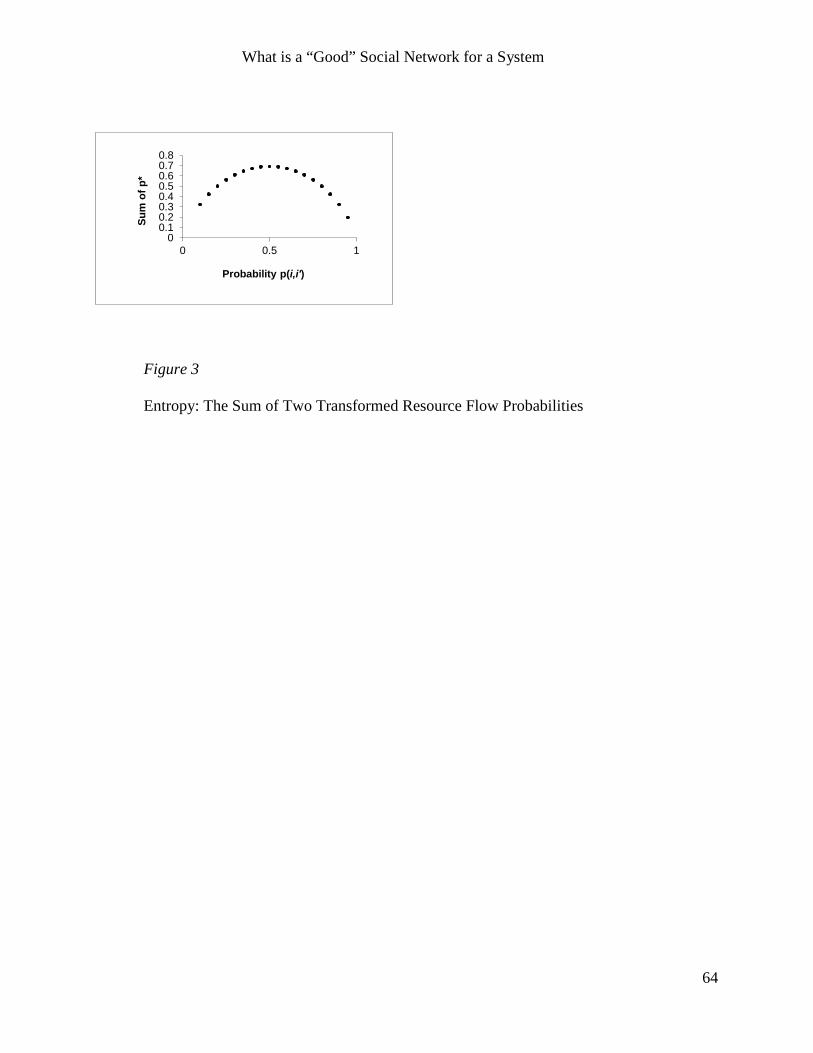
What is a “Good” Social Network for a System
64
Figure 3
Entropy: The Sum of Two Transformed Resource Flow Probabilities
00.10.20.30.40.50.60.70.8
0 0.5 1
Sum
of p
*
Probability p(i,i')

What is a “Good” Social Network for a System
65
Figure 4
Linear Trend between Potential Provider Entropy and Change in Implementation of the
School-wide Initiative
-2
-1.5
-1
-0.5
0
0.5
1
1.5
-0.6 -0.5 -0.4 -0.3 -0.2 -0.1 0
Cha
nge
in Im
plem
enta
tion
of In
itiat
ive
Potential Provider Entropy