what factors predict high school graduation in the los...
TRANSCRIPT

South Hall, Room 4722 www.lmri.ucsb.edu/dropouts Phone: 805-893-2683 University of California Fax: 805-893-8673 Santa Barbara, CA 93106-3220 Email: [email protected]
What Factors Predict High School Graduation in the Los Angeles Unified School District
California Dropout Research Project Report #14 June 2008
By
David Silver, Marisa Saunders, and Estela Zarate UCLA/IDEA and UC/ACCORD

ABSTRACT
Because the paths to high school graduation or to dropping out begin years before these events, identifying relevant school-related factors requires a comprehensive analysis of data at the district, school, and student levels. In collaboration with the Los Angeles Unified School District (LAUSD), the authors of this study analyzed district data to track the educational progress of all first-time 2001-02 9th graders from the 6th grade through to their expected graduation in the spring of 2005. This group consisted of 48,561 students who attended 163 LAUSD middle and high schools. The analysis of transcript records, standardized test scores, and a broad database of student and school characteristics sheds light on the middle and high school factors related to high school persistence and graduation.
The study exposes troubling rates of academic failure, but it also offers reasons for hope, demonstrating that academic experiences and school factors play a much larger role than student demographics in determining graduation rates, and that there is tremendous variation in the extent to which schools can have success with populations of students whose odds of graduation are typically quite poor.

1
Addressing California’s high school dropout crisis requires understanding the academic lives of students. Although the causes of dropping out are many and complex, students’ school experiences certainly play a critical role. Because the trajectories leading students either to high school graduation or to dropping out begin years before these events, identifying relevant school-related factors requires a comprehensive analysis of longitudinal district-, school-, and student-level data.
California currently lacks a statewide data system that permits such analyses. However, many school districts have such a system in place. This report examines the middle school and high school records of the students in the largest school district in the state, and the second largest in the country—the Los Angeles Unified School District (LAUSD)—using the district’s own longitudinal Student Information System. In addition to documenting which students persist to graduation and which ones do not, it identifies key times and circumstances, beginning in middle school, that relate to successful and unsuccessful schooling trajectories.
All other school districts in the state are small relative to LAUSD. In 2004-05, the Los Angeles Unified School District served over 740,000 students—more than five times the size of the next largest district in California. Approximately 350,000 LAUSD students were enrolled in the District’s 163 middle and high schools. This report explores the educational pathways of LAUSD’s middle school and high school students as they make their way towards high school graduation. Using a seven-year longitudinal dataset about the district’s 2005 graduating class, this study examines patterns of high school completion and persistence using a cohort analysis approach.1 Analyses of the middle and high school transcript records of this class of students, their standardized test scores, and characteristics of the schools they attended together provide valuable insight about the factors, beginning in middle school, related to high school persistence, achievement, and graduation. All graduation rates reported in this paper are on-time graduation rates (i.e. the percentage of 2001 first-time freshmen who graduate within four years).
Our analyses address three central sets of questions:
• What percentage of first-time LAUSD 9th graders graduates “on time”—that is, within 4 years of starting high school, and how do rates vary for groups with different characteristics (gender, racial/ethnic background, English Language status, and recipients of free/reduced lunch program)?
• Which student and school characteristics (in both middle school and high school) are associated with successful and unsuccessful persistence and high school completion?
1 Cohort analysis provides greater accuracy than traditional methods of reporting dropout and persistence rates. In this calculation, a cohort is longitudinally tracked as it moves through high school, starting from the time students enroll in the fall of 9th grade until they graduate four years later. Students who take more than four years to graduate are excluded from the four-year cohort graduation rate. Students who earn alternative high school graduation credentials are also excluded.

2
• Are there identified academic experiences, course-taking patterns, and/or circumstances that lead to successful and unsuccessful high school completion?
Background
In March, 2005, the Harvard Civil Rights Project released a study that exposed the alarmingly high dropout rate in California. Officially, the state reported an overall graduation rate approaching 87% in 2002; however using a more accurate measure, the Civil Rights Project study found the graduation rate for California to be significantly lower at 71%. The widely reported conclusion was that, although California has steadily increased its overall graduation rate from 64% in 1992 to 71% in 2002, the proportion of 9th graders who graduate—particularly in districts and schools with high minority concentrations—remains at “crisis level proportions” (Barton, 2005). In LAUSD, for example, an analysis conducted by the University of California All Campus Consortium on Research for Diversity (UC/ACCORD), approximated that only 45% of Black and Latino 9th graders in the fall of 1998 completed the 12th grade four years later (Oakes, et al, 2007). Although the Harvard Civil Rights Project’s and UC/ACCORD’s measures and reports of the likelihood that a 9th grader will graduate from high school four years later are among the most accurate published estimates, they rely on publicly available cross-sectional data, the use of which imposes serious limitations. Chief among these is the inability to control for important sources of error such as rates of grade retention and the effects of mobility (Roy & Mishel, 2008). These findings have sparked considerable debate and have motivated research focused on how best to measure the State’s graduation rate (de Cos, 2005) and the graduation rate in individual districts/regions (Nield & Balfanz, 2006; Allensworth & Easton, 2007); and on reform policies that might improve graduation rates. Among other undertakings within LAUSD, the Huizar Resolution to Research Best Practices within LAUSD to Increase Student Achievement authorized research to identify best schooling practices in middle schools and high schools that lead to successful high school graduation and completion of college preparation requirements. The findings shared in this report are derived from these efforts of the LAUSD in collaboration with city-wide community groups and organizations. Longitudinal data, provided by the District, created an opportunity to examine school and district patterns of high school completion using precise estimates of high school completion and a better gauge of the accuracy of current estimates. In particular, the massive size of LAUSD means that most students who transfer still remain in the system, providing an opportunity for researchers to follow students before and after they move, to assess the educational impact of mobility, and to largely disentangle mobility from dropout.
Review of the Literature
Prior research has identified critical transitions in the lives of all students as they move from family and neighborhood to school, from elementary to middle to high school to

3
college, and from school to work (Phelan, et al, 1994; Lucas, 1997). These transitions are especially critical for underrepresented2 students, in that they often mean contending with linguistic and cultural differences and striking out on unfamiliar life trajectories. The foci of this study are the critical transitions between middle school and high school and between 9th grade and high school graduation. These transitions are poorly understood and seldom studied. For example, because there is limited, large-scale longitudinal data on middle school experiences, it is not well understood how middle school factors influence high school completion or achievement. The National Center for Education Statistics (NCES) has designed a longitudinal survey (ECLS-B) that in the future will allow researchers to examine middle school academic experiences and their relation to elementary both earlier and later school experiences. However, this longitudinal survey is currently in its initial stages, and middle school data will not be available for several years. The National Education Longitudinal Study (NELS) is the only currently available, large-scale longitudinal data set that offers a view of 8th grade school performance and its relationship to post-secondary outcomes. Various studies using this database have found that taking algebra in the 8th grade, 8th grade aspirations (student and parent), 8th grade reading performance, geographic location of middle school, and academic tracking of 8th grade students all play a significant role in determining post-high school educational outcomes (Cabrera & La Nasa, 2000; Hurtado et al, 1997; Horn & Nunez, 2000; Swail et al., 2005). Indeed, pre-high school academic performance and schooling experiences seem to predict high school performance and post-high school college enrollment. Although the NELS data set and corresponding analyses have contributed to our understanding of the relevance of pre-high school factors to high school completion and post-high school educational status, it is difficult to make confident conclusions about the middle school experience with data that does not capture schooling experienced prior to the 8th grade. Smaller- scale studies make clear that early academic performance remains a crucial factor in determining who graduates from high school and who proceeds to college (Perna, 2005). A number of studies, for example, have found that high school performance and postsecondary educational status is influenced by a student’s academic trajectory beginning as early as elementary school (Zarate & Gallimore, in press). Longitudinal studies of cohorts, however, have been most successful in exposing patterns that often precede dropping out. Among these studies, Roderick (1993) found that educational experiences—academic performance and school engagement—are the best predictors of who will and will not graduate from high school. “Early dropouts” (those who leave prior to 9th grade) could be predicted by low grades dating back to their elementary school years, while “later dropouts” (those who leave between 10th and 12th grade) could not be predicted until they entered middle school or high school. Roderick found that the transition years functioned as decisive turning points for many dropouts. Although academic performance and attendance declined somewhat for most students 2 Underrepresented refers to groups under-represented at the University of California, including African Americans, Latinos, Native Americans, and Pacific Islanders.

4
during the transition to middle school and to high school, the decline was far steeper for those who would eventually leave school without a diploma. These findings are confirmed by a longitudinal analysis conducted by Neild and Balfanz (2006) of the School District in Philadelphia, showing that academic experiences play a critical role in students’ lack of persistence to high school graduation. And, many students begin to fall of the graduation track years before they enter the 9th grade. Attendance rates and course failure in math and English during 8th grade were found to have strong predictive power for high school completion. In another study, Balfanz, Herzog & Mac Iver (2007) found that, using attendance, behavior, and course failure in math and English as key predictive indicators, they were able to identify over half of the district’s future dropouts as early as the 6th grade. Hence, the transition into the high school setting at 9th grade can function to push students who have been struggling academically and/or have been disengaged for years off the path to graduation. In summary, there is much evidence that high school completion and post-high school educational status are not a function of high school educational experiences alone. In some cases, early educational experiences can predict the high school track in which students are assigned, which in turn can influence educational outcomes (Gonzalez et al., 2003; Oakes, 1985/2005). Education is a cumulative process in which high school academic success is informed by earlier academic experiences. Yet, a more precise understanding of early school factors that influence high school performance is needed to formulate pre-high school interventions that can improve high school completion rates. The present study builds on the research summarized above as well as on previous research and identifies critical conditions for academic success at the high school level (Oakes, et al., 2007). The latter body of work demonstrates that longitudinal, student-level data that includes the characteristics of the schools students attend allows for more rigorous examination of the relationship between school conditions and student outcomes (Oakes et al., 2007). In particular, indicators of “best practices” or school conditions and learning opportunities serve as useful predictors of higher rates of graduation, college readiness, and college admission. These indicators characterize the nature of a complex and hard- to-measure system by regularly measuring some of its key components (Shavelson et al., 1989; Oakes, 1986). For example, a study of high school freshmen, conducted by the Chicago Consortium on School Research (CCSR), identified indicators of high school completion based on freshman-year course performance. Inadequate credit accumulation in the freshman year, usually the result of course failures, was found to be highly predictive of a failure to graduate four years later. While the CCSR study demonstrates that success in coursework is more affected by students’ high school efforts and success strategies than by previous preparation for high school and background, the study also demonstrates that teachers and schools impact students’ performance (Allensworth & Easton, 2007). Additional studies have found that the schools’ social organization (e.g., teacher/student relationships) and academic organization are associated with the likelihood of dropout (Lee & Burkham, 2000).
5
Together, these prior studies make clear that longitudinal analysis can illuminate the educational pathways and experiences of students. Understanding these experiences can lead to the identification of factors that lead to high school graduation and those that detract from this outcome. Such findings provide both an accurate documentation of students’ trajectories through high school and insight into the points at which intervention can be most powerful.
Methods
Our analysis of a seven-year longitudinal dataset of the LAUSD’s class of 2005 examined over one million course-taking records of students who attended district schools from 1998-99 through December, 2005, as well as demographic, testing, attendance, and graduation data. We linked these student-level data to school-level data to gain a comprehensive understanding of student and school factors that lead to, or serve as obstacles on the path to, high school graduation. We conducted descriptive analyses of the on-time graduation rates for students who differed in background characteristics, attended schools with different characteristics, and had different academic histories. Multilevel logistic regression was then conducted to illustrate the independent and combined effects of various factors related to high school graduation, and to do so while accounting for the nested structure of the data. We focused our analyses on the cohort of 48,561 students who entered the 9th grade for the first time in 2001-02 who were expected to be members of LAUSD’s graduating class of 2005. The middle school analysis of this cohort of first-time 9th graders includes only those 9th graders for whom middle school records were available.3 To arrive at the final sample of first-time 9th graders, we began with all 2001-02 9th graders who had attended LAUSD as 6th graders in 1998-99, 7th graders in 1999-00, or 8th grade in 2000-01. We then added 9th graders who were new to the system in 2001-02. Official transfers out of LAUSD are excluded from the sample (less than 1%).4
3 Over 4,000 first-time freshmen did not have 8th grade records, and the middle school records of 1,400 first-time freshmen did not contain any demographic information. These students were excluded from our middle school analysis of LAUSD’s cohort of first-time freshmen in 2001-02, generating a sample of 39,616 students. 4 The final dataset was culled from 70,108 9th graders in 2001-02 who attended at least one day of school; 46,574 of those are confirmed first-time 9th graders who progressed from 8th grade to 9th grade in 2001. An additional 4,749 were new to the system as 9th graders bringing the cohort to 51,323. However, after removing those students with no record of completing a single course and r those who transferred out of the district (.6%) a final first-time 9th grade sample of 48,564 students was established. This cohort is considerably smaller than LAUSD’s full 9th grade class in 2001-2002, which the California Department of Education reports to include 64,307 students. The latter statistic is based on October enrollment for all 9th graders, including repeaters.
6
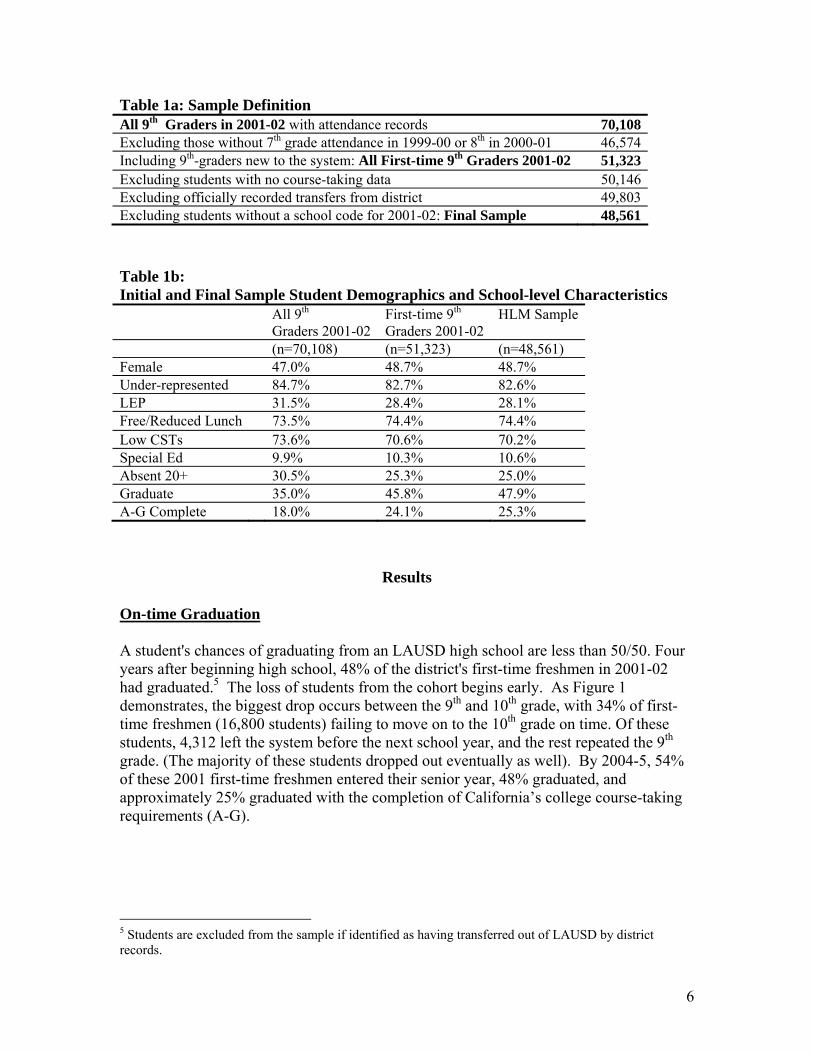
Table 1a: Sample Definition All 9th Graders in 2001-02 with attendance records 70,108 Excluding those without 7th grade attendance in 1999-00 or 8th in 2000-01 46,574 Including 9th-graders new to the system: All First-time 9th Graders 2001-02 51,323 Excluding students with no course-taking data 50,146 Excluding officially recorded transfers from district 49,803 Excluding students without a school code for 2001-02: Final Sample 48,561 Table 1b: Initial and Final Sample Student Demographics and School-level Characteristics All 9th
Graders 2001-02First-time 9th Graders 2001-02
HLM Sample
(n=70,108) (n=51,323) (n=48,561) Female 47.0% 48.7% 48.7% Under-represented 84.7% 82.7% 82.6% LEP 31.5% 28.4% 28.1% Free/Reduced Lunch 73.5% 74.4% 74.4% Low CSTs 73.6% 70.6% 70.2% Special Ed 9.9% 10.3% 10.6% Absent 20+ 30.5% 25.3% 25.0% Graduate 35.0% 45.8% 47.9% A-G Complete 18.0% 24.1% 25.3%
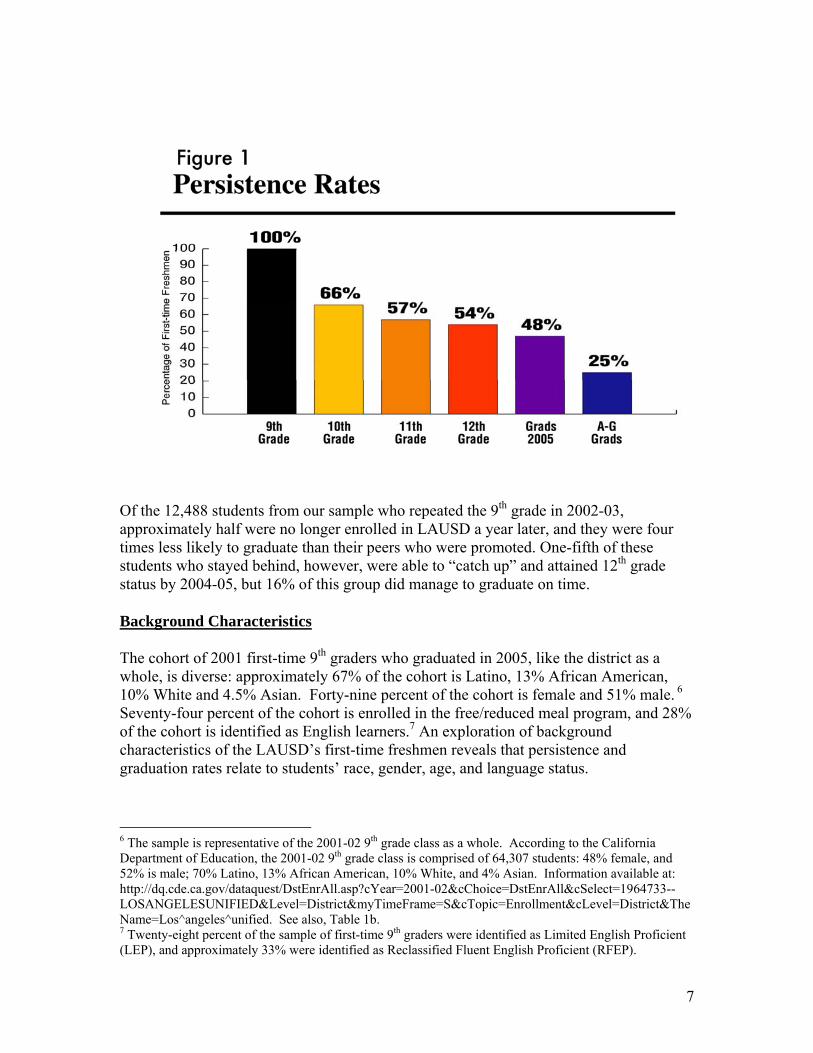
Results On-time Graduation A student's chances of graduating from an LAUSD high school are less than 50/50. Four years after beginning high school, 48% of the district's first-time freshmen in 2001-02 had graduated.5 The loss of students from the cohort begins early. As Figure 1 demonstrates, the biggest drop occurs between the 9th and 10th grade, with 34% of first-time freshmen (16,800 students) failing to move on to the 10th grade on time. Of these students, 4,312 left the system before the next school year, and the rest repeated the 9th grade. (The majority of these students dropped out eventually as well). By 2004-5, 54% of these 2001 first-time freshmen entered their senior year, 48% graduated, and approximately 25% graduated with the completion of California’s college course-taking requirements (A-G).
5 Students are excluded from the sample if identified as having transferred out of LAUSD by district records.
7
Of the 12,488 students from our sample who repeated the 9th grade in 2002-03, approximately half were no longer enrolled in LAUSD a year later, and they were four times less likely to graduate than their peers who were promoted. One-fifth of these students who stayed behind, however, were able to “catch up” and attained 12th grade status by 2004-05, but 16% of this group did manage to graduate on time.
Background Characteristics
The cohort of 2001 first-time 9th graders who graduated in 2005, like the district as a whole, is diverse: approximately 67% of the cohort is Latino, 13% African American, 10% White and 4.5% Asian. Forty-nine percent of the cohort is female and 51% male. 6 Seventy-four percent of the cohort is enrolled in the free/reduced meal program, and 28% of the cohort is identified as English learners.7 An exploration of background characteristics of the LAUSD’s first-time freshmen reveals that persistence and graduation rates relate to students’ race, gender, age, and language status.
6 The sample is representative of the 2001-02 9th grade class as a whole. According to the California Department of Education, the 2001-02 9th grade class is comprised of 64,307 students: 48% female, and 52% is male; 70% Latino, 13% African American, 10% White, and 4% Asian. Information available at: http://dq.cde.ca.gov/dataquest/DstEnrAll.asp?cYear=2001-02&cChoice=DstEnrAll&cSelect=1964733--LOSANGELESUNIFIED&Level=District&myTimeFrame=S&cTopic=Enrollment&cLevel=District&TheName=Los^angeles^unified. See also, Table 1b. 7 Twenty-eight percent of the sample of first-time 9th graders were identified as Limited English Proficient (LEP), and approximately 33% were identified as Reclassified Fluent English Proficient (RFEP).
8
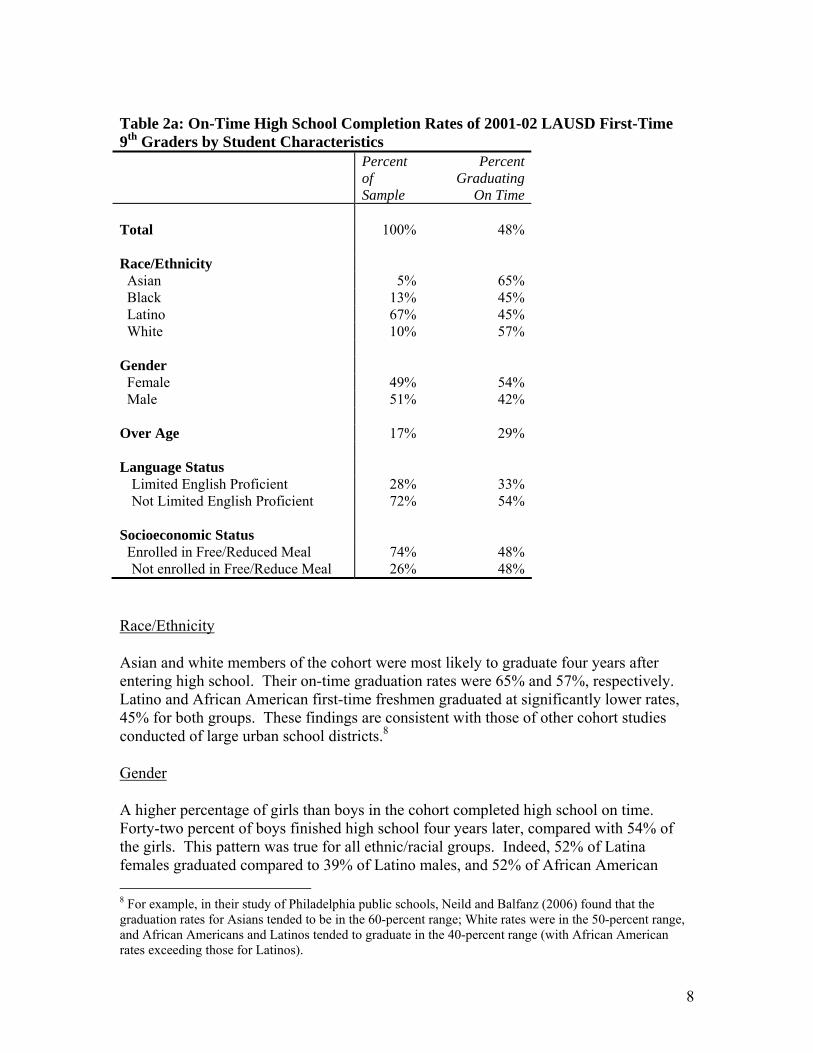
Table 2a: On-Time High School Completion Rates of 2001-02 LAUSD First-Time 9th Graders by Student Characteristics Percent
of Sample
Percent Graduating
On Time Total 100% 48% Race/Ethnicity Asian 5% 65% Black 13% 45% Latino 67% 45% White 10% 57% Gender Female 49% 54% Male 51% 42% Over Age 17% 29% Language Status
Limited English Proficient 28% 33%Not Limited English Proficient 72% 54%
Socioeconomic Status Enrolled in Free/Reduced Meal 74% 48%
Not enrolled in Free/Reduce Meal 26% 48%
Race/Ethnicity
Asian and white members of the cohort were most likely to graduate four years after entering high school. Their on-time graduation rates were 65% and 57%, respectively. Latino and African American first-time freshmen graduated at significantly lower rates, 45% for both groups. These findings are consistent with those of other cohort studies conducted of large urban school districts.8
Gender
A higher percentage of girls than boys in the cohort completed high school on time. Forty-two percent of boys finished high school four years later, compared with 54% of the girls. This pattern was true for all ethnic/racial groups. Indeed, 52% of Latina females graduated compared to 39% of Latino males, and 52% of African American 8 For example, in their study of Philadelphia public schools, Neild and Balfanz (2006) found that the graduation rates for Asians tended to be in the 60-percent range; White rates were in the 50-percent range, and African Americans and Latinos tended to graduate in the 40-percent range (with African American rates exceeding those for Latinos).

9
females graduated compared to 38% of African American males. Similarly, 63% of White females graduated compared to 53% of White males, and 69% of Asian females compared to 61% of Asian males.
Age
Being over age – being born before the December 1 cutoff for the year that typically defines a cohort – is a proxy for grade retention prior to high school. Graduation rates are reduced by almost half for those students who are over age when they enter the 9th grade.9 Approximately 29% of over-age students graduated on-time compared to 52% of those students who were not. LAUSD loses these students at a rapid but even pace, with approximately 18% of them leaving the system each year.
Language
Significant differences were found between the graduation rates of students who were designated Limited English Proficient (LEP) in the 9th grade and those who had been redesignated as fluent-English proficient (FFEP). Only 33% of students who were identified LEP in 9th grade graduated four years later compared to 58% of students who had been redesignated prior to entering high school, and compared to 54% of a larger sample of students who were not LEP in 9th grade (this includes RFEP students). Interestingly, there were no differences in high school completion rates between students whose home language was English or Spanish.10 Half of those students who reported living in English-speaking households and half who reported living in Spanish-speaking households on the district’s Home Language Survey completed high school four years later. These findings might be partially explained by the large number of Standard English Learners (SELs) enrolled within the LAUSD. SELs are those students for whom Standard English is not their native language yet are often classified as “English Only” because their home language generally incorporates English vocabulary.11 Notably, however, students who indicated that they spoke a language other than English or Spanish at home were more likely to complete high school than those from either English or Spanish speaking households. These students had a high school completion rate of 67%. That differences in high school graduation rates are identified based on student background characteristics is not surprising, given that opportunities to learn often differ based on the population of students served (UC/ACCORD, 2007). Middle and high
9 Students were determined to be overage if his/her date of birth fell at least one year prior to the cut-off date for entry into Kindergarten within the LAUSD. In this case, students who were born before Dec. 1, 1986 are considered overage for grade level. 10 Results using Home Language Survey use information from middle school transcripts and rely on a smaller sample of students as discussed in our methods section. English Language status and associated on-time graduation rates are based on our larger sample of first-time 9th graders. 11 Languages spoken by SELs include African American language (AL), sometimes referred to as African American English; Mexican American Language (ML) also referred to as Chicano English; Hawaiian American Language (HL) also referred to as Hawaiian Pidgin English; and Native American Language (NL) sometimes referred to as American Indian English or Red English.

10
schools in which the majority of students are from underrepresented groups are most likely to grapple with critical learning opportunity problems such as overcrowding, limited access to qualified secondary teachers, and limited access to a rigorous, a high-quality, college preparatory curriculum. As the LAUSD data demonstrate, attending a high-resource school with qualified teachers and critical learning conditions makes a big difference in one's prospects for graduating. School Characteristics The characteristics of schools attended by first-time 9th graders during their middle and high school years relate to students’ graduation rates. Previous research has demonstrated that conditions such as overcrowding, limited, access to qualified teachers, concentrations of poverty, and racial isolation are associated with lower rates of academic achievement rates (UC ACCORD, 2007; Darling-Hammond, 2004; Darling-Hammond, 2007; White & Cantrell, 2001; Shields et al., 1999; Sanders & Rivers, 1996). In this section we explore these conditions in LAUSD and, when possible, provide the associated graduation rates for students who attend schools with such characteristics. In addition, we explore the impact of attending a magnet school during middle and high school within the LAUSD. Table 2b: Graduation Rates by School Characteristics* Percent
of Sample
Percent Graduating
On Time Total 100% 48% Teachers
20% + w/o full credentials 9% 35%< 20 w/o full credentials 91% 49%
Concentration of Poverty
Title 1 44% 44%Non Title-1 56% 51%
Racial Isolation
90-100% African American or Latino 47% 45%< 90% African American or Latino 54% 50%
English Learners
33% + ELs 37% 42%< 33% ELs 63% 51%
School Type
Magnet 12% 73%Non-Magnet 88% 45%
*School characteristics of 9th-grade School.

11
Qualified Teacher Shortage High concentrations of teachers within a school who are not fully credentialed can cause a series of school-level problems. Concentrations of underqualified teachers that exceed one-fifth “can create problems throughout the entire school community” (Shields et al., 1999, p. 47). These difficulties include a lack of mentors; high turnover of untrained teachers leading to instability and persistent hiring concerns; and a deterioration of professional development (Darling-Hammond, 2004). At the student-level, attending a school with a high concentration of teachers who are not fully credentialed increases the student’s chance of encountering a teacher that possesses less content area knowledge, relies heavily on lecturing, and is ill-equipped to engage students in higher-order thinking and assignments. Further, it increases the chance of a student’s encountering an ongoing sequence of these teachers. This cumulative effect is much more damaging to a student’s learning than one semester or one year of poor teaching (Sanders & Rivers, 1996). Students who completed a high school diploma, in general, have been shown to have had greater access to qualified teachers in both middle school and high school. Students who attended middle schools where more than one-fifth of the teachers were not fully certified graduated from high school at lower rates (51%) than did students who attended middle schools without such severe shortages of fully certified teachers (63%).12 Similarly, students who attended high schools where more than one-fifth of the teachers were not fully certified graduated from high school at lower rates (35%) than did students who attended high school where fewer than one-fifth of the teachers were not fully certified (49%).13
High Concentrations of English Learners Confronting many of the same conditions (e.g., overcrowding, and teacher shortages) that plague racially and economically isolated schools, only one in three students attending high schools that serve a high concentration of English Learners will ultimately graduate. In addition to more limited resources that many of these schools face, staffing for English language learning programs may be severely over-taxed. Magnet Schools First-time freshmen who attend a middle school or high school that participates in the LAUSD CHOICES Program (LAUSD’s Court-Ordered voluntary integration program)
12 Based on 1999-2000 staffing data. Available from California Basic Educational Data System (CBEDS), Professional Assignment Information Form (PAIF). 13 Based on 2004-05 staffing data. Available from California Basic Educational Data System (CBEDS), Professional Assignment Information Form (PAIF).

12
graduate from high school at higher rates than students not enrolled in the CHOICES program.14 First-time freshmen who attended a magnet school or center during middle school had a 68% chance of graduating compared to 51% for those students who did not attend a magnet middle school.15 The impact of magnet school attendance is even greater at the high school level. The chance of high school graduation for first-time freshmen who attended a magnet school in high school is 73% compared to 45% for non-magnet school attendees. These large differences in graduation rates for students who attend a magnet middle school or high school might be attributed, in part, to the theme-based nature of magnet schools, wherein students choose to attend a school based on their interest in the theme offered (e.g., humanities, math/science, medical, fine arts, etcetera). In this way, magnet schools attempt to address the issue of student disengagement and disinterest. Further, by design, these schools provide a racially and ethnically diverse setting. As our findings suggest, students who attend racially isolated middle schools and high schools do not fare as well in completing a high school diploma as students who attend middle schools with larger percentages of White and Asian students. Finally, research on LAUSD magnet schools (Griffin, Allen, Kimura-Walsh & Yamamura, 2007) found that students attending a magnet school had increased access to “college-going resources and greater opportunities to learn.” Middle School Academic Experiences Although student demographics and high school characteristics can be meaningful predictors of high school completion or dropout, these factors are insufficient to fully understand the path to high school graduation. Researchers have shown that high school graduation is the product of a student’s cumulative academic experiences (Alexander, Entwisle & Kabbini, 2001). In particular, dropping out is often the concluding act of a long series of events that reveal disengagement such as course failures and absences. As such, there is growing evidence that potential high school dropouts can be identified during their middle school years. Through an examination of the LAUSD students’ middle school records we explore precursors to successful and unsuccessful high school completion that can be identified prior to entering high school. The likelihood of dropping out of school is greatest for 9th graders. This critical transition year to high school may intensify pre-existing academic disengagement and/or difficulties (Allensworth & Easton, 2005; Neild & Balfanz, 2006). While students are less likely to drop out after the 10th grade, many of them do drop out in subsequent years. Consequently, we also explore academic experiences in high school that lead to high school persistence, graduation or dropout. At both the middle and high school we
14 The LAUSD maintains 106 magnet programs that serve middle school and high school students. Information available at http://choices.lausd.net/Mag/MagSchoollist.aspx 15 Based on 8th grade enrollments.

13
examine the importance of course grades and failures; attendance rates; standardized test scores; and course-taking patterns. Table 3: Graduation Rates by Academic Experiences and Achievement Percent
of Sample
Percent Graduating
On Time Total 100% 48% Academic Background Middle School Fs (two or more) 26% 40% Low CST (9th grade below/far below basic) 70% 46%
Basic or higher on CST 30% 71% Over age for typical 9th grader 17% 29%
High School Achievement More than 10% Fs 61% 55% Passes Algebra by end of 9th grade 38% 70%
Does not Pass Algebra 63% 35%
Mobility Attends more than one high school 18% 32%Attends a single high school 82% 57%
Failing Classes
Middle School. Approximately half (49%) of the students in the cohort failed at least one core academic class16 during their middle school years (6th through 8th grade). This high rate of failure is significant, in that students who failed a core academic middle school course demonstrated lower rates of high school completion. Sixty-nine percent of the students who never failed a class in middle school graduated on time, compared with less than 50% of those who failed at least one course. In fact, students who did not graduate on time failed, on average, four times as many middle school classes (3.5 failed classes) as those who graduated (1 failed class). And, only 18% of students who failed 8 or more core academic classes throughout their middle school experience, completed high school on time. The timing of a failed class in middle school also affects the chances of graduating. Students who fail classes in 6th grade or 7th grade only, but recover (that is, fail no classes in 8th grade), graduate from high school at much higher rates than those students who continue their pattern of failing courses. Additionally, students who only fail classes closer to the transition to high school (in 8th grade) are at greater risk of not completing
16 Courses in four academic areas are considered in these analyses: mathematics, English language arts, science, and social science.

14
high school than those who only fail classes earlier. Students for whom class failure becomes a pattern are most at risk of not graduating; less than 20% of students who failed classes in all three years of middle school graduated from high school. High School. Course failure is also a common occurrence for students enrolled in District high schools. Over three-quarters (77%) of the cohort failed at least one academic core course during their high school years. Members of the cohort who went on to graduate failed an average of 9% of their core academic high school courses; those who did not graduate failed almost half of all their core academic courses (47%) prior to dropout. Failing one academic high school course is associated with a 64% chance of graduating, and each successive failure is associated with approximately 10% further reduction in graduation rate. The association between middle school course failure and high school graduation is strong.
As bleak as these statistics are, they actually understate the prevalence of failure in many core classes. On average, 65% of students in any given Algebra 1 class in the district will fail. The numbers are only slightly better for other courses: 51% fail Geometry A, 49% fail Biology A, 48% fail World History A, and 43% fail English 10A. In the most troubled schools, of course, the passing rates (not to mention rates of mastery) are even worse, so one can imagine the tremendous challenges that students must overcome to be successful in this context. Teachers must be exceptional, and students need to find focus amidst intellectual chaos. Nonetheless, nearly half of those who failed more than three core courses still managed to graduate on time. In other words, in the right setting, students with prior academic struggles may still prosper. The multilevel models presented in the following section will shed some light on the process by which struggling students may be able to recover.

15
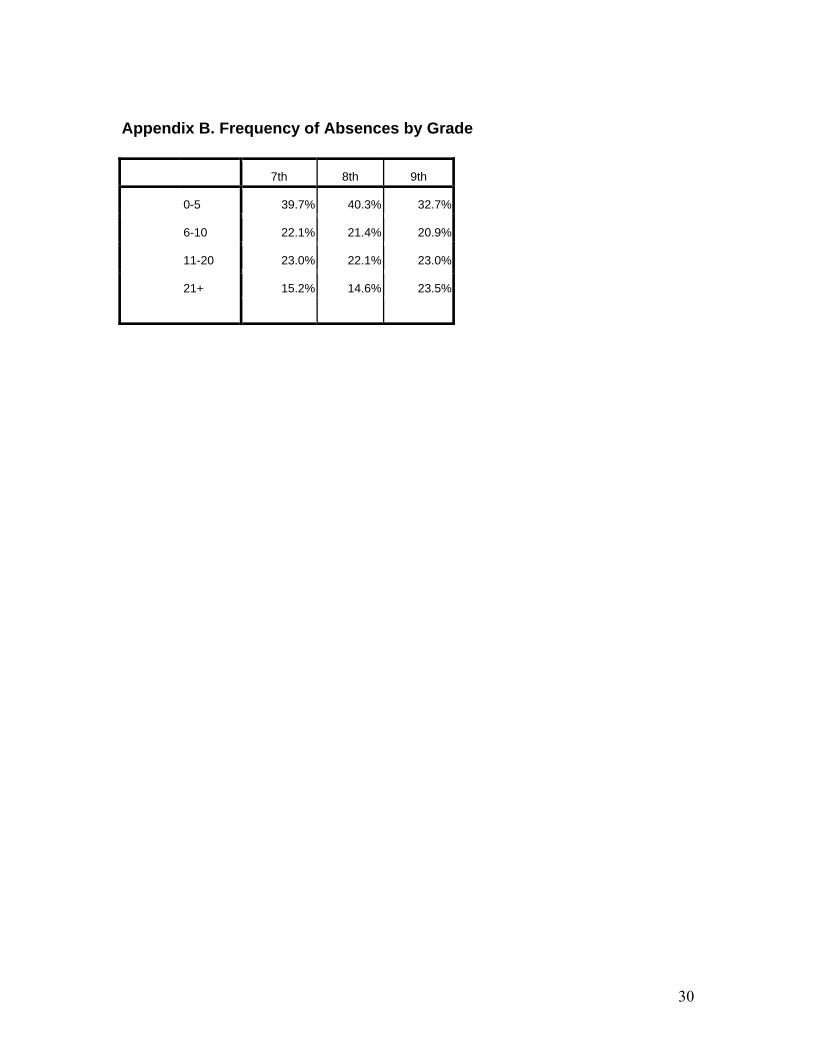
Algebra The rate of failure in Algebra is particularly problematic because of the pivotal role that the course has been shown to play as the “gateway” to more advanced mathematics, high school graduation, and postsecondary education opportunities.17 Students who passed Algebra 1 by their freshman year of high school graduated at much higher rates than students who had not passed Algebra 1 by the 9th grade. (The graduation rate was two times greater: 70% vs. 35%). Attendance Like failing classes, frequent absences usually indicate students’ disengagement from school. As such, poor attendance can signal the probability of dropping out. For example, members of the cohort who did not complete high school were absent, on average, twice as often when they were 7th and 8th graders as those who did graduate on time (14-15 days compared to 7 days per year). As Figure 3 demonstrates, absences at the middle school and high school level have a significant and similar impact on high school completion: students who missed an average of 0 to 5 days of school in the 7th, 8th,, or 9th grades graduated at a rates of 65% to 69%. The chance of graduating dropped to approximately 40% for students who were absent an average of 10 to 20 days, and dropped to between 17% and 24% for those students who were absent 21 days or more (more than 10% of the school year).18
17 The state of California required students to complete Algebra in order to receive a high school diploma, starting with the Class of 2004. 18 See Appendix B for frequencies in each category of absences.

16
Test Scores
Middle School SAT-9 Scores. Performance on middle school standardized tests is associated with high school completion rates. At every level, at least as early as grade 6, test scores are predictive of graduation – and the relationship is persistent over time. Fewer than half of students scoring below the 50th percentile will graduate, whether we are talking about 6th-grade, 7th-grade s, or 8th-grade scores, and whether we are talking about performance in math or language arts. On the other hand, nearly three quarters of students with higher scores will go on to graduate.
High School California Standardized Test (CST) Scores. Almost three-quarters (70%) of the cohort scored “below basic” or “far below basic” on either the math or English language arts portion of the California Standards Tests (CST) in the 9th grade. Approximately 46% of these relatively low-performers graduated from high school four years later compared to 71% of students who score in the range of basic, proficient, or advanced. As in the case with middle school standardized test score results, we found very little difference in the likelihood of graduating from high school between students’ scores on the English language arts or the and math portions of the CST.
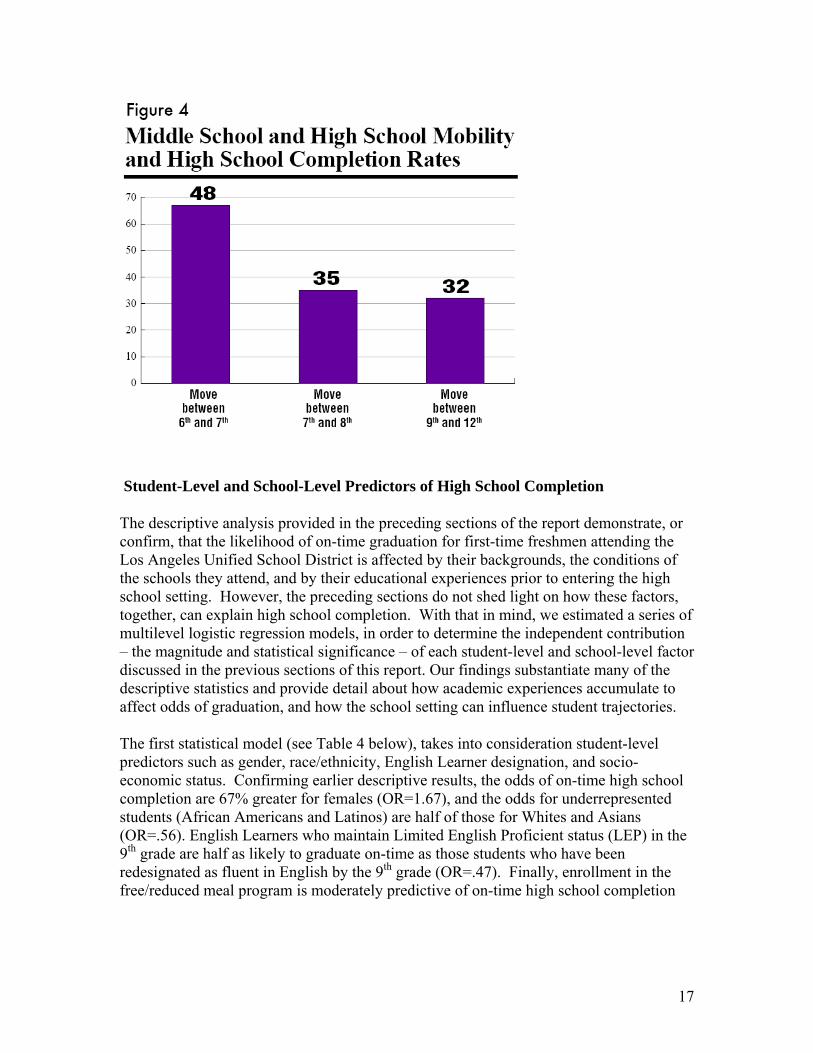
Mobility
Middle School. Changing middle schools can be particularly disruptive to young adolescents’ progress toward high school graduation. Although only 8% of the cohort changed schools between 6th and 7th grade and only 6% changed middle schools between 7th and 8th, these students had considerably lower graduation rates from high school than their peers who did not change middle schools. Fifty-four percent of students who remained at the same middle school from grades 6-8 graduated from high school; the comparable figure for students who changed middle schools between 6th and 7th grade was 48%, and for students who changed schools between 7th and 8th grade , only 35%. High School. Most high school students within LAUSD also remain at the same school throughout their high school careers, but the 18% of first-time freshmen who changed schools at least once were at greater risk of dropping out. Only 32% graduated four years later, compared with approximately 57% of students who did not change high schools. These findings suggest that mobility may take a higher toll on older students, who face increasing complexity of both schoolwork and social interactions.
17
Student-Level and School-Level Predictors of High School Completion
The descriptive analysis provided in the preceding sections of the report demonstrate, or confirm, that the likelihood of on-time graduation for first-time freshmen attending the Los Angeles Unified School District is affected by their backgrounds, the conditions of the schools they attend, and by their educational experiences prior to entering the high school setting. However, the preceding sections do not shed light on how these factors, together, can explain high school completion. With that in mind, we estimated a series of multilevel logistic regression models, in order to determine the independent contribution – the magnitude and statistical significance – of each student-level and school-level factor discussed in the previous sections of this report. Our findings substantiate many of the descriptive statistics and provide detail about how academic experiences accumulate to affect odds of graduation, and how the school setting can influence student trajectories.
The first statistical model (see Table 4 below), takes into consideration student-level predictors such as gender, race/ethnicity, English Learner designation, and socio-economic status. Confirming earlier descriptive results, the odds of on-time high school completion are 67% greater for females (OR=1.67), and the odds for underrepresented students (African Americans and Latinos) are half of those for Whites and Asians (OR=.56). English Learners who maintain Limited English Proficient status (LEP) in the 9th grade are half as likely to graduate on-time as those students who have been redesignated as fluent in English by the 9th grade (OR=.47). Finally, enrollment in the free/reduced meal program is moderately predictive of on-time high school completion

18
(OR=1.29).19 FRL is a flawed SES indicator, especially in high school.20 LAUSD data show that graduation rates are equivalent (48%) for those qualified for FRL in 9th grade as those who are not. The odds of graduation are 23% greater for those qualifying for FRL than others, after controlling for gender, ethnicity, and English proficiency. (Students receiving FRL are more likely to graduate than others of the same gender, ethnicity and English proficiency.) These demographic factors, together, explain 4% of the variation in student-level graduation outcomes in the cohort of students expected to graduate from the LAUSD in 2004-05.21
Table 4: Odds of On-Time Completion from Student-Level HLM
Bivariate Odds
Model 1 Model 2 Model 3
Demographic
Female 1.54*** 1.52 *** 1.28 *** 1.18 *** Under-represented 0.61*** 0.62 *** 0.80 *** 1.15 *** LEP 0.50*** 0.52 *** 0.64 *** 0.69 *** Free/Reduced Meal 1.08 1.23 *** 1.20 *** 1.18 ***
Academic background 2+ Fs in MS 0.26*** 0.31 *** 0.54 *** Over Age in 9th Grade 0.46*** 0.51 *** 0.52 *** Low 9th Grade CSTs 0.44*** 0.64 *** 0.93 Mobility in HS 0.39*** 0.44 *** 0.52 ***
HS Achievement Passed Algebra 1 by 9th 3.61*** 1.76 *** 10% Fs in HS 0.13*** 0.20 ***
* p<.05; ** p<.01; ***p<.001 ª The equation for the final level-1 model is: Prob(Graduation=1|β) = φ; log[φ/(1-φ)] = η. η = β0 + β1(Female) + β2(URM) + β3(LEP) + β4(FRL) + β5(Middle School Fs) + β6(Over Age) + β7(Low CST Scores) + β8(Mobility) + β9(Passed Algebra) + β10(High School Fs) + u0
The second model adds variables that capture the middle school and early high school academic backgrounds of first-time freshmen. The "Over Age" variable is a proxy for grade retention prior to grade 9. In addition, we considered mobility, middle school course failures, and proficiency level on 9th grade California Standardized Tests.
19 Effect sizes are those proposed by Rumberger & Arellano (2007): a small odds ratio = 1.50 (positive) or .67 (negative); a medium odds ratio = 2.00 (positive) or .50 (negative); a large odds ratio = 4.00 (positive) or .25 (negative). 20 Privacy concerns prevent schools from collecting data on students’ family income, and education researchers often use students’ enrollment in Free/Reduced meal programs to measure concentrations of poverty at the school level. However, not all eligible students are enrolled in the free/reduced meal program, so these numbers often do not reflect all low-income students. This is particularly problematic at the high school level where a large percentage of eligible students do not enroll in the program. 21 This approximation is the reduction in total level-1 variance using variance components from multilevel models treating graduation as a continuous outcome [1-(Model 1 variance/null model variance)].
19
Together, this cluster of variables captures the past and current educational experiences (both in and out of school) of the sample. In particular, this cluster takes into consideration the middle school experiences of students (9th grade CST scores are meant to capture learning up to spring of 2002). All of these variables were significant predictors of on-time graduation, and reduced the impact of all the demographic variables in the model. In particular, controlling for academic background reduced the significance and size of the predictor of race/ethnicity in the model. This suggests that the lower on-time completion rates of underrepresented students in LAUSD can be partially explained by other variables in the model such as middle school academic experiences. Demographic and academic background variables, taken together, account for approximately 17% of the variation in graduation rates at the student level.22
The addition of high school academic variables in the third model—high school course failures and successful Algebra completion by the 9th grade—continues to reduce both the effect and magnitude of the demographic predictors in the model. Controlling for other variables, the odds of on-time high school graduation were significantly lower for those students who failed 10% or more of their high school core courses versus those who did not (OR=.2). In addition, those students who passed Algebra 1 by the 9th grade increased their odds of on-time graduation by more than 75%. Interestingly, the addition of these variables reduced the effect of several academic background variables (in particular, the size of the effect of middle school grades and first-year high school test scores). When indicators of high school performance are taken into consideration (rather than academic background alone), the variation in graduation rates explained by the model increases from 17% to 29%. These findings suggest that high school achievement, persistence and graduation depend in part on the accumulation of past academic experiences, but also that experiences during high school may be pivotal in altering academic outcomes.
In order to examine the impact of school-level conditions on high school completion, three level-two models examined the effects of school characteristics on average graduation rates. A broad range of variables measuring both school conditions and resources were examined to predict on-time high school completion, and three variables in particular appear to be important: the percentage of English Learners at a school, whether the school is a magnet school, and the qualifications of the teachers. Models 4, 5, and 6, respectively, summarize these effects. Schools clearly cannot change the background characteristics of the students they serve, but these models suggest that the academic experiences of students in middle school and high school can significantly improve (or undermine) their chances. School practices, resources, and critical learning conditions matter tremendously.
The effects of school conditions and resources account for much of the explained variance in on-time high school completion within the LAUSD. Schools with high concentrations of LEP-classified students tend to have much lower graduation rates, even when controlling for student and school characteristics such as ethnicity and minority group isolation. The effect is cumulative -- and actually somewhat larger than – the effect 22 1-(Model 2 variance/null model variance), again using continuous outcome approximation.

20
of simply being a LEP student. Adjusted odds of graduation are about 30% lower for LEP students than for others, and they are 40% lower for those attending schools with large LEP populations. The school effect, which can perhaps be thought of as an aggregate measure of a school's need for quality English Learner instruction, explains over one- third of the variation in on-time completion rates. Whether a school is classified as a magnet explains another 12%. There was no direct effect on graduation of teacher credential rate, but teaching appears to moderate the effects of important student characteristics (LEP, Low CST scores, and middle school course failure), reducing the risk associated with each of these factors by up to 40%. This finding may help to explain an important disagreement in education research. Specifically, some empirical research points to the importance of a highly-qualified teaching staff (Oakes, Mendoza, and Silver) and other work questions the association between teacher credentials and student achievement (Pianta, et al., 2007; ETS, 2004). The simple answer may be that models that treat the associations between background achievement measures and academic outcomes as fixed effects (not varying across classrooms or schools) are not designed to detect the most important roles that teacher experience, qualifications, and quality most likely play – namely as resources that help students succeed under difficult circumstances. When background achievement measures are treated as random variables that predict outcomes differently at different schools, as they in fact do, it becomes clear that their influence on graduation can be explained in part by the quality of the teaching staff.23 This is the case even when using the often-criticized teacher quality indicator, the credential rate. (It should be noted that this is the State of California's only official indicator of teacher quality.) Together, the school-level variables measuring LEP concentration, magnet program participation, and teacher credential rates explained 42% of the variation in graduation within the LAUSD in 2004-05. Table 5: Odds of On-Time Completion from School-Level HLM
Model 4 Model 5
School Conditions More than 30% LEP 0.52 *** 0.63 ***
School Type Magnet School 2.7 ***
* p<.05; ** p<.01; ***p<.001
23 See Appendix A for detailed description of the multilevel modeling.
21
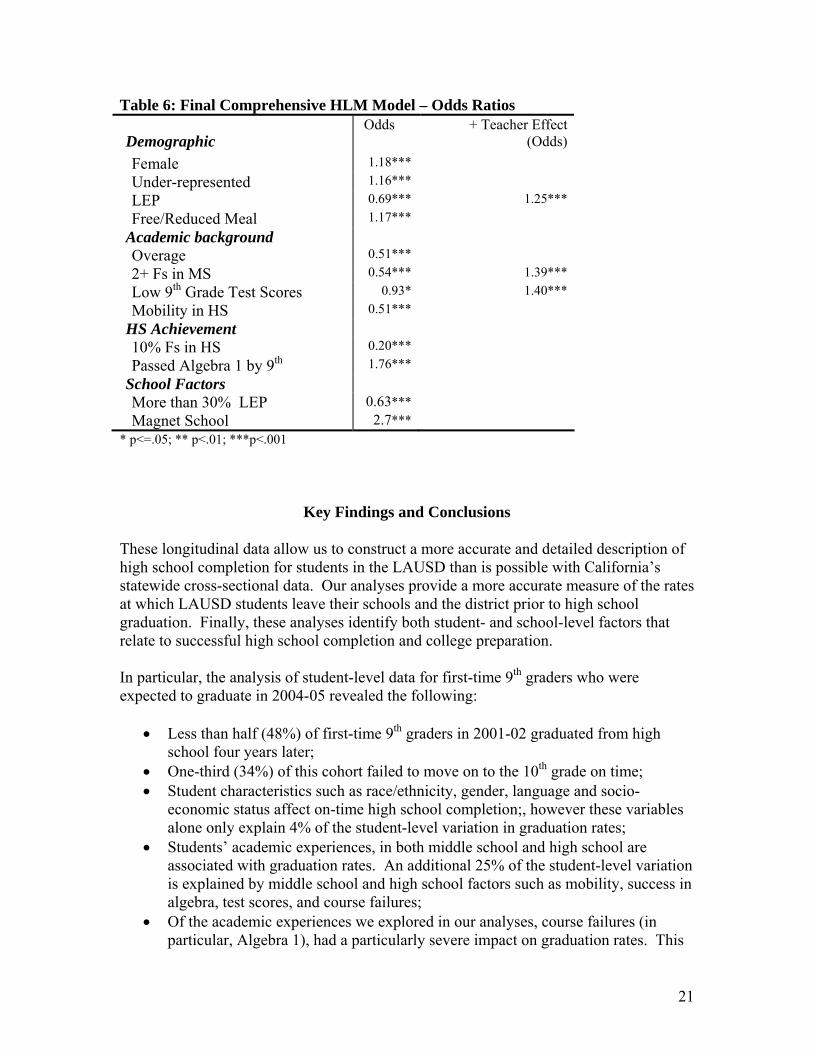
Table 6: Final Comprehensive HLM Model – Odds Ratios
Demographic Odds + Teacher Effect
(Odds)Female 1.18*** Under-represented 1.16*** LEP 0.69*** 1.25*** Free/Reduced Meal 1.17***
Academic background Overage 0.51*** 2+ Fs in MS 0.54*** 1.39*** Low 9th Grade Test Scores 0.93* 1.40*** Mobility in HS 0.51***
HS Achievement 10% Fs in HS 0.20*** Passed Algebra 1 by 9th 1.76***
School Factors More than 30% LEP 0.63*** Magnet School 2.7***
* p<=.05; ** p<.01; ***p<.001
Key Findings and Conclusions
These longitudinal data allow us to construct a more accurate and detailed description of high school completion for students in the LAUSD than is possible with California’s statewide cross-sectional data. Our analyses provide a more accurate measure of the rates at which LAUSD students leave their schools and the district prior to high school graduation. Finally, these analyses identify both student- and school-level factors that relate to successful high school completion and college preparation. In particular, the analysis of student-level data for first-time 9th graders who were expected to graduate in 2004-05 revealed the following:
• Less than half (48%) of first-time 9th graders in 2001-02 graduated from high school four years later;
• One-third (34%) of this cohort failed to move on to the 10th grade on time; • Student characteristics such as race/ethnicity, gender, language and socio-
economic status affect on-time high school completion;, however these variables alone only explain 4% of the student-level variation in graduation rates;
• Students’ academic experiences, in both middle school and high school are associated with graduation rates. An additional 25% of the student-level variation is explained by middle school and high school factors such as mobility, success in algebra, test scores, and course failures;
• Of the academic experiences we explored in our analyses, course failures (in particular, Algebra 1), had a particularly severe impact on graduation rates. This

22
is significant given that approximately half of the cohort failed at least one academic course during their middle school years, and three-quarters failed an academic course in high school. Sixty-three percent of the cohort received either a “D” or “F” in Algebra 1;
• Each successive school failure at the middle school level has a greater negative impact on high school graduation rates than course failure at the high school level;
• Middle school and high school absences also affect on-time graduation rates: the chance of graduating dropped to less than half for students who were absent more than 10 days/year in 7th or 8th grade or in high school;
• School mobility matters. Most students remain at one middle school or high school. However, students who change schools are significantly affected. Only about one-third (35%) of students who changed schools close to the transition to high school (8th grade) graduated on time. Changing schools during the high school years is slightly more detrimental, with only 32% of these students graduating on time.
Student-level indicators alone cannot account for all the variation we see in on-time graduation rates. School-level conditions, at both the middle school and high school level impact rates of on-time high school graduation:
• More than three-quarters of the total variability in on-time graduation is between schools.
• Approximately 42% of between-school variance can be explained by three school characteristics: the percentage of qualified teachers at the school, percentage of English Learners, and magnet school status.
• Of these school-level conditions, we found evidence of distress at schools serving high concentrations of English language learners: students at such schools were 40% less likely to graduate on time, controlling for individual language classifications and other demographic and academic characteristics.
• Multilevel regression models confirm independent effects for most of the simple associations shown in descriptive statistics in Tables 1 and 2.
• There was no direct effect found to explain the low (35%) graduation rate at schools where more than 20% of teachers lack full credentials. Rather, multilevel models showed that teaching appears to moderate the effects of students’ being in any of three critical risk categories: LEP-classification, low test scores, and middle school academic difficulties.
• Attending a magnet school dramatically improves students’ odds of graduation (OR=2.7). Again, this confirms what is implied by the simple descriptive statistics, showing that students who attend a magnet school in high school complete high school at a rate of 73% compared to 45% for those who do not attend a magnet school.
Although these findings pertain to the cohort of first-time freshmen expected to graduate in 2004-05, it is reasonable to assume that similar trends/patterns would be identified for subsequent cohorts of students within the LAUSD. Indeed, these estimates are

23
conservative given the current administration of the California High School Exit Exam (CAHSEE) and the exclusion of students from the sample.24 Further, while the sample is representative of the cohort as a whole, the exclusion of students from the sample (approximately 4,000) for whom we have no record of course completion or were missing most data also contributes to an underestimation of the rate of on-time completion. Nonetheless, these findings can inform efforts in the district and the state to make graduation from high school the norm for all students. Our findings support the idea that schools need to ensure that both the social and academic needs of students are met prior to students’ entry into the high school environment and within the high school setting. Our findings also suggest that increasing the on-time graduation rate of students will require addressing school-level conditions and the resources provided to schools. Clearly, solving the LAUSD’s dropout crisis is a formidable challenge that will require a long-term, comprehensive, and multi-faceted strategy to improve all of the District’s schools.
24 Research has shown that graduation rates fell in California in 2006 (especially for Latino and African American students)—to the lowest rates the State has seen since 1997 (Rogers, 2007). That the graduating class of 2004-05 was not subject to passing the CAHSEE as a condition for receiving their high school diploma suggests that current on-time completion rates are lower than those reported here.
24
References Alexander, K.L., Entwisle, D.R., & Kabbini, N.S. (2001). The Dropout Process in Life Course Perspective: Early Risk Factors at Home and School. Teachers College Record, 103, 760-882. Allensworth, E. M., & Easton, J.Q., (2007). What Matters for Staying On-Track and
Graduating in Chicago Public High Schools: A Close Look at Course Grades, Failures, and Attendance in the Freshman Year. Consortium on Chicago School Research at the University of Chicago.
Balfanz, R., & Legters, N., (2004). Locating the Dropout Crisis: Which High Schools
Produce the Nation’s Dropouts? Where are they Located? Who Attends Them? Center for Research on the Education of Students Placed At Risk (CRESPAR), Johns Hopkins University.
Balfanz, R., Herzog, L., & Mac Iver, D.J., (2007). “Preventing Student Disengagement
and Keeping Students on the Graduation Path in Urban Middle-Grade Schools: Early Identification and Effective Interventions.” Educational Psychologist, 42, 223-235.
Barton, P.E., (2005). One-Third of a Nation: Rising Dropout Rates and Declining Opportunities. Policy Information Center, Educational Testing Service (ETS). Cabrera, A., & La Nasa, S. (2000). Understanding the College Choice of Disadvantaged
Students: New Directions for Institutional Research. San Francisco: Jossey-Bass. Civil Rights Project, (2005). Confronting the Graduation Rate Crisis in California. The
Civil Rights Project, Harvard University. Darling-Hammond, L., (2004). Inequality and the Right to Learn: Access to Qualified
Teachers in California’s Public Schools. Teacher’s College Record 106 (10), p.1936-1966.
Darling-Hammond, L., (2007). The Flat Earth and Education: How America’s Commitment to Equity Will Determine Our Future. Educational Researcher, 36(6), 318-334.
De Cos, P.L., (2005). High School Dropouts, Enrollment, and Graduation Rates in
California. CRB 05-008. California Research Bureau. Educational Testing Service (2004), Where We Stand on Teacher Quality: An Issue
Paper from ETS (ETS, Princeton, NJ); http://ftp.ets.org/pub/corp/position_paper.pdf.
Gonzalez, K. P., Stoner, C., & Jovel, J. (2003). Examining the Role of Social Capital in
Access to College for Latinas: Toward a College Opportunity Framework. Journal of Higher Education, 2 (2), 146-170.

25
Griffin, K.A., Allen, W.R., Kimura-Walsh, E., & Yamamura, E.K. (2007). Those Who
Left, Those Who Stayed: Exploring the Educational Opportunities of High-Achieving Black and Latina/o Students at Magnet and Nonmagnet Los Angeles High Schools (2001-2002). Educational Studies: A Journal of the American Educational Studies Association. 42 (3), 229-247.
Horn, L. & Nunez, A.M. (2000). Mapping the Road to College: First Generation
Students’ Math Track, Planning Strategies, and Context of Support. NCES Statistical Report # 2000-153.
Hurtado, S., Inkelas, K. K., Briggs, C., & Rhee, B. (1997). Differences in College Access
and Choice Among Racial/Ethnic Groups: Identifying Continuing Barriers. Research in Higher Education, 38, 43-64.
Lee, V.E., & Burkham, D.T., (2001). Dropping Out of High School: The Role of School
Organization and Structure. Paper prepared for conference: “Dropouts in America: How Sever is the Problem? What do we know about Intervention and Prevention? Harvard Civil Rights Project, Harvard University.
Lee, V.E., Ready, D.D., & Welner, K. (2002). Educational Equity and School Structure:
School Size, School Overcrowding, and Alternative Organizational Structures. Institute for Democracy, Education & Access (IDEA), University of California, Los Angeles. Available at: www.ucla-idea.org.
Lucas, T. (1997). Into, Through, and Beyond Secondary School: Critical transitions for immigrant youth. Arlington, VA: Center for Applied Linguistics. Nield, R.C., & Balfanz, R. (2006). Unfilled Promises: The Dimensions and
Characteristics of Philadelphia’s Dropout Crisis, 2000-2005. Baltimore: Center for Social Organization of Schools, Johns Hopkins University.
Oakes, J. (1985/2005). Keeping Track: How Schools Structure Inequality. New Haven:
Yale University Press. Oakes, J. (1986). Educational Indicators: A Guide for Policymakers. Center for Policy
Research in Education, The RAND Corporation, Santa Monica, CA. Oakes, J., Mendoza, J., & Silver, D., (2007). “California Opportunity Indicators: Informing and Monitoring California’s Progress Towards Equitable College Access,” in G. Orfield and X. Gandara (Eds.), Expanding Opportunity in Higher Education: California and the Nation. Pianta, et al. (2007). Opportunities to Learn in America's Classrooms. Science.

26
Perna, L.W., (2005). The key to college access: Rigorous academic preparation. In W.G. Tierney, Z.B. Corwin, & J.E. Colyar (Eds.), Preparing for College: Nine Elements of Effective Outreach. Albany, NY: State University of New York Press. Phelan, P., Yu, H. C., & Davidson, A. L. (1994). Navigating the Psychosocial Pressures of Adolescence: The Voices and Experiences of High School Youth. American Educational Research Journal, 31(2), 415-447. Roderick, M.R., (1993). The Path to Dropping Out: Evidence for Intervention. Westport, CT: Auburn House. Rogers, J.S., (2007). Constructing Success?: Accountability, Public Reporting, and the California High School Exit Exam. Santa Clara Law Review, 47(4), 755-784. Rumberger, R.W., & Arellano, B., (2007). Student and School Predictors of High School Graduation in California. California Dropout Research Project Report #5, University of California, Santa Barbara. Sanders, W.L., & Rivers, J.C., (1996). Cumulative and Residual Effects of Teachers on Future Student Academic Achievement. Knoxville: University of Tennessee Value-Added Research and Assessment Center. Shavelson, R., McDonnell, L.M. & Oakes, J. (Eds, 1989) Indicators for Monitoring
Mathematics and Science Education: A Sourcebook. Santa Monica: RAND Corporation.
Shields, P.M., Esch, C., Humphrey, D.C., Young, V.M., Gatson, M., & Hunt, H., (1999).
The Status of the Teaching Profession: Research Findings and Policy Recommendations. A report to the Teaching and California’s Future Task Force. Santa Cruz, CA: The Center for the Future of Teaching and Learning.
Swail, W.S., Cabrera, A.F., Lee, C., & Williams. (2005), Latino Students and The
Educational Pipeline. Report issued by the Educational Policy Institute. Univeristy of California All Campus Consortium on Research for Diversity
(UC/ACCORD), (2007). California Educational Opportunity Report. Instititute for Democracy Education and Access (IDEA) and UC/ACCORD, University of California, Los Angeles.
White, J., & Cantrell, S.M., (2001). Comparisons of Student Outcomes in Multi-Track,
Year-Round and Single-Track Traditional School Calendars. Los Angeles: Los Angeles Unified School District.
Zarate, M.E. & Gallimore, R.G. (in press). Gender Differences in Factors Leading to
College Enrollment: A longitudinal Analysis of Latina and Latino Students. Harvard Educational Review, Cambridge, MA.

27
Appendix A. Description of Multilevel Models LEVEL-1 DESCRIPTIVE STATISTICS VARIABLE NAME N MEAN SD MINIMUM MAXIMUM UNDERREP 48561 0.83 0.38 0.00 1.00 LEP 48561 0.28 0.45 0.00 1.00 FRL 48561 0.74 0.44 0.00 1.00 OVERAGE 48561 0.17 0.38 0.00 1.00 GRAD 48561 0.48 0.50 0.00 1.00 F2MS_1 48561 0.39 0.47 0.00 1.00 MOBILITY 48561 0.18 0.38 0.00 1.00 CSTLOW_1 48561 0.71 0.44 0.00 1.00 PASSALG1 48561 0.38 0.48 0.00 1.00 F10PCT_1 48561 0.61 0.49 0.00 1.00 FEMALE 48561 0.49 0.50 0.00 1.00 LEVEL-2 DESCRIPTIVE STATISTICS VARIABLE NAME N MEAN SD MINIMUM MAXIMUM URML2 123 0.77 0.24 0.00 1.00 LEPL2 123 0.19 0.19 0.00 1.00 TEACHL2 123 0.11 0.31 0.00 1.00 VOCL2 123 0.12 0.05 0.03 0.32 MAGNETL2 123 0.50 0.50 0.00 1.00 CONC6L2 123 0.41 0.46 0.00 1.00 SEG 123 0.43 0.50 0.00 1.00 LEP30 123 0.26 0.44 0.00 1.00 VOC15 123 0.33 0.47 0.00 1.00
Models 1-3 are binomial outcome models with fixed effects for all predictors at level one, and no predictors at level two. Models 4 and 5 introduce predictors at level two, and treat three critical student characteristics as random variables. Each of these random effects is highly significant, and each is moderated by teaching. Final Level-1 Model: Prob(Graduation=1|β) = φ; log[φ/(1-φ)] = η. η = β0 + β1(Female) + β2(URM) + β3(LEP) + β4(FRL) + β5(Middle School Fs) + β6(Over Age) + β7(Low CST Scores) + β8(Mobility) + β9(Passed Algebra) + β10(High School Fs) + u0
Final Level-2 Model: β0= γ00 + γ01 *(Magnet) + γ02 *(High-LEP Concentration) + u0 β1= γ10 β2 = γ20 + γ21 *(Teaching) + u2 β3= γ30 β4= γ40 β5= γ50 + γ51 *(Teaching) + u5 β6= γ60 β7= γ70 + γ71 *(Teaching) + u7 β8= γ80 β9= γ90 β10= γ100 All level-1 predictors are group-mean centered; level-2 predictors are grand-mean centered.

28
Final estimation of variance components: ----------------------------------------------------------------------------- Random Effect Standard Variance df Chi-square P-value Deviation Component ----------------------------------------------------------------------------- INTRCPT1, U0 0.84742 0.71811 103 2472.85930 0.000 LEP slope, U2 0.16490 0.02719 104 128.47543 0.052 F2MS_1 slope, U5 0.23481 0.05513 104 194.62485 0.000 CSTLOW_1 slope, U7 0.24962 0.06231 104 157.52653 0.001 ----------------------------------------------------------------------------- Final estimation of fixed effects (Population-average model with robust standard errors) ---------------------------------------------------------------------------- Standard Approx. Fixed Effect Coefficient Error T-ratio d.f. P-value ---------------------------------------------------------------------------- For INTRCPT1, B0 INTRCPT2, G00 0.408612 0.063301 6.455 120 0.000 MAGNETL2, G01 0.980150 0.147375 6.651 120 0.000 LEP30, G02 -0.455916 0.163319 -2.792 120 0.007 For UNDERREP slope, B1 INTRCPT2, G10 0.152619 0.033596 4.543 48545 0.000 For LEP slope, B2 INTRCPT2, G20 -0.334926 0.027315 -12.262 121 0.000 TEACHL2, G21 0.223418 0.073673 3.033 121 0.003 For FRL slope, B3 INTRCPT2, G30 0.160263 0.036519 4.388 48545 0.000 For OVERAGE slope, B4 INTRCPT2, G40 -0.666835 0.035451 -18.810 48545 0.000 For F2MS_1 slope, B5 INTRCPT2, G50 -0.578994 0.028525 -20.298 121 0.000 TEACHL2, G51 0.330642 0.110236 2.999 121 0.004 For MOBILITY slope, B6 INTRCPT2, G60 -0.678384 0.063192 -10.735 48545 0.000 For CSTLOW_1 slope, B7 INTRCPT2, G70 -0.007656 0.029977 -0.255 121 0.799 TEACHL2, G71 0.339152 0.089883 3.773 121 0.000 For PASSALG1 slope, B8 INTRCPT2, G80 0.584701 0.029681 19.699 48545 0.000 For F10PCT_1 slope, B9 INTRCPT2, G90 -1.635018 0.045562 -35.886 48545 0.000 For FEMALE slope, B10 INTRCPT2, G100 0.166486 0.019933 8.352 48545 0.000 ---------------------------------------------------------------------------- Odds Confidence Fixed Effect Coefficient Ratio Interval ---------------------------------------------------------------------- For INTRCPT1, B0 INTRCPT2, G00 0.408612 1.504727 (1.328,1.705) MAGNETL2, G01 0.980150 2.664857 (1.991,3.566) LEP30, G02 -0.455916 0.633867 (0.459,0.875) For UNDERREP slope, B1 INTRCPT2, G10 0.152619 1.164881 (1.091,1.244) For LEP slope, B2 INTRCPT2, G20 -0.334926 0.715391 (0.678,0.755) TEACHL2, G21 0.223418 1.250343 (1.081,1.446) For FRL slope, B3 INTRCPT2, G30 0.160263 1.173819 (1.093,1.261) For OVERAGE slope, B4 INTRCPT2, G40 -0.666835 0.513331 (0.479,0.550) For F2MS_1 slope, B5

29
INTRCPT2, G50 -0.578994 0.560462 (0.530,0.593) TEACHL2, G51 0.330642 1.391862 (1.119,1.731) For MOBILITY slope, B6 INTRCPT2, G60 -0.678384 0.507436 (0.448,0.574) For CSTLOW_1 slope, B7 INTRCPT2, G70 -0.007656 0.992374 (0.935,1.053) TEACHL2, G71 0.339152 1.403756 (1.175,1.677) For PASSALG1 slope, B8 INTRCPT2, G80 0.584701 1.794455 (1.693,1.902) For F10PCT_1 slope, B9 INTRCPT2, G90 -1.635018 0.194949 (0.178,0.213) For FEMALE slope, B10 INTRCPT2, G100 0.166486 1.181147 (1.136,1.228) ----------------------------------------------------------------------
30
Appendix B. Frequency of Absences by Grade 7th 8th 9th
0-5 39.7% 40.3% 32.7%
6-10 22.1% 21.4% 20.9%
11-20 23.0% 22.1% 23.0%
21+ 15.2% 14.6% 23.5%