what drives private equity fund performance?
TRANSCRIPT
What Drives Private Equity Fund Performance?
Ludovic Phalippou and Maurizio Zollo
November 2005
Abstract Using a novel and comprehensive database on both US and EU private equity funds and their underlying investments, we study the drivers of private equity fund performance. First, we study whether their hedging properties are attractive enough to justify their low performance. We document that fund performance co-varies positively with both business cycles and stock-market cycles, an unattractive property. We also find that private equity funds – like hedge funds - are exposed to tail risk. Second, we do not find evidence that idiosyncratic risk is priced and document that low performance is concentrated in small and inexperienced funds.
JEL: G23, G24 Keywords: Private equity funds, Hedging properties Please address all correspondence to: Ludovic Phalippou, University of Amsterdam, Faculty of Economics and Econometrics, Finance group, 11 Roerterstraat, 1018 Amsterdam, The Netherlands. Tel: +31 20 525 4153, Email: l.phalippou “at” uva.nl Maurizio Zollo is affiliated to INSEAD. Financial support from the R&D Department at INSEAD, the Wharton-INSEAD Alliance are gratefully acknowledged. The authors would like to thank Jesse Reyes and Thomson Venture Economics for making this project possible through generous access to their databases. We also thank Bernard Dumas, Alexander Groh, Robert Kosowski, Eric Nowak, Andrew Metrick, Dima Leshchinskii, Oliver Gottschalg, Anna Scherbina and Lin Tse-Chun for their constructive comments.

1
Abstract Using a novel and comprehensive database on both US and EU private equity funds and their underlying investments, we study the drivers of private equity fund performance. First, we study whether their hedging properties are attractive enough to justify their low performance. We document that fund performance co-varies positively with both business cycles and stock-market cycles, an unattractive property. We also find that private equity funds – like hedge funds - are exposed to tail risk. Second, we do not find evidence that idiosyncratic risk is priced and document that low performance is concentrated in small and inexperienced funds.
2
The activities of private equity funds have recently received considerable attention due,
primarily, to two factors. First, the amount of capital committed to US private equity funds
has grown from $5 billion in 1980 to $300 billion in 2004, totaling over $1 trillion over the
last 25 years (Lerner et al., 2004). Second, it has been extensively argued that fund managers
play an important strategic role in the companies they finance (e.g. Lerner, 1995, Hellmann,
1998, and Hellmann and Puri, 2002).
Given the importance of private equity both as an investment vehicle and as a catalyst
for economic growth, the need for a comprehensive assessment of the risk profile of this
industry is apparent. In a review paper, Gompers and Lerner (2001) classify the
understanding of risk and return as “what we don’t know about venture capital,” a statement
that is also true for buyout investments.1
Getting insight into the risk profile of private equity funds as well as the other drivers
of their performance is the objective of this paper. We believe that this endeavor is not only
interesting per se (e.g. for portfolio allocation) but also interesting in light of recent research
that reports that private equity funds have a relatively low performance. For example, Kaplan
and Schoar (2005) show that, in their sample, private equity funds have a performance that is
close to the performance of the S&P 500. This is puzzling as the bulk of the money of private
equity funds is invested in leveraged buyouts, which are typically significantly more levered
than the S&P 500. This should result in a sizeable premium for buyout investments. The rest
of the money is invested mainly in venture capital, which might also command a premium
over the S&P 500 due to betas likely higher than one. Furthermore, Phalippou and Zollo
(2005) show that the sample selected by Kaplan and Schoar (2005) includes superior funds
and that the realized aggregated performance of private equity funds is actually significantly
below that of the S&P 500. Such results prompt the following questions: what are the
characteristics of the funds that under-perform? Do funds exhibit risk and hedging
characteristics that would make the above performance estimate fair?
Using a unique and comprehensive dataset containing information on cash flows
to/from investors and the investments made by about 700 private equity funds, this paper
addresses these two related questions by investigating what are the drivers of private equity
fund performance.
To evaluate the influence of business cycles and stock-market cycles on performance,
we first construct a proxy for the CAPM-beta of funds. We use the information on the
3
industry in which funds invest and the type of investment they make (venture capital versus
buyout) to compute a beta for each investment based on the matching industry betas and
making appropriate leverage assumptions. The investment betas are then aggregated at the
fund level to obtain a beta for each fund. These fund betas are found to be about 1.6 and we
do not find a statistically significant relation between fund beta and fund performance.
Second, we assess how macroeconomic conditions at the time of investments, during
the life of investments, and at the exit of investments relate to fund performance. Irrespective
of the proxies we use, we find that private equity fund performance is significantly pro-
cyclical. Performance significantly increases with the average GDP growth rate and decreases
with the average level of interest rates – in particular corporate bond yields – that prevailed
during the life of the investments. Moreover, macroeconomic conditions are found
particularly important at the time investments are made. When either credit spreads or
corporate bond yields are low at the time investments are made, fund performance is higher.
Third, returns on public stock-markets strongly influence fund performance. We find
that performance significantly increases with both the average return on the stock-market
(CRSP-VW index) and the average return on the call options written on the S&P composite
index that occurred during the life of the investments. This shows that like hedge funds,
private equity funds exhibit tail risk, i.e. non-linear systematic risk (see Agarwal and Naik,
2004).
When the effects of the stock-market and macroeconomic variables are compared to
one another, we find that the two dominant variables are the level of corporate bond yields at
the time investments are made and the level of the stock-market returns that prevail during
the life of investments. These findings show that private equity fund performance is pro-
cyclical and, therefore, makes the “performance puzzle” even greater.
Our dataset also enables us to study the other drivers of fund performance. First, we
further test the hypothesis of Jones and Rhodes-Kropf (2003) according to which
idiosyncratic risk should be priced for private equity funds. We do not find strong support for
this hypothesis. The only exception is when we measure idiosyncratic risk by the Herfindahl
index for industry concentration (of investments). However, we note that the effect is driven
by the amount invested in high-tech industries. Second, consistent with widespread belief,
small and inexperienced funds have significantly lower performance. Funds that invest more
outside the US and in venture capital also witness a lower performance but it is not
1 Note that real estate and entrepreneurial investments in non-public companies are also sometimes called

4
statistically significant. The question is then why certain investors buy small and
inexperienced funds and the answer could be that these funds are the only ones accessible to
less sophisticated investors or that they are those with highest potential side-benefits for
investors (e.g. to establish a commercial relationship) or both.
The paper continues as follows: section 1 reviews the literature, section 2 describes
the data, section 3 is dedicated to systematic risk, section 4 focuses on exposure to
macroeconomic conditions, section 5 investigates the pricing of idiosyncratic risk, section 6
reports the relation between fund characteristics and performance and section 7 briefly
concludes.
I. Risk and Return of Private Equity Investments
A. The private equity industry (see Appendix A.I for details)
Private equity investors are principally institutional investors such as endowments and
pension funds. These investors, called Limited Partners (LPs), commit a certain amount of
capital to private equity funds, which are run by General Partners (GPs). GPs search out
investments and tend to specialize in either venture capital (VC) investments or buyout (BO)
investments. In general, when a GP identifies an investment opportunity, it “calls” money
from its LPs. When the investment is liquidated, the GP distributes the proceeds to its LPs.
The timing of these cash flows is typically unknown ex ante.
B. Literature review
We can divide the literature on risk-return of private equity investments into two sets of
studies. The first, and most extensive set, documents the (gross-of-fees) performance of
individual venture capital investments of GPs. The second set focuses on the cash-flow
stream from (to) the private equity funds to (from) LPs, which includes fee payments and,
importantly, contains both buyout investments and venture capital investments. They thus
measure the net performance obtained by LPs who invest in private equity funds.
B.1. Performance of individual venture capital investments of GPs
Peng (2001), Quigley and Woodward (2003), and Woodward and Hall (2003) compute a VC
index and derive the correlation between this index and a public stockmarket index. The
index is built from discretely observed valuations (new financing round, IPOs, acquisitions,
private equity. In this paper, we consider only buyout funds and venture capital funds.
5
or liquidation).2 With similar observations, Cochrane (2005) assumes that the change in the
log of the company’s valuation follows a log-CAPM and models selection bias explicitly by
assuming that the probability of observing a new round follows a logistic function of firm
value. Using a maximum likelihood approach, the alpha and beta of the log-CAPM that are
most consistent with these observations are then derived.3
The results of these studies vary substantially. Quigley and Woodward (2003) finds
gross real returns of about 5% per quarter, which is less than the S&P 500 and the Nasdaq
over the same period, but find a beta close to 0. Woodward and Hall (2003) estimate that
average performance is 20% per year, abnormal performance is 8.5% per year, and beta is
0.86. Peng (2001) finds an average return of 55% per annum (1987-1999) and estimated beta
ranges from 0.8 to 4.7. Finally, Cochrane (2005) reports a 59% annual average (arithmetic)
gross return, a corresponding alpha of 32% and a beta below 1.
B.2. Net performance of private equity funds (LP perspective)
Four fund-level studies have been conducted to our knowledge, beginning with Gompers and
Lerner’s (1997) pioneering work. This study examines the risk-adjusted performance of a
single fund group (Warburg Pincus) by marking-to-market each investment, in order to
obtain the fund’s quarterly market value. The resulting time series of portfolio value is
regressed on asset pricing factors, giving a performance “alpha” and “beta” for that fund.
Second, Kaplan and Schoar (2005) find that the main drivers of performance are past fund
performance (i.e. there is persistence) and fund size. The third study, by Jones and Rhodes-
Kropf (2003), argues that idiosyncratic risk should be (and is empirically) related to fund
returns. The last of the four studies, by Ljungqvist and Richardson (2003), focuses on the
determinants of the speed of the draw-downs and capital distributions. They estimate betas of
73 funds by employing a four-step procedure similar to what we use in this paper. First, they
identify each portfolio company held by a fund. Second, given this identification, they assign
portfolio companies to one industry group. Third, assuming that the leverage of the private
company coincides with that of the industry, they assign the industry beta to the portfolio
company. Fourth, they compute the average equity beta of the fund using the capital
disbursements as weights.
2 The main challenge faced by these studies is that in the majority of cases, they observe performance only when the investment was successful. Accounting for such selection bias is difficult as successful investments account for a mere quarter of the total number of observations. 3 Cummings and Walz (2004) also offers an estimate of investment-level returns, focusing on how the legal environment influences performance.
6
Our study falls in this second set of studies and uses the most comprehensive dataset
to date in that we have both the link between fund cash flows and fund investments like
Ljungqvist and Richardson (2003) and a large cross-section of funds like Kaplan and Schoar
(2005). We can thus apply the four-step estimation of fund betas described above to a large
number of funds (700 funds). In addition, this paper is the first to our knowledge to focus on
how macroeconomic conditions influence performance and whether there is evidence of non-
linear risk factors (e.g. right tail risk).
II. Data
In this section, we detail our data sources, our sample selection scheme, and our performance
estimate. We also offer descriptive statistics about the characteristics of private equity funds
and their investments.
A. Data sources
In this study, we use several sources of data. Data on both Treasury bill rates and stock
performance are from CRSP (via WRDS). Data on corporate bond yields are from the
Federal Reserve Bank of Saint Louis. Data on private equity funds have been obtained from
two datasets maintained by Thomson Venture Economics. These datasets cover funds raised
from 1980 to 2003. Venture Economics records the amount and date of all cash flows as well
as the aggregate quarterly book value of all unrealized investments for each fund until
December 2003 (residual values). Cash flows are net of fees as they include all fee payments
to the General Partners (GPs, or fund managers), and distributions are reduced by the carried
interest and other charges. Throughout the text we refer to this dataset as the “cash-flow”
dataset. Venture Economics also collects information on fund investments through its Vxpert
database. The unique feature of our dataset is that Venture Economics have provided us with
identifiers that link the two datasets. This way, we know the investments and the cash flows
for a large cross section of funds. Details about these databases as well as certain corrections
that we undertake are provided in the appendix A.
B. Sample selection and treatment of residual values
Until a fund is entirely liquidated, the existence of non-exited investments prevents a precise
estimation of fund performance as neither the fund nor its underlying investments are
publicly traded. The unique assessment of the value of non-exited investments is the
accounting value that is reported quarterly by funds. However, these accounting valuations
7
are unreliable.4 A solution proposed by Kaplan and Schoar (2005) is to focus on a sample of
quasi-liquidated funds. In such a sample, the treatment of accounting values has a reduced
impact but the sample might not be representative. As our dataset allows us to correct
partially for sample selection biases (see below), we follow Kaplan and Schoar (2005) in that
we select a sample of quasi-liquidated funds (i.e. raised between 1980 and 1996 and is either
officially liquidated or have not reported any cash-flow over the last two years.)
In addition, certain funds in this sample have implausibly high residual values (so-
called ‘living-deads’). Hence, we write-off the residual values of officially liquidated funds
and funds that do not have any cash flow reported over the last four years (and are raised
before 1993). For the other funds, we assume that their residual values (reported at the end of
December 2003) equal the present value of their future cash-flow streams.
Finally, we use the profitability index (PI) as a performance measure. PI equals the
present value of cash inflows divided by the present value of cash outflows. As we use the
return of the S&P 500 to discount both cash flows, a PI above 1 indicates a better
performance than the S&P 500 index.
Table 1
An additional selection requirement for funds to be included in our study is that they
have information about at least four investments. We count 705 funds that satisfy these
criteria out of the 2844 funds raised between 1980 and 1996. Table 1 reports our sample
characteristics. Generally, the descriptive statistics are similar to those reported in the
literature (see Kaplan and Schoar, 2005). Venture funds are significantly smaller than buyout
funds, with an average invested capital of $48 million for venture funds compared to $225
million for buyout funds. Moreover, reflecting the fact that the private equity industry is
young and rather inexperienced, over one third of the funds in our database are first-time
funds (i.e. they are the first fund raised by the parent firm). Our sample appears to over-
represent both large funds and venture capital funds and to under-represent first-time funds.
Performance data are also similar to what is reported in the literature. If we do not
correct for sample selection bias, value-weight by deflated capital committed and eliminate
‘living-deads’, private equity funds in our sample have an average PI of 1.02 for buyout
4 The US National Venture Capital Association proposed certain mark-to-market guidelines for the valuation of PE fund investment in 1989 which have become a quasi-standard for the industry since then. Nevertheless, the discussion in the PE industry about appropriate rules for the valuation of unrealized investments is ongoing and accounting practices vary to the point that LPs sometimes receive significantly different valuations from different GPs who jointly invest in the same company. In general, however, the accounting value of a deal stays equal to the amount invested in that deal. Interested readers may refer to Blaydon and Horvath (2002, 2003) for a detailed discussion of accounting practices.
8
funds and 1.07 for venture capital funds, indicating a slight outperformance with respect to
the S&P 500.5
Table 2
The fact that our sample is not representative of the universe is confirmed by a Probit
regression (Table 2). The dependant variable is a dummy variable that takes the value one if
the fund is included in the sample and zero otherwise. From this regression, we deduce the
lambda of each fund, which reflects the likelihood of a fund to be selected in the sample. This
vector of lambda is added to all the regressions in this paper to control for the fact that our
sample of analysis is not representative of the universe but rather is biased toward a certain
type of funds (see Greene, 2003, for details on Heckit regression and Cumming and Walz,
2004, for an application in a private equity context).
Table 3
We now turn to the description of investments, which is reported in Table 3. We find
that venture funds have almost twice as many investments as buyout funds. Venture funds
invest in 28 (22) companies on average (median) and buyout funds in 17 (11) companies for
an average period of almost five years for venture capital deals and four years for buyout
deals. These figures are consistent with the findings of Gompers and Lerner (1999) for a
different sample: they note that venture funds typically invest in two dozen firms over about
three years.
Several important elements are worth mentioning. First, we find that venture funds
have 9% of their investments on average in buyouts and that as much as 18% of the
investments of buyout funds are on average in venture deals. This indicates that a few funds
in each category (and more so among buyout funds) are diversified across deal types.
Consequently, care should be taken when interpreting differences in the behavior of funds
according to their objectives (buyout versus venture capital). Second, the industry focus is
very similar for both venture funds and buyout funds as they both concentrate 40% of their
portfolio in one industry (out of 48 industry categories). Funds thus appear to be fairly
specialized. Third, and finally, more than half of the deals undertaken by venture funds are in
high-technology industries (in terms of value).
5 If we correct for sample selection bias, this average performance estimate is dramatically reduced and both venture capital funds and buyout funds underperform significantly.
9
III. Systematic Risk
A first driver of performance should be, in theory, the amount of systematic risk carried by
funds. In this section, we propose a methodology to assess the CAPM-beta of private equity
funds along the lines of Kaplan and Ruback (1995) and Ljungqvist and Richardson (2003).
Were private equity investments continuously traded, it is likely they would have
relatively high betas; the reason being that buyout investments have a high level of debt and
venture investments are made in small firms that typically belong to high-beta industries. To
obtain an order of magnitude, we compute, for each fund, the average beta of its investments.
Importantly, this average investment beta is not the same as the fund beta, but rather is a
proxy for fund beta.
We assume that the CAPM holds and that the betas on asset are the same inside a
given industry.6 By making further assumptions regarding the leverage of the deals we can
assess the beta of each investment made by GPs. The methodology that we follow is basically
what is proposed by Kaplan and Ruback (1995) and Ljungqvist and Richardson (2003);
construction details are presented in the appendix B. The fundamental idea is to compute the
beta on asset that prevails in each industry, assign it to each private equity investment made
in this industry, and lever it up as a function of the deal type (venture capital or buyout). The
betas are then averaged for each fund. Given our assumptions, note that variations in betas
reflect a combination of the riskyness of the industry in which funds invest, the type of
investments made and the time duration of each investment. To compute betas, we assume
that the leverage of buyouts decreases linearly over time from a debt-to-equity ratio of 3 (at
entry) down to the leverage that prevails in the industry (at exit). The beta on debt is assumed
to be 0.25 and the beta for venture deals is assumed to be the same as the beta of the 20%-
smallest stocks in the corresponding industry. Importantly, stock betas are computed using
Dimson’s correction. The choice of the beta on debt is based on Cornell and Green (1991),
who evaluate the beta for high-grade debt (from 1977 to 1989). The choice of equity-to-debt
ratio is based on Cotter and Peck (2001) and on Lerner et al. (2004), who argue that a 3:1
debt-to-equity ratio for buyouts is rather typical (though slightly conservative).7
Table 4
The average estimated betas are reported in Table 4. We document how betas differ
between venture funds and buyout funds and between large funds and small funds. The
6 Note that here, and throughout this paper, we do not separate US and EU funds. We use US only benchmarks: market portfolio and industry. Such a convention has little impact on our results.
10
average beta of buyout funds is 1.7 and is similar to the average beta of venture funds, which
is 1.6. Similarly, small funds have an average beta of 1.65 and large funds have an average
beta of 1.56. We also report how these estimates change as we modify our assumptions about
buyout leverage. We observe little overall effect. The beta of buyout funds, however, doubles
when we use (for the entire length of the investment) a debt-to-equity ratio of 3 instead of the
industry average, which are the two most extreme assumptions one can make about leverage.
When we relate beta to performance, we find a positive but not statistically significant
relation [unreported results]. This result holds irrespective of both the control variables that
we use and our leverage assumptions. This result might not appear very surprising given that
the relation between stock-beta and stock performance has also been found weak.
To summarize, in a CAPM framework, the beta of private equity funds is expected to
be substantially higher than 1. Hence the existing estimates of fund performance (e.g. Kaplan
and Schoar, 2005) are optimistic as they assume that fund beta is 1. Moreover, systematic risk
does not appear to be a driver of fund performance.
IV. Fund exposure to macroeconomic conditions
In this section, we attempt to investigate how business cycles and stock-market cycles
influence fund performance. Using available data about the underlying investments of funds,
we can compute the exposure of each fund to several factors. Construction details are given
in the appendix B, but the idea is straightforward. Assume that we want to know the influence
on performance of the level of credit spreads that prevails during the life of the investments.
As we know when a given investment starts and finishes, we can compute the (time-series)
average level of credit spreads that prevails during the life of this investment. Let us denote it
TSAcs(i) for each investment i. Then, we compute the (cross-sectional) average of TSAcs(i)
across all the investments i of a given fund f, resulting in Acs(f). Acs(f) is labeled ‘fund
loading on credit spreads’. Indeed, if a fund invests mainly during times when credit spreads
are high then its ‘loading on credit spreads’ will be high. Finally, by running a cross-sectional
regression of fund performance on the vector of Acs(f), we assess the exposure/sensitivity of
fund performance to the level of credit spreads.
We compute the exposure to variables that are related to both business cycles and
public stock-markets: real GDP growth rate, BAA-bond yields, credit spreads, market
portfolio performance, and option-based risk factors. All these variables are taken at a
7 Leverage in buyouts has decreased over time. From 95% debt - 5% equity in the 80s down to 70% debt – 30%
11
quarterly frequency. Yields of Corporate-BAA bonds as reported by Moody’s reflect the cost
of debt for buyout investments. Credit spread is the difference between the yield on the
corporate-BAA bonds and the 10-year treasury bonds. This variable captures both the
probability of default and the expected recovery in case of default in the economy, which is
important for the cost of financing buyouts. Importantly, both credit spreads and bond yields
also capture certain dimensions of business cycles that are relevant for both venture and
buyout investments. Times of high credit spread and high bond yields typically correspond to
down economic times (i.e. times with low free cash-flows), especially for small and
innovative firms. The market portfolio loading aims at assessing the impact of investing in
periods of high stock-market performance. Finally, the option-based risk factors consist of
out-of-the-money European call and put options on the S&P 500 composite index traded on
the Chicago Mercantile Exchange. These option-based factors are proposed by Agarwal and
Naik (2004), who argue that it is important to take into account option-like features to
evaluate the risk of hedge funds.8 In the context of private equity, both venture and buyout
investments are likely to have an option-like payoff: buyout investments as they are highly
levered and venture investments as they are carried up by stages with, each time, a target
market value beyond which there is a new round of financing. This point is emphasized by
Cochrane (2005) who states that “venture capital investments are like options; they have a
small chance of a huge payoff.” This type of payoff is expected to resemble the payoff of a
call option.
Finally, we compute both the average earning-to-price ratio (price multiples) and the
state of the IPO market that prevails (amount of equity issued) in the year when investments
are exited. Similarly, we compute both the average yields of Corporate-BAA bonds and the
average credit spread that prevail when investments are made (i.e. at entry). These indicators
being related to the valuation of firms at entry and exit, they may play an important role for
performance.
Table 5
In Table 5, we report how these loadings relate to performance. In order to compare
the economic importance of each loading, variables are standardized by subtracting their
sample mean and dividing by their sample standard deviation (i.e. each variable is expressed
in terms of z-score). Each regression includes a correction variable (vector of lambdas, see
equity in the late 90s. 8 We are extremely grateful to Vikas Agarwal and Narayan Naik for generously providing us with their factors.
12
Greene 2003 for details about Heckit regressions) to account for a potential sample selection
bias.
As these loadings have a high correlation among one another, we first report their
statistical and economic significance one at a time. The signs of each proxy always indicate
that private equity funds offer pro-cyclical performance. Private equity funds that entered
investments at time when interest rates and credit spreads were high underperform.
Performance increases substantially when investments take place during times of high GDP
growth, high public market performance, high return for call options, and low returns on put
options. The exit variables are not statistically significant unlike entry variables. Among entry
variables, the yield on risky corporate bonds (rated BAA) is the most important variable. In
Panel C, we show that this variable remains significant irrespective of the other variables we
add in the regression. It appears that the two most significant variables are the yield on risky
corporate bonds at the time of investment and the average stock-market return during the life
of the investment.
The significance of the public stock-market return is slightly superior to the
significance of the call option return. The two variables are however highly positively
correlated and both are highly significant when we control for corporate bond yields at entry.
The result of the call option return is particularly interesting because this factor has also been
found significantly related to hedge fund performance by Agarwal and Naik (2004). It shows
that, like hedge funds, private equity funds bear significant right-tail risk. That is, the
performance is mainly realized when the public stock-market has high returns. If the public
stock-market return is below a certain threshold then private equity performance is very low
irrespective of how low public stock-market returns are.
V. The pricing of Idiosyncratic risk
Jones and Rhodes-Kropf (2003) point out that GPs are forced to hold considerable
idiosyncratic risk and that idiosyncratic risk should be an important determinant of
performance. Consequently, it is important to include measures of idiosyncratic risk among
explanatory variables for fund performance. In addition, a unique feature of our dataset
allows us to shed further light on the results uncovered by Jones and Rhodes-Kropf (2003).
Jones and Rhodes-Kropf (2003) propose a model whereby more idiosyncratic risk
should be associated with higher returns, in equilibrium. The idea is that investors want GPs
13
to specialize so that they have higher performance. 9 In equilibrium, GPs obtain a
compensation that increases with the amount of idiosyncratic risk and “all else equal, the
return received by the investors is increasing in the amount of realized idiosyncratic risk,
even though they face competitive market conditions” (their theorem 4). To test this
implication they argue that a reasonable proxy for idiosyncratic risk is the number of
investments that a fund makes. In the absence of this information they use the number of
take-downs. Our dataset, in contrast, enables us to use directly the number of investments
and, in addition, to construct several proxies that capture more closely the spirit of their
model. In addition to the number of take-downs and of investments, we then construct the
proportion invested in the dominant industry and use Herfindahl indices for type and industry
concentration based on the number of investments across deal type (venture deals vs buyout
deals) and across 48 industries.10
Table 6
Results are reported in Table 6. Unlike Jones and Rhodes-Kropf, we find a positive
relation between take-downs and performance as well as between the number of investments
and performance. Nonetheless, the industry Herfindahl is significantly positively related to
performance. The Herfindahl based on the type of deals is also positively related to
performance but not significantly so.11 However, we note that when we control for the
fraction invested in high-tech industries, this effect vanishes.12 We therefore do not find
evidence that idiosyncratic risk is priced in our sample.
9 Being focused enables GPs to work with smaller and more specialized teams that may learn faster via a high number of similar deals. An additional benefit is that GPs build tight links with the industry which may improve performance. It may also happen that unskilled managers diversify because they have failed in a certain type of deal and thus try something different or are forced to change (e.g. a manager that ends up with a couple of BO in bankruptcy may not have access to the debt market anymore). Finally, there is casual evidence (Lerner et al., 2004) that several funds have invested in a country, industry, or private equity type that is different to their stated objective in order to have a track record in that investment category and then raise a new fund in that category. In other words, GPs have an incentive to build their reputations at the expense of LPs. Interestingly, we note that, nowadays, most contracts explicitly limit this type of behavior. 10The 48 industries are as defined in Fama and French (1997). 11Note that a similar result is reported by Gompers and Lerner (2002, chap. 5). They find that companies that are funded by corporate investors that have a well-defined strategic focus enjoy greater success. 12 Industry groups are defined as follows. Health comprises three Fama French (1997) industries: healthcare, medical equipment, and pharmaceutical products. High-tech comprises four Fama French (1997) industries: electrical equipment, telecommunications, computers, and electronic equipment.
14
VI. Fund characteristics and fund performance
We now focus on the characteristics that are related to performance. The main goal here is to
characterize the type of funds that underperform in order to better understand the source of
the documented low fund performance (Kaplan and Schoar, 2005, and Phalippou and Zollo,
2005).
To begin with, we include fund size and fund size squared. Size is an important
characteristic that captures several performance-related dimensions such as reputation,
economies of scale, and learning. Indeed, a larger fund may learn faster as it makes more
deals than a smaller fund. An often-invoked downside of running a large fund is, however,
that it increases the difficulty of finding enough good deals.
We also include as explanatory variable the proportion invested outside the US as
Kaplan et al. (2003) and Hege et al. (2003) document that certain European private equity
investments have lead to very poor performance. They advance various reasons for this, such
as a wrong type of contract used and institutional differences. In addition, the private equity
industry outside the US is younger and thus at a lower point in the learning curve.
Gompers and Lerner (1999) and Kaplan and Schoar (2005) find that performance
depends on the fund sequence number.13 We thus include this variable as well. We also
include the proportion invested in venture capital and the average length of the investments.
As Lerner et al. (2004) report that certain private equity funds rush young firms to the public
market place to demonstrate a successful track record, we expect the loading on investment
length to be negative. On the other hand, long duration for investments might signal living-
deads and thus predicts lower performance. Finally, we include the amount of capital
committed in a given year as Gompers and Lerner (2000) find that, in their sample, this proxy
for the amount of “money chasing deals” negatively impact fund performance. Importantly,
each estimation, unlike in the previous literature, is executed using a sample selection
correction factor.14
Table 7
Results are reported in Table 7. Unlike previous literature, we do not find evidence of
a concave relationship between performance and fund size but do find a positive relation
between size and performance as in Kaplan and Schoar (2005). Neither do we find evidence
13 Fund families raise one fund at a time. The first fund ever raised by a given fund family is assigned a sequence number of 1, the second fund is assigned a sequence number of 2 etc. 14 This so-called lambda is derived from the Probit estimation reported in Table 3 (see Greene, 2003, for details)
15
of a “money chasing deals” effect.15 This finding is not only driven by sample correction but
also by the choice of control variables and the treatment of residual values in our
performance measure.
We confirm the importance of family experience for fund performance as measured
by fund sequence. This effect is of considerable magnitude and in line with what Gompers
and Lerner (1999) and Kaplan and Schoar (2005) report for different samples. Fund sequence
appears as the best determinant of fund performance. The next best explanatory variable is
the fraction invested in high-technology industries. Likely, funds raised before 1996 (our
sample) that have invested in high-tech industries have benefited from the buoyant IPO
market of the late 90s. Finally, we note that funds that keep their investments longer tend to
have lower performance.
Overall, we find six key determinants of fund performance: the level of corporate
bond yield at the time of investments, the return of the public stock-market during the life of
investments, the length of investments (between start and exit), the size of the fund and the
experience of the fund family. These six variables explain 11% of the cross-sectional
variation in fund performance.
VII. Conclusion
Many institutional investors invest heavily in private equity funds based on the belief that
returns are largely uncorrelated with market returns. For example, Lerner et al. (2004) report
that Yale endowment fund, one of the largest investor in private equity funds, believe that
private equity funds can “generate incremental returns independent of how the broader
markets were performing.” This paper shows that, in reality, the performance of private
equity funds is pro-cyclical as it positively co-varies with both the business cycles and public
stock-markets. In addition, this paper points toward small and inexperienced funds as the
main drivers of the documented low performance of private equity funds.
15 We note, however, that capital committed in a given year is not a precise measure of the money chasing deals as the capital committed in the previous years that is not invested yet is also chasing deals.
16
References
Agarwal, V., and N.Y. Naik, 2004, Risks and portfolio decisions involving hedge funds,
Review of Financial Studies 17, 63-98.
Blaydon, C. and M. Horvath, 2002, What’s a company worth? It depends on which GP you
ask, Venture Capital Journal, May.
Blaydon, C. and M. Horvath, 2003, LPs need to trust General Partners in setting valuations,
Venture Capital Journal, March.
Cochrane, J., 2005, The risk and return of venture capital, Journal of Financial Economics
forthcoming.
Cornell, B. and K. Green, 1991, The investment performance of low-grade bond funds,
Journal of Finance 46, 29-48.
Cotter, J. and S. Peck, 2001, The structure of debt and active equity investors: The case of the
buyout specialist, Journal of Financial Economics 59, 101-147.
Cumming, D. and U. Walz, 2004, Private equity returns and disclosure around the world,
mimeo.
Fama, E. and K. French, 1997, Industry cost of equity, Journal of Financial Economics 43,
153-193.
Fernandez, P., 2004, The value of tax shields is not equal to the present value of tax shields,
Journal of Financial Economics, forthcoming.
Gompers, P., and J. Lerner, 1999, An analysis of compensation in the U.S. venture capital
partnership, Journal of Financial Economics 51, 3-44.
Gompers, P., and J. Lerner, 2000, Money chasing deals? The impact of fund inflows on
private equity valuations, Journal of Financial Economics 55, 281-325.
Gompers, P., and J. Lerner, 2001, The venture capital revolution, Journal of Economic
Perspectives 15, 145-168.
Greene, W.H., 2003, Econometric analysis, 5th edition, Prentice Hall.
Hege, U., F. Palomino and A. Schwienbacher, 2003, Determinants of venture capital
performance: Europe and the United States, Mimeo.
Hellmann, T. 1998, The allocation of control rights in venture capital contracts, Rand Journal
of Economics 29, 57-76.
Hellmann, T. and M. Puri, 2002, Venture capital and the professionalization of Start-up
firms: Empirical evidence, Journal of Finance 57, 169-197.
Jones, C. and M. Rhodes-Kropf, 2003, The price of diversifiable risk in venture capital and
private equity, Working paper, Columbia University.
17
Kaplan, S.N., 1995, The valuation of cash flow forecasts: An empirical analysis, Journal of
Finance 50, 1059-1093.
Kaplan, S.N., F. Martel, and P. Stromberg, 2003, How do legal differences and learning
affect financial contracts?, Working paper, University of Chicago.
Kaplan, S.N. and R. Ruback, 1995, The valuation of cash flow forecasts: An empirical
analysis, Journal of Finance 50, 1059-1093.
Kaplan, S.N. and A. Schoar, 2005, Private equity performance: Returns, persistence, and
capital flows, Journal of Finance, forthcoming.
Lerner, J., 1995, Venture capitalists and the oversight of private firms, Journal of Finance 50,
301-318.
Lerner, J., F. Hardymon, and A. Leamon, 2004, Venture capital and private equity: A
casebook, 3rd edition, John Wiley & Sons.
Ljungqvist, A., and M. Richardson, 2003, The investment behavior of private equity fund
managers, working paper NYU.
Phalippou, L., and M. Zollo, 2005, Performance of private equity funds: another puzzle?,
INSEAD working paper.
18
Appendix A: Industry description and datasets A.I. Industry description A brief description of the industry is offered in this appendix. For a more detailed description, we advise interested readers to refer to Lerner et al. (2004) and Gompers and Lerner (2002).
Private Equity funds are typically structured as limited liability partnerships in which a specialized Private Equity firm serves as the general partner (GP) and institutional investors or high-net-worth individuals provide the majority of capital as limited partners (LP). Most Private Equity funds are closed-end funds with a finite life of 10 or 12 years, which may be extended with the consent of the majority of the shareholders (Gompers and Lerner, 1999). During this period, the GP undertakes investments of various types (e.g. venture capital, bridge financing, expansion capital, leveraged buyouts), with the obligation to liquidate all investments and return the proceeds to the investors by the end of the fund's life. A minority of funds, so-called "evergreen" funds have an infinite life and no obligation to liquidate their positions.
At the time of the fund's inception, LPs commit to a percentage of total fund size. In the first years of the fund life (typically the six first years), the GP makes capital calls (or take-downs) to LPs whenever it finds an investment opportunity. Typically, within two weeks, LPs have to provide the corresponding cash. The total amount of such "capital calls" can exceed the capital committed at the fund's birth, but this is relatively rare. In fact, it is more common for a fund to liquidate without having invested all the capital committed.
Whenever a fund receives returns on its investments, proceeds are proportionally distributed to LPs, net of fees and so-called "carried interest". These distributions can be in form of cash or shares (common, preferred, or convertibles). GP receives compensation in varying forms. A fixed component, a yearly management fee (between 1% and 3%) of the total committed capital is charged to LPs. In addition, GPs can receive fees for each transaction performed (fixed or as a percentage of deal value) and participates in the fund returns through "carried interest" which often specifies that 20% of all net gains (or gains beyond a certain "hurdle rate") accrue to the GP whilst the rest is distributed among LPs.
PE firms often manage several funds, raising a new fund three to five years after the closing of the fundraising process for the previous fund. Note also that some PE funds are structured as non-partnership captive or semi-captive vehicles with one dominant (or exclusive) LP. This is mainly the case with funds that are managed by subsidiaries of large insurance companies or banks that invest the parent company's money. A.II. VentureXpert content and corrections Venture Economics’ Private Equity Performance Database (also called cash-flow dataset in the text) is the most comprehensive source of financial performance of both US and European Private Equity funds and has been used in previous studies (e.g., Kaplan and Schoar, 2005). It covers about 88% of venture funds and 50% of buyout funds in terms of capital committed. In terms of number of funds, it offers cash-flow series for about 40% of both Europe funds and US funds. Venture Economics builds and maintains this dataset based on voluntarily reported information about cash flows between GPs and LPs in Private Equity funds. Venture Economics obtains and crosschecks information from both GPs and LPs, which increases the reliability of this dataset. Finally, the aggregate residual values of unrealized investments (i.e., non-exited investments) are obtained from audited financial reports of the partnership.
Venture Economics makes certain simplifying assumptions about cash flows. First, cash flows are assumed to take place at the end of the month. Second, stock distributions are valued based on the closing market price the day of distribution to LPs. In the case of an IPO, GPs have to hold on to the stock until the end of the lockup period. After this date, however,
19
they have some flexibility regarding when to distribute the stock to the LPs. In addition, the valuation at the time of stock distribution to LPs differ from the value of actual realizations by LPs, as LPs may hold the shares for a while and may face substantial transaction costs (mainly via the price impact of their trade).
For each fund, Venture Economics collects information on underlying investments through its VentureXpert database, starting from 1980 (Vxpert in the text). This database contains information on Private Equity investments in 29 739 companies. Several of these investments have received funding at different points in time (e.g. subsequent rounds in VC investments) and by different private equity funds, so that the total number of investments amounts to 134 641. Data on investments include information about the target company (location, industry description, age), the investment (time of investment, stage, group of co-investors, equity amount provided by each fund, exit date and exit mode for liquidated investments), and the fund (investment focus, vintage year). Note that the industry description of the target company is codified by Vxpert. We have converted each of these industry codes into one of the 48 industries as defined by Fama and French (1997) ourselves.
Due to the confidential character of Private Equity investments, the composition of this dataset is based on information Venture Economics obtained through its relationships with the GP and LP community over the past decades. However, despite all these efforts, a complete coverage of all investments by all funds remains difficult to achieve. Consequently, missing information about certain investments is accommodated in the following way.
Vxpert includes a number of investments with a 0 value. These correspond to confidential investments with an undisclosed equity amount. We assign an equity value to these deals according to the following logic. If we have information about at least three other investments of the same fund at the same stage (four stages are defined: early, intermediate, late VC, and buyout), we assigned the average amount of these investments to the focal investment (71% of the missing cases). Whenever there are too few investments of the same category by the same fund, we turned to the firm level (i.e., consider all investments made by the same GP) and apply the same procedure. Whenever there are too few investments made even by the firm, we rely on the average per stage across the entire sample. Similarly, Vxpert provides information on many investments but relatively few divestments. This can be explained by the confidential character of many divestitures. We then have to correct for certain missing holding periods. First, certain investments are still in the database as "active investments" with a holding period of more than seven years (i.e., that started before 1996). Second, some investments are reported as terminated but lack an exit date. The same logic as above is then applied. We estimate the average length for each type of deal and deduce the exit date. For 82% of the cases there were enough investments in the same stage operated by the same fund to use the stage-fund average length. It is important to note that these simple interpolations aim at neutralizing these anonymous deals in our weighting exit success scheme.
Recently, Kaplan, Sensoy and Stromberg (2002) studied the accuracy of Vxpert and point out that discrepancies arise from the treatment of milestone rounds; many are missing in the dataset. However, we do not use this information in our analysis. Note that Gompers and Lerner (2002, chap. 16) also describe and discuss the quality of the databases collected by Venture Economics. They report a coverage of deals of about 90% in terms of value and note that the number of rounds is overstated. Their analysis shows that VE data do not suffer from any significant biases that would impair our analysis. Regarding buyout investments, we do not know any study that discusses the accuracy of Vxpert. It is nonetheless known that buyouts have not been the focus of Venture Economics until recently and thus several deals are missing. Casual checking of Vxpert reveals that at least the largest deals are present (e.g. Nabisco).

20
Appendix B: Systematic risk of private equity fund portfolios We evaluate the systematic risk of private equity fund portfolios in three steps. We first estimate industry-wide unlevered beta. Second, we assign each company (deal) to an industry and assume that the unlevered beta of the company is the same as the corresponding industry-aggregate. We lever it up for BOs and VCs in a different fashion. Finally, we aggregate each deal beta at the fund level.
1. Estimation of industry-wide unlevered betas
First, we assume that the CAPM holds, hence the risk-return trade-off for the equity of firm h is: (1) )-(e
h fmfeh RRRR β+=
Where fR is the risk-free rate (proxied by T-bill 30 days), ehβ is the stock's systematic risk,
and mR is the market portfolio (proxied by the CRSP value-weighted index). Estimating (1) at a monthly frequency, using the Dimson's correction and rolling over the past 60 months, we obtain a time series of e
th,β for each stock. These betas are then unlevered using the following relationship:
(2) thth
thth
DEDE
,,
,d
th,,e
th,uth, )1(
)1(τ
τβββ
−+
−+=
Where Eh,t is the capitalization of firm h at the beginning of the month, Dh,t is the book value (from Compustat) of the long-term debt, updated yearly. We further assume that the corporate tax rate τ is constant across both firms and time, and equals 35%. Finally, we denote u
th,β the systematic risk of the unlevered firm and we denote dth,β the systematic risk
of debt. Following Cornell and Green (1991), who estimate the systematic risk of high-grade debt, we assume that d
th,β equals 0.25. Relation (2) makes some simplifying assumptions. In particular, it values interest tax
shields at the full corporate tax rate and assumes that the value of tax shields has the same systematic risk as the unlevered firm. More details and comments on these issues can be found in Kaplan and Ruback(1995) and Fernandez (2004).
Next, each stock is assigned to one of the 48 industries defined in Fama and French (1997). Then, individual betas are aggregated in each industry to obtain a time-series of industry (unlevered) betas:
(3) uth,
1,
uti, ββ ∑
=
=iN
hthw , with
∑=
=iN
hth
thth
E
Ew
1,
,, , i = 1,…,48
Finally, we construct the (equally-weighted) average equity betas for the 20%-smallest stocks in each industry and denote it as se
ti,β .
2. Estimation of equity betas for venture capital and buyout deals
Each investment j, carried out by a given fund, has a VEIC number assigned by VentureXpert. Using their industry description, we assign each VEIC number to one of the 48 industries (manually, by eye match).
21
Each venture capital investment is assigned an equity beta for each month between the date of entry (dentry) and the date of exit (dexit) of the deal. The equity beta is se
ti,β described above. That is, each venture capital investment operating in industry i is assigned a time-series of equity betas: ( se
dentryi,β ,..., sedexiti,β ).
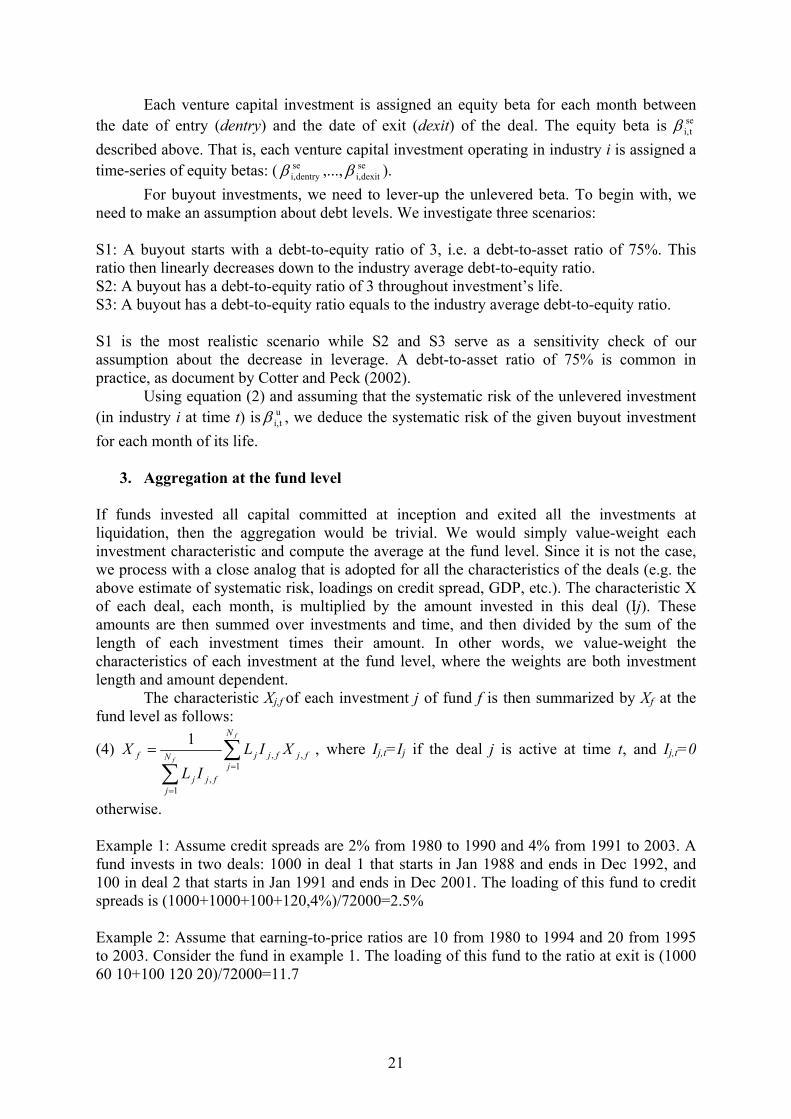
For buyout investments, we need to lever-up the unlevered beta. To begin with, we need to make an assumption about debt levels. We investigate three scenarios: S1: A buyout starts with a debt-to-equity ratio of 3, i.e. a debt-to-asset ratio of 75%. This ratio then linearly decreases down to the industry average debt-to-equity ratio. S2: A buyout has a debt-to-equity ratio of 3 throughout investment’s life. S3: A buyout has a debt-to-equity ratio equals to the industry average debt-to-equity ratio. S1 is the most realistic scenario while S2 and S3 serve as a sensitivity check of our assumption about the decrease in leverage. A debt-to-asset ratio of 75% is common in practice, as document by Cotter and Peck (2002).
Using equation (2) and assuming that the systematic risk of the unlevered investment (in industry i at time t) is u
ti,β , we deduce the systematic risk of the given buyout investment for each month of its life.
3. Aggregation at the fund level
If funds invested all capital committed at inception and exited all the investments at liquidation, then the aggregation would be trivial. We would simply value-weight each investment characteristic and compute the average at the fund level. Since it is not the case, we process with a close analog that is adopted for all the characteristics of the deals (e.g. the above estimate of systematic risk, loadings on credit spread, GDP, etc.). The characteristic X of each deal, each month, is multiplied by the amount invested in this deal (Ij). These amounts are then summed over investments and time, and then divided by the sum of the length of each investment times their amount. In other words, we value-weight the characteristics of each investment at the fund level, where the weights are both investment length and amount dependent.
The characteristic Xj,f of each investment j of fund f is then summarized by Xf at the fund level as follows:
(4) ∑∑ =
=
=f
f
N
jfjfjjN
jfjj
f XILIL
X1
,,
1,
1 , where Ij,t=Ij if the deal j is active at time t, and Ij,t=0
otherwise. Example 1: Assume credit spreads are 2% from 1980 to 1990 and 4% from 1991 to 2003. A fund invests in two deals: 1000 in deal 1 that starts in Jan 1988 and ends in Dec 1992, and 100 in deal 2 that starts in Jan 1991 and ends in Dec 2001. The loading of this fund to credit spreads is (1000+1000+100+120,4%)/72000=2.5% Example 2: Assume that earning-to-price ratios are 10 from 1980 to 1994 and 20 from 1995 to 2003. Consider the fund in example 1. The loading of this fund to the ratio at exit is (1000 60 10+100 120 20)/72000=11.7
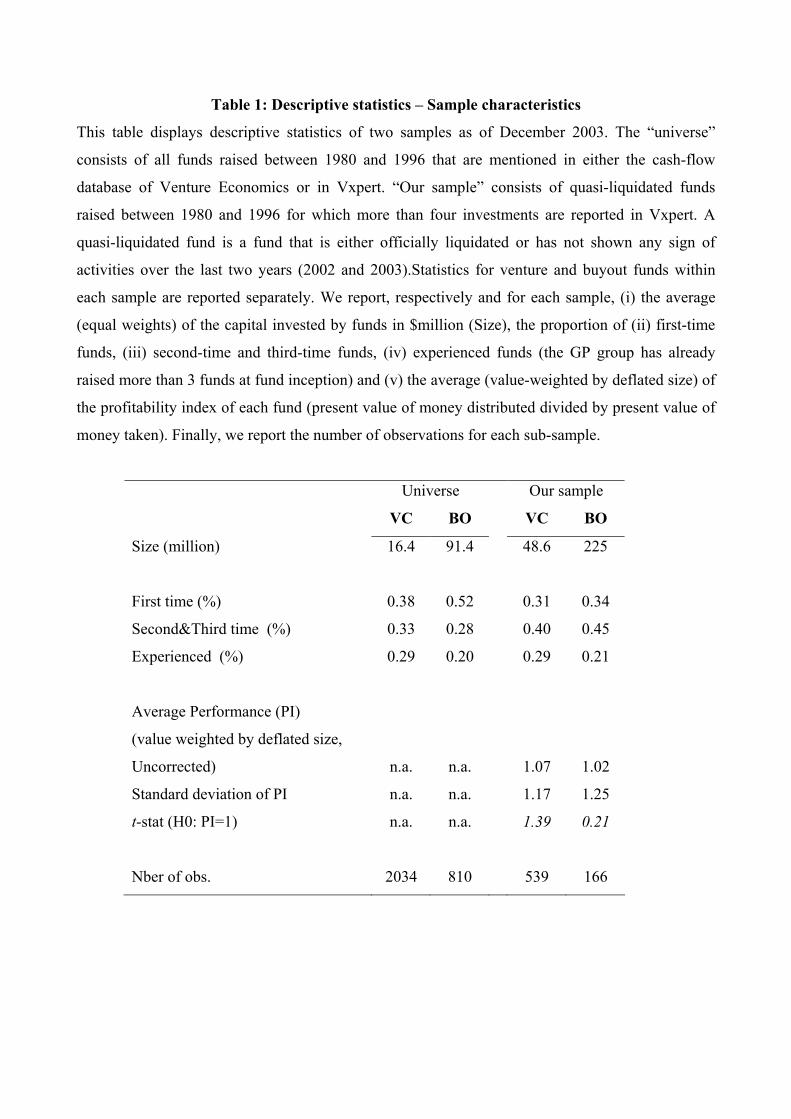
Table 1: Descriptive statistics – Sample characteristics
This table displays descriptive statistics of two samples as of December 2003. The “universe”
consists of all funds raised between 1980 and 1996 that are mentioned in either the cash-flow
database of Venture Economics or in Vxpert. “Our sample” consists of quasi-liquidated funds
raised between 1980 and 1996 for which more than four investments are reported in Vxpert. A
quasi-liquidated fund is a fund that is either officially liquidated or has not shown any sign of
activities over the last two years (2002 and 2003).Statistics for venture and buyout funds within
each sample are reported separately. We report, respectively and for each sample, (i) the average
(equal weights) of the capital invested by funds in $million (Size), the proportion of (ii) first-time
funds, (iii) second-time and third-time funds, (iv) experienced funds (the GP group has already
raised more than 3 funds at fund inception) and (v) the average (value-weighted by deflated size) of
the profitability index of each fund (present value of money distributed divided by present value of
money taken). Finally, we report the number of observations for each sub-sample.
Universe Our sample
VC BO VC BO
Size (million) 16.4 91.4 48.6 225
First time (%) 0.38 0.52 0.31 0.34
Second&Third time (%) 0.33 0.28 0.40 0.45
Experienced (%) 0.29 0.20 0.29 0.21
Average Performance (PI)
(value weighted by deflated size,
Uncorrected) n.a. n.a. 1.07 1.02
Standard deviation of PI n.a. n.a. 1.17 1.25
t-stat (H0: PI=1) n.a. n.a. 1.39 0.21
Nber of obs. 2034 810 539 166
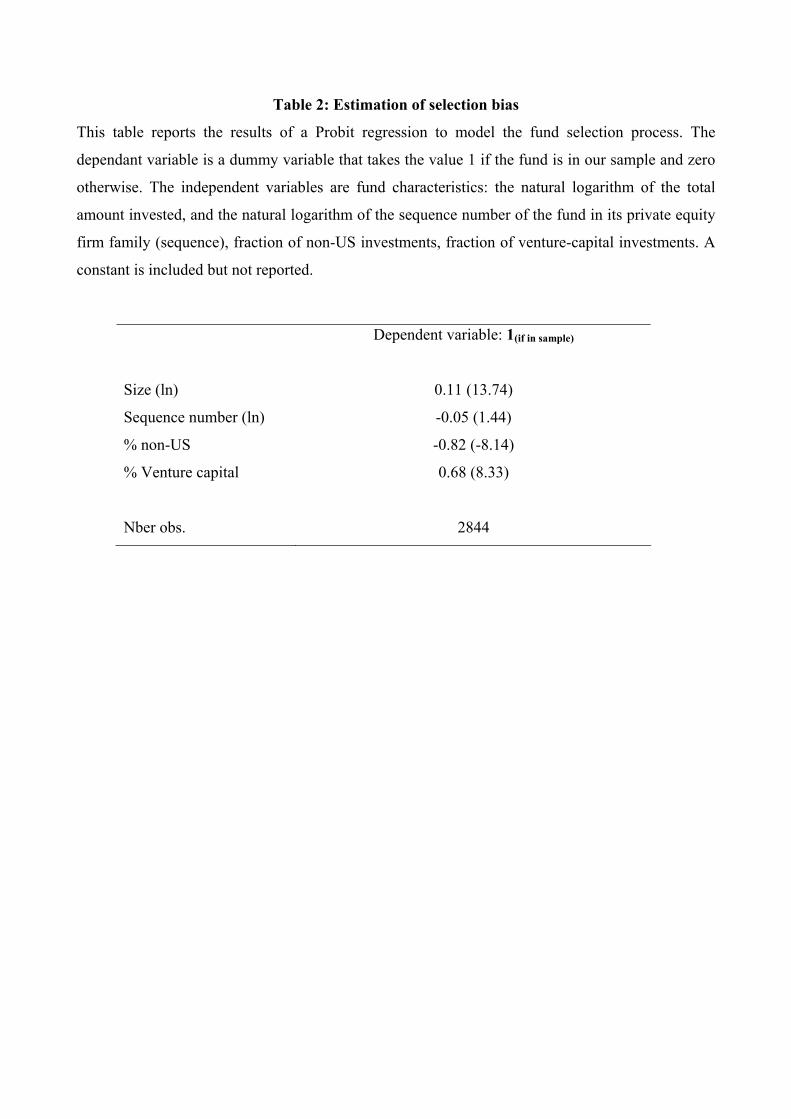
Table 2: Estimation of selection bias
This table reports the results of a Probit regression to model the fund selection process. The
dependant variable is a dummy variable that takes the value 1 if the fund is in our sample and zero
otherwise. The independent variables are fund characteristics: the natural logarithm of the total
amount invested, and the natural logarithm of the sequence number of the fund in its private equity
firm family (sequence), fraction of non-US investments, fraction of venture-capital investments. A
constant is included but not reported.
Dependent variable: 1(if in sample)
Size (ln) 0.11 (13.74)
Sequence number (ln) -0.05 (1.44)
% non-US -0.82 (-8.14)
% Venture capital 0.68 (8.33)
Nber obs. 2844
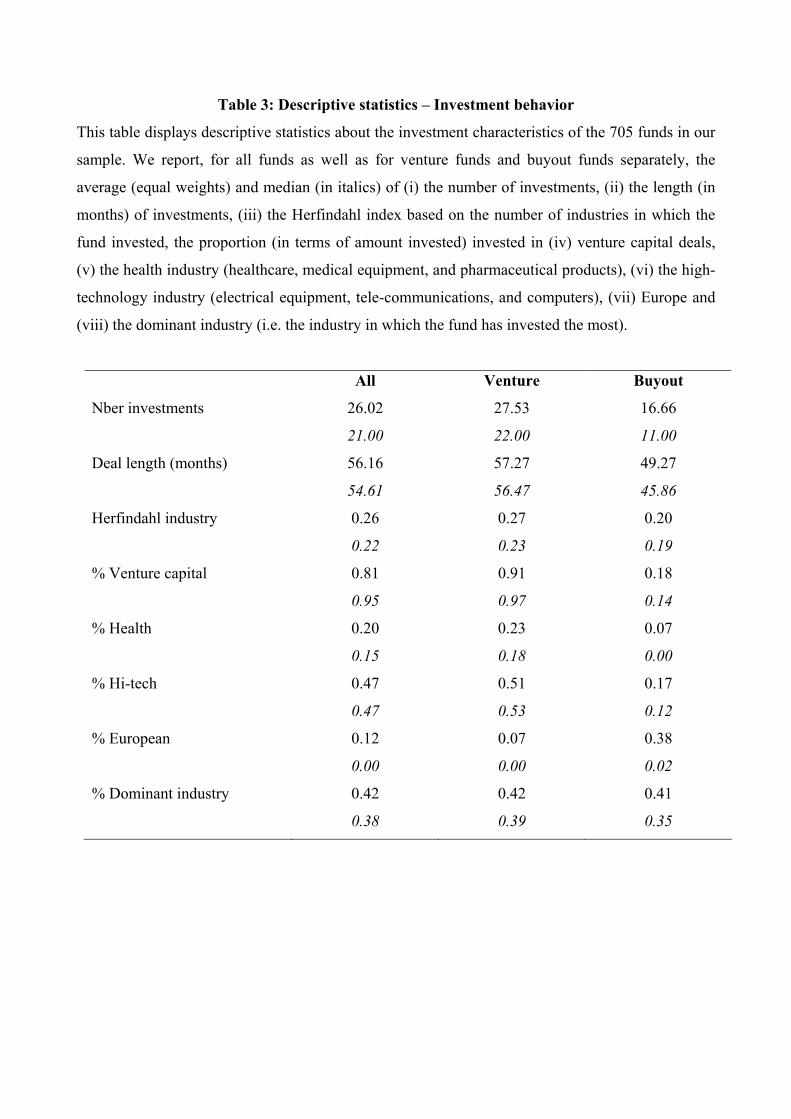
Table 3: Descriptive statistics – Investment behavior
This table displays descriptive statistics about the investment characteristics of the 705 funds in our
sample. We report, for all funds as well as for venture funds and buyout funds separately, the
average (equal weights) and median (in italics) of (i) the number of investments, (ii) the length (in
months) of investments, (iii) the Herfindahl index based on the number of industries in which the
fund invested, the proportion (in terms of amount invested) invested in (iv) venture capital deals,
(v) the health industry (healthcare, medical equipment, and pharmaceutical products), (vi) the high-
technology industry (electrical equipment, tele-communications, and computers), (vii) Europe and
(viii) the dominant industry (i.e. the industry in which the fund has invested the most).
All Venture Buyout
Nber investments 26.02 27.53 16.66
21.00 22.00 11.00
Deal length (months) 56.16 57.27 49.27
54.61 56.47 45.86
Herfindahl industry 0.26 0.27 0.20
0.22 0.23 0.19
% Venture capital 0.81 0.91 0.18
0.95 0.97 0.14
% Health 0.20 0.23 0.07
0.15 0.18 0.00
% Hi-tech 0.47 0.51 0.17
0.47 0.53 0.12
% European 0.12 0.07 0.38
0.00 0.00 0.02
% Dominant industry 0.42 0.42 0.41
0.38 0.39 0.35
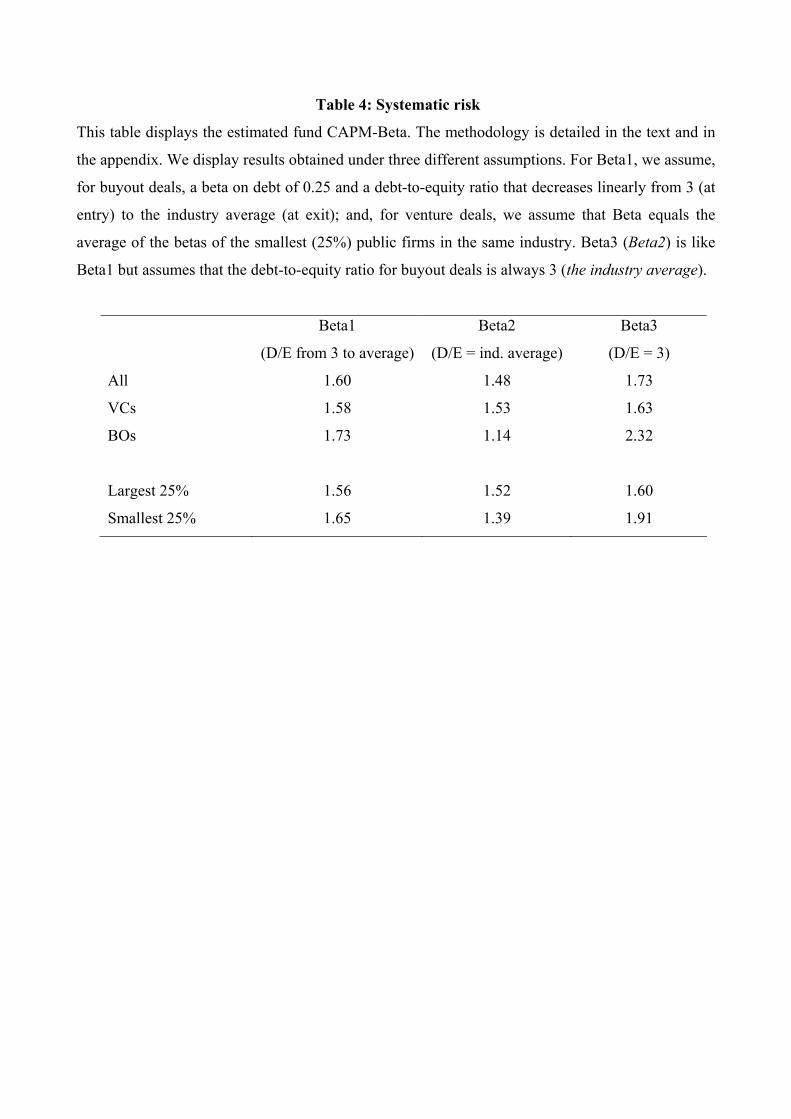
Table 4: Systematic risk
This table displays the estimated fund CAPM-Beta. The methodology is detailed in the text and in
the appendix. We display results obtained under three different assumptions. For Beta1, we assume,
for buyout deals, a beta on debt of 0.25 and a debt-to-equity ratio that decreases linearly from 3 (at
entry) to the industry average (at exit); and, for venture deals, we assume that Beta equals the
average of the betas of the smallest (25%) public firms in the same industry. Beta3 (Beta2) is like
Beta1 but assumes that the debt-to-equity ratio for buyout deals is always 3 (the industry average).
Beta1
(D/E from 3 to average)
Beta2
(D/E = ind. average)
Beta3
(D/E = 3)
All 1.60 1.48 1.73
VCs 1.58 1.53 1.63
BOs 1.73 1.14 2.32
Largest 25% 1.56 1.52 1.60
Smallest 25% 1.65 1.39 1.91

Table 5: Performance and business cycles
This table presents the results of multiple regressions, in which the dependent variable is ln(1+PI);
where PI is the profitability index (see text for definition). Explanatory variables include: 1)
average corporate bond yield (BAA) and credit spread (BAA bond yield minus 10 years Treasury-
Bill); during the quarter when the investment was made, 2) average real GDP growth, corporate
bond yield, public stock-market portfolio return (CRSP-VW), return of the out-of-the-money call
option on the S&P composite index and return of the out-of-the-money put option on the S&P
composite index; during the life of the investments, 3) average earning-to-price ratio (for all stocks
listed on the NYSE/AMEX/NASDAQ) and the amount of money raised through an IPO during the
year when investment was exited. There are 705 observations. The t-statistics are reported between
parentheses. All the variables are expressed as a z-score. A constant and a vector of lambdas (which
controls for the fact that the fund was selected in our sample; Heckit methodology, see Greene,
2003) are included in all regressions but are not reported.

Panel A: Regression of performance on macroeconomic variables during investments
1 2 3 4 5
Market 0.08 (1.89)
GDP 0.18 (4.42)
BAA-yield -0.16 (-3.90)
OTM Call Option 0.06 (1.24)
OTM Put Option -0.06 (-1.32)
Panel B: Regression of performance on macroeconomic variables at entry and exit of investments
1 2 3 4 5
At entry:
Credit spread -0.12 (-2.93) -0.06 (-1.20)
BAA-yield -0.16 (-3.98) -0.13 (-2.83)
At exit:
IPO 0.06 (1.55)
E/P 0.05 (1.20)
Panel C: Regression of performance on macroeconomic variables
1 2 3 4
BAA-yield entry -0.19 (-4.56) -0.08 (-1.76) -0.20 (-4.64) -0.17 (-4.18)
Market during 0.13 (3.01)
GDP during 0.13 (2.72)
OTM Call Option during 0.12 (2.78)
OTM Put Option during -0.08 (-1.98)
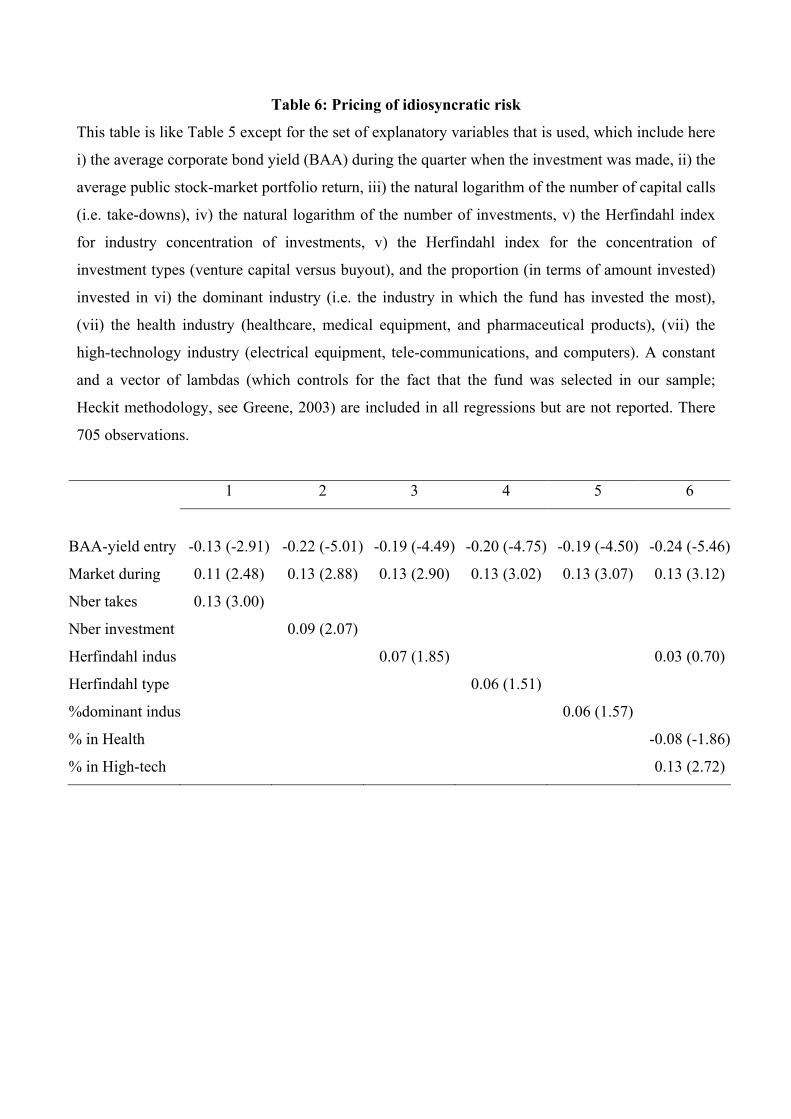
Table 6: Pricing of idiosyncratic risk
This table is like Table 5 except for the set of explanatory variables that is used, which include here
i) the average corporate bond yield (BAA) during the quarter when the investment was made, ii) the
average public stock-market portfolio return, iii) the natural logarithm of the number of capital calls
(i.e. take-downs), iv) the natural logarithm of the number of investments, v) the Herfindahl index
for industry concentration of investments, v) the Herfindahl index for the concentration of
investment types (venture capital versus buyout), and the proportion (in terms of amount invested)
invested in vi) the dominant industry (i.e. the industry in which the fund has invested the most),
(vii) the health industry (healthcare, medical equipment, and pharmaceutical products), (vii) the
high-technology industry (electrical equipment, tele-communications, and computers). A constant
and a vector of lambdas (which controls for the fact that the fund was selected in our sample;
Heckit methodology, see Greene, 2003) are included in all regressions but are not reported. There
705 observations.
1 2 3 4 5 6
BAA-yield entry -0.13 (-2.91) -0.22 (-5.01) -0.19 (-4.49) -0.20 (-4.75) -0.19 (-4.50) -0.24 (-5.46)
Market during 0.11 (2.48) 0.13 (2.88) 0.13 (2.90) 0.13 (3.02) 0.13 (3.07) 0.13 (3.12)
Nber takes 0.13 (3.00)
Nber investment 0.09 (2.07)
Herfindahl indus 0.07 (1.85) 0.03 (0.70)
Herfindahl type 0.06 (1.51)
%dominant indus 0.06 (1.57)
% in Health -0.08 (-1.86)
% in High-tech 0.13 (2.72)
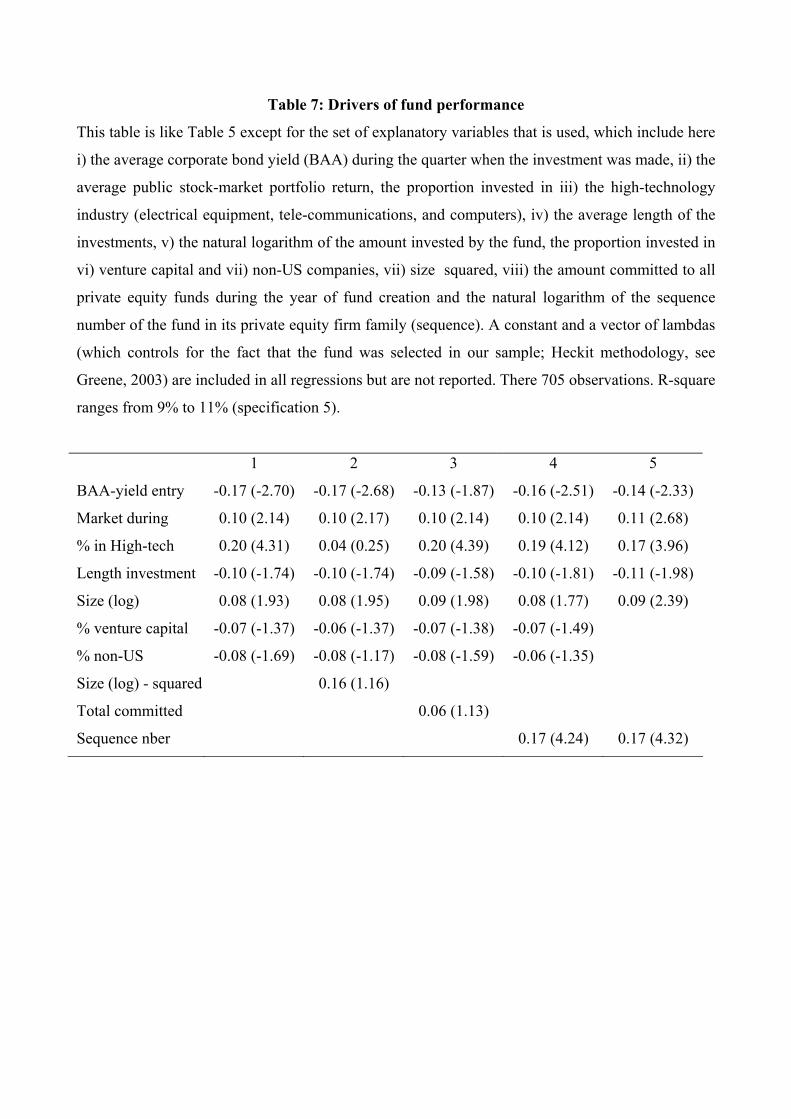
Table 7: Drivers of fund performance
This table is like Table 5 except for the set of explanatory variables that is used, which include here
i) the average corporate bond yield (BAA) during the quarter when the investment was made, ii) the
average public stock-market portfolio return, the proportion invested in iii) the high-technology
industry (electrical equipment, tele-communications, and computers), iv) the average length of the
investments, v) the natural logarithm of the amount invested by the fund, the proportion invested in
vi) venture capital and vii) non-US companies, vii) size squared, viii) the amount committed to all
private equity funds during the year of fund creation and the natural logarithm of the sequence
number of the fund in its private equity firm family (sequence). A constant and a vector of lambdas
(which controls for the fact that the fund was selected in our sample; Heckit methodology, see
Greene, 2003) are included in all regressions but are not reported. There 705 observations. R-square
ranges from 9% to 11% (specification 5).
1 2 3 4 5
BAA-yield entry -0.17 (-2.70) -0.17 (-2.68) -0.13 (-1.87) -0.16 (-2.51) -0.14 (-2.33)
Market during 0.10 (2.14) 0.10 (2.17) 0.10 (2.14) 0.10 (2.14) 0.11 (2.68)
% in High-tech 0.20 (4.31) 0.04 (0.25) 0.20 (4.39) 0.19 (4.12) 0.17 (3.96)
Length investment -0.10 (-1.74) -0.10 (-1.74) -0.09 (-1.58) -0.10 (-1.81) -0.11 (-1.98)
Size (log) 0.08 (1.93) 0.08 (1.95) 0.09 (1.98) 0.08 (1.77) 0.09 (2.39)
% venture capital -0.07 (-1.37) -0.06 (-1.37) -0.07 (-1.38) -0.07 (-1.49)
% non-US -0.08 (-1.69) -0.08 (-1.17) -0.08 (-1.59) -0.06 (-1.35)
Size (log) - squared 0.16 (1.16)
Total committed 0.06 (1.13)
Sequence nber 0.17 (4.24) 0.17 (4.32)