what drives agricultural policy reform in...
TRANSCRIPT

Photo Credit Goes Here
Feed the Future Nigeria Agricultural Policy Project
June 30, 2016
What Drives Agricultural Policy
Reform in Africa?Insights from the Kaleidoscope Model of
Food Security Change
Danielle Resnick, IFPRI

Outline
1) Motivations for a conceptual framework of drivers of food
security and agricultural policy change
2) Introduction to the Kaleidoscope Model
3) Application to Zambia’s Farmer Input Support Program
4) Preview of application to Nigeria’s land tenure reform efforts
5) Conclusions

Motivations & Objectives
• Achieving policy impact requires a deep understanding of the policy
process to identify practical entry points
• The process is messy, opaque, with volatility and incoherence and
often affected by the local context
• But can we find an operational framework with testable hypotheses
across different countries and different policy domains?
• Doing so requires reconciling silver bullet approaches from the
development community with academic policy process theorizing

Development Community ApproachesHypotheses Underlying assumptions Operational examples
Monte Carlo Changes in the payoff matrix influence the
probability and direction of public
investments and policy change.
• Structural adjustment programs
• CAADP investment plans
Sherlock Holmes Better empirical evidence leads to better
policies.
• ReSAKSS
• Fewsnet
• Food security portal
• DHS data program
Contagion
Inoculation
Prominent policy “success stories,” can
spur international emulation.
• Abuja Fertilizer Summit
• SUN initiative
Masters of the
Universe
Top-down negotiations and high-level
commitments can enable and enforce
policy change.
• New Alliance agreements
• Maputo Declaration
Frank Lloyd
Wright
Institutional architecture matters; open,
transparent, evidence-based policy
processes improve policy outcomes.
• Joint sector reviews
• GAFSP
• Feed the Future program
Hercules Champions of policy change can overcome
flawed institutional architecture to effect
policy change and confront powerful Dark
Knights
• Africa Lead Champions of
Change
• AGRA policy champions
• Transform Nutrition champions

Academic ApproachesDominant view of
the state
What shapes actors' behavior?
Interests Institutions Ideas and Identity
Captured by
society
Public choice theory
Marxism
Autonomous
from society,
unitary
preferences
Elitist theory Street level
bureaucrats
Corporatism
Developmental states
Interactive with
society, diverse
preferences
Multiple streams
Punctuated equilibrium
Policy paradigms
Policy networks theory
Advocacy coalitions
Social construction
theory

Our Approach
• Builds on existing scholarship and development approaches
• But also is inductively derived by comparing existing case studies of
policy change in developing regions in domains related to food security
(e.g. health, education, agriculture, social protection)
• Macro variables were identified across cases that were consistently
important in explaining why a policy reached a particular stage of the
policy process
• Follows the logic of Qualitative Comparative Analysis (QCA)
• Attention given to highlighting necessary and sufficient conditions for
policy change to occur

Kaleidoscope Model

In more detail…

In more detail…

In more detail…

Applications to Distinct Policy Domains
• Input subsidy programs – Ghana, Tanzania, and Zambia
• Micronutrient interventions – Malawi, South Africa, and Zambia
• Seed safety – ECOWAS
• Land tenure reform – Nigeria
• Public sector reforms – CAADP, Ethiopia, Ghana, Rwanda, Tanzania

Analytical ToolsPolicy chronologies –process tracing by indicating whether certain
events precipitated subsequent policy changes
Agricultural policy mapping- identifies key institutions and frameworks,
regulations, procedures, etc.
Policy domain mapping - roles of key actors (e.g. formulation,
administration, oversight, or knowledge)
Stakeholder inventories - identifies perceived winners and losers and
their preferences
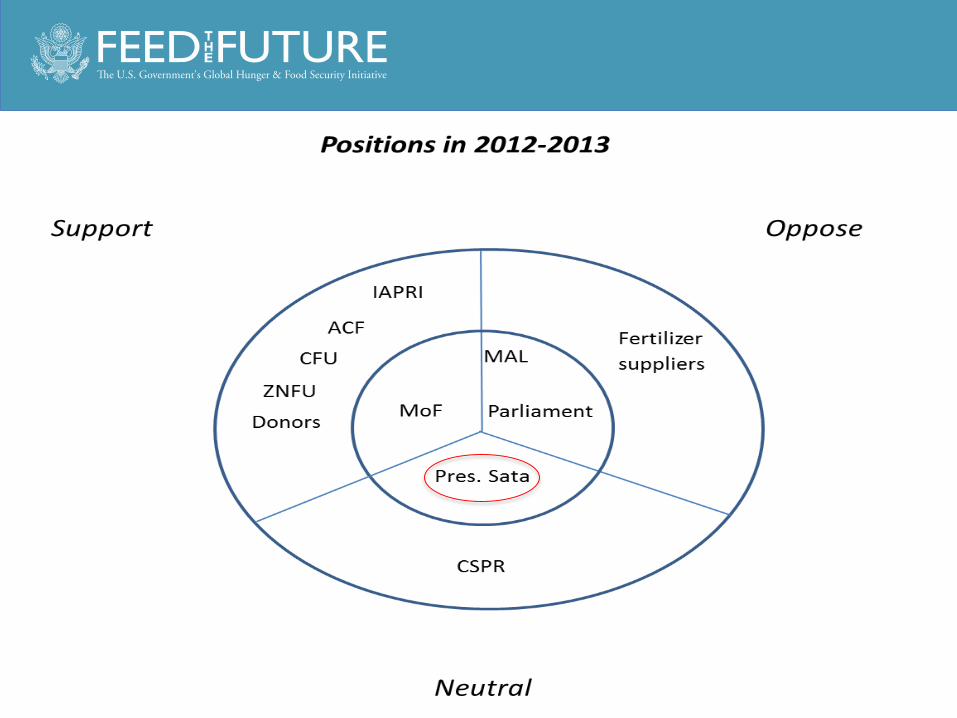
Circle of influence graphics - aligns stakeholders in a two dimensional
space to map their preferences vis-à-vis a policy with their power
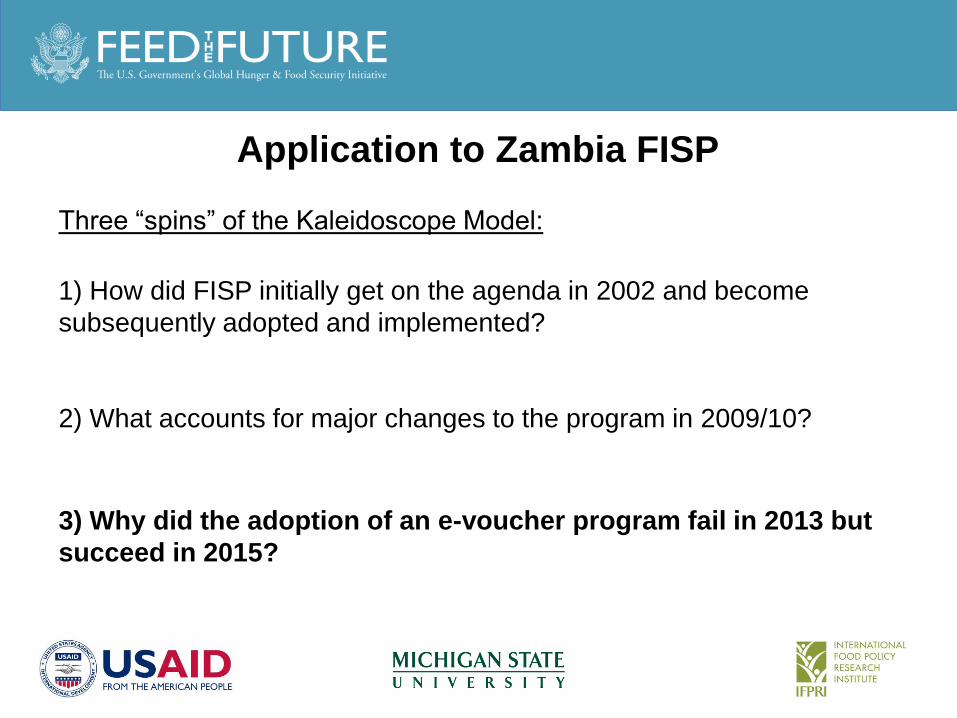
Application to Zambia FISP
Three “spins” of the Kaleidoscope Model:
1) How did FISP initially get on the agenda in 2002 and become
subsequently adopted and implemented?
2) What accounts for major changes to the program in 2009/10?
3) Why did the adoption of an e-voucher program fail in 2013 but
succeed in 2015?

Cropping year
No. of intended
benefi-ciaries
Quantities of subsidized inputs (MT) Subsidy rate
Total program
cost (US$
million)
Total cost
as % of agric.
expend-itures
Total cost as % of
national expend-
ituresFertilizerMaizeseed
Riceseed
Sorghumseed
Cottonseed
Ground-nut seed Fertilizer
Maize seed
2002/03 120,000 48,000 2,400 0 0 0 0 50 504.04 10.4 0.5
2003/04 150,000 60,000 3,000 0 0 0 0 50 5010.56 17.2 1.1
2004/05 115,000 46,000 2,500 0 0 0 0 50 5020.52 26.8 1.6
2005/06 125,000 50,000 2,500 0 0 0 0 50 5031.36 26.9 1.9
2006/07 210,000 84,000 4,234 0 0 0 0 60 6051.08 25.5 2.4
2007/08 125,000 50,000 2,550 0 0 0 0 60 6051.10 18.0 2.2
2008/09 200,000 80,000 4,000 0 0 0 0 75 50131.37 37.6 3.5
2009/10 500,000 100,000 5,342 0 0 0 0 75 50111.99 42.5 3.7
2010/11 891,500 178,000 8,790 30 0 0 0 76 50122.78 29.9 3.4
2011/12 914,670 182,454 8,985 39 0 0 0 79 53184.21 30.1 4.4
2012/13 877,000 183,634 8,770 143 60 286 150 -- --165.68 50.3 3.1
2013/14 900,000 188,312 9,000 159 107 156 130 50 100113.22 30.2 1.9
2014/15 1,000,000 208,236 10,000 127 119 0 1,357 -- -- -- -- --
Sources: Calculated by Nicole Mason. ZMAL (various years), ZMFNP (various years).
Overview of Zambia’s FISP
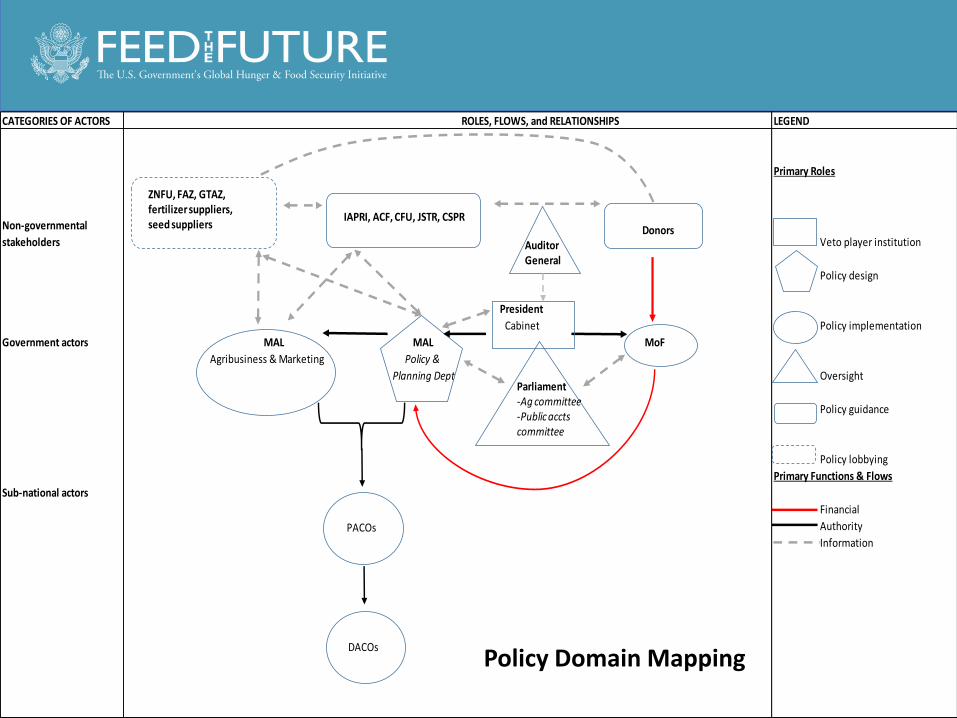
CATEGORIES OF ACTORS LEGEND
Primary Roles
Non-governmental
stakeholders Veto player institution
Policy design
President
Cabinet Policy implementation
Government actors MAL MAL MoF
Agribusiness & Marketing Policy &
Planning Dept Oversight
Policy guidance
Policy lobbying
Primary Functions & Flows
Sub-national actors
Financial
Authority
Information
ROLES, FLOWS, and RELATIONSHIPS
ZNFU, FAZ, GTAZ, fertilizer suppliers, seed suppliers Donors
IAPRI, ACF, CFU, JSTR, CSPR
Parliament-Ag committee-Public accts committee
PACOs
DACOs
AuditorGeneral
Policy Domain Mapping

E-voucher Adoption (Round 1)

Pioneering of e-vouchers by Zoona in 2009
IAPRI, ZNFU, CFU, ACF, JASZ*
Corruption, poor targeting, leakage, excessive spending, and loss of 26 billion kwacha in 2006
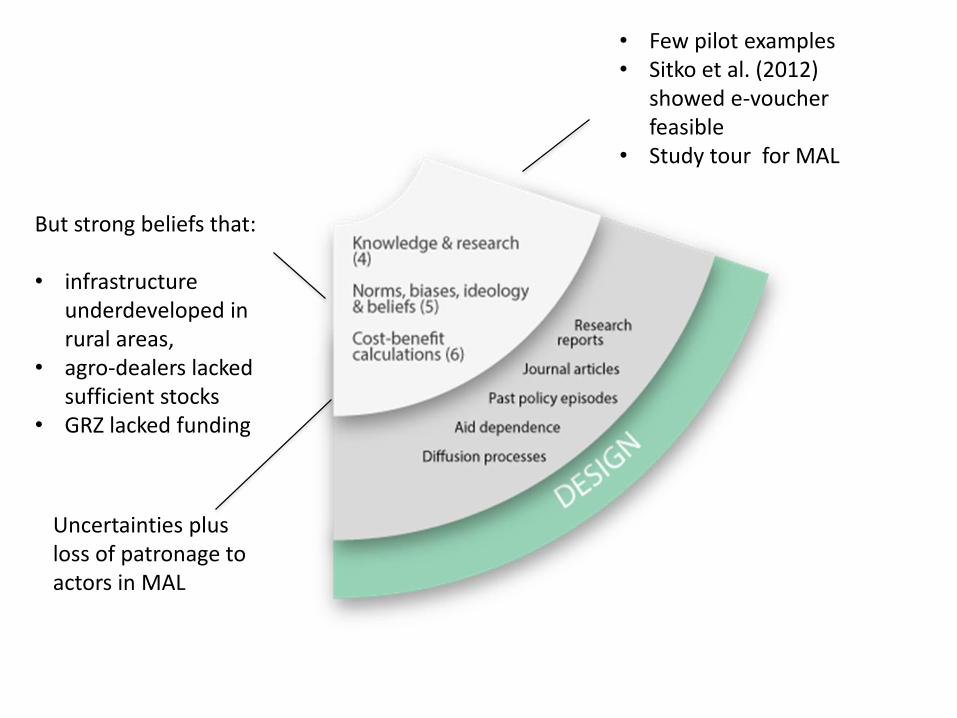
• Few pilot examples• Sitko et al. (2012)
showed e-voucher feasible
• Study tour for MAL
But strong beliefs that:
• infrastructure underdeveloped in rural areas,
• agro-dealers lacked sufficient stocks
• GRZ lacked funding
Uncertainties plus loss of patronage to actors in MAL

Policy Chronology (Round 1)

E-voucher Adoption (Round 2)

• ZNFU launched pre-paid Visa card in 2014
• Pilots with scratch cards revealed some lessons learned
• New MAL minister held 2 Indabas on issue Belief that:
• a Visa card could be used for all social welfare programs
• Included “wallets” to be used for more than fertilizer/seed
• Be “catalytic” for the banking sector
• Key figures benefitting from patronage in MAL resigned
• Promise of improved transparency and reduced outlays
• Donor commitments
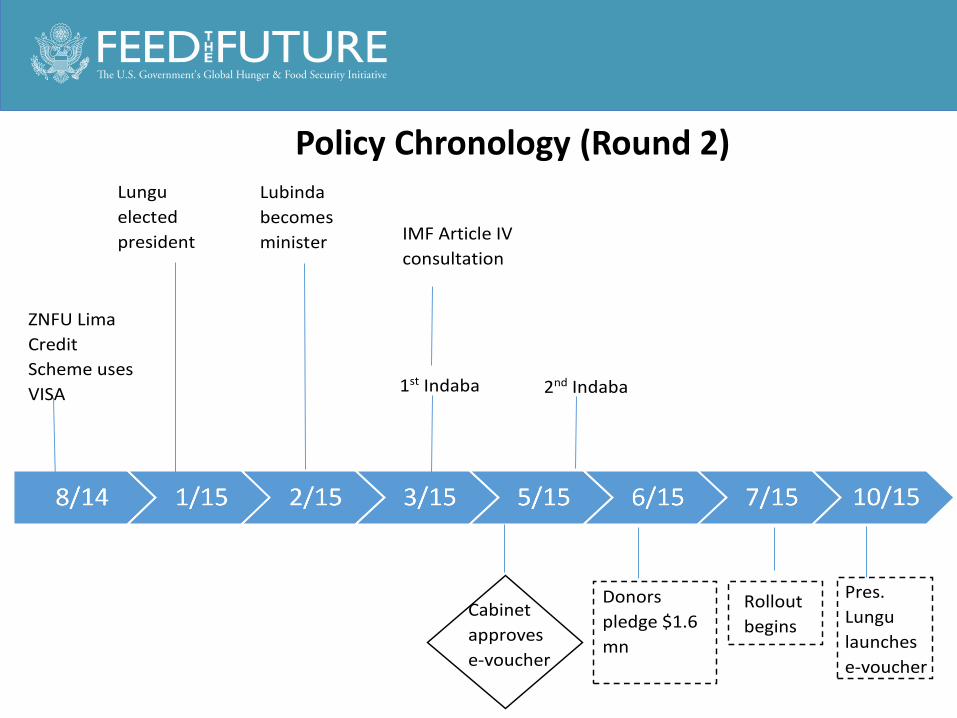
Lubinda
becomes
minister
1st Indaba
Donors
pledge $1.6
mn
ZNFU Lima
Credit
Scheme uses
VISA
Rollout
begins
Pres.
Lungu
launches
e-voucher
Lungu
elected
president
2nd Indaba
IMF Article IV
consultation
Cabinet
approves
e-voucher
Policy Chronology (Round 2)


• People like you are pushing on the e-vouchers, but I have a different view: us, we will not put fertilizer in remote areas. (Omnia representative)
• The subsidy will never go away. It’s a political tool. So all we can do is to push for it to be refined. (Grain Traders’ Association of Zambia)
• Whenever we pushed e-voucher in the past, MAL went to the president or the vice president and we were stopped. So we said that we would include it in some of our loans as a condition as something that has to be done. (MoF representative)
• All the cooperating partners think the e-voucher is the way to go and we’ve seen them driving that. (MAL deputy minister)
Illustrative Quotes

Nigerian Land Reform: 2 Layers
(1) Federal level
• Land tenure has been a relevant problem for a long time in
Nigeria, with many arguing that the Land Use Act needed to
be reformed
o Why did President Yar’Adua include this in his 7 Point Agenda in
2007 and submit a Bill to reform LUA in 2009?
o Why was the Bill ultimately stymied at the adoption stage?
o Why has the Draft Land Policy drafted by the PTCLR and others
been stalled thus far?
o How do shifts in the political setting, and increasing acceptance of
the SLTR by more and more states, affect political will to reform?
Nigerian Land Reform: 2 Layers
(2) State level
• What accounts for differential levels of progress with, and
approaches toward, improving land registration and titling
across states?
o Key states under consideration are:
o Kano, Ondo – “supply-driven” pilot SLTR states
o Kaduna, Jigawa – “demand-driven” pilot SLTR states
o Cross Rivers, Lagos – “trailblazer states”
o Key variables explored include degree of donor engagement,
private sector interests, incentive for IGR, individual
leadership of governors, and lobbying by civil society

Emerging Lessons
• Pilot examples can sometimes be more convincing than
abstract policy recommendations
• Both donor interests and aid modalities play an important
role in the agenda and implementation stages
• Technical solutions that ignore political realities may have
limited impact in winning over veto players
• Institutional instability intersects strongly with the policy
process • Since 2001, 6 mergers of “lands” ministry, with 9 ministers in Nigeria

Conclusions
• Potential for predictive explanation for why some policies are adopted but never implemented, and why some never even get on the agenda
• Opportunities for controlled comparative analysis by identifying common drivers of policy change in…– similar policy domains across different countries or states
– different policy domains within the same country
• Integrates importance of interests, ideas, and institutions, as well as the relative weight of external and domestic actors
• Identifies relative weight of research compared with many other factors and when research may have the most impact

www.feedthefuture.gov