what does the universe look like in color?
TRANSCRIPT
EXPLORATION 3: ASTRO-PHOTOGRAPHER!
What does the universelook like in color?
The purpose of this exploration is to create a full-color image of acelestial object, using three black-and-white images taken throughthe telescope's color filters.
• The human eye can sense red, green, and blue light.Combinations of these three colors are perceived as full-color.
• Any color scene can be separated into its red, green, and bluecomponents and then reconstructed to form full color.
• The color of a celestial object carries information about theobject's temperature, composition, speed, and other physicalproperties.
• When creating an image, scientists may have to make choicesabout what to display, and these choices may affect theinterpretation of the image.
Background
With training, the average person can distinguish about one millioncolors. That makes it all the more amazing that, for hundreds ofyears, artists have been able to mix almost any color from just threepigments: red, yellow, and blue (and white to lighten the mixture).
In the 1860's, the German physiologist Hermann von Helmholtzdiscovered that the eye has three different kinds of cells that respondto three different regions of the color spectrum. Most peoplethought these cells would turn out to be sensitive to red, yellow, andblue light—since these were the "primary" pigments that artists had
long used. But to everyone's surprise, Helmholtz showed that theeye's three kinds of color receptors have their peak sensitivity to red,green, and blue light. These three colors are now known as theprimary colors of light, since any color the eye can see can beproduced by stimulating the eye with a combination of red, green,and blue light.
From a scientific point of view, Helmholtz' discovery was a greatsuccess. It explained, for example, the phenomenon of after-images.If you stare at a red circle, for example, for half a minute or so, andthen look at a blank white part of the page, you will see a bluish-green after-image. Helmholtz interpreted this as indicating that theeye's red-receptors somehow got "used up" in staring at the color,allowing the blue- and green-receptors to dominate vision andproduce the bluish-green afterimage.
Inspired by Helmholtz' early experiments on color vision, theScottish physicist James Clerk Maxwell gave an astoundingdemonstration to the British Academy in 1861: He was able tocreate a full-color image of a Scottish tartan ribbon, from threeblack-and-white slides projected through red, green, and blue filtersto form one image. This proved that full-color could be recreatedfrom mixing red, green, and blue light.
Artists were fascinated by these new scientific discoveries, whichstimulated new styles of art. Georges Seurat, for example, attemptedto stimulate the viewer's eye with paintings created from thousandsof dots, often using primary colors or complementary colors side byside. But artists quickly found it difficult and unrewarding to try tomimic the mixing of light by juxtaposing colored pigments. Today,the primary pigments for artists remain red, yellow, and blue—whilethe primary colors of light are red, green, and blue, as you can seefrom closely observely the screen of your television set or computermonitor.
Detail from Seurat’sBathing at Asnieres.
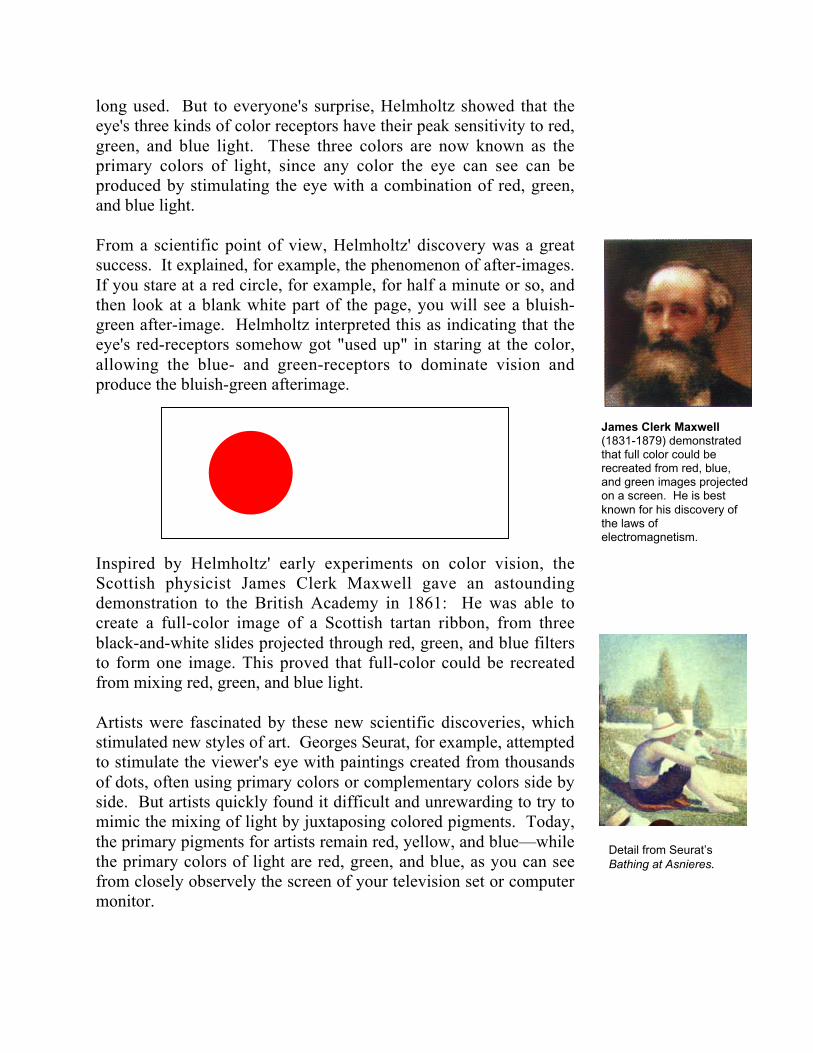
James Clerk Maxwell(1831-1879) demonstratedthat full color could berecreated from red, blue,and green images projectedon a screen. He is bestknown for his discovery ofthe laws ofelectromagnetism.
Color and the universe
The universe tells us its story largely through the light that it sendsus—and color plays a key role in the story. To the eye, the objectsin the night sky look unremittingly white, except for the planet Marsand a few stars, such as Antares, whose reddish glow is noticeable ifyou look carefully. But through a telescope, the universe is aglowwith color. What can these colors reveal?
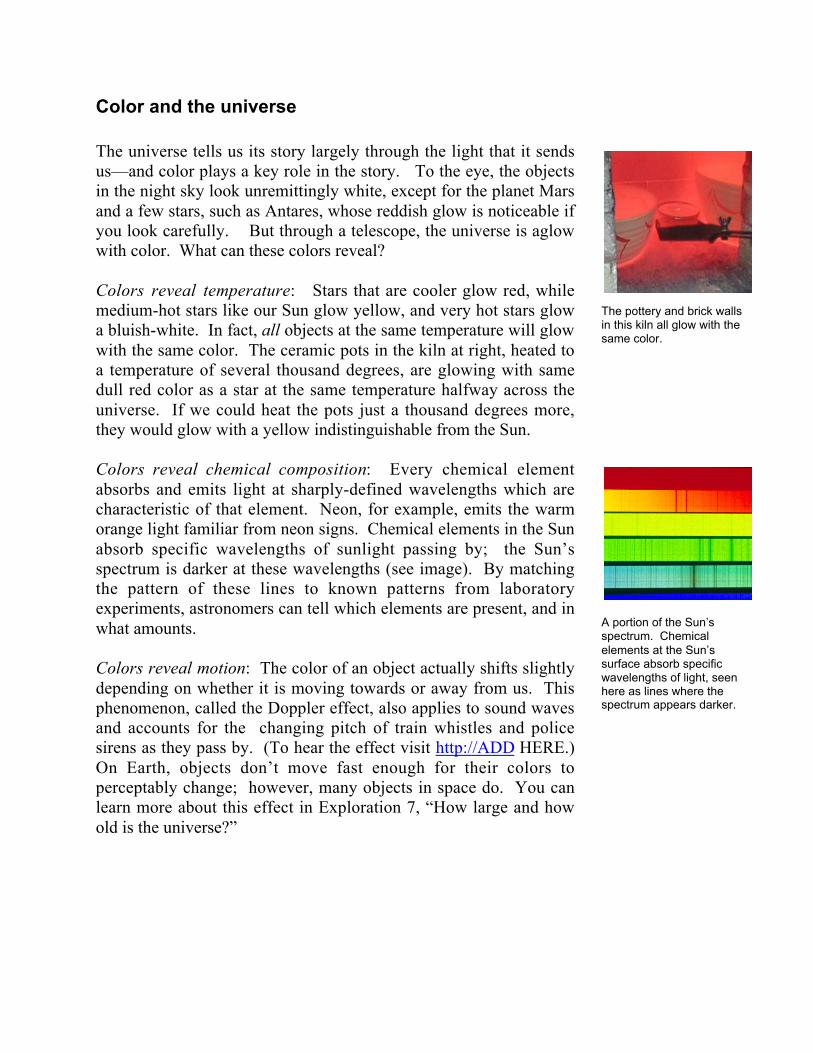
Colors reveal temperature: Stars that are cooler glow red, whilemedium-hot stars like our Sun glow yellow, and very hot stars glowa bluish-white. In fact, all objects at the same temperature will glowwith the same color. The ceramic pots in the kiln at right, heated toa temperature of several thousand degrees, are glowing with samedull red color as a star at the same temperature halfway across theuniverse. If we could heat the pots just a thousand degrees more,they would glow with a yellow indistinguishable from the Sun.
Colors reveal chemical composition: Every chemical elementabsorbs and emits light at sharply-defined wavelengths which arecharacteristic of that element. Neon, for example, emits the warmorange light familiar from neon signs. Chemical elements in the Sunabsorb specific wavelengths of sunlight passing by; the Sun’sspectrum is darker at these wavelengths (see image). By matchingthe pattern of these lines to known patterns from laboratoryexperiments, astronomers can tell which elements are present, and inwhat amounts.
Colors reveal motion: The color of an object actually shifts slightlydepending on whether it is moving towards or away from us. Thisphenomenon, called the Doppler effect, also applies to sound wavesand accounts for the changing pitch of train whistles and policesirens as they pass by. (To hear the effect visit http://ADD HERE.)On Earth, objects don’t move fast enough for their colors toperceptably change; however, many objects in space do. You canlearn more about this effect in Exploration 7, “How large and howold is the universe?”
The pottery and brick wallsin this kiln all glow with thesame color.
A portion of the Sun’sspectrum. Chemicalelements at the Sun’ssurface absorb specificwavelengths of light, seenhere as lines where thespectrum appears darker.
Materials Needed
For each team of studentsColor filters: Red, green, and blue1. 2” x 2” swatches work well.For the classInternet access to the MicroObservatory online telescopesImage-processing software (MOImage) on your local computerOptional: Shockwave plug-in on your local computer
1 For example, medium red ROSCOLUX #27, dark yellow green ROSCOLUX #90,primary blue ROSCOLUX #74; available at http://www.rosco-ca.com/products/filters/filters-roscolux.html Other suppliers are available; ask for purecolor filters for science experiments.
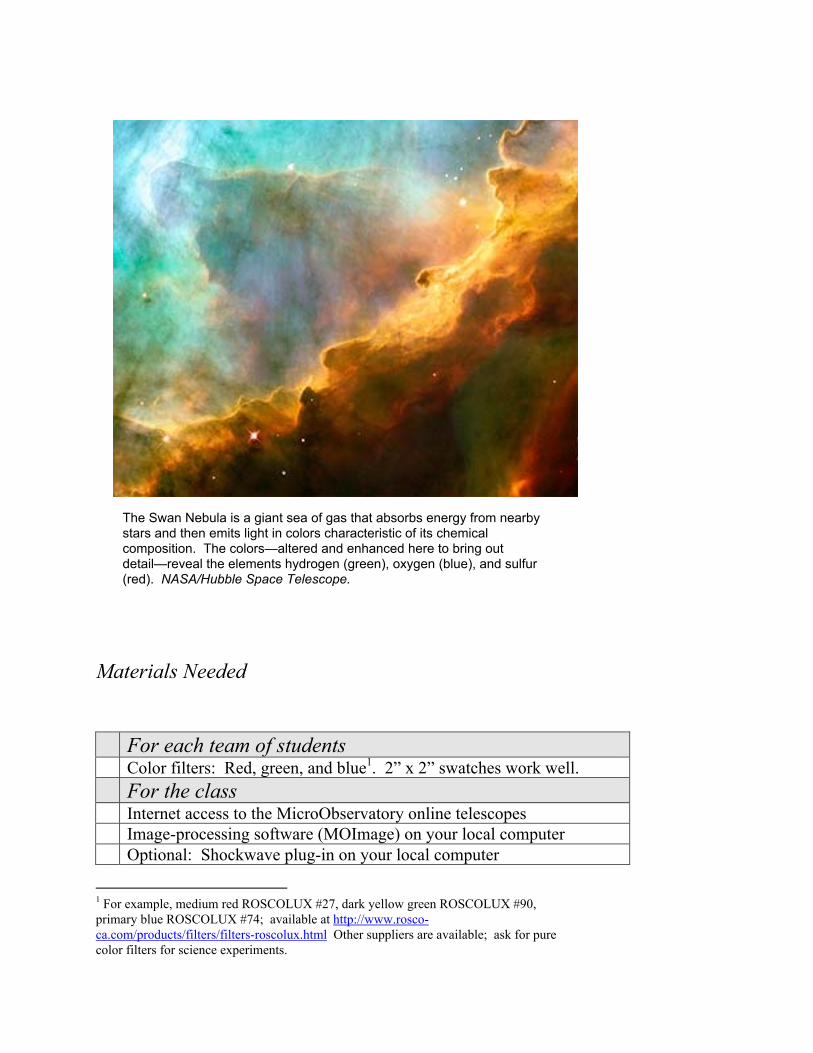
The Swan Nebula is a giant sea of gas that absorbs energy from nearbystars and then emits light in colors characteristic of its chemicalcomposition. The colors—altered and enhanced here to bring outdetail—reveal the elements hydrogen (green), oxygen (blue), and sulfur(red). NASA/Hubble Space Telescope.
Optional: Printer (color)For the teacherOverhead projectorOverhead transparency of eye’s color sensitivity2
Part 1. Students' ideas about lightand color
In order for students to make sense of their work with the telescopes,it is important for them to understand the three major actors involvedin seeing or in taking an image: There is the source—such as astar—that emits the light. There is the receptor—such as the eye’sretina or the telescope’s light-sensing chip—which detects the light.And there may or may not be an intermediate object that aborbssome of the light and reflects or transmits the rest to the observer.Examples are the Moon and planets.
However, students prior ideas about light and color are often deeplyheld. The following discussion with the class is important to helpthe class to sort out their prior ideas and move towards morescientific, and more useful, understandings.
Have students respond to the questions and record their answers intheir science journals. Then discuss their ideas about light and color:
Where does light come from? How many things can you namethat are a source of light?
Ask students for their responses, and write down their answers onthe blackboard. For each response, ask the class whether they agree
2 Supplied with From the Ground Up! materials.
this is a source of light. Examples may include fire, incandescentlights, fluorescent lights, the Sun, the stars, TV screens, those funnylight sticks they hand out at carnivals, luminescent dials on watchesand clocks, neon signs, blinking LED displays, fireflies and otherglowing creatures, auroras, etc. A traffic light might not be acceptedas a separate example, because the source is an ordinary light bulbinside the device.
Point out to students that although we see light indoors and out, thereare relatively few different sources of light. These few sources lightour entire world, indoors and out.
Which of the sources you named are hot?
Go back through the class' list and have students identify whichitems are sources of light by virtue of being hot enough to glow.Examples include the Sun, fire, a glowing oven or hot coals,incandescent bulbs, and the stars (though we have no directexperience with the stars).
Many of the light sources on the list are not hot. Examples are thered and green lights (LEDs) in electronic equipment, the glow of TVscreens, fluorescent bulbs, neon signs, auroras etc. These sourcesmust produce light by some means other than being hot enough toglow.
Is the Moon a source of light? Is the daytime sky a source oflight?
The Moon is bright enough to cast shadows at night, but is it thesource of light? Ask students whether the Moon gives off its ownlight, or merely reflects the light from some other source. This is agood opportunity to remind students that the Sun is the source of theMoon's light; the moonlight we see is reflected light whose source isthe Sun.
The daytime sky is an even more subtle example of reflected orscattered light. To "turn off" the sky, we would have to turn off theSun; the source of energy for the daylight is the Sun.
If you close your eyes or if you dream, you can still see thesensation of light. Is this light? If so, what's the source?
Misconception alert: Many students think that the eye is somehowa source of light, and that this light helps us see. As evidence,students may cite the "glow" of animals' eyes in the dark (in realitythis is reflected light) or Superman's x-ray vision. The ancientGreeks pointed out that you can "see" your dreams even with youreyes closed, so a source of light would seem to come from withinyour eye. Today we know that the eye and brain can create thesensation of light, even though the eye produces no light of its own.
Which of the light sources you mentioned give off colored light?Does the color give you information about the source of thelight? What kinds of information?
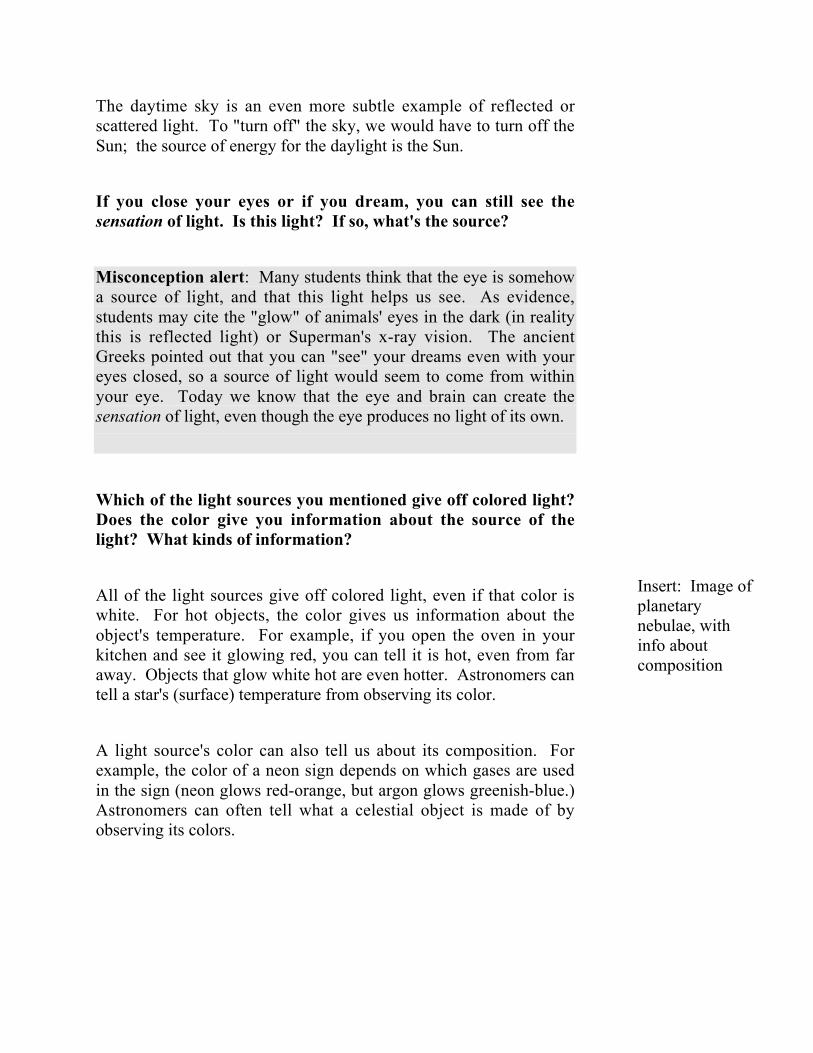
All of the light sources give off colored light, even if that color iswhite. For hot objects, the color gives us information about theobject's temperature. For example, if you open the oven in yourkitchen and see it glowing red, you can tell it is hot, even from faraway. Objects that glow white hot are even hotter. Astronomers cantell a star's (surface) temperature from observing its color.
A light source's color can also tell us about its composition. Forexample, the color of a neon sign depends on which gases are usedin the sign (neon glows red-orange, but argon glows greenish-blue.)Astronomers can often tell what a celestial object is made of byobserving its colors.
Insert: Image ofplanetarynebulae, withinfo aboutcomposition
Part 2. Planning the exploration
Experiment 1: All colors can be made with 3primary colors
The purpose of this experiment is to investigate what produces themany different colors on a TV screen or computer monitor.
• The human eye can sense red, green, and blue light.Combinations of these three colors are perceived as full-color.
This activity works even better with an older computer monitor,because the dot size is larger on older monitors.
1. Use any multi-colored image on the screen, or go to this URLfor an image:
http://
2. Have students use a magnifying glass to observe the screen.Alternatively, you can place a single drop of water on thescreen. The water drop will act as a powerful magnifyingglass. CAUTION: Pouring water down the screen candamage the monitor.
3. Have students record their responses to the questions in theirscience journals.
What do you observe beneath the water drop?
What colors are the dots or lines you see?
No matter what colors are in the image onscreen, do thecolors of the dots remain the same?
The image on the screen is composed of thousands of tinyred, green, and blue dots (or lines, in some screens).
Each color in an image is a combination of the red, green, andblue dots, glowing at different brightnesses. For example, thecolor yellow is created from the red and green dots glowingtogether, with very little or no blue. White is created from thered, green, and blue dots all glowing together. Brown is acombination of dim red and dim green.
Why are there 3 primary colors?
4. Explain to students that all colors can be createdfrom just red, green, and blue light. These colorsare called the primary colors of light.
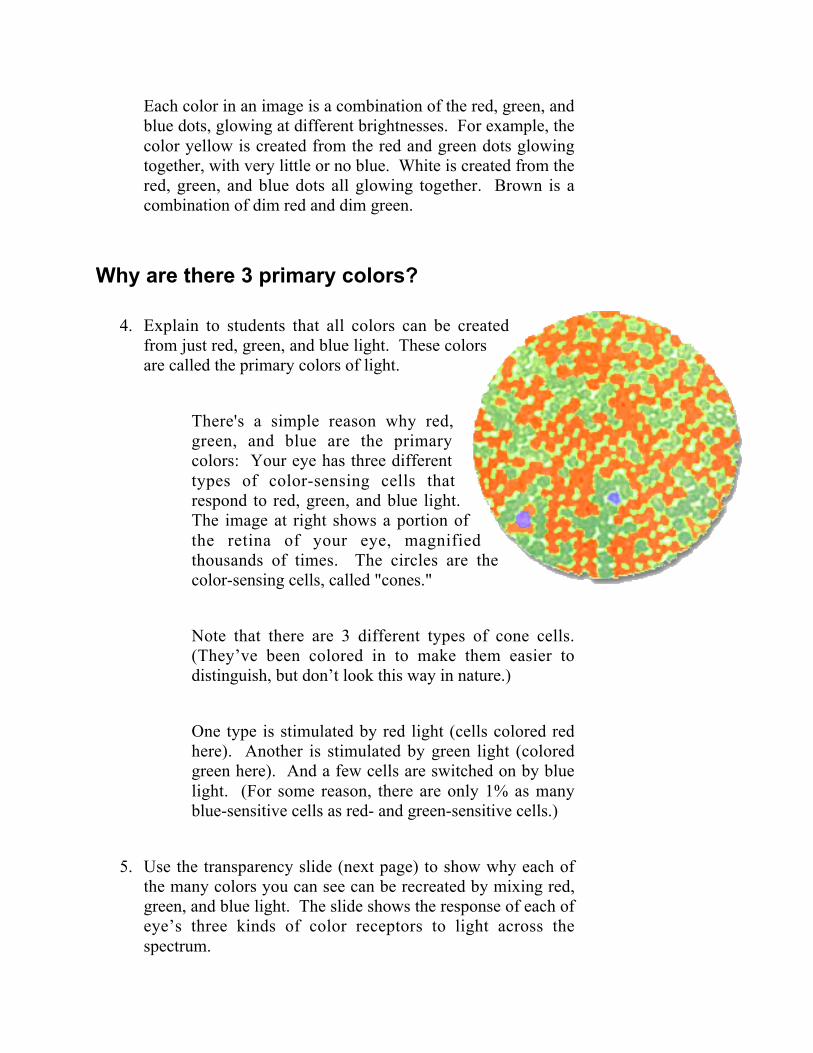
There's a simple reason why red,green, and blue are the primarycolors: Your eye has three differenttypes of color-sensing cells thatrespond to red, green, and blue light.The image at right shows a portion ofthe retina of your eye, magnifiedthousands of times. The circles are thecolor-sensing cells, called "cones."
Note that there are 3 different types of cone cells.(They’ve been colored in to make them easier todistinguish, but don’t look this way in nature.)
One type is stimulated by red light (cells colored redhere). Another is stimulated by green light (coloredgreen here). And a few cells are switched on by bluelight. (For some reason, there are only 1% as manyblue-sensitive cells as red- and green-sensitive cells.)
5. Use the transparency slide (next page) to show why each ofthe many colors you can see can be recreated by mixing red,green, and blue light. The slide shows the response of each ofeye’s three kinds of color receptors to light across thespectrum.
Note that the blue receptor absorbs light mainly at theblue end of the spectrum, and similarly for the greenand red receptors. But there is some overlap among allthree receptors: As a result, yellow light, e.g.,stimulates both the red and the green receptors. Weperceive the color yellow as a result of these tworeceptors being stimulated.
Therefore, if we show the eye red light plus greenlight, then we stimulate both the red- and green-receptors, and this produces the perception of yellow.The eye has no way of telling whether it has beenshown one wavelength (“yellow”) that stimulates boththe red and green-receptors, versus whether it has beenshown two primary colors of light, red and green. Thisis why a television monitor, e.g., can produce allcolors, using just the three primary colors oflight—red, green, and blue.
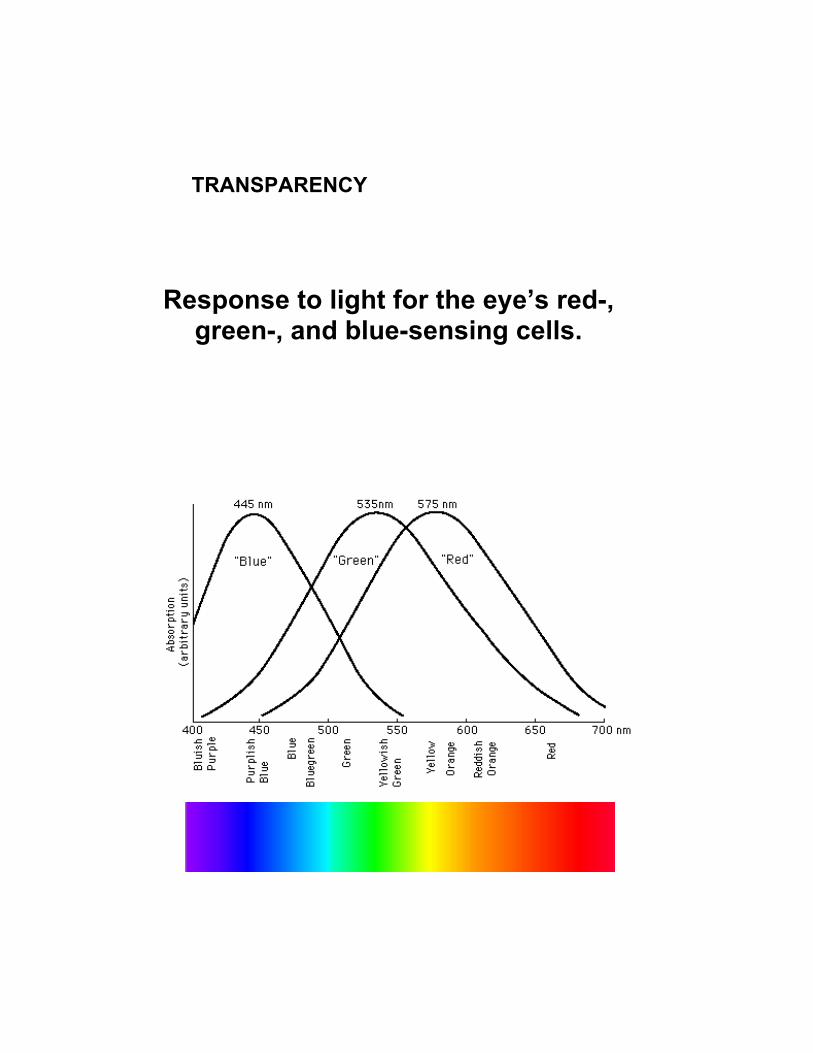
TRANSPARENCY
Response to light for the eye’s red-,green-, and blue-sensing cells.
Experiment 2: Working with color filters
The purpose of this activity is to investigate the behavior of colorfilters.
• A red-passing filter allows red light to pass through, butblocks green and blue. Similarly, green- and blue-passingfilters allow green and blue light through, respectively.
Misconception alert: Students often find filters confusing, becausethe terminology in common use is often inconsistent. Inphotography, for example, a red filter allows red light through, butan ultraviolet filter blocks—or filters out—ultraviolet light. Does afilter pass light or filter it out? For this exploration, we recommendalways denoting the function of the filter by using term red-passing,green-passing, etc.
1. Have students bring up on the computer monitor the spectrumat this Website:
http://mo-www.harvard.edu/Java/MiniSpectroscopy.html
2. Have students predict what they will observe when they lookat the spectrum through a red, green, and then blue filter.Have them record their predictions in their science journals.
Which part of the spectrum do you think will appear thelightest when you look at the spectrum through the blue-passing filter (the filter that lets through only blue light)?
How about the green-passing filter? Which part of thespectrum will look lightest when seen through the green-passing filter?
And the red-passing filter?
3. Have students carry out the observations, using each of thecolored filters.
How does what you observe compare with what youpredicted?
Suppose you were color-blind. If you looked at the worldthrough each of the three filters, could you tell that they aredifferent, based on what you saw? How could you tell?
Will images taken with the telescope look different if you usedifferent filters—even though the telescope only registerslight and dark?
Students should observe that, when viewed through the red-passingfilter, the red portion of the spectrum will appear the brightest, andthe other portions of the spectrum will appear darker. Similarly,when viewed through the green-passing filter, the green portion ofthe spectrum will appear brightest, while the other regions will bedarker. This makes sense, since the red-passing filter lets the redlight through, but blocks the other colors.
If you were completely color-blind, you could still tell that the red-,green-, and blue-passing filters must be different from each other.When looking through the red-passing filter, the parts of the worldthat were reddish would look lighter, whereas the other filters wouldmake the other parts of the scene appear lighter.
Similarly, the telescope is "color-blind," because it only records inblack and white (and greys). But if you image the same scene usingthe red-, green-, and blue-passing filters, each image will be differentfrom the others.
Experiment 3: "Breaking down" a color scene,using filters
The purpose of this activity is to observe what happens when a full-color scene is viewed successively through a red-, green-, and thenblue-passing filter.
• Any color scene can be separated into the brightness anddarkness of its red, green, and blue components.
1. Have students answer the questions and make theirpredictions in their science journals.
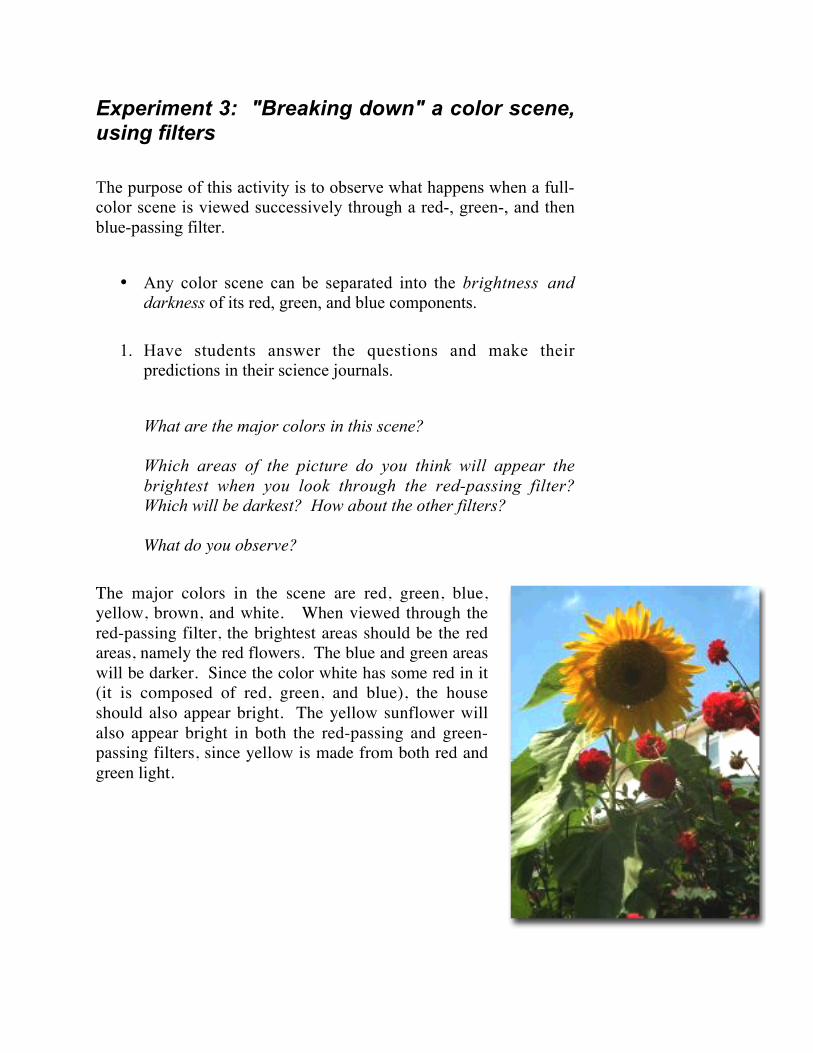
What are the major colors in this scene?
Which areas of the picture do you think will appear thebrightest when you look through the red-passing filter?Which will be darkest? How about the other filters?
What do you observe?
The major colors in the scene are red, green, blue,yellow, brown, and white. When viewed through thered-passing filter, the brightest areas should be the redareas, namely the red flowers. The blue and green areaswill be darker. Since the color white has some red in it(it is composed of red, green, and blue), the houseshould also appear bright. The yellow sunflower willalso appear bright in both the red-passing and green-passing filters, since yellow is made from both red andgreen light.

Red-Passing Filter Green-Passing Filter Blue-Passing FilterBrightest Areas red flowers,
houseleaves, house sky, house
Darkest Areas leaves, sky flowers leaves
2. If time is available, have students try the experiment using thekitten's and children's images in their science journals as well.These images are more challenging, because the colors arenot primary colors.
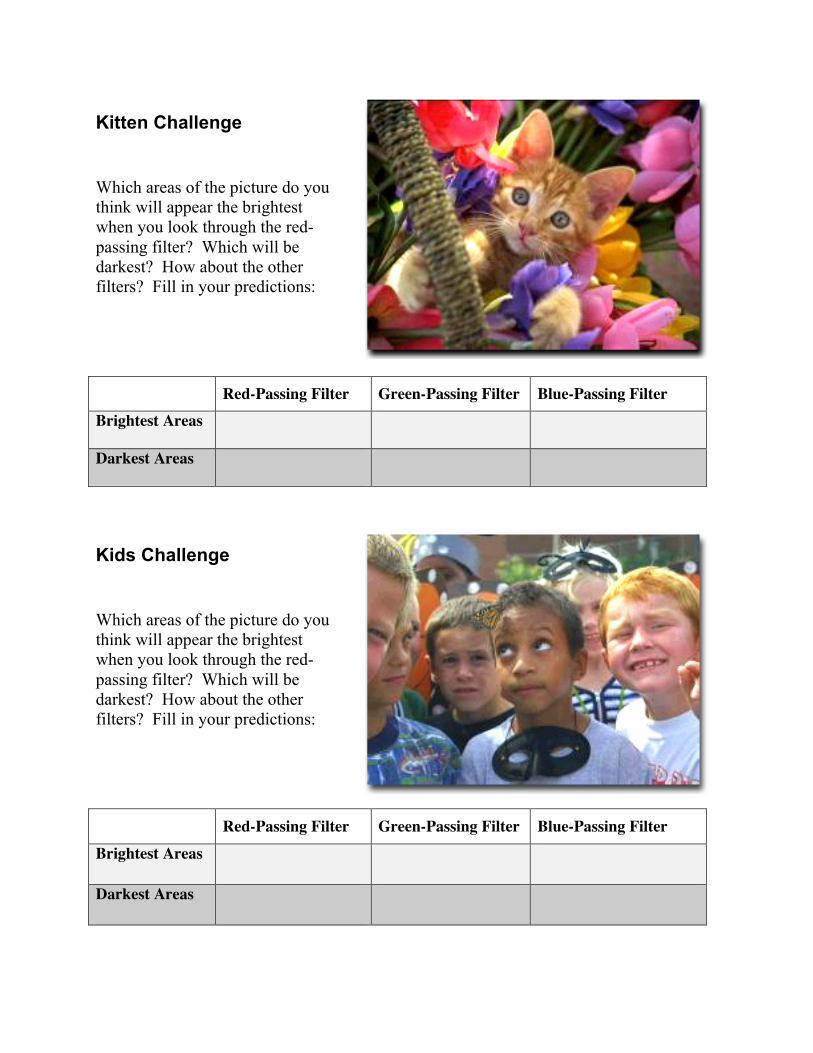
Kitten Challenge
Which areas of the picture do youthink will appear the brightestwhen you look through the red-passing filter? Which will bedarkest? How about the otherfilters? Fill in your predictions:
Red-Passing Filter Green-Passing Filter Blue-Passing FilterBrightest Areas
Darkest Areas
Kids Challenge
Which areas of the picture do youthink will appear the brightestwhen you look through the red-passing filter? Which will bedarkest? How about the otherfilters? Fill in your predictions:
Red-Passing Filter Green-Passing Filter Blue-Passing FilterBrightest Areas
Darkest Areas
Assessment: Can you tell which filter wasused?
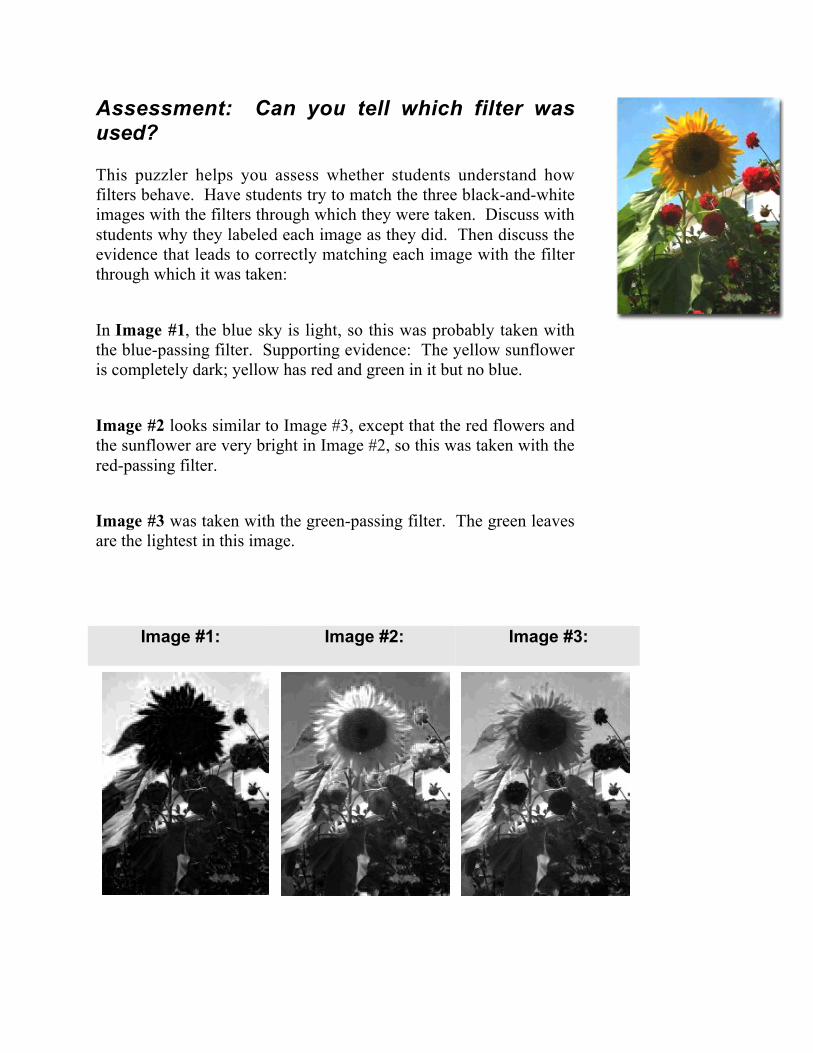
This puzzler helps you assess whether students understand howfilters behave. Have students try to match the three black-and-whiteimages with the filters through which they were taken. Discuss withstudents why they labeled each image as they did. Then discuss theevidence that leads to correctly matching each image with the filterthrough which it was taken:
In Image #1, the blue sky is light, so this was probably taken withthe blue-passing filter. Supporting evidence: The yellow sunfloweris completely dark; yellow has red and green in it but no blue.
Image #2 looks similar to Image #3, except that the red flowers andthe sunflower are very bright in Image #2, so this was taken with thered-passing filter.
Image #3 was taken with the green-passing filter. The green leavesare the lightest in this image.
Image #1: Image #2: Image #3:
Experiment 4: Creating color from red, green,and blue
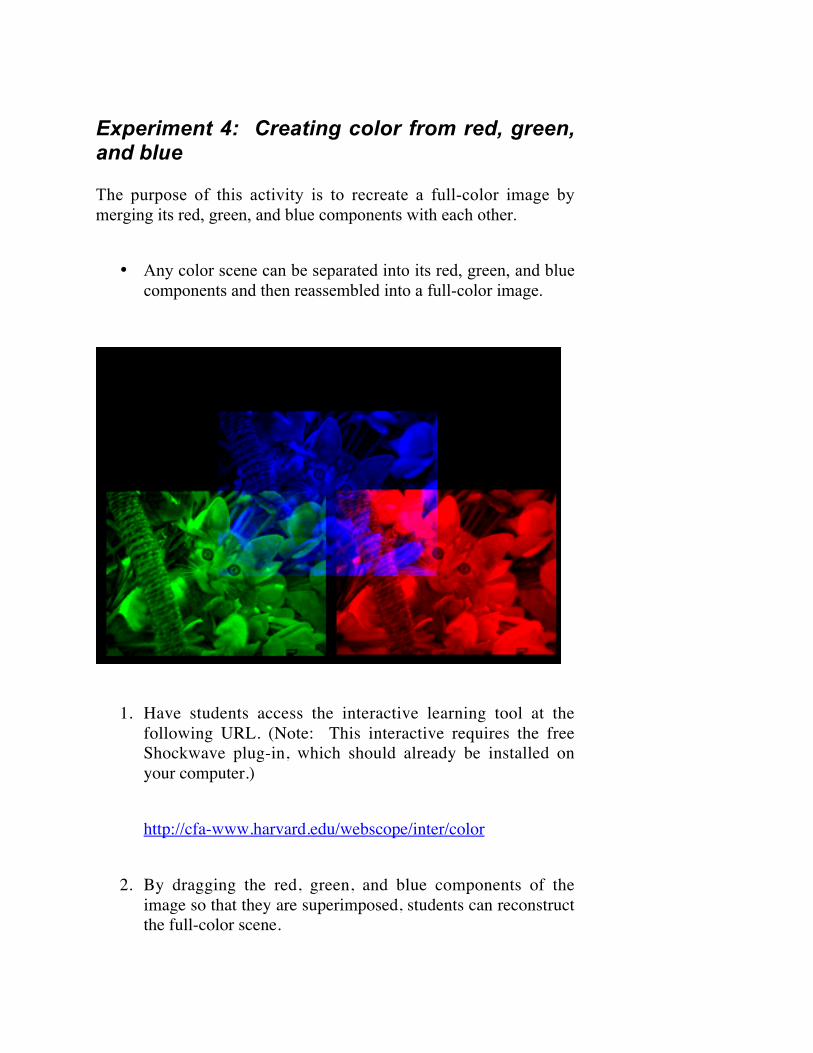
The purpose of this activity is to recreate a full-color image bymerging its red, green, and blue components with each other.
• Any color scene can be separated into its red, green, and bluecomponents and then reassembled into a full-color image.
1. Have students access the interactive learning tool at thefollowing URL. (Note: This interactive requires the freeShockwave plug-in, which should already be installed onyour computer.)
http://cfa-www.harvard.edu/webscope/inter/color
2. By dragging the red, green, and blue components of theimage so that they are superimposed, students can reconstructthe full-color scene.
Experiment 5: Creating full-color images usingsoftware.
The purpose of this activity is to create a full-color image from threeblack-and-white images taken through color filters, using theMOImage software.
• Any color scene can be separated into its red, green, and bluecomponents and then reconstructed to form full color.
In order to create full-color images using the telescopes, studentswill need to use the MOImage software on the computer. To getthem started with the program, have them reconstruct the full-colorsunflower using just the black-and-white images taken through thethree red-, green-, and blue-passing filters.
1. Have students download the three black-and-white imagesfrom the "From the Ground Up!" website at this address:
http://cfa-www.harvard.edu/webscope/activities/color
2. Students launch the MOImage software on the computer.
3. Students open the flower files that they just downloaded: Firstopen flowerR.gif. This is the red portion of the flower image.Under the Process menu, select Color Tables / Red. Thisautomatically colors the image red. In the same way, openthe green image (flowerG.gif) and color it green by selectingProcess/Color Tables/Green. Finally, open flowerB.gif andcolor it blue.
4. Under the Process menu, select Stack, and select ConvertImages to Stack.
5. Have students take a moment to scroll through the stack,using the or arrows at the bottom edge of the image. Note
that the three images contain very different information aboutthe picture. The third image is very dark, because there is noblue in the scene, except for the sky.
6. To create the color picture, go to the Process menu, selectStack, then Convert Stack to RGB (which stands for red,green, blue color).
The result should be a full-color picture of the sunflower.
If students mix up the color of the images—for example, coloringthe red-information image green—they'll get a strangely-coloredpicture that won't be the color of the original image.
Planning the exploration
Students are now ready to use the MicroObservatory telescopes tocreate a color image of an object in the night sky.
1. Have students discuss with their team what kind of objectthey would like to image. Remember that large objects suchas nebulae often form the best subjects. Planets may not begood choices, because they are small and will show littlecolor variation in the MicroObservatory telescopes. Havestudents either choose from the list of suggested targets, oruse a target not on the list.
2. Have each team develop an outline for how to proceed. Theywill be able to use:
• the telescopes
• the telescopes' filter wheel, containing filters that pass red,green, and blue light
• MOImage software for combining the red, green, and blueinformation to form color.
Part 3. Creating color images withthe telescope.
Students work in teams of three. Have each team select a celestialobject they would like to image, using either the list of suggestionsprovided, or another target. It does not matter if several teams imagethe same object, since they will be able to compare their results.Make sure that students understand they have to take three imagesfor each celestial object: one each through the red-, green-, andblue-passing filters.
To ensure that they produce successful images, help students withthese issues:
Make certain that the targets they have chosen are above thehorizon at this time of year.
Have students use a range of exposure times (such as half andtwice the recommended exposure time for their object). Foreach exposure time, they should take one image through eachof the three color filters.
Make certain that students download their images from theWeb in FITS format (follow instructions on the Website)rather than GIF format, so that they can process their images.
Remind students to clearly label their downloaded imageswith the name of the object and the filter color that was used.It is a good idea to print the Image Info file that comes witheach thumbnail of the image, because this contains all theinformation about the image, including the color filter used.This information is also contained in the FITS "header,"which accompanies every FITS image and which can be readin the MOImage program under the Windows menu (selectWindows / FITS Header).
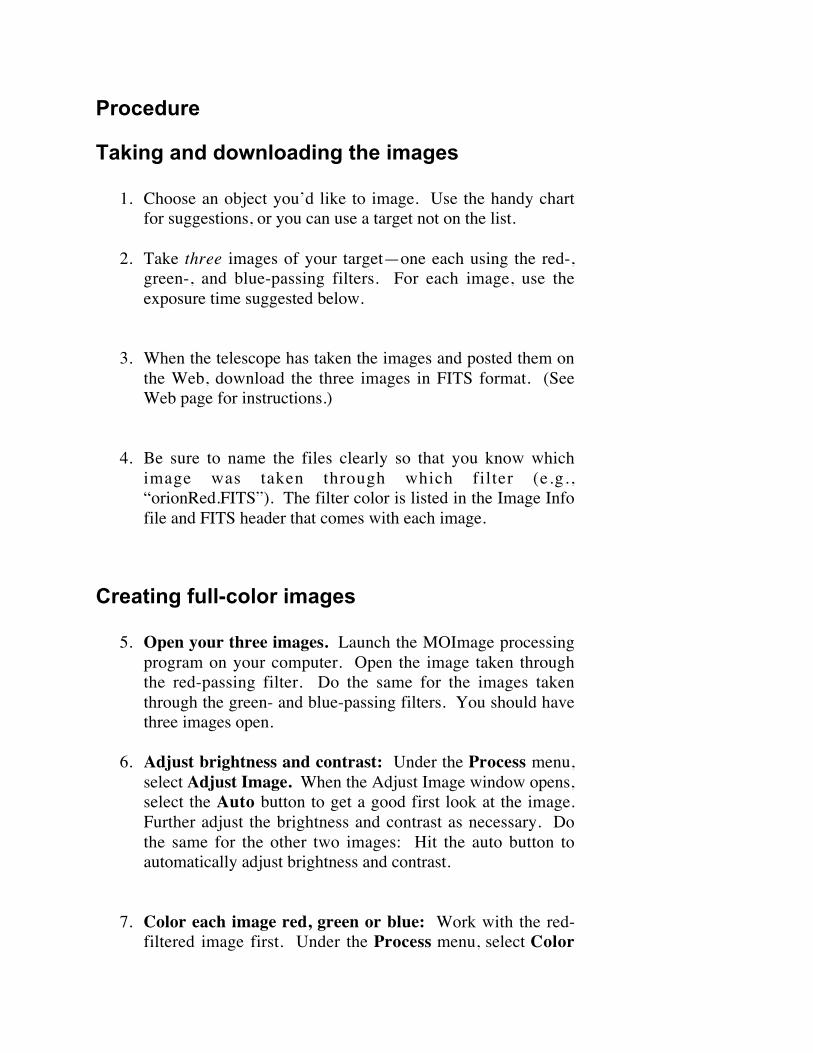
Procedure
Taking and downloading the images
1. Choose an object you’d like to image. Use the handy chartfor suggestions, or you can use a target not on the list.
2. Take three images of your target—one each using the red-,green-, and blue-passing filters. For each image, use theexposure time suggested below.
3. When the telescope has taken the images and posted them onthe Web, download the three images in FITS format. (SeeWeb page for instructions.)
4. Be sure to name the files clearly so that you know whichimage was taken through which filter (e.g.,“orionRed.FITS”). The filter color is listed in the Image Infofile and FITS header that comes with each image.
Creating full-color images
5. Open your three images. Launch the MOImage processingprogram on your computer. Open the image taken throughthe red-passing filter. Do the same for the images takenthrough the green- and blue-passing filters. You should havethree images open.
6. Adjust brightness and contrast: Under the Process menu,select Adjust Image. When the Adjust Image window opens,select the Auto button to get a good first look at the image.Further adjust the brightness and contrast as necessary. Dothe same for the other two images: Hit the auto button toautomatically adjust brightness and contrast.
7. Color each image red, green or blue: Work with the red-filtered image first. Under the Process menu, select Color
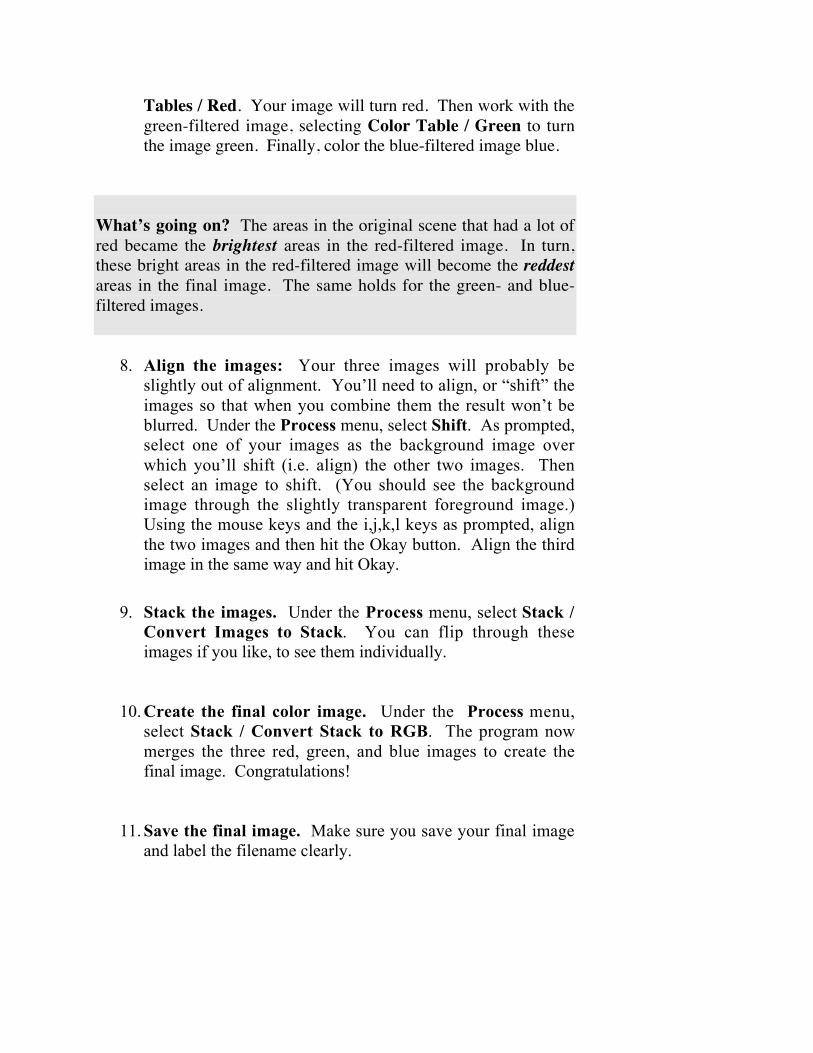
Tables / Red. Your image will turn red. Then work with thegreen-filtered image, selecting Color Table / Green to turnthe image green. Finally, color the blue-filtered image blue.
What’s going on? The areas in the original scene that had a lot ofred became the brightest areas in the red-filtered image. In turn,these bright areas in the red-filtered image will become the reddestareas in the final image. The same holds for the green- and blue-filtered images.
8. Align the images: Your three images will probably beslightly out of alignment. You’ll need to align, or “shift” theimages so that when you combine them the result won’t beblurred. Under the Process menu, select Shift. As prompted,select one of your images as the background image overwhich you’ll shift (i.e. align) the other two images. Thenselect an image to shift. (You should see the backgroundimage through the slightly transparent foreground image.)Using the mouse keys and the i,j,k,l keys as prompted, alignthe two images and then hit the Okay button. Align the thirdimage in the same way and hit Okay.
9. Stack the images. Under the Process menu, select Stack /Convert Images to Stack. You can flip through theseimages if you like, to see them individually.
10. Create the final color image. Under the Process menu,select Stack / Convert Stack to RGB. The program nowmerges the three red, green, and blue images to create thefinal image. Congratulations!
11. Save the final image. Make sure you save your final imageand label the filename clearly.
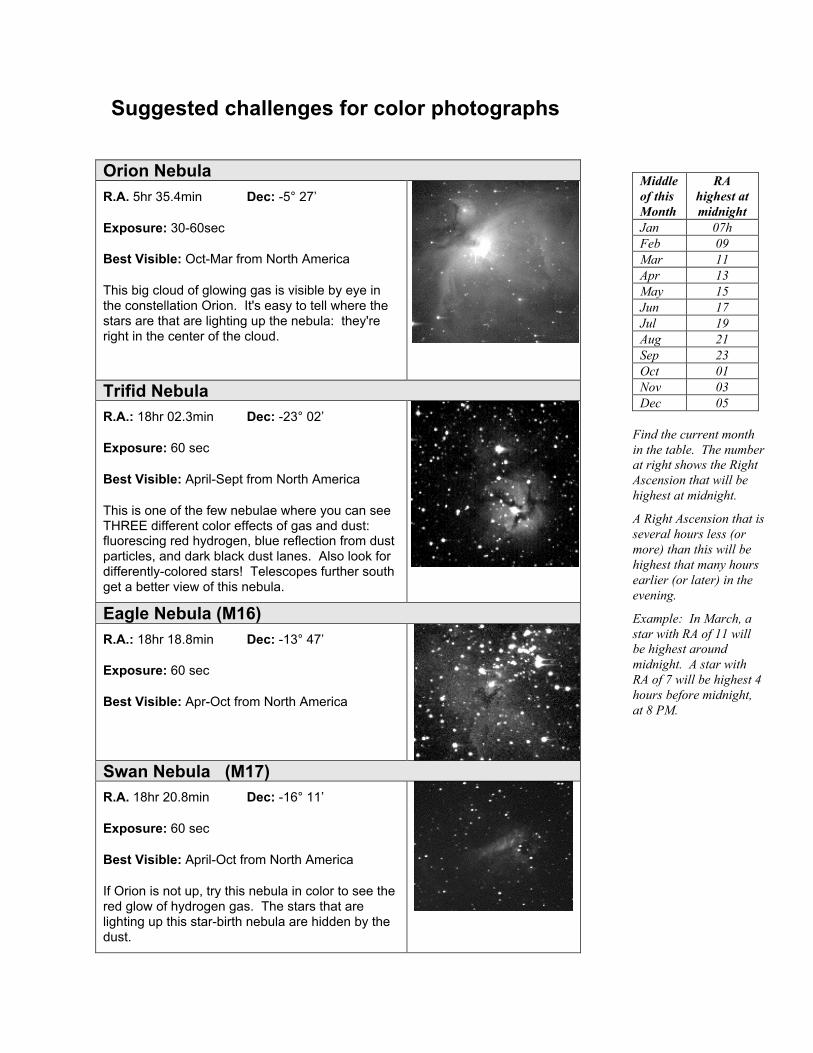
Suggested challenges for color photographs
Orion Nebula
R.A. 5hr 35.4min Dec: -5° 27’
Exposure: 30-60sec
Best Visible: Oct-Mar from North America
This big cloud of glowing gas is visible by eye inthe constellation Orion. It's easy to tell where thestars are that are lighting up the nebula: they'reright in the center of the cloud.
Trifid Nebula
R.A.: 18hr 02.3min Dec: -23° 02’
Exposure: 60 sec
Best Visible: April-Sept from North America
This is one of the few nebulae where you can seeTHREE different color effects of gas and dust:fluorescing red hydrogen, blue reflection from dustparticles, and dark black dust lanes. Also look fordifferently-colored stars! Telescopes further southget a better view of this nebula.
Eagle Nebula (M16)
R.A.: 18hr 18.8min Dec: -13° 47’
Exposure: 60 sec
Best Visible: Apr-Oct from North America
Swan Nebula (M17)
R.A. 18hr 20.8min Dec: -16° 11’
Exposure: 60 sec
Best Visible: April-Oct from North America
If Orion is not up, try this nebula in color to see thered glow of hydrogen gas. The stars that arelighting up this star-birth nebula are hidden by thedust.
Middleof thisMonth
RAhighest atmidnight
Jan 07hFeb 09Mar 11Apr 13May 15Jun 17Jul 19Aug 21Sep 23Oct 01Nov 03Dec 05
Find the current monthin the table. The numberat right shows the RightAscension that will behighest at midnight.
A Right Ascension that isseveral hours less (ormore) than this will behighest that many hoursearlier (or later) in theevening.
Example: In March, astar with RA of 11 willbe highest aroundmidnight. A star withRA of 7 will be highest 4hours before midnight,at 8 PM.
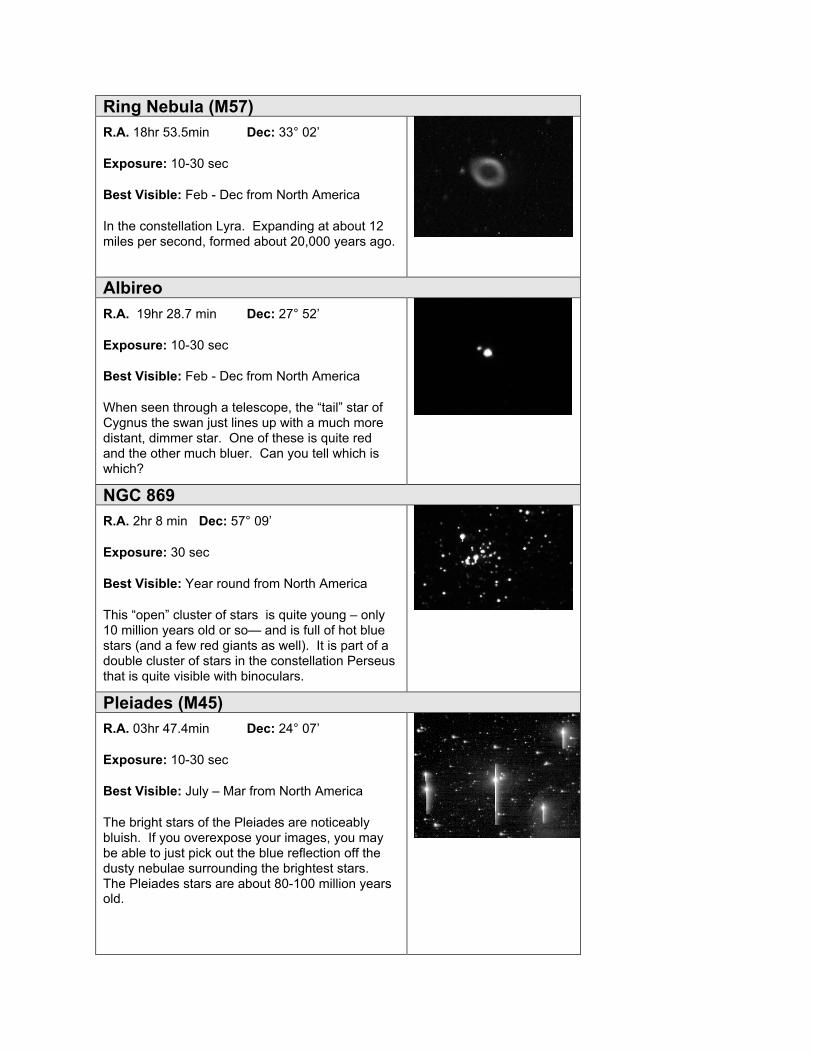
Ring Nebula (M57)
R.A. 18hr 53.5min Dec: 33° 02’
Exposure: 10-30 sec
Best Visible: Feb - Dec from North America
In the constellation Lyra. Expanding at about 12miles per second, formed about 20,000 years ago.
Albireo
R.A. 19hr 28.7 min Dec: 27° 52’
Exposure: 10-30 sec
Best Visible: Feb - Dec from North America
When seen through a telescope, the “tail” star ofCygnus the swan just lines up with a much moredistant, dimmer star. One of these is quite redand the other much bluer. Can you tell which iswhich?
NGC 869
R.A. 2hr 8 min Dec: 57° 09’
Exposure: 30 sec
Best Visible: Year round from North America
This “open” cluster of stars is quite young – only10 million years old or so— and is full of hot bluestars (and a few red giants as well). It is part of adouble cluster of stars in the constellation Perseusthat is quite visible with binoculars.
Pleiades (M45)
R.A. 03hr 47.4min Dec: 24° 07’
Exposure: 10-30 sec
Best Visible: July – Mar from North America
The bright stars of the Pleiades are noticeablybluish. If you overexpose your images, you maybe able to just pick out the blue reflection off thedusty nebulae surrounding the brightest stars.The Pleiades stars are about 80-100 million yearsold.
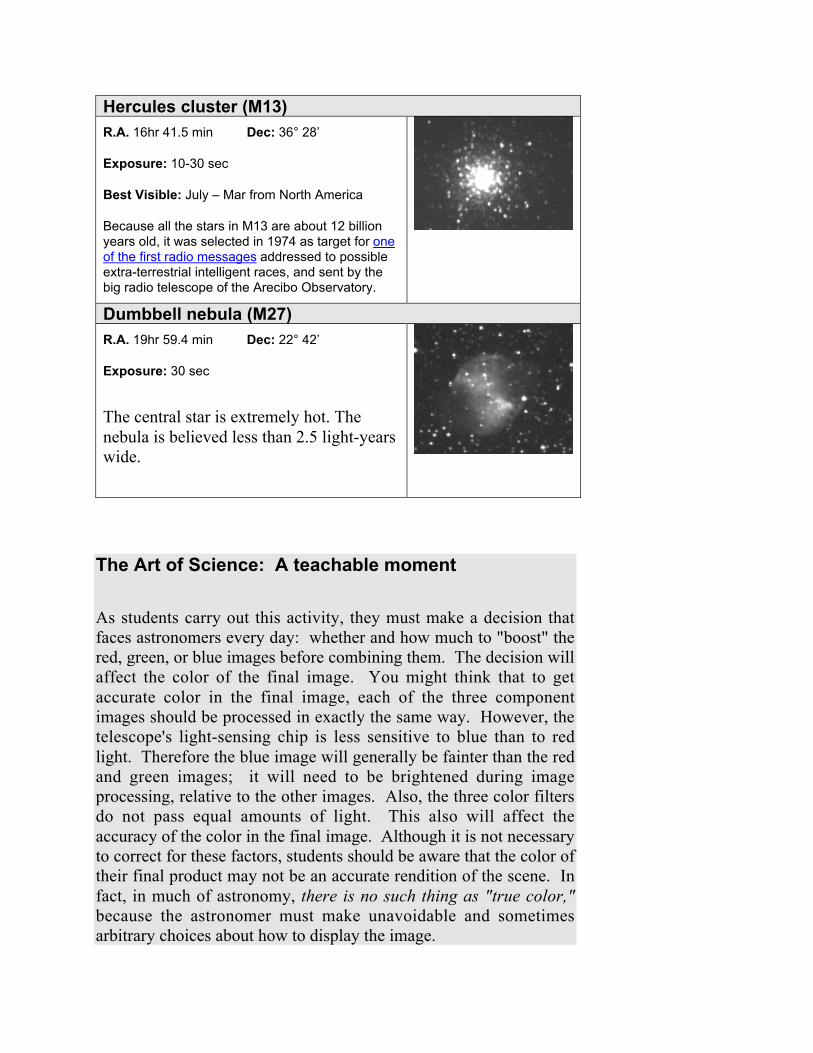
Hercules cluster (M13)
R.A. 16hr 41.5 min Dec: 36° 28’
Exposure: 10-30 sec
Best Visible: July – Mar from North America
Because all the stars in M13 are about 12 billionyears old, it was selected in 1974 as target for oneof the first radio messages addressed to possibleextra-terrestrial intelligent races, and sent by thebig radio telescope of the Arecibo Observatory.
Dumbbell nebula (M27)
R.A. 19hr 59.4 min Dec: 22° 42’
Exposure: 30 sec
The central star is extremely hot. Thenebula is believed less than 2.5 light-yearswide.
The Art of Science: A teachable moment
As students carry out this activity, they must make a decision thatfaces astronomers every day: whether and how much to "boost" thered, green, or blue images before combining them. The decision willaffect the color of the final image. You might think that to getaccurate color in the final image, each of the three componentimages should be processed in exactly the same way. However, thetelescope's light-sensing chip is less sensitive to blue than to redlight. Therefore the blue image will generally be fainter than the redand green images; it will need to be brightened during imageprocessing, relative to the other images. Also, the three color filtersdo not pass equal amounts of light. This also will affect theaccuracy of the color in the final image. Although it is not necessaryto correct for these factors, students should be aware that the color oftheir final product may not be an accurate rendition of the scene. Infact, in much of astronomy, there is no such thing as "true color,"because the astronomer must make unavoidable and sometimesarbitrary choices about how to display the image.
Part 4. Reflecting on the results.
Have students record their responses to the following questions intheir science journals.
Does the color of the object in your image tell you anythingabout the object? What?
The telescope's light sensor is not equally sensitive to red,green, and blue light. How might this affect the color of yourfinal image?
When you added the three images together, did you boost thebrightness of any of the images? If so, how did this affect thecolor image?
How closely do you think that your image captures"reality"—and why?
Suppose you have imaged a very faint object that no humanhas ever seen with the naked eye—because it is so faint. Doyou think there is such a thing as how the object should look?How would you determine the best color balance, or the bestimage processing?
The telescope’s light-sensing silicon chip is most sensitive to redlight, and least sensitive to blue light. This means that reddishobjects will appear comparatively brighter than bluish objects inyour black-and-white images. And when you reconstruct the colorscene, the final image will appear redder than the actual scene innature.
You can compensate for this, if desired, by boosting the brightnessof the image taken through the blue-passing filter. This can be donewhen image-processing, just before colorizing the three black-and-white images.
Astronomers try to learn as much as they can from the images theytake. This does not always mean producing an image that most

closely resembles what you would see with your eyes. For example,by enhancing the contrast of a scene, you can bring out details of theimage you might never have noticed if you produced the mostnatural-looking image. Scientists sometimes alter the color of theirimages for the same reason: to bring out details that might otherwisebe missed.
The Art of Science
When trying to answer the question, “Is that what the scene reallylooks like?” it helps to keep in mind that most astronomical scenesare too faint to see by eye; therefore it may not make sense to askwhat the scene really looks like. The most that a scientist can strivefor is to be explicit about how s/he took the image; what changess/he made in the brightness, contrast, and color balance; and whythose changes were made. That honesty is a cornerstone of the ethicof science.