what do we want to know? selecting indicators linda …
TRANSCRIPT

What Do We Want to Know? Selecting Indicators Linda Mayoux Page 1
WHAT DO WE WANT TO KNOW? SELECTING INDICATORS
LINDA MAYOUX 2001 Consultant for WISE1
EDIAIS
CONTENTS Section 1 Impacts and indicators: definitions and misconceptions 1.1 Impacts and indicators: definitions and distinctions 1.2 Selecting indicators: some common misconceptions Section 2 Indicators in integrated assessment: ways forward 2.1 Indicators in integrated assessment: key issues 2.2 Why do we need indicators? the challenge of practical relevance 2.3 Whose indicators? challenges of stakeholder participation Section 3: Thinking it through: guidelines for selecting and using indicators in integrated impact assessment
3.1 Thinking it through: indicator trees 3.2 Using indicators: from selection to investigation and analysis 3.3 Practical and institutional considerations
Appendix ‘SMART’ and ‘SPICED’ indicators The paper also uses the diagram techniques described in detail in ‘Thinking it through: using diagrams for assessment design and information analysis’ in this Toolkit
1 I am very grateful to Caroline Pinder of WISE and Tony Polatajko of DFID for comments and suggestions on earlier drafts of this paper. Any errors are however entirely mine. Details about how the approach to selecting indicators described here feeds into subsequent parts of the assessment process can be found in: Mayoux, L. (2002 forthcoming) From Impact Assessment to Sustainable and Participatory Practical Learning: A Guide for Enterprise Development Open University Working Paper, Milton Keynes.

What Do We Want to Know? Selecting Indicators Linda Mayoux Page 2
SECTION 1 IMPACTS AND INDICATORS: KEY ISSUES 1.1 Impacts and indicators: definitions and distinctions Indicators are needed in order to make the process of investigation manageable. They do not have any objective validity in themselves but are, as defined in the Oxford English Dictionary:
‘ a thing that serves to give an indication [a sign, symptom or hint] or suggestion of something else’
There is no one given set of 'correct indicators ' for assessing a particular type of impact, but a range of possible signs, symptoms or hints by which impacts can be observed, measured or detected with varying degrees of certainty. A distinction must be made between: • Impact goals: ie what is to be assessed. These may vary from very broad goals like
'poverty alleviation ', ' economic growth ' or 'empowerment ' to narrowly specified goals like ' increased cash incomes ', ' expansion in number of enterprises in a particular sector ' or ' increased role in major household economic decisions. ' Impact goals are generally specified in organisational mandates and Logframes, although priorities may differ between different stakeholders. In the case of DFID these include both social and economic goals as specified in the White papers and TSPs (!!Insert link to David Stanton’s paper).
and • Indicators: ie how it is to be assessed or measured. These generally involve more
specific questions e.g. wage levels over time, numbers of enterprises and profits as recorded in accounts, who made decisions over land purchase. A number of different types are commonly distinguished (See Box 1).
However both impact goals and indicators and different types of indicators themselves exist on a continuum rather than as discrete categories: • narrowly specified goals may be used as broad indicators. Where the boundary
between the two should be drawn in any particular assessment will vary, and may also change somewhat over time.
• quantitative indicators vary in their degree of precision of estimation and the nature of
quantification – they can quantify precise amounts eg wage levels, they can estimate rough quantities eg amounts of unrecorded income from informal sector activities. At the analysis stage they are often grouped with varying degrees of precision. Some quantitative indicators may inevitably be very imprecise and almost become qualitative in nature.

What Do We Want to Know? Selecting Indicators Linda Mayoux Page 3
• qualitative indicators vary in the levels of closedness or openness of response elicited depending on how they are used. They may assess observable ‘facts’ (eg whether houses are built out of brick or mud) or ideas and attitudes (eg whether or not women feel they have more self-confidence). In either case questions may elicit simple ‘yes/no’ or ranked responses and can be categorised and enumerated like quantitative indicators. The categorisation process can be done with varying degrees of precision. Where qualitative indicators are used for illustrative purposes and/or to capture processes of change, they may be much more open and highly subjective.
• there are degrees of ‘directness’ and proximity eg type of housing may be a direct
indicator of assets in an impact assessment of a housing loan program, or an indirect proxy for increased incomes in a general microfinance program.
• SMART and SPICED indicators can be combined. It is possible to use participatory
methods to derive SMART indicators which are then cross checked and derived and used in ways which empower. It is also possible to have a number of different sets of such SMART indicators for any particular impact goal to capture diversity and subjectivity.
BOX 1: WHAT ARE INDICATORS? DEFINITIONS AND DISTINCTIONS GOALS AND INDICATORS Impact goals: what is to be assessed. Impact indicators: how it is to be assessed QUANTITATIVE/QUALITATIVE INDICATORS • Quantitative indicators are those which are answered in numerical form. They differ
along a continuum of the degree of precision of estimation required. • Qualitative indicators are those which are answered in verbal form. DIRECT/PROXY INDICATORS • Direct indicators are those which are a direct result of an intervention e.g. levels of
savings in a savings and credit program. • Proxy indicators are those which are assumed to be related to direct impacts but may
be easier to measure or assess e.g. levels of women's savings as a proxy indicator of poverty reduction or economic empowerment.
SMART/SPICED In NGO impact assessment attempts have been made to establish criteria for selecting indicators. Initially the focus was on:

What Do We Want to Know? Selecting Indicators Linda Mayoux Page 4
• SMART indicators: specific, measurable, attainable, relevant, timebound. The main considerations are the feasibility of collecting data which can be quickly and easily used at specific points in the project management cycle.
Later, with the increasing emphasis on participatory assessment, another set of criteria were developed: • SPICED indicators are: subjective, participatory, interpreted, cross-checked,
empowering, diverse focuses more on relevance of indicators to different stakeholders and their accurate representation of complex realities.
1.2 Selecting indicators: some common misconceptions Many impact assessments collect large amounts of quantitative data in an attempt to capture 'an objective picture ' of impact on incomes. The very long questionnaires generated yield data of uncertain reliability because of gaps in respondent knowledge and interviewee (and interviewer) fatigue. Much of the data is of therefore rather suspect accuracy and is never even analysed. This is obviously a waste of time and resources for funders, programmes and respondents. The complexity of livelihoods means that no matter how much quantitative data is collected, it will never be ' completely rigorous '. Even if indicators were devised for all known dimensions of livelihoods and data systematically collected, it is unlikely that these could ever be exhaustive. As can be seen from Box 2, even assessing narrowly defined economic impact goals like increased incomes and assets is inevitably an imprecise art open to dispute and qualification2
. The degree to which income impacts can easily be assessed with any degree of precision will depend crucially on factors like:
• the economic context and degree to which wage levels, inflation and prices are known and stable over time
• the types and range of activities in which respondents are engaged, whether these are regular with fixed remuneration, whether or not accurate accounts are kept, levels of non market activity
• the degree to which respondents control their income in predictable ways • the degree to which non market activities and social support networks are important in
providing basic necessities and safety nets These factors are likely to vary not only between contexts but even within individual programmes for different respondents e.g. between urban and rural areas, between women and men, between the ‘better-off’ poor and the poorest. The relative importance of different indicators and ways in which they are quantified is likely to change over even relatively short periods of time with market fluctuations and seasonal variations. There is also likely to be considerable individual variation in the degree to which respondents are able to
2 For discussion of the different types of indicators used in different studies and their limitations see for example Daniels 1999a.

What Do We Want to Know? Selecting Indicators Linda Mayoux Page 5
calculate incomes or recall them over time. These variations may be nonrandom e.g. profits over the last month may be more stable in some sectors than others and assessments of income using this measure will be biased in ways which affect the subsequent analysis. Any assessment is therefore based on a particular selection of partial indicators. Recent debates about indicators have suggested the need to narrow down assessments to a narrow range of manageable, particularly economic and quantitative proxy indicators for poverty reduction. Some donors are proposing that these should be established as a common standard for reporting for comparative assessments, in the same way as for example financial reporting in micro-finance programmes3
. However while there is obviously a need for comparative assessments, and also a need to make indicators manageable, the primacy given to a few quantitative economic measures is unlikely to lead to assessments capable of producing credible and useful practical recommendations.
Firstly particular quantitative economic indicators of impact on direct beneficiaries of enterprise interventions cannot be taken as ‘proof ' of impacts on broader development goals e.g. increased household cash incomes or enterprise profits does not necessarily prove positive impact on poverty reduction. As the wealth of recent research on poverty has indicated, cash incomes may not be the most important issue for poor people. This represents only a part, albeit generally very significant part, of the means by which poor people can decrease their vulnerability and increase their well-being. Poverty reduction is inherently interlinked with political and cultural processes, access to and control over resources, environmental management and other development goals like health and education policy. The relative significance of the different dimensions of incomes indicated in Box 2 is likely to vary depending on factors like gender, household composition and marital status, rural/urban environment and so on. This means that assessment of the significance of any impacts observed will need to take into account potential trade-offs and the perceptions of different stakeholders in weighting and aggregating even quantitative economic information before any useful practical conclusions can be drawn. Indicators of impact at one level cannot be assumed to imply automatic impacts at other levels. Measuring the impact on the incomes of individual beneficiaries or those directly involved in enterprise interventions does not capture broader impacts on the incomes of other poor people in the same households or communities, on local, national or international markets, or national economies. Understanding the complexities of poverty and the interlinkages between individual and broader impacts are both crucial for improving policies for poverty reduction. Examples of limitations of income indicators for individual beneficiaries in indicating impact on poverty reduction Gender differences:
3 For an attempt to derive reliable proxy indicators in one context, Zimbabwe, see Daniels 1999b.

What Do We Want to Know? Selecting Indicators Linda Mayoux Page 6
• some women may not be trying to increase cash incomes, but production of
subsistence crops, livestock and investment in human capital. Cash incomes may risk being appropriated by husbands and/or successful businesses taken over.
• increasing women’s incomes does not necessarily increase household income
because it may be either directly used by men or used as a pretext for men withdrawing more of their own income from the household pool for their own consumption. In some cases this may leave women even worse off
• increased men’s incomes may not be used for the household This means that if the aim is to assess benefits to women and children, rather than increased disposable income for husbands, assessments focusing only on increased incomes of either women or men are likely to be inadequate. Significance of non-market benefits: • cash wages for labourers may increase but social benefits are withdrawn or work
contracts altered, increasing vulnerability and removing safety nets. This means that assessment of employment impacts cannot just be based on numbers of people employed or even wage levels.
• people may have been pushed into cash income generation because of loss of the
sources of subsistence eg loss of agricultural land and/or increasing costs of services eg water, education, health care. This means that income impacts must be placed in the context of consumption costs.
Ecological constraints: • private landownership may not be possible or desirable e.g. in some communal
systems, under some systems of inheritance or in coastal areas of Bangladesh where land is continually shifting through movements in river courses. Here questions about assets would need to focus much more on issues of access to and control of productive resources rather than ownership.
Different levels of impact • increased income at national level says very little about income distribution within
countries and hence about poverty alleviation. • increased household income says very little about distribution of income within
households and hence about the relative well-being of men, women and children or the elderly. Increased income of individual men or women may make little contribution to household income if this is spent on their own personal luxury preferences.
• increased income of a small group of individual beneficiaries cannot be assumed to indicate broader impact on the local economy unless local market linkages are created. It may make little contribution to the local economy if it is spent on goods imported from the cities or multinational companies.

What Do We Want to Know? Selecting Indicators Linda Mayoux Page 7
• the incomes of those with the resources and contacts to participate in enterprise interventions may increase their advantage in markets at the expense of poorer people in the same markets
Secondly, the dismissal of social impact goals e.g. women's empowerment as too context-specific that indicators cannot be devised is misplaced. However the key dimensions of empowerment are no more context-specific than those of poverty reduction which is also a multidimensional process of economic and political change as discussed above. There are internationally agreed conventions on human rights for both women and men which can form the basis of a framework for empowerment. The process of deriving indicators from these broad goals is no more or less subject to contextual variation than poverty reduction. Quantitative indicators have been derived and impacts have been usefully measured in areas ranging from intra household decision-making to political participation (!! Link to gender TSP). Thirdly this dismissal of social impact goals is linked to a dismissal of qualitative and participatory research methods as inherently less credible than quantitative assessment. It is certainly true that in many assessments investigation of crucial areas like intra-household relations, vulnerability and empowerment is reduced to anecdotal add-ons, falsely termed ‘qualitative’. In other cases participatory research consists of the mechanical application of diagram techniques with very little credible analysis. Those who have conventionally been involved in impact assessment have not had the to use qualitative and participatory methods well. Either they have only been trained in economic and quantitative analysis or they are practitioners with insufficient experience, training and funding. However as discussed elsewhere on this site the use of qualitative and participatory methods is essential to overcoming the many limitations of quantitative economic analysis. The solution is therefore much greater care and rigour in the use of qualitative and participatory indicators and methods. There are no blueprint recipes for selecting indicators, no easy checklists which can be assumed to yield relevant, credible and useful information for all purposes in all contexts. No particular types of indicator are inherently more useful credible than others because:
• the selection of impact goals is inevitably a political process. This is as true of economic goals like poverty reduction as it is of social goals like empowerment.
• any indicators are inevitably partial and selective. This is true of economic
indicators as social indicators, as true of quantitative as qualitative ones. The selection of any particular set of indicators from the total possible range of relevant indicators is inevitably based on an underlying theoretical, and often political, understanding of what types of impacts are important.
• different stakeholders will have differing priorities, different levels of knowledge
and ability and/or willingness to respond. There are inevitably tricky questions about how the relative significance of indicators is to be weighted and trade-offs to be assessed.

What Do We Want to Know? Selecting Indicators Linda Mayoux Page 8
Failure to acknowledge the inherently subjective, and often political, nature of selection of even quantitative economic indicators gives a very false sense of their usefulness in improving policy. Although economic indicators are a crucial part of any assessment, their selection must be based on prior qualitative and/or participatory research to identify their relevance to particular contexts and stakeholders and the best ways of framing questions to obtain reliable information. BOX 2: SOME TRICKY ISSUES IN ASSESSING INCOMES AND ASSETS ISSUES IN DEFINITION AND MEASUREMENT INCOME: defined as ‘the total value of goods, services, and wages transacted within a
specified time period’ (Little 1997) • What is meant by value? Is this in terms of cash? What about imputed values to
subsistence and other non-cash incomes? How are imputed values to be calculated? How is inflation to be taken into account?
• Which goods, services and wages are to be covered? What is the total of activities to be covered? Only those which take up most time? Or all those small goods and activities for both cash and subsistence necessary for survival and livelihood improvement?
• Whose goods, services and wages are to be included? How are these to be aggregated in the context of total or partial or occasional pooling of incomes from different household members?
• What about social capital? How can account be taken of access to goods and services in kind which are not traded in the market system but may be crucial to livelihoods and may be affected by enterprise interventions?
• What time factor? should incomes be calculated on a weekly, monthly or annual basis? what are the effects of seasonality or variation over time in prices, wages, employment and other activities?
ASSETS: defined as ' Stock or base wealth that reflect the accumulation and use of
economic value and income over time’ (Little 1997). • Which assets are to be included? Only productive assets? What about jewellery?
Domestic items essential to well-being? Luxury items? Housing? • How are values to be imputed to assets? how are second-hand values for sale of
assets to be assessed? how are different qualities of land in terms of crops which can be grown, accessibility, productivity be calculated in situations where markets for land and crops are only partially developed or fluctuate rapidly?
• How are the relative benefits of access, ownership and control of productive resources to be assessed particularly within the household, joint ownership systems or in sharecropping and tenancy agreements?
ISSUES IN COLLECTING INFORMATION

What Do We Want to Know? Selecting Indicators Linda Mayoux Page 9
• Can people tell you? Many people do not keep records, particularly where incomes are seasonal and regular or for non market activities. For many assets there may not be a second-hand market and/or prices may differ considerably depending on time for sale or relative status of buyers and sellers. • Do people want to tell you? Information on incomes and assets may well be secret and confidential as people fear theft or jealousy from neighbours, or appropriation by other household members. ISSUES IN ANALYSING INFORMATION • Aggregation: How is the total sum of incomes and asset values to be aggregated, given
their potential incompatibility in relation to the above? e.g. where daily cash incomes rise but social benefits and safety nets are withdrawn?
• Significance What levels of change in incomes and asset ownership is to be judged ‘significant'?
• Trade-offs how are trade-offs between impact on different indicators to be analysed or weighted e.g. in increase in cash incomes versus decreases in control

What Do We Want to Know? Selecting Indicators Linda Mayoux Page 10
SECTION 2 INDICATORS IN INTEGRATED ASSESSMENT: WAYS FORWARD 2.1 Indicators in integrated assessment: key issues The key task in selecting indicators is not therefore to attempt to provide a total picture of 'reality ' where all possible impacts are rigorously quantified. This is impossible even in large-scale longitudinal academic research. Nor is it to narrow down the numbers and types of indicators in a preconceived straightjacket. This is unlikely to yield credible or useful information for policy improvement. The key tasks are rather how to make the selection of indicators and their analysis: • more useful • less arbitrary • more accountable. This must be done in relation to:
• a credible model and set of hypotheses about the ways in which particular interventions fit into and contribute to a complex process of change
• the aims, needs and aspirations of those which the intervention is intended to
benefit Although the focus of impact assessment will vary, selection of indicators in most impact assessments for pro-poor enterprise development will inevitably need to: • combine assessment of both economic and social impacts and combine indicators
of different types. Even where the main focus of the intervention is economic, the range of possible anticipated and unanticipated social as well as economic impacts will be crucial for the target groups. For donors also there are requirements to compare different types of economic and social interventions to make funding decisions.
• include detailed analysis of the intervention concerned and the institutions
involved • incorporate some degree of stakeholder participation in decisions about both impact
goals and indicators : • incorporate flexibility in both goals and indicators. It is often the unexpected impacts
and exceptional impacts which point to directions for innovation and/or the need to attend to particular problems rather than average impacts on foreseen indicators. Indicators, their significance and ways in which they can be measured are also likely to change over the lifetime of programme. This is a particular problem for maintaining the usefulness of longitudinal or repeat impact assessments or monitoring and evaluation.
These concerns are likely to broaden the range of possible indicators. In order to make the assessment manageable in terms of both time and resources indicator selection must be

What Do We Want to Know? Selecting Indicators Linda Mayoux Page 11
based first on some rather different but very fundamental questions as summarised in Box 3: • Why are indicators needed ? • Whose indicators are likely to be most relevant for policy improvement?
It is only then that the very detailed questions about type of indicator needed can be answered as discussed in Section 3 below. BOX 3: KEY QUESTIONS IN ASSESSING INDICATORS WHY ARE INDICATORS NEEDED? • What are the particular interventions, or issues to be assessed? What models and hypotheses of impact are the indicators intended to assess? What contextual factors need to be taken into account? • What is the purpose of the impact assessment? Does the IA fit into an ongoing learning process? What are the implications for comparability of impact goals and indicators across different contexts and stakeholders? over time? • How and to whom is the information to be disseminated? What does this imply for sophistication of statistical analysis and hence quantification of indicators? For use of Case Studies? For stakeholder participation in identification of indicators? WHOSE INDICATORS? • Which stakeholders are included in the selection process? • Are the most disadvantaged adequately represented? • How are any differences or conflicts of interest to be resolved? WHAT SORT OF INDICATORS ARE NEEDED? • Which impact goals are to be prioritised in terms of time and resources? On what basis was this selection made? Are interlinkages between social and economic goals addressed? • What unintended impacts and contextual factors are to be assessed? • At what level is analysis needed? e.g.Individual, household, community, market, national, international
What Do We Want to Know? Selecting Indicators Linda Mayoux Page 12
• What degree of precision is needed in the assessment of each impact goal? What are the implications for quantification and analysis? What are the implications for qualitative and participatory methods? • What are the potential limitations of each indicator in terms of definition and measurement and in terms of problems in data collection? What are the implications for data collection and analysis? • What about unanticipated impacts: does the assessment allow for incorporation positive or negative impacts not predicted by either the programme aims or the broader social development objectives identified by participants. • What about progressive evolution over time ie whether the indicators are fixed from the beginning of an assessment or whether they are allowed to progressively evolve in response either to increase understanding of the nature of the impacts, or changes in priorities of the various stakeholders. PRACTICAL QUESTIONS • What time and resources are available? What are the implications for prioritisation of impact goals and depth of investigation? • What types of information are readily available? Is this data already adequate? If not is it possible to devise useful indicators to analyse this information? • Are the skills and capacities of the investigators and organizations who will carry out the assessment adequate for the different types of indicator? If not how is this to be addressed? 2.2 Why do we need indicators? the challenge of practical relevance Many impact assessments fail to yield credible practical conclusions and recommendations because the indicators have been chosen without clear reference to analysis of the intervention being assessed and the institutions involved in implementation. Although evidence of positive or negative impacts is obtained, it is not clear either why they are occurring or what can be done to improve the situation. This is particularly a problem with comparative research where unwarranted conclusions may be drawn because of an insufficiently sophisticated understanding of differences between the programmes or interventions assessed and the context in which they operate4
4 An example of this is the literature on sustainability and poverty reduction. Any useful discussion of this issue would need to distinguish between the different types of policy which are being implemented to achieve financial or organisational sustainability. This is discussed in more detail in the paper on microfinance on this web site (!! Insert link).
. The selection of indicators

What Do We Want to Know? Selecting Indicators Linda Mayoux Page 13
must therefore be related firstly to hypotheses and models of expected impacts of particular interventions and how these interact with contextual factors. Secondly the scope of the assessment and the indicators selected must relate to the purpose of the assessment. As discussed in the Core Text, DFID impact assessments may be commissioned for a number of different but interrelated purposes which have led to rather different emphases in selection of indicators:
• Accountability in use of donor funds. Here impact goals and methods of verification
are generally agreed at the beginning of a project, documented in the Logframe and assessed in monitoring, evaluations and reviews. Logframes have in the past generally favoured a quantitative focus partly geared to assessing cost-recovery. However recently with changes in donor policies and focus on partnership with programmes, logframes have been required to become more sophisticated in their ability to incorporate qualitative and participatory processes and adapt to changing priorities (!!Link to DFID/EDIAIS texts on logframes and project management). Social goals are an integral part of DFID’s sustainable livelihoods and human rights approach to poverty elimination and hence contribution to DFID development targets (!!Link to TSPs)
• Improving effectiveness in programmes/projects: Here impact goals and indicators
are to some extent more fluid depending on the type of intervention and nature of any internal management information, monitoring and evaluation systems. Many programmes collect a range of types of quantitative information through eg financial monitoring in micro-finance, training evaluation forms. Some have been increasingly interested in market research to improve their services. Some IAs have been concerned with questions of vulnerability and empowerment and have used qualitative, participatory and flexible indicators (eg Goyder et al 1998; Ritchie et al 1996). Here there are pressures to go ‘beyond anecdotal promotion’ of both economic and social impacts to more systematic assessment of their breadth, depth and change over time.
• Policy development and learning: This is a more recent but increasingly important
concern. It generally requires a specified set of impact goals which are assessed across interventions and contexts. Again for DFID these include both social and economic goals which underpin impact assessment as a contribution to SWAPS. Although goals will have to be assessed across interventions and contexts, indicators can be context-specific but weighted for comparison. Here there is an increasing emphasis on stakeholder participation and negotiation, as for example in the Participatory Poverty Assessments (See paper on Participatory Methods) and Ethical Trade Initiative (See Fair Trade and Ethical Enterprise Development).
The need for indicators is not actually self-evident. For some purposes there are strong arguments in fact for ‘indicatorless’ reporting. This approach is particularly useful where the main aim is programme improvement within very limited resources. It is also potentially useful at all levels from grassroots through to donor organizations as a basis on which to start or periodically review participatory identification of indicators.

What Do We Want to Know? Selecting Indicators Linda Mayoux Page 14
Indicatorless reporting Christian Commission for Development in Bangladesh has been piloting this approach supported by Rick Davies. Here staff are requested to report the most significant changes (positive or negative, planned or unplanned) over the last period and explain why they have identified these as significant. This discussion of relative significance highlights changing priorities with the programme and captures both planned and unplanned benefits and costs. It has also generated more usable information than previous quantitative and qualitative information systems (Davies 1998). What is needed therefore is not so much ‘harmonisation’ of indicators but building on complementarity between assessments. The process of practical learning does not require strict comparability. This is in any case problematic because of differences between contexts and hence the ways in which even the same indicators and questions will be interpreted (See paper on collecting information). What is needed is cumulative learning to build up a picture of processes of change and how particular types of intervention contribute. This is more akin to building solid blocks of a complex jigsaw where one piece fits into and completes another while still requiring yet one further piece to improve understanding. In each case the most ‘appropriate’ indicators will therefore depend on: • the nature and range of intervention/s to be assessed and the anticipated types of
positive and negative impact. Even for the same types of intervention different organizations may wish to focus on particular dimensions of impact depending on their own particular impact goals, organisational mandates and existing management information systems. At the same time, for programme beneficiaries or people affected by macro-level policies there may be other priorities which require broader consideration of the unexpected or unplanned impacts.
• the use to which the data is to be put: this includes the ways in which it is to be fed
into programme improvement, the ways in which it is to be analysed and disseminated. This will decrease the amounts of extraneous data being collected but which are then neither analysed nor disseminated.
• how this particular IA relates to any longer-term learning process. For example are
particular indicators necessary to enable comparison with previous or future studies and/or across contexts? What types of questions can be inserted into existing management information systems and routine data collection? This will enable a cumulative process of focused learning between stakeholders rather than any one impact assessment attempting unsuccessfully to be all things to all people5
.
5 For more discussion of indicators and logframes for example see Gibson 2001. Although, contrary to what is argued here, the focus is principally on economic data, the principles of relating indicators to programme planning cycles are similar.

What Do We Want to Know? Selecting Indicators Linda Mayoux Page 15
2.3 Whose indicators? challenges of stakeholder participation
The most common approach to selection of indicators until recently has been a priori external selection where indicators have been selected at the beginning of an assessment by external assessors or programme staff. While this is a valid method where impact goals are clear and those selecting indicators have a good understanding of context, it also has its limitations in view of the complexities discussed above. Some assessments have selected indicators following in-depth qualitative research and/or detailed piloting where indicators have been refined in the light of responses. However, even where care is taken, selecting indicators on the basis of external priorities has inherent subjective biases which will need to be taken into account and justified in analysis of the data and in drawing any practical conclusions.
More recently, there has been increasing emphasis on stakeholder participation in the identification of indicators. Stakeholder participation is an integral part of any enterprise development assessment which aims to make useful recommendations for pro poor growth. Stakeholder participation is essential to:
• ensure that the assessment focuses on those impact goals which are most important for those whom enterprise development is intended to serve.
• ensuring the credibility and relevance of indicators in assessing contribution to those goals.
• ensuring that the final findings of any assessment are accepted by stakeholders and contribute to programme and policy improvement.
A distinction may be made between two approaches:
• Participatory grassroots-led selection where PLA techniques like participatory
wealth ranking or other types of matrix ranking or less focused brainstorming focus group discussions are used to identify indicators prioritised by programme beneficiaries (as eg in Goyder et al 1998)
• Participatory multi-stakeholder selection which uses similar techniques to
grassroots-led selection, but rather than attempting to reach consensus differentiates between and includes a range of indicators as identified by different stakeholders. For example different indicators may be developed by women and men, by donors, programmes and grassroots beneficiaries.
Grassroots participation in defining indicators does not necessarily decrease the validity of externally identified indicators based on theoretical analysis or political priorities of other stakeholders involved. Grassroots indicators (like those of external assessors) are likely to be neither uniform nor static but vary between stakeholders and may change over time. This variation and change may in itself be an important indicator of programme impact. For example in a number of programmes in India involved in impact assessments of Oxfam and ActionAid, women did not identify indicators of changing gender relations although this was the name of programmes assessed. By the end of the assessment, empowerment indicators were seen as very important by the women and this was in itself taken as an indicator of positive impact (Roche 1999; Goyder et al 1998). However

What Do We Want to Know? Selecting Indicators Linda Mayoux Page 16
although externally identified indicators will remain valid, where particular impacts identified are not prioritised by primary stakeholders and/or are costly to measure using long lists of precise indicators, questions will need to be asked about whether it would not be better to use proxy indicators for estimation. This would enable resources and time to be concentrated on more detailed assessment of other higher priority impacts. The process of stakeholder participation will inevitably require careful planning. There are a number of potential pitfalls and challenges: • the potentially unmanageable proliferation of indicators • unequal representation of more disadvantaged stakeholders • irreconcilable differences between stakeholders in priorities • local differences in interpretation of indicators • raising unrealistic expectations of programmes through inclusion of indicators which
may be important to beneficiaries but which are not part of programmes aims These are not unique to participatory indicators. Wherever possible: • the facilitation and indicator selection process itself needs to be explicit. For
example the selection process could begin with either a predetermined checklist from which participants select indicators, or with an open-ended participatory brainstorming session which is then progressively narrowed down and prioritised. The former could be justified where resources and time are limited and/or appropriate participatory systems do not exist.
• power relations between stakeholders also need to be acknowledged and
addressed. Prioritisation of some views over others may be justified because of greater levels of knowledge or commitment, but the reasons need to be specified to avoid misunderstanding and conflict.
Grassroots indicators can also be developed through a pilot questionnaire if the topic or organizational context does not allow a public participatory process. For example some investigations of labour issues, certain aspects of communal or domestic violence or more confidential dimensions of control over incomes within households may need a much less public profile in both identification of indicators as well as data collection.

What Do We Want to Know? Selecting Indicators Linda Mayoux Page 17
SECTION 3: THINKING IT THROUGH: GUIDELINES FOR SELECTING AND USING INDICATORS IN INTEGRATED IMPACT ASSESSMENT
3.1 Thinking it through: indicators trees Most impact assessments will use integrated methodologies combining some level of statistical analysis, qualitative research and participatory learning. This requires: • going beyond standardised checklists of indicators to a much more probing and
reflexive use of indicators, tailored to particular purposes and questions. • attention to careful analysis of the limitations of each indicator and indicator
selection processes to ensure less arbitrary selection and greater accountability. One way of thinking about and deriving indicators for any one impact assessment is to start with an ‘indicator tree’ to map the spectrum of goals and indicators which may be relevant, either as a direct result of any intervention or unintended outcomes which need to be assessed in order to find out how far an intervention is contributing to an organisation's development goals. The process of generating tree diagrams is discussed in a separate paper on this web site (!! Into link.) In relation to selecting indicators the top of the tree should start with broad impact goals either of the intervention itself or the organization implementing it eg poverty reduction, empowerment and the main elements of these goals identified by the organisation or other stakeholders as indicated in documents like organizational mandates. For each of these impact goals branches can be forked off at different levels which become progressively more specific in their transition from goals to indicators. Figure 1 gives an idea of what an indicator tree for certain dimensions of poverty reduction might look like. The indicators given there should not however be taken as a checklist or a hard and fast categorisation. (!!Insert tree diagram from separate file) Indicator trees are ideally derived through participatory methods (!!Link to PM paper). Focus group discussions can be used to:
• determine the levels at which broad impact goals are agreed across contexts and stakeholder groups
• prioritise impact goals for the most in-depth assessment • identify the levels at which context- or stakeholder-specific indicators are needed • identify the diversity of possible sources of information
It is likely that different stakeholders will produce different trees. Whether or not these can or should be combined into one single agreed indicator tree will depend very much on the nature of the assessment and the levels of disagreement. In some cases it may be feasible and desirable to assess a number of separate trees. For example it may be more useful for policy makers to know how far policies are addressing the different needs of different stakeholders eg women and men, rural and urban populations etc rather than either narrowing down the number of indicators or attempting a much larger and costly assessment over the whole range of indicators for everyone. As discussed above and in

What Do We Want to Know? Selecting Indicators Linda Mayoux Page 18
more detail elsewhere on this site, in some cases it may be possible for different stakeholders to control and conduct assessment of those indicators which are most useful and important to them (!!Insert link to paper on grassroots learning forthcoming). Most assessments will use a series of interlinked and related trees as the anaylsis progresses.The point is to make the diagrams into flexible tools for thinking, rather than imposing a rigid methodology. The advantage of using an indicator tree as an aid to thinking is that it enables: • a basis for more systematic prioritisation of impact goals to be assessed through
clarification of the interlinkages or tensions between broader development goals and different project or policy impact goals.
• clarification of interrelations between different goals and indicators, including the
limitations and gaps in any particular selection of indicators and hence issues to be taken into account in analysing the data.
• clearer choices to be made about levels of specificity for particular indicators based on
prioritisation of impact goals and/or methodologies to be used. 3.2 Using indicators from selection to investigation and analysis Once the broad range of relevant indicators has been mapped, these initial trees will then be progressively refined to focus the investigation and make it manageable. The tree can be developed in many different ways and combined with other diagramming techniques like flow, network and Venn diagrams as discussed below and indicated in Box 4. This process of refinement needs to take into account how the indicators are to be used:
• which particular impact models and hypotheses are to form the main focus of this particular assessment
• how they are to be translated into questions in surveys, qualitative investigation and
participatory workshops
• how they are to be analysed and disseminated It may not always be possible to predict all these in advance in large assessments and some flexibility will need to be allowed for. Nevertheless, preliminary planning of the assessment as a whole and how the different stages fit together is essential to ensure that large amounts of extraneous data are not collected and/or important dimensions of impact are not omitted. The first stage is to identify on the tree which indicators are the most relevant to the models of impact being used. Distinctions should be made between:
• direct anticipated impacts specified in the goals of the intervention

What Do We Want to Know? Selecting Indicators Linda Mayoux Page 19
• possible indirect impacts which are important in view of the organizational mandates of the institutions involved or the needs and aspirations of intended beneficiaries
It is useful to use Flow diagrams for generating these models of the impact chain. These should clearly indicate:
• which particular programme strategies are expected to lead to which impacts and why
• what contextual features are likely to be important in providing opportunities and constraints
This analysis then provides the basis for the questions to be put in different sections of a questionnaire or interview or participatory exercise.
The next step is then to identify which impacts will require analysis at which level. Typically impact assessments are concerned with impacts at a number of different but interrelated levels e.g. individual, household, community, market, national. In some cases the same indicators and questions can simply be asked at different levels. In other cases different indicators, questions and methodologies will be needed. Ideally these questions should be decided through a participatory process involving stakeholders at the same time as identification of indicators. This should also take into account and link with decisions about sampling and stakeholder representation in the investigation (!!Insert link). It may be useful to use techniques like Venn diagrams to indicate overlap between indicators at different levels or different stakeholders. Depending on the particular focus of the investigation, different goals will be investigated with differing degrees of depth and precision. This together with the particular requirements of the stakeholders to whom the findings are to be disseminated will affect: • which particular indicators require precise quantification for purposes of statistical
analysis • which indicators can be estimated to some degree of accuracy through use of proxy
indicators or qualitative methods
• which indicators require only imprecise assessment of probability or possibility to indicate issues which might need to be borne in mind in policy change
The types of indicator selected at different levels and degrees of precision will inevitably be influenced by practical considerations. These include the degree to which respondents are likely to be able to answer particular questions. Not all indicators need be assessed through individual questionnaires or surveys. Usable information may exist at other levels, for example programme Management Information Systems, statistics collected by government offices, research by local Research Institutes and so on. If data on particular impact goals exist, but have not used ‘ideal’ indicators, it may still be more cost-effective to use this information and concentrate on examining its reliability, relevance and limitations through qualitative or participatory methods rather than conducting a new large-scale quantitative survey. This is particularly the case if the impact concerned is not high priority

What Do We Want to Know? Selecting Indicators Linda Mayoux Page 20
but is an exploratory area of possible importance in the future. These points can be indicated through using different colours, putting different types of box around key indicators, linking particular indicators with arrows and lines of different types and so on.
BOX 4: USING DIAGRAM TECHNIQUES FOR SELECTING INDICATORS: SUMMARY STEPS AND GENERAL PRINCIPLES
STEPS IN SELECTING INDICATORS 1) Indicator tree/s to map the range of impact goals and indicators which may be
relevant 2) Flow diagram/s to explore models and hypotheses about: • the ways in which particular policies, strategies or institutional factors may bring about
particular impacts • the opportunities and constraints posed by particular contextual factors 3) Revisiting the indicator tree/s to narrow down the focus on those goals and
indicators relevant in the light of the flow diagram analysis 4) Venn diagrams to indicate the relevant levels of analysis, different stakeholders and
overlaps/differences between impact goals and what they may contribute to the investigation
5) Revisiting the indicator tree/s to identify: • Which indicators need to be assessed by what methods and with what degrees of
precision • For which indicators sources of information already exist and how reliable they are likely
to be • Linkages between different sources of information for crosschecking • For which indicators collecting information is likely to be too unreliable, costly or difficult
and therefore imposes limitations on the state of the assessment and the conclusions can be drawn.
GENERAL GUIDELINES • At all stages diagrams and refinements should be done through a participatory process.
The different steps could all be done in one initial participatory workshop or a series of workshops with different stakeholders as part of the rapport-building process (See paper on the investigation process)
• The various refinements in the diagrams can be indicated through using different
colours, putting different types of box around key indicators, linking particular indicators with arrows and lines of different types and so on (!!Insert link to paper on Using Diagrams).

What Do We Want to Know? Selecting Indicators Linda Mayoux Page 21
3.3 Practical and institutional considerations Participatory selection of indicators in the way described here requires skilled facilitators and hence has costs. However the process of identifying and assessing indicators can be combined with other tasks such as building rapport and sampling as part of initial and ongoing participatory workshops. Moreover in some cases it may be feasible and desirable for different stakeholders to control assessment of those indicators which are most useful and important to them. It may be for example that women's groups are sufficiently interested in issues like impact on markets or incomes in particular activities that they are prepared to collect systematic information on these issues (!! Insert link to paper on grassroots learning). Women's organisations or environmental organisations or community organisations may be willing to collect the information which they have on issues which concern them. The participatory process may therefore bring in for the resources and expertise to set up an ongoing learning process. The use of diagram trees in this way provides a much more coherent and less arbitrary basis for subsequent decisions about the design of the investigation: • What particular issues and questions should be included in which surveys,
questionnaires and participatory workshops • How the different methodologies can be used to complement and cross-check each
other • What the limitations of the impact assessment are in terms of the issues and questions
not covered, the gaps in information obtained and hence the implications for the types of practical conclusions which can be drawn
Comparison of the different trees from different assessments would also provide a much sounder basis for identifying: • how far they can be compared in relation to which types of impact • how they might complement each other in the wider picture • which bits of the big jigsaw are still missing and need to be taken up in subsequent
assessments This would therefore enable the contribution of any one assessment to a longer term learning process to be more clearly identified.

What Do We Want to Know? Selecting Indicators Linda Mayoux Page 22
What Do We Want to Know? Selecting Indicators Linda Mayoux Page 23
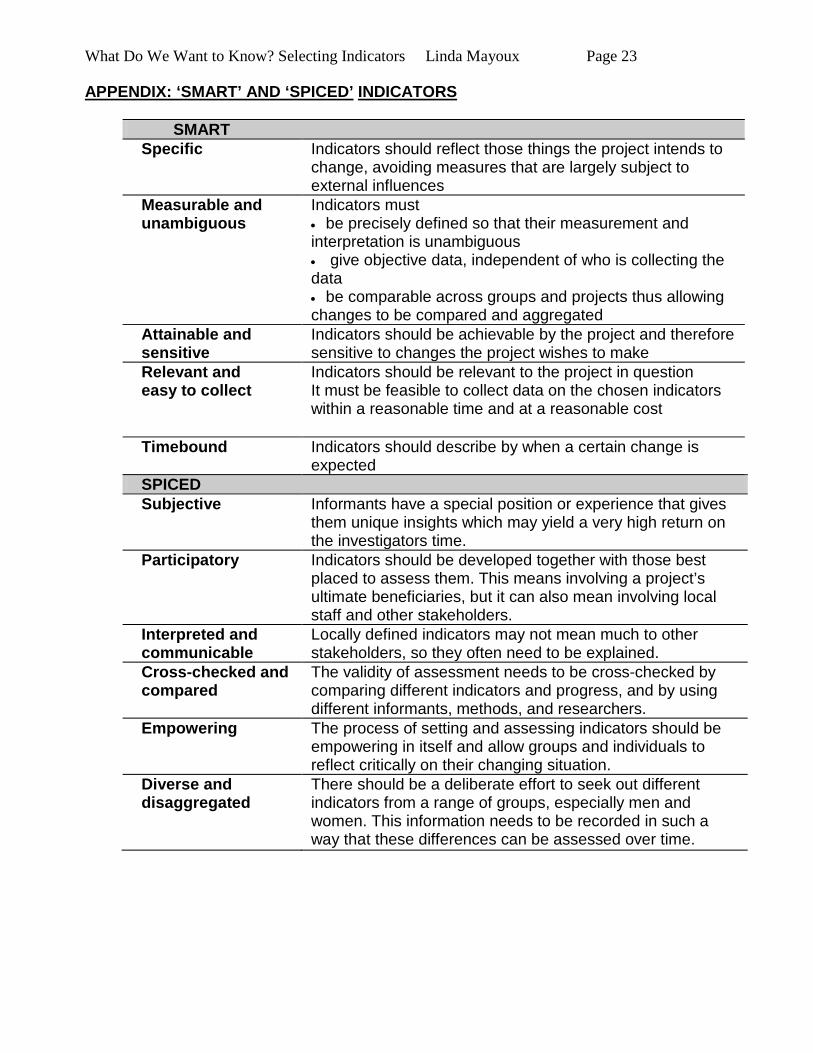
APPENDIX: ‘SMART’ AND ‘SPICED’ INDICATORS
SMART Specific Indicators should reflect those things the project intends to
change, avoiding measures that are largely subject to external influences
Measurable and unambiguous
Indicators must • be precisely defined so that their measurement and interpretation is unambiguous • give objective data, independent of who is collecting the data • be comparable across groups and projects thus allowing changes to be compared and aggregated
Attainable and sensitive
Indicators should be achievable by the project and therefore sensitive to changes the project wishes to make
Relevant and easy to collect
Indicators should be relevant to the project in question It must be feasible to collect data on the chosen indicators within a reasonable time and at a reasonable cost
Timebound Indicators should describe by when a certain change is expected
SPICED Subjective Informants have a special position or experience that gives
them unique insights which may yield a very high return on the investigators time.
Participatory Indicators should be developed together with those best placed to assess them. This means involving a project’s ultimate beneficiaries, but it can also mean involving local staff and other stakeholders.
Interpreted and communicable
Locally defined indicators may not mean much to other stakeholders, so they often need to be explained.
Cross-checked and compared
The validity of assessment needs to be cross-checked by comparing different indicators and progress, and by using different informants, methods, and researchers.
Empowering The process of setting and assessing indicators should be empowering in itself and allow groups and individuals to reflect critically on their changing situation.
Diverse and disaggregated
There should be a deliberate effort to seek out different indicators from a range of groups, especially men and women. This information needs to be recorded in such a way that these differences can be assessed over time.

What Do We Want to Know? Selecting Indicators Linda Mayoux Page 24
REFERENCES Daniels, L. (1999). Alternatives for Measuring Profits and Net Worth of Microenterprises. Washington DC, Management Systems International. Available from www.mip.org Daniels, L. (1999). Measuring Profits and Net Worth of Microenterprises: A Field Test of Eight Proxies. Washington DC, Management Systems International. Available from www.mip.org Davies, R. (1998). An evolutionary approach to facilitating organizational learning: An experiment by the Christian Commission for Development in Bangladesh. Development as process: Concepts and Methods for Working with Complexity. D. Mosse, J. Farrington and A. Rew. London, Routledge/ODI: 68-250. Available from www.mande.co.uk. Gibson, A. (2001). Developing indicators in small enterprise development projects: A tool for people involved in designing, implementing and evaluating SED project. Durham, Springfield Centre for Business in Development. Goyder, H., R. Davies, et al. (1998). Participatory Impact Assessment: A Report on a DFID funded Action Aid research project on methods and indicators for measuring the impact of poverty reduction. London, Action Aid. Little, P. D. (1997). Income and Assets as Impact Indicators. Kentucky, Paper presented to CGAP AIMS virtual workshop. Mayoux, L. (2002 forthcoming) From Impact Assessment to Sustainable and Participatory Practical Learning: A Guide for Enterprise Development Open University Working Paper, Milton Keynes. Ritchie, A., F. K. Bhuiya, et al. (1996). Impact Evaluation of Income Generation Projects. Dhaka, CARE-Bangladesh. Roche, C. (1999). Impact Assessment for Development Agencies: Learning to Value Change. Oxford, Oxfam Novib.