what do returns to acquiring firms tell us
TRANSCRIPT
7/21/2019 What Do Returns to Acquiring Firms Tell Us
http://slidepdf.com/reader/full/what-do-returns-to-acquiring-firms-tell-us 1/32
What Do Returns to Acquiring Firms Tell Us?
Evidence from Firms That MakeMany Acquisitions
KATHLEEN FULLER, JEFFRY NETTER, and MIKE STEGEMOLLER*
ABSTRACT
We study shareholder returns for firms that acquired five or more public, private,and0or subsidiary targets within a short time period. Since the same bidder chooses
different types of targets and methods of payment, any variation in returns mustbe due to the characteristics of the target and the bid. Results indicate biddershareholders gain when buying a private firm or subsidiary but lose when pur-chasing a public firm. Further, the return is greater the larger the target and if the bidder offers stock. These results are consistent with a liquidity discount, andtax and control effects in this market.
Takeovers are one of the most important events in corporate finance, bothfor a firm and the economy. Extensive research has shown that shareholders
in target firms gain significantly and that wealth is created at the announce-ment of takeovers ~i.e., combined bidder and target returns are positive!.However, we know much less about the effects of takeovers on the share-holders of acquiring firms. Evidence suggests that these shareholders earn,on average, a zero abnormal return at the acquisition’s announcement, thoughthere is tremendous variation in these returns. Researchers have been un-able to successfully explain much of this variation, partially because theannouncement of a takeover reveals information about numerous things.For example, Grinblatt and Titman ~2002, p. 708! state that the stock returnat the time of the bid cannot be completely attributed to the expected effect
of the acquisition on profitability, arguing that, “the stock returns of thebidder at the time of the announcement of the bid may tell us more abouthow the market is reassessing the bidder’s business than it does about the
* Fuller and Netter are from Terry College of Business at the University of Georgia. Stegemol-ler is f rom Kelly School of Business at Indiana University, Indianapolis. We thank Anup Agrawal;Sanjai Bhagat; Michael Goldstein; E. Han Kim; Marc Lipson; David Mauer; Maureen O’Hara;Bill Petty; Annette Poulsen; Raghu Rau; Sheridan Titman; seminar participants at the Uni- versity of Georgia and Babson College; and participants at the 11th Annual Financial Econom-ics and Accounting Conference and 7th Mitsui Life Symposium on Global Financial Markets atthe University of Michigan, the 2001 European Financial Management Association meetings,
the 2001 Financial Management Association meetings, and the 2002 American Finance Asso-ciation meetings for comments and suggestions on earlier drafts of this paper. All errors are ourown.
THE JOURNAL OF FINANCE • VOL. LVII, NO. 4 • AUGUST 2002

7/21/2019 What Do Returns to Acquiring Firms Tell Us
http://slidepdf.com/reader/full/what-do-returns-to-acquiring-firms-tell-us 2/32
value of the acquisition.” Hietala, Kaplan, and Robinson ~2001! note that theannouncement of a takeover reveals information about the potential syner-gies in the combination, the stand-alone values of the bidder ~s! and tar-
get~s!, and the bidder overpayment. They argue that it is often impossible toisolate these effects and, thus, know the meaning of the market’s reactionsto a takeover announcement.
Our research design allows us to control for much of the information aboutbidder characteristics contained in the returns at the announcement of thetakeover. Thus, we are able to more directly examine the impact of targetand bid characteristics on the returns of acquirers than previous research.We investigate the returns to shareholders of firms making five or moresuccessful bids within three years between 1990 and 2000. This sampleof firms enables us to hold bidder characteristics constant while examining
the pattern of announcement returns. Presumably, if the same firms makedifferent types of acquisitions, and if we assume that the acquisition pattern varies randomly among firms, we can attribute most of the variation in theacquirer’s returns as due mainly to factors other than new information aboutthe bidder. Our main focus is on examining the returns to acquirers making bids for public, private, and subsidiary targets, using cash and stock, andseeing how the acquirers’ returns vary by these characteristics. Our studyenables us to provide new evidence on what bidder returns tell us abouttakeovers.1
We choose to examine the 1990 to 2000 period because the level of take-
over activity in the United States in the 1990s was very high by historicalstandards. Additionally, firms making multiple acquisitions initiated a sig-nificant portion of takeover activity in this period. The firms in our samplemake more than one-third of all the large, nonfinancial, nonutility takeoversin the United States as reported by Securities Data Corporation.2 Therefore,our sample provides a fruitful testing ground for probing the meaning of returns to acquirers. Further, we include acquisitions of private firms andsubsidiaries, which is an important component of the takeover market ~81 per-cent of all acquisitions! but a market that few have studied.
Using a sample of 3,135 takeovers, we f ind that bidders have significantlynegative returns when buying public targets and significantly positive returnswhen buying private or subsidiary targets. When the bids are partitioned onmethod of payment ~cash, stock, or a combination of the two!, we find thatacquisitions of public targets result in insignificant bidder returns for cashor combination offers but significantly negative returns to the acquirers whenstock is offered. However, for private and subsidiary targets, acquirer re-turns are significantly positive regardless of method of payment. These ac-
1 Note that in our analysis, the terms bidder and acquirer are used interchangeably becauseall the bids in our sample lead to a completed acquisition.
2
Acquisitions by multiple bidders were an important source of growth to these firms. Thetotal value of their acquisitions averaged 6.5 times greater than their market value the monthbefore the first acquisition.
1764 The Journal of Finance

7/21/2019 What Do Returns to Acquiring Firms Tell Us
http://slidepdf.com/reader/full/what-do-returns-to-acquiring-firms-tell-us 3/32
quirer returns accompanying bids for private firms and subsidiaries are greaterfor bids financed with equity than for bids financed with cash. Further, wedo not find any evidence that the returns to the acquirer when a subsidiary
is purchased depends on whether the seller is diversified. Additionally, when we partition the returns to acquirers on the relative
size of the target compared to the bidder, we find that for public targets, asthe relative size of the target increases, the returns become more positive forcash offers, more negative for stock offers, and change little for combinationoffers. However, for both subsidiary and private targets, there is a positiverelationship between the target’s relative size and the acquirers’ positiveabnormal returns. As the relative size of the target increases for a privateacquisition, returns to the bidder using stock are greater than if the bidderhad used cash.
One explanation for the differing market reactions to the acquisitions of private and subsidiary targets versus public acquisitions is that bidders re-ceive a better price when they buy nonpublic firms. This could be due to aliquidity effect—private firms and subsidiaries cannot be bought and sold aseasily as publicly traded firms. This lack of liquidity makes these invest-ments less attractive and thus less valuable than similar, more liquid in-
vestments. The acquirer captures this discount in purchasing the privatelyheld firm or the subsidiary. This also is consistent with why the returns toacquirers are more positive the greater the relative size of the target forprivate targets and subsidiaries and more negative the greater the relative
size of the target for public targets.Two other factors also contribute to the pattern of abnormal returns of offers for private firms. First, by definition, private firms are closely held.Thus, as the relative size of the private target to the bidders increases, sodoes the likelihood of blockholder formation when stock is used as the methodof payment. This creation of a large blockholder then allows for greater mon-itoring of the bidder’s management, increasing bidder value. Therefore, bid-ders using stock rather than cash to acquire a private target will receivehigher returns, and the returns will be higher the greater the target’s rel-ative size. Further, when a privately held firm is acquired with cash, theprivate-firm owners are faced with immediate tax implications. However,when private-firm owners are given stock in exchange for their ownershiprights, the tax implications are deferred. If this tax deferral option is valu-able to owners, they may accept a discounted price for the firm equal to, atmost, the value of the option. This lower price will be reflected in the higherbidder returns for stock offers.
In sum, we suggest that transactions prices in mergers vary with the typeof the target. In terms of prices, bidders receive the best prices when theybuy private firms and subsidiaries with equity, then private firms and sub-sidiaries with cash, then public firms with cash, and finally the worst pricefor public firms purchased with equity. These results are somewhat in the
spirit of Shleifer and Vishny ~2001, p. 2! who also argue “stock market val-uation shapes merger activity.”
What Do Returns to Acquiring Firms Tell Us? 1765

7/21/2019 What Do Returns to Acquiring Firms Tell Us
http://slidepdf.com/reader/full/what-do-returns-to-acquiring-firms-tell-us 4/32
In addition to our evidence on the impact of liquidity and control on themarkets for corporate assets, we also add to the evidence on the method-of-payment choice. For public targets, our results are consistent with Myers
and Majluf ~1984!—a bid made with stock reveals the bidder views theirstock as overvalued. However, for private and subsidiary targets, the samebidders experience positive reactions for both stock and cash offers, even if the private and public bids are made almost simultaneously. This lends sup-port to Hansen’s ~1987! hypothesis that if the bidder has less informationregarding the target’s value, the bidder should make a stock offer.
Further, our sample allows us to examine the choice of the bidder’s methodof payment in a unique way. We construct a sample of firms that acquiredtwo targets within 90 days. In comparisons of these two bids, we hold con-stant bidder characteristics and concentrate on the relation between the
characteristics of targets and bids and acquirer returns. We first show thatin clustered bids, bidders often use different methods of payment. Thissuggests that the choice of a method of payment is often a function of thecharacteristics of the target rather than just the bidder’s attributes. If thetargets have different public status, if the bidder and targets were in dif-ferent industries, and if the difference in the size of the two targets waslarge, then the acquirers are more likely to choose two different methods of payment.
The paper is organized as follows. In Section I, we review the relatedliterature and discuss our approach. Section II describes the data, while
Section III reports the results and our interpretations. Section IV concludesthe paper.
I. Previous Research on Returns to Shareholders
of Bidding Firms
A. Empirical Evidence on Bidder Returns: Public Targets
Mulherin and Boone ~2000! study acquisition and divestiture activity from1990 through 1999 of 1,305 Value Line firms. They find that both acquisi-tions and divestitures create wealth, which they measure by the combinedstock price reaction to the announcement. An average target return of 20.2 per-cent in the three-day window around the acquisition offsets a slightly neg-ative but insignificant bidder return. Mulherin and Boone find that combinedbidder and target returns are significantly related to the relative value of the target ~target value0bidder value!. They conclude that the wealth ef-fects are directly related to the size of the event for acquisitions ~and di-
vestitures! and are consistent with a synergistic explanation for thetransactions.
The Mulherin and Boone ~2000! results are consistent with a host of studies mostly using data from earlier time periods ~see the surveys by
Jensen and Ruback ~1983!, Jarrell, Brickley, and Netter ~1988!, Andrade,Mitchell, and Stafford ~2001!, Bruner ~2001!, and Weston, Siu, and John-
1766 The Journal of Finance

7/21/2019 What Do Returns to Acquiring Firms Tell Us
http://slidepdf.com/reader/full/what-do-returns-to-acquiring-firms-tell-us 5/32
son ~2001, Chapter 8!!. For example, Bradley, Desai, and Kim ~1988! findthat excess returns to bidders on the announcement of a takeover fall fromabout 4 percent in the 1960s to 1.3 percent in the 1970s and then to
3 percent in the 1980s ~all statistically significant!. However, they alsofind positive combined gains for bidders plus targets in takeovers for eachperiod. Weston et al.’s review of the evidence on returns to acquirers intakeovers notes several reasons why the returns to bidders may have de-creased over time. The Williams Act ~adopted in 1968! made the tenderoffer process more costly and time-consuming for bidders. In the 1980s,takeover defenses adopted by firms, state antitakeover laws, and judicialdecisions protecting targets all developed to further shift the bargaining balance from bidders to targets.
These results raise an important question. If bidder returns are not pos-
itive, then why do firms make acquisitions? There are several possible ex-planations. Weston et al. ~2001, p. 221! note that zero returns to bidders areconsistent with a competitive corporate control market in which firms earn“normal” returns in their operations. By this standard, Bruner ~2001, p. 14!
concludes “60 to 70 percent of all M&A transactions are associated withfinancial performance that at least compensates investors for their oppor-tunity cost.” Additionally, while bidder returns are on average small, there isa tremendous variation in returns and many bidders are trying to be one of the winning firms.
In addition, there are several difficulties in estimating bidder returns.3
First, targets may be small relative to the bidder, so even good acquisitionscould have little impact on the bidder’s stock price. Second, the stock pricereaction to an acquisition can only represent the surprise component of theacquisition. If a bidder is known to be engaging in an acquisition strategy,the stock price reaction to any acquisition announcement will only representhow the market perceives that acquisition to be different from the antici-pated acquisition. Third, if the target resists the takeover, the takeover pro-cess could take a long time. Thus, the uncertain outcome of the event makesit difficult to isolate the market’s perception of the bid.
Hietala et al. ~2001! raise more fundamental objections to the interpreta-tion of bidder returns. They note that the announcement of a takeover re-
veals information about several things including the potential synergies inthe combination, the stand-alone values of the bidder ~s! and target~s!, andthe split in value among the firms. They suggest that it is generally impos-sible to disentangle these effects and infer the meaning of the market’s re-actions to a takeover announcement. Hietala et al. present a model thatshows it is possible in several special cases to use bidder and target stockprice movements to estimate the market’s estimate of synergies andoverpayment—including cases where a deal is not completed or where atakeover contest has exactly two bidders. Empirically, they use their meth-odology to show that the winning bidder for Paramount, Viacom, won by
3 See Eckbo, Maksimovic, and Williams ~1990! for a more thorough discussion.
What Do Returns to Acquiring Firms Tell Us? 1767

7/21/2019 What Do Returns to Acquiring Firms Tell Us
http://slidepdf.com/reader/full/what-do-returns-to-acquiring-firms-tell-us 6/32
being willing to overpay more than its competitor, QVC, in the bidding con-test even though QVC had greater synergies with Paramount.4
B. Empirical Evidence on Bidder Returns: Private Targets
There is little research on method-of-payment choice or wealth effects whenthe target is a private company and essentially none when the target is asubsidiary of another company. Chang ~1998! examines bidder returns tofirms acquiring 281 privately held targets from 1981 through 1992 and com-pares them to bidder returns for 255 public targets from 1981 through 1988.He finds no significant abnormal returns for a two-day window for bidderswho acquire private targets with cash. However, bidders who buy privatetargets with stock have a significant 2.64 percent return. Chang suggests
that when making a stock acquisition, a large blockholder or several block-holders may be created from the target shareholders. If the blockholderswere better able to monitor the actions of the bidding firm management, theperformance of the bidding firm would improve. To test this, Chang sepa-rates the bidders by whether or not a new blockholder in the bidder emergesfrom the private target firm. He finds a 4.96 percent announcement abnor-mal return if a new blockholder is formed versus a 1.77 percent return if there is no new blockholder; both of these abnormal returns are significant,as is their difference. Though large blockholders can be created for bothprivate and public targets, this effect is more likely with private targets
since public targets generally have less concentrated ownership.This differential may be offset somewhat, however, by the fact that publictargets tend to be larger than private targets and therefore receive a largerownership stake in the bidder. In addition, private target managers may usethe takeover as an exit strategy and be uninterested ~or incapable! of acting as effective monitors. Thus, blockholder considerations are not conclusivein explaining differences in bidder returns based on the public0privatedistinction.5
Hansen and Lott ~1996! also examine the returns to bidders acquiring private and public targets. They examine the returns to bidders acquiring 252 private and public targets from 1985 to 1991. Their results indicate thatthe bidders experience a 2 percent higher return when purchasing a privatefirm. In 65 percent of the bids for public targets, the bidder return wasnegative, while in only 43 percent of the bids for the private targets was thebidder return negative. Hansen and Lott offer an alternative explanationthan blockholder formation for why bidders do relatively better in an acqui-
4 Bhagat, Hirshleifer, and Noah ~2001! use probability scaling and intervention methods of estimation to attempt to better estimate the shareholder value effects of takeovers. They arguetheir estimation methods correct for the problems induced by choosing incorrect length eventwindows and bidder-revelation bias ~the bid reveals information about the bidder!. They find
investors perceive large value improvements from tender offers.5 Another possible reason for the different reactions is the bias discussed earlier: Privatedeals will almost certainly be completed, while the public deals may not be completed.
1768 The Journal of Finance

7/21/2019 What Do Returns to Acquiring Firms Tell Us
http://slidepdf.com/reader/full/what-do-returns-to-acquiring-firms-tell-us 7/32
sition of a private target than a public target. They hypothesize that sinceinvestors are diversified, the goal of the manager of a firm is not to maxi-mize shareholder value but to maximize the value of the shareholder’s port-
folio. Thus, when a public bidder acquires a public target, diversifiedshareholders will be indifferent to how the gains from the acquisition aredivided, assuming they own stock in both firms. The negative returns of thebidder are offset by the positive gains of the target. However, when a publicbidder acquires a private target, the bidder’s shareholders will capture partof the gains of the acquisition, assuming the bid is value increasing.
C. Method of Payment in Mergers and Acquisitions
One area of significant research that focuses on the determinants of bid-der returns is the choice between cash and stock as the method of payment.
Myers and Majluf ~1984! argue that a bidder firm will use stock as themedium of exchange if the board believes that its own shares are over-
valued. Since target shareholders know this, they are not inclined to accepta stock offer. Fishman ~1989!, Berkovitch and Narayanan ~1990!, and Eckbo,Giammarino, and Heinkel ~1990! expand on this idea and show that higher-
valued bidders will use cash or a higher propor tion of cash to signal their value to the market. However, if the bidder is uncertain about the target’s value, the bidder may not want to offer cash, since the target will only accepta cash offer greater than its true value and the bidder will have overpaid.
Hansen ~1987! and Eckbo and Thorburn ~2000! develop models that ad-
dress the issue of uncertainty in target valuation. They suggest that biddersmake stock offers in these cases since stock offers have a “contingency pric-ing effect” ~Hansen ~1987, p. 76!!. That is, the target is forced to share partof the risk if the bidder overpays when evaluating a stock offer. Thus, bid-ders should make cash offers when there is high uncertainty on their ownfirm’s value, and stock offers when there is high uncertainty on the target’s
value.Empirical research supports these theoretical hypotheses. For example,
Travlos ~1987!, Fishman ~1989!, Brown and Ryngaert ~1991!, and Martin~1996! all find that bidders making cash offers have greater abnormal re-
turns at the bid announcement than do those making stock offers. In addi-tion, Martin finds that stock offers are more likely to be used than cash if there is more uncertainty about the bidder.
D. Evidence on Multiple Bidders
Three papers are directly related to the focus of our study on multiplebidders. Schipper and Thompson ~1983! examine bidder returns for 55 firmsthat engage in acquisition programs from 1952 to 1968. They find positiveabnormal returns of 13 percent in the 12 months up to and including theannouncement of the acquisition program. However, they find little stock
price reaction to subsequent acquisition announcements. Asquith, Bruner,and Mullins ~1983! find that most bidding firms make multiple bids: 45 per-
What Do Returns to Acquiring Firms Tell Us? 1769

7/21/2019 What Do Returns to Acquiring Firms Tell Us
http://slidepdf.com/reader/full/what-do-returns-to-acquiring-firms-tell-us 8/32
cent of their sample made four or more subsequent bids throughout the 17-year sample period of their study ~1963 to 1979!. Unlike Schipper andThompson, Asquith et al. find bidder returns, in their sample of bids from
1969 to 1974, remain positive through the fourth bid and conclude that all of the benefits of a merger program are not capitalized in the announcement of the program. Malatesta and Thompson ~1985! use Schipper and Thompson’sdata to test a model of stock price reaction to partially anticipated events.They find significant bidder returns at the acquisition announcement evenby firms that had previously announced an acquisition program.
These earlier studies reveal that it is not uncommon for the same firm tomake multiple acquisitions. However, they rely on relatively small samplescompared to ours, and focus on much earlier time periods. Further, theSchipper and Thompson ~1983! results indicate that it is difficult to identify
the market’s perception of an individual acquisition when firms make mul-tiple bids as part of an announced acquisition program. Since the impact of the acquisitions is already impounded in the stock price, any finding of sig-nificant bidder abnormal returns at an acquisition announcement is note-worthy. The Asquith et al. ~1983! study indicates that in a carefully chosensample it is possible to identify the effects of subsequent merger announce-ments on bidders’ returns.
II. Data
We collect from Securities Data Corporation’s ~SDC! U.S. Mergers and Acquisitions ~M&A ! Database a list of successful mergers and tender offersfor foreign and domestic targets, with initial bids announced between Jan-uary 1, 1990 and December 31, 2000.6 To be included in the sample, thefollowing conditions must be satisfied:
1. The target is a public f irm, a private firm, or a subsidiary of a publicfirm.
2. The target f irm has a disclosed dollar value and the bidder is acquiring more than 50 percent of the target firm.
3. The deal value is one million dollars or more. Deal value is defined asthe total value of consideration paid by the acquirer, excluding fees andexpenses. The dollar value includes the amount paid for all common
6 For a random sample of 500 acquisitions in our sample, we verified the announcementdates listed on SDC. For 92.6 percent of the sample, the announcement date provided by SDCwas correct, in the other cases it was only off by two days at most. We do not check for con-founding events. However, even if we do not have the exact date ~which occurs rarely! or if thereis a random confounding event, it biases against f inding any significant returns for the acquir-ers in our sample. The problem we do not address, identified by Bhagat et al. ~2001!, is thatbidders can choose to announce the bid along with another positive announcement to make the
bid look better. This might be more likely for bids for private targets or subsidiaries than forpublic targets because there are less regulatory restrictions on the timing of those announce-ments than bids for public targets.
1770 The Journal of Finance

7/21/2019 What Do Returns to Acquiring Firms Tell Us
http://slidepdf.com/reader/full/what-do-returns-to-acquiring-firms-tell-us 9/32
stock, common stock equivalents, preferred stock, debt, options, assets,warrants, and stake purchases made within six months of the an-nouncement date of the transaction.
4. Acquiring firms are U.S. f irms publicly traded on the AMEX, Nasdaq,or NYSE and have five days of return data around the takeover an-nouncement listed on the Center for Research in Security Prices ~CRSP!
file.5. Neither the acquirer nor the target is a utility or a financial institution.6. The acquirer completes bids for f ive or more targets in any three-year
window during the sample period.
We exclude from the main analysis clustered takeovers where the bidderacquires two or more firms within five days, since we cannot isolate the
bidder’s return for a particular target. To avoid bid–ask bias in theannouncement-period abnormal returns, we exclude bids where the bidderstock price is below two dollars. Our final sample includes 539 unique ac-quirers making 3,135 bids.
Similar to Martin ~1996!, we group the method of payment into threecategories. ~1! Cash financing includes combinations of cash, debt, and liabil-ities. ~2! Financing with common stock includes payments with common stockor a combination of common stock and options or warrants. ~3! Combinationfinancing comprises combinations of common stock, cash, debt, preferredstock, convertible securities, and methods classified as “other” by SDC.
Table I reports the summary statistics for the firms making multiple ac-quisitions and their targets. Panels A, B, C, and D report the yearly meanand median bidder and target size for all bids, only public bids, only privatebids, and only subsidiary bids, respectively. The mean and median size foreach bidder and each target is reported in the year the bid was announced.The acquirer’s market capitalization equals the price per share one monthprior to the bid announcement times the number of common shares out-standing. For public targets the market capitalization equals the price pershare one month prior to the bid announcement times the number of com-mon shares outstanding, but for private and subsidiary targets, the marketcapitalization is assumed to be the value of the deal when announced. Thefinal row of each panel provides the mean and median size for each uniquebidder and target, counted only once. Thus, for the sample in Panel A, themean ~median! size of the bidder is 5.24 billion dollars ~534 million dollars!
for 539 unique bidders. Table I also shows a general trend in M&A activity—during the 1990s there was an increase in the number and size of acquisi-tions for private, public, and subsidiary targets.7
7 Holmstrom and Kaplan ~2001! argue that while both the 1980s and 1990s were periods of significant M&A activity, the type of M&A activity was different in the two periods. Significant
LBO and hostile activity characterized the 1980s while the 1990s bids were friendly and fi-nanced much more with equity. They suggest that by the 1990s, corporations had adopted thebeneficial features introduced in the 1980s by LBOs.
What Do Returns to Acquiring Firms Tell Us? 1771

7/21/2019 What Do Returns to Acquiring Firms Tell Us
http://slidepdf.com/reader/full/what-do-returns-to-acquiring-firms-tell-us 10/32
Panels B, C, and D differentiate transactions on the basis of whether the
target is public ~Panel B!, private ~Panel C!, or a subsidiary of a public firm~Panel D!. Note that a firm that bids for public, private, and0or subsidiary
Table I
Mean and Median Size of Acquirers and TargetsSample of bidders and targets where the bidder successfully acquired five or more targets
within a three-year period from 1990 to 2000. Targets are comprised of public, private, andsubsidiary f irms. For each of the following panels, a particular bidder is represented only onceper year, but may be represented multiple times over the 11-year period. The total row for thenumber of bidder firms represents the number of unique acquirers throughout the sampleperiod. All acquirers are publicly traded firms listed on the NYSE, Nasdaq, or AMEX. Targetsinclude both foreign and domestic firms. Panel A contains 539 unique bidders acquiring 3,135targets. Targets in Panel A are public, private, and subsidiary. Panels B, C, and D representpublic, private, and subsidiary deals, respectively. Panel B represents 261 unique bidders acquir-ing 456 public targets. Panel C contains 511 unique bidders acquiring 2,060 private targets.Panel D contains 324 unique bidders acquiring 619 subsidiary targets. Numbers are reported inmillions.
Bidder Target
Mean Median N Mean Median N
Panel A: All
1990 2,470 308 18 199 21 261991 2,063 508 40 98 25 601992 1,991 319 65 65 17 1071993 2,329 316 101 260 22 1671994 2,083 325 138 107 15 2701995 2,382 316 188 158 20 3521996 2,850 425 240 125 27 489
1997 4,310 506 277 165 25 5831998 6,811 714 253 344 31 5231999 11,518 948 173 614 42 3552000 16,639 2,756 88 637 71 204
Total 5,240 534 539 265 27 3,135
Panel B: Public
1990 2,119 2,119 1 459 459 11991 2,501 1,814 5 260 135 51992 1,097 778 10 215 150 111993 5,384 704 19 1,505 289 221994 4,182 1,322 31 428 157 38
1995 5,516 1,149 42 843 243 471996 5,121 1,530 58 505 148 721997 9,141 1,092 65 630 301 741998 7,932 1,384 77 1,566 197 941999 28,923 3,947 47 2,594 429 652000 21,523 6,320 24 3,254 465 27
Total 10,203 1,695 261 1,271 233 456
1772 The Journal of Finance

7/21/2019 What Do Returns to Acquiring Firms Tell Us
http://slidepdf.com/reader/full/what-do-returns-to-acquiring-firms-tell-us 11/32
targets will be included in the bidder data in several panels. For 456 uniquepublic targets, Panel B reports that the mean ~median! size is 1.271 billiondollars ~233 million dollars!. Panel C reports that the private target mean~median! size is much smaller than for public targets ~69 million dollars~18 million dollars! for 2,060 unique private targets!. Panel D shows that the619 unique subsidiary targets are also smaller than public targets ~mean~median! size of 177 million dollars ~38 million dollars!!.
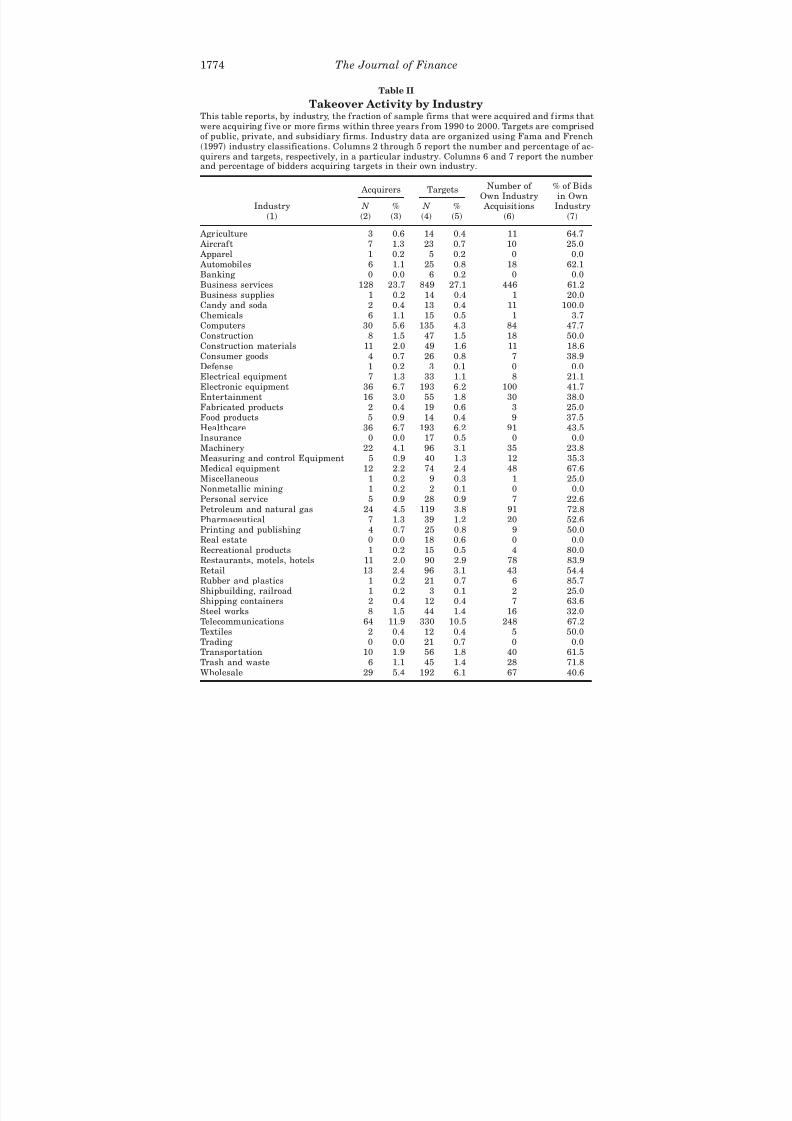
Table II presents takeover activity by industry using classifications fromFama and French ~1997!. We report by industry the number of firms making multiple bids, the percent of all multiple bids made by firms in that indus-try, the number of firms that are targets of a multiple bidders, and thepercent of all f irms in that industry that are targets of multiple bidders. The
last two columns of Table II report data on the number and percent of bidsoriginating in the bidders’ own industry. For some industries, the percent of
Table I —Continued
Bidder Target
Mean Median N Mean Median N
Panel C: Private
1990 594 149 13 194 11 191991 2,379 426 26 82 13 351992 1,254 277 50 41 12 751993 1,067 227 69 37 15 1011994 1,792 191 106 43 10 1781995 954 272 137 37 15 2321996 2,127 268 190 49 18 3251997 3,383 423 208 46 18 3871998 3,534 546 188 56 20 3391999 7,942 775 136 121 24 2242000 17,509 2,137 74 225 53 145
Total 3,905 440 511 69 18 2,060
Panel D: Subsidiary
1990 7,037 1,337 5 172 127 61991 1,766 1,141 16 84 27 201992 3,977 308 19 74 25 211993 2,803 485 35 150 34 431994 4,597 749 43 93 29 541995 2,983 379 64 102 27 73
1996 3,506 471 72 97 40 921997 5,490 562 95 259 33 1221998 10,163 857 73 154 52 901999 26,052 1,673 54 338 65 662000 23,372 2,848 27 300 63 32
Total 8,298 733 324 177 38 619
What Do Returns to Acquiring Firms Tell Us? 1773
7/21/2019 What Do Returns to Acquiring Firms Tell Us
http://slidepdf.com/reader/full/what-do-returns-to-acquiring-firms-tell-us 12/32
Table II
Takeover Activity by IndustryThis table reports, by industry, the f raction of sample firms that were acquired and f irms thatwere acquiring f ive or more firms within three years f rom 1990 to 2000. Targets are comprisedof public, private, and subsidiary firms. Industry data are organized using Fama and French~1997! industry classifications. Columns 2 through 5 report the number and percentage of ac-quirers and targets, respectively, in a particular industry. Columns 6 and 7 report the numberand percentage of bidders acquiring targets in their own industry.
Acquirers Targets
Industry~1!
N ~2!
%~3!
N ~4!
%~5!
Number of Own Industry Acquisitions
~6!
% of Bidsin Own
Industry~7!
Agriculture 3 0.6 14 0.4 11 64.7 Aircraf t 7 1.3 23 0.7 10 25.0 Apparel 1 0.2 5 0.2 0 0.0
Automobiles 6 1.1 25 0.8 18 62.1Banking 0 0.0 6 0.2 0 0.0Business services 128 23.7 849 27.1 446 61.2Business supplies 1 0.2 14 0.4 1 20.0Candy and soda 2 0.4 13 0.4 11 100.0Chemicals 6 1.1 15 0.5 1 3.7Computers 30 5.6 135 4.3 84 47.7Construction 8 1.5 47 1.5 18 50.0Construction materials 11 2.0 49 1.6 11 18.6Consumer goods 4 0.7 26 0.8 7 38.9Defense 1 0.2 3 0.1 0 0.0Electrical equipment 7 1.3 33 1.1 8 21.1Electronic equipment 36 6.7 193 6.2 100 41.7
Entertainment 16 3.0 55 1.8 30 38.0Fabricated products 2 0.4 19 0.6 3 25.0Food products 5 0.9 14 0.4 9 37.5Healthcare 36 6.7 193 6.2 91 43.5Insurance 0 0.0 17 0.5 0 0.0Machinery 22 4.1 96 3.1 35 23.8Measuring and control Equipment 5 0.9 40 1.3 12 35.3Medical equipment 12 2.2 74 2.4 48 67.6Miscellaneous 1 0.2 9 0.3 1 25.0Nonmetallic mining 1 0.2 2 0.1 0 0.0Personal service 5 0.9 28 0.9 7 22.6Petroleum and natural gas 24 4.5 119 3.8 91 72.8Pharmaceutical 7 1.3 39 1.2 20 52.6
Printing and publishing 4 0.7 25 0.8 9 50.0Real estate 0 0.0 18 0.6 0 0.0Recreational products 1 0.2 15 0.5 4 80.0Restaurants, motels, hotels 11 2.0 90 2.9 78 83.9Retail 13 2.4 96 3.1 43 54.4Rubber and plastics 1 0.2 21 0.7 6 85.7Shipbuilding, railroad 1 0.2 3 0.1 2 25.0Shipping containers 2 0.4 12 0.4 7 63.6Steel works 8 1.5 44 1.4 16 32.0Telecommunications 64 11.9 330 10.5 248 67.2Textiles 2 0.4 12 0.4 5 50.0Trading 0 0.0 21 0.7 0 0.0Transportation 10 1.9 56 1.8 40 61.5
Trash and waste 6 1.1 45 1.4 28 71.8Wholesale 29 5.4 192 6.1 67 40.6
1774 The Journal of Finance

7/21/2019 What Do Returns to Acquiring Firms Tell Us
http://slidepdf.com/reader/full/what-do-returns-to-acquiring-firms-tell-us 13/32
own-industry bids is very high ~e.g., Candy and Soda: 100 percent, Petro-leum and Natural Gas: 72.8 percent, Telecommunications: 67.2 percent!, whilein other industries it is much lower ~e.g., Aircraft: 25 percent, Machinery:
23.8 percent!.We follow Brown and Warner’s ~1985! standard event study methodology
to calculate CARs for the five-day period ~2, 2! around the announcementdate supplied by SDC. We estimate the abnormal returns using a modifiedmarket model:
ARi ri rm ~1!
where ri is the return on firm i and rm is the value-weighted market index
return. We do not estimate market parameters based on a time period beforeeach bid, since for frequent acquirers, there is a high probability that pre-
vious takeover attempts would be included in the estimation period, thusmaking beta estimations less meaningful. Additionally, it has been shownthat for short-window event studies, weighting the market return by thefirm’s beta does not significantly improve estimation.8
III. Results
A. Abnormal Returns by Target Type and Method of Payment
Tables III, IV, V, and VI report the five-day cumulative abnormal returns~CARs! to multiple bidders classified by type of target and method of pay-ment. In Table III, Panel A, we report the CARs for the full sample of bidders.For all bids, the CAR is a statistically significant positive 1.77 percent. How-ever, when we differentiate the returns on the basis of whether the targetwas public or nonpublic, we find that the CAR is a significantly negative1.00 percent for public targets, significantly positive 2.08 percent for privatetargets, and significantly positive 2.75 percent for subsidiaries.9 If the targetis public, bidder returns are insignificant if the bid is made with cash or a
combination but a negative and significant
1.86 percent if the bid is madewith stock. The CARs are positive and significant for the private targetsample regardless of the method of payment used: cash ~1.62 percent!, com-mon stock ~2.43 percent!, or combination ~2.48 percent!. The market also
views acquisitions of subsidiaries as good regardless of the method of pay-
8 See Brown and Warner ~1980! for comparison of the market model with the market-and-risk-adjusted model.
9 We do not examine the public targets to see how long they have been public and whetherthat makes a difference in the bidder returns. However, Field and Mulherin ~1999! show that
acquisition terms and target returns are similar across samples of recently public firms andmore established firms. Our work complements theirs, because our private targets choose to beacquired without going public first.
What Do Returns to Acquiring Firms Tell Us? 1775

7/21/2019 What Do Returns to Acquiring Firms Tell Us
http://slidepdf.com/reader/full/what-do-returns-to-acquiring-firms-tell-us 14/32
Table III
Cumulative Abnormal Returns of Frequent AcquirersCumulative abnormal returns for bidders that acquired five or more public, private, or subsid-
iary targets during a three-year period between 1990 and 2000. Cumulative abnormal returnsare calculated for the five days ~2, 2! around the announcement ~day 0! of a takeover. Abnor-mal returns are estimated using a modified market model:
ARi ri rm
where ri is the return on firm i and rm is the value-weighted market index return. The usualestimation period is eliminated due to the high probability of confounding events for biddersacquiring five or more targets within three years. All acquirers are publicly traded firms listedon the NYSE, Nasdaq, or AMEX with a stock price of two dollars or greater in the month of thetakeover announcement. Results in Panel A are all bids for public, private, and subsidiarytargets. Panels B and C are subsamples of Panel A; they contain f irst bids and f ifth and higherbids, respectively. The results for each panel are divided further by the method of payment.Cash offers include cash only and mixtures of cash and debt. Stock offers include common stockonly or a combination of common stock and options, warrants, or rights. Combination deals arecomprised of some proportion of cash and stock. The median is in brackets and the number of bids is reported below the median.
All Cash Stock Combo
Panel A: All Bids
All multiple acquirers 1.77%a 1.78%a 1.25%a 2.20%a
@1.07%# @1.12%# @0.77%# @1.24%#
3,135 1,530 763 842
Public targets 1.00%b 0.34% 1.86%b 1.10%@0.71%# @0.53%# @1.28%# @1.63%#
456 146 218 92
Private targets 2.08%a 1.62%a 2.43%a 2.48%a
@1.29%# @0.90%# @1.54%# @1.81%#
2,060 920 506 634
Subsidiary targets 2.75%a 2.56%a 3.23% 3.33%a
@1.72%# @1.62%# @4.27%# @2.26%#
619 464 39 116
Panel B: 1st Bids—Within 3-Year Constraint
All multiple acquirers 2.74%a 2.20%a 2.15%c 4.24%a
@1.54%# @1.28%# @0.95%# @2.88%#
471 222 120 129
Public targets 0.88% 0.69% 1.74% 0.23%
@0.44%# @0.74%# @0.35%# @0.01%#
65 27 24 14
Private targets 3.22%a 1.95%a 3.05%b 4.93%a
@1.74%# @1.32%# @1.36%# @3.42%#
309 122 87 100
Subsidiary targets 3.64%a 3.68%a 3.78% 3.36%b
@2.42%# @1.85%# @1.30%# @2.91%#97 73 9 15
1776 The Journal of Finance

7/21/2019 What Do Returns to Acquiring Firms Tell Us
http://slidepdf.com/reader/full/what-do-returns-to-acquiring-firms-tell-us 15/32
ment: a positive and significant CAR of 2.56 percent, 3.23 percent, and 3.33percent for cash, stock, and combination offers, respectively. Interestingly,
subsidiary targets offer acquiring firms the largest abnormal returns.10In Panels B and C of Table III we report the CARs for the first bid and the
fifth and higher bids. We assume that the bidder returns on the fifth andhigher bids will contain relatively less information about the bidder than thefirst bid, since the market has learned about the bidder, and correspondinglycontain relatively more information about the synergies and division of gainsin the deal than earlier bids. The results suggest that the market reaction tothe fifth and higher bid is different than the reaction to the first bid. Thereis no significant stock price reaction to the first bid for public targets, nomatter the method of payment, although the sample sizes are so small it is
difficult to read much into these results. The CAR for the fifth and higherbids for public targets is negative and significant ~1.73 percent!. Publictargets acquired with stock ~2.62 percent! drive this negative return. Thisgreater negative return for later offers made with stock is possibly due tothe dilution of ownership from offers made for large public firms. Anotherreason, discussed below for bids for private f irms, is that after making manyquick acquisitions, bidders negotiate less efficiently and create less synergyin later deals.
10 Note that approximately half the acquisitions are made with cash. Thus, especially when
one includes private targets and subsidiaries, the comment of Andrade et al. ~2001, p. 107! that“the pictures of mergers in the 1990s that emerges is one where merging parties, often inclosely related industries, negotiate a friendly stock swap,” is not consistent with our data.
Table III —Continued
All Cash Stock Combo
Panel C: 5th and Higher Bids
All multiple acquirers 0.52%c 0.87%a0.25% 0.53%
@0.24%# @0.57%# @0.11%# @0.38%#
1,299 659 313 327
Public targets 1.73%b0.38% 2.62%c
1.51%
@1.52%# @0.31%# @1.79%# @2.29%#
194 56 95 43
Private targets 0.72%b 0.54% 0.89% 0.87%
@0.24%# @0.20%# @0.65%# @0.10%#
856 411 206 239
Subsidiary targets 1.57%a 1.94%a 1.02% 0.68%@1.43%# @1.64%# @1.23%# @0.11%#
249 192 12 45
a Denotes significance at 1% level.b Denotes significance at 5% level.c Denotes significance at 10% level.
What Do Returns to Acquiring Firms Tell Us? 1777

7/21/2019 What Do Returns to Acquiring Firms Tell Us
http://slidepdf.com/reader/full/what-do-returns-to-acquiring-firms-tell-us 16/32
Table IV
Cumulative Abnormal Returns of Frequent AcquireThis table describes the cumulative abnormal returns of a bidder acquiring a subsidiary from a portion of the table, or nondiversified, represented on the right side of the table. A diversified pa
code is different from that of the subsidiary company. CARs are calculated for the five daystakeover. Abnormal returns are estimated using a modified market model:
ARi ri rm ,
where ri is the return on firm i and rm is the value-weighted market index return. The usualprobability of confounding events for bidders acquiring five or more targets within three yearsthe NYSE, Nasdaq, or AMEX with a stock price of two dollars or greater in the month of the takare divided further by the method of payment. Cash offers include cash only and mixtures of caonly or a combination of common stock and options, warrants, or rights. Combination deals areThe median is in brackets and the number of bids is reported below the median.
Diversified Parent
All Cash Stock Combo Al
All bids 2.93%a 2.90%a 3.48% 2.86%a [email protected]%# @1.62%# @2.85%# @2.11%# @1.79
419 317 25 77 20
1st bids 3.64%a 3.42%a 4.39% 4.36%b [email protected]%# @1.11%# @2.11%# @4.30%# @3.09
66 51 5 10 3
5th and higher bids 1.95%a 2.45%a,* 1.93% 0.46% [email protected]%# @1.92%# @4.26%# @0.25%# @1.16
163 128 9 26 8
* The diversified sample is significantly different from the nondiversified sample ~10%!.a Denotes significance at 1% level.b Denotes significance at 5% level.c Denotes significance at 10% level.
7/21/2019 What Do Returns to Acquiring Firms Tell Us
http://slidepdf.com/reader/full/what-do-returns-to-acquiring-firms-tell-us 17/32
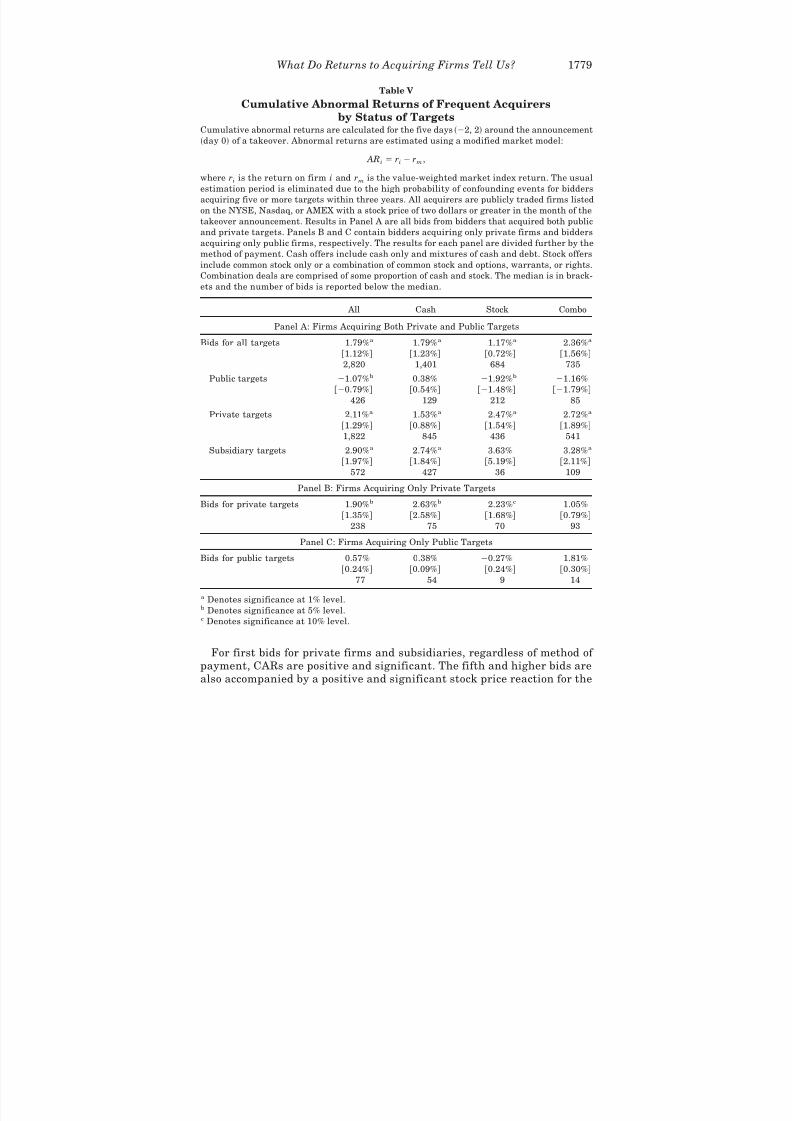
For first bids for private firms and subsidiaries, regardless of method of
payment, CARs are positive and significant. The fifth and higher bids arealso accompanied by a positive and significant stock price reaction for the
Table V
Cumulative Abnormal Returns of Frequent Acquirers
by Status of Targets
Cumulative abnormal returns are calculated for the five days ~
2, 2! around the announcement~day 0! of a takeover. Abnormal returns are estimated using a modified market model:
ARi ri rm ,
where ri is the return on firm i and rm is the value-weighted market index return. The usualestimation period is eliminated due to the high probability of confounding events for biddersacquiring five or more targets within three years. All acquirers are publicly traded firms listedon the NYSE, Nasdaq, or AMEX with a stock price of two dollars or greater in the month of thetakeover announcement. Results in Panel A are all bids from bidders that acquired both publicand private targets. Panels B and C contain bidders acquiring only private firms and biddersacquiring only public firms, respectively. The results for each panel are divided further by themethod of payment. Cash offers include cash only and mixtures of cash and debt. Stock offers
include common stock only or a combination of common stock and options, warrants, or rights.Combination deals are comprised of some proportion of cash and stock. The median is in brack-ets and the number of bids is reported below the median.
All Cash Stock Combo
Panel A: Firms Acquiring Both Private and Public Targets
Bids for all targets 1.79%a 1.79%a 1.17%a 2.36%a
@1.12%# @1.23%# @0.72%# @1.56%#
2,820 1,401 684 735
Public targets 1.07%b 0.38% 1.92%b1.16%
@0.79%# @0.54%# @1.48%# @1.79%#
426 129 212 85
Private targets 2.11%a 1.53%a 2.47%a 2.72%a
@1.29%# @0.88%# @1.54%# @1.89%#
1,822 845 436 541
Subsidiary targets 2.90%a 2.74%a 3.63% 3.28%a
@1.97%# @1.84%# @5.19%# @2.11%#
572 427 36 109
Panel B: Firms Acquiring Only Private Targets
Bids for private targets 1.90%b 2.63%b 2.23%c 1.05%@1.35%# @2.58%# @1.68%# @0.79%#
238 75 70 93Panel C: Firms Acquiring Only Public Targets
Bids for public targets 0.57% 0.38% 0.27% 1.81%@0.24%# @0.09%# @0.24%# @0.30%#
77 54 9 14
a Denotes significance at 1% level.b Denotes significance at 5% level.c Denotes significance at 10% level.
What Do Returns to Acquiring Firms Tell Us? 1779

7/21/2019 What Do Returns to Acquiring Firms Tell Us
http://slidepdf.com/reader/full/what-do-returns-to-acquiring-firms-tell-us 18/32
Table VI
Cumulative Abnormal Returns of Frequent Bidders
by the Relative Size of the Target
Cumulative abnormal returns are calculated for the five days ~
2, 2! around the announcement~day 0! of a takeover. Abnormal returns are estimated using a modified market model:
ARi ri rm ,
where ri is the return on firm i and rm is the value-weighted market index return. The esti-mation period is eliminated due to the probability of confounding events for bidders acquiring five or more targets within three years. The relative size of the target is target value divided byacquirer market value. Acquirer market value is calculated as of the month before the an-nouncement date and is the product of the monthly price and common shares outstanding onCRSP. Cash offers include cash only and mixtures of cash and debt. Stock offers include com-mon stock only or a combination of common stock and options, warrants, or rights. Combination
deals are comprised of some proportion of cash and stock. Panel A represents all bids whilePanels B to D represent public, private, and subsidiary, respectively. The median is in bracketsand the number of bids is below the median.
All Cash Stock Combo
Panel A: All
,5% 1.04%a 0.84%a 1.31%a 1.26%b
@0.55%# @0.39%# @1.06%# @0.71%#
1,573 875 384 314
5%–9.99% 2.02%a 1.86%a 1.94%b 2.37%a
@1.61%# @1.35%# @1.59%# @1.96%#528 249 129 150
10%–19.99% 2.12%a 2.71%a 1.68% 1.64%b
@1.40%# @1.96%# @0.52%# @0.70%#
463 206 102 155
20% 3.23%a 4.86%a 0.17% 3.81%a
@2.14%# @4.18%# @0.97%# @2.47%#
571 200 148 223
Panel B: Public
,5% 0.62%
0.15% 1.93%b
0.03%@0.05%# @0.38%# @0.69%# @0.94%#
138 75 50 13
5%–9.99% 0.13% 1.21% 2.11% 2.25%
@1.93%# @1.87%# @2.18%# @1.49%#
56 23 25 8
10%–19.99% 0.97% 3.28%a2.81%c
1.59%
@1.31%# @1.83%# @4.56%# @2.87%#
76 21 45 10
20% 2.56%a 0.74% 4.37%a1.10%
@2.03%# @1.14%# @2.64%# @2.18%#186 27 98 61
1780 The Journal of Finance

7/21/2019 What Do Returns to Acquiring Firms Tell Us
http://slidepdf.com/reader/full/what-do-returns-to-acquiring-firms-tell-us 19/32
full samples of private targets and subsidiary targets. However, the magni-tude of the positive reaction is less for the later bids and is insignificantwhen the private target sample is separated by method of payment.
Possible explanations for these results for the later bids for private firmsand subsidiaries are that bidders do not receive as favorable a price whenthey acquire multiple private firms and subsidiaries in a short period of
time or bidders making multiple acquisitions in a concentrated period of timeare making acquisitions that create relatively small amount of synergies.
Table VI —Continued
All Cash Stock Combo
Panel C: Private
,5% 1.03%a 0.76%b 1.26%b 1.32%b
@0.49%# @0.25%# @1.14%# @0.79%#
1,120 541 319 260
5%–9.99% 2.08%a 1.88%a 1.50% 2.79%a
@1.16%# @0.47%# @0.95%# @1.99%#
371 150 98 123
10%-19.99% 2.69%a 3.07%a 4.34%a 1.70%c
@1.68%# @2.23%# @2.44%# @1.15%#
297 121 49 127
20% 5.75%a 3.96%a 11.72%a 5.39%a
@4.35%# @3.50%# @7.89%# @4.04%#
272 108 40 124
Panel D: Subsidiary
,5% 1.26%a 1.31%a 0.35% 1.28%
@0.88%# @0.87%# @1.30%# @1.07%#
315 259 15 41
5%–9.99% 2.87%a 2.74%a 8.44%c 1.63%
@2.00%# @1.77%# @5.73%# @4.53%#
101 76 6 19
10%–19.99% 2.84%a 1.83%b 10.67%b 2.97%
@2.51%# @1.90%# @10.35%# @1.26%#
90 64 8 18
20% 6.71%a 8.07%a1.52% 6.55%a
@5.81%# @5.71%# @0.65%# @6.13%#
113 65 10 38
a Denotes significance at 1% level.b Denotes significance at 5% level.c
Denotes significance at 10% level.
What Do Returns to Acquiring Firms Tell Us? 1781

7/21/2019 What Do Returns to Acquiring Firms Tell Us
http://slidepdf.com/reader/full/what-do-returns-to-acquiring-firms-tell-us 20/32
We test these ideas by examining a sample of clustered private bids ~two ormore bids for private firms made on the same day!.11 The five-day CARs forall bids ~292 bids! for clustered private targets is a significant 2.77 percent,
an insignificant 0.40 percent for 122 cash bids, a significant 3.85 percent for89 stock bids, and a significant 5.15 percent for 81 combination bids. Sincethese targets are of similar size to those in the our original sample and thereare two or more targets acquired on the same day, these CARs are smaller inmagnitude on a per bid basis than if only one private firm were acquired onthat day. This is supportive of the theory that bidders do not do as well, peracquisition, either because they pay too much or create less synergy whenthey buy multiple private firms in a short period of time.
Another factor that may be related to the returns for later bids is the riseof Internet firms in the later part of our sample. Since many bids during the
later 1990s involved Internet firms and more of the fifth and higher bidswould be during the later 1990s, these results may be driven by Internetdeals. We examine acquirer returns for all bids made in 1998 and 1999 andfor all bids made in 1998 and 1999 not involving Internet firms ~either thebidder or target is an Internet firm!. We choose 1998 and 1999 because theyare at the end of the sample and thus contain more of the fifth and higherbids, they are years with a major increase in the number and size of deals,and they are the years with the influx of Internet deals. We do not reportthese results, but the pattern of returns is similar to that for all bids re-ported in Table III. In fact, for non-Internet deals the CARs are slightly less,
though not significantly, than for all deals in 1998 and 1999. As shown in Table III, the market views acquisitions of private firms andsubsidiaries differently from acquisitions of public firms. We continue toexplore the causes and the implications of this difference.
B. Further Evidence on Subsidiary Acquisitions
In Table IV we examine the subsidiary deals in greater detail. One reasonsuggested for why a firm sells a subsidiary is the gain from increased focus.This implies that diversified firms might accept a relatively lower price foran asset sale than a nondiversified firm—a diversification discount. Table IV divides our sample of subsidiary targets based on whether their selling parentwas diversified or not. We find that the returns to acquirers buying subsid-iaries from diversified or nondiversified parents are relatively similar for allbids and first bids. However, for fifth bids and higher, only acquisitionsmade using cash for a diversified parent’s subsidiary provide the bidder withsignificantly positive abnormal returns, 2.45 percent. Thus, there is weakevidence that diversified parents will sell subsidiaries at a discount relativeto nondiversified parents.
11
Note that these bids are not in our main sample. However, the average size of these bids~and the target’s relative size compared to the bidder! is essentially the same as in the fullsample.
1782 The Journal of Finance

7/21/2019 What Do Returns to Acquiring Firms Tell Us
http://slidepdf.com/reader/full/what-do-returns-to-acquiring-firms-tell-us 21/32
C. Bidders Acquiring Both Public and Private Targets
Our results indicate that the market views bids for private firms andsubsidiaries differently from those for public firms. We suggest that this isdue to either a difference in the synergies between takeovers of public, pri-
vate, and subsidiary targets or in the division of gains from the bid. Anotherpossibility is that these results are due to differences in the characteristicsof bidders for public and private targets. Thus, we examine the returns toacquirers separated by whether they made bids for only public targets, onlyprivate targets, or for both nonpublic and public targets. Table V, Panel A,reports the returns to bidders that purchased public, private, and subsidiarytargets. These results are essentially the same as for the sample in Table III.
As before, the average CARs for bidders are zero or significantly negative if the target is a public firm but significantly positive if the target is a private
firm or a subsidiary. This suggests that it is the characteristics of the targetfirm and its potential relationship with the bidding firm rather than thebidding firm itself that determine these results.
To further confirm this result, we examine acquirers that made five ormore bids for only public or only private firms. These results are reported inPanels B and C of Table V. The CARs to a bidder that only acquired privatefirms ~Panel B! are positive and significant regardless of the offer type.These CARs are similar to the CARs that a bidder receives if it acquires aprivate target even if it also acquires a public target at some other point~Panel A !. However, the returns to acquirers purchasing only public firms
~Panel C! are insignificant for all offer types, even for stock bids ~althoughthere are only nine!. Note that there are 24 bidders that made bids for onlypublic targets and 76 bidders that made bids for only private targets, but439 acquirers that made bids for private, public, and subsidiary targets.Thus, most acquirers in our sample purchase both public and nonpublic targets.
In sum, the evidence in Table V shows that one of our major results—themarket reaction to the acquisition of nonpublic targets, with both stock andcash as methods of payment, is positive, while the market reaction to theacquisition of public targets is at most zero—occurs among multiple bidderswho bid for public targets only, private targets only, or both public and non-
public targets. Thus, the market will give positive and negative reactions tothe same bidder, depending on the type of target even after controlling forthe method of payment.
D. Impact of Relative Size on Acquirer Returns
In Table VI we control for target size. Since private targets are, on aver-age, much smaller than public targets, we expect the impact on the bidder of a private acquisition to be smaller than a public acquisition. Thus, to bettercompare public and private takeovers, we control for the effect of target sizeon bidder returns by partitioning bidder returns by the relative size of the
target. The relative size of the target is measured as the target market ~deal! value divided by bidder market value.
What Do Returns to Acquiring Firms Tell Us? 1783

7/21/2019 What Do Returns to Acquiring Firms Tell Us
http://slidepdf.com/reader/full/what-do-returns-to-acquiring-firms-tell-us 22/32
We identify several patterns in the CARs. First, for public targets ~PanelB!, the larger the target relative to the bidder, the more negative the ac-quirer’s CAR. Once again, this negative return is driven by stock offers to
public targets. In contrast, for private targets and subsidiaries ~Panels Cand D!, the CARs become more positive as the target size increases. Inter-estingly, the empirical finding of greater abnormal returns for larger privatetargets is similar to what Asquith et al. ~1983! found for bids for publictargets in the 1970s. However, unlike public targets, as the relative sizeincreases, bidders that acquire private targets with stock have larger CARsthan bidders acquiring private targets with cash. This pattern of higherreturns for stock offers than cash offers does not hold for subsidiary targets.
E. Causes for the Patterns of Acquirer Returns
There are several possible explanations for the negative CARs for largepublic firms. The larger the target is relative to the bidder, the stronger thetarget’s negotiating position and ability to extract more of the gain from thetransaction. Alternatively, bidding firms may find it more difficult to inte-grate larger public targets into their business. However, neither of theseexplanations clarifies the different relationship between the returns to bid-ders and the relative size of the target for bids for private targets and bidsfor public targets. A third explanation is that there are fundamental differ-ences in the division of gains and0or synergies between takeovers involving
public and private targets, and these differences are magnified the greaterthe relative size of the merger. We believe this is partially a liquidity effect.Private firms and subsidiaries cannot be bought and sold as easily as
publicly traded firms. The lack of liquidity makes these investments lessattractive and thus less valuable than similar, more liquid investments. Salesof public targets are typically auction-like in nature, with full disclosurerequired by the SEC. Professional arbitrageurs take positions in both targetand bidder stocks, thus, providing more market feedback in the prices of both securities. In contrast, the sales process can vary substantially for pri-
vate targets. At best, if the targets have a financial advisor, they can pro-mote an auction-like atmosphere, with participation by a large number of qualified bidders. More realistic scenarios include limited auctions or a smallnumber of interested bidders in a negotiated sale. The bidders are likely tohave a bargaining advantage, at least relative to their position in bids forpublic targets. In practice, this liquidity discount is readily observable. Anexcerpt from an Allen & Company valuation of a private firm ~Impac Hotel!
being acquired by a public firm ~Servico Inc.! states, “In calculating the pri- vate market valuation above, Allen & Company utilized a 20% private mar-ket ~liquidity! discount.” ~Servico Inc., ~1998, p. 46.!!
Regulation also favors public targets more in the bidding process than aprivate target. For example, the disclosure and delay requirements of the
Williams Act only apply to public targets, not private or subsidiary targets.State antitakeover laws ~and firm takeover defenses! only come into play
1784 The Journal of Finance

7/21/2019 What Do Returns to Acquiring Firms Tell Us
http://slidepdf.com/reader/full/what-do-returns-to-acquiring-firms-tell-us 23/32
when the management of the target wants to resist a takeover, which, bydefinition, will not happen for a private firm that is for sale. Although aprivate target has the perfect defense against a bid ~do not sell!, personal
pressure is also often higher for managers of private firms than for manag-ers of public firms. Private target management might be the firm founderswho, due to competitive conditions or their desire to cash out, want to sell.Therefore, private managers may not have an effective bargaining position.
Due to the nature of the acquisition process and regulation, the acquirercaptures this discount in purchasing the privately held firm or the subsid-iary. The liquidity effect is consistent with a positive relationship betweenrelative size and returns to acquirers of private and subsidiary targets, andnegative relationship between relative size and returns to acquirers of pub-lic targets. In support of this evidence, Koeplin, Sarin, and Shapiro ~2000!
find that private companies sell for a statistically and economically signif-icant discount compared to public companies using multiples of financialratios to value the firm. However, liquidity alone cannot explain why as therelative size of the merger increases, so does the disparity in returns be-tween cash and stock bids for private targets.
The higher abnormal returns for stock offers relative to cash offers forprivate firms may be explained by the creation of a blockholder and favor-able tax implications for private-firm owners. By definition, private firmsare closely held. Poulsen and Stegemoller ~2002! find that the average di-rector and officer holdings for private firms undergoing a buyout by a public
company are over 58 percent. In addition, more than 35 percent of privatefirms in a buyout have a single shareholder with greater than 50 percentownership. Thus, as the size of the private target increases, so does thelikelihood of blockholder formation when stock is the method of payment.Our f indings are consistent with blockholders becoming monitors of the bid-der’s management. This monitoring role increases the correlation betweenthe manager and owner interests, thus increasing value. The shareholders,including the private target’s owners, will garner this increase in value. There-fore, bidders using stock rather than cash to acquire private targets willreceive higher returns. This also explains why subsidiary targets, which arealso not publicly traded, do not garner significantly higher bidder returnswhen the offer is stock rather than cash. Since subsidiaries are owned bypublic companies, which have a more diverse ownership, there will be adecreased probability of blockholder creation when a subsidiary is acquiredwith stock.
Further, when a privately held firm is acquired with cash, the private-firm owners are faced with immediate tax implications. However, when private-firm owners are given stock in exchange for their ownership rights, the taximplications are deferred indefinitely. This tax deferral option is valuable toowners; thus they are willing to accept a discounted price for the firm equalto, at most, the value of the option. In support of this reasoning, Poulsen and
Stegemoller ~2002! observe that 36 percent of private target owners list favor-able tax consequences as a reason for selling out to a public company.
What Do Returns to Acquiring Firms Tell Us? 1785

7/21/2019 What Do Returns to Acquiring Firms Tell Us
http://slidepdf.com/reader/full/what-do-returns-to-acquiring-firms-tell-us 24/32
F. Regression Analysis
The previous results analyze returns to acquirers using univariate com-
parisons. In this section, we perform multivariate tests on the determinantsof acquirer’s returns. In Table VII, we present the results of regressing thebidder’s CARs on factors that may impact CARs. As with all regressions thatexplain returns to acquiring firms, because of the low explanatory power of the regression, the results must be viewed with skepticism, although the
F -statistic for the equation is positive and significant. Since our results sug-gest that there are fundamental differences between private, public, andsubsidiary targets, we run regressions for these three groups separately.Note, however, that there is overlap between the bidders in the three re-gressions, since bidders made all three types of acquisitions.
We estimate bidder returns as a function of several bid characteristics,including whether the target is acquired with stock, with a combination of stock and cash, and interaction variables between the method of paymentand the relative size of the target. Other variables include the log of relativesize of the target, the log of the target’s size, and dummy variables to indi-cate if the target and the bidder are in the same industry, if the bid is thefirst bid, if the bid is a fifth or higher bid, if the target is foreign, if the dealinvolves an Internet firm, and if the subsidiary is from a diversified parent.
Each of the explanatory variables has been suggested by theory as a de-terminant of the market’s perception of an acquisition. The relative size of
the target proxies for several effects. At a basic level, the larger the targetrelative to the bidder, the greater the effect of the acquisition on the bidder,and the more likely a greater market reaction. We interact the method of payment with the relative size variable to capture the interaction betweenthe relative importance of the acquisition and any information conveyed bythe bidder’s method-of-payment choice. Dummy variables are included forwhether the bid was a first bid or a fifth and higher bid to capture theresults of the univariate tests that show fifth and higher bids may containless information about the bidder than the first bids. The foreign dummyaccounts for the potential that bids for foreign targets are different thanbids for U.S. targets. The dummy variable for whether the bidder or thetarget was an Internet firm is included though the theory is unclear on howthe presence of an Internet firm in a deal would affect the bidder return.Finally, we account for industry effects by including dummy variables foreight Census Bureau’s grouping of SIC codes.
In general, the results are similar to what we have found with the uni- variate analysis. For private firms, the coeff icients on common stock deal,the interaction between stock and relative size, and relative size variablesare positive and significant. This suggests the CARs associated with stockdeals are more positive than those associated with cash deals in acquisitionsof private firms, and that the market views larger deals even more favor-
ably. The coefficient on the dummy variable for the fifth and higher bid isnegative and significant. This suggests that as the number of bids increases,
1786 The Journal of Finance

7/21/2019 What Do Returns to Acquiring Firms Tell Us
http://slidepdf.com/reader/full/what-do-returns-to-acquiring-firms-tell-us 25/32
the acquirer will have lower CARs. Further, bids for foreign private firms
have a negative and significant impact on CARs. The coefficients of theservice, retail, and natural resources industry dummies are positive and sig-
Table VII
Ordinary Least Squares Regression Analyses of Cumulative
Abnormal Returns of Frequent Bidders
Ordinary least squares regression of the bidder’s five-day cumulative abnormal return on thefollowing variables. The first two dummy variables are defined as whether the target is acquiredwith stock and whether the target is acquired with a combination of stock and cash. Cash offersinclude cash only and mixtures of cash and debt. Stock offers include common stock only or acombination of common stock and options, warrants, or rights. Combination deals are com-prised of some proportion of cash and stock. The remainder of the dummy variables are definedas whether the bid is the fist bid, whether the bid is the fifth or higher bid, whether the targetis foreign, whether the bidder or target is a technology f irm, whether the bidder and target arein the same industry, and whether the subsidiary is from a diversified firm. A subsidiary isclassified as being sold by a diversified firm if the subsidiary’s parent firm is in a differentthree-digit SIC code from that of the subsidiary. The log of the relative size of the target andthe log of the target’s size are also included in the regression. The relative size of the target
is the natural log of target deal value, as reported by SDC, divided by acquirer market value asof the month before the announcement date. Finally, interaction variables of the relative sizewith stock or combination are included. Technology firm classifications are taken from SDC. Anindustry measure is taken from the Census Bureau’s grouping of SIC codes yielding eightindustry classifications. Seven of these are used as dummies in the regression but are notreported in the results. P-values are reported in brackets next to the parameter estimates.
Dependent Variables Public Private Subsidiary
Intercept 0.038 @0.182# 0.042 @0.001# 0.085 @0.000#
Dummy 1 if target is acquiredwith common stock
0.061 @0.005# 0.043 @0.007# 0.041 @0.180#
Dummy 1 if target is acquired
with combo
0.019 @0.397# 0.009 @0.460# 0.005 @0.766#
Dummy 1 if first bid 0.007 @0.627# 0.003 @0.685# 0.005 @0.629#
Dummy 1 if fifth or higher bid 0.013 @0.181# 0.019 @0.000# 0.020 @0.008#
Dummy 1 if target is foreig n 0.016 @0.255# 0.012 @0.062# 0.007 @0.450#
Dummy 1 if bidder or targetis a tech firm
0.009 @0.451# 0.004 @0.431# 0.003 @0.732#
Dummy 1 if target and bidderare in same industry
0.000 @0.967# 0.004 @0.358# 0.004 @0.610#
Dummy 1 if subsidiary is froma diversified firm
0.004 @0.595#
Log of relative size 0.005 @0.401# 0.007 @0.010# 0.017 @0.000#
Log of target size 0.004 @0.162# 0.001 @0.442# 0.001 @0.692#
Interaction variable relative size * stock
0.023 @0.002# 0.011 @0.012# 0.014 @0.169#
Interaction variable relative size * combo
0.005 @0.563# 0.003 @0.513# 0.001 @0.908#
F -statistic 2.21 @0.003# 5.14 @0.000# 3.60 @0.000#
N 456 2,060 619
Adjusted R2 4.6% 3.5% 7.4%
What Do Returns to Acquiring Firms Tell Us? 1787

7/21/2019 What Do Returns to Acquiring Firms Tell Us
http://slidepdf.com/reader/full/what-do-returns-to-acquiring-firms-tell-us 26/32
nificant. Finally, the coefficient on the Internet deal dummy, the first biddummy, and same industry dummy are all insignificant.
There are fewer variables that have significant coefficients in the sample
of acquisitions of public firms or subsidiaries. For public firms, the onlyexplanatory variables with significant coefficients are the dummy for whetherthe acquisition is with stock and for the interaction variable for relative sizeand stock. Similar to the univariate results, the larger the relative size of the target for the public firms, the greater the negative abnormal returns tothe bidder who makes a stock offer. All other variables are insignificant. Forsubsidiaries, the only significant variables are the relative size of the targetand the dummy for the fifth and higher bid.
G. Method of Payment Analysis for Firms Making Several
Acquisition within Three Months
Much of the method-of-payment literature hypothesizes that a bidder willoffer its stock in payment when its stock is overvalued and cash when itsstock is undervalued or correctly valued. This leads to the empirical predictionthat bidders making stock offers will have negative price reactions to mergerannouncements and those making cash offers will have positive or zero pricereactions. Results reported in Tables III, V, and VI support this prediction forpublic firms. However, we f ind that for private and subsidiary targets, acquir-ers have significant and positive abnormal returns even when using their own
stock for the acquisition. An additional consideration, noted by Hansen ~1987!,suggests that if there is uncertainty about the target’s value, the bidder maychoose to use stock even if its own stock is correctly valued. In a stock offer, thetarget shareholders share in any future gains or losses from the transaction.Since it is more difficult to value private firms and subsidiaries, bidders maybe more likely to offer stock resulting in more positive abnormal returns thanif they had used cash. Our results are consistent with this prediction.
Our sample of acquirers making five or more bids within a three-yearperiod allows an alternative examination of the method-of-payment choice.While we do not directly test why a certain method of payment is used, wecan test if a bidder uses the same method of payment in separate bids thatare made relatively close in time to each other. This enables us to concen-trate on target and bid characteristics that inf luence the method-of-payment choice. To the extent information asymmetry regarding the valueof the acquirer is important in bids, we would expect to see patterns in thebids made close together in time, since the information asymmetry that ex-ists at one point in time and its impact on bidders presumably would impactnearby bids in similar ways.
From our original sample, we identify 1,115 paired acquisitions where thebidder acquired two targets within a three-month period. We expect acquir-ers to use the same method of payment for these transactions if the target
and bid characteristics are similar. That is, if both targets are private firms,the bidder would use stock for both targets, all else held constant. Further,
1788 The Journal of Finance

7/21/2019 What Do Returns to Acquiring Firms Tell Us
http://slidepdf.com/reader/full/what-do-returns-to-acquiring-firms-tell-us 27/32
if the bidder and the targets are in different industries, the bidder wouldagain use stock. These predictions result from the expectation that if thetarget is private or if the target is in a different industry from the bidder,
the bidder is less likely to know the value of the targets.Table VIII provides summary statistics for the paired transactions differ-
entiated by whether both targets are in the same two-digit SIC code, whetherboth targets are in the same industry as the bidder, whether both targetshave the same public status, whether the same method of payment is usedfor both targets, and by the average difference in the relative size of thetargets. We find substantial variation in the method of payment where theo-ries driven by information asymmetry would predict less variation. Whenboth targets are in the same industry, the bidder uses different methods of payment for the two transactions 37.7 percent of the time. When the targets
and the bidder are all in the same industry, the bidder uses a different methodof payment for the two transactions 36.3 percent of the time. Further, whenthe targets are both private firms or both subsidiaries, the bidder uses dif-ferent methods of payment 36.2 percent of the time. Hansen’s ~1987! worksuggests that if there is greater uncertainty about target valuation, the bid-der should use stock for the acquisition. However, we find that even whentarget characteristics are similar, there is substantial variation in the choiceof method of payment.
Other characteristics of the bid could influence the choice of payment of-fered, perhaps, most importantly, the relative size of the targets. To more
fully examine the method-of-payment choice, we estimate a logistic regres-sion of the choice of whether the two targets were acquired using the sameor different method of payment. Our independent variables include a dummy
variable with a value of 1 if the targets have differing public status ~public,private, or subsidiary!, or 0 otherwise; a dummy variable with a value of 1if the two targets are in different industries from each other, or 0 otherwise;a dummy variable with a value of 1 if one or both targets are foreign, or 0otherwise; a dummy variable with a value of 1 if the bidder and the targetsare in different industries, or 0 otherwise; and the log of the absolute dif-ference in the relative size of the targets. We also include dummy variablesindicating whether the targets and0or the bidder are in high-tech industries,as classified by SDC. For example, if the bidder and only one of the targetsare in a high-tech industry, the dummy variable HLH is assigned a value of 1; otherwise the observation is 0. We use the high-tech industry classifica-tion as a crude proxy for uncertainty since we cannot calculate the often-used proxy, market-to-book ratio.
As repor ted in Table IX, we find that if the two targets have differentpublic status, or if the bidder and targets are in different industries, it ismore likely the bidder will choose different methods of payment. We alsofind that the larger the difference in the relative size of the two targets, themore likely the bidder is to choose different methods of payment. In addi-
tion, whether the bidder or targets were in high-tech industries did not im-pact the bidder decision to use the same or different methods of payment.
What Do Returns to Acquiring Firms Tell Us? 1789

7/21/2019 What Do Returns to Acquiring Firms Tell Us
http://slidepdf.com/reader/full/what-do-returns-to-acquiring-firms-tell-us 28/32
Table VIII
Descriptive Statistics for Paired Acquisitions Where t
Acquires Two Targets within 90 DaColumns 2 and 3 represent aggregate numbers on paired transactions. Columns 4 and 5 repr90 days where the bidder used different methods of payment. The last eight data columns remethod. Method of payment is classified as follows. Cash offers include cash only and mixturestock only or a combination of common stock and options, warrants, or rights. Combination deastock. Industry is measured using three-digit SIC codes.
Me
Different All Paired
Transactions~ N 1,115! ~ N 450!
Stock~ N 141!
# % # % # %
Targets in the same industry 536 48.1 202 37.7 70 13.1 Pairs in the same industry as bidder 430 38.6 156 36.3 56 13.0 Pairs with the same public status 682 61.2 250 36.7 102 15.0
Public 32 2.9 8 25.0 13 40.6 Private 591 53.0 227 38.4 88 15.0 Subsidiary 59 5.3 15 25.4 1 1.7
Average @median# difference in size $300—
$437—
$449—
of targets ~in millions of dollars! @$23# @$27# @$44#
~1! ~2! ~3! ~4! ~5! ~6! ~7!

7/21/2019 What Do Returns to Acquiring Firms Tell Us
http://slidepdf.com/reader/full/what-do-returns-to-acquiring-firms-tell-us 29/32
Overall, we find that the choice of the method of payment in a transactionis complex. Most of the previous work in the method-of-payment literaturehas focused on bidder characteristics, largely ignoring the nature of the tar-get. While there are certainly additional unidentified influences, our analy-
sis provides insights into the importance of the characteristics of the targetand the deal in determining the method of payment chosen by a bidder.
Table IX
Logistic Regression Analysis of Factors Affecting
Method of Payment
This sample consists of 655 observations in which a bidder acquired two f irms within a 90-dayperiod. Each observation consists of two consecutive bids. If the bidder acquired three firmswithin 90 days, the middle bid is used twice; it is paired with the first and third bids. Thedependent variable is a dummy variable taking the value 0 if the bidder acquired the two firmsusing the same method of payment and 1 if the bidder used different methods of payment.There are 518 paired transactions using the same method of payment; 137 paired transactionsusing a different method of payment in each takeover. In this analysis, we consider only thosepaired takeovers where either cash or stock was used. Combination deals are entirely excluded.Cash offers include cash only and mixtures of cash and debt. Stock offers include common stockonly or a combination of common stock and options, warrants, or rights. STATUS is a dummy variable with a value of 1 if the targets have differing public status ~public, private or subsid-iary!, or 0 otherwise. TARGET INDUSTRY is a dummy variable with a value of 1 if the targets
are in different industries, or 0 otherwise. Industry data are organized using Fama and French~1997! industry classifications. TARGET COUNTRY is a dummy variable with a value of 1 if the targets are in different countries, or 0 otherwise. BIDDER/TARGET INDUSTRY is a dummy variable with a value of 1 if the targets and the bidder are in different industries, or 0 other-wise. TARGET SIZE DIFFERENCE is the log of the absolute difference in the relative size of the targets. The relative size of the target is the natural log of deal value divided by acquirermarket value as of the month before the announcement date. HHH is a dummy variable witha value of 1 if the targets and the bidder are all in high-tech industries, as classified by SDC,or 0 otherwise. HLH is a dummy variable with a value of 1 if the bidder and only one of thetargets are in high-tech industries, or 0 otherwise. LHH is a dummy variable with a value of 1if the bidder is in a low-tech industry and both of the targets are in high-tech industries, or 0otherwise. LHL is a dummy variable with a value of 1 if the bidder and only one of the targetsare in low-tech industries, or 0 otherwise. LLL is a dummy variable with a value of 1 if neitherof the targets nor the bidder is in high-tech industries, or 0 otherwise. P-values are reported inbrackets next to the parameter estimates.
Variable Estimate
Intercept 1.737 @0.001#
STATUS 0.650 @0.002#
TARGET INDUSTRY 0.324 @0.322#
TARGET COUNTRY 0.246 @0.282#
BIDDER/TARGET INDUSTRY 0.915 @0.006#
TARGET SIZE DIFFERENCE 0.133 @0.020#
HHH 0.420 @0.100#
HLH 0.261 @0.431# LHH 0.478 @0.451#
LHL 0.009 @0.986#
LLL 0.408 @0.204#
What Do Returns to Acquiring Firms Tell Us? 1791

7/21/2019 What Do Returns to Acquiring Firms Tell Us
http://slidepdf.com/reader/full/what-do-returns-to-acquiring-firms-tell-us 30/32
IV. Conclusion
We study shareholder returns in public firms that acquired five or morepublic, private, or subsidiary targets. Since the announcement of a takeoverreveals information about the potential synergies of the combination, thestand-alone values of the bidder and target, and potential bidder overpay-ment, it is difficult to interpret the announcement returns for acquiring firms. However, our sample controls for one confounding factor, acquirercharacteristics. Since we control for acquirer characteristics in that the samebidder will often choose to acquire targets with varying ownership status,and with different payment methods, we can examine the variation in ac-quirer returns as a function of these bid characteristics. Our results indicatethat bidder shareholders gain when the bidding firm buys a private firm ora subsidiary of a public firm and lose when the bidder buys a public firm. Inaddition, the gain or loss is greater in absolute value when the target islarger and when the bidder uses stock.
We suggest that when bidders acquire private firms or subsidiaries, theyare purchasing assets in a relatively illiquid market. Thus, the valuation of those assets reflects a liquidity discount, resulting in a higher return tobidder shareholders. Further, the even larger returns received by bidderswhen making stock offers for a private target may result from tax consid-erations and monitoring benefits. If target owners receive stock in compen-sation for their ownership stake, the owners delay their tax liability untilthe position in the bidder is liquidated and thus they may be willing to
accept a lower price for the assets. In addition, if the stock transfer resultsin a large blockholder in the acquiring f irm, the acquiring f irm shareholdersmay benefit from ability of that owner to monitor the activities of the firm.
REFERENCES
Andrade, Gregor, Mark Mitchell, and Erik Stafford, 2001, New evidence and perspectives onmergers, Journal of Economic Perspectives 15, 103–120.
Asquith, Paul, Robert Bruner, and David Mullins, 1983, The gains to bidding firms from merger, Journal of Financial Economics 11, 121–139.
Berkovitch, Eli, and M. P. Narayanan, 1990, Competition and the medium of exchange in take-overs, Review of Financial Studies 3, 153–174.
Bhagat, Sanjai, David Hirshleifer, and Robert Noah, 2001, Do takeovers create value? Newmethods and evidence, Working paper, University of Colorado.
Bradley, Michael, Anand Desai, and E. Han Kim, 1988, Synergistic gains from corporate ac-quisitions and their division between the stockholders of target and acquiring firms, Jour-
nal of Financial Economics 21, 3–40.Brown, David, and Michael Ryngaert, 1991, The mode of acquisition in takeovers: Taxes and
asymmetric information, Journal of Finance 46, 653–669.Brown, Stephen, and Jerold Warner, 1980, Measuring security price performance, Journal of
Financial Economics 8, 205–258.Brown, Stephen, and Jerold Warner, 1985, Using daily stock returns: The case of event studies,
Journal of Financial Economics 14, 3–32.Bruner, Robert, 2001, Does M&A pay? A survey of evidence for the decision maker, Working paper, Darden Graduate School of Business, University of Virginia.
1792 The Journal of Finance

7/21/2019 What Do Returns to Acquiring Firms Tell Us
http://slidepdf.com/reader/full/what-do-returns-to-acquiring-firms-tell-us 31/32
Chang, Saeyoung, 1998, Takeovers of privately held targets, methods of payment, and bidderreturns, Journal of Finance 53, 773–784.
Eckbo, B. Espen, Ronald Giammarino, and Robert Heinkel, 1990, Asymmetric information andthe medium of exchange in takeovers: Theory and tests, Review of Financial Studies 3,
651–676.Eckbo, B. Espen, Yojislav Maksimovic, and Jeffrey Williams, 1990, Consistent estimation of
cross-sectional models in event studies, Review of Financial Studies 3, 343–365.Eckbo, B. Espen, and Karin Thorburn, 2000, Gains to bidder firms revisited: Domestic and
foreign acquisitions in Canada, Journal of Financial and Quantitative Analysis 35, 1–25.Fama, Eugene, and Kenneth French, 1997, Industry costs of equity, Journal of Financial Eco-
nomics 43, 153–193.Field, Laura, and J. Harold Mulherin, 1999, Newly public firms as acquisition targets: A com-
parison with established target firms, Working paper, Penn State University.Fishman, Michael, 1989, Preemptive bidding and the role of the medium of exchange in acqui-
sitions, Journal of Finance 44, 41–57.Grinblatt, Mark, and Sheridan Titman, 2002, Financial Markets and Corporate Strategy, 2nd
edition ~McGraw Hill Irwin, New York!.Hansen, Robert G., 1987, A theory for the choice of exchange medium in mergers and acquisi-
tions, Journal of Business 60, 75–95.Hansen, Robert G., and John Lott, 1996, Externalities and corporate objectives in a world with
diversified shareholders0consumers, Journal of Financial and Quantitative Analysis 31,43–68.
Hietala, Pekka, Steve Kaplan, and David Robinson, 2000, What is the price of hubris? Using takeover battles to infer overpayments and synergies, Working paper, INSEAD and Uni- versity of Chicago.
Holmstrom, Bengt, and Steve Kaplan, 2001, Corporate governance and merger activity in theU.S.: Making sense of the ’80s and ’90s, Journal of Economic Perspectives 15, 121–144.
Jarrell, Gregg, James Brickley, and Jeffry Netter, 1988, The market for corporate control: The
empirical evidence since 1980, Journal of Economic Perspectives 2, 49–68.Jensen, Michael, and Richard Ruback, 1983, The market for corporate control: The scientific
evidence, Journal of Financial Economics 11, 5–50.Koeplin, John, Atulya Sarin, and Alan Shapiro, 2000, The private company discount, Journal of
Applied Corporate Finance 12, 94–101.Malatesta, Paul, and Rex Thompson, 1985, Partially anticipated events: A model of stock price
reactions with an application to corporate acquisitions, Journal of Financial Economics 14,237–250.
Martin, Kenneth, 1996, The method of payment in corporate acquisitions, investment oppor-tunities, and management ownership, Journal of Finance 51, 1227–1246.
Mulherin, J. Harold, and Audra Boone, 2000, Comparing acquisitions and divestitures, Journal
of Corporate Finance 6, 117–129.
Myers, Stewart, and Nicholas Majluf, 1984, Corporate financing and investment decisions whenfirms have information investors do not have, Journal of Financial Economics 87, 355–374.Poulsen, Annette, and Michael Stegemoller, 2002, Transitions: From private to public owner-
ship, Working paper, University of Georgia.Schipper, Katherine, and Rex Thompson, 1983, Evidence on the capitalized value of merger
activity for acquiring firms, Journal of Financial Economics 11, 85–119.Servico, Inc., 1998, PREM 14A SEC filing, April 27, 1998.Shleifer, Andrei, and Robert Vishny, 2001, Stock market driven acquisitions, Working paper
8439, NBER.Travlos, Nikolaos, 1987, Corporate takeover bids, methods of payment, and bidding firms’ stock
returns, Journal of Finance 43, 943–963.Weston, J., Juan Siu, and Brian Johnson, 2001, Takeovers, Restructuring, and Corporate Gov-
ernance, 3rd ed. ~Prentice Hall, New Jersey!.
What Do Returns to Acquiring Firms Tell Us? 1793

7/21/2019 What Do Returns to Acquiring Firms Tell Us
http://slidepdf.com/reader/full/what-do-returns-to-acquiring-firms-tell-us 32/32