what do recent evaluations tell us about the state of teachers in sub
TRANSCRIPT

2008/ED/EFA/MRT/PI/19
Background paper prepared for the
Education for All Global Monitoring Report 2008
Education for All by 2015: will we make it?
What do recent evaluations tell us about the state of teachers in Sub-Saharan Africa?
Gabrielle Bonnet 2007
This paper was commissioned by the Education for All Global Monitoring Report as background information to assist in drafting the 2008 report. It has not been edited by the team. The views and opinions expressed in this paper are those of the author(s) and should not be attributed to the EFA Global Monitoring Report or to UNESCO. The papers can be cited with the following reference: “Paper commissioned for the EFA Global Monitoring Report 2008, Education for All by 2015: will we make it. For further information, please contact [email protected]

WHAT DO RECENT EVALUATIONS TELL US ABOUT THE STATE OF TEACHERS IN SUB-SAHARAN COUNTRIES?
A. Table of contents and illustration table
I. Table of contents A. Table of contents and illustration table .............................................................................. 1
I. Table of contents ............................................................................................................ 1 II. Illustration table.............................................................................................................. 2
B. Acknowledgements ............................................................................................................ 5 C. Introduction ........................................................................................................................ 5 D. PASEC and SACMEQ general goals and procedures ....................................................... 6
I. Samples .......................................................................................................................... 6 II. Target populations.......................................................................................................... 6 III. Brief history of the evaluations .................................................................................. 6
E. Sample characteristics for PASEC and SACMEQ studies: impact on the interpretation of the data ....................................................................................................................................... 7 F. Contextual data................................................................................................................... 8 G. Descriptive results ............................................................................................................ 10
I. Employment status ....................................................................................................... 10 II. Gender of the teacher ................................................................................................... 14 III. Teachers’ age and experience .................................................................................. 18 IV. Academic qualifications........................................................................................... 21 V. Pre-service training / duration ...................................................................................... 23 VI. In-service training / duration .................................................................................... 26 VII. Test scores ................................................................................................................ 27 VIII. Local language (PASEC countries).......................................................................... 31 IX. Incentives and benefits, second activities, and motivation levels ............................ 31 X. Contribution of the community to teachers’ salaries in SACMEQ countries .............. 35 XI. Percentage of the Maths and French curricula covered by the teacher .................... 35 XII. Working days of absence ......................................................................................... 37 XIII. Class size, students’ absenteeism and attrition......................................................... 40 XIV. Classroom conditions ........................................................................................... 45
H. Conclusion........................................................................................................................ 51 I. Annex I: Technical elements............................................................................................ 53
I. Parameters used in the PASEC and SACMEQ evaluations......................................... 53 II. Sample characteristics .................................................................................................. 56
J. Annex II: Original French terminology and English translation or closest equivalents .. 61 K. Bibliography:.................................................................................................................... 61

2
II. Illustration table Table 1: list of countries involved in SACMEQ, dates of data collection and type of
evaluations 7 Table 2 : list of countries involved in PASEC, dates of data collection and type of evaluations
7 Table 3: Enrolment rates in primary schools, GDP PPP (purchasing power parity), HIV/AIDS
prevalence, and agreement with donors (Fast-Track Initiative –FTI-) in the 21 countries or States studied in the article 9
Table 4: status of teachers in the sample of the Mauritania PASEC evaluation, disaggregated by language of instruction 10
Table 5: Status of teachers in Chad as given by national data (2003) 10 Table 6: Status of teachers in the sample of the Chad PASEC evaluation (2003) 11 Table 7: Status of teachers in Guinea as given by national data (2006) 11 Table 8: Status of teachers in the sample of the Guinea PASEC evaluation (2004) 11 Table 9: Status of teachers in Mali as given by national data in 2001 12 Table 10: Status of teachers in the sample of the Mali PASEC evaluation (2002) 12 Table 11: Status of teachers in Niger as given by national data (2002) 12 Table 12: Status of teachers in the sample of the Niger PASEC evaluation (2002) 13 Table 13: Status of teachers in Togo as given by national data (2000-2001) 13 Table 14: Status of teachers in the sample of the Togo PASEC evaluation (2001) 13 Table 15: Summary of the status of teachers in Chad, Guinea, Mali, Mauritania, Niger and
Togo (percentage) 14 Table 16: Professional status of public and private schools teachers (percentage) 14 Table 17: Percentage of women teachers in 2nd and 5th years – PASEC countries 15 Table 18: percentage of women teachers according to status and country – PASEC data 15 Table 19: Women teachers in urban and rural areas – PASEC countries 16 Table 20: Percentage of students with a woman teacher in urban and rural areas – SACMEQ
countries 17 Table 21: Women teachers: discrepancies by subject matter (reading or maths) –SACMEQ
countries 17 Table 22: Teachers’ age: average and percentages of teachers in various age ranges – PASEC
countries 18 Table 23: Teachers’ age: average and percentage of students with teachers in various age
ranges – SACMEQ countries 18 Table 24: Teachers’ experience: average and percentages of teachers in the sample in various
experience ranges – PASEC countries 19 Table 25: Teachers’ experience: average and percentages of studies with teachers in various
experience ranges – SACMEQ countries 20 Table 26: Average teacher experience and experience range disaggregated by professional
status, and percentages of teachers of the corresponding status in the teacher population –PASEC countries 20
Table 27: Teachers’ academic qualifications – PASEC countries 22 Table 28: Teachers’ academic qualifications – SACMEQ countries 22 Table 29: Duration of pre-service training, disaggregated according to professional status –
PASEC countries 24 Table 30: Duration of pre-service training, disaggregated according to professional status –
SACMEQ countries 25 Table 31: Percentage of teachers who received in-service training – PASEC countries 26

3
Table 32: Average duration of in-service (no in-service corresponds to an average duration of 0 days) –PASEC countries 26
Table 33: Repartition of in-service lengths – PASEC countries 26 Table 34: Average number of in-service courses and duration of in-service (no in-service
corresponds to an average duration of 0 days) –SACMEQ countries 27 Table 35: Literacy competency levels of 6th year teachers – SACMEQ countries 27 Table 36: Numeracy competency levels of 6th year teachers – SACMEQ countries 28 Table 37: Teachers’ results on a French test – PASEC countries 30 Table 38: Repartition of teachers’ French test results –PASEC countries 30 Table 39: Percentage of teachers who speak the local language – PASEC countries 31 Table 40: Percentage of teachers claiming they receive incentives and benefits – some PASEC
countries 32 Table 41: Part of the salary represented by the benefits and incentives received –some PASEC
countries 32 Table 42: Percentage of teachers in the country who say they have a second activity – PASEC
countries 32 Table 43: Salaries declared by the teachers, part of the salary represented by the incentives,
teachers with a second activity disaggregated by professional status – some PASEC countries 32
Table 44: “Motivation” levels of the teachers and main ambitions, disaggregated by status– PASEC countries 33
Table 45: Community contributions to teachers’ salaries – SACMEQ II countries 35 Table 46: Percentage of the French curriculum covered during the year – PASEC teachers 35 Table 47: Percentage of the Maths curriculum covered during the year – PASEC countries 36 Table 48: Percentage of teachers who covered less than 50%, 50% to 75%, 75% to 90%, and
more than 90% of the French curriculum – PASEC countries 36 Table 49: Percentage of teachers who covered less than 50%, 50% to 75%, 75% to 90%, and
more than 90% of the Maths curriculum – PASEC countries 36 Table 50: Working days of absence in the past month (self-reported by the teacher) – PASEC
countries 37 Table 51: Percentage of teachers who were absent 0, 1, 2-3 or 4 or more working days in the
past month – PASEC countries 37 Table 52: Percentage of cases in which the teacher at the end of the year was different from
the one at the beginning – PASEC countries 38 Table 53: date of beginning of the school year 38 Table 54: Estimation of the importance of the problem of teacher absenteeism in the school,
as reported by school heads – SACMEQ countries 39 Table 55: Number of days lost in the past year due to non-school events 40 Table 56: Class size– PASEC countries 41 Table 57: Class size– SACMEQ countries 41 Table 58: Student absenteeism – SACMEQ countries 44 Table 59: Attrition rates – PASEC countries 44 Table 60: classroom conditions, equipment – PASEC countries 45 Table 61: classroom conditions, equipment – SACMEQ countries 46 Table 62: Condition of the school building – SACMEQ countries 47 Table 63: Seats for children – PASEC countries 47 Table 64: seats for children – SACMEQ countries 48 Table 65: Percentage of students whose teachers has (diagnosis studies) / of teachers having
(thematic studies) a book or guide in the subject(s) taught – all countries 49 Table 66: percentage of (students in) schools having toilets– all countries 50

4
Table 67: Percentage of missing answers for the parameters studied in the article – PASEC countries 53
Table 68: Percentage of missing answers for the parameters studied in the article – SACMEQ I countries 54
Table 69: Percentage of missing answers for the parameters studied in the article – SACMEQ II countries 55
Table 70: Desired, defined, and excluded populations – SACMEQ II countries 57 Table 71: French and English terminology table 61

5
B. Acknowledgements This article owes a lot to the help of the PASEC and SACMEQ teams, who gave me the data, replied to my numerous questions and offered to reread either part or the entire article. I therefore thank, in alphabetical order, Jean-Marc Bernard, Jean Bourdon, Stéphanie Dolata, Kenneth Houngbedji, Amavi Kodjovi, Alain Patrick Nkengne Nkengne, Mioko Saito, Frank Van Cappelle and Pierre Varly. I also have to thank the IIEP team whose training I followed, including Kenneth Ross, Khadim Sylla, and team members I have already mentioned. Many thanks to the Global Monitoring Report team who suggested I write this article, and more specifically to Aaron Benavot and Paula Razquin, and to my chief of section Caroline Pontefract for accepting this. Finally, I have to thank Paul Coustère and Jean-Claude Mantes who have introduced me to the work done by the above-mentioned colleagues in Africa.
C. Introduction The purpose of this document is to present some teacher and school / class characteristics in several Sub-Saharan countries. Those characteristics are generally not present in known databases but can be extracted or in some cases estimated from the data gathered by the Programme d’Analyse des Systèmes Educatifs des pays de la CONFEMEN (PASEC)1 or the Southern and Eastern Africa Consortium for Monitoring Educational Quality (SACMEQ)2. This article will be essentially descriptive, but it obviously cannot stand on its own, separate from analyses of the impact of the variables we describe, especially on students’ achievement. For general articles on that subject, see for example [Hanushek E.A., 2003], [Duthilleul and Allen, 2005], [Bernard et al., 2004].
The data correspond to 20 different countries: Chad, Guinea, Mali, Mauritania, Niger, Togo, Botswana, Kenya, Lesotho, Malawi, Mauritius, Mozambique, Namibia, Seychelles, South Africa, Swaziland, Tanzania (mainland –studied separately from Zanzibar), Uganda, Zambia, Zanzibar and Zimbabwe. The first 6 countries correspond to countries studied by the PASEC evaluation after 2000, and the other countries were studied by the SACMEQ, for all of them save Zimbabwe, between 2000 and 2002 (SACMEQ II), and for some of them (Kenya, Malawi, Mauritius, Namibia, Zambia, Zanzibar, Zimbabwe), in 1995 (1997-1998 for Malawi, and 1998 for Kenya) through SACMEQ I.
The two evaluations (PASEC and SACMEQ) studied students, schools and teachers’ variables, many of those variables being common to the two evaluations. We are centring ourselves mainly on teacher parameters, adding in some cases some school or classroom variables. Those parameters are mostly common to PASEC and SACMEQ, but in some cases they are specific only to one evaluation.
The first parts of the article are devoted to presenting the two evaluations, PASEC and SACMEQ, which data were used to create this document, and a few indicators of the context of the corresponding countries. The article will then describe the teachers’ professional status and personal characteristics: gender and age, experience, academic and professional training as well as subject matter and local language abilities. The following parts describe the teachers’ behaviours: second activity, motivation levels, percentage of the curriculum covered, and teacher absenteeism rates, then finally give some class variables which can have an impact on teaching: class size, students’ absenteeism, classroom condition and furniture. Part D (“Descriptive results”) tables have been created by the author using the PASEC3 and SACMEQ4 databases, some additional data from UIS or national sources have sometimes been added to the tables.
A descriptive article as this one cannot give definite “reasons” for the trends and characteristics which appear, however, some potential explanations will be given and pending questions will be underlined.
1 http://www.confemen.org/ 2 http://www.sacmeq.org/ 3 A CD-Rom of the earliest PASEC evaluations has been edited, more recent data may be requested directly to the PASEC team 4 The data and technical data of the SACMEQ I and II are in the public domain

6
D. PASEC and SACMEQ general goals and procedures PASEC and SACMEQ5 goals and procedures are not completely identical; in particular they differ in terms of:
I. Samples In the case of SACMEQ, the samples are all samples of students, while PASEC was commissioned by different countries to do different kinds of evaluations: in particular, some studies are thematic studies (Mali, Niger, Togo, Guinea) and use samples made to compare different categories of teachers, while others are diagnosis studies (Chad, Mauritania) and use samples of students. This means the numbers in the tables in section C will have different meanings which will be discussed accordingly. Other (pre-2000) PASEC studies also include longitudinal studies.
The PASEC evaluations were meant to evaluate the impact of different variables at student, school and teacher level, on students’ learning outcomes –more precisely on students’ progress during a year, progress which is assessed through the administration of a pre-test at the beginning of the year and of a post-test at the end of the year.: it follows a “value added” approach. Those results will not be discussed in this paper, but extensive discussions are available both online on the PASEC website, and in several articles [Michaelowa and Wechtler, 2006].
II. Target populations The grade levels which are studied differ: PASEC gives us information on 2nd and 5th year teachers and students, while SACMEQ data correspond to the 6th grade level. This can have an impact on the teacher and classroom characteristics, which may differ according to the grade. Furthermore, SACMEQ provides separate information on Maths and Reading teachers if those teachers are different, in 6th grade, in the country’s system. Whenever no more precision is brought, PASEC data will correspond to the 2nd and 5th year teachers taken together, and SACMEQ data will correspond to Reading teachers.
Sometimes some variables are not available for all the countries. Though the parameters are mostly very similar from one evaluation to the next, there can be exceptions. In that case, the corresponding country will be missing from the table.
III. Brief history of the evaluations The SACMEQ evaluation undertook 21 different studies between 1995 and 2002 and is currently preparing SACMEQ III. 6 countries were visited twice.
The PASEC evaluation undertook 24 (25 if one includes the recent, slightly different Central African Republic study) different studies between 1993-1994 and 2006-2007, the latest evaluations having yet to be published. 8 countries were visited twice.
The wealth of existing data and of existing parameters (teacher, students, etc.) in those studies is important. Descriptive results have already been very much explained in SACMEQ individual country reports, and some of the existing descriptive data were also described in individual PASEC country reports.
The goal of this document is to make comparisons between countries, to make out general trends or on the contrary dissimilarities, on a subpart of the existing variables: quite a few of the existing teacher variables (but not all) and some classroom variables, and on a subpart of the existing studies: we limited our study of PASEC countries to post-2000 evaluations which report had already gone out when we began this article. For more details about the choice of variables, see Annex I.
5 This document will outline major technical issues in the main text and annexes, but not do an in-depth technical presentation of any of the two evaluations. For more details, the technical report about the conduct of the SACMEQ study is available in Chapter 2 of the SACMEQ II reports. The reports are downloadable on the website. For the PASEC evaluation, a 2000 manual [Béhaghel and Coustère, 2000], included in the CD-Rom of earlier evaluations, gives general information about the procedures, and current working documents are available on request. More specific information is found, as in the case of the SACMEQ evaluation, in the individual countries’ reports.

7
Here are, however, two tables about SACMEQ and PASEC studies, to situate the data we used inside the more general panorama of existing information. Table 1: list of countries involved in SACMEQ, dates of data collection and type of evaluations
SACMEQ countries
Data collection
Type of evaluation
SACMEQ countries
Data collection
Type of evaluation
Malawi 1997-1998 Diagnosis Mauritius 2001 Diagnosis Mauritius 1995 Diagnosis Mozambique 2000 Diagnosis Namibia 1995 Diagnosis Namibia 2000 Diagnosis Zambia 1995 Diagnosis Seychelles 2000 Diagnosis
Zanzibar 1995 Diagnosis South Africa 2000 Diagnosis Zimbabwe 1995 Diagnosis Swaziland 2000 Diagnosis
Kenya 1998 Diagnosis Tanzania 2000 Diagnosis Botswana 2000 Diagnosis Uganda 2000 Diagnosis
Kenya 2000 Diagnosis Zambia 2000 Diagnosis Lesotho 2000 Diagnosis Zanzibar 2000 Diagnosis Malawi 2002 Diagnosis
Table 2 : list of countries involved in PASEC, dates of data collection and type of evaluations
PASEC countries Data collection
Type of evaluation
PASEC countries
Data collection
Type of evaluation
Djibouti 1993/1994 Diagnosis Mali 2001/2002 Thematic Congo 1993/1994 Diagnosis Niger 2001/2002 Thematic
Mali 1994/1995 Diagnosis Guinea 2003/2004 Thematic Chad 2003/2004 Diagnosis Central African
Republic 1994/1995 Diagnosis
Mauritania 2003/2004 Diagnosis Senegal 1995 à 1998 Longitudinal Benin 2004/2005 Diagnosis
Burkina Faso 1995 à 1998 Longitudinal Cameroon 2004/2005 Diagnosis Cameroon 1995/1996 Diagnosis Madagascar 2004/2005 Diagnosis Ivory Coast 1995 à 1998 Longitudinal Gabon 2005/2006 Diagnosis Madagascar 1997/1998 Diagnosis Mauritius 2006 Diagnosis
Guinea 1999/2000 Thematic Congo 2006/2007 Diagnosis Togo 2000/2001 Thematic Senegal 2006/2007 Diagnosis
Burkina Faso 2006/2007 Diagnosis
Central African Republic
2006 Diagnosis6
Note : Early surveys for Djibouti, Mali, Congo and CAR have been set up on heterogenous methodologies not directly comparable with more recent surveys
E. Sample characteristics for PASEC and SACMEQ studies: impact on the interpretation of the data
SACMEQ I (1995, 1998 for Kenya and 1997-1998 for Malawi) and SACMEQ II (2000 to 2002) studies are all based on a sample of students, and the corresponding results should therefore be interpreted from the point of view of the students: for example, SACMEQ will not give the approximate percentage of female teachers existing in the country, but the approximate percentage of students in the country whose teacher is a woman. The percentage of students who have a teacher with a given characteristic (for example: being female) and the percentage of the teaching staff that has that characteristic will often be close to one another. The student-centred point of view to which the data correspond must however be kept in mind7.
Chad 2003 PASEC study was a “diagnosis study”, which means it was meant to evaluate the country’s school system and was based on a sample of students, as SACMEQ studies are. 149 different schools were studied, corresponding to 135 2nd year classes and 124 5th year classes. As in the case of SACMEQ, the point of view here is a student-centred one.
6 This evaluation based on PASEC’s methodology was operated by “Pôle de Dakar” and limited to a final year assessment at only grade 5. 7 The two percentages are different if there is a correlation between the characteristic which is studied (for example: the teacher is a female) and class size.

8
Similarly, the 2003 Mauritania PASEC study [PASEC/CONFEMEN, 2006b] was also meant to evaluate the country’s school system, and was based on a sample of students. Before 1999, the Mauritanian system was separated between an Arabic-speaking part and a French-speaking one, corresponding to two different parts of the population. The 1999 reform, however, has unified the system by enforcing bilingualism in all the country. 164 different schools were studied, corresponding to 141 2nd year classes and 124 5th year classes. Some of those schools have two different teachers, one for disciplines taught in French, and the other one for disciplines taught in Arabic, and others have one teacher for both languages. Mauritania teachers will be studied as a whole or separately according to what seems more relevant. The existence of classes which have one teacher for both languages, and of classes which have two different teachers, renders the statistics more complicated. When considering the age of the teaching force, if one wishes to know how many teachers are going to retire in the future years, for example, one will look at the total number of teachers in our data, each teacher, whether Arabic-speaking, French-speaking, or bilingual, having the same weight. If, on the other hand, one wishes to know which percentage of the students has a trained teacher, giving the same weight to each teacher would lead to give double weight to those students who have two teachers instead of one. Finally, if one is interested in the existence of a Maths guide or teacher’s book for the teacher, one will not want to know if the teacher who only teaches French has a Maths guide, but whether the teacher who has to teach the subject has that guide. We shall explain our choices for each variable we study.
Guinea (2004), Mali (2002), Niger (2002) and Togo (2001) PASEC studies were commissioned in order to compare several categories of teachers, therefore, the sample characteristics were different.
In Guinea, the purpose of the study was to compare the two variants of contract teachers (FIMG 9-9 and FIMG 3-9-3) as well as the ENI-trained teachers, therefore the sample was meant to include 1/3 of teachers of each category. In Mali, the purpose of the study was to compare the impact of contract teachers with that of civil servants. Therefore, the sample was constructed so as to have, for each contract teacher in the sample, a civil servant teacher of a nearby school. In Niger, again, the intention was to compare civil servants and contract teachers (called “volunteers”), so the sample was intended to include around half of each category. The PASEC was commissioned another kind of study for Togo: since many teachers in the country have never undergone any training or have only had a short in-service training, a study was commissioned to compare the different teacher profiles, and, to achieve that aim, the sample intends to represent all the variety of teacher situations in the country.
In the 4 cases, the samples, perfectly relevant to the purpose of the studies (comparison of specific kinds of teachers) cannot give us descriptive results of teacher characteristics inside the country with the same accuracy as in the other countries. Bearing those limits in mind, one can however make out interesting tendencies from the existing samples.
The tables below will take into account the characteristics of each sample and their consequences on the interpretation of descriptive results.
F. Contextual data The purpose of this document is not to present an extensive description of any of the countries we refer to. The tables themselves present many indicators upon teachers but do not describe extensively the state of teachers in the respective countries. However, even for such a purpose, it is necessary to get informed on the context of each of the countries / States we refer to8. This paragraph is not meant to replace an extensive search about the situation of each of the countries, but is given for the reader to have a few quantitative data available for quick reference.
The countries we are going to present in terms of teacher and classroom level data are extremely varied in relation to enrolment rates, wealth, HIV/AIDS prevalence, and thus in terms of the actions governments are taking in order to face the educational challenges specific to their context. It is not surprising the tables below will reflect that variety in situations and therefore in solutions.
8 The first part of PASEC and SACMEQ reports give a brief description of the context of the country

9
Table 3: Enrolment rates in primary schools, GDP PPP (purchasing power parity), HIV/AIDS prevalence, and agreement with donors (Fast-Track Initiative –FTI-) in the 21 countries or States studied in the article
Country Net
Enrolment rate (2000)*
Net Enrolment rate (2004)*
% increase in the total
primary school population 1991-2004*
GDP PPP per capita (2005)****
HIV/AIDS adult (15-49) prevalence**
FTI country since***
Chad 54% 57% 114% 1 502 $ 3.5% [1.7-6.0] Pending 2007
Guinea 47% 64% 231% 2 001 $ 1.5% [1.2-1.8] 2002
Mali 42% 47% 254% 1 101 $ 1.7% [1.3-2.1] 2006
Mauritania 63% 74% 160% 2 228 $ 0.7% [0.4-2.8] 2002
Niger 25% 39% 166% 965 $ 1.1% [0.5-1.9] 2002
Togo 80% 82% 52% 1 574 $ 3.2% [1.9-4.7] Expected 2008
Botswana 80% 82% 10% 10 491 $ 24.1% [23.0-32.0] N/A
Kenya 67% 76% 9% 1 096 $ 6.1% [5.2-7.0] 2005
Lesotho 82% 86% 18% 2 739 $ 23.2% [21.9-24.7] 2005
Malawi 98% 95% 103% 617 $ 14.1% [6.9-21.4] Expected 2008
Mauritius 93% 95% - 8% 13 046 $ 0.6% [0.3-1.8] N/A
Mozambique 56% 71% 193% 1 338 $ 16.1% [12.5-20.0] 2003
Namibia 74% 74% 14%† 6 992 $ 19.6% [8.6-31.7] N/A
Seychelles 87% 96% - 10% 12 526 $ N/A N/A
South Africa 90% 89% 3%† 11 997 $ 18.8% [16.8-20.7] N/A
Swaziland 76% 77% 24%† 4 810 $ 33.4% [21.2-45.3] N/A
Tanzania 51% 91% 115% 735 $ 6.5% [5.8-7.2] Expected 2008
Uganda N/A N/A 173% 1 783 $ 6.7% [5.7-7.6] Expected 2008
Zambia 63% 80% 49% 938 $ 17.0% [15.9-18.1] Pending 2007
Zanzibar N/A N/A N/A N/A N/A Expected 2008
Zimbabwe 82% 82% 8%† 2 220 $ 20.1% [13.3-27.6] N/A
Sources: *UIS database, **UNAIDS website, ***World Bank website, ****CIA World Factbook †1991-2000 evolution School fees were not mentioned in the table above, as the subject cannot be summarized to a “yes” or “no” answer to the question “are there school fees?”. Let’s recall however that Universal Primary Education was launched in 1994 in Malawi, in 1997 in Uganda, 2001 in Tanzania, 2002 in Zambia, 2003 in Kenya, 2004 in Mozambique, and between 2000 and 2006 (beginning with Standard 1 and rolling standard by standard up to Standard 6) in Lesotho.
In PASEC countries, as a rule, the public school system is free, however, at the school level some fees and mandatory contributions are requested from families. In general, the national ruler does ban fees but traditions can persist.
Furthermore, some of the countries mentioned are involved in specific agreements with donors, which contribute to shape the path they take towards development goals.
10
G. Descriptive results
I. Employment status Here is the employment status of teachers in national statistics and inside the various samples.
1. Mauritania (2003)
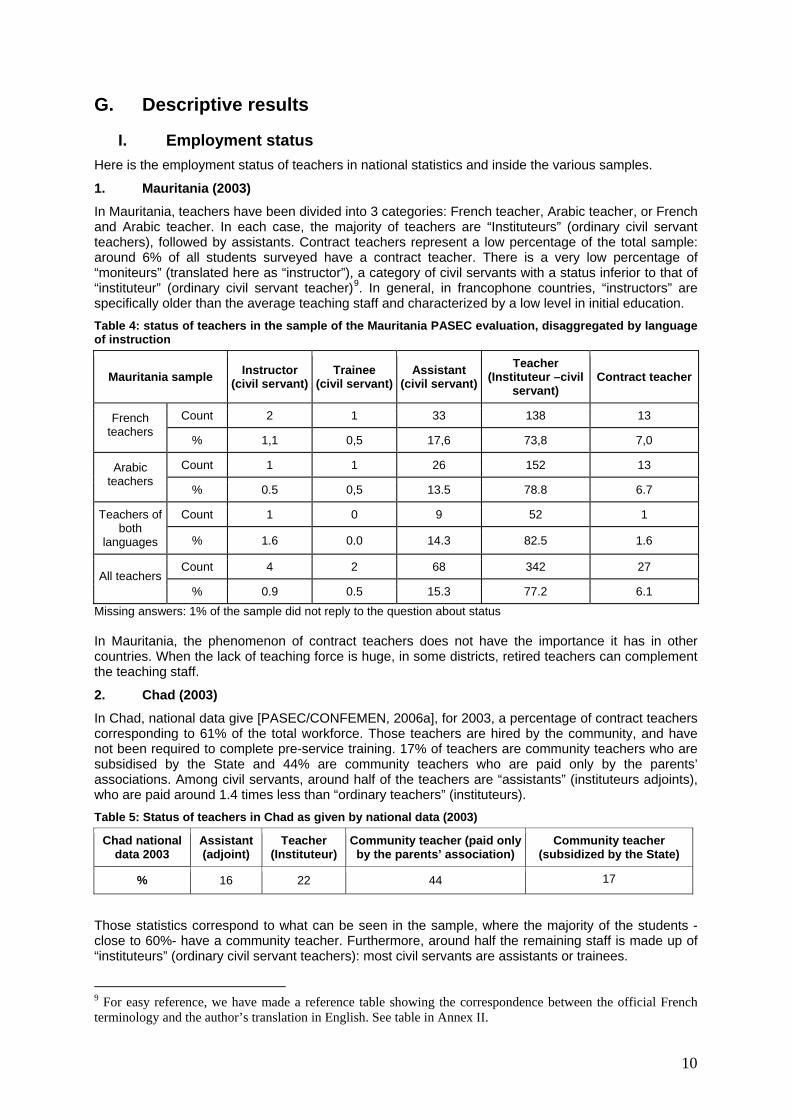
In Mauritania, teachers have been divided into 3 categories: French teacher, Arabic teacher, or French and Arabic teacher. In each case, the majority of teachers are “Instituteurs” (ordinary civil servant teachers), followed by assistants. Contract teachers represent a low percentage of the total sample: around 6% of all students surveyed have a contract teacher. There is a very low percentage of “moniteurs” (translated here as “instructor”), a category of civil servants with a status inferior to that of “instituteur” (ordinary civil servant teacher)9. In general, in francophone countries, “instructors” are specifically older than the average teaching staff and characterized by a low level in initial education. Table 4: status of teachers in the sample of the Mauritania PASEC evaluation, disaggregated by language of instruction
Mauritania sample Instructor (civil servant)
Trainee (civil servant)
Assistant (civil servant)
Teacher (Instituteur –civil
servant) Contract teacher
Count 2 1 33 138 13 French teachers
% 1,1 0,5 17,6 73,8 7,0
Count 1 1 26 152 13 Arabic teachers
% 0.5 0,5 13.5 78.8 6.7
Count 1 0 9 52 1 Teachers of both
languages % 1.6 0.0 14.3 82.5 1.6
Count 4 2 68 342 27 All teachers
% 0.9 0.5 15.3 77.2 6.1 Missing answers: 1% of the sample did not reply to the question about status In Mauritania, the phenomenon of contract teachers does not have the importance it has in other countries. When the lack of teaching force is huge, in some districts, retired teachers can complement the teaching staff.
2. Chad (2003)
In Chad, national data give [PASEC/CONFEMEN, 2006a], for 2003, a percentage of contract teachers corresponding to 61% of the total workforce. Those teachers are hired by the community, and have not been required to complete pre-service training. 17% of teachers are community teachers who are subsidised by the State and 44% are community teachers who are paid only by the parents’ associations. Among civil servants, around half of the teachers are “assistants” (instituteurs adjoints), who are paid around 1.4 times less than “ordinary teachers” (instituteurs). Table 5: Status of teachers in Chad as given by national data (2003)
Chad national data 2003
Assistant (adjoint)
Teacher (Instituteur)
Community teacher (paid only by the parents’ association)
Community teacher (subsidized by the State)
% 16 22 44 17
Those statistics correspond to what can be seen in the sample, where the majority of the students -close to 60%- have a community teacher. Furthermore, around half the remaining staff is made up of “instituteurs” (ordinary civil servant teachers): most civil servants are assistants or trainees.
9 For easy reference, we have made a reference table showing the correspondence between the official French terminology and the author’s translation in English. See table in Annex II.

11
Table 6: Status of teachers in the sample of the Chad PASEC evaluation (2003)
Chad sample Trainee (stagiaire)
Assistant (adjoint)
Teacher (Instituteur) Community teacher
Count 19 31 43 127
% 8.6 14.1 19.5 57.7
Missing answers: 5 teachers (2% of the sample) did not reply to the question about status
3. Guinea (2004):
In Guinea, Mali and Niger, the makeup of the samples was different: as explained before, the goal of the study was to compare the impact of different categories of teachers on learning outcomes, thus the samples had to reflect all those categories, even though their weight in the actual teacher population may be different.
In Guinea, a programme for the recruitment of contract teachers was set in place in 1998. The objective was to train enough teachers (it was estimated at the time that it was necessary to recruit around 2000 teachers / year), in a context in which teacher training institutions could only train 200 teachers a year in a traditional way. The goal was also to reduce training costs and to rethink the training. At the time of the 2004 study, 7 groups of teachers had already been trained [PASEC/CONFEMEN, 2004c]
Here are below national data detailing the repartition of each category of teacher nationwide was the following: Table 7: Status of teachers in Guinea as given by national data (2006)
All Guinea Civil servant Contract teacher Community teacher Other
Count 7598 10710 949 1
% 39.5 55.6 4.9 0.0 *source: Djénabou Balde, TTISSA coordinator (2006), « l’Initiative de l’UNESCO pour la formation des enseignants en Afrique subsaharienne : Note sur la situation des enseignants en Guinée », UNESCO [Balde, 2006]. One can see in table 8 below that civil servants are somewhat overrepresented in the final sample, while community teachers are underrepresented. This reminds us that teacher statistics which can be done on the PASEC sample will have to keep in mind the fact that the data gathered do not come, stricto sensu, from a sample representative of the Guinean teaching force. It can, however, give broad tendencies. Table 8: Status of teachers in the sample of the Guinea PASEC evaluation (2004)
Guinea Teacher (Instituteur) Assistant Instructor BM contract PEPT
contract Community teachers
Count 120 16 1 134 34 4 Sample
% 38.8 5.2 0.3 43.4 11.0 1.3
Guinea Civil servants Contract teachers Community teachers
Count 137 168 4 Sample
% 44.3 54.4 1.3 Missing answers: the answer about the status of 14 of the teachers (4% of the sample) present in the database was missing “BM contract” and “PEPT contract” categories above represent two kinds of contract teachers. At the beginning of the programme [PASEC/CONFEMEN, 2004c], contract teachers were accepted in training provided they could present a Bac 2 diploma for men (A level) and a Bac 1 diploma for women (senior secondary diploma), but later on, because of cases of fraud, the programme organized an additional examination to verify candidates’ knowledge in French, Maths, and General Knowledge. Those first contract teachers, called “BM contract” because the programme was partly subsidised

12
through the World Bank (Banque Mondiale in French), were trained in two different ways: 9 months of theoretical training followed by 9 months of practical training, or 3 months of theory, followed by 9 months of practice, then 3 months of theory again. The latest programme, in place since November 2002, recruits “PEPT contract” teachers (PEPT = Education For All Programme) through a newer formula, decided based on the results of the first cohorts, of 9 months of theoretical training followed by 9 months of practice and 3 months of theory.
4. Mali (2002):
As in the case of Guinea, the goal of the Mali study was to assess the impact of contract teachers on students as compared to that of civil servants. Indeed, new teachers recruited between 1998 and 2002 have mainly been contract teachers (the hiring of contract teachers began in 1991): 57% were community teachers, 30% State contract teachers, and 14% civil servants. As a consequence, in 2001, contract teachers (State contract teachers and community teachers) taken together represented around one third of the work force [PASEC/CONFEMEN, 2004a]. More recent national data (for example [Maga et al, 2006] p 112) confirm the very sharp increase in the number of contract teachers, since civil servants represented, in 2003-2004, only 23.1% of the primary school teaching force, contract teachers 69.0%, and “vacataires” (a precarious status of teachers) 4.8% of the workforce. The table below does not differentiate between contract teachers paid by the State and community teachers paid by local communities. We however know that [Bourdon et al, 2007], in 2004, there were approximately as many teachers of each category. Table 9: Status of teachers in Mali as given by national data in 2001
All Mali Civil servants State and community contract teachers
% 67 33 *source: « enseignants contractuels et qualité de l’école fondamentale au Mali : quels enseignements ? », PASEC, 2004 [PASEC/CONFEMEN, 2004a] The sample below reflects the choice to make a comparative study of different kinds of teachers: around half the teachers studied were civil servants and half contract teachers. The goal was to have, for each contract teacher, a civil servant teacher from a nearby school, in order to increase comparability. Table 10: Status of teachers in the sample of the Mali PASEC evaluation (2002)
Mali sample Civil servants (fonctionnaires)
Trainees (stagiaires)
State and community contract teachers
Count 124 4 143
% 45.8 1.5 52.8 Missing answers: 4 teachers (less than 2% of the sample) did not reply to the question about status This sample was not meant to reflect the percentages of each category of teachers at the time of the study, therefore, while global data for the whole sample will be given, whenever differences between the two categories are significant, separate percentages for each category of teacher will be given as they will be more meaningful.
5. Niger (2002):
Before 1998, only the status of teacher and assistant teacher, recruited as civil servants after an initial training of 1 to 2 years, and that of “moniteur” (“instructor”), recruited as civil servants at a lower level of education and with an initial training of 1 year, existed. Since 1998, new modes of recruitment have been decided: contract teachers. Those have either received training as civil servants do, in a teacher training institution, or are required to receive a 45 days training before entering the workforce. In 2002, contract teachers represented 55% of the total workforce [PASEC/CONFEMEN, 2004b]. 2003 data [Bourdon et al, 2007] show almost all of those are paid by the State. Table 11: Status of teachers in Niger as given by national data (2002)
All Niger Civil servant Contract teacher % 45 55

13
The goal of the Niger study was to compare civil servants and contract teachers (called “volunteers”). The sample was thus devised to have enough teachers of each of those two categories. The intention was to have the same number of teachers of each group, but this was not possible. Table 12: Status of teachers in the sample of the Niger PASEC evaluation (2002)
Niger Sample Teacher Assistant Instructor Volunteer
Count 40 115 3 96
% 15.7 45.3 1.2 37.8 Missing answers: 5 teachers (2% of the sample) did not reply to the question about status When interpreting the data coming from the Niger teacher sample, it will be necessary to bear in mind that the sample of teachers which was assessed did not correspond exactly to the composition of the Niger workforce. It will thus often be useful to disaggregate teacher data by status.
6. Togo (2001):
The case of Togo is a little particular. After 1983, the level of academic training required to become a teacher has been raised from the BEPC (Junior secondary qualification) to the Baccalauréat (A level) in parallel with the diminution of the initial professional training from 3 years to 1 year. Since 1983, however, only 3 promotions of teachers have been given initial professional training (1 year long), which means around 2/3 of existing teachers never got such training.
In order to compensate for that lack of initial training, Togo set in place 3-months in-service training sessions for untrained teachers, with the help of the World Bank.
The goal of the study was to compare different teacher profiles, and, to achieve that aim, to have all the variety of situations represented inside the sample [PASEC/CONFEMEN, 2004d].
Proportions of each category of teacher in the general country population: Table 13: Status of teachers in Togo as given by national data (2000-2001)
All Togo (2000-2001) Civil servants Auxiliaries Temporary / Volunteers
Count 5377 7985 2527
% 33.8 50.3 15.9
Auxiliaries are teachers recruited by the State directly after their studies to become contract teachers. “Volunteers”, also called “temporary teachers” have no pre-service training either and are most of the time directly recruited by parents’ associations. The category of civil servants includes “instituteurs”, “adjoints”, and “moniteurs” (instructors).
Below are the proportions of each category of teachers in the Togo sample: Table 14: Status of teachers in the sample of the Togo PASEC evaluation (2001)
Togo sample Teacher Assistant Instructor Auxiliaries Volunteers
Count 67 49 19 57 28
% 30.5 22.3 8.6 25.9 12.7
Togo Sample Civil servants Contract teachers Community teachers
61.4 25.9 12.7 Missing answers: the status of 3 teachers (1% of the sample) was unavailable The proportions in the sample are not identical to those in the general population: it has proven necessary, in order to compare the impact of different levels of training (and in particular the 3-years training which concerns a low percentage of the teacher population) to over represent the category of civil servants. Therefore, while global data for the whole sample will be given, whenever differences between the two categories are significant, separate percentages for each category of teacher will be given as they will be more meaningful.
14
7. Comparison of employment status across the 6 countries:
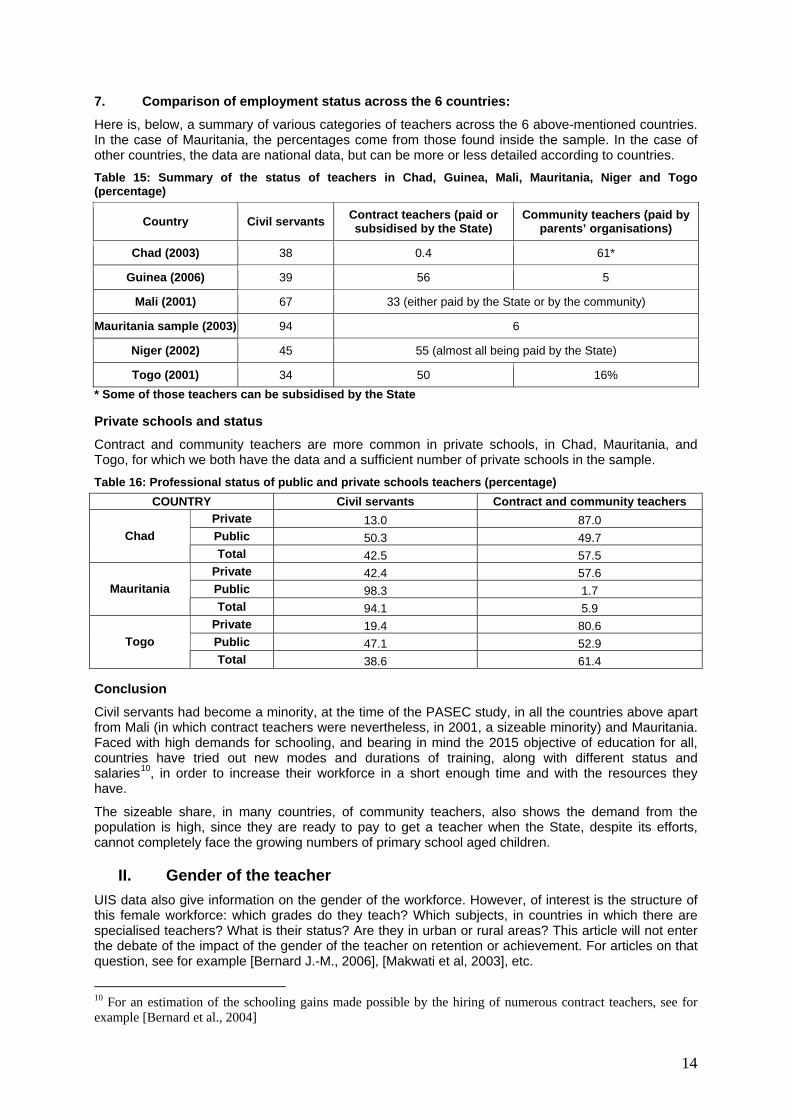
Here is, below, a summary of various categories of teachers across the 6 above-mentioned countries. In the case of Mauritania, the percentages come from those found inside the sample. In the case of other countries, the data are national data, but can be more or less detailed according to countries. Table 15: Summary of the status of teachers in Chad, Guinea, Mali, Mauritania, Niger and Togo (percentage)
Country Civil servants Contract teachers (paid or subsidised by the State)
Community teachers (paid by parents’ organisations)
Chad (2003) 38 0.4 61*
Guinea (2006) 39 56 5
Mali (2001) 67 33 (either paid by the State or by the community)
Mauritania sample (2003) 94 6
Niger (2002) 45 55 (almost all being paid by the State)
Togo (2001) 34 50 16% * Some of those teachers can be subsidised by the State Private schools and status
Contract and community teachers are more common in private schools, in Chad, Mauritania, and Togo, for which we both have the data and a sufficient number of private schools in the sample. Table 16: Professional status of public and private schools teachers (percentage)
COUNTRY Civil servants Contract and community teachers Private 13.0 87.0 Public 50.3 49.7 Chad Total 42.5 57.5
Private 42.4 57.6 Public 98.3 1.7 Mauritania Total 94.1 5.9
Private 19.4 80.6 Public 47.1 52.9 Togo Total 38.6 61.4
Conclusion
Civil servants had become a minority, at the time of the PASEC study, in all the countries above apart from Mali (in which contract teachers were nevertheless, in 2001, a sizeable minority) and Mauritania. Faced with high demands for schooling, and bearing in mind the 2015 objective of education for all, countries have tried out new modes and durations of training, along with different status and salaries10, in order to increase their workforce in a short enough time and with the resources they have.
The sizeable share, in many countries, of community teachers, also shows the demand from the population is high, since they are ready to pay to get a teacher when the State, despite its efforts, cannot completely face the growing numbers of primary school aged children.
II. Gender of the teacher UIS data also give information on the gender of the workforce. However, of interest is the structure of this female workforce: which grades do they teach? Which subjects, in countries in which there are specialised teachers? What is their status? Are they in urban or rural areas? This article will not enter the debate of the impact of the gender of the teacher on retention or achievement. For articles on that question, see for example [Bernard J.-M., 2006], [Makwati et al, 2003], etc.
10 For an estimation of the schooling gains made possible by the hiring of numerous contract teachers, see for example [Bernard et al., 2004]
15
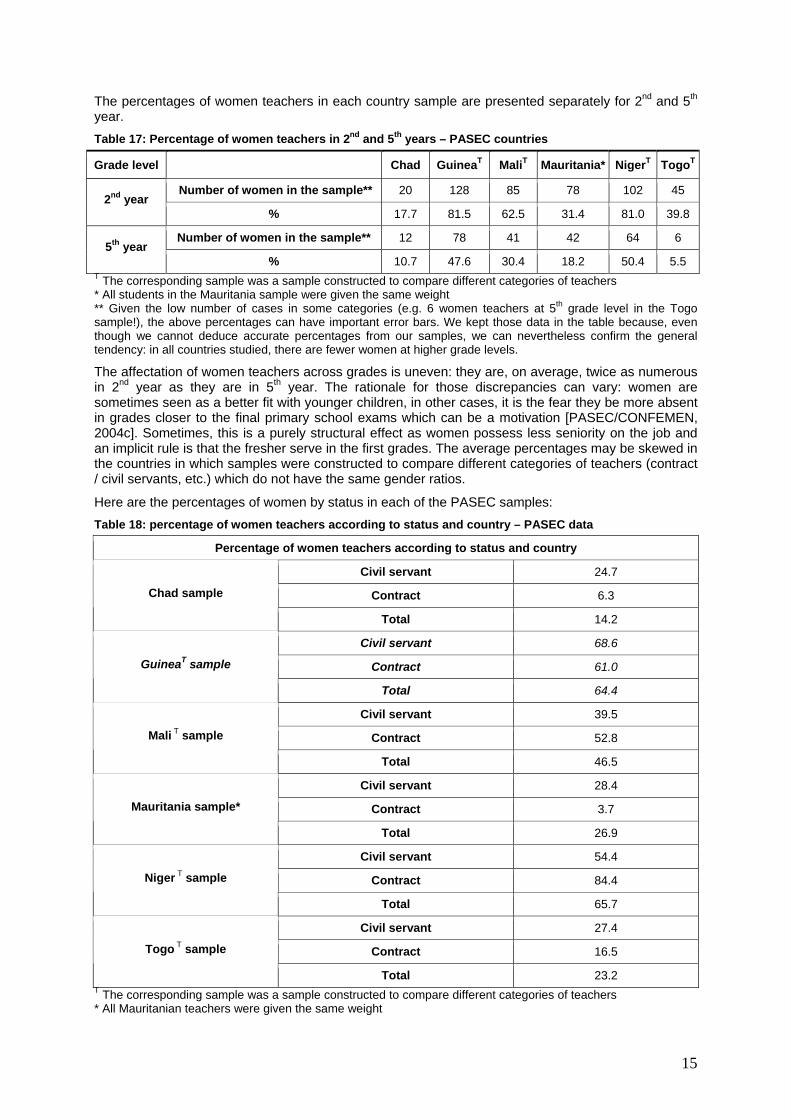
The percentages of women teachers in each country sample are presented separately for 2nd and 5th year. Table 17: Percentage of women teachers in 2nd and 5th years – PASEC countries
Grade level Chad GuineaT MaliT Mauritania* NigerT TogoT
Number of women in the sample** 20 128 85 78 102 45 2nd year
% 17.7 81.5 62.5 31.4 81.0 39.8
Number of women in the sample** 12 78 41 42 64 6 5th year
% 10.7 47.6 30.4 18.2 50.4 5.5 T The corresponding sample was a sample constructed to compare different categories of teachers * All students in the Mauritania sample were given the same weight ** Given the low number of cases in some categories (e.g. 6 women teachers at 5th grade level in the Togo sample!), the above percentages can have important error bars. We kept those data in the table because, even though we cannot deduce accurate percentages from our samples, we can nevertheless confirm the general tendency: in all countries studied, there are fewer women at higher grade levels.
The affectation of women teachers across grades is uneven: they are, on average, twice as numerous in 2nd year as they are in 5th year. The rationale for those discrepancies can vary: women are sometimes seen as a better fit with younger children, in other cases, it is the fear they be more absent in grades closer to the final primary school exams which can be a motivation [PASEC/CONFEMEN, 2004c]. Sometimes, this is a purely structural effect as women possess less seniority on the job and an implicit rule is that the fresher serve in the first grades. The average percentages may be skewed in the countries in which samples were constructed to compare different categories of teachers (contract / civil servants, etc.) which do not have the same gender ratios.
Here are the percentages of women by status in each of the PASEC samples: Table 18: percentage of women teachers according to status and country – PASEC data
Percentage of women teachers according to status and country
Civil servant 24.7
Contract 6.3 Chad sample
Total 14.2
Civil servant 68.6
Contract 61.0 GuineaT sample
Total 64.4
Civil servant 39.5
Contract 52.8 Mali T sample
Total 46.5
Civil servant 28.4
Contract 3.7 Mauritania sample*
Total 26.9
Civil servant 54.4
Contract 84.4 Niger T sample
Total 65.7
Civil servant 27.4
Contract 16.5 Togo T sample
Total 23.2 T The corresponding sample was a sample constructed to compare different categories of teachers * All Mauritanian teachers were given the same weight
16
Women are significantly more numerous among civil servants than among contract teachers in Chad and Mauritania. The discrepancy is less important in the Togo sample. However, they represent a higher percentage of contract teachers than of civil servants in Mali and Niger.
In the Guinea sample, women teachers are overrepresented compared to the percentage in the general workforce given by the Ministry for the 2004-2005 school year: 34% of women in 2nd grade and 17% in 5th grade [PASEC/CONFEMEN, 2004c]. It was already the case in the previous PASEC study, due to the nature of the sample studied (see detail below).
Urban / rural discrepancies: Technical considerations:
Once again, the discrepancies one can make out are less accurate in countries like Guinea, Mali, Niger or Togo where the samples were not meant to represent the school population of the country, but to compare different categories of teachers.
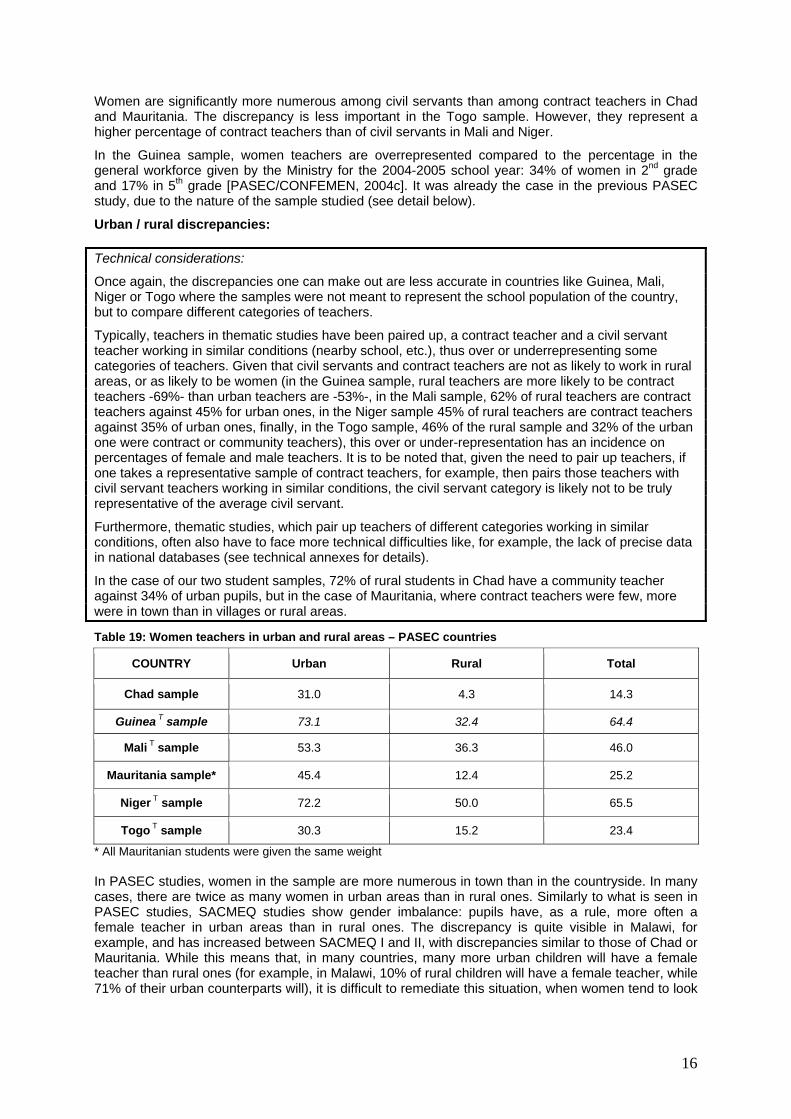
Typically, teachers in thematic studies have been paired up, a contract teacher and a civil servant teacher working in similar conditions (nearby school, etc.), thus over or underrepresenting some categories of teachers. Given that civil servants and contract teachers are not as likely to work in rural areas, or as likely to be women (in the Guinea sample, rural teachers are more likely to be contract teachers -69%- than urban teachers are -53%-, in the Mali sample, 62% of rural teachers are contract teachers against 45% for urban ones, in the Niger sample 45% of rural teachers are contract teachers against 35% of urban ones, finally, in the Togo sample, 46% of the rural sample and 32% of the urban one were contract or community teachers), this over or under-representation has an incidence on percentages of female and male teachers. It is to be noted that, given the need to pair up teachers, if one takes a representative sample of contract teachers, for example, then pairs those teachers with civil servant teachers working in similar conditions, the civil servant category is likely not to be truly representative of the average civil servant.
Furthermore, thematic studies, which pair up teachers of different categories working in similar conditions, often also have to face more technical difficulties like, for example, the lack of precise data in national databases (see technical annexes for details).
In the case of our two student samples, 72% of rural students in Chad have a community teacher against 34% of urban pupils, but in the case of Mauritania, where contract teachers were few, more were in town than in villages or rural areas.
Table 19: Women teachers in urban and rural areas – PASEC countries
COUNTRY Urban Rural Total
Chad sample 31.0 4.3 14.3
Guinea T sample 73.1 32.4 64.4
Mali T sample 53.3 36.3 46.0
Mauritania sample* 45.4 12.4 25.2
Niger T sample 72.2 50.0 65.5
Togo T sample 30.3 15.2 23.4
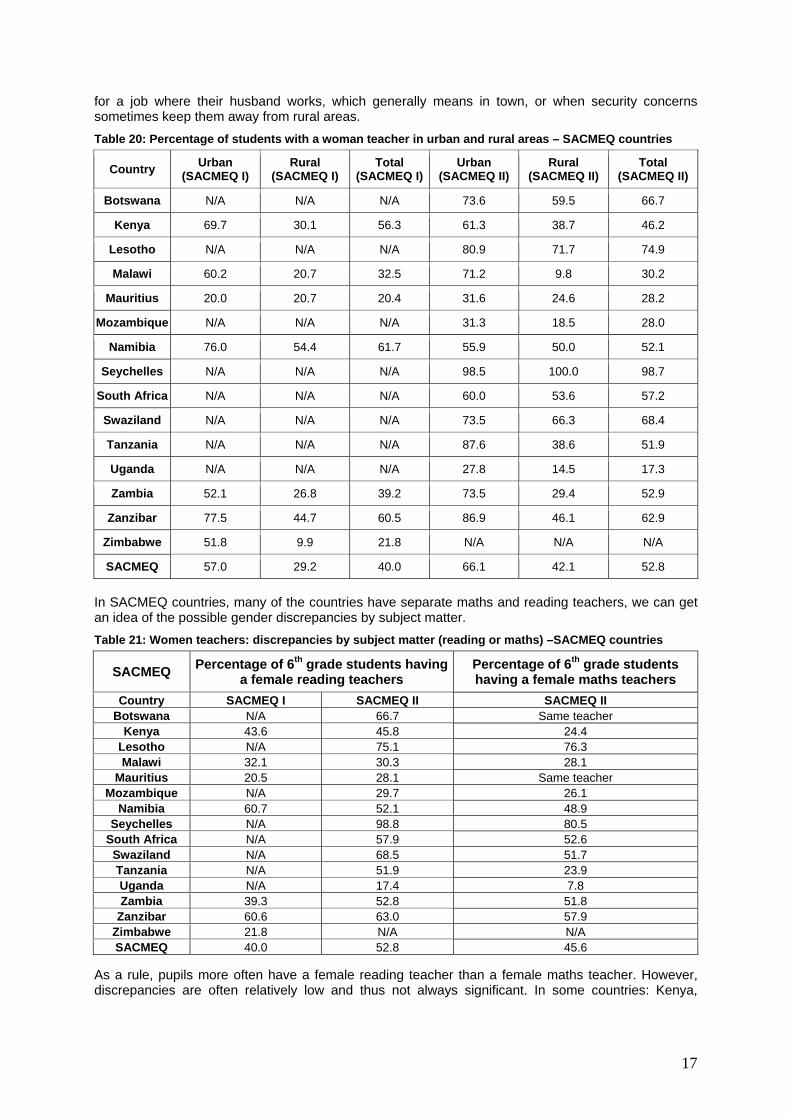
* All Mauritanian students were given the same weight In PASEC studies, women in the sample are more numerous in town than in the countryside. In many cases, there are twice as many women in urban areas than in rural ones. Similarly to what is seen in PASEC studies, SACMEQ studies show gender imbalance: pupils have, as a rule, more often a female teacher in urban areas than in rural ones. The discrepancy is quite visible in Malawi, for example, and has increased between SACMEQ I and II, with discrepancies similar to those of Chad or Mauritania. While this means that, in many countries, many more urban children will have a female teacher than rural ones (for example, in Malawi, 10% of rural children will have a female teacher, while 71% of their urban counterparts will), it is difficult to remediate this situation, when women tend to look
17
for a job where their husband works, which generally means in town, or when security concerns sometimes keep them away from rural areas. Table 20: Percentage of students with a woman teacher in urban and rural areas – SACMEQ countries
Country Urban (SACMEQ I)
Rural (SACMEQ I)
Total (SACMEQ I)
Urban (SACMEQ II)
Rural (SACMEQ II)
Total (SACMEQ II)
Botswana N/A N/A N/A 73.6 59.5 66.7
Kenya 69.7 30.1 56.3 61.3 38.7 46.2
Lesotho N/A N/A N/A 80.9 71.7 74.9
Malawi 60.2 20.7 32.5 71.2 9.8 30.2
Mauritius 20.0 20.7 20.4 31.6 24.6 28.2
Mozambique N/A N/A N/A 31.3 18.5 28.0
Namibia 76.0 54.4 61.7 55.9 50.0 52.1
Seychelles N/A N/A N/A 98.5 100.0 98.7
South Africa N/A N/A N/A 60.0 53.6 57.2
Swaziland N/A N/A N/A 73.5 66.3 68.4
Tanzania N/A N/A N/A 87.6 38.6 51.9
Uganda N/A N/A N/A 27.8 14.5 17.3
Zambia 52.1 26.8 39.2 73.5 29.4 52.9
Zanzibar 77.5 44.7 60.5 86.9 46.1 62.9
Zimbabwe 51.8 9.9 21.8 N/A N/A N/A
SACMEQ 57.0 29.2 40.0 66.1 42.1 52.8
In SACMEQ countries, many of the countries have separate maths and reading teachers, we can get an idea of the possible gender discrepancies by subject matter. Table 21: Women teachers: discrepancies by subject matter (reading or maths) –SACMEQ countries
SACMEQ Percentage of 6th grade students having a female reading teachers
Percentage of 6th grade students having a female maths teachers
Country SACMEQ I SACMEQ II SACMEQ II Botswana N/A 66.7 Same teacher
Kenya 43.6 45.8 24.4 Lesotho N/A 75.1 76.3 Malawi 32.1 30.3 28.1
Mauritius 20.5 28.1 Same teacher Mozambique N/A 29.7 26.1
Namibia 60.7 52.1 48.9 Seychelles N/A 98.8 80.5
South Africa N/A 57.9 52.6 Swaziland N/A 68.5 51.7 Tanzania N/A 51.9 23.9 Uganda N/A 17.4 7.8 Zambia 39.3 52.8 51.8
Zanzibar 60.6 63.0 57.9 Zimbabwe 21.8 N/A N/A SACMEQ 40.0 52.8 45.6
As a rule, pupils more often have a female reading teacher than a female maths teacher. However, discrepancies are often relatively low and thus not always significant. In some countries: Kenya,

18
Tanzania, and Uganda, though, around twice as many children have a female reading teacher as a male one.
Conclusions:
Women tend to teach lower classes (at least in PASEC countries), and be in urban areas (in big cities or at least in small towns) in all countries. It might have been expected they would hold more stable jobs, thus be less present among contract teachers, but this is not true in all countries. It must be noted that specific female-oriented recruitment policies have sometimes been set in place in order to recruit female contract teachers, and that the status of those teachers can also vary (some are hired by the State, others are hired by the communities). For example, Guinea accepts women candidates with a senior secondary school diploma while male candidates need an A level.
III. Teachers’ age and experience 1. Age:
The table below presents the average ages of the teachers present in the various samples, keeping in mind that, contract teachers being on average younger, samples which slightly misrepresent their prevalence inside the teacher population can change this estimated average age.
Some teachers did not reply to the question, but the number of missing answers remains relatively low in most countries (1.5% and 1.9% in Mali and Niger, 3.5% and 4% in Chad and Guinea, 6.3% in Togo). The number of missing answers for experience and age are comparable. Table 22: Teachers’ age: average and percentages of teachers in various age ranges – PASEC countries
Teachers’ age Country Mean N Std. Deviation Median < 28 (%) 28 – 32 (%) 33 – 39 (%) > 39 (%)
Chad 34.4 217 8.1 34 20.3 24.9 30.4 24.5
GuineaT 34.4 310 6.9 34 15.2 31.3 32.6 20.9
MaliT 36.7 271 8.7 35 18.1 20.3 22.5 39.1
Mauritania 33.4 407 6.8 32 16.4 35.6 29.9 18.1
NigerT 31.8 254 6.0 30 22.8 38.2 26.8 12.2
TogoT 38.8 223 7.7 39 7.6 16.5 27.9 48.0 T The corresponding sample was a sample constructed to compare different categories of teachers
Table 23: Teachers’ age: average and percentage of students with teachers in various age ranges – SACMEQ countries
(Reading)Teacher’s average age
Country SACMEQ I SACMEQ II Std. Deviation Median < 28 28 - 32 33 - 39 > 39
Botswana N/A 34.9 7.4 34.0 16.0 25.3 33.8 25.0 Kenya 36.6 37.6 7.8 37.0 11.4 16.4 31.0 41.1
Lesotho N/A 41.1 9.4 42.0 7.2 14.2 20.7 57.9 Malawi 30.7 32.4 6.9 31.0 24.3 37.3 25.8 12.5
Mauritius 43.2 44.9 8.0 46.0 2.3 9.3 13.8 74.8 Mozambique N/A 32.8 7.8 31.0 28.8 25.0 30.1 16.1
Namibia 33.2 34.7 7.5 34.0 17.6 23.1 36.9 22.4 Seychelles N/A 38.5 11.2 40.3 20.6 20.6 7.3 51.6
South Africa N/A 38.9 8.5 38.0 5.2 21.4 30.2 43.3 Swaziland N/A 34.7 7.3 33.0 15.1 33.2 26.3 25.5 Tanzania N/A 38.0 7.5 38.0 9.8 18.8 25.1 46.2 Uganda N/A 33.1 7.5 31.0 29.6 32.0 18.3 20.1 Zambia 31.8 35.8 8.8 34.5 23.3 20.8 22.6 33.3
Zanzibar 31.5 33.7 6.7 34.0 20.8 27.4 33.3 18.5 Zimbabwe 31.9 N/A N/A N/A N/A N/A N/A N/A SACMEQ 34.1 36.4 8.8 35.0 16.5 23.2 25.3 34.9

19
In most countries, and especially in PASEC ones, the average age of students’ teachers tends to be quite low: in 13 countries out of 21, teachers are on average less than 35 years old. Average ages range from 31.8 years in Niger, 32.4 years in Malawi, and 32.8 years in Mozambique, to almost 45 years old in Mauritius. Ages range from 19 to 66 years in PASEC countries, and from 19 to 65 in SACMEQ countries. In Niger, the oldest teacher of the sample was 48 years old, while the age of the youngest teacher in individual countries’ samples range from 19 to 24, a probable reflection of hiring policies (pre-service and academic qualifications required)11.
Most of the teachers are very young. There are a few exceptions, like Mauritius (around 45 years old on average for 6th grade teachers), where the proportion of students with a teacher over 40 is ¾ in the 6th grade population, however, the average age in half of the countries is under 35.
In some of those countries, the young age of students’ teachers can be explained by important hiring of teachers to meet increasing demands. Age is also lower when life expectancy is shorter.
In Niger, gross enrolment rates in primary schools grew from 29% in 1990 to 48% in 2003: this increase was faced through the hiring of numerous young new teachers (most of them contract teachers). This is the case for many other PASEC countries: Guinea’s gross enrolment rate in primary schools grew, in the same period, from 34% to 81%, in Mauritania the increase was from 49% to 88%, Mali also made important efforts, its primary school gross enrolment rates grew from 53% to 64% between 2000 and 2004 [PASEC/CONFEMEN, 2004c], [UIS, 2007]. Despite evolutions in the quality of data collection which partly contribute to data changes, important efforts have obviously been made.
Some SACMEQ countries also faced similar challenges, with the abolition of school fees: the decision to suppress school fees was made in 1994 in Malawi, and 1997 in Uganda.
Other countries followed, but when they did so after 2000, the effect cannot be visible in the table above: Kenya suppressed school fees in 2003, Zambia in 2002, Tanzania in 2001, and Lesotho started with standard one in 2000, rolling annually standard by standard so that, in 2006, all primary education be free.
2. Experience:
The table below presents the experience of the teachers present in the various samples. One should be cautions with the Guinea, Mali, Niger and Togo samples since those samples were not representative of the students’ population, and, as such, will lead to different interpretations. It is expected that age and experience will be strongly correlated, even though ages of entry in the profession vary depending on the academic credentials and in-service required of the future teachers. Table 24: Teachers’ experience: average and percentages of teachers in the sample in various experience ranges – PASEC countries
Country Mean N SD Median 1 year 2 - 5 years
6 - 10 years
11 - 15 years
> 15 years
Chad 7.8 215 7.4 6 10.7 38.1 26.5 13.0 11.6
GuineaT 7.3 (7) 318 5.9 6 2.8 46.5 34.9 8.2 7.5
MaliT 11.4 (15) 271 10.3 6 10.7 33.6 16.2 3.7 35.8
Mauritania* 8.9 433 7.5 7 8.5 35.8 23.8 14.3 17.6
NigerT 7.9 (6) 254 7.5 4 10.6 49.2 11.4 10.2 18.5
TogoT 12.1 (9) 223 8.3 9 3.1 23.3 30.9 7.6 35.0 T The corresponding sample was a sample constructed to compare different categories of teachers The percentage of missing answers ranges from 0.4% in Mauritania to 6.4% in Togo. In parenthesis and in red are approximate “corrected values” taking into account the specific characteristics of the sample in the corresponding countries. * In the above table, all Mauritanian teachers were given the same weight
11 Due to survey design in PASEC thematic operations the necessity to select, on one hand, a contract teacher and, on the other hand, a civil servant could bias the average age of the second type.

20
Table 25: Teachers’ experience: average and percentages of studies with teachers in various experience ranges – SACMEQ countries
Country SACMEQ I SACMEQ II SD Median 1 year 2-5 years
6 - 10 years
11 - 15 years
> 16 years
Botswana N/A 10.8 6.7 10.0 5.0 19.3 28.0 22.3 25.5
Kenya 12.7 14.0 8.0 13.5 2.9 13.0 21.2 25.1 37.8
Lesotho N/A 16.6 10.0 14.7 1.0 9.5 23.3 18.0 48.3
Malawi 6.8 7.7 5.4 7.0 0.8 30.8 54.1 8.8 5.5
Mauritius 20.2 21.7 8.6 24.0 0.0 3.0 14.3 10.8 72.0
Mozambique N/A 9.9 8.2 6.0 8.9 39.4 9.7 13.2 28.8
Namibia 9.3 10.0 7.2 10.0 6.5 27.9 21.6 25.4 18.6
Seychelles N/A 19.8 12.5 23.0 1.3 15.0 20.3 5.3 58.3
South Africa N/A 14.2 7.6 13.0 1.0 10.8 29.4 18.3 40.5
Swaziland N/A 10.1 6.9 9.0 9.4 20.9 28.1 22.2 19.4
Tanzania N/A 14.1 7.8 15.0 4.0 14.4 22.2 11.4 48.0
Uganda N/A 8.6 7.9 7.0 10.5 35.0 28.5 11.1 14.9
Zambia 7.7 11.5 8.8 10.4 12.0 25.5 12.5 13.3 36.7
Zanzibar 10.4 13.1 13.5 9.0 12.0 17.9 27.4 12.3 30.4
Zimbabwe 8.4 N/A N/A N/A N/A N/A N/A N/A N/A
SACMEQ N/A N/A 9.6 11.0 5.4 20.2 24.3 15.5 34.7 On average, 2nd year students hace less experienced teachers than 5th year ones. The mean experience of 2nd year students’ teachers is 8.3 while it is 9.6 for 5th year students’ teachers, but situations sometimes differ according to countries.
The meaning of the numbers in the tables above varies according to the constitution of the sample, indeed, contract teachers are most of the time less experienced than civil servants, so a sample which does not follow the proportion of teachers of each status in the teachers population of the country will yield inaccurate results in terms of both age and experience.
The Guinea statistics in the table nethertheless clearly reflect the sudden hiring of a very high number of contract teachers since 1998, who now have less than 7 years of experience.
How much does experience vary with status? Below is the average experience for each country and broad professional status category, along with the percentages of the total teacher population those categories represent. Table 26: Average teacher experience and experience range disaggregated by professional status, and percentages of teachers of the corresponding status in the teacher population –PASEC countries
Country Civil servants Contract teachers (paid or subsidised by the State) and community teachers (paid by parents’ organisations)
Chad 9.8 [1-39]
38% 6.2 [1-23]
62%
Guinea 11.0 [2-31]
39% 4.4 [1-12]
61%
Mali 20.0 [0-38]
67% 3.7 [0-25]
33%
21
Mauritania* 9.0 [0-42]
94% 7.2 [1-44]
6%
Niger 11.3 [0-30]
45% 2.2 [0-4]
55%
Togo 15.9 [1-29]
34% 6.1 [1-30]
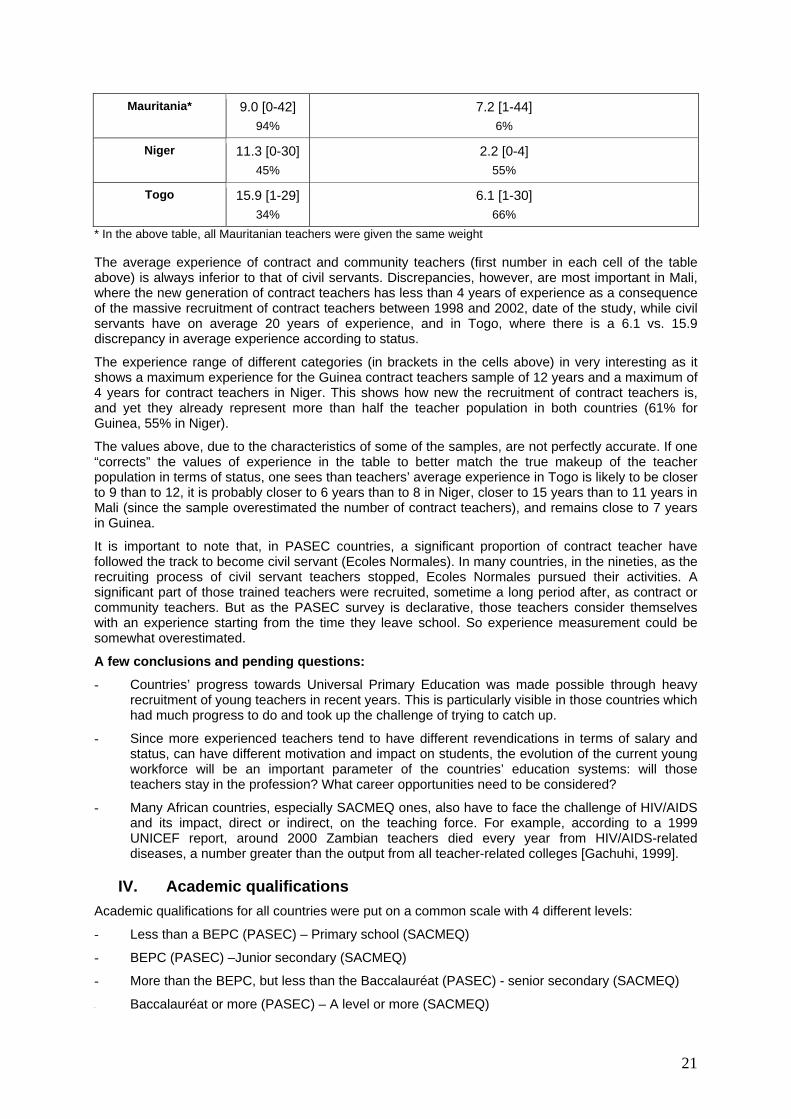
66% * In the above table, all Mauritanian teachers were given the same weight The average experience of contract and community teachers (first number in each cell of the table above) is always inferior to that of civil servants. Discrepancies, however, are most important in Mali, where the new generation of contract teachers has less than 4 years of experience as a consequence of the massive recruitment of contract teachers between 1998 and 2002, date of the study, while civil servants have on average 20 years of experience, and in Togo, where there is a 6.1 vs. 15.9 discrepancy in average experience according to status.
The experience range of different categories (in brackets in the cells above) in very interesting as it shows a maximum experience for the Guinea contract teachers sample of 12 years and a maximum of 4 years for contract teachers in Niger. This shows how new the recruitment of contract teachers is, and yet they already represent more than half the teacher population in both countries (61% for Guinea, 55% in Niger).
The values above, due to the characteristics of some of the samples, are not perfectly accurate. If one “corrects” the values of experience in the table to better match the true makeup of the teacher population in terms of status, one sees than teachers’ average experience in Togo is likely to be closer to 9 than to 12, it is probably closer to 6 years than to 8 in Niger, closer to 15 years than to 11 years in Mali (since the sample overestimated the number of contract teachers), and remains close to 7 years in Guinea.
It is important to note that, in PASEC countries, a significant proportion of contract teacher have followed the track to become civil servant (Ecoles Normales). In many countries, in the nineties, as the recruiting process of civil servant teachers stopped, Ecoles Normales pursued their activities. A significant part of those trained teachers were recruited, sometime a long period after, as contract or community teachers. But as the PASEC survey is declarative, those teachers consider themselves with an experience starting from the time they leave school. So experience measurement could be somewhat overestimated.
A few conclusions and pending questions:
- Countries’ progress towards Universal Primary Education was made possible through heavy recruitment of young teachers in recent years. This is particularly visible in those countries which had much progress to do and took up the challenge of trying to catch up.
- Since more experienced teachers tend to have different revendications in terms of salary and status, can have different motivation and impact on students, the evolution of the current young workforce will be an important parameter of the countries’ education systems: will those teachers stay in the profession? What career opportunities need to be considered?
- Many African countries, especially SACMEQ ones, also have to face the challenge of HIV/AIDS and its impact, direct or indirect, on the teaching force. For example, according to a 1999 UNICEF report, around 2000 Zambian teachers died every year from HIV/AIDS-related diseases, a number greater than the output from all teacher-related colleges [Gachuhi, 1999].
IV. Academic qualifications Academic qualifications for all countries were put on a common scale with 4 different levels:
- Less than a BEPC (PASEC) – Primary school (SACMEQ)
- BEPC (PASEC) –Junior secondary (SACMEQ)
- More than the BEPC, but less than the Baccalauréat (PASEC) - senior secondary (SACMEQ)
- Baccalauréat or more (PASEC) – A level or more (SACMEQ)

22
We have added, when we had the information, the percentage of teachers with a tertiary qualification. Table 27: Teachers’ academic qualifications – PASEC countries
Country < BEPC BEPC BEPC< <Baccalauréat Baccalauréat or more Tertiary
Count 29 39 86 68 N/A Chad
% 13.1 17.6 38.7 30.6 N/A
Count 2 16 168 132 23 GuineaT
% 0.6 5.0 52.8 41.5 7.2
Count 8 22 212 29 N/A MaliT
% 3.0 8.1 78.2 10.7 N/A
Count 23 134 3 270 89 Mauritania*
% 5.1 31.0 0.8 62.3 21.1
Count 8 90 94 61 N/A NigerT
% 3.2 35.6 37.2 24.1 N/A
Count 41 33 111 38 N/A TogoT
% 18.4 14.8 49.8 17.0 N/A
PASEC % 7.2 18.7 42.9 31.0 N/A T The corresponding sample was a sample constructed to compare different categories of teachers Missing answers: Chad: 1.3% (3 cases), Guinea: 1.5% (5 cases), Mali: 1.5% (4 cases), Niger: 1.9% (5 cases), Mauritania: 3.1% (14 cases), Togo: 6.3% (15 cases). * In the above table, all Mauritanian students were given the same weight –the difference with giving the same weight to all teachers does not exceed 1%
Table 28: Teachers’ academic qualifications – SACMEQ countries
Country Primary school
Junior secondary Senior secondary A level or more Tertiary
Botswana 8.2 47.4 30.1 14.2 5.8 Kenya 0.5 2.3 78.4 18.9 1.8
Lesotho 51.1 11.7 15.5 21.8 5.5 Malawi 0.8 35.7 63.4 0.2 0
Mauritius 0.0 0 55 45.0 2.6 Mozambique 3.4 17.6 75.4 3.7 0.15
Namibia 17.7 8.9 46.1 29.5 11.6 Seychelles 1.3 7.3 32.0 59.5 6.0
South Africa 30.2 3.6 18.9 47.3 26.4 Swaziland 9.3 2.1 16.0 72.7 11.6 Tanzania 16.5 79.4 1.9 2.3 0.25 Uganda 2.4 1.1 59.0 37.7 4.8 Zambia 10.2 6.0 71.6 12.2 0.6
Zanzibar 0.8 8.5 83.6 7.1 0.0 Zimbabwe N/A N/A N/A N/A N/A SACMEQ II 10.8 16.6 45.3 27.3 5.5
Statistics in PASEC and SACMEQ countries taken as a whole seem to have almost teachers with almost the same average qualifications. Though the figures for either group are not identical, much bigger and significant differences are to be found between individual countries.
From the tables, we can gather that, in many countries, the wide majority of teachers have at least a lower secondary diploma. Understandably, the countries with the lowest percentages of students with a teacher who only has a primary school qualification include Seychelles and Mauritius, but also Zanzibar, Malawi, Kenya, and Guinea –wealth, shortage of teachers and thus hiring policies today and in past history, as well as attraction for the profession, are among the explanatory factors-. Malawi has both a low percentage of students with a teacher with just a primary school education and a low percentage of students with a teacher with an A level or more. South Africa, on the other hand, due to
23
its racial segregation history (which led to schools and teachers of very different qualities for pupils of different racial backgrounds), has one of the highest shares of students with teachers only having a primary school education while also having the highest share of students with teachers who have a tertiary degree.
The highest percentages of students whose teacher only has a primary school qualification are in Lesotho (the only country in which they represent more than 50% of the total) and South Africa (a little less than one third), Togo, Namibia and Tanzania (around 1/6 of the total each).
In PASEC countries, the use of contract teachers had varying impacts on academic qualifications, mainly related to the policy for the recruitment of those teachers: in Chad, community teachers in the sample are on average less educated than civil servants, and it is the same with contract/community teachers in Togo. On the other hand, one cannot make accurate statistics with the few contract teachers there are in Mauritania. In Guinea and Mali, though, the average academic diploma of contract/community teachers appears higher. In Niger, the situation of contract teachers seems almost the same (a little better) than that of civil servants, in terms of academic diplomas.
The number of candidates to the teaching profession today can be concerning, though. One example is the case of Guinea which had 3086 candidates for 1077 posts in 2004, but only 1953 candidates for 1859 posts in 2005.
When looking at the detail of teachers’ diploma according to grade level, it appears that, logically, in all PASEC countries, the lower diplomas are more often affected in 2nd year than they are in 5th year. However, while, in Guinea, and Niger, 5th year teachers without a lower secondary grade diploma represent less than 1% of the total sample (1 individual in our sample), and in Mali and Mauritania less or around 5% corresponding to only a few cases, in Togo and Chad, around one 5th year teacher in ten appears not to have obtained a BEPC. The structure of the SACMEQ sample, thus, can be different from that of the whole primary school teaching force: in some cases, as in PASEC countries, the best-educated teachers will be more present in the highest grades.
Conclusions and pending questions: The data above raise the question of the ability of the school systems to attract, motivate and keep highly qualified teachers12.
Interpreting the above data also requires to have an idea of what the desirable level of education is, for example through assessment of the impact of different categories of teachers on children and of the system’s ability to keep those teachers motivated enough to stay. Several studies have tried to answer the question of the impact of those parameters on children’s learning in an African context (see, for example [Duthilleul and Allen, 2005], [Bourdon et al, 2007], [Bernard et al., 2004], [Michaelowa, 2002] or, for individual countries, PASEC/CONFEMEN country reports).
V. Pre-service training / duration On average, in PASEC countries, 24% of 2nd year teachers have never had any pre-service training. This is also the case of 16% of 5th year teachers. All countries, except Guinea (in which only 1 teacher in the sample has never had any pedagogic training, and teaches 5th year) have lower levels of pedagogic training in 2nd year than in 5th.
The 3 most common situations for PASEC teachers are: no professional training at all, 1 to 3 months of training, and one year or more, but other training lengths (less than 1 month, 3-6 months and 9 months) exist.
In Guinea and Niger, most teachers have a year or more of training. In Chad, around half of the teachers have no training, and half more than 1 year. Mali, Mauritania and Togo all have a significant part of all teachers who received a very short training: 1 to 3 months. Despite the existence of that very short training, more than half of the teachers in the Togo sample have no professional training at all.
Of interest is the comparison of training lengths according to status, especially as the samples constructed in Mali, Niger, and Guinea were specifically made to compare different status of teachers. 12 For example, the number of candidates to become contract teachers in Guinea fell down from 3086 in 2004 to 1953 in 2005 [5]. This is not an isolated phenomenon: recruiting new teachers fitting minimum requirements is a challenge in many countries, including developed ones, some of those resorting to teachers from developing countries to fill in the gaps.

24
Contract teachers may be thought to be teachers with no training at all, but though this is the case of most contract teachers in Chad, Mauritania, and Togo, in Guinea, 99.4% of contract teachers underwent training for more than 1 year. In Mali, 6.3% of contract teachers had no training at all, but the majority (72.5%) underwent a 1 to 3 months long professional training. In Niger, close to 1 contract teacher in 5 (19.8%) received no training, but almost half (42.7%) received a pre-service training of 1 year or more.
Furthermore, a minority of civil servants received no initial training at all, so training and status are not always synonyms. Table 29: Duration of pre-service training, disaggregated according to professional status –PASEC countries
COUNTRY Civil servant Contract and community teacher Total
No training 74.0% 42.1%
< 1 month 4.9 2.8
1-3 months 1.1 9.8 6.0
3-6 months 1.6 0.9
Chad
1 year or more 98.9 9.8 48.1
No training 0.8 0.0 0.3
1 year or more 98.5 99.4 99.0 GuineaT
Others 0.8 0.6 0.7
No training 6.3 3.3
< 1 month 7.7 4.1
1-3 months 72.5 38.0 MaliT
1 year or more 100.0 13.4 54.6
No training 4.3 55.6 7.5
<1 month 1.4 11.1 2.0
1-3 months 15.7 7.4 15.2
3-6 months 3.4 3.7 3.4
6-9 months 44.2 7.4 42.0
Mauritania*
1 year or more 30.9 14.8 29.9
No training 3.8 19.8 9.8
<1 month 0.0 17.7 6.7
1-3 months 0.0 19.8 7.5 NigerT
1 year or more 96.2 42.7 76.0
No training 31.1 82.4 50.9
1-3 months 51.1 4.7 33.2 TogoT
1 year or more 17.8 12.9 15.9 T The corresponding sample was a sample constructed to compare different categories of teachers * In the above table, all Mauritanian teachers were given the same weight Those figures can be related to the countries’ policies: in Guinea, the FIMG programme (“Formation Initiale des Maîtres en Guinée”) specifically trains future contract teachers through 15 or 18 months long pre-service training, so contract teachers and civil servants all had training before entering the

25
workforce. Furthermore, some of the current civil servants began their career as contract teachers, thus 28% of them have in fact undergone an FIMG training.
In Mali, those of the future contract teachers who do not hold a professional diploma have to undergo a 3 months long training session, which explains why this category corresponds to the bulk of contract teachers in Mali.
In Niger, the most common category of contract teachers is a contract teacher who underwent more than 1 year of pre-service training. Almost all of those hold a pedagogical diploma: the CEAPCF, which is the diploma enabling a teacher to become an assistant teacher. Assistant teachers are civil servants, but some of the students who got the diploma were hired as contract teachers.
Pre-service training in SACMEQ countries: Table 30: Duration of pre-service training, disaggregated according to professional status –SACMEQ countries
(Reading) Teachers’ average pre-service
training (duration in years(Reading) teachers’ pre-service duration
Country SACMEQ I SACMEQ II no teacher training < 1 year 1 year 2 years 3 years > 3 years
Botswana N/A 2.2 4.8 1.3 0.0 74.4 10.5 9.0 Kenya 2.1 2.1 1.3 0.8 0.5 87.3 7.9 2.1
Lesotho N/A 2.7 10.0 3.5 4.2 8.7 44.4 29.2 Malawi 1.2 1.5 6.3 20.9 22.4 41.0 6.5 3.0
Mauritius 2.0 2.2 0.3 0.5 11.0 67.0 6.5 14.8 Mozambique N/A 1.8 21.9 14.2 3.3 23.2 31.0 6.4
Namibia 1.9 2.7 3.5 2.3 4.3 26.3 44.9 18.8 Seychelles N/A 2.9 0.5 2.8 5.5 26.0 30.0 35.3
South Africa N/A 3.2 0.5 0.0 2.8 15.8 42.4 38.5 Swaziland N/A 2.7 3.3 0.5 1.5 28.8 54.8 11.0 Tanzania N/A 2.2 0.0 1.3 5.1 67.9 23.2 2.5 Uganda N/A 2.3 4.1 4.4 3.4 56.8 12.7 18.6 Zambia 1.2 2.0 2.3 0.8 1.8 91.6 1.3 2.3
Zanzibar 1.4 1.7 6.7 12.3 7.2 71.5 0.3 2.1 Zimbabwe 2.6 N/A N/A NA NA NA NA NA SACMEQ 1.8 2.3 4.7 4.7 5.2 48.9 22.7 13.9
Pre-service training, in SACMEQ countries, has increased or been constant over the past few years, and is longer than in PASEC ones.
In SACMEQ countries as a whole, 4.7% of students are taught by a teacher with no pre-service training, another 4.7% by teachers with training shorter than 1 month, and a little more than 90% by teachers with training longer than 1 year. The average for the above mentioned PASEC countries was lower, at 54%, with wide variations between countries (Guinea’s teachers, though many of them are contract teachers, have undergone, for 99% of them, trainings of 1 year or more, a percentage similar to those of Tanzania, Mauritius, or South Africa for example). On the other hand, the wide variety of short pre-service trainings reflects the efforts of many of those countries to meet the educational demands in non-traditional ways without sending new teachers into schools with no training at all.
Overall conclusions and pending questions: The necessities of Universal Primary Education (and the requirements of donors) led those countries which were most behind in terms of school attendance (those countries are mostly in the PASEC group) to train teachers through very short programmes –this leads to time and financial gains.
When teachers did not receive pre-service training at all, were they specifically targeted by in-service programmes?
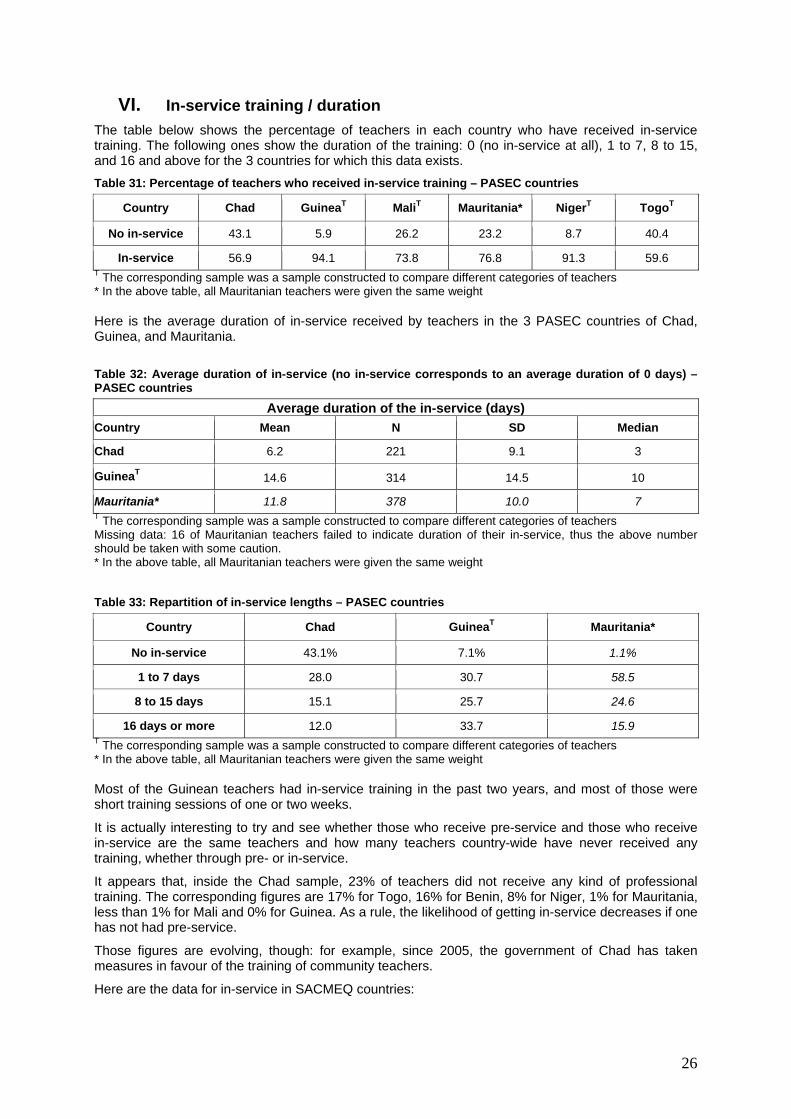
26
VI. In-service training / duration The table below shows the percentage of teachers in each country who have received in-service training. The following ones show the duration of the training: 0 (no in-service at all), 1 to 7, 8 to 15, and 16 and above for the 3 countries for which this data exists. Table 31: Percentage of teachers who received in-service training – PASEC countries
Country Chad GuineaT MaliT Mauritania* NigerT TogoT
No in-service 43.1 5.9 26.2 23.2 8.7 40.4
In-service 56.9 94.1 73.8 76.8 91.3 59.6 T The corresponding sample was a sample constructed to compare different categories of teachers * In the above table, all Mauritanian teachers were given the same weight Here is the average duration of in-service received by teachers in the 3 PASEC countries of Chad, Guinea, and Mauritania. Table 32: Average duration of in-service (no in-service corresponds to an average duration of 0 days) –PASEC countries
Average duration of the in-service (days) Country Mean N SD Median
Chad 6.2 221 9.1 3
GuineaT 14.6 314 14.5 10
Mauritania* 11.8 378 10.0 7 T The corresponding sample was a sample constructed to compare different categories of teachers Missing data: 16 of Mauritanian teachers failed to indicate duration of their in-service, thus the above number should be taken with some caution. * In the above table, all Mauritanian teachers were given the same weight Table 33: Repartition of in-service lengths – PASEC countries
Country Chad GuineaT Mauritania*
No in-service 43.1% 7.1% 1.1%
1 to 7 days 28.0 30.7 58.5
8 to 15 days 15.1 25.7 24.6
16 days or more 12.0 33.7 15.9 T The corresponding sample was a sample constructed to compare different categories of teachers * In the above table, all Mauritanian teachers were given the same weight Most of the Guinean teachers had in-service training in the past two years, and most of those were short training sessions of one or two weeks.
It is actually interesting to try and see whether those who receive pre-service and those who receive in-service are the same teachers and how many teachers country-wide have never received any training, whether through pre- or in-service.
It appears that, inside the Chad sample, 23% of teachers did not receive any kind of professional training. The corresponding figures are 17% for Togo, 16% for Benin, 8% for Niger, 1% for Mauritania, less than 1% for Mali and 0% for Guinea. As a rule, the likelihood of getting in-service decreases if one has not had pre-service.
Those figures are evolving, though: for example, since 2005, the government of Chad has taken measures in favour of the training of community teachers.
Here are the data for in-service in SACMEQ countries:

27
Table 34: Average number of in-service courses and duration of in-service (no in-service corresponds to an average duration of 0 days) –SACMEQ countries
(Reading) Teachers’ average in-service
Country SACMEQ I (total number of courses attended in the whole career)
SACMEQ II (courses in the past 3 years)
SACMEQ II (days in the past 3 years)
Botswana N/A 2.7 17.0 Kenya 3.4 3.6 16.2
Lesotho N/A 2.2 53.1 Malawi 1.1 0.9 14.5
Mauritius 4.9 1.8 14.5 Mozambique N/A 0.5 16.8
Namibia 3.1 2.7 34.4 Seychelles N/A 1.8 9.3
South Africa N/A 4.0 20.8 Swaziland N/A 2.9 11.3 Tanzania N/A 0.3 14.5 Uganda N/A 3.7 33.0 Zambia 0.38 1.9 45.1
Zanzibar 1.1 2.5 12.1 Zimbabwe 3.3 N/A N/A SACMEQ 2.6 2.2 21.8
The teachers were asked a different question in SACMEQ II than in SACMEQ I, as it was suggested they may not remember accurately the number of courses they had attended in their whole career.
If one computes the percentage of students with a teacher who never received either pre- or in-service training, this percentage is generally low: inferior to 5% except in the cases of Lesotho: 8.8%, Malawi: just 5%, Mozambique: 16.6%, and Zanzibar: 6.1%.
In SACMEQ countries as in PASEC countries, lower pre-service increases the likelihood not to get in-service.
Conclusion:
As a rule, in both groups of countries, teachers who did not get pre-service are also less likely to get in-service.
VII. Test scores 1. Testing teachers in SACMEQ countries
Tests were given to Maths and Reading teachers in SACMEQ countries. Here are the results for SACMEQ II: Table 35: Literacy competency levels of 6th year teachers – SACMEQ countries
Percentage of teachers reaching the reading competence level Competency level 1 2 3 4 5 6 7 8
Botswana 0.0 0.0 0.0 0.0 0.3 0.2 17.5 82.0 Kenya 0.0 0.0 0.1 0.0 0.0 0.0 6.4 93.5
Lesotho 0.0 0.0 0.0 0.0 0.8 3.1 36.3 59.8 Malawi 0.0 0.0 0.0 1.4 0.9 3.3 35.9 58.4
Mauritius NA NA NA NA NA NA NA NA Mozambique 0.0 0.0 0.0 1.0 1.7 8.1 37.1 52.0
Namibia 0.4 0.0 0.2 0.0 1.7 4.8 34.1 58.8 Seychelles 0.0 0.0 0.0 0.0 0.0 0.0 5.8 94.2
South Africa NA NA NA NA NA NA NA NA Swaziland 0.0 0.0 0.0 0.0 0.8 2.6 20.5 76.0 Tanzania 0.0 0.0 0.0 0.2 0.0 2.6 51.1 46.1 Uganda 0.0 0.0 1.6 8.9 6.6 3.9 21.9 57.1 Zambia 0.0 0.0 0.0 0.0 0.0 1.9 15.7 82.4
Zanzibar 0.5 0.0 1.6 0.5 4.5 19.4 54.4 19.1 SACMEQ II teachers 0.1 0.0 0.3 1.0 1.4 4.1 28.1 65.0 SACMEQ II students 6.7 14.9 18.4 20.2 16.8 10.7 8.4 3.8

28
Students and teachers were given tests which had items in common, and which could be interpreted using the same scale. Their results can thus be compared.
Detailed meaning of the literacy competency levels
Level 1: Pre Reading
Matches words and pictures involving concrete concepts and everyday objects. Follows short simple written instructions.
Level 2: Emergent Reading
Matches words and pictures involving prepositions and abstract concepts; uses cuing systems (by sounding out, using simple sentence structure, and familiar words) to interpret phrases by reading on.
Level 3: Basic Reading
Interprets meaning (by matching words and phrases, completing a sentence, or matching adjacent words) in a short and simple text by reading on or reading back.
Level 4: Reading for Meaning
Reads on or reads back in order to link and interpret information located in various parts of the text.
Level 5: Interpretive Reading
(Reads on and reads back in order to combine and interpret information from various parts of the text in association with external information (based on recalled factual knowledge) that “completes” and contextualizes meaning.
Level 6: Inferential Reading
Reads on and reads back through longer texts (narrative, document or expository) in order to combine information from various parts of the text so as to infer the writer’s purpose.
Level 7: Analytical Reading
(Locates information in longer texts (narrative, document or expository) by reading on and reading back in order to combine information from various parts of the text so as to infer the writer’s personal beliefs (value systems, prejudices, and/or biases).
Level 8: Critical Reading
Locates information in a longer texts (narrative, document or expository) by reading on and reading back in order to combine information from various parts of the text so as to infer and evaluate what the writer has assumed about both the topic and the characteristics of the reader – such as age, knowledge, and personal beliefs (value systems, prejudices, and/or biases).
Table 36: Numeracy competency levels of 6th year teachers – SACMEQ countries Percentage of teachers reaching the mathematics competency level
Competency level 1 2 3 4 5 6 7 8 Botswana 0.0 0.0 0.0 2.3 5.1 26.4 47.9 18.4
Kenya 0.0 0.0 0.0 0.0 0.0 0.0 4.3 95.6 Lesotho 0.0 0.0 1.3 0.4 8.6 27.5 51.5 10.6 Malawi 0.0 0.0 0.0 1.8 6.9 10.5 51.3 29.4
Mauritius NA NA NA NA NA NA NA NA Mozambique 0.0 0.0 0.3 2.9 4.6 16.3 44.3 31.7
Namibia 0.0 0.0 1.9 3.8 14.2 29.1 31.1 19.9 Seychelles 0.0 0.0 0.0 0.0 0.0 0.0 24.1 75.9
South Africa NA NA NA NA NA NA NA NA Swaziland 0.0 0.0 0.5 0.0 1.7 11.6 39.7 46.5 Tanzania 0.0 0.0 0.0 1.5 2.7 13.2 38.8 43.9 Uganda 0.0 0.0 0.0 1.2 5.3 11.4 27.9 54.2 Zambia 0.0 0.0 0.6 3.7 4.2 22.7 40.5 28.3
Zanzibar 0.0 0.0 6.3 6.2 19.3 30.0 28.9 9.3 SACMEQ II teachers 0.0 0.0 0.9 2.0 6.0 16.7 36.0 38.5 SACMEQ II students 6.2 34.3 29.8 14.6 7.5 4.6 2.2 0.9 Detailed meaning of the numeracy competency levels

29
Level 1: Pre Numeracy
Applies single step addition or subtraction operations. Recognizes simple shapes. Matches numbers and pictures. Counts in whole numbers.
Level 2: Emergent Numeracy
Applies a two-step addition or subtraction operation involving carrying, checking (through very basic estimation), or conversion of pictures to numbers. Estimates the length of familiar objects. Recognizes common two-dimensional shapes.
Level 3: Basic Numeracy
Translates verbal information presented in a sentence, simple graph or table using one arithmetic operation in several repeated steps. Translates graphical information into fractions. Interprets place value of whole numbers up to thousands. Interprets simple common everyday units of measurement.
Level 4: Beginning Numeracy
Translates verbal or graphic information into simple arithmetic problems. Uses multiple different arithmetic operations (in the correct order) on whole numbers, fractions, and/or decimals.
Level 5: Competent Numeracy
Translates verbal, graphic, or tabular information into an arithmetic form in order to solve a given problem. Solves multiple-operation problems (using the correct order of arithmetic operations) involving everyday units of measurement and/or whole and mixed numbers. Converts basic measurement units from one level of measurement to another (for example, metres to centimetres).
Level 6: Mathematically Skilled
Solves multiple-operation problems (using the correct order of arithmetic operations) involving fractions, ratios, and decimals. Translates verbal and graphic representation information into symbolic, algebraic, and equation form in order to solve a given mathematical problem. Checks and estimates answers using external knowledge (not provided within the problem).
Level 7: Concrete Problem Solving
Extracts and converts (for example, with respect to measurement units) information from tables, charts, visual and symbolic presentations in order to identify, and then solves multi-step problems.
Level 8: Abstract Problem Solving
Identifies the nature of an unstated mathematical problem embedded within verbal or graphic information, and then translate this into symbolic, algebraic, or equation form in order to solve the problem.
The above tests call for several remarks:
If one defines, for the sake of simplicity, the separation between “emergent” and “competent” in a given (reading or mathematics) skill as corresponding to the transition between competency levels 4 and 5, 1.4% of students are taught by teachers who are not competent in Reading and 2.9% by teachers who are not competent in Maths overall in all SACMEQ countries.
More complex computations (using the scores of the individual students and those of the corresponding teacher) show that 0.9% of the students in the sample have a teacher whose score on the literacy test is lower than their own, and 2.4% have a teacher whose score on the maths test is lower than their own.
One can also compute the impact of the teacher’s academic diploma on his competency level: in the SACMEQ II teacher population taken as a whole, the difference between a Junior Secondary diploma and an A Level corresponds to around one sixth of a literacy competency level (0.15 for Reading teachers).
On the other hand, if one takes all Reading teachers with a senior secondary school qualification from the samples from all the 12 countries which were tested, the standard deviation one obtains is 0.74 competency levels, even though they all have the same diploma.
SACMEQ studies also show important regional differences. Competency levels of teachers with the same academic diploma differ according to the region in which they are posted: for example, the

30
average test result for a teacher with a secondary school diploma in the least advantaged part of Botswana can be lower than the average test result for a teacher with a junior secondary diploma in the most advantaged part of the country. This is not specific to Botswana: regional differences between teachers’ academic competencies are therefore often greater than the analysis of the distribution of academic diplomas across regions may let us think.
2. Testing teachers in PASEC countries
Though testing the teachers was not central to the PASEC evaluation, teachers were nevertheless given a quick test in 4 out of 6 of the PASEC countries mentioned in this document. Unfortunately, results are not transcribed exactly in the same way in all 4 countries, so we shall only be able to give the results for the two countries below.
The test consisted of a simple French text, in which the teachers were to correct the errors made by a fictitious student. When teachers underlined a “true error” (a word in which there was truly an error), they were given one point. When they underlined a “false error”, on the other hand (a word in which there was no error), they lost one point. This explains why test results were, in some cases, below zero (which means the teacher found more inexistent errors than true errors!).
Since the text contained 12 errors, the highest possible score was 12, which was achieved by 1.3% of all teachers in Guinea, and 3.4% in Chad. Table 37: Teachers’ results on a French test – PASEC countries
Test score (highest possible = 12) Country Mean N Std. Deviation Median
Chad 6,2 208 3,3 7
GuineaT 4,6 319 4,0 5 T The corresponding sample was a sample constructed to compare different categories of teachers The distribution of test scores among teachers inside each country is given in the table below: Table 38: Repartition of teachers’ French test results –PASEC countries
Test result Chad GuineaT < 4 20.2% 40.8%
4 to 6 28.8 23.2 7 to 8 24.0 17.2
9 and more 26.9 18.8 T The corresponding sample was a sample constructed to compare different categories of teachers The first category has found less than 1/3 of the errors contained in the text (or found more true errors but also corrected errors which did not exist). It represents, in Chad, almost 1 teacher in 5 and in Guinea more than one third of the teachers. The most competent category is made of teachers who found at least 2/3 of the total number of errors in the text. This category makes up only one fourth of teachers in Chad, and around one teacher in five in Guinea.
Though this kind of test cannot be compared to the SACMEQ test, it gives an idea of the academic difficulties teachers have.
In Guinea, civil servants had an average score of 4.60 and contract teachers had a 4.55 average; the difference between the two is not significant. The community teachers of the sample got a 5.75, but there were only 4 teachers in that category.
On the other hand, women have a 4.1 average vs. a 5.4 average for men. Is it because women were accepted with slightly lower diplomas than men? This does not seem to be enough of an explanation, as, even though teachers with only senior secondary school get a 3.8 average while teachers with an A level or more get a 5.4 average, women, even with the same diploma and status as men, keep having lower results.
Women seem to be overrepresented among the low scores but not underrepresented among the high scores: indeed, they make up 61% of the teachers who got a 9 or over on the test, vs. 64% of the total sample, but they make up 86% of the teachers who got a 0 or less on the test.
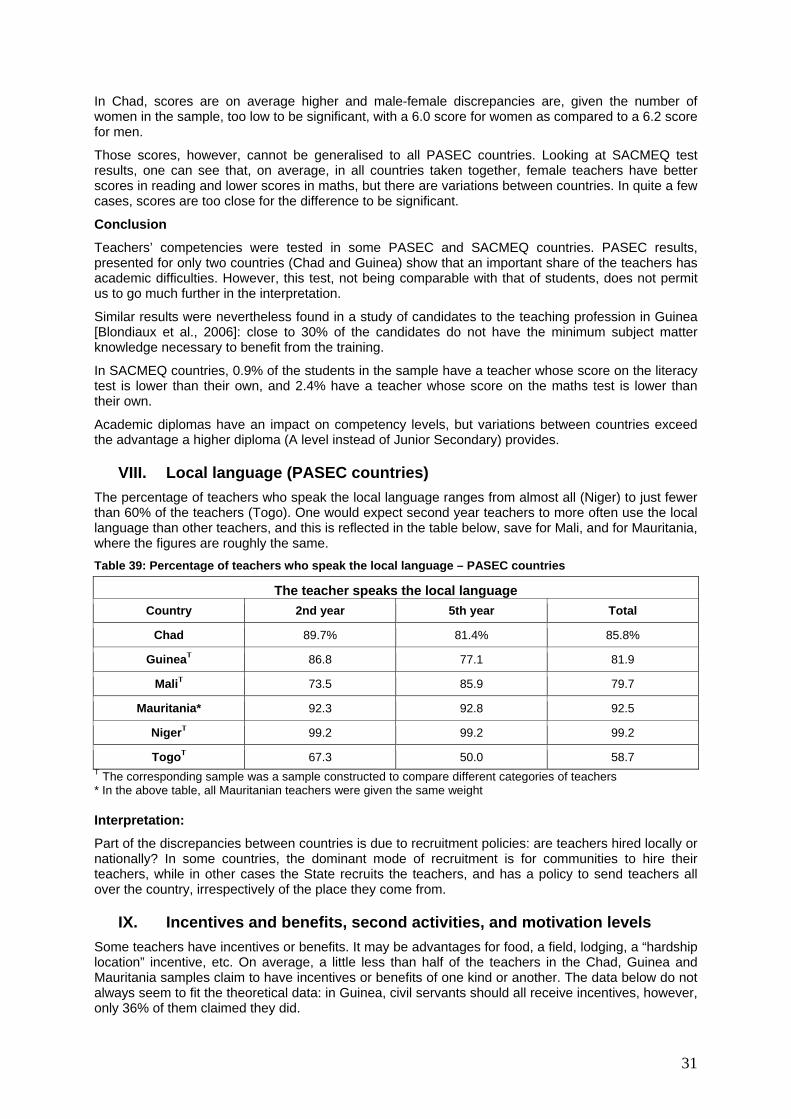
31
In Chad, scores are on average higher and male-female discrepancies are, given the number of women in the sample, too low to be significant, with a 6.0 score for women as compared to a 6.2 score for men.
Those scores, however, cannot be generalised to all PASEC countries. Looking at SACMEQ test results, one can see that, on average, in all countries taken together, female teachers have better scores in reading and lower scores in maths, but there are variations between countries. In quite a few cases, scores are too close for the difference to be significant.
Conclusion
Teachers’ competencies were tested in some PASEC and SACMEQ countries. PASEC results, presented for only two countries (Chad and Guinea) show that an important share of the teachers has academic difficulties. However, this test, not being comparable with that of students, does not permit us to go much further in the interpretation.
Similar results were nevertheless found in a study of candidates to the teaching profession in Guinea [Blondiaux et al., 2006]: close to 30% of the candidates do not have the minimum subject matter knowledge necessary to benefit from the training.
In SACMEQ countries, 0.9% of the students in the sample have a teacher whose score on the literacy test is lower than their own, and 2.4% have a teacher whose score on the maths test is lower than their own.
Academic diplomas have an impact on competency levels, but variations between countries exceed the advantage a higher diploma (A level instead of Junior Secondary) provides.
VIII. Local language (PASEC countries) The percentage of teachers who speak the local language ranges from almost all (Niger) to just fewer than 60% of the teachers (Togo). One would expect second year teachers to more often use the local language than other teachers, and this is reflected in the table below, save for Mali, and for Mauritania, where the figures are roughly the same. Table 39: Percentage of teachers who speak the local language – PASEC countries
The teacher speaks the local language Country 2nd year 5th year Total
Chad 89.7% 81.4% 85.8%
GuineaT 86.8 77.1 81.9
MaliT 73.5 85.9 79.7
Mauritania* 92.3 92.8 92.5
NigerT 99.2 99.2 99.2
TogoT 67.3 50.0 58.7 T The corresponding sample was a sample constructed to compare different categories of teachers * In the above table, all Mauritanian teachers were given the same weight Interpretation:
Part of the discrepancies between countries is due to recruitment policies: are teachers hired locally or nationally? In some countries, the dominant mode of recruitment is for communities to hire their teachers, while in other cases the State recruits the teachers, and has a policy to send teachers all over the country, irrespectively of the place they come from.
IX. Incentives and benefits, second activities, and motivation levels Some teachers have incentives or benefits. It may be advantages for food, a field, lodging, a “hardship location” incentive, etc. On average, a little less than half of the teachers in the Chad, Guinea and Mauritania samples claim to have incentives or benefits of one kind or another. The data below do not always seem to fit the theoretical data: in Guinea, civil servants should all receive incentives, however, only 36% of them claimed they did.

32
Two thirds of the teachers claim those benefits or incentive do not correspond to a financial benefit. 17% of the teachers in the Chad sample claim to receive benefits and incentives representing at least ¼ of their total salary. The corresponding figures are 3% in Guinea, and 17.2% in Mauritania.
Furthermore, many of the teachers claim they hold a second activity. Data about second activities may however be considered with caution, as some teachers may declare they have a second activity because they have a garden or because they have hens, while others will give extra-lessons to students or hold a business. The possible second activities also vary according to the place the teacher lives in –in town or in the countryside-. Data about the financial benefits generated by this second activity and the nature of the activity (agriculture, business, lessons, etc.) are available in PASEC database, but will not be shown here because they would deserve more in-depth analysis than can be done in a paragraph of this document. Table 40: Percentage of teachers claiming they receive incentives and benefits – some PASEC countries
Benefits and incentives: lodging, food, field, hardship location, etc. Chad GuineaT Mauritania*
No benefit 61.3 70.2 54.6
Benefits 38.7 29.8 45.4 T The corresponding sample was a sample constructed to compare different categories of teachers * In the above table, all Mauritanian teachers were given the same weight Table 41: Part of the salary represented by the benefits and incentives received –some PASEC countries
Part of the salary represented by the benefits and incentives Chad GuineaT Mauritania*
> salary 10.4 0.3 3.7
Salary 0.5 0.0 1.7
> 1/2 salary 0.5 0.3 3.3
1/2 salary 2.0 0.7 1.7
1/4 salary 4.5 1.6 4.3
< 1/4 salary 82.1 6.2 10.0
No financial benefit 0.0 90.8 75.3 T The corresponding sample was a sample constructed to compare different categories of teachers * In the above table, all Mauritanian teachers were given the same weight Table 42: Percentage of teachers in the country who say they have a second activity – PASEC countries
Percentage of the teachers of the country who hold a second activity
Chad GuineaT MaliT Mauritania* NigerT TogoT
72.0 29.8 50.9 23.2 33.6 27.8 T The corresponding sample was a sample constructed to compare different categories of teachers Missing answers: 0 Chad, 0 Guinea, 4 Mali, 5 Niger, 15 in Togo, 60 (13%) in Mauritania * In the above table, all Mauritanian teachers were given the same weight This overall panorama, however, sometimes hides wide disparities in status: the salary of a civil servant is often several times that of a community teacher, thus, when incentives represent a low amount of money for the highest-paid teachers, the same benefits may represent the equivalent of a low-paid teacher’s salary. Furthermore, not all categories may be pushed to have a second activity. Finally, different laws in different countries may limit the freedom of teachers to have another activity. We thus give the above data disaggregated by status, whenever possible: Table 43: Salaries declared by the teachers, part of the salary represented by the incentives, teachers with a second activity disaggregated by professional status – some PASEC countries
Country Professional status
Average salaries declared by
teachers
Incentives higher than ¼ of the
salary with 2nd activity
Teachers say salary is late

33
Civil servants 97,650 FCFA* 3.6% 49.5% N/A Chad
Community teachers 17,550 FCFA* 20.7 88.1 N/A
Civil servants 178,794 GNF 3.1 32.1 N/A
Contract teachers 140,000 GNF** 2.5 26.8 N/A GuineaT
Community teachers (4 cases)** 125,750 GNF 0 Half of the cases N/A
Civil servants 86,165 FCFA N/A 51.9 N/A Mali T State/community contract
teachers 54,839 FCFA N/A 50.7 N/A
Civil servants 26,000 UM* 14.3 22.5 N/A Mauritania*
Contract teachers (27 cases)** 20,000 UM* 17.6 30.4 N/A
Civil servants N/A N/A 33.5 N/A Niger T
Contract teachers N/A N/A 33.3 N/A
Civil servant N/A N/A 28.1 68
Contract teachers N/A N/A 22.8 95 Togo T
Community teachers N/A N/A 35.7 89 T The corresponding sample was a sample constructed to compare different categories of teachers * In the above table, all Mauritanian teachers were given the same weight ** The number of cases is sometimes too low to give any accurate percentage. The Mauritania result for contract teachers, for example, is obviously just a broad indication of tendencies in the country. In Chad, the discrepancies in salaries between civil servants and community teachers are high: more than 5 times higher for civil servants on average. This might explain why incentives constitute a much bigger part of community teachers’ salaries, and why most of those teachers have a second activity, against just fewer than 50% of civil servants. Few of those teachers seem to teach outside school hours: the most common identified second activity is in agriculture. Surprisingly, community teachers, though less paid than civil servants, appear “happier” with their job: this is the case for 69% of them against 49% of civil servants. Civil servants most often hope a promotion while a majority of community teachers hope to enter the civil service (see table below).
In Guinea, 36% of teachers overall (33% of civil servants and 38% of contract teachers) claim that their salary constrains them to have a second activity. Civil servants seem to be as often in agriculture, business or teaching, while contract teachers are more often in agriculture. Almost all contract teachers (155 out of 157 who replied to the question) claim they earn 140,000 GNF / month. This value, which is also the current official salary for contract teachers, was preferred to computing the average including the two anomalous values. Community teachers are paid less and civil servants more. The differences in salary claimed by the teachers above are nevertheless relatively low. One should also notice that most teachers surveyed (and most teachers in the country) are young teachers, even when they are civil servants.
Globally, Guinean teachers appeared satisfied enough with the profession. This does not mean they do not have ambitions for improvement inside the job: the most common ambition for contract teachers is to enter the civil service. This is possible in Guinea through a competitive examination, even though some of the contract teachers who succeeded were not actually integrated in the civil service. Table 44: “Motivation” levels of the teachers and main ambitions, disaggregated by status– PASEC countries
Country status The teacher wants to
remain a teacher Teacher’s ambitions
Civil servants 49% Promotion (83%) Chad Community teachers 69 Civil service (63%)

34
Total 60 N/A
Civil servants 74 Promotion (86%)
Contract teachers 71 Civil service (53%), promotion (42%)
Community teachers (4 cases)** All cases Civil service (All cases) GuineaT
Total 73 N/A
Civil servants 63 N/A
State/community contract teachers 66 N/A Mali T
Total 65 N/A
Civil servants 53 Promotion (79%)
Contract teachers (27 cases)** 70 Promotion (43%) Mauritania*
Total 54 N/A
Civil servants 55 N/A
Contract teachers 67 N/A Niger T
Total 59 N/A T The corresponding sample was a sample constructed to compare different categories of teachers * In the above table, all Mauritanian teachers were given the same weight ** As in the previous table, the number of cases is sometimes too low to give any accurate percentage. In Mali as in Chad, civil servants appear less happy with their job than the other categories of teachers, even though the difference is low. Unfortunately, the data do not enable us to distinguish between state and community contract teachers to assess the differences between those two categories.
In Mauritania, the most common identified second activity is teaching.
Not all second activities generate revenues: only around 13% of Niger teachers claim to have a second source of revenues.
We do not have detailed data about Togolese teachers’ satisfaction with the profession, this is Togo why was not included in the table above. Other countries’ data show teachers often are both a majority to be happy with the profession and unhappy with the salaries, it would thus have been interesting to have professional satisfaction levels for Togo.
Teachers in the countries above, save Togo, were asked whether what new profession they would choose if they had a choice: medicine, law, agriculture, administration, a technical profession, finances, business, or teaching. As a whole, in PASEC countries teachers are most often attracted, apart from teaching, towards medicine and administration, often a lot more than towards the other above-mentioned professions.
Conclusions:
Teacher satisfaction (defined as teachers choosing teacher among all other suggested professions) appears in general higher among contract and community teachers than among civil servants. It is also lower among experienced teachers, as experience and status are strongly correlated, A 2002 analysis by Michaelowa [Michaelowa, 2002] of the parameters leading to job satisfaction in 5 countries: Burkina Faso, the Ivory Coast, Cameroon, Madagascar and Senegal determined job experience was the most important parameter of the two and determined lower satisfaction, even when controlling for professional status.
We have not reproduced such elaborate study for the above-mentioned countries, so cannot say whether those results would still hold in the 6 PASEC countries above.

35
X. Contribution of the community to teachers’ salaries in SACMEQ countries
The table below gives the extent of the contribution of the community to teachers’ salaries in SACMEQ countries, as gathered from school heads during SACMEQ II. While, in Mauritius, none of the schools contributed to the salaries of teachers (via the payment of the salaries of additional teachers, or the payment of an additional amount to the teachers’ salaries), it remains common practice in 5 countries: Lesotho, where 56% of students study in schools in which the community contributes to the salaries of additional teachers, in Kenya where this is the case of 39 of students, in South Africa (27% of students), Namibia (20%) and Uganda (18%). Table 45: Community contributions to teachers’ salaries – SACMEQ II countries
Some of the community contributions to the school Country Salaries of additional teachers Additional amount of the salary of the teachers
Botswana 2.3 0.5 Kenya 39.4 7.1
Lesotho 56.0 15.6 Malawi 0.9 0.5
Mauritius 0.0 0.0 Mozambique 6.1 7.7
Namibia 19.9 1.6 Seychelles 0.0 17.6
South Africa 27.0 7.1 Swaziland 23.5 5.3 Tanzania 4.6 1.2 Uganda 17.6 9.0 Zambia 21.9 9.2
Zanzibar 5.0 3.5 Zimbabwe N/A N/A SACMEQ II 16.0 4.8
Lesotho is the country with the highest community contributions to teachers’ salaries in the group. What is the impact of communities’ contributions to teacher salaries? What context does it respond to?
XI. Percentage of the Maths and French curricula covered by the teacher PASEC teachers were asked, in all countries save Togo, to state the percentage of the curriculum they managed to cover, in French and maths. Table 46: Percentage of the French curriculum covered during the year – PASEC teachers
Country Mean N Std. Deviation Median
Chad 57,9 161 21,3 60
GuineaT 83,8 301 19,6 90
MaliT 78,8 271 20,9 85
Mauritania* 61.6 200 23.7 60
NigerT 63,7 252 28,9 70 T The corresponding sample was a sample constructed to compare different categories of teachers * Around 25% of answers are missing in the case of Mauritania. Data have been constructed using the response of the teacher charged with teaching French to the class.
It is in Guinea that teachers covered the highest percentage of the curriculum. On the other hand, the standard deviation (SD) is highest in Niger, both for the French curriculum (table above) and for the Maths one (table below).
The relatively low percentages shown above can be put in parallel with the results of other research: it has been shown [Mingat, 2003] that African children have mastered, on average, only 51.6% of the

36
official school curriculum. Not having been taught that curriculum is the first obstacle on the road towards mastery.
At first sight, discrepancies inside the countries do not appear to be strongly correlated to geography (urban vs. rural areas). They do not appear very much correlated with the gender of the teacher either, except for the maths curriculum in Chad (where men do 64% of the curriculum on average against 57% of the curriculum for women). They appear, on the other hand, to be correlated to the status of the teacher in 2 of the PASEC countries: in Mali, contract teachers claimed they covered on average 70% of the Maths curriculum, against 78% for civil servants, finally, in Niger, civil servants claimed they covered on average 68% of the Maths curriculum, against 54% for contract teachers, and 74% of the French curriculum, against 56% for contract teachers. Table 47: Percentage of the Maths curriculum covered during the year – PASEC countries
Mean N Std. Deviation Median
Chad 63,2 161 21,8 65
GuineaT 83,6 298 20,7 90
MaliT 73,7 271 20,1 80
Mauritania 72.5 184 23.4 80
NigerT 59,1 252 28,6 65 T The corresponding sample was a sample constructed to compare different categories of teachers. Around 30% of answers are missing in the case of Mauritania. Data have been constructed using the response of the teacher charged with teaching Maths to the class. In-country variations: Table 48: Percentage of teachers who covered less than 50%, 50% to 75%, 75% to 90%, and more than 90% of the French curriculum – PASEC countries
% of the French curriculum Chad GuineaT MaliT Mauritania NigerT
Less than 50 31.7 5.3 7.7 25.3 21.4
Between 50 and 74 39.8 11.0 23.6 40.7 31.0
Between 75 and 89 21.1 30.6 22.9 16.0 24.6
More than 90 7.5 53.2 45.8 18.0 23.0 T The corresponding sample was a sample constructed to compare different categories of teachers Table 49: Percentage of teachers who covered less than 50%, 50% to 75%, 75% to 90%, and more than 90% of the Maths curriculum – PASEC countries
% of the Maths curriculum Chad GuineaT MaliT Mauritania NigerT
Less than 50% 18.6 5.4 10.7 15.6 27.0
Between 50 and 74% 41.6 11.1 31.0 26.4 33.7
Between 75 and 89% 28.0 27.9 28.8 23.4 23.4
More than 90% 11.8 55.7 29.5 34.6 15.9 T The corresponding sample was a sample constructed to compare different categories of teachers When high percentages of teachers do not cover the curriculum, one can wonder whether the curriculum is adapted to the students, or whether teachers’ training is adapted to the curriculum teachers will have to teach.
The PASEC countries average for teachers with no initial professional training shows they say they cover on average 58% of the Maths curriculum and 56% of the French one, while trained teachers (all
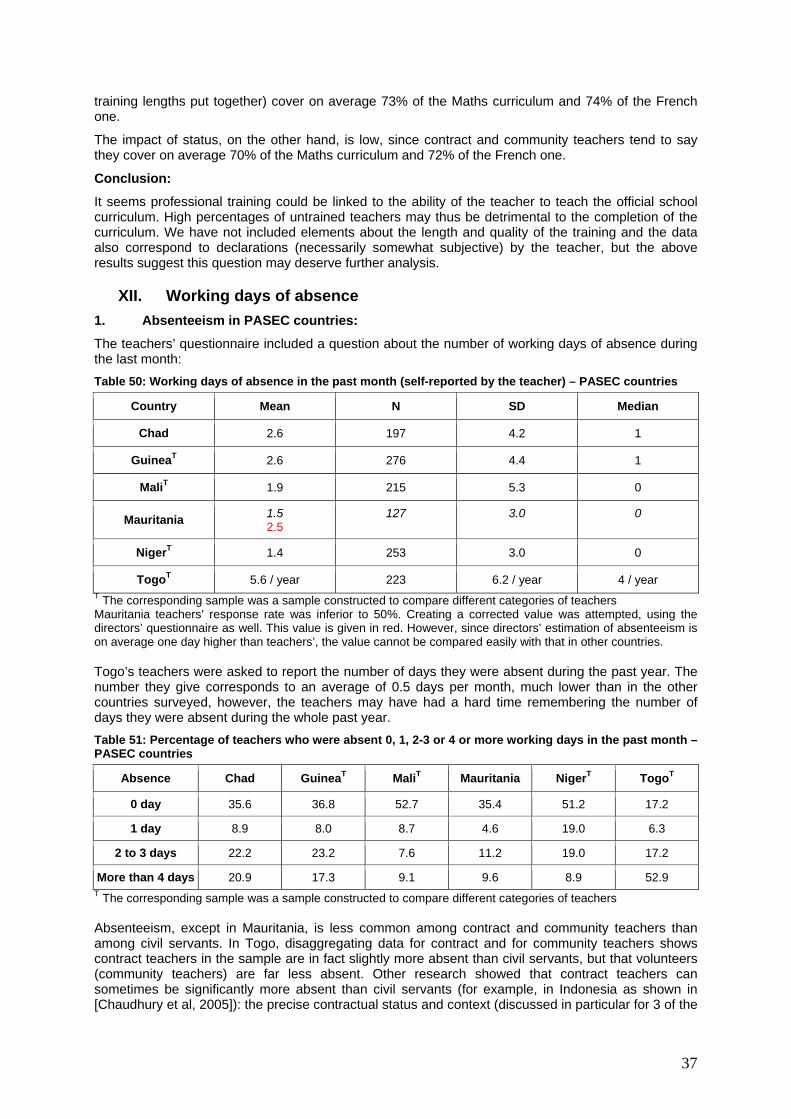
37
training lengths put together) cover on average 73% of the Maths curriculum and 74% of the French one.
The impact of status, on the other hand, is low, since contract and community teachers tend to say they cover on average 70% of the Maths curriculum and 72% of the French one.
Conclusion:
It seems professional training could be linked to the ability of the teacher to teach the official school curriculum. High percentages of untrained teachers may thus be detrimental to the completion of the curriculum. We have not included elements about the length and quality of the training and the data also correspond to declarations (necessarily somewhat subjective) by the teacher, but the above results suggest this question may deserve further analysis.
XII. Working days of absence 1. Absenteeism in PASEC countries:
The teachers’ questionnaire included a question about the number of working days of absence during the last month: Table 50: Working days of absence in the past month (self-reported by the teacher) – PASEC countries
Country Mean N SD Median
Chad 2.6 197 4.2 1
GuineaT 2.6 276 4.4 1
MaliT 1.9 215 5.3 0
Mauritania 1.5 2.5
127
3.0
0
NigerT 1.4 253 3.0 0
TogoT 5.6 / year 223 6.2 / year 4 / year T The corresponding sample was a sample constructed to compare different categories of teachers Mauritania teachers’ response rate was inferior to 50%. Creating a corrected value was attempted, using the directors’ questionnaire as well. This value is given in red. However, since directors’ estimation of absenteeism is on average one day higher than teachers’, the value cannot be compared easily with that in other countries. Togo’s teachers were asked to report the number of days they were absent during the past year. The number they give corresponds to an average of 0.5 days per month, much lower than in the other countries surveyed, however, the teachers may have had a hard time remembering the number of days they were absent during the whole past year. Table 51: Percentage of teachers who were absent 0, 1, 2-3 or 4 or more working days in the past month – PASEC countries
Absence Chad GuineaT MaliT Mauritania NigerT TogoT
0 day 35.6 36.8 52.7 35.4 51.2 17.2
1 day 8.9 8.0 8.7 4.6 19.0 6.3
2 to 3 days 22.2 23.2 7.6 11.2 19.0 17.2
More than 4 days 20.9 17.3 9.1 9.6 8.9 52.9 T The corresponding sample was a sample constructed to compare different categories of teachers Absenteeism, except in Mauritania, is less common among contract and community teachers than among civil servants. In Togo, disaggregating data for contract and for community teachers shows contract teachers in the sample are in fact slightly more absent than civil servants, but that volunteers (community teachers) are far less absent. Other research showed that contract teachers can sometimes be significantly more absent than civil servants (for example, in Indonesia as shown in [Chaudhury et al, 2005]): the precise contractual status and context (discussed in particular for 3 of the

38
above countries by [Bourdon et al, 2007]) is therefore probably more relevant to understand the reasons of teacher absenteeism than using a broad category “contract and community teachers”.
Discrepancies between genders depend on the country: in Guinea and Mali, they appear to be much more absent, while they are less often absent in other countries, though sometimes not in a significant way.
Since status and gender are correlated, though (women are, in most countries, also more often civil servants than contract or community teachers), one should be cautious not to equate the above correlations with a causal relationship.
2. Teacher turnover: are pupils likely to do the whole school year with the same teacher?
The table below shows teachers often change during the year: in 1 case in 10 at least, and up to more than 1 case in 5, the teacher at the end of the year was different from the one at the beginning: though this is not the same as teacher absenteeism, frequent teacher changes may nevertheless be prejudicial to learning. Table 52: Percentage of cases in which the teacher at the end of the year was different from the one at the beginning – PASEC countries
Country Chad GuineaT Mauritania TogoT
The teacher has changed during the year 16,3 12,8 21,5 15,2 T The corresponding sample was a sample constructed to compare different categories of teachers Teacher turnover may also be associated to a period during which no teacher is available. We have no data enabling us to have an idea of the extent this phenomenon may have.
3. Beginning of the school year in PASEC countries: theory and practice
All the above-mentioned PASEC countries officially begin the school year either in September (Togo, Mauritania) or October (Chad, Guinea, Mali, Niger) and finish it in June, or July in the case of Niger. However, not all teachers are in place at the beginning of the year, leading to some loss in schooling time, which can amount to months in some cases. The data below represents the effective date of the beginning of the school year. In Chad and Guinea, the official month is October, in Mauritania, it is September. Table 53: date of beginning of the school year
Country Mean N SD Median Range (days)
Chad 22/10/2003 202 21.7 15/10/2003 172
GuineaT 07/10/2004 319 14.8 04/10/2004 157
Mauritania 05/11/2003 437 28.5 09/11/2003 186
In Mali, teachers were asked another question, so the answers are not 100% comparable: they had to say if they began the school year during the first, the second, or the third week of October. 85.2% of teachers stated they began the school year during the first week, 6.6% during the second, and 8.1% during the third.
In the three countries for which we’ve got comparable data, it appears there are wide discrepancies between the earliest and the latest schools –around 6 months!-. The standard deviation is lowest in Guinea, in which 92% of classes began with less than 2 days of delay, but it is close to a month in Mauritania.
The actual length of the school year thus varies strongly from school to school.
4. Absenteeism in SACMEQ countries:
SACMEQ countries do not have as precise data about absenteeism, but there is nevertheless an indicator of teacher absenteeism. Below is the table representing school heads opinion of the extent of the problem of teacher absenteeism in their schools:
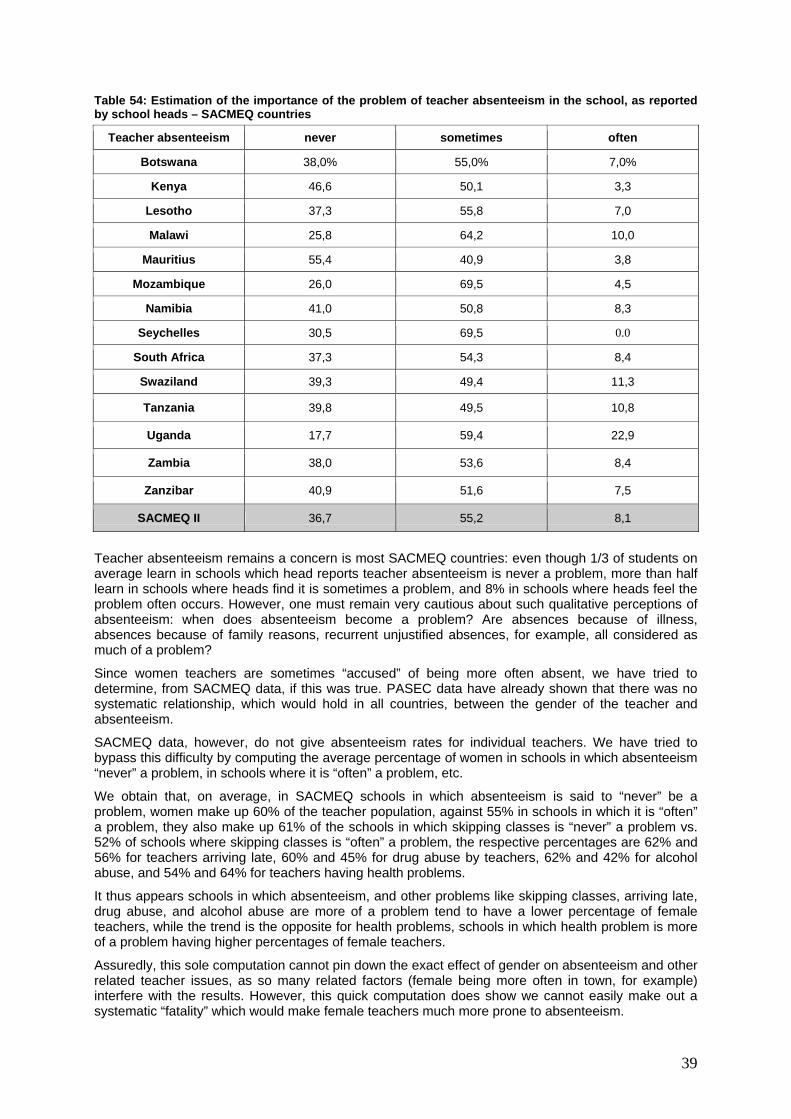
39
Table 54: Estimation of the importance of the problem of teacher absenteeism in the school, as reported by school heads – SACMEQ countries
Teacher absenteeism never sometimes often
Botswana 38,0% 55,0% 7,0%
Kenya 46,6 50,1 3,3
Lesotho 37,3 55,8 7,0
Malawi 25,8 64,2 10,0
Mauritius 55,4 40,9 3,8
Mozambique 26,0 69,5 4,5
Namibia 41,0 50,8 8,3
Seychelles 30,5 69,5 0.0
South Africa 37,3 54,3 8,4
Swaziland 39,3 49,4 11,3
Tanzania 39,8 49,5 10,8
Uganda 17,7 59,4 22,9
Zambia 38,0 53,6 8,4
Zanzibar 40,9 51,6 7,5
SACMEQ II 36,7 55,2 8,1
Teacher absenteeism remains a concern is most SACMEQ countries: even though 1/3 of students on average learn in schools which head reports teacher absenteeism is never a problem, more than half learn in schools where heads find it is sometimes a problem, and 8% in schools where heads feel the problem often occurs. However, one must remain very cautious about such qualitative perceptions of absenteeism: when does absenteeism become a problem? Are absences because of illness, absences because of family reasons, recurrent unjustified absences, for example, all considered as much of a problem?
Since women teachers are sometimes “accused” of being more often absent, we have tried to determine, from SACMEQ data, if this was true. PASEC data have already shown that there was no systematic relationship, which would hold in all countries, between the gender of the teacher and absenteeism.
SACMEQ data, however, do not give absenteeism rates for individual teachers. We have tried to bypass this difficulty by computing the average percentage of women in schools in which absenteeism “never” a problem, in schools where it is “often” a problem, etc.
We obtain that, on average, in SACMEQ schools in which absenteeism is said to “never” be a problem, women make up 60% of the teacher population, against 55% in schools in which it is “often” a problem, they also make up 61% of the schools in which skipping classes is “never” a problem vs. 52% of schools where skipping classes is “often” a problem, the respective percentages are 62% and 56% for teachers arriving late, 60% and 45% for drug abuse by teachers, 62% and 42% for alcohol abuse, and 54% and 64% for teachers having health problems.
It thus appears schools in which absenteeism, and other problems like skipping classes, arriving late, drug abuse, and alcohol abuse are more of a problem tend to have a lower percentage of female teachers, while the trend is the opposite for health problems, schools in which health problem is more of a problem having higher percentages of female teachers.
Assuredly, this sole computation cannot pin down the exact effect of gender on absenteeism and other related teacher issues, as so many related factors (female being more often in town, for example) interfere with the results. However, this quick computation does show we cannot easily make out a systematic “fatality” which would make female teachers much more prone to absenteeism.
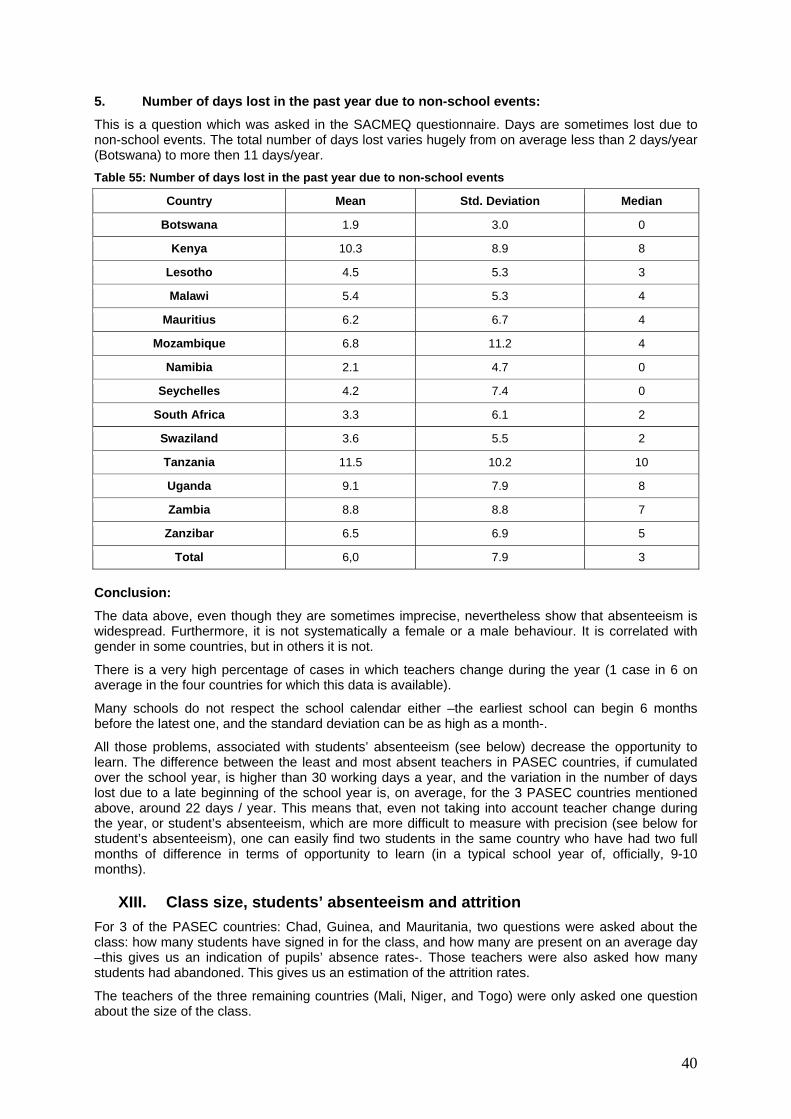
40
5. Number of days lost in the past year due to non-school events:
This is a question which was asked in the SACMEQ questionnaire. Days are sometimes lost due to non-school events. The total number of days lost varies hugely from on average less than 2 days/year (Botswana) to more then 11 days/year. Table 55: Number of days lost in the past year due to non-school events
Country Mean Std. Deviation Median
Botswana 1.9 3.0 0
Kenya 10.3 8.9 8
Lesotho 4.5 5.3 3
Malawi 5.4 5.3 4
Mauritius 6.2 6.7 4
Mozambique 6.8 11.2 4
Namibia 2.1 4.7 0
Seychelles 4.2 7.4 0
South Africa 3.3 6.1 2
Swaziland 3.6 5.5 2
Tanzania 11.5 10.2 10
Uganda 9.1 7.9 8
Zambia 8.8 8.8 7
Zanzibar 6.5 6.9 5
Total 6,0 7.9 3
Conclusion:
The data above, even though they are sometimes imprecise, nevertheless show that absenteeism is widespread. Furthermore, it is not systematically a female or a male behaviour. It is correlated with gender in some countries, but in others it is not.
There is a very high percentage of cases in which teachers change during the year (1 case in 6 on average in the four countries for which this data is available).
Many schools do not respect the school calendar either –the earliest school can begin 6 months before the latest one, and the standard deviation can be as high as a month-.
All those problems, associated with students’ absenteeism (see below) decrease the opportunity to learn. The difference between the least and most absent teachers in PASEC countries, if cumulated over the school year, is higher than 30 working days a year, and the variation in the number of days lost due to a late beginning of the school year is, on average, for the 3 PASEC countries mentioned above, around 22 days / year. This means that, even not taking into account teacher change during the year, or student’s absenteeism, which are more difficult to measure with precision (see below for student’s absenteeism), one can easily find two students in the same country who have had two full months of difference in terms of opportunity to learn (in a typical school year of, officially, 9-10 months).
XIII. Class size, students’ absenteeism and attrition For 3 of the PASEC countries: Chad, Guinea, and Mauritania, two questions were asked about the class: how many students have signed in for the class, and how many are present on an average day –this gives us an indication of pupils’ absence rates-. Those teachers were also asked how many students had abandoned. This gives us an estimation of the attrition rates.
The teachers of the three remaining countries (Mali, Niger, and Togo) were only asked one question about the size of the class.
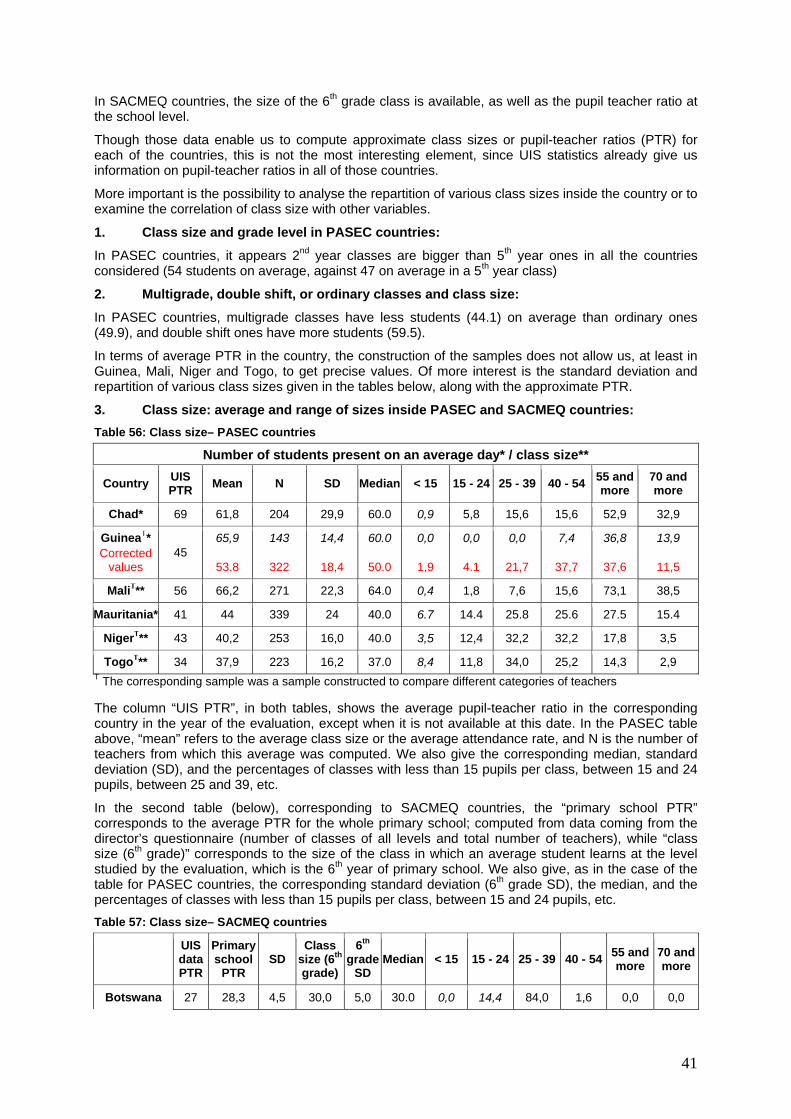
41
In SACMEQ countries, the size of the 6th grade class is available, as well as the pupil teacher ratio at the school level.
Though those data enable us to compute approximate class sizes or pupil-teacher ratios (PTR) for each of the countries, this is not the most interesting element, since UIS statistics already give us information on pupil-teacher ratios in all of those countries.
More important is the possibility to analyse the repartition of various class sizes inside the country or to examine the correlation of class size with other variables.
1. Class size and grade level in PASEC countries:
In PASEC countries, it appears 2nd year classes are bigger than 5th year ones in all the countries considered (54 students on average, against 47 on average in a 5th year class)
2. Multigrade, double shift, or ordinary classes and class size:
In PASEC countries, multigrade classes have less students (44.1) on average than ordinary ones (49.9), and double shift ones have more students (59.5).
In terms of average PTR in the country, the construction of the samples does not allow us, at least in Guinea, Mali, Niger and Togo, to get precise values. Of more interest is the standard deviation and repartition of various class sizes given in the tables below, along with the approximate PTR.
3. Class size: average and range of sizes inside PASEC and SACMEQ countries: Table 56: Class size– PASEC countries
Number of students present on an average day* / class size**
Country UIS PTR Mean N SD Median < 15 15 - 24 25 - 39 40 - 54 55 and
more 70 and more
Chad* 69 61,8 204 29,9 60.0 0,9 5,8 15,6 15,6 52,9 32,9
GuineaT*
Corrected values
45 65,9
53.8
143
322
14,4
18,4
60.0
50.0
0,0
1,9
0,0
4.1
0,0
21,7
7,4
37,7
36,8
37,6
13,9
11,5
MaliT** 56 66,2 271 22,3 64.0 0,4 1,8 7,6 15,6 73,1 38,5
Mauritania* 41 44 339 24 40.0 6.7 14.4 25.8 25.6 27.5 15.4
NigerT** 43 40,2 253 16,0 40.0 3,5 12,4 32,2 32,2 17,8 3,5
TogoT** 34 37,9 223 16,2 37.0 8,4 11,8 34,0 25,2 14,3 2,9 T The corresponding sample was a sample constructed to compare different categories of teachers The column “UIS PTR”, in both tables, shows the average pupil-teacher ratio in the corresponding country in the year of the evaluation, except when it is not available at this date. In the PASEC table above, “mean” refers to the average class size or the average attendance rate, and N is the number of teachers from which this average was computed. We also give the corresponding median, standard deviation (SD), and the percentages of classes with less than 15 pupils per class, between 15 and 24 pupils, between 25 and 39, etc.
In the second table (below), corresponding to SACMEQ countries, the “primary school PTR” corresponds to the average PTR for the whole primary school; computed from data coming from the director’s questionnaire (number of classes of all levels and total number of teachers), while “class size (6th grade)” corresponds to the size of the class in which an average student learns at the level studied by the evaluation, which is the 6th year of primary school. We also give, as in the case of the table for PASEC countries, the corresponding standard deviation (6th grade SD), the median, and the percentages of classes with less than 15 pupils per class, between 15 and 24 pupils, etc. Table 57: Class size– SACMEQ countries
UIS data PTR
Primary school
PTR SD
Class size (6th
grade)
6th grade
SD Median < 15 15 - 24 25 - 39 40 - 54 55 and
more 70 and more
Botswana 27 28,3 4,5 30,0 5,0 30.0 0,0 14,4 84,0 1,6 0,0 0,0

42
Kenya 34 33,4 9,2 37,0 10,8 36.0 0,4 15,1 41,0 38,5 5,0 0,0
Lesotho 47 53,9 18,5 44,9 18,1 45.0 2,0 11,4 22,8 36,1 27,8 7,1
Malawi 70 70,0 30,0 56,6 24,1 52.0 1,2 8,0 18,6 25,4 46,8 30,1
Mauritius 25 24,5 13,7 36,4 7,9 38.0 0,5 8,6 50,4 40,4 0,0 0,0
Mozambique 66 51,3 36,2 52,5 11,3 53.0 0,1 0,2 11,9 43,9 43,8 4,3
Namibia 32 31,5 7,2 38,4 10,9 37.0 0,6 4,8 55,4 31,4 7,8 1,3
Seychelles 14 16,6 3,8 27,4 6,2 28.0 1,7 29,1 69,2 0,0 0,0 0,0
South Africa 37 36,5 6,4 42,1 12,3 41.0 1,2 2,1 39,3 44,7 12,7 3,1
Swaziland 33 35,1 6,7 37,2 9,0 36.0 0,3 6,7 57,5 33,4 2,1 0,0
Tanzania 46 47,1 19,8 41,9 14,8 42.0 0,2 7,7 36,5 41,7 13,9 5,9
Uganda 53 58,0 24,7 38,0 8,2 38.0 0,0 5,4 51,5 43,1 0,0 0,0
Zambia 45 53,7 40,3 36,6 13,0 36.0 3,4 13,8 40,6 35,8 6,4 1,6
Zanzibar N/A 35,0 8,5 49,8 11,6 49.0 0,0 0,7 19,1 47,7 32,6 4,7
SACMEQ II N/A 40,7 24,6 40,6 14,4 39.0 0,8 8,3 43,1 34,0 13,8 3,7
For Chad, Mauritania and Guinea, we chose to present average class attendance (as estimated by the teacher) rather than average enrolment. Discrepancies between the two numbers can be high, given absenteeism and abandons: the average enrolment is 74 in Chad, 53 in Mauritania, and 57 in Guinea.
Technical considerations:
The case of Guinea:
The precision of the values given depends on the percentage of teachers who did not reply to the question. This number ranges, for most of the countries, from as low as around 1% to almost 10%: from 1.5% in Mali and 1.9% in Niger to 6.3% in Togo and 9.2% in Chad.
A much greater percentage of the Guinean teachers, however did not fill in the question about the number of students present on an average day: this is the case for 55.8% of them. Most of them, though, did fill in the rest of the questionnaire, and in particular the question about the number of students signed in for the class and the question about the number of students who are absent on an average day. The analysis of the profile of the teachers who replied to the question about the number of students present on an average day shows those are the teachers with the highest average number of students signed in for the class. We can get corrected values for class attendance which show the average class size is lower: it is likely to be close to 54 for the teachers in the Guinea sample.
Impact of Guinea, Mali, Niger and Togo’s sample characteristics:
Given that some of the samples used in the above-mentioned studies (and in particular those of Mali, Niger and Togo) did not have the same percentage of teachers of each status than in the general teacher population, it is interesting to see how much average class sizes vary according to a teacher’s status:
In Guinea, civil servants and contract teachers both have an average class size of 51 students.
In Mali, the average class size for civil servants is around 69, while the average class size for contract teachers is 64. Since there are more civil servants in the general teacher population of the country than in the sample, one can assume the actual mean PTR for all Mali classes should be a little higher than it is in the table above.
In Niger, civil servants and contract teachers both have an average class size of 40 students.
In Togo, the average size of the classes civil servants teach is 37, while the average class size of other teachers is 39. There are discrepancies between volunteers (community teachers: 35 students on average) and auxiliaries (contract teachers: 40 students on average). Overall, correcting the

43
percentages does not change data much, because we would get 38.5 students per class instead of 37.9.
Interpretation: Around 1/3 of students or more are studying in huge classes (more than 70 students) in Chad, Malawi and Mali. Those are also countries with very high (over 65) average class sizes. Universal primary education in Malawi, and more generally the increase in the demands for education in a context of a shortage of teachers –despite countries’ important efforts to cope- resulted in high shares of overcrowded classrooms.
One must be cautious, on the other hand, with the above data when considering schools with fewer than 15 students, since those schools, or part of them, were often part of the “excluded population” when designing the sample. Schools with fewer than 10, 15, or 20 students per grade level were often excluded in SACMEQ data, as well as classes with less than 8 students in PASEC data. This leads to necessarily inaccurate percentages (in italic in the above table) for the lowest class sizes.
Standard variations in class sizes range from 5.0 in Botswana to 29.9 in Chad. Those values can give us an idea of the equity of teacher repartition inside the various parts of the country. They cannot be the sole indicator of equity, though, as the variety of contexts needs to be fully understood (for example, isolated schools with very few students thus very low class sizes cannot be replaced by bigger schools if it means children will have to walk a huge distance to school).
If there are indeed, even considering the constraints of the context, strong inequities in teacher repartition, what are the ways of getting a more effective teacher deployment?
4. Urban-rural differences in class sizes:
On average, in our samples, urban classes have more students enrolled than rural ones in Chad, Mali, Mauritania and Togo. It is the contrary in Niger and Guinea. If one computes the average class enrolment for all PASEC countries taken together, in urban and rural areas, one gets a little more students in urban classes than in rural ones. This difference, however, does not appear to be significant.
In SACMEQ countries, only Seychelles and Namibia have lower class size in rural areas than in urban ones. On average, for all SACMEQ countries, urban classes have 39.1 students vs. 42.5 for rural areas.
There may be urban-rural class size differences in some individual countries, but overall, the differences remain moderate.
5. Student absenteeism:
Pupils’ absenteeism rate is a data one does not have in most databases, that is why it is an interesting value to compute: the median absenteeism rate for children, as estimated by the teachers of the samples, is 15.8% in Chad, 7.0% in Guinea (6.0% for civil servants and 7.1% for contract teachers, the highest median absenteeism rates being with assistants –instituteurs adjoints-, then contract teachers, then “ordinary teachers” –instituteurs-), 9.7% in Mauritania, and 6.0% in Niger.
This means children in the PASEC samples were out of school on average 3.4 days in the month before the survey in Chad, 1.5 days in the previous month in Guinea, 2.1 days in Mauritania, and 1.3 days in Niger.13
Those values are of course very approximate, and subject to change from month to month, according to harvests, etc. They nevertheless have to be added to the already computed teacher absenteeism, to the impact of late school year beginnings, and to the impact of teacher change during the year, or days lost for non-school reasons.
We also have estimates of student absenteeism for SACMEQ countries: students were asked to give the number of days they had been absent during the previous month:
13 The number of school days in the previous month varies according to the month and the school system (were there holidays?). Let’s assume children go to school on average, outside of holidays, 5/7 of the time, then we get an average number of school days in the previous month of around 21 days.

44
Table 58: Student absenteeism – SACMEQ countries
Students’ average number of days of absence in the previous month
Country SACMEQ I SACMEQ II Most common reasons for absence (SACMEQ II)
Botswana N/A 0.4 Illness (73%) / family reasons (12%) Kenya 2.0 2.0 Illness (23) / fees (20)
Lesotho N/A 1.3 Illness (29) / family reasons (11) Malawi 3.7 2.0 Illness (69) / family reasons (25)
Mauritius 1.2 1.8 Illness / family reasons Mozambique N/A 2.7 Illness / family reasons
Namibia 1.4 1.5 Illness (27) / family reasons (10) Seychelles N/A 0.9 Illness (73.8) / Family reasons (5.4)
South Africa N/A 1.6 Illness (25) / family reasons (9) Swaziland N/A 0.8 Illness (20) / Family reasons (5) Tanzania N/A 2.1 Illness (33) / family reasons (9) Uganda N/A 1.9 Illness (57) / Family reasons (23) Zambia 2.2 2.5 Illness (39.7) / Fees (10.4)
Zanzibar 1.8 2.0 Illness (59) / family reasons (3) Zimbabwe 1.5 N/A N/A SACMEQ 1.9 1.7 N/A
At first sight, it seems children in the 4 PASEC countries mentioned above were more often absent than the average SACMEQ student. However, comparing PASEC and SACMEQ countries’ data must be done with caution, since the questions about absenteeism were different (number of kids absent per day / number of days absent in the past month), and were asked to different people (teachers / pupils). In PASEC data, teachers, when we compare their statements to those of directors, underestimate their absence rates by 1 full day per month, it is likely that students were also tempted to underestimate their absence rates.
Interpretations: Absenteeism rates remain high in many countries: Chad, Mozambique, and Zambia all had, at the date of the most recent study in the country, average absenteeism rates higher than 2.5 days / month. In the case of Zambia, this is due to an increase in rural absenteeism rates –from an average in days of 2.1 in rural areas, and 2.2 in urban areas in SACMEQ I, the numbers grew to 2.8 in rural areas –while absence rates remained at 2.2 in urban areas-.
Added to the absenteeism rates for teachers, this means students may easily loose one full week a month (5 working days) during the school year, in addition to the impact of late school year beginnings. The total number of days lost may easily amount to 3 months (9-10 weeks plus a one month delay at the beginning of the year) in a school year which counts 9-10 months.
6. Attrition rates:
Attrition rates (calculated as the ratio of the number of abandons and the number of students signed in for the class) are available only for 4 countries: Benin, Chad, Guinea and Mauritania. They are, on average, similar in 2nd and 5th year, with lower rates in Guinea, despite class sizes higher than the PASEC countries average.
Absenteeism and attrition tend to be strongly correlated –the Guinean sample both has lower absenteeism and lower attrition, for example-, so solving absenteeism problems may be a step towards reducing attrition.
Table 59: Attrition rates – PASEC countries
ATTRITION Country Mean (%) N SD Median (%) < 2 2 - 5 5 - 10 > 10
Chad 9,9 208 14,9 4,9 19 31 21 29
GuineaT 4,7 300 8,6 3,1 37 30 24 9
Mauritania 10,2 173 11,8 6,0 25 18 20 36

45
T The corresponding sample was a sample constructed to compare different categories of teachers N.B.: Missing values: 7.5% of answers are missing in Chad, 7% in Guinea. Technical considerations:
Attrition rates vary with status in Guinea: the average attrition rate for all civil servants was 4.3%, it was 5.1% for contract teachers inside the sample. However, one of the categories of contract teachers (the most numerous: FIMG BM) have higher than attrition rates than civil servants, while other categories ( FIMG PEPT teachers) have lower attrition, so there does not appear to be any no systematic relationship between status and attrition.
A few conclusions and pending questions:
- Teacher shortages remain particularly acute in a few countries, leading to huge average class sizes and, in the most striking cases, to 1/3 of children learning in classes with more than 70 students.
- Teacher deployment inside many countries remains ill-balanced, with urban/rural, lower grades/higher grades disparities in class sizes, and globally high class size standard deviations.
XIV. Classroom conditions 1. General classroom condition and furniture – PASEC and SACMEQ countries
Classroom conditions are detailed below for the samples of 4 PASEC countries: Chad, Guinea, Mauritania and Niger: Table 60: classroom conditions, equipment – PASEC countries
1 2** 3 4 5 6 7 8 9 10 11 12
Chad 37.9 0.0 50.2 50.7 4.9 84.9 76.4 66.7 44.4 40.4 11.6 16.4
GuineaT 86.5 10.8 87.6 89.4 39.1 92.9 86.0 87.3 75.5 69.3 17.1 21.4
Mauritania 29.4 9.8 48.2 57.1 33.9 85.7 76.1 73.2 63.8 59.6 6.9 22.8
NigerT NA 11.0 83.0 75.5 66.8 95.3 96.0 75.5 53.8 43.9 8.3 11.5 T The corresponding sample was a sample constructed to compare different categories of teachers ** 10.7% of classrooms have electricity in Mali, 14.8% in Togo, which corresponds to an overall percentage for all 6 countries of 9.9% 1. Permanent classroom 2. Electricity** 3. Desk 4. Teacher’s chair 5. Cupboard 6. Blackboard (fixed or mobile)
7. Chalk or pen for the blackboard 8. Ruler for the blackboard 9. Set square for the blackboard 10. Compass for the blackboard 11. Dictionary 12. Map or Earth globe 13. Geometrical instruments for the classroom

46
Table 61: classroom conditions, equipment – SACMEQ countries14
Blackboard (6) and chalk (7) are important elements of a classroom: on average, in SACMEQ II countries, 94.5% of students are studying in classes with blackboards, the percentage being 90% for the 4 PASEC countries mentioned above. In Chad, Mauritania, Mauritius, Uganda, and Zambia, less than 90% of students are studying in classes equipped with a blackboard.
The percentage of classes having chalk or pen for a blackboard are similar, most of the time almost equal or even higher, except in Chad, Guinea, and Mauritania, where less teachers (around 8% less or more) claim to have chalk than a blackboard.
Variations between countries are more important when considering less important equipment: the PASEC countries considered above have low percentages of dictionaries or maps, but the average percentage of classrooms with one or more geometrical instrument is similar to that in SACMEQ countries (64% of classes in PASEC countries have either a set square or a compass or both –not counting the ruler as a geometrical instrument-, while 63% of students in SACMEQ ones study in classes with geometrical instruments in the classroom).
In PASEC countries, 2nd year classrooms are, on average, less well furnished than 5th year ones, except in terms of chalk or pen for the blackboard, for which 85% of 2nd year and 84% of 5th year classrooms have chalk or a blackboard pen which means both levels are similary equipped with those. The biggest discrepancies in favour of 5th year classrooms concern the ruler, set square, compass, dictionary and map which are 1.7 to almost 3 times more common in 5th year than in 2nd year classes. PASEC and SACMEQ results must be compared with caution as grade levels, in particular, are different.
14 PASEC and SACMEQ studies did not always refer to the same classroom resources, this is why it has seemed more relevant here, for the sake of comparison, to leave two complete tables with the detail of statistics for each kind of classroom equipment rather than try and create a global index. However, a SACMEQ “school resources index” exists (see for example [Saito, 2005]) and can help compare global levels of equipment in classrooms among SACMEQ countries.
Reading teacher Maths
teacher
2 3 4 5 6 7 Wall chart
Book shelves Library 11 12 13
Botswana 52.0 89.0 87.8 55.0 94.3 94.0 72.5 69.5 81.3 84.0 77.0 77.0
Kenya 16.9 62.1 65.8 15.8 98.9 98.7 66.1 7.0 44.9 85.4 72.7 86.8
Lesotho 11.0 86.3 87.8 90.3 95.8 98.3 78.8 41.8 54.0 74.3 68.0 61.0
Malawi 7.8 48.0 50.5 51.3 94.5 96.5 58.3 17.6 20.4 60.1 41.2 20.7
Mauritius 100.0 88.5 88.3 84.8 89.8 89.8 74.0 26.3 66.0 92.0 86.5 34.3
Mozambique 58.6 70.6 70.6 18.3 98.1 95.7 17.8 8.9 24.5 64.3 41.3 60.3
Namibia 57.0 69.6 68.1 59.6 97.0 96.0 56.6 29.8 45.7 85.2 63.6 66.3
Seychelles 100.0 97.0 97.0 91.8 94.8 97.0 97.0 94.8 74.3 99.0 96.8 81.5
South Africa 77.2 88.5 87.1 69.1 96.6 99.2 84.8 38.2 62.5 70.3 68.7 64.4
Swaziland 47.0 84.9 88.0 54.3 98.2 99.5 79.3 33.5 45.5 90.3 76.2 92.7
Tanzania 15.5 34.8 38.1 16.4 97.0 95.0 57.7 13.6 7.1 75.8 78.6 58.8
Uganda 14.8 59.0 75.8 16.8 85.1 89.9 66.0 8.8 23.5 74.2 62.9 77.4
Zambia 42.6 54.4 52.6 14.1 88.0 85.4 75.8 11.2 45.3 61.1 84.9 55.7
Zanzibar 37.8 65.4 69.5 8.2 95.1 91.0 22.3 5.6 35.9 22.3 46.7 50.5
SACMEQ II 45.5 71.4 73.4 46.6 94.5 94.7 65.0 29.4 45.2 74.2 69.0 63.2

47
2. Condition of the school buildings in SACMEQ countries: Table 62: Condition of the school building – SACMEQ countries
Condition of school building
Complete rebuilding Some major repairMost minor
repair Some minor
repair Good
condition
Botswana 7,3 31,5 20,0 29,0 12,3
Kenya 5,3 27,6 25,9 30,9 10,3
Lesotho 21,1 46,1 10,5 20,3 2,0
Malawi 16,8 41,5 16,5 19,3 6,0
Mauritius 2,8 14,8 12,0 40,1 30,3
Mozambique 17,8 25,5 22,8 20,4 13,5
Namibia 8,5 39,8 9,5 26,6 15,5
Seychelles 23,1 14,8 5,5 13,5 43,1
South Africa 15,5 29,2 22,6 16,5 16,2
Swaziland 6,5 41,9 21,1 23,6 7,0
Tanzania 11,0 39,5 31,3 13,0 5,3
Uganda 35,2 43,1 12,7 5,0 4,0
Zambia 23,0 27,8 19,6 19,9 9,7
Zanzibar 6,8 40,3 15,8 33,0 4,3
SACMEQ II 14,3 33,1 17,5 22,2 12,8
47.4% of students overall in SACMEQ countries study in schools which are in need either of major repair or of complete rebuilding, and only 12.8% in schools which are said to be in good condition.
In some countries, fighting has caused an important number of destructions, including of schools.
3. Seats for pupils: Table 63: Seats for children – PASEC countries
Proportion of students who are comfortably seated
All Almost all Half Some None
Chad 25.7 9.8 0 10.7 50.0
GuineaT 39.1 20.8 0 14.5 15.8
Mauritania 72.3 8.7 5.9 5.9 7.4 T The corresponding sample was a sample constructed to compare different categories of teachers “Comfortably seated” refers to children who both have a chair or bench to sit on and a desk or table to write on, with no more pupils on the bench/seat than there should normally be. The importance of demands for education in sub-Saharan countries is met with great efforts on the part of governments, but getting enough (decently furnished) classrooms ready for all the children remains a challenge.

48
Discrepancies between 2nd and 5th year are less important when considering seats than in terms of furniture, but still in favour of 5th year: more children are seated comfortably in 5th year than in 2nd year. Those discrepancies are aligned with the class size discrepancies made out earlier. Class dimensions are often standardized, and the proportion of children who are comfortably seated is then related to the number of pupils attending class, as compared to the maximum number of tables which can be put in a class of that dimension.
We have similar data for SACMEQ country students. The first column is the approximate equivalent of: “comfortably seated”, since it corresponds to the percentage of students who both have a place (chair, bench, or seat –stones, logs, or boxes are not included in the data-) to sit on, and a place (table or desk) to write on. The data do not enable us to know if the student is seated with just one a classmate on a bench made for 2 students, or if there are 3 or 4 students on a bench made for two, so the equivalency may not be perfect (in PASEC countries, a requirement for a student to be considered as “comfortably seated” was that s/he be seated on a chair or bench with no more pupils on the bench/seat than there should normally be).
The second column refers to the least advantaged pupils, those who sit on the floor, not even on a stone, log, or box, and have nowhere to write, not even some makeshift table. Table 64: seats for children – SACMEQ countries
Country
% of students who both have a chair/bench/seat to sit on and a table/desk to
write % of students who sit on the floor and have
nowhere to write
Botswana 100.0 0.0
Kenya 95.5 0.0
Lesotho 97.3 0.0
Malawi 54.0 42.8
Mauritius 100.0 0.0
Mozambique 65.3 23.8
Namibia 95.3 0.3
Seychelles 100.0 0.0
South Africa 95.3 0.3
Swaziland 98.5 0.0
Tanzania 94.8 1.3
Uganda 71.0 1.8
Zambia 86.8 2.8
Zanzibar 49.5 41.3
Total 85.9 8.1
One can see that, while the richest countries, like Botswana, Mauritius, or Seychelles have students who all have a place to seat and a place to write, other places like Malawi or Zanzibar offer such conditions to only around half of the students, most of the other half having to seat on the ground with no place to write.
As in PASEC countries, great efforts have been made but in several places, getting enough (decently furnished) classrooms ready for all the children remains a challenge.
4. Teacher’s guide:
How many teachers have a book or guide to follow in the subjects they teach?
The table below shows the percentages for teachers’ guides in PASEC and SACMEQ countries.

49
Table 65: Percentage of students whose teachers has (diagnosis studies) / of teachers having (thematic studies) a book or guide in the subject(s) taught – all countries
Teacher's book or guide French / English / reading Maths
Chad 62.4 52.3
GuineaT 77.5 50.3
MaliT 53.9 69.4
Mauritania 71.5 47.2
NigerT 58.1 82.2
TogoT 43.3 35.7
6 PASEC countries above 61.1 56.2
Botswana 83.8 64.3
Kenya 94.2 86.8
Lesotho 77.3 82.8
Malawi 88.9 78.3
Mauritius 30.5 26.0
Mozambique 55.6 30.8
Namibia 83.2 68.0
Seychelles 92.8 48.3
South Africa 73.1 67.4
Swaziland 95.9 93.7
Tanzania 85.4 87.3
Uganda 71.9 78.4
Zambia 76.7 83.7
Zanzibar 55.6 60.7
SACMEQ II 76.0 68.1 T The corresponding sample was a sample constructed to compare different categories of teachers One word of caution is needed before interpreting the figures: in PASEC countries, 5th year teachers have a Maths teacher’s book a little more often than 2nd year ones while 2nd grade teachers more often have a French teacher’s book (around 20% more teachers have a French teacher’s book in 2nd year, than in 5th year). The variations in the figures from one grade to the next can be important, so knowing what the percentage of books is in one grade is not enough to extrapolate to other grades. Not knowing the priorities of the school systems, it is difficult to compare 2nd grade allocations in one country, for example, with 6th grade allocations in another, or to extrapolate something about the whole primary school in a country based on the 6th grade sample.
It seems, though, that most countries place more importance on the reading book than on the maths book. There are however 7 exceptions among the 20 countries listed above.
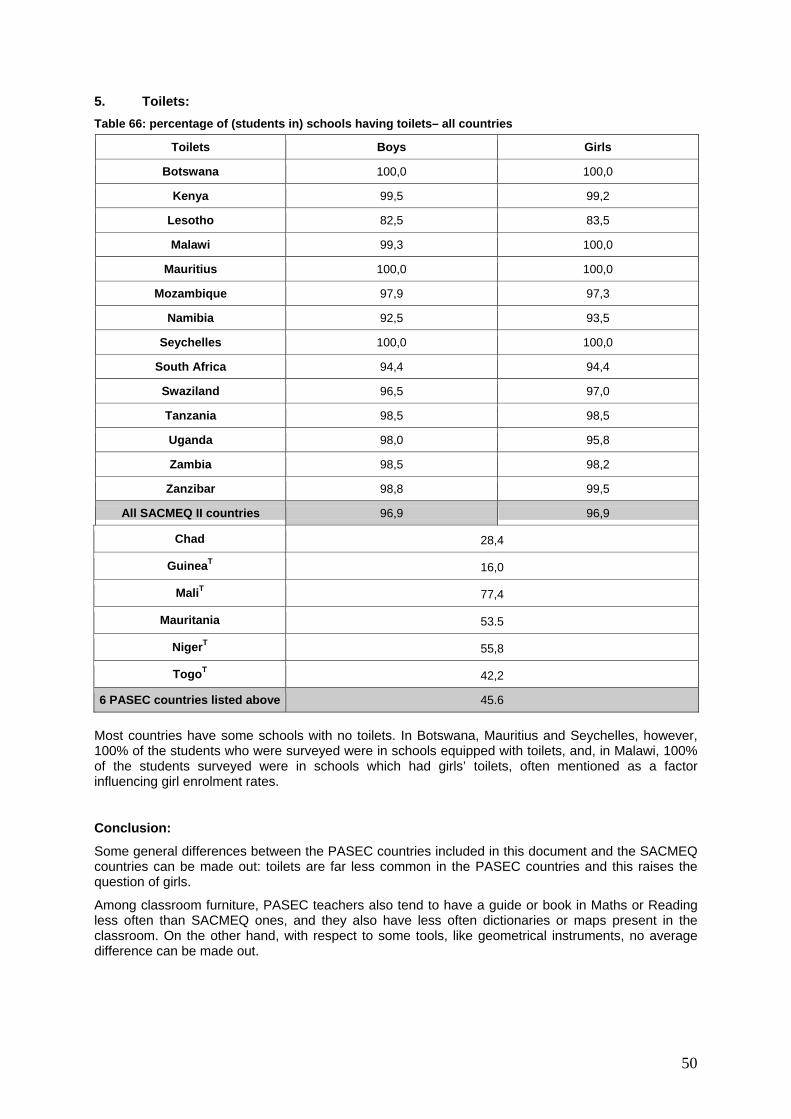
50
5. Toilets: Table 66: percentage of (students in) schools having toilets– all countries
Toilets Boys Girls
Botswana 100,0 100,0
Kenya 99,5 99,2
Lesotho 82,5 83,5
Malawi 99,3 100,0
Mauritius 100,0 100,0
Mozambique 97,9 97,3
Namibia 92,5 93,5
Seychelles 100,0 100,0
South Africa 94,4 94,4
Swaziland 96,5 97,0
Tanzania 98,5 98,5
Uganda 98,0 95,8
Zambia 98,5 98,2
Zanzibar 98,8 99,5
All SACMEQ II countries 96,9 96,9
Chad 28,4
GuineaT 16,0
MaliT 77,4
Mauritania 53.5
NigerT 55,8
TogoT 42,2
6 PASEC countries listed above 45.6
Most countries have some schools with no toilets. In Botswana, Mauritius and Seychelles, however, 100% of the students who were surveyed were in schools equipped with toilets, and, in Malawi, 100% of the students surveyed were in schools which had girls’ toilets, often mentioned as a factor influencing girl enrolment rates.
Conclusion:
Some general differences between the PASEC countries included in this document and the SACMEQ countries can be made out: toilets are far less common in the PASEC countries and this raises the question of girls.
Among classroom furniture, PASEC teachers also tend to have a guide or book in Maths or Reading less often than SACMEQ ones, and they also have less often dictionaries or maps present in the classroom. On the other hand, with respect to some tools, like geometrical instruments, no average difference can be made out.

51
H. Conclusion Teachers’ professional status
Civil servants had become a minority, at the time of the PASEC study, in four out of the six PASEC countries mentioned in this paper. Faced with high demands for schooling, and bearing in mind the 2015 objective of education for all, countries have tried out new modes and durations of training, along with different status and salaries, in order to increase their workforce in a short enough time and with the resources they have. The data show that PASEC countries, which often had greater enrolment challenges to face than SACMEQ ones, tend to have significantly shorter pre-service training than SACMEQ ones. The sizeable share, in many countries, of community teachers, also shows the demand from the population is high, since they are ready to pay to get a teacher when the State, despite its efforts, cannot completely face the growing numbers of primary school aged children. Gender of the teacher
Women tend to teach lower classes (at least in PASEC countries), and be in urban areas (in big cities or at least in small towns) in all countries. They are not systematically less present among contract teachers than among civil servants: the situation varies from country to country. It must be noted that specific female-oriented recruitment policies have sometimes been set in place in order to recruit female contract teachers, and that the status of those teachers who are not civil servants can also vary (some are hired by the State, others are hired by the communities). For example, Guinea accepts women candidates with a senior secondary school diploma while male candidates need an A level.
Age and experience
Countries’ progress towards Universal Primary Education was made possible through heavy recruitment of young teachers in recent years. This is particularly visible in those countries which had much progress to do and took up the challenge of trying to catch up.
Since more experienced teachers tend to have different revendications in terms of salary and status, can have different motivation and impact on students, the evolution of the current young workforce will be an important parameter of the countries’ education systems: will those teachers stay in the profession? What career opportunities need to be considered?
Many African countries, especially SACMEQ ones, also have to face the challenge of HIV/AIDS and its impact, direct or indirect, on the teaching force.
Academic qualifications
PASEC and SACMEQ evaluations data raise the question of the ability of the school systems to attract, motivate and keep highly qualified teachers.
Interpreting the tables also requires to have an idea of what the desirable level of education is, for example through assessment of the impact of different categories of teachers on children and of the system’s ability to keep those teachers motivated enough to stay.
Pre- and in-service training
The necessities of Universal Primary Education (and the requirements of donors) led those countries which were most behind in terms of school attendance (those countries are mostly in the PASEC group) to train teachers through very short programmes –this leads to time and financial gains
As a rule, in both groups of countries, teachers who did not get pre-service are also less likely not to get in-service. Testing the teachers
Teachers’ competencies were tested in some PASEC and SACMEQ countries. PASEC results, presented for only two countries (Chad and Guinea) show that an important share of the teachers has academic difficulties. However, this test, not being comparable with that of the students, does not permit us to go much further in the interpretation.

52
In SACMEQ countries, 0.9% of the students in the sample have a teacher whose score on the literacy test is lower than their own, and 2.4% have a teacher whose score on the maths test is lower than their own.
Academic diplomas have an impact on competency levels, but variations between countries exceed the advantage a higher diploma (A level instead of Junior Secondary, for example) provides. Variety in country from region to region can also be important.
Local language competencies
Part of the discrepancies between countries is due to recruitment policies: are teachers hired locally or nationally? In some countries, the dominant mode of recruitment is for communities to hire their teachers, while in other cases the State recruits the teachers, and has a policy to send teachers all over the country, irrespectively of the place they come from.
Teachers’ satisfaction levels
Teacher satisfaction appears to generally be higher among contract and community teachers than among civil servants. It is also lower among experienced teachers, as experience and status are strongly correlated. A 2002 analysis by Michaelowa [Michaelowa, 2002] of the parameters leading to job satisfaction in 5 different countries determined job experience was the most important parameter of the two and was linked with lower satisfaction, even when controlling for professional status.
We have not reproduced such elaborate study for the above-mentioned countries, so cannot say whether those results would still hold in the 6 PASEC countries mentioned in this document. This is a question probably worth pursuing.
Proportion of the official school curriculum covered during the year, as estimated by the teachers
It seems professional training could be linked with the ability of the teacher to teach the official school curriculum. High percentages of untrained teachers may thus be detrimental to the completion of the curriculum. We have not included elements about the length and quality of the training and the data correspond to declarations (necessarily somewhat subjective) by the teachers, but the above results suggest this question may deserve further analysis.
Teacher absenteeism
PASEC and SACMEQ data, even though they are sometimes imprecise, nevertheless show that absenteeism is widespread. Furthermore, it is not systematically a female or a male behaviour. It is correlated with gender in some countries, but in others it is not.
There is also a very high percentage of cases in which teachers change during the year (1 case in 6 on average in the four countries for which this data is available).
Many schools do not respect the school calendar either –the earliest school can begin 6 months before the latest one, and the standard deviation can be as high as a month-.
All those problems, associated with students’ absenteeism decrease the opportunity to learn. For PASEC countries, this means that, even not taking into account teacher change during the year, or student’s absenteeism, which are more difficult to measure with precision, one can easily find two students in the same country who have had two full months of difference in terms of opportunity to learn (in a typical school year of, officially, 9-10 months). Adding in our estimations of student absenteeism, a student may easily loose 3 months out of a school year which counts 9-10 months: one third of the total official learning time.
Class enrolment and attendance
Teacher shortages remain particularly acute in a few countries, leading to huge average class sizes and, in the most striking cases, to 1/3 of children learning in classes with more than 70 students. Furthermore, deployment inside many countries remains ill-balanced, with urban/rural, lower grades/higher grades disparities in class sizes, and globally high class size standard deviations.
Class and school furniture and commodities Some general differences between the PASEC and SACMEQ countries included in this document can be made out: toilets are far less common in the PASEC countries and this raises the question of girls’ enrolment and attendance.
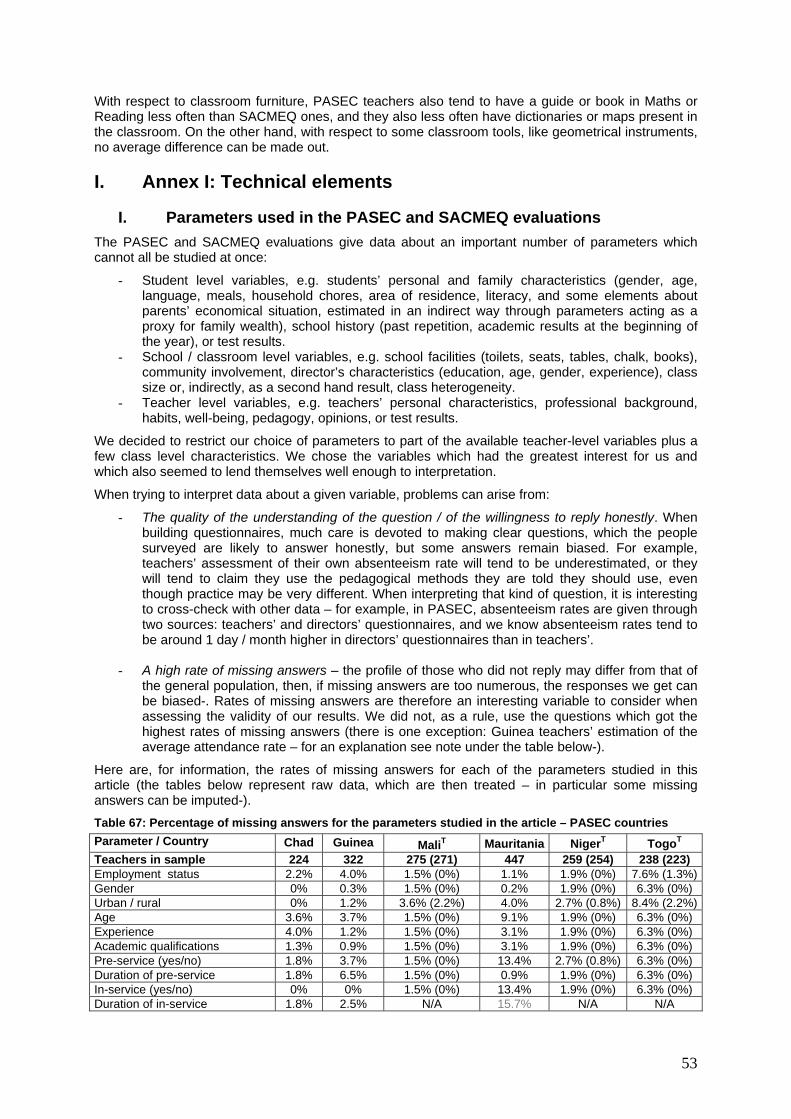
53
With respect to classroom furniture, PASEC teachers also tend to have a guide or book in Maths or Reading less often than SACMEQ ones, and they also less often have dictionaries or maps present in the classroom. On the other hand, with respect to some classroom tools, like geometrical instruments, no average difference can be made out.
I. Annex I: Technical elements
I. Parameters used in the PASEC and SACMEQ evaluations The PASEC and SACMEQ evaluations give data about an important number of parameters which cannot all be studied at once:
- Student level variables, e.g. students’ personal and family characteristics (gender, age, language, meals, household chores, area of residence, literacy, and some elements about parents’ economical situation, estimated in an indirect way through parameters acting as a proxy for family wealth), school history (past repetition, academic results at the beginning of the year), or test results.
- School / classroom level variables, e.g. school facilities (toilets, seats, tables, chalk, books), community involvement, director’s characteristics (education, age, gender, experience), class size or, indirectly, as a second hand result, class heterogeneity.
- Teacher level variables, e.g. teachers’ personal characteristics, professional background, habits, well-being, pedagogy, opinions, or test results.
We decided to restrict our choice of parameters to part of the available teacher-level variables plus a few class level characteristics. We chose the variables which had the greatest interest for us and which also seemed to lend themselves well enough to interpretation.
When trying to interpret data about a given variable, problems can arise from:
- The quality of the understanding of the question / of the willingness to reply honestly. When building questionnaires, much care is devoted to making clear questions, which the people surveyed are likely to answer honestly, but some answers remain biased. For example, teachers’ assessment of their own absenteeism rate will tend to be underestimated, or they will tend to claim they use the pedagogical methods they are told they should use, even though practice may be very different. When interpreting that kind of question, it is interesting to cross-check with other data – for example, in PASEC, absenteeism rates are given through two sources: teachers’ and directors’ questionnaires, and we know absenteeism rates tend to be around 1 day / month higher in directors’ questionnaires than in teachers’.
- A high rate of missing answers – the profile of those who did not reply may differ from that of
the general population, then, if missing answers are too numerous, the responses we get can be biased-. Rates of missing answers are therefore an interesting variable to consider when assessing the validity of our results. We did not, as a rule, use the questions which got the highest rates of missing answers (there is one exception: Guinea teachers’ estimation of the average attendance rate – for an explanation see note under the table below-).
Here are, for information, the rates of missing answers for each of the parameters studied in this article (the tables below represent raw data, which are then treated – in particular some missing answers can be imputed-). Table 67: Percentage of missing answers for the parameters studied in the article – PASEC countries Parameter / Country Chad Guinea MaliT Mauritania NigerT TogoT Teachers in sample 224 322 275 (271) 447 259 (254) 238 (223) Employment status 2.2% 4.0% 1.5% (0%) 1.1% 1.9% (0%) 7.6% (1.3%)Gender 0% 0.3% 1.5% (0%) 0.2% 1.9% (0%) 6.3% (0%) Urban / rural 0% 1.2% 3.6% (2.2%) 4.0% 2.7% (0.8%) 8.4% (2.2%)Age 3.6% 3.7% 1.5% (0%) 9.1% 1.9% (0%) 6.3% (0%) Experience 4.0% 1.2% 1.5% (0%) 3.1% 1.9% (0%) 6.3% (0%) Academic qualifications 1.3% 0.9% 1.5% (0%) 3.1% 1.9% (0%) 6.3% (0%) Pre-service (yes/no) 1.8% 3.7% 1.5% (0%) 13.4% 2.7% (0.8%) 6.3% (0%) Duration of pre-service 1.8% 6.5% 1.5% (0%) 0.9% 1.9% (0%) 6.3% (0%) In-service (yes/no) 0% 0% 1.5% (0%) 13.4% 1.9% (0%) 6.3% (0%) Duration of in-service 1.8% 2.5% N/A 15.7% N/A N/A

54
Test results 7.1% 0.9% 2.2% (0.7%) 16.6% N/A N/A Local language 9.4% 4.0% 1.5% (0%) 16.3% 1.9% (0%) 6.3% (0%) Benefits (existence) 0% 0% N/A 27.3% N/A N/A Incentives (existence) 0% 0% N/A 34.5% N/A N/A Incentives (% of salary) 10.7% 5.0% N/A 33.3% N/A N/A Second activity 0% 0% 1.5% (0%) 13.4% 1.9% (0%) 6.3% (0%) Salary 11.6% 5.6% 1.5% (0%) 18.6% N/A N/A Salary is late N/A N/A N/A N/A N/A 6.3% (0%) Wish to change school 11.6% 5.3% 8.0% (6.6%) 18.6% 1.9% (0%) N/A Wish to remain a teacher 13.8% 5.6% 8.4% (7.0%) 17.9% 1.9% (0%) N/A Ambitions 16.1% 12.7% N/A 18.1% N/A N/A % Maths curriculum covered 28.6% 7.5% 1.5% (0%) 5.6% 1.9% (0%) N/A % French curriculum covered 28.6% 6.5% 1.5% (0%) 4.5% 1.9% (0%) N/A Teacher absenteeism 12.5% 14.3% 21.8% (20.7%) 54.6% 1.9% (0%) 6.3% (0%) Teacher has changed 4.5% 0.6% N/A 8.7% N/A 6.3% (0%) Beginning of the year (date) 9.8% 0.9% 1.5% (0%) 2.2% N/A N/A Enrolment 0.4% 0% N/A 0% N/A N/A Attendance 9.4% 55.6%** 1.5% (0%) 10.1% 1.9% (0%) 6.3% (0%) Multigrade / double shift 0.9% 0.3% 1.5% (0%) 0% 1.9% (0%) 6.3% (0%) Attrition 7.6% 7%? N/A 6.5% N/A N/A Permanent classroom 6.3% 0.9% 1.5% (0%) 10.3% 1.9% (0%) N/A Electricity 6.7% 2.5% 1.5% (0%) 11.4% 1.9% (0%) N/A Desk 0% 0% N/A 0% 1.9% (0%) N/A Teacher’s chair 0% 0% N/A 0% 1.9% (0%) N/A Cupboard 0% 0% N/A 0% 1.9% (0%) N/A Blackboard 0% 0% N/A 0% 1.9% (0%) N/A Chalk / pen 0% 0% N/A 0% 1.9% (0%) N/A Ruler for the blackboard 0% 0% N/A 0% 1.9% (0%) N/A Set square 0% 0% N/A 0% 1.9% (0%) N/A Compass 0% 0% N/A 0% 1.9% (0%) N/A Dictionary 0% 0% N/A 0% 1.9% (0%) N/A Map or Earth globe 0% 0% N/A 0% 1.9% (0%) N/A Students comfortably seated 4.9% 1.6% N/A 12.3% 1.9% (0%) N/A Teacher’s Maths guide 13.4% 9.9% 1.5% (0%) 13.4% 1.9% (0%) 6.3% (0%) Teacher’s French guide 12.5% 14.6% 1.5% (0%) 13.4% 1.9% (0%) 6.3% (0%) Toilets 0% 1.2% 3.6% (2.2%) 0.7% 2.7% (0.8%) 8.4% (2.2%)Public / private school 0% 1.2% N/A 0.7% N/A 8.4% (2.2%)* All data are absent for 4 teachers in the Mali sample. Their students were tested normally, but we do not have any data about the teachers. The sample included 275 teachers, 271 of whom replied to part of the questionnaire. We are giving the percentage of missing answers on the 275 teacher sample, and, in parenthesis, the percentage of missing answers among the remaining 271 teachers. Similarly, in Niger, all data are absent for 5 of the 259 teachers in the sample, and in Togo, all data are absent for 15 of the 238 teachers. ** When the question is “number of students present in your class on an average day”, 55.6% of teachers do not reply, whereas, if the question is “number of students absent in your class on an average day” only 2.8% of teachers fail to reply to the question. It is then possible to complement missing answers and get an improved estimated average attendance rate. This illustrates the importance of the wording of the questionnaires.
Table 68: Percentage of missing answers for the parameters studied in the article – SACMEQ I countries
SAC
MEQ
I:
MISSIN
G
AN
SWER
S
Teacher's gender
School location
Teacher's age
Experience
Professional
qualification
In-service
Days
absent (pupil)
Kenya 1.5 0 0 1.5 1.5 1.5 0
Malawi 12.8 0 0 10.8 10.8 12.0 14.8
Mauritius 4.3 0 0 4.3 4.3 4.3 0
Namibia 7.3 0 0 7.3 7.3 7.3 0
Zambia 13.3 20.8 0 12.0 12.0 13.3 0.3
Zanzibar 0.8 0 0 0.8 0.8 0.8 0
Zimbabwe 0.8 0 0 0.8 0.8 0.8 0

55
The following table shows the rate of missing answers for the SACMEQ II questionnaire. Table 69: Percentage of missing answers for the parameters studied in the article – SACMEQ II countries

56
The number of classes included15 in the SACMEQ II survey was the following: Botswana: 471, Kenya: 320, Lesotho: 250, Malawi: 197, Mauritius: 525, Mozambique: 1058, Namibia: 606, Seychelles: 60, South Africa: 399, Swaziland: 295, Tanzania: 313, Uganda: 163, Zambia: 430, Zanzibar: 360. For each SACMEQ II class, one teacher (if 6th grade teachers are in charge both of Maths and Reading, which is the case in Botswana and Mauritius) or two teachers (in the other SACMEQ countries) were surveyed.
II. Sample characteristics General principles of the evaluations: The tests/surveys we used in this article had different primary goals:
- PASEC diagnostic evaluations assess students’ progress, in 2nd and 5th year, and the impact of various parameters on this progress.
- SACMEQ evaluations assess students’ (and teachers’, for SACMEQ II) competencies and describe students’ and teachers’ characteristics at the end of 6th grade.
- PASEC thematic evaluations assess the impact of specific variables (teacher professional status / teacher training) on students’ progress, in 2nd and 5th year. Those evaluations also study the impact of other parameters, but the primary goal is the assessment of the impact of those specific variables.
When assessing 6th year SACMEQ students, or 5th year PASEC students, one generally assesses students who are in their previous to last year of primary school, since most francophone African countries consider the 6 first years of schooling to be primary school, while most Anglophone ones consider the 7 first years to be primary school. Therefore, those students are generally not in their exam year. This was intentional, and similar reasons led, for PASEC evaluations, to the assessment of 2nd year students – first year is deemed too specific. The rationale behind assessing two different years in PASEC was that some parameters (teacher gender, school books, etc.) may have varying importance at different ages and competency levels, furthermore, many students have already left school in 5th year, it therefore seemed important to also cover the 2nd year. Achieving the varying objectives of each evaluation has technical consequences: Data sources: Evaluating students’ progress means one will have to do two evaluations, one at the beginning of the school year, and the other one at the end. The data one uses to make one’s sample of students are more up-to-date at the end of the year than at the beginning of the year, but assessing progress (which is what is done in the PASEC evaluations) means one will have to make do with the data available when the school year starts. On the other hand, when one does not assess progress but students’ end-of-year results, it is difficult to assess the impact of some parameters, in particular teacher parameters. Indeed, the result of a child at the end of the year depends on his/her whole school history, therefore the impact of this year’s teacher is likely to be diluted. Excluded populations: The excluded population is the population which was excluded when doing the evaluation, either because of safety reasons or for practical reasons (e.g. tiny population which is difficult to reach, and which would generate high costs if included in the survey). As a rule, there is no excluded population in PASEC diagnostic evaluations, and population was excluded from thematic evaluations only when the status or training of the teacher which did not correspond to the purpose of the evaluation. This is the case in Guinea, were the purpose of the study was to compare civil servants with state contract teachers, it was therefore intended to exclude community teachers from the sample. This should have represented, at the time of the survey [Balde,
15 “included” means that at least one student from the class was evaluated. Contrary to what happens in PASEC studies, students from a given school in SACMEQ studies can be from different classes.

57
2006], around 5% of the teacher population. However, a population is excluded, de facto, from the evaluations: this is the population for which the Ministry’s databases do not give enough information. The size of this excluded population is difficult to estimate. Despite the “no excluded population” rule of PASEC evaluations, it was necessary to exclude some parts of Chad (Tibesti and East of the country) for security reasons, and “Franco Arabic schools” were also excluded from the survey. In PASEC thematic evaluations, the samples were constructed to best represent the categories of teachers one wanted to compare. In Guinea, the study was centered on the comparison between teachers trained through the classical, long teacher training, and teachers trained through shorter training. Furthermore, the goal of the study was also to compare the efficiency of different modalities of accelerated training. Community teachers, on the other hand, were not to be assessed, therefore, they were supposed to be part of the excluded population. 4 community teachers were nevertheless included in the sample because of the technical difficulties arising from the need to survey at an affordable cost both 2nd and 5th grade level students and teachers (see explanation below). In Togo, “EDIL” schools (“schools of local initiative”) represent 8.8% of the primary school population. It was unfortunately impossible to include them in the sample.
In SACMEQ II evaluations, the excluded population includes students from special schools, small schools (schools with less than 20 students in Standard 6 for Botswana, Mozambique, South Africa, Tanzania, Uganda, Zanzibar, schools with less than 15 students in Standard 6 for Kenya, Malawi, Mauritius, Namibia, Swaziland and Zambia, and schools with less than 10 students in Lesotho and Seychelles), private schools in Malawi, “inaccessible schools” in Namibia and Malawi, and schools from conflict zones in Uganda.
Here is a table below, extracted and adapted from the SACMEQ country reports, giving the percentage of the students and schools which were excluded for each SACMEQ country. Table 70: Desired, defined, and excluded populations – SACMEQ II countries
Desired Defined Excluded School System Schools Pupils Schools Pupils Schools Pupils Pupils % Schools %
Teachers % (approximation)
Botswana 720 41408 589 39773 131 1635 3.9 18,2 9,0
Kenya 15439 631544 13313 607900 2126 23644 3.7 13,8 11,5
Lesotho 1170 40493 947 39212 223 1281 3.2 19,1 20,3
Malawi 3663 219945 3368 212046 295 7899 3.6 8,1 7,3
Mauritius 277 26510 274 26481 3 29 0.1 1,1 0,4
Mozambique 509 112279 500 112173 9 106 0.1 1,8 0,4
Namibia 849 48567 767 47683 82 884 1.8 9,7 6,2
Seychelles 25 1577 24 1571 1 6 0.4 4,0 1,7
South Africa 17073 962350 11997 920020 5076 42330 4.4 29,7 18,8
Swaziland 498 19940 458 19541 40 399 2.0 8,0 7,1
Tanzania 10786 529296 9516 511354 1270 17942 3.4 11,8 9,4
Uganda 9688 517861 8425 499127 1263 18734 3.6 13,0 8,8
Zambia 3858 180584 3090 176336 768 4248 2.4 19,9 13,7
Zanzibar 161 22179 151 22041 10 138 0.6 6,2 2,2
Total 64716 3354533 53419 3235258 11297 119275 3.6 17,5 12,4 The percentage of teachers which were excluded is not available in SACMEQ reports. Since we are mainly interested in teachers, we have made an approximation of the percentage of teachers who

58
were excluded, using the average 6th grade class size computed from the SACMEQ data (those data are available in the main text of this article). The column: teachers % (approximation) can be obtained computing:
Schools (excluded) / ( (pupils (defined) / 6th grade class size) + schools (excluded) ) The rationale for this formula is that small schools (less than 20, 15, or 10 students in Standard 6) will probably only have one teacher in 6th grade (therefore the approximation that the number of teachers excluded is equal to the number of schools excluded). If the number of excluded schools with more than one 6th grade teacher is not negligible, then the percentage of teachers who were excluded can be higher than the number which we computed. Choice of the sample: Size of the sample: Once the excluded population has been defined, the size of the sample is determined in function of the expected precision of the results. This size depends on the number of students one will assess in each school and on the intra-class correlation, if it is known, or of an estimation of it, if it is unknown. Intra-class correlation coefficients tend to fall between 0.2 and 0.4, however, evaluations can also show more extreme coefficients such as 0.1 (Madagascar / PASEC, Seychelles / SACMEQ) or 0.6 (Namibia / SACMEQ). Stratification procedures: The stratification procedures, in SACMEQ countries [Shabalala, 2005] employ an explicit stratification variable: region, and an implicit one, school size. The choice of region as a variable corresponds to the wish of the SACMEQ Ministries of Education. The choice of size as a variable contributes to separating mostly urban and mostly rural schools, urban/rural differences being a concern of the study.
Stratification variables are not the same in all PASEC evaluations. Different kinds of purposes (diagnosis of the school system or evaluation of the impact of teachers’ status, for example) call for adapted stratification variables.
Diagnosis studies:
The Chad study is a diagnosis study. The stratification procedure identifies several relevant variables: type of school (public school, community school, private school), type of class (multigrade, etc.), school with complete / incomplete primary cycle.
The Mauritania study is also a diagnosis study. The stratification procedure identifies several relevant variables: type of school (public /private school), type of class (multigrade, double shift), school with complete / incomplete primary cycle.
Thematic studies:
The goal of the Togo evaluation was to identify the impact of different levels of training for teachers, the stratification procedure reflects those concerns by identifying stratification variables: professional training, academic diploma, date of entry in the teaching profession, and type of school (public / private).
In Mali, Guinea and Niger thematic evaluations, the stratification variables were the status / training of the teachers and the region / sub-region of the country. The number of students in each stratum, in SACMEQ and PASEC diagnosis studies, is defined so that each student in the country has the same weight. Some strata, both in PASEC and SACMEQ, were over-represented in order to have enough students from that category to have the desired precision on the results for those students. For example, some PASEC evaluations wanted to assess the impact of multigrade schools. If this goal was to be achieved, it was impossible to have only 2 or 3 multigrade

59
classes in the sample, therefore, this stratum was overrepresented, then weights were introduced to compensate for that overrepresentation. In the case of PASEC thematic studies, the main purpose is to compare different categories of teachers. In this perspective, results with optimal precision will be obtained if the number of teachers in each category is high enough. It was thus decided to use samples with equal numbers of teachers of each category. If one category (for example, civil servant teachers), is less represented in the teacher population than another (for example contract teachers), we then have biased samples in which not each pupil has the same weight (even though the weight of each category can be corrected to have an idea of the general population). Those samples are thus best suited to compare different categories of teachers, but do not give as precise information on the general student population. This was already explained in the main text of this article. Selection of schools and pupils within schools: SACMEQ samples: In SACMEQ evaluations, once strata are defined, and the number of children to be chosen in the strata therefore known, one then proceeds to first choose schools, then pupils, in the strata. 20 students are evaluated in each school: this defines the number of schools which are to be chosen. Schools are chosen by selecting the corresponding number of students in the list of students (this corresponds to choosing schools by giving each school a weight proportional to its population, thus giving all students the same weight), then 20 students are chosen at random from each of the selected schools. Final weights are given to each student to correct for:
- over or under-representation of strata - mismatch between the data used and the actual number of students in each school - students who are absent during testing The final corrected sample therefore gives equal weight to each student in the country. Students from a same school may or may not have the same teacher. Since the 20 students from a given school were selected randomly, the probability they have the same teacher varies from country to country: for example, in Uganda, 98.5% of schools only have one class at 6th grade level: this means the overwhelming majority of students in a same school will be from the same class and have the same teacher. In Mozambique, however, schools with only one 6th grade class represent only 1.1% of the total school population, most schools having between 3 and 6 classes at 6th grade level, some having up to 33 classes at that level. This means in some schools most students selected will likely have different teachers. On average, for all SACMEQ, 34.7% of schools have only one class at 6th grade level. As a consequence of that situation, in most cases, it will be more difficult to assess class effect in the case of SACMEQ evaluations, whereas the sample is very adapted, on the other hand, to the main purpose of the SACMEQ evaluations which is to assess the state of the education system nationally, allowing in particular for regional and urban/rural comparisons. For a descriptive article as this one, this kind of sample is also well adapted. The high variations (from 163 in Uganda, where one school surveyed will almost automatically correspond to one teacher, to 1058 in Mozambique) in the number of classes surveyed are also a consequence of the variations in the number of classes per school according to country (only 60 classes were surveyed in Seychelles, but this is simply due to the tiny size of the island – all the 6th grade school population, save 6 students studying in one school, was surveyed).
Selection of schools and pupils within schools: PASEC samples: In PASEC evaluations, once strata are defined, and the number of children to be chosen in the strata therefore known, one then proceeds to first choose schools, then classes if there are several classes at the level (2nd or 5th grade) chosen, then pupils. The choice to select all students from a given school in the same class responds to the purpose of the PASEC evaluation, which includes assessment of the impact of class level variables, such as teacher training, academic background, experience, or personal characteristics.

60
15 students are evaluated for each class which is selected. Togo is an exception: 12 students were evaluated in each of the classes selected. The number of students surveyed per class and the correlation coefficient determine the number of schools which are to be chosen in each stratum. Schools are chosen by selecting the corresponding number of students in the list of students (this corresponds to choosing schools by giving each school a weight proportional to its population, thus giving all students the same weight), then, if there are several classes at that grade level inside the same school, one class is chosen at random, then a random set of 15 students (12 for Togo) is chosen from that class. The bias generated from choosing a class at random while not all classes at the same grade level have exactly the same number of students can be corrected using weights16. Given the characteristics of PASEC countries, which have many tiny schools, and the importance given, in most PASEC evaluations, to understanding the impact of those schools, it was important that small schools be included in the sample17. Therefore, it sometimes happens that one wants to take a random number of 15 (or 12 in the case of Togo) 2nd or 5th grade students from a given class, while there are only 5 students, for example, in the whole school at 5th grade level. The solution chosen by PASEC evaluators was to then include the entire class population (5 in this case) in the sample, and correct the errors induced by taking less than the expected number of 15 (or 12) students, using appropriate weights. As in the case of SACMEQ, databases are not always accurate, schools and students’ number being different in reality from what was expected. Furthermore, ministries may have some data about schools, but not enough data about teachers’ status within schools. Because of the needs of PASEC thematic studies, this can be a problem, and ministry-level data can have to be complemented by other data (e.g. local inspectors’ knowledge). This has to be taken into account in the analysis. As in the case of SACMEQ, the final sample differs from the expected sample. Tables explaining those differences can be found in country reports, both for SACMEQ and PASEC countries, and were not reproduced in this annexe. One final technical difficulty arises from the choice to assess students in 2nd and 5th year: this means one has to double the number of students sampled. If one did two different samples, one for 2nd grade, and the other one for 5th grade, then one would get the best sample but the total number of schools to sample, thus the total cost, would be doubled. This was not possible, especially as costs were already doubled by doing both a pre-test and a post-test, so, in order to diminish the financial burden, it was decided to survey 5th grade classes in schools where 2nd grade classes were sampled, and reciprocally, each time both 5th and 2nd grade exist in the school (this is not always the case, since, in some countries, a significant number of schools only offer an incomplete primary cycle). In so doing, students’ weight is not the same as it should be in an unbiased sample, since the weight of a school should be proportional to the 2nd grade population for a 2nd grade survey, and to the 5th grade population for a 5th grade survey, and it obviously cannot be both –unless all schools have exactly the same 5th grade population / 2nd grade population ratio!-. This bias is compensated by using adequate correcting weights. Corrections to give equal weight to all students can therefore be complicated. They have to include corrections of:
- over or under-representation of strata - mismatch between the data used and the actual number of students in each school - changes between expected and actual sample due to students who are absent during testing - errors due to the difference in size between two classes at the same grade level, if there were
more than one class - school weights to take into account the actual number of students at 2nd and 5th grade levels
PASEC thematic evaluations are geared towards the comparison between different categories of teachers. Teachers are therefore first chosen, then 15 (12 in the case of Togo) students are evaluated
16 Most PASEC countries tend to have a majority of schools with only one class at 5th or 2nd grade level. This is the case for around 80% of schools surveyed in Chad, Mauritania and Togo, a majority of schools in Mali and Niger, and 26.8% of Guinea schools for 2nd grade, 36.4% of schools for 5th grade. 17 Those schools, on the other hand were excluded from the SACMEQ samples –different characteristics and goals led to that decision-.

61
from their class. As in diagnostic evaluations, if the class is too small, all children from the class will be evaluated – this was chosen in order to avoid the specific pedagogic situation of very small classes-. For example, if one wishes to compare contract and civil servant teachers, one will choose the intended number of contract teachers from the various strata identified for the evaluation, and then will pair up those contract teachers with civil servant teachers working in similar environments (same school or nearby school).
J. Annex II: Original French terminology and English translation or closest equivalents
We have devised a reference table showing the correspondence between the French terminology used in Francophone countries and the English translation or closest equivalent which has been used in this article. We hope this table will help the bilingual reader go more easily from articles in English and in French. Table 71: French and English terminology table
French term English term Instituteur Teacher Instituteur adjoint Assistant teacher Instituteur stagiaire Trainee Moniteur Instructor Instituteur contractuel Contract teacher Instituteur communautaire Community teacher Instituteur volontaire Volunteer teacher Instituteur temporaire Temporary teacher Baccalauréat A’ Level (closest equivalent) Bac 2 (same thing as Baccalauréat) A’ Level (closest equivalent) Bac 1 Senior secondary school diploma (closest equivalent) BEPC / Brevet Junior secondary school diploma (closest equivalent) “Instituteur” could be both the term for the elementary school teachers who have the most favourable contract among civil servants and a generic term for all elementary school teachers. It has been translated, for want of a better word, by “teacher”, which can also be a generic term. In the entire article, however, “Instituteur” referred to the specific category of teachers mentioned above rather than to all teachers.
K. Bibliography: The above tables were created directly from the PASEC and SACMEQ databases, with occasional checking, when possible, from PASEC or SACMEQ articles.
More specific reference is made to:
Balde D., 2006, l’Initiative de l’UNESCO pour la formation des enseignants en Afrique subsaharienne : Note sur la situation des enseignants en Guinée, UNESCO. Béhaghel L., Coustère P., 2000, Manuel pratique d’évaluation, PASEC / CONFEMEN, Dakar. Bernard J.-M., 2006, Gender and primary school achievement in francophone Africa, Analysis based on PASEC data, Report for the Human Development Network, The World Bank Bernard J.-M., Kouak Tiyab B., Vianou K., PASEC / CONFEMEN, 2004, Profils enseignants et qualité de l’éducation primaire en Afrique subsaharienne francophone : Bilan et perspectives de dix années de recherche du PASEC. Blondiaux M., Diallo A., Diallo F. K., Sâa Tinguiano J., 2006, Evaluation des compétences en français et calcul des instituteurs/-trices contractuel/-lles de l’élémentaire (ice) de la 4ème cohorte, régions de Labé et de Mamou, Conakry, Cellule Nationale de Coordination de l’Evaluation des Systèmes Educatifs. Bourdon J., Frölich M., Michaelowa K., 2007, Teacher shortages, teacher contracts, and their impact on education in Africa

62
Chaudhury N., Hammer J., Kremer M., Muralidharan K., Rogers F. H., 2005, Missing in Action: Teacher and Health Worker Absence in Developing Countries, Journal of Economic Perspectives Duthilleul Y., Allen R., 2005, Which Teachers Make a Difference? Implications for Policy Makers in SACMEQ Countries, International Institute for Educational Planning Gachuhi D., UNICEF ESARO Consultant, 1999, The impact of HIV/AIDS on education systems in the Eastern and Southern Africa region and the response of education systems to HIV/AIDS: life skills programmes. Hanushek E. A., 2003, The Failure of Input-Based Schooling Policies, Economic Journal Vol. 113, No. 2, F64-F98 Maga B., Maiga B., Sidibé L., Konaté F., Ba Y., Koita L., Dioman M., Niambélé I., Doucouré S., Cissima M., Samaké B., Doumbia B., Cissé O., Keita B., Coulibaly L., Dembélé A., Traoré D., Ledoux B., Ndem F., Reuge N., Mingat A., Rakotomalala R., 2006, Rapport d’Etat du Système Educatif Malien. Eléments de Diagnostic du Système Educatif Malien « Le besoin d’une Politique Educative Nouvelle pour l’atteinte des objectifs du millénaire et la réduction de la pauvreté » Makwati G., Audinos B., Lairez T., 2003, The role of Statistics in Improving the Quality of Basic Education in Sub-Saharan Africa, ADEA Biennial Meeting, Grande Baie, Mauritius PASEC/CONFEMEN, 2004a, Enseignants contractuels et qualité de l’école fondamentale au Mali : quels enseignements ? __, 2004b, Les enseignants contractuels et la qualité de l’enseignement de base au Niger : quel bilan ? __, 2004c, La formation des enseignants contractuels: étude thématique Guinée 2006. __, 2004d, Recrutement et formation des enseignants du premier degré au Togo : quels enseignements ? PASEC/CONFEMEN, 2006a, La qualité de l’éducation au Tchad, quels espaces et facteurs d’amélioration? __, 2006b, La qualité de l’éducation en Mauritanie: quelles ressources pour quels résultats? Michaelowa, K. 2002. Teacher job satisfaction, student achievement, and the cost of primary education in Francophone sub-Saharan Africa, Hamburg Institute of International Economics HWWA Discussion Paper 188. Michaelowa K., Wechtler A., 2006, The Cost-Effectiveness of Inputs in Primary Education : Insights from the Literature and Recents Student Surveys for Sub-Saharan Africa / Coût-efficacité des intrants de l'enseignement primaire : ce que nous apprend la documentation et des récentes enquêtes sur les étudiants en Afrique sub-saharienne, ADEA Biennial Meeting, Libreville, Gabon, 27-31 March 2006. Mingat A., 2003, Analytical and factual elements for a Quality Policy for Primary Education in Sub-Saharan Africa in the Context of Education For All, ADEA Biennium Meeting, Grande-Baie, Mauritius. Saito M., 2005, The Construction of a “SACMEQ School Resources Index” Using Rasch Scaling, International Institute for Educational Planning Shabalala J., 2005, The SACMEQ II Project in Swaziland: A Study of the Conditions of Schooling and the Quality of Education, SACMEQ Educational Policy Research Series UNESCO Institute of Statistics database, 2007.