what determines firm size? - booth school of...
TRANSCRIPT

What Determines Firm Size?
Krishna B. KumarMarshall School of Business,
University of Southern California
Raghuram G. RajanGraduate School of Business,
University of Chicago & NBER
Luigi Zingales∗
Graduate School of Business,University of Chicago, NBER, & CEPR
First Draft: April, 1999
This Draft: March, 2001.
Abstract
In this paper we examine data on firm size from Europe to shed light on factors correlatedwith firm size. In addition to studying broad patterns, we use the data to ask whether itis sufficient to think of the firm as a black box as some theories of the firm that we label“technological” do, or whether we need to be concerned with features such as asset specificityand the process of control that are the focus of “organizational” theories. At the industrylevel, we find capital-intensive industries, high wage industries, and industries that do a lotof R&D have larger firms. While these results are broadly consistent with both types oftheories, we find that at the country level organizational theories fare better – countries thathave better institutional development, as measured by the efficiency of their judicial system,have larger firms and, once we correct for institutional development, there is little evidencethat richer countries or countries with higher average human capital have larger firms. Thestudy of the effects of interactions between an industry’s characteristics and a country’senvironment on size is perhaps the most novel aspect of this paper, and best allows us todiscriminate between theories. A central result is that as the judicial efficiency improves,the difference in size between firms in physical capital intensive industries and those in lesscapital intensive industries diminishes. Similarly, an improvement in patent protection in acountry is associated with an increase in the size of firms in R&D intensive industries. Thesefindings are consistent with “Critical Resource” theories of the firm.
∗We thank Eugene Fama, Doug Gollin, Ananth Madhavan, John Matsusaka, Andrei Shleifer, and workshopparticipants at Chicago, Copenhagen, Norwegian School of Management-BI, and USC for comments. Kumar ac-knowledges support from the US Department of Education and USC’s CIBEAR. Rajan and Zingales acknowledgefinancial support from the Sloan Foundation (officer grant) and the Stigler Center.
Why is it that a small country like Finland has such large successful firms such as Nokia?
More generally, why is there such a large disparity of firm size across countries and industries?
In this paper we examine cross-country, cross-industry firm size data from Europe through the
lens of theories we label “technological” or “organizational” to shed some light on these and the
following related questions. Is it sufficient to think of the firm as a black-box, as technological
theories typically do, or do we need to be concerned with features such as asset specificity and
the process of control that are at the center of organizational theories? Which regressors will
aid in discriminating between these theories? What broad patterns hold in the data, and where
should we concentrate our future search for determinants?
This issue of firm size is not of minor importance. An interesting aspect of economic growth
is that much of it takes place through the growth in the size of existing organizations. For
instance, in the sample of 43 countries they study, Rajan and Zingales (1998a) find that two-
thirds of the growth in industries over the 1980s comes from the growth in the size of existing
establishments, and only the remaining one-third from the creation of new ones. It is thus useful
to study the potential determinants of the size of economic organizations, and ask if there are
any constraints to size and, hence, any potential constraints to growth.1
We attempt to establish the nature of relationships between likely determinants suggested by
theory and firm size using data on the size distribution of firms across industries in 15 European
countries. This data set is particularly well suited for our purposes because these are all fairly
well-developed countries, so the minimum conditions for the existence of firms such as a basic
respect for property rights, the widespread rule of law, and the educational levels to manage
complex hierarchies exist. A number of first order factors such as war, economic system, or
respect for basic property rights that would otherwise affect firm size are held constant in this
sample. This enables us to focus on more subtle institutional factors for which there is some
variation across this sample of countries. We also have a large number of industries, and the
variation between industries in their use of different factors can give us some understanding of
the effects of production technology on firm size. Most importantly, we are able to study the
interactions between institutional and technological effects suggested by theories that provide
specifics on the mechanism by which size is affected. By examining these interactions we get
1Organizational size seems important for various economic phenomena. For example, the work by Gertler andGilchrist (1994) suggests that small firms account for a disproportionate share of the manufacturing decline thatfollows the tightening of monetary policy. Size has been found to be an important influence on stock returns(see Banz (1981)). Similarly, various phenomena in corporate finance - the extent to which a firm levers up, thequantity of trade credit it uses, the compensation its top managers get, all seem related to firm size. For thelink between firm size and leverage see the extensive literature cited in Harris and Raviv (1990) or Rajan andZingales (1995), for size and trade credit see Petersen and Rajan (1997), and for compensation, see Jensen andMurphy (1990), and the literature cited there.
1
the clearest insights into the possible determinants of firm size.
We start by documenting broad patterns in firm size across industries and countries. At the
industry level, we find physical capital intensive industries, high wage industries, and industries
that do a lot of R&D have larger firms.2 We also find that, on average, firms facing larger
markets are larger. At the country level, the most salient findings are that countries with
efficient judicial systems have larger firms, though, contrary to conventional wisdom, there is
little evidence that richer or higher human capital countries have larger firms. The cross-industry
results are broadly consistent with both types of theories, but at the country level organizational
theories fare better, and the efficiency of the judicial system emerges as a correlate worthy of
further study.
These broad correlations, however, can take us only so far in identifying theories with the
most promising structural determinants of firm size. For this reason, we study the effects
of interactions between an industry’s characteristics and a country’s environment on size, after
correcting for industry and country effects. The analysis of these interactions, which are best able
to discriminate between theories perhaps the most novel aspect of this paper. Organizational
theories, which model the micro mechanisms in greater detail, are more amenable to such tests.
A central finding is that the relative size of firms in capital intensive industries diminishes as
the judicial system becomes more efficient. This is in large measure because the average size of
firms in industries that are not physical asset intensive is larger in countries with better judicial
systems. One way to interpret this finding is that firms in consulting and law, which are based
on intangible assets such as reputations, client relationships, or intellectual property, tend to
be much bigger in countries with a better legal system because a sophisticated legal system is
necessary to protect these assets. By contrast, only a crude legal system is necessary to enforce
the property rights associated with physical capital, so basic physical capital intensive industries
like steel or chemicals will have relatively larger firms in countries with an underdeveloped legal
system. In further support of this argument, we find that R&D intensive industries have larger
firms in countries that have better patent protection, suggesting that the judicial system may
be particularly important in protecting intangible resources, enabling larger firms to emerge in
industries that depend on such resources.
Our evidence suggests that theories emphasizing the fundamental importance of ownership
2Some of these cross-industry correlations are not surprising given the past literature on intra-industry patterns(see Audretsch and Mahmood (1995), Caves and Pugel (1980), Klepper (1996), Sutton (1991), for example). Thereare also a number of cross-industry studies on the determinants of industry concentration (see Schmalensee (1989)for a survey). While we do not believe there is a one-to-one correspondence between concentration and firm size,some of the cross-industry correlations (for example, that between R&D and size) may be viewed as reinforcingthe findings of that literature.
2

of physical assets in determining the boundaries of the firm, and those that suggest mechanisms
other than ownership can expand firm boundaries when the judicial system improves – a class
of theories we refer to as “Critical Resource” theories – are particularly promising frameworks
with which to explore the determinants of firm size. It also appears that further attention can
be more fruitfully focused not on technological variables or institutional variables by themselves,
but on interactions between these variables.
A caveat is in order. There is a large literature on how the forces affecting competition
between firms (see Sutton (1991) for an excellent review) determine the concentration of the
market and, indirectly, firm size. While there may be some overlap between our cross-industry
findings and the vast literature on the cross-industry determinants of concentration, not all
the patterns we establish for firm size can simply be inferred from the literature on concen-
tration. More important, following the spirit of Sutton (1991) our most persuasive results are
on interactions, which are hard to explain using theories of market structure. Nevertheless, we
acknowledge that a focus on firm size ignoring the forces of competition is likely to offer as par-
tial an answer as one deriving from an analysis of competition while ignoring other constraints
internal or institutional constraints on firm size.
With this caveat, the rest of the paper is as follows. In section 1, we provide a candidate
list of determinants of firm size suggested by the theories, and in Section 2 we present the data
and discuss the broad patterns. We report partial correlations of size with industry specific
characteristics (section 3), country specific variables (section 4), and interactions between the
two (section 5) correcting for industry and country characteristics. We discuss the results in
section 6 and conclude with suggestions for future research.
1 Existing Theories
In a companion paper, Kumar, Rajan, and Zingales (2000), we survey in detail the implications
for firm size of theories we broadly classify as technological, organizational, and institutional,
based on whether they focus on the production function, the process of control, or environmental
influences. In this section, we limit ourselves to providing a list of the firm size correlates
suggested by these theories with brief annotations.
1.1 Technological Theories
Since Adam Smith (1776), economists have studied the size of the market as a determinant
of the extent of specialization, and indirectly the size of the firm. Predictions have, however,
been conflicting; for instance, Becker and Murphy (1992) question the conventional wisdom
3
that specialization is limited by the size of the market and argue that coordination costs pose
greater limits. Give this debate, it is important to include market size in our empirical analysis.
Perhaps the most important formulation of the neoclassical theory of firm size is Lucas (1978).
In Lucas’ model per capita capital positively affects firm size. Thus, we expect that greater
capital intensity, proxied by investment per worker or R&D intensity, to be associated with
larger firms.
Human capital is suggested as being positively correlated with firm size by the theories in
Rosen (1982) and Kremer (1993). We thus consider cross-country measures of human capital
and cross-industry measures of wage per worker, a variable closely related to human capital, as
regressors in our study.
1.2 Organizational Theories
In ‘Contracting Cost’ theories (see, for example, Alchian and Demsetz (1972) and Jensen and
Meckling (1976)), the contracts in a firm are no different from contracts in the market place,
and thus these theories are silent on whether improvements in contractibility have any effect
on the size of firms. Factors that typically determine the extent of integration in ‘Transaction
Cost’ theories (see Klein, Crawford and Alchian 1978) and Williamson (1975, 1985)), such as
asset specificity and informational asymmetry, are hard to proxy for even with detailed data,
let alone in a relatively macro-level study such as ours. Therefore, we primarily rely on a third
set of theories collectively described as “Critical Resource” theories of the firm (see Grossman
and Hart (1986) for the seminal work in this area and Hart (1995) for an excellent survey of the
early literature), which are more amenable to empirical analysis.
These theories point to a variety of non-contractual mechanisms that attach a critical re-
source, valuable to the production process, to an agent. Control over the critical resource gives
the agent power. By structuring the non-contractual mechanisms appropriately, power can be
configured so as to maximize surplus. For example, the Property Rights approach (see Gross-
man and Hart (1986), Hart and Moore (1990)) emphasizes physical assets as the primary critical
resource, and ownership as the mechanism that attaches this resource to the right agent. These
theories suggest that the quantity of physical assets over which ownership can be exerted, as well
as the efficiency with which the judicial system enforces ownership rights are positive influences
on firm size.3
More recent developments of this theory (see Rajan and Zingales (forthcoming), as well as
3Of course, an improvement in judicial efficiency will also enhance contractibility in general. If every aspectof a relationship becomes perfectly contractible, then there is no room for authority and the optimal size of firmsbecomes indeterminate. In practice, we are unlikely to find ourselves in this situation.
4

Baker, Gibbons, and Murphy (1997), Holmstrom (1999), and Holmstrom and Roberts (1998) for
example) emphasize that the critical resource can be different from an alienable physical asset,
and mechanisms other than ownership, which work by fostering complementarities between
agents, and between agents and the critical resource, can be sources of power within the firm.
Rajan and Zingales (forthcoming) analyze a model where an entrepreneur’s property rights to
the critical resource are allowed to vary. This model has the implication that as long as the
government respects property rights broadly, physical assets are hard to make away with and
thus physical capital intensive firms will typically be larger. But as legal institutions improve,
other forms of protection become available to the entrepreneur – patent rights protect her
intellectual property, while non-compete clauses restrain employees from departing. Thus firms
that rely on other forms of critical resources, such as brand names, intellectual property, or
innovative processes, should become larger as the legal environment improves. This implication
forms the cornerstone of our analysis of interactions involving judicial efficiency and capital
intensity.
1.3 Institutional Explanations
There are many channels through which institutions can affect firm size beyond what is pre-
dicted by the technological and organizational theories. We group these channels into two main
categories: regulatory and financial.
On the regulatory side, barriers to entry could be important in determining average firm
size. However, theories such as Hopenhayn (1992), conclude the effect of entry costs on size
is ambiguous. Whether increased barriers to entry increases or decreases average firm size is
therefore an empirical question to seek to address within the confines of our data.
If the availability of external funds is important for firms to grow, firm size should be
positively correlated with financial development and, more generally, with factors promoting
the development of financial markets. La Porta, Lopez-De-Silanes, Shleifer, and Vishny (1997a)
find that a country with a Common Law judicial system, and having strict enforcement of the
law, has a more developed financial system. This would suggest that there is an additional,
indirect, channel through which sound laws and judicial efficiency affect firm size - through
their effect on financial market development.
Rajan and Zingales (1998a), however, find that financial development affects growth in both
the average size of existing establishments and in the number of new establishments in industries
dependent on external finance (though disproportionately the former). With the development of
financial markets, more firms will be born, reducing the average size of firms; however, existing
5
firms will be able to grow faster, increasing the average size of firms. Whether the average size
of firms in industries that rely on external finance is larger, thus, is ultimately an empirical
question, which we will try to resolve.
We have attempted in the preceding paragraphs to describe some important technical, legal,
and institutional influences on firm size. Most of these effects are country specific. Given the
large number of possible effects and the limited number of countries we have data for, we will
not attempt to capture them all, but will typically control for them by inserting country fixed
effects.
1.4 Existing Empirical Literature
1.4.1 Market Structure
Much of the evidence we already have comes indirectly from the vast literature on market
structure. Most of the early cross-industry work appealed to the structure-conduct-performance
paradigm of Bain (1956). However, this literature came under criticism, especially after the
extensive work on game theory in the 1980s, when it became clear that the theoretical predictions
were much more nuanced than allowed for in the empirical work. As a result, much work since
has been within-industry because it is easier to map the underlying characteristics of specific
industries to particular theoretical models.4
However, more recently Sutton (1991) has argued that “too rigid adherence to such a view
runs the risk of abandoning a central part of the traditional agenda of the subject, which concerns
the investigation of regularities of behavior that hold across the general run of industries”.
Instead, he argues for investigating robust predictions that are likely to hold across a class of
models. In particular, he argues when up front sunk costs are exogenous, and the degree of price
competition is fixed, a robust prediction is that the size of the market and the concentration
of the market should be negatively related. Intuitively, the larger the market, the greater the
ability to amortize fixed costs, and the greater the amount of entry.
The results on concentration (e.g., see the early work by Pashigian (1968)and Stigler (1968))
do not, however, map one to one onto results on firm size. Bresnahan and Reiss (1991) argue
that price competition does not change much with entry. If so, the number of firms should
expand linearly with the market, and there should be no predicted relationship between market
size and firm size. By contrast, other theories of firm size predict a positive relationship between
the size of the market and the size of firms, and the evidence, we will see, is consistent with this
4Though see Caves and Pugel (1980), Audretsch and Mahmood (1995), and Mata (1996)
6
prediction.5
Because our focus is on technological, managerial, and institutional determinants of firm
size and not on competition within a market for a specific product, we can afford to examine
industries defined fairly broadly so long as the underlying technological characteristics of firms
within each broad industry group are strongly correlated. To this extent, we also reduce the
importance of a particular product’s market structure for our findings. And by emphasizing
interaction effects that are unlikely to come from theories of competition, we hope to establish
the independent validity of our focus. Of course, ultimately, theory should address both the
determinants of firm size arising from external competition, and those arising from factors like
the capabilities of the firms themselves (see Penrose (1959)). Pending such a theory, a focus on
either the competitive forces determining market structure or on the technological, managerial
or institutional forces determining firm size, can only be partial, however careful the empirical
work.
1.4.2 Institutional differences and firm size.
There have been very few cross-country studies focusing on the effects of institutional differences
on firm size. Davis and Henrekson (1997) find that the institutional structure in Sweden forces
a tilt (relative to the US) towards industries that are dominated by large firms. Their interest,
however, is in the relative distribution of employment across sectors, not in the determinants
of firm size per se. La Porta, Lopez-De-Silanes, Shleifer, and Vishny (1997b) find a positive
correlation between an indicator of the level of trust prevailing in a country and the share of
GDP represented by large organizations (defined as the 20 largest publicly traded corporations
by sales). Their focus, however, is on the relative importance of large organizations, while our
focus is on the determinants of the absolute size of organizations.
2 The Data
In 1988, Directorate-General XXIII of the European Commission and Eurostat launched a
project to improve the collection and compilation of statistics on small and medium enterprises.
This project led to the publication of Enterprises in Europe by the European Commission
in 1994. This data set contains statistics on enterprises, employment, and production for all
5It is possible to reconcile the positive relationship between market size and firm size if one assumes thatfirms compete more fiercely when there are more of them (see Campbell and Hopenhayn (1999)). But this thensuggests the theory is indeterminate unless we fully understand what drives price competition.
7
economic sectors (except agriculture) in the European Union (EU) and the European Free Trade
Agreement (EFTA) countries.
One of the explicit purposes of this effort was to assemble “comparable and reliable statistics
which make it possible to identify the relative importance of different categories of enterprises.”
(Enterprises in Europe, Third Report, v.I, p. xxii). In spite of the effort to homogenize the
statistical criteria Eurostat warns that several methodological differences in the classification
and coverage of units remain. Thus, the cross-country analysis should be interpreted with more
caution, while the cross-sector analysis or interactions, which control for country fixed-effects,
are less sensitive to this problem. With all its limitations this is the first source we know of that
provides comparable data on firm size across countries.
Enterprises in Europe provides us with the size distribution of firms (number of employees) in
each NACE two-digit industry (we use “industry” interchangeably with “sector”).6 We exclude
from the analysis Iceland, Luxembourg, and Liechtenstein because of their extremely small
size. We also drop Ireland, because data are not consistently reported. This leaves us with 15
countries. For all these countries, data are available for either 1991 or 1992. Further details on
the data are presented in the data appendix.
We have data on how many firms and employees belong to each firm size bin (e.g., there
are 30,065 employees and 109 firms in the bin containing 200-499 employees in “Electricity” in
Germany).7
2.1 The Theoretical Unit of Interest and the Empirical Unit.
Technological theories focus on the allocation of productive inputs across various activities and
the effect this has on the size of the production process, rather than on the ways in which
hierarchical control is exerted. The length of the production process is thus the theoretical size
of the firm. These theories would not, for example, make much of a distinction between Toyota
and its supplier network, and General Motors (a much more vertically integrated firm) and its
supplier network, since both feed into broadly similar production processes.
Organizational theories, on the other hand, focus on how hierarchical control is exerted. The
Property Rights view asserts that control exerted through an arm’s length contract (General
Motors over its suppliers) is not the same thing as control exerted through ownership (General
Motors over its divisions). According to this view, the economic definition of a firm corresponds
to the legal view – a firm is a set of commonly owned assets. More recent developments
6NACE is the general industrial classification of economic activities within the EU. Two-digit NACE industryroughly corresponds to two-digit SIC sectors.
7We use the terms “bin” and “size class” interchangeably.
8
(see Rajan and Zingales (1998b, forthcoming), for example) go further and suggest that if the
economic distinction between transactions that are firm-like and market-like turns on whether
hierarchical, non-contractual, control is exerted, common ownership is neither necessary nor
sufficient to define the economic limits of a firm. Toyota may exert much more control over
its suppliers who are tied to it by a long history of specific investment than General Motors,
which puts supply contracts up for widespread competitive bidding. Toyota and its suppliers,
although distinct legal entities, could thus be thought of as a firm in the economic sense, while
General Motors and its suppliers are distinct economic and legal entities. Thus, in general, the
firm described by the theories does not correspond to the legal entity.
However, data are available only for the legal entity. The unit of analysis is the enterprise,
defined as “the smallest combination of legal units that is an organizational unit producing goods
or services, which benefits from a certain degree of autonomy in decision-making, especially for
the allocation of its current resources. An enterprise carries out one or more activity at one or
more location” (Enterprises in Europe, Third Report, v.II, p. 5).
The emphasis on the “smallest combination of legal units” is important. Conversations with
Eurostat managers indicates that subsidiaries of conglomerates are treated as firms in their own
right, as are subsidiaries of multinationals.8 Some subjectivity, however, is introduced because
Eurostat looks also for autonomy in decision making in drawing the boundary of the enterprise.
To this extent, the enterprise corresponds to the economic entity discussed above – the economic
realm over which centralized control is exercised.
The definition used for the enterprise is, therefore, a combination of the “legal”, and what
we call the “economic”, firm. To make some headway, we have to assume that it is also a good
proxy for the length of the production process. All we really need is the plausible assumption
that factors that permit a longer chain of production should also increase the average size of
the autonomous legal entity called the firm.
2.2 What Do We Mean by Average Size?
Should we measure the size of a firm in terms of its output, its value added, or the number
of its employees? Value added is clearly preferable to output, because the complexity of the
organization has to do with the value of its contribution not with the value of the output sold.
Enterprises in Europe reports that value added per employee is fairly stable across different
size-classes, which implies a measure of firm size based on the number of employees is likely
8Foreign subsidiaries of a multinational with headquarters in a particular country do not, therefore, add tothe enterprise’s size in the country of the parent.
9
to be very similar to one based on value added. Yet, coordination costs, which are present
both in the technological and the organizational theories of the firms, are in terms of number
of employees, not their productivity. This argues for a measure based on number of employees,
which is what we use in the rest of the paper. Such a measure has a long intellectual tradition
(e.g., Pashighian (1968)).
What is the most appropriate measure of average firm size for our data? The simple, or firm
weighted, average, obtained by dividing the total employment in the country-sector combination
by the total number of firms in that combination, is inappropriate for two reasons. First, it
ignores the richness of the data on the distribution of firm size. Second, it could give us a
number that has little bearing on the size of the firm that has the greatest share in the sector’s
production. For instance, in the automobile sector in Spain, 78% of the employees work for
29 firms which employ 38,302 employees. There are, however, 1,302 self-employed people, who
account for an equal number of firms. Taken together with the intermediate categories, the
simplest measure would suggest that the average firm has only 570 employees.
Davis and Henrekson (1997) suggest the coworker mean as a measure of size to emphasize
the number of employees at the average worker’s place of employment. It is the size-weighted
mean of employer size; by squaring the number of employees in each firm, this measure clearly
emphasizes the larger firms. We adapt this measure to our data, which are available only at
the level of firm size bins, and compute a weighted average size as follows. The average firm
size in each size bin is first calculated by dividing the number of employees by the number of
firms. The average size for the entire sector is then calculated as the weighted sum of these bin
averages, using as weights the proportion of the total sectoral employment in that bin. This
produces a “employee-weighted” average of firm size.
Employee Weighted Average Number of Employees =n∑
bin=1
(NEmpbin
NEmpSector
)(NEmpbin
NFirmsbin
)
where NEmpbin is the total number of employees in a bin, NEmp
Sector is the total number of employees
in the sector, and NFirmsbin is the total number of firms in a bin. In contrast to the firm-weighted
simple average, the employee-weighted average emphasizes the larger firms; note the squaring
of bin employment in the numerator. In the above example of automobile manufacture in Spain
this measure gives an average firm size of 3,002 employees.9
9In addition to focusing on firms that carry out the bulk of the economic activity in a sector, this measureis also more likely to capture firms at or near their optimal scale. The theories we have described suggest thedeterminants of the optimal scale of firms. Likewise, the measure mitigates the problem of not knowing firm entryand exit details in our cross-sectional data. When there is entry and exit, firms grow substantially when young, and
10
For the remainder of this paper when we refer to firm size without qualification, we mean
the employee-weighted average (or the log of the employee-weighted average in the regressions).
2.3 Cross-Industry Patterns in Firm Size
In Table 1A, we present summary statistics on different measures of size by industry; the average
is computed across all countries reporting data for a given industry. There are 55 sectors on
which we have data, though from the last column indicating the frequency of countries reporting,
we can see that coverage across countries is not uniform.
The simple average and the employee weighted average can present a very different picture.
For example, “Air Transport” has the third largest firms by the latter measure with an average
of 6,335 employees, but has only the twelfth largest firms with an average of 135 employees
by the former measure. This is because most employees belong to a few large airlines (hence
the higher employee weighted average), but there are also many tiny firms in the air transport
industry providing ancillary services (hence the low simple average). In what follows, we focus
on employee weighted measures.
The largest sectors, by far, are “Communication”, “Railways”, “Air transport”, and “Elec-
tricity”. The sizes of the largest firms in these sectors are also significantly higher than those for
the other sectors. Given the typically high degree of Government ownership and intervention
in these sectors, we label them collectively “Utilities” (although they do not correspond exactly
to what are called utilities in the United States). We present country level statistics with and
without them in Table 2.
The smallest sectors are “Letting of real estate”, “Scrap and waste”, “Personal services”,
“Repair of consumer goods”, and “Renting, leasing”. Based on this, it is incorrect to conclude
that firms in the service sector are small. Firms in financial services like Banking or Insurance
are about the same size as firms in Motor Vehicles, the manufacturing sector with the largest
firms.
The sixth column of Table 1A presents the mean of residuals across countries from the
there is inter-industry variation in these rates of growth (see Caves (1998) and Pakes and Ericson (forthcoming)).Despite this problem, since we have countries at relatively similar stages of development, industries should be atsimilar stages of the product life cycle across countries (see Klepper (1996) for a formalization of the effects of thePLC). Hence, the cross-country and interaction effects should indeed reflect the effects of institutional differenceson average size. More important, Sutton (1997, p52) argues that most entry and exit has relatively little effecton the largest firms in the industry (which are likely to have achieved the optimal scale).
We do not fully succeed in emphasizing the largest firms since we do not have the distribution of size withinbins, especially the largest. So, for instance, if much of the employment in an industry is concentrated in a singlelarge firm, but there are 15 smaller firms in the largest bin, our calculated employee weighted average would tendto understate the true employee weighted average.
11
regression:
log (Employee weighted average sizec,s) = cons+ αc · dc + εc,s
where, dc is a vector of country dummies. The aim is to study the employee weighted average
size when the country effects are purged. A comparison of the ranking of sectors purged of
country effects with the ranking of the sectors based on the original average gives us an idea of
the importance of country effects. Spearman’s rank correlation coefficient between the average
with and without country effect is 0.86 when all sectors are included, and 0.95 when the utility
sectors are dropped. The ranking of the largest 4 sectors (which include the utility sectors) is
preserved across both means. These coefficients indicate that while there may well be country
effects, they are likely to be overshadowed by sectoral effects.
Indeed, a two-way analysis of variance of the employee weighted average size on country and
sector shows that close to 63% of the total variation in size comes from sectoral effects while
about 2.5% comes from country effects. The corresponding numbers when the simple average
is used are 26% and 1.4%.
In Table 1B, we present the dispersion in firm size in the various sectors. The formulas
used in computing this and other statistics are given in the appendix. The weighted coefficient
of variation of firm size within a sector (the employee weighted standard deviation across bins
divided by the employee weighted mean averaged for that sector across countries) is likely to be
small if the industry is concentrated (so that most of the employment is in a few large firms)
or if there is a well-defined optimal scale of operations (so that most firms cluster around that
scale). It is highest for the service industries such as “Personal Services”, “Agents”, “Hotels
and Catering”, “Repair of Consumer Goods” while it is lowest for “Extraction of Solid Fuels”,
“Communications”, and “Nuclear Fuels”. Capital intensive industries seem to be less dispersed,
though it is hard to tell which of the above forces is responsible. Finally, the employee weighted
skewness is typically negative (39 of 55 sectors negative).
2.4 Cross-Country Patterns in Firm Size
In Table 2, we present summary statistics on average size by country. Table 2A has data for all
the sectors, while Table 2B for different subsamples. The broadest coverage is for Italy and the
sparsest coverage for Austria and Denmark. In this table, the mean for a country is simply the
ratio of total number of employees to total number of firms.
Greece, Portugal, and Austria have firms with the smallest employee weighted average size,
though correcting for industry effects (column VI), Norway’s firms are also relatively small.
The UK and Italy have firms with the highest average size, in fact, substantially higher than
12
the remaining countries. Since Italy is reputed to have many small firms, it might come as a
surprise that it has the second highest average size. As we will see, this is partly because of the
composition of industries in Italy.10
The second to last column presents the mean of residuals across countries from the regression:
log (Employee weighted average sizec,s) = cons+ βs · ds + εc,s
where, ds is a vector of sector dummies. The aim is to study the employee weighted size in
a country when the sector effects are purged. Spearman’s rank correlation coefficient between
the means with and without sector effects is 0.45, significantly lower than the figures presented
above for the sector tables. The ranking is preserved only for UK. Interestingly, Finland which
is ranked sixth in average size falls only marginally to seventh after purging industry effects.
Thus Finland’s large firms are not simply because of industry effects.
As mentioned earlier, the utilities sectors need to be treated differently. The first column in
Table 2B presents the mean for the country distributions when the utilities sectors are excluded.
The mean drops for several countries, with the drop for Italy being the most dramatic (2244
to 545). Spearman’s rank correlation coefficient between the means with and without utilities
is 0.78. UK, Germany, and France now have the highest averages, while Greece, Portugal, and
Austria continue to have the smallest averages (they do not have coverage for utilities in the
first place and are therefore unaffected by the exclusion).
Since manufacturing excludes utilities, the means for manufacturing sectors alone are very
similar to those when utilities are excluded. In fact, the Spearman coefficient between the means
without utilities and for manufacturing alone is 0.89.
It is hard to discern any obvious patterns in Table 2B. A rich country like Switzerland has
firms of very small average size, while small countries like Denmark have large firms. Remark-
ably, UK has the largest firms according to almost any classification considered. While we
cannot rule out differences in the definition of firms in the United Kingdom, no other country
preserves its rank so consistently.
Finally, Table 2C indicates that Italy, Spain and Portugal have the highest employee weighted
coefficient of variation for firm size. Austria, Belgium, and the United Kingdom have relatively
low dispersion of firm size.
10When we look at the total number of firms in the country, Italy has by far the most firms. One must becareful, though, because the number of sectors reported differ by country. This might explain the relatively lownumber of firms in Austria and Denmark. The anomalous observation is Greece, which reports a sizeable numberof sectors, but appears to have very few firms. The reason is that only enterprises with more than 10 employeesare reported in Greece. While this biases the average size upwards, our employee-weighted average minimizes theeffect. Nevertheless, we will check that none of our results depend on this.
13
2.5 Other Summary Statistics
We present in Table 3 the summary statistics of the explanatory variables used in the subsequent
analysis as well as their cross-correlations. Two variables that we will focus attention on are
an index of the efficiency of the judicial system, henceforth termed “judicial efficiency”, and an
index of patent rights termed “patent protection”.
Judicial efficiency is an assessment of the “efficiency and integrity of the legal environment as
it affects business, particularly foreign firms”. It is produced by the country risk rating agency
Business International Corp. We use the measure to capture the degree to which the rights of
contractual parties are protected by the courts. Because it emphasizes foreign firms, we believe
it also reflects the ease of access to the judicial system by all parties, not just insiders. We have
the average between 1980 and 1983 on a scale from zero to 10 with with lower scores reflecting
lower efficiency levels.
Patent protection is from Ginarte and Park (1997). They compute an index for 110 countries
using a coding scheme applied to national patent laws. The five aspects of patent laws exam-
ined were (1) the extent of coverage, (2) membership in international patent agreements, (3)
provisions for loss of protection, (4) enforcement mechanisms, and (5) duration of protection.
Each of these categories was scored on a scale of 0 to 1, and the sum was the value of the index
of patent protection, with higher values indicating greater protection. We use value of the index
computed in 1985. The definitions of all these variables are contained in the Data Appendix.
Two facts are worth pointing out. First, despite the homogeneity of the sample (all the
countries are European and would be classified as developed), there is enough variation in most
of the explanatory variables. For example, per capita income varies between $6,783 (Greece) and
$16,245 (Switzerland) and the measure for human capital varies between 3.8 years (Portugal)
and 10.4 (Norway). Likewise, judicial efficiency, an important variable in our analysis, ranges
from 5.5 to 10.
The second fact is that some of these measures are highly correlated. For example, judicial
efficiency has a correlation of 0.9 with human capital. This can make it difficult to separate the
effect of the two.
3 Cross-Industry Correlations
As mentioned earlier, the empirical results involving interactions between industry-level and
country-level variables are the most important and novel aspect of our study. However, we
briefly present our analysis of the correlation between firm size and each of these sets of variables
14
first, to see what they reveal about each type of theory and to identify the broad correlations
that hold in data.
3.1 Proxies
As a proxy for the size of the actual market we use the log of total employment in the industry
in that country.11 There are two problems with this measure. First, theories (e.g., Smith
(1776)) obviously refer to the potential market. Second, and following from the first, there
may be spurious correlation between average firm size and our measure of the market size. For
example, in the case of monopolies, there will be a one-to-one correspondence between average
firm size and our proxy for the size of the market. To correct for this, we instrument our measure
of market size with the logarithm of GDP, the country population, and the ratio of exports to
GDP (1960-85 average). These country level variables should be uncorrelated with industry
level constraints, but should be correlated with the size of the potential market, hence they
should be good instruments.
While we do not have a direct measure of capital stock in an industry to enable us to
calculate physical capital intensity, we have the gross investment in an industry. Dividing this
by the number of workers in that industry, we have investment per worker. In order to obtain
a more exogenous measure, we take the mean of this variable across all the countries for which
we have this data.12
To measure an industry’s dependence on intangible capital, we use the R&D done in that
industry as a share of the country’s total R&D. Unlike physical capital, we do not compute per
worker intensity of R&D because R&D is a nonrival input that impacts the whole firm.13 The
R&D data is from OECD’s ANBERD database, with appropriate conversion done from ISIC to
NACE. Again, the mean across all countries is used.
Finally, Rajan and Zingales (1998a) compute an industry’s dependence on external funds as
the fraction of capital expenditure in that industry in the United States funded from external
sources. We use the Rajan and Zingales measure of external dependence and weight it by the
investment per worker in an industry to get the amount per worker that has to be raised from
external sources.
The maintained assumption in using these proxies is that there are technological character-
11Whenever we require the logarithm of a variable, we always add one before taking logs.12This includes the United States. Dropping the United States in the calculation does not change the results
qualitatively. Neither does taking medians. All industry variables are winsorized at the 5% and 95% levels toreduce the effects of outliers.
13The intensity with respect to sales, rather than to employees, is an alternate measure, but given the paucityof sales data we chose the sectoral R&D share.
15
istics of certain industries that carry over countries.14 In other words, if Drugs and Pharma-
ceuticals is more research intensive in the United States than Leather goods, it will continue to
be so in Italy. While this assumption allows us to use independent variables that are likely to
be more exogenous, and also overcome the paucity of data, a failure of this assumption means,
of course, that some of our independent variables are noise and should have little explanatory
power.
3.2 Results
We report in Table 4, the estimates from a regression of log employee weighted average firm size
on industry characteristics, when the size of the market (measured as total sectoral employment)
is instrumented. The partial correlation of market size with firm size is positive and highly
statistically significant (henceforth, “significant” will denote significance at the 10% level or
better). An increase in log employment in the industry from the twenty fifth percentile to
the seventy fifth percentile is associated with an increase in firm size by about 35% of the
inter-quartile range.
We also include investment per worker, R&D intensity, wages per worker, and amount
financed externally per worker. The first three explanatory variables are positively and signifi-
cantly correlated with size, while the amount financed externally is negatively correlated, but is
not statistically significant. While we expected investment, wages, and R&D expenditure to be
positively correlated, we had no strong prior on the sign of the correlation between the amount
financed externally and size.
The magnitudes of the effects are also considerable. According to the estimates in column
I, an increase in investment per worker, R&D intensity, and wage per worker from the 25th
percentile to the 75th percentile of the variable are associated with an increase in log firm size
of 22%, 13%, and 38% of its inter-quartile range respectively. The explanatory power of the
regression is also considerable (R2 = 0.40).
These significant correlations are robust to the inclusion of country fixed effects (which
necessitates dropping country level instruments), and including the explanatory variables one
at a time. These robustness results have been omitted from the paper in the interest of brevity,
and to focus attention on the section on interactions. These and other omitted results can be
obtained from the authors on request.
Which theories are these correlations consistent with? If industries are located in specific
14This is also the assumption made in Rajan and Zingales (1998a). Since we are primarily interested in thesign of coefficients, what we really require is that the relative relationship between industries carry over ratherthan the precise levels.
16

areas and there is a high cost to labor mobility, or if agents have industry specific human capital,
then the Lucas (1978) model could be applied industry by industry in a country. The positive
partial correlation between investment per worker and size is consistent with Lucas. It is also
consistent with Critical Resource theories of the firm where a firm of larger size is easier to
control when the critical resource is physical capital.
Lucas does not distinguish between investment in physical capital and investment in R&D.
Thus we should expect a positive correlation between size and R&D expenditure. Similarly,
from the perspective of Critical Resource theories, if the critical resource is intellectual property
and it is protected to some extent by patent laws, we should expect such a correlation.
The positive correlation between wages per worker and size is consistent with the thrust
of Lucas’s (1978) notion that the incentive to become an entrepreneur is relatively small when
wages are high. It is also consistent with Rosen’s view that large firms have better managers
who are paid more, or Kremer’s (1993) view that if wages are a proxy for the quality of a worker,
higher wages should be associated with larger firms. Of course, there is an extensive literature
suggesting that large firms pay more within an industry, so the direction of causality here is
indeterminate.
Finally, the insignificant correlation between the amount financed externally and size sug-
gests the adverse effects on average size of financial constraints on the growth of existing firms
may offset the positive effects on average size of reduced entry by new firms in financially
dependent industries.
Before we conclude this section, we should point out that we are not the first to find some
of these patterns. For example, Caves and Pugel (1980) find that size is correlated with capital
intensity within industry, while the relationship between firm size and total firm R&D investment
within an industry is well known (see Cohen and Klepper (1996) for references). However, our
finding is across industries and countries and, therefore, we establish the greater generality of
these patterns.
In summary, the partial correlations are consistent with multiple theories and do not provide
enough room to discriminate between technological and organizational theories. Nevertheless,
the correlations are not irrelevant in that they provide a minimum set of patterns that theories
should fit.
4 Cross-country correlations
Let us now examine the partial correlations of country level variables with firm size.
17
4.1 Results
The first variable we include in the regression is the log of per capita income. This can be
interpreted as a proxy for per capita capital (as in Lucas (1978)) or, more generally, as a
measure of a country’s wealth. As a measure of human capital, which is suggested by the
technological theories, we use the average years of schooling in the population over age 25. This
comes from the Barro-Lee database and is measured in the year 1985.
In Table 5, column I, we present partial correlations of size with the cross-country explana-
tory variables. We include industry fixed effects and the size of the market, which is instrumented
by the log of GDP and the ratio of exports to GDP.15 Other than market size, the only variable
with a positive and highly significant coefficient is the efficiency of the judicial system. An
increase in judicial efficiency from the 25th percentile to the 75th percentile is associated with
an increase in log firm size by 50% of its inter-quartile range. The coefficient on log per capita
income is significant but negative. However, when included alone (column II), the coefficient on
per capita income is positive, while when human capital is included (column III), the coefficient
on human capital is positive and significant, while the coefficient on per capita income turns
negative.
We also inserted a number of other variables in our specification, one at a time, in place
of judicial efficiency in the specification in column I. We include Ginarte and Park (1997)’s
index of the protection given to patent rights in different countries, the quality of accounting
standards which Rajan and Zingales (1998a) argue is a good proxy for the extent of financial
sector development in a country, as also proxies for regulatory constraints and a measure of
product liability. It turns out that none of these variables remains significant when judicial
efficiency is included (though accounting standards comes in positive and significant when on
its own). The coefficient estimate for judicial efficiency, however, always remains positive and
highly statistically significant, and that for log per capita income is negative.
The “stylized fact” that richer countries have larger firms seems true only when we examine
the obvious difference between the size of firms in really poor countries where there is little
industry to speak of, and those in the rich developed countries, and when we do not correct for
differences in institutions.16 Within the set of industrialized countries, however, there seems to
be little evidence of a significant positive partial correlation between per capita GDP and size,
15Since we use log per capita GDP as an explanatory variable, of the three instruments used earlier, log GDP,log population, and ratio of export over GDP, we can use only two otherwise they would be perfectly collinearwith log per capita GDP.
16See Gollin (1998) for an example of a study that focuses on economic development and firm formation.
18
or human capital and size.17
The large positive correlation of firm size with judicial efficiency is consistent with Critical
Resource theories, legal and financial theories, and co-ordination cost theories of the firm: An
efficient legal system eases management’s ability to use critical resources other than physical
assets as sources of power. This leads to the establishment of firms of larger size (see Rajan
and Zingales (forthcoming)). It also protects outside investors better and allows larger firms
to be financed (see La Porta et al. (1997a,1998)). Finally, an efficient legal system reduces
co-ordination costs and allows larger organizations (Becker and Murphy (1992)).
This cross-country analysis should be interpreted with caution because it is most sensitive
to differences in the definition of enterprise across countries. Moreover, some of the explanatory
variables are strongly correlated. For example, judicial efficiency has a correlation of 0.90 with
our measure of human capital, 0.65 with accounting standards, and 0.52 with patent protection.
This is a traditional problem with cross-country regressions - all measures of institutional and
human capital development are typically highly correlated, so it is hard to tell their effects
apart; this is one of the reasons to study interactions as we do next. Nevertheless, two results
seem to emerge. First, the correlation between per-capita income and firm size is not as clear as
previously thought and may, in fact, be a proxy for institutional development. In general, the
cross-country results provide only minimal support to technological theories. Second, judicial
efficiency seems to have the most clear cut correlation with firm size and deserves more detailed
study.
5 Interactions
Cross-country regressions could be biased by differences in the definition of the enterprise as
well as effectively have fewer degrees of freedom. Hence, it is hard to estimate anything with
accuracy, and know whether something is really a proxy for what it purports to be. One way to
reduce both these problems is to test predictions that rely on an interaction between country
and industry characteristics, after controlling for both country and industry effects. By doing
so, we not only use more of the information in the data, but also test a more detailed implication
of the theory, which helps distinguish theories that have the same prediction for direct or level
17One could argue that our dependent variable is a proxy for labor intensity, and high per capita incomecountries could be substituting cheap capital for labor. This would yield a negative correlation between size andper capita income. To check that this is not driving our result, we would need data on sales. Unfortunately, dataon sales present in Enterprises in Europe are sporadic. Nevertheless, we experimented with the limited sampleavailable. Even with sales weighted average sales as dependent variable, the coefficient estimate for per capitaincome is never significantly positive.
19
effects. Organizational theories, which model the micro mechanisms in greater detail, are more
amenable to such tests.
5.1 Predictions and Proxies
As we have seen, greater judicial efficiency is correlated with bigger firms. In all the countries
in our sample, basic property rights over physical assets are protected, and guarantee owners
a certain degree of power. However, the increased protection afforded to intellectual property,
management techniques, firm-client relationships, etc., by a more efficient judicial system should
allow more resources (even inalienable ones) to come into their own as sources of power. There-
fore, according to Critical Resource theory, we should expect judicial efficiency to particularly
enhance management’s control rights for firms with relatively few physical assets resulting in
larger firms in such industries. This will imply the interaction between judicial efficiency and
investment per worker (a proxy for physical asset intensity) should be negatively correlated with
size. Note that this is not a direct implication of theories like Lucas (1978), which emphasize
the rents created for workers by physical capital but not its control properties, or Becker and
Murphy (1992), which, refers to the co-ordination benefits of a better judicial system without
emphasizing specific channels through which it works.
5.2 Results
One of the advantages of looking at interaction effects is that we can include both country and
industry indicators to absorb all the direct effects. Thus we do not need to worry about which
country or industry variables to include. The problem, however, is that we cannot instrument
the size of the market because the instruments are collinear with the country indicators. This
is why we will try specifications both with and without country indicators.
In Table 6, we report estimates for the coefficient of the interaction variable (included along
with market size, country indicators, and industry indicators). Capital intensive industries have
relatively smaller firms in countries with better judicial systems. In column I, an increase in
judicial efficiency from its 25th percentile to its 75th percentile is associated with a decrease in
the difference in log average size between firms in industries at the 75th percentile of capital
intensity and firms in industries at the 25th percentile of capital intensity of approximately 12%
of the inter quartile range of log size. Put differently, in countries with a better legal system, the
evidence indicates that the difference in size between automobile manufacturers and consulting
firms is smaller.
The negative correlation between the judicial efficiency-capital intensity interaction and firm
20

size is consistent with Critical Resource theories of the firm. While Becker and Murphy (1992)
do not discuss the precise channels through which increases in legal efficiency will increase
the size of firms, the evidence is broadly consistent with their theory also. The importance
of the interaction effect is in giving us greater assurance that the main effects (such as the
effect of capital intensity or judicial efficiency on firm size) are correlated, at least in part, for
the particular theoretical reasons we attribute to them. Perhaps a greater reason to focus on
interaction effects is their value in distinguishing otherwise hard-to-disentangle level effects.18
Recall that both physical investment per worker and R&D intensity were positively corre-
lated with firm size. Critical Resource theory, however, predicts different interaction effects.
The theory would suggest that R&D intensive firms, that rely more on intangible assets, should
benefit much more from protections offered by the law. So R&D intensive firms should be larger
in countries with better patent protection. In column II, we include the interaction between
R&D and patent protection. The interaction effect is positive, suggesting that firms in R&D
intensive industries are larger in countries with better patent protection, but it is significant at
only the 20th percent level.
The problem with including country indicators is that we cannot instrument for the size of
the market, and we know there may be significant biases in including it directly. So in column
III, we drop country indicators but include instruments, as also the level of judicial efficiency and
the level of patent protection. The interaction between judicial efficiency and capital intensity is
again negative and statistically significant, while the direct effect of judicial efficiency is positive
and significant. The interaction between patent protection and R&D intensity is again positive,
but now statistically significant. Interestingly, the direct correlation between firm size and
patent protection is now negative. This correlation was obscured in earlier specifications.
While the interaction effects seem consistent with Critical Resource theory the direct effect
of patent protection seems puzzling. Why, as the estimates indicate, is greater patent protection
associated with a lower size of firm outside R&D intensive industries while it is associated with
a higher size of firm in R&D intensive industries? One explanation consistent with Critical
Resource theory is the following: In countries where R&D is poorly protected, it may be that
18Could judicial efficiency be a proxy for low levels of tax evasion, given that a better judicial system is generallyassociated with better tax enforcement? This would be consistent with the finding that countries with a betterjudicial system (less easy to evade taxes) have bigger firms, since the rationale for staying small to evade taxes isabsent in such economies. However, if tax evasion were the real determinant of size, capital intensive firms, whichare more easily detectable, have a particularly strong incentive to stay small and evade taxes when enforcementis ineffective. These are the firms most likely to find the rationale for staying small disappear with improvedjudicial efficiency, and the interaction effect of capital intensity and judicial efficiency should be positive in sizeregressions. But this is contrary to the results presented in Table 6; thus tax evasion is unlikely to be the realreason behind the regression results on judicial efficiency.
21
firms relying on R&D alone cannot command critical resources sufficient to achieve scale. This
is why firms from industries based on other, more appropriable, resources, have the scale and
thus a comparative advantage, in undertaking R&D. When patents become better protected,
firms in R&D intensive industries can themselves reach the necessary scale. Thus R&D activity
migrates away from firms outside R&D intensive industries to firms in those industries, reducing
the size of the former, and increasing the size of the latter.
While this is admittedly an ex post-facto rationalization, there is some evidence consistent
with it. If, in fact, there is migration of activity across firms in different industries, we should see
the share of employment in R&D intensive industries increase in countries with better patent
protection. This is, in fact, the case. When we run a regression of an industry’s share of total
employment in a country against country indicators, industry indicators, and the interaction
between the industry’s R&D intensity and patent protection in that country, we find a positive
and significant coefficient. Thus R&D intensive sectors are a greater fraction of total employment
in countries with better protection of R&D.
5.3 Why Does a Better Judicial System Reduce the Impact of Capital In-
tensity on Size?
We can use interactions to further evaluate the implications of the Critical Resource theory. We
cannot, as yet, tell whether the negative interaction effect between improved judicial efficiency
and capital intensity comes from firms with relatively few physical assets becoming larger or from
capital intensive firms becoming smaller. Being able to distinguish between these effects would
provide more insight into the Critical Resource Theory. We have argued that improved judicial
efficiency will enable management to gain control from legal devices other than ownership rights
over physical assets. This suggests that the effect should largely come from the increase in size
of firms in industries that are not physical capital intensive (this will also provide additional
support for the causal link we want to draw for the R&D intensity-patent protection interaction).
There is, however, another possibility. If the residual rights arising from ownership of physical
assets are what distinguish firms from markets, as judicial efficiency improves, contractibility
improves, and the rights associated with physical assets become less important. Also, physical
assets become easier to finance for departing employees, therefore becoming less unique and well
protected, and again residual control rights associated with them diminish. This implies that
capital intensive firms should become smaller with improvements in judicial efficiency, which
could also explain the result.
To test this, we replace the interaction variable with judicial efficiency multiplied by indi-
22
cators if an industry is in the highest or lowest tertile of physical capital intensity in Table 6B.
The coefficient on the interaction between judicial efficiency and the highest tertile indicator is
negative but not significant. Most of the action comes from the lowest tertile indicator which
is positive and significant. This suggests that the effects of improvements in judicial efficiency
come primarily from the growth in the size of firms that are not physical capital intensive.
Therefore, the interaction effect seems consistent with the direct influence of capital intensity
and judicial efficiency on firm size as postulated by the Critical Resource theory, suggesting that
these theories might be worthy of further investigation.
6 Discussion
6.1 Relevance of Technological Theories
The cross-industry results are consistent with the technological theories. This fact is of impor-
tance given that the bulk of the variation in size, as indicated by an analysis of variance, is due
to sectoral effects. However, the cross-country evidence is mixed. For example, log per capita
income has, if anything, a negative correlation with firm size after correcting for institutional
variables that should be irrelevant in technological theories. Similarly, the level of human capital
has an insignificant correlation with firm size after we correct for the efficiency of the judicial
system.
This result is to be expected, as technological theories often abstract from institutional
features that vary across countries and affect firm formation. They instead focus on the orga-
nization of a typical sector within a given economy, and are thus most likely to be consistent
with time-series evidence, as in Lucas (1978), or cross-industry evidence, as in the early part of
our study.
One way to get at more detailed implications of technological theories may be to examine the
influences on the dispersion of firm size within industry. For example, Kremer’s (1993) results
on assortative matching based on human capital, and higher human capital firms undertaking
more complex processes (larger firms) can be combined to get the implication that greater
inequality in human capital would be correlated with greater dispersion in firm size. Rosen’s
(1982) model has a similar implication - with more skilled managers running large firms and less
skilled managers running small firms. As a measure of inequality in human capital we compute
the coefficient of variation in educational attainments.19 In Table 7, we regress the weighted
19Barro and Lee (1993) have data on the percentage of population over 25 in 4 categories of educationalattainment – none, primary, secondary, higher – for each country. They also have years of education attainment ofeach type – PYR25, SYR25, and HYR25. We assign the following years of education to the four-category frequency
23

coefficient of variation of firm size against this measure of inequality. We find, as predicted, the
coefficient on inequality to be positive and highly statistically significant.
One could, however, argue that institutional development reduces the importance of factors
like talent and incumbency for the exercise of managerial control, and levels the playing field.
For example, greater judicial efficiency could help even small entrants secure their property,
thus ensuring they reach optimal scale for production. Therefore, we would expect measures of
institutional development to be negatively correlated with dispersion. This is, in fact, the case.
When we include judicial efficiency in column II, it is strongly negatively correlated with the
weighted coefficient of variation of firm size, and inequality in human capital, while still positive,
is no longer statistically significant. Finally, the inclusion of per capita income in column III
does not change our conclusions.
As done for organizational theories, we could conduct more convincing tests of technological
theories if we could exploit the way differences in institutional environments across countries
affect the use of particular technologies or the organizational structures. One could tease out of
the technological theories tests for such interactions, even if it is hard to do so. For instance, in
Kremer (1993) when the value added in a particular technology is high, human capital will be
more important. For such technologies, firm size will be larger when the human capital available
in the country is better. This suggests a positive correlation between firm size and the interaction
of human capital in the country with value added per worker. This correlation is indeed positive
but insignificant when we include this interaction in the model in Table 6A, column III. Of
course, our measures are noisy, so more work is warranted before definite conclusions are drawn.
Even if one can devise more careful tests that discriminate between technological and orga-
nizational explanations of the size of firms, it is likely that they will be biased in favor of the
latter. The firm in our dataset is defined as the legal entity, and the focus of some organiza-
tional theories is precisely on that entity. Clearly, they should have more explanatory power.
By contrast, technological theories focus more on the technological limits to production. The
unit of observation to test such theories should be the length of a production process from raw
material input to final output. This may extend across several firms. Unfortunately, we do not
have data on the length of processes, hence the bias.
distribution mentioned above: 0, PYR25, PYR25+SYR25, and PYR25+SYR25+HYR25. The coefficient ofvariation is then computed the usual way and used as a measure of human capital inequality. All human capitaldata is for the year 1985.
24

6.2 Vertical vs. horizontal integration
Firms could become larger because they become more vertically integrated or because they
expand horizontally. A few theories are very specific about which of these forces leads to
greater size. For example, Adam Smith’s view that size is related to the extent of the market
clearly refers to a firm expanding by doing more of the same when the market grows, i.e.,
horizontal expansion. By contrast, the Property Rights view of Grossman and Hart was first
set in the context of vertical integration. In general, however, with this and most theories of firm
size, similar predictions can be obtained regardless of whether expansion comes from increased
vertical, or horizontal, integration. For this reason, we have purposefully avoided the question
thus far of whether differences in size arise from differences in the level of vertical, or horizontal,
integration.
Nevertheless, it is of some interest to examine how size and the extent of vertical integration
are related. A traditional measure of vertical integration is the value added to sales ratio
(Adelman, 1955). More vertically integrated firms have higher value added per unit of sales
and, thus, will have a higher ratio. Unfortunately, Enterprises in Europe report the data on
value added and sales only for a subset of sector-country observations (249 overall). Furthermore,
these do not coincide perfectly with the sector-country observations for which we have data on
size distribution (only 146 sector-country observations have both data). Thus, our analysis is,
by necessity, exploratory.
Table 8A reports the average value-added-to-sales ratio across countries (column I). With the
exception of Denmark and Greece, all countries have a similar level of vertical integration, where
the value added generated by an enterprise corresponds to roughly 35% of sales.20 The pattern
is unchanged if we correct for the different industry composition in the various countries, as
shown in column II. A possible explanation of this remarkable homogeneity across the European
countries is the long-standing presence of a valued added tax system among members of the
European Union. Unlike sales taxes, a valued added tax is neutral with respect to the integration
decision. Thus, our sample of European countries appears particularly suitable to explore other
determinants of size, because it is unaffected by biases stemming from taxes on sales.
Table 8B reports the average value-added-to-sales ratio across industries (column I). Here we
do observe a lot of cross sectional variation. In fact, in an analysis of variance, sector dummies
account for 58% of the overall variability, while country dummies only 10%. As seems quite
20The different levels of integration in Denmark and Greece are probably attributable to differences in thedefinitions of enterprise. As reported by Eurostat (Enterprises in Europe 3 vol. I, p. xxvi) Greece uses a narrowerdefinition of enterprise, which is more similar to the notion of establishment, while Denmark uses a broaderdefinition, based on the legal entity.
25

plausible, the least vertically integrated sectors are Agents, Wholesale Distribution, Coke Oven,
Retail Distribution, and Oil Refining. At the other extreme, the most vertically integrated
sectors are Railways, Services, and Research & Development.
How much of the differences in size across industries and countries are driven by differences
in the degree of vertical integration? To examine this, we determine the correlation between
our measure of firm size (logarithm of the employee-weighted average size) and the degree of
vertical integration. Surprisingly, the correlation is approximately zero (0.006). This continues
to be true if we control for country fixed effects and industry fixed effects. This is consistent
with Jovanovic (1993), who documents empirical evidence on the joint trend toward bigness and
diversification (i.e., horizontal integration) of firms in the United States and other countries. If
firms achieve greater size largely through horizontal integration we may indeed find that size
and the degree of vertical integration are uncorrelated.
We then substitute the measure of firm size with the value-added-to-sales ratio and re-
estimate all the above specifications in Tables 4 and 5 (estimates not reported). While the
coefficient signs are generally the same as in the tables, none of the coefficients is statistically
significant. The only exception is the log of per capita income, which enters positively and sig-
nificantly when the dependent variable is vertical integration, and negatively and insignificantly
when the dependent variable is size. While the limited sample at our disposition (146 observa-
tions) and the likely noisiness of the measure prevent any strong conclusions, the results seem
to indicate that the differences in size we capture are not driven by differences in the extent of
vertical integration.
7 Conclusion
We believe we have uncovered a number of regularities that can provide some answers to the
questions that started this paper as well as offer guidance for future empirical and theoretical
work on determinants of firm size. The broad patterns are that firms in capital-intensive indus-
tries are larger, as are firms in countries with efficient judicial systems. The cross-industry results
are consistent with both technological and organizational theories, while the cross-country re-
sults are understandably less supportive of the technological theories. The most novel aspect of
this study is the use of interactions between institutional and technological variables to test de-
tailed mechanics of the theories; organizational theories are particularly amenable to such tests.
A central finding is that firms in capital intensive industries are relatively smaller when located
in countries with efficient judicial systems, which lends support to organizational theories, es-
pecially the Critical Resource theories. Moreover, R&D intensive industries have larger firms
26

when patents are better protected, though firms outside R&D intensive industries are smaller.
We have gone some way towards addressing the issue of causality by investigating the detailed
implications of the theory. If, in fact, the policy variables that we have found correlated with
firm size are causal, then our findings suggest a potential answer to the initial question of
why Finland has large firms. Finland’s judicial efficiency is rated 10, the highest on the scale
(a position shared with a number of other countries). It comes in at 2.95 on the index of
patent protection, which puts Finland only above Portugal and Greece in our sample. Since
the direct effect of judicial efficiency is positive and that of patent protection is negative, our
analysis suggests reasons why Finland has above average firms. Of course, these aggregate level
explanations will have to be refined for individual firms. For example, Nokia, Finland’s single
largest firm, is well known for its prowess in telecommunications, an R&D intensive industry.
It is surprising that Nokia has grown to such a size despite Finland having relatively poor
protection of patent rights. The explanation probably has to do with the fact that Nokia was
already a conglomerate, involved in paper, chemicals, and rubber, when it started doing the
research that eventually led to its forays into telecommunications in the 1990s. Because it had
the size and organizational stability coming from other critical resources, unlike a firm purely
in telecommunications it did not have to rely on patent protection to protect itself.
An important question, which we plan to address in future work, is whether size differ-
ences matter for the industry specialization as well as the level and growth of productivity
across countries. This study should be viewed as a first step towards the goal of understanding
how institutional and technological factors can affect the size of organizations and, ultimately,
growth.
27
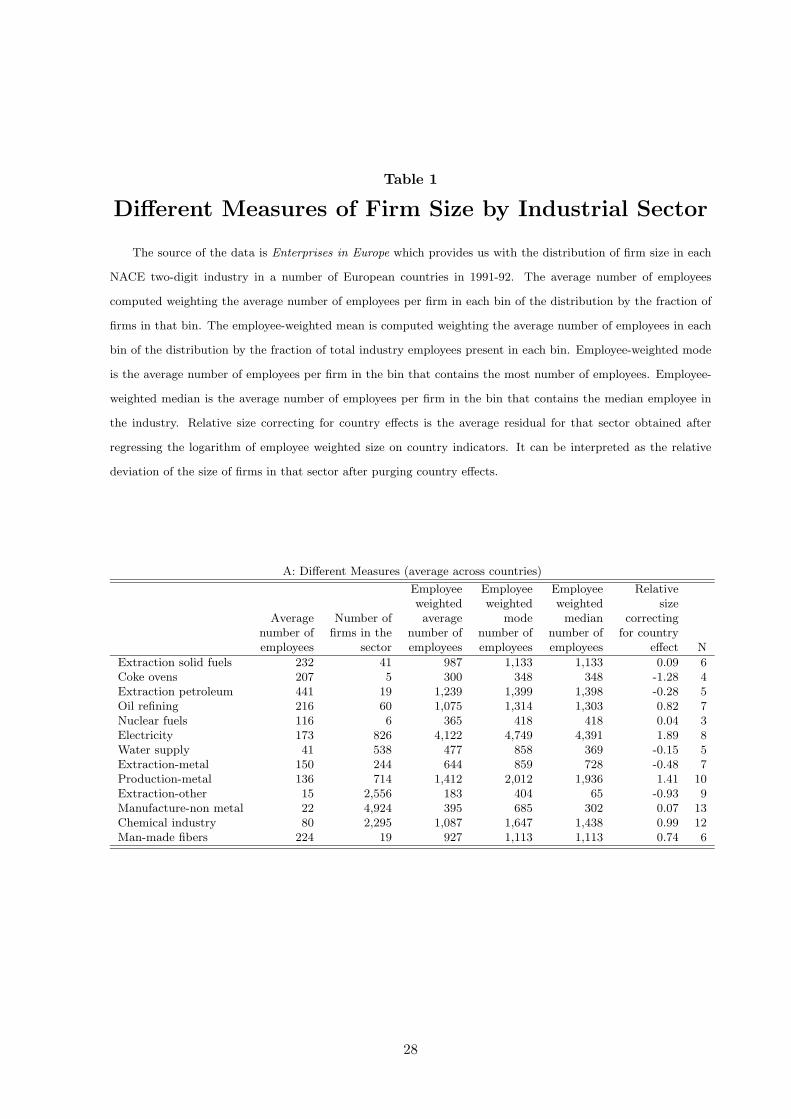
Table 1
Different Measures of Firm Size by Industrial Sector
The source of the data is Enterprises in Europe which provides us with the distribution of firm size in each
NACE two-digit industry in a number of European countries in 1991-92. The average number of employees
computed weighting the average number of employees per firm in each bin of the distribution by the fraction of
firms in that bin. The employee-weighted mean is computed weighting the average number of employees in each
bin of the distribution by the fraction of total industry employees present in each bin. Employee-weighted mode
is the average number of employees per firm in the bin that contains the most number of employees. Employee-
weighted median is the average number of employees per firm in the bin that contains the median employee in
the industry. Relative size correcting for country effects is the average residual for that sector obtained after
regressing the logarithm of employee weighted size on country indicators. It can be interpreted as the relative
deviation of the size of firms in that sector after purging country effects.
A: Different Measures (average across countries)
Employee Employee Employee Relativeweighted weighted weighted size
Average Number of average mode median correctingnumber of firms in the number of number of number of for countryemployees sector employees employees employees effect N
Extraction solid fuels 232 41 987 1,133 1,133 0.09 6Coke ovens 207 5 300 348 348 -1.28 4Extraction petroleum 441 19 1,239 1,399 1,398 -0.28 5Oil refining 216 60 1,075 1,314 1,303 0.82 7Nuclear fuels 116 6 365 418 418 0.04 3Electricity 173 826 4,122 4,749 4,391 1.89 8Water supply 41 538 477 858 369 -0.15 5Extraction-metal 150 244 644 859 728 -0.48 7Production-metal 136 714 1,412 2,012 1,936 1.41 10Extraction-other 15 2,556 183 404 65 -0.93 9Manufacture-non metal 22 4,924 395 685 302 0.07 13Chemical industry 80 2,295 1,087 1,647 1,438 0.99 12Man-made fibers 224 19 927 1,113 1,113 0.74 6
28
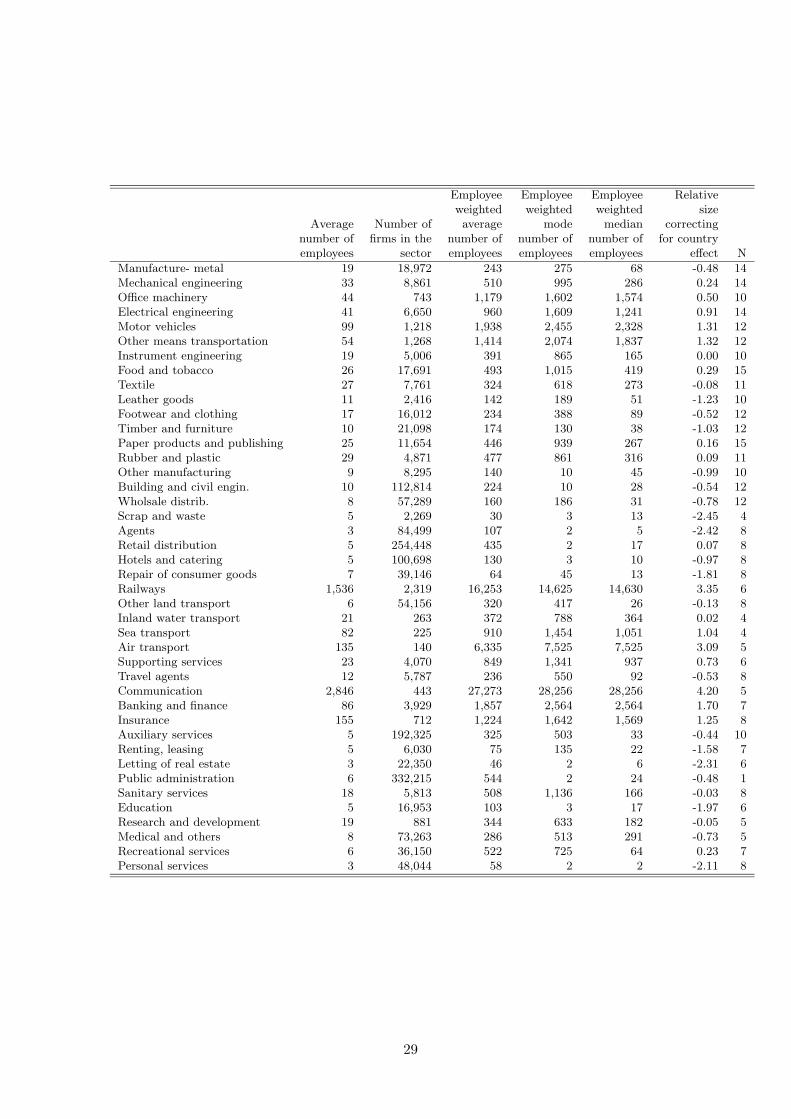
Employee Employee Employee Relativeweighted weighted weighted size
Average Number of average mode median correctingnumber of firms in the number of number of number of for countryemployees sector employees employees employees effect N
Manufacture- metal 19 18,972 243 275 68 -0.48 14Mechanical engineering 33 8,861 510 995 286 0.24 14Office machinery 44 743 1,179 1,602 1,574 0.50 10Electrical engineering 41 6,650 960 1,609 1,241 0.91 14Motor vehicles 99 1,218 1,938 2,455 2,328 1.31 12Other means transportation 54 1,268 1,414 2,074 1,837 1.32 12Instrument engineering 19 5,006 391 865 165 0.00 10Food and tobacco 26 17,691 493 1,015 419 0.29 15Textile 27 7,761 324 618 273 -0.08 11Leather goods 11 2,416 142 189 51 -1.23 10Footwear and clothing 17 16,012 234 388 89 -0.52 12Timber and furniture 10 21,098 174 130 38 -1.03 12Paper products and publishing 25 11,654 446 939 267 0.16 15Rubber and plastic 29 4,871 477 861 316 0.09 11Other manufacturing 9 8,295 140 10 45 -0.99 10Building and civil engin. 10 112,814 224 10 28 -0.54 12Wholsale distrib. 8 57,289 160 186 31 -0.78 12Scrap and waste 5 2,269 30 3 13 -2.45 4Agents 3 84,499 107 2 5 -2.42 8Retail distribution 5 254,448 435 2 17 0.07 8Hotels and catering 5 100,698 130 3 10 -0.97 8Repair of consumer goods 7 39,146 64 45 13 -1.81 8Railways 1,536 2,319 16,253 14,625 14,630 3.35 6Other land transport 6 54,156 320 417 26 -0.13 8Inland water transport 21 263 372 788 364 0.02 4Sea transport 82 225 910 1,454 1,051 1.04 4Air transport 135 140 6,335 7,525 7,525 3.09 5Supporting services 23 4,070 849 1,341 937 0.73 6Travel agents 12 5,787 236 550 92 -0.53 8Communication 2,846 443 27,273 28,256 28,256 4.20 5Banking and finance 86 3,929 1,857 2,564 2,564 1.70 7Insurance 155 712 1,224 1,642 1,569 1.25 8Auxiliary services 5 192,325 325 503 33 -0.44 10Renting, leasing 5 6,030 75 135 22 -1.58 7Letting of real estate 3 22,350 46 2 6 -2.31 6Public administration 6 332,215 544 2 24 -0.48 1Sanitary services 18 5,813 508 1,136 166 -0.03 8Education 5 16,953 103 3 17 -1.97 6Research and development 19 881 344 633 182 -0.05 5Medical and others 8 73,263 286 513 291 -0.73 5Recreational services 6 36,150 522 725 64 0.23 7Personal services 3 48,044 58 2 2 -2.11 8
29
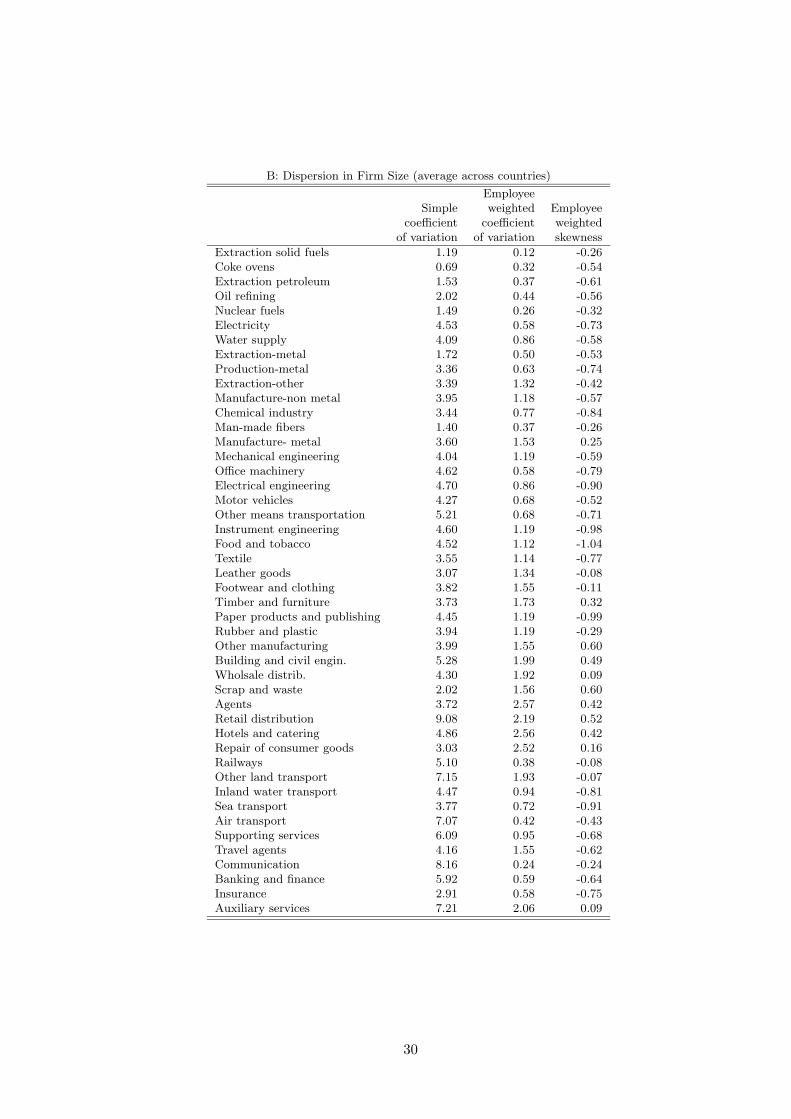
B: Dispersion in Firm Size (average across countries)
EmployeeSimple weighted Employee
coefficient coefficient weightedof variation of variation skewness
Extraction solid fuels 1.19 0.12 -0.26Coke ovens 0.69 0.32 -0.54Extraction petroleum 1.53 0.37 -0.61Oil refining 2.02 0.44 -0.56Nuclear fuels 1.49 0.26 -0.32Electricity 4.53 0.58 -0.73Water supply 4.09 0.86 -0.58Extraction-metal 1.72 0.50 -0.53Production-metal 3.36 0.63 -0.74Extraction-other 3.39 1.32 -0.42Manufacture-non metal 3.95 1.18 -0.57Chemical industry 3.44 0.77 -0.84Man-made fibers 1.40 0.37 -0.26Manufacture- metal 3.60 1.53 0.25Mechanical engineering 4.04 1.19 -0.59Office machinery 4.62 0.58 -0.79Electrical engineering 4.70 0.86 -0.90Motor vehicles 4.27 0.68 -0.52Other means transportation 5.21 0.68 -0.71Instrument engineering 4.60 1.19 -0.98Food and tobacco 4.52 1.12 -1.04Textile 3.55 1.14 -0.77Leather goods 3.07 1.34 -0.08Footwear and clothing 3.82 1.55 -0.11Timber and furniture 3.73 1.73 0.32Paper products and publishing 4.45 1.19 -0.99Rubber and plastic 3.94 1.19 -0.29Other manufacturing 3.99 1.55 0.60Building and civil engin. 5.28 1.99 0.49Wholsale distrib. 4.30 1.92 0.09Scrap and waste 2.02 1.56 0.60Agents 3.72 2.57 0.42Retail distribution 9.08 2.19 0.52Hotels and catering 4.86 2.56 0.42Repair of consumer goods 3.03 2.52 0.16Railways 5.10 0.38 -0.08Other land transport 7.15 1.93 -0.07Inland water transport 4.47 0.94 -0.81Sea transport 3.77 0.72 -0.91Air transport 7.07 0.42 -0.43Supporting services 6.09 0.95 -0.68Travel agents 4.16 1.55 -0.62Communication 8.16 0.24 -0.24Banking and finance 5.92 0.59 -0.64Insurance 2.91 0.58 -0.75Auxiliary services 7.21 2.06 0.09
30
B: Dispersion in Firm Size (average across countries)
EmployeeSimple weighted Employee
coefficient coefficient weightedof variation of variation skewness
Renting, leasing 3.80 1.89 0.20Letting of real estate 3.27 1.96 0.54Public administration 9.35 1.72 0.58Sanitary services 5.38 1.15 -0.78Education 3.75 1.71 0.55Research and development 4.43 0.96 -0.82Medical and others 5.84 1.91 -0.24Recreational services 9.65 1.65 -0.30Personal services 4.01 2.81 0.34
31
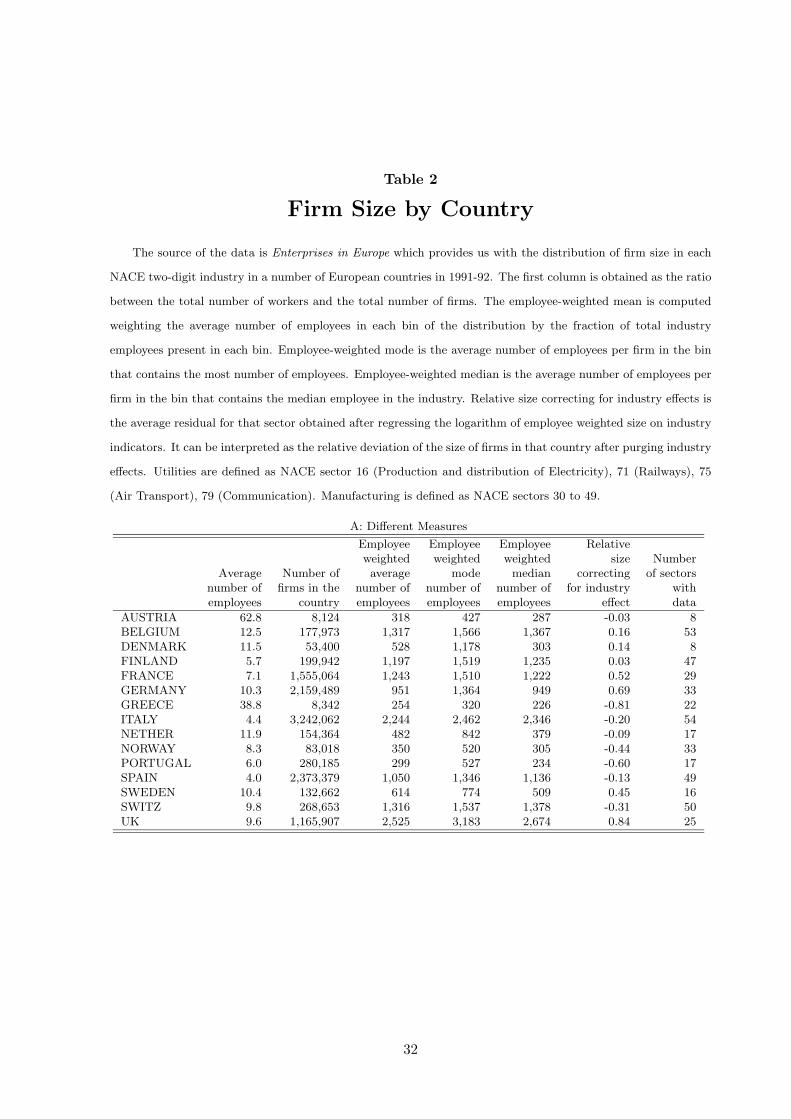
Table 2
Firm Size by Country
The source of the data is Enterprises in Europe which provides us with the distribution of firm size in each
NACE two-digit industry in a number of European countries in 1991-92. The first column is obtained as the ratio
between the total number of workers and the total number of firms. The employee-weighted mean is computed
weighting the average number of employees in each bin of the distribution by the fraction of total industry
employees present in each bin. Employee-weighted mode is the average number of employees per firm in the bin
that contains the most number of employees. Employee-weighted median is the average number of employees per
firm in the bin that contains the median employee in the industry. Relative size correcting for industry effects is
the average residual for that sector obtained after regressing the logarithm of employee weighted size on industry
indicators. It can be interpreted as the relative deviation of the size of firms in that country after purging industry
effects. Utilities are defined as NACE sector 16 (Production and distribution of Electricity), 71 (Railways), 75
(Air Transport), 79 (Communication). Manufacturing is defined as NACE sectors 30 to 49.
A: Different Measures
Employee Employee Employee Relativeweighted weighted weighted size Number
Average Number of average mode median correcting of sectorsnumber of firms in the number of number of number of for industry withemployees country employees employees employees effect data
AUSTRIA 62.8 8,124 318 427 287 -0.03 8BELGIUM 12.5 177,973 1,317 1,566 1,367 0.16 53DENMARK 11.5 53,400 528 1,178 303 0.14 8FINLAND 5.7 199,942 1,197 1,519 1,235 0.03 47FRANCE 7.1 1,555,064 1,243 1,510 1,222 0.52 29GERMANY 10.3 2,159,489 951 1,364 949 0.69 33GREECE 38.8 8,342 254 320 226 -0.81 22ITALY 4.4 3,242,062 2,244 2,462 2,346 -0.20 54NETHER 11.9 154,364 482 842 379 -0.09 17NORWAY 8.3 83,018 350 520 305 -0.44 33PORTUGAL 6.0 280,185 299 527 234 -0.60 17SPAIN 4.0 2,373,379 1,050 1,346 1,136 -0.13 49SWEDEN 10.4 132,662 614 774 509 0.45 16SWITZ 9.8 268,653 1,316 1,537 1,378 -0.31 50UK 9.6 1,165,907 2,525 3,183 2,674 0.84 25
32

B: Different Subsamples
Mean in Mean in Mean inMean without manufacturing mechanical food and
Country utilities alone engineering drink
AUSTRIA 318 366 369 194BELGIUM 631 566 615 363DENMARK 528 688 823 904FINLAND 519 555 660 719FRANCE 706 798 NA 376GERMANY 900 1007 751 293GREECE 254 233 73 241ITALY 545 691 292 290NETHER 443 556 105 422NORWAY 347 243 730 403PORTUGAL 299 341 155 216SPAIN 558 750 118 292SWEDEN 576 681 479 635SWITZ 321 242 581 373UK 1041 1087 1187 1486
C: Dispersion in Firm Size (average across industries)
EmployeeSimple weighted Employee
coefficient coefficient weightedCountry of variation of variation skewness
AUSTRIA 1.68 0.94 -0.20BELGIUM 3.51 0.97 -0.36DENMARK 4.75 1.27 -0.89FINLAND 5.59 1.10 -0.51FRANCE 5.20 1.28 -0.27GERMANY 4.50 1.31 -0.61GREECE 1.72 1.01 -0.07ITALY 4.35 1.70 -0.05NETHER 3.89 1.28 -0.45NORWAY 3.00 1.15 -0.23PORTUGAL 4.18 1.32 -0.33SPAIN 4.69 1.62 -0.25SWEDEN 5.49 1.11 -0.38SWITZ 3.73 1.19 -0.22UK 7.13 0.97 -0.54
33
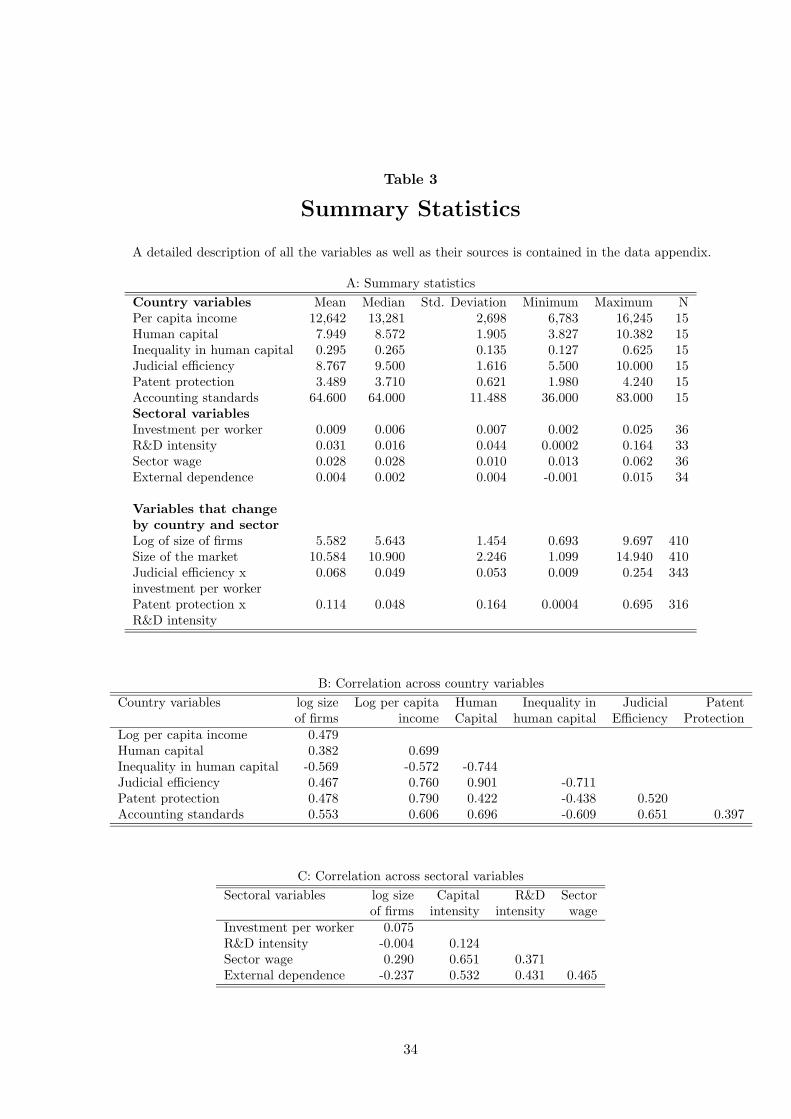
Table 3
Summary Statistics
A detailed description of all the variables as well as their sources is contained in the data appendix.
A: Summary statisticsCountry variables Mean Median Std. Deviation Minimum Maximum NPer capita income 12,642 13,281 2,698 6,783 16,245 15Human capital 7.949 8.572 1.905 3.827 10.382 15Inequality in human capital 0.295 0.265 0.135 0.127 0.625 15Judicial efficiency 8.767 9.500 1.616 5.500 10.000 15Patent protection 3.489 3.710 0.621 1.980 4.240 15Accounting standards 64.600 64.000 11.488 36.000 83.000 15Sectoral variablesInvestment per worker 0.009 0.006 0.007 0.002 0.025 36R&D intensity 0.031 0.016 0.044 0.0002 0.164 33Sector wage 0.028 0.028 0.010 0.013 0.062 36External dependence 0.004 0.002 0.004 -0.001 0.015 34
Variables that changeby country and sectorLog of size of firms 5.582 5.643 1.454 0.693 9.697 410Size of the market 10.584 10.900 2.246 1.099 14.940 410Judicial efficiency x 0.068 0.049 0.053 0.009 0.254 343investment per workerPatent protection x 0.114 0.048 0.164 0.0004 0.695 316R&D intensity
B: Correlation across country variablesCountry variables log size Log per capita Human Inequality in Judicial Patent
of firms income Capital human capital Efficiency ProtectionLog per capita income 0.479Human capital 0.382 0.699Inequality in human capital -0.569 -0.572 -0.744Judicial efficiency 0.467 0.760 0.901 -0.711Patent protection 0.478 0.790 0.422 -0.438 0.520Accounting standards 0.553 0.606 0.696 -0.609 0.651 0.397
C: Correlation across sectoral variablesSectoral variables log size Capital R&D Sector
of firms intensity intensity wageInvestment per worker 0.075R&D intensity -0.004 0.124Sector wage 0.290 0.651 0.371External dependence -0.237 0.532 0.431 0.465
34

D: Correlation across variables that changeboth by country and sector
Variables that change log size Market Jud. eff. x Pat. prot.by country and sector of firms size cap. int. R&D int.Size of the market 0.301Judicial efficiency x 0.156 -0.361investment per workerPatent protection x 0.140 -0.023 0.162R&D intensity
35
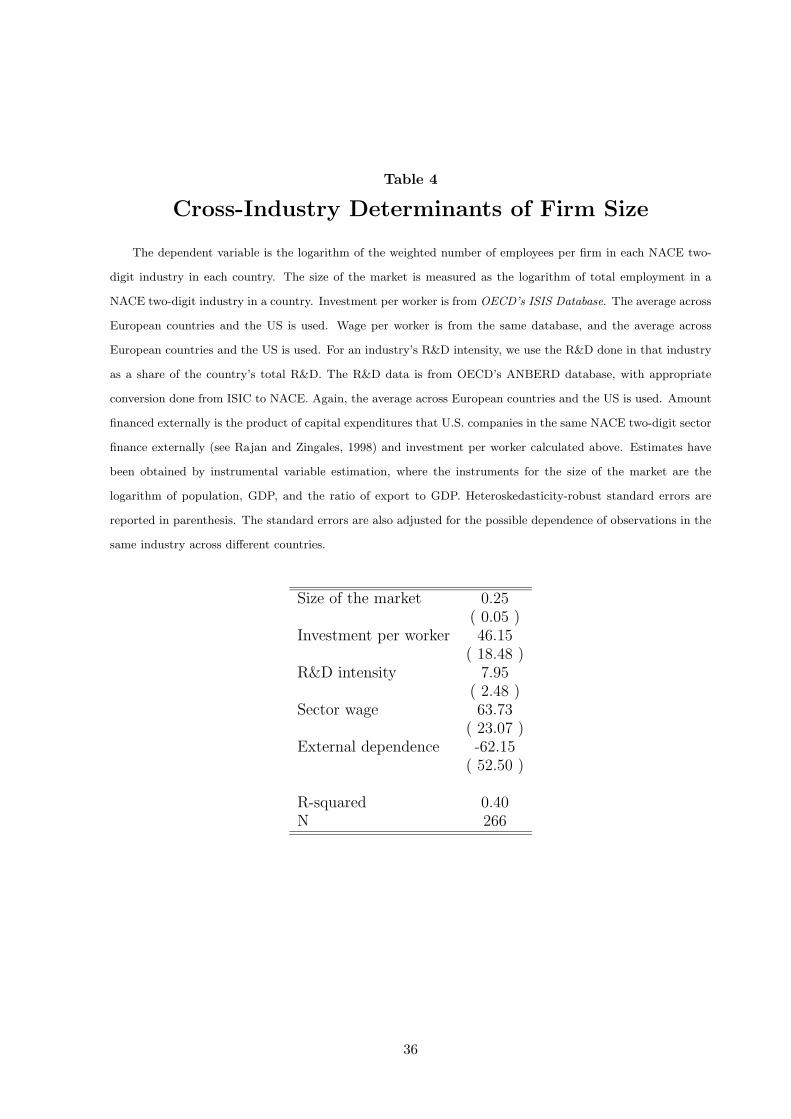
Table 4
Cross-Industry Determinants of Firm Size
The dependent variable is the logarithm of the weighted number of employees per firm in each NACE two-
digit industry in each country. The size of the market is measured as the logarithm of total employment in a
NACE two-digit industry in a country. Investment per worker is from OECD’s ISIS Database. The average across
European countries and the US is used. Wage per worker is from the same database, and the average across
European countries and the US is used. For an industry’s R&D intensity, we use the R&D done in that industry
as a share of the country’s total R&D. The R&D data is from OECD’s ANBERD database, with appropriate
conversion done from ISIC to NACE. Again, the average across European countries and the US is used. Amount
financed externally is the product of capital expenditures that U.S. companies in the same NACE two-digit sector
finance externally (see Rajan and Zingales, 1998) and investment per worker calculated above. Estimates have
been obtained by instrumental variable estimation, where the instruments for the size of the market are the
logarithm of population, GDP, and the ratio of export to GDP. Heteroskedasticity-robust standard errors are
reported in parenthesis. The standard errors are also adjusted for the possible dependence of observations in the
same industry across different countries.
Size of the market 0.25( 0.05 )
Investment per worker 46.15( 18.48 )
R&D intensity 7.95( 2.48 )
Sector wage 63.73( 23.07 )
External dependence -62.15( 52.50 )
R-squared 0.40N 266
36
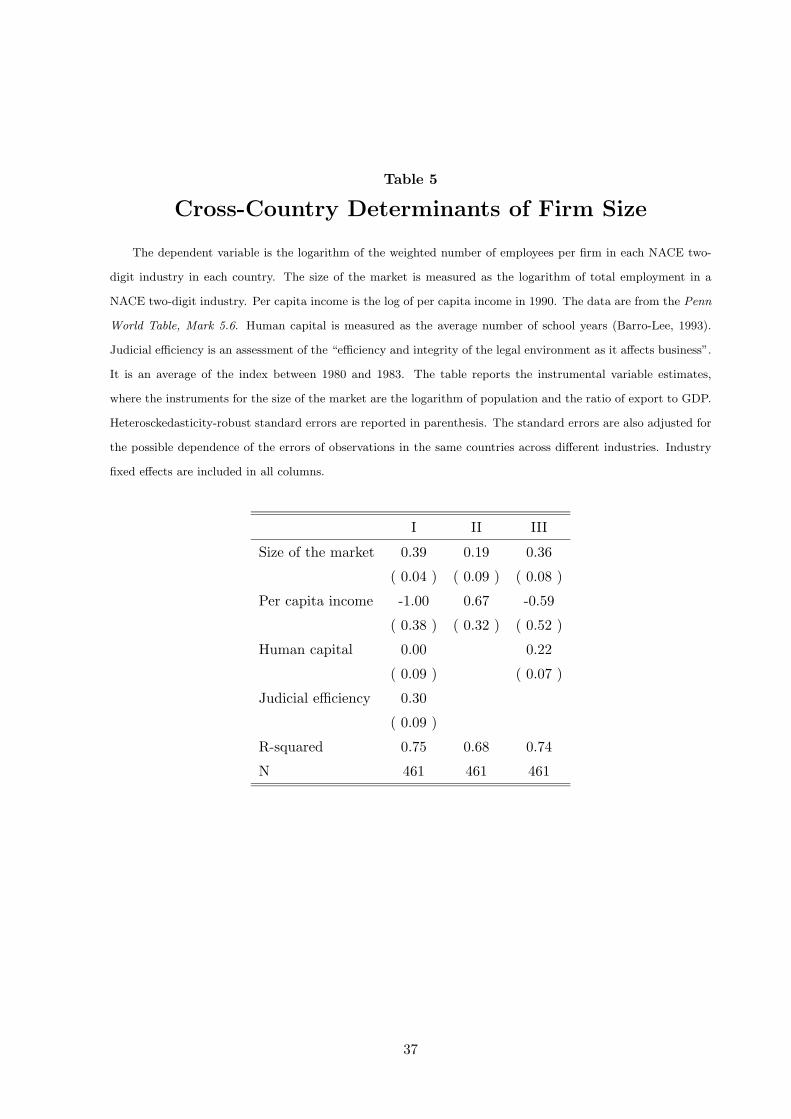
Table 5
Cross-Country Determinants of Firm Size
The dependent variable is the logarithm of the weighted number of employees per firm in each NACE two-
digit industry in each country. The size of the market is measured as the logarithm of total employment in a
NACE two-digit industry. Per capita income is the log of per capita income in 1990. The data are from the Penn
World Table, Mark 5.6. Human capital is measured as the average number of school years (Barro-Lee, 1993).
Judicial efficiency is an assessment of the “efficiency and integrity of the legal environment as it affects business”.
It is an average of the index between 1980 and 1983. The table reports the instrumental variable estimates,
where the instruments for the size of the market are the logarithm of population and the ratio of export to GDP.
Heterosckedasticity-robust standard errors are reported in parenthesis. The standard errors are also adjusted for
the possible dependence of the errors of observations in the same countries across different industries. Industry
fixed effects are included in all columns.
I II III
Size of the market 0.39 0.19 0.36
( 0.04 ) ( 0.09 ) ( 0.08 )
Per capita income -1.00 0.67 -0.59
( 0.38 ) ( 0.32 ) ( 0.52 )
Human capital 0.00 0.22
( 0.09 ) ( 0.07 )
Judicial efficiency 0.30
( 0.09 )
R-squared 0.75 0.68 0.74
N 461 461 461
37
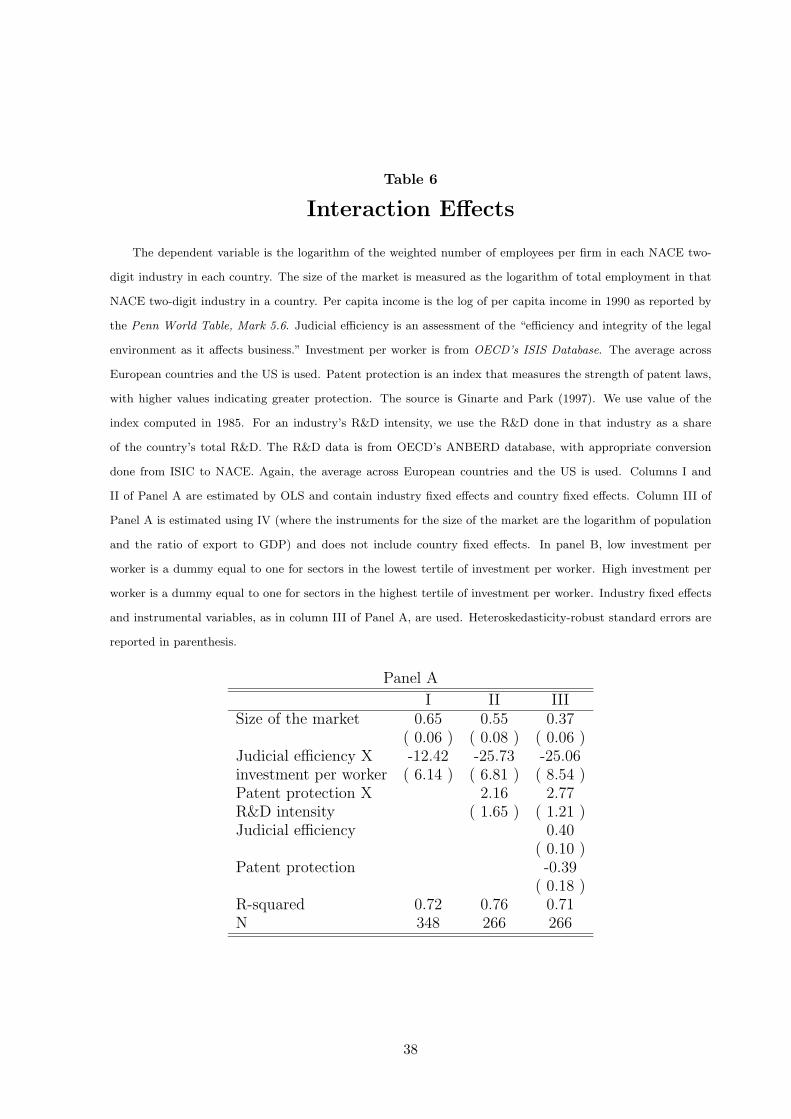
Table 6
Interaction Effects
The dependent variable is the logarithm of the weighted number of employees per firm in each NACE two-
digit industry in each country. The size of the market is measured as the logarithm of total employment in that
NACE two-digit industry in a country. Per capita income is the log of per capita income in 1990 as reported by
the Penn World Table, Mark 5.6. Judicial efficiency is an assessment of the “efficiency and integrity of the legal
environment as it affects business.” Investment per worker is from OECD’s ISIS Database. The average across
European countries and the US is used. Patent protection is an index that measures the strength of patent laws,
with higher values indicating greater protection. The source is Ginarte and Park (1997). We use value of the
index computed in 1985. For an industry’s R&D intensity, we use the R&D done in that industry as a share
of the country’s total R&D. The R&D data is from OECD’s ANBERD database, with appropriate conversion
done from ISIC to NACE. Again, the average across European countries and the US is used. Columns I and
II of Panel A are estimated by OLS and contain industry fixed effects and country fixed effects. Column III of
Panel A is estimated using IV (where the instruments for the size of the market are the logarithm of population
and the ratio of export to GDP) and does not include country fixed effects. In panel B, low investment per
worker is a dummy equal to one for sectors in the lowest tertile of investment per worker. High investment per
worker is a dummy equal to one for sectors in the highest tertile of investment per worker. Industry fixed effects
and instrumental variables, as in column III of Panel A, are used. Heteroskedasticity-robust standard errors are
reported in parenthesis.
Panel A
I II IIISize of the market 0.65 0.55 0.37
( 0.06 ) ( 0.08 ) ( 0.06 )Judicial efficiency X -12.42 -25.73 -25.06investment per worker ( 6.14 ) ( 6.81 ) ( 8.54 )Patent protection X 2.16 2.77R&D intensity ( 1.65 ) ( 1.21 )Judicial efficiency 0.40
( 0.10 )Patent protection -0.39
( 0.18 )R-squared 0.72 0.76 0.71N 348 266 266
38

Panel B
Size of the market 0.38( 0.06 )
Patent protection x 2.82R&D intensity ( 1.22 )Judicial efficiency 0.19
( 0.06 )Patent protection -0.36
( 0.17 )Judicial efficiency x -0.07high investment per worker ( 0.07 )Judicial efficiency x 0.19low investment per worker ( 0.04 )R-squared 0.70N 266
39
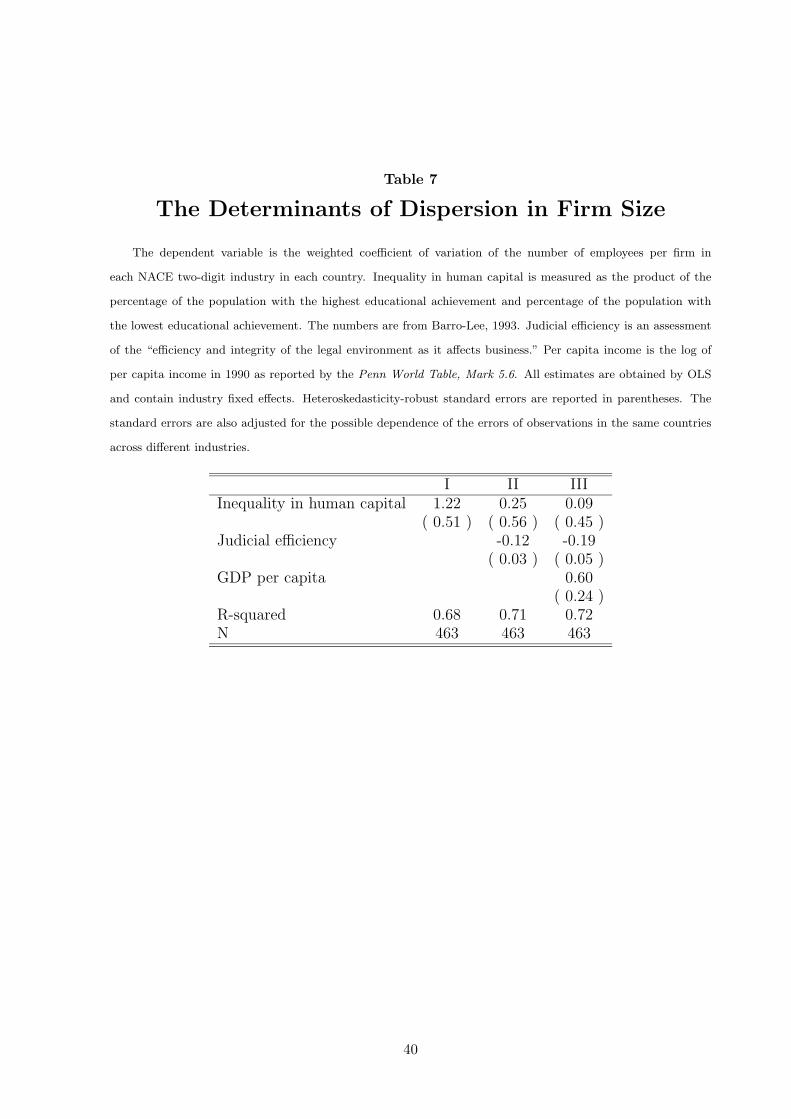
Table 7
The Determinants of Dispersion in Firm Size
The dependent variable is the weighted coefficient of variation of the number of employees per firm in
each NACE two-digit industry in each country. Inequality in human capital is measured as the product of the
percentage of the population with the highest educational achievement and percentage of the population with
the lowest educational achievement. The numbers are from Barro-Lee, 1993. Judicial efficiency is an assessment
of the “efficiency and integrity of the legal environment as it affects business.” Per capita income is the log of
per capita income in 1990 as reported by the Penn World Table, Mark 5.6. All estimates are obtained by OLS
and contain industry fixed effects. Heteroskedasticity-robust standard errors are reported in parentheses. The
standard errors are also adjusted for the possible dependence of the errors of observations in the same countries
across different industries.
I II IIIInequality in human capital 1.22 0.25 0.09
( 0.51 ) ( 0.56 ) ( 0.45 )Judicial efficiency -0.12 -0.19
( 0.03 ) ( 0.05 )GDP per capita 0.60
( 0.24 )R-squared 0.68 0.71 0.72N 463 463 463
40
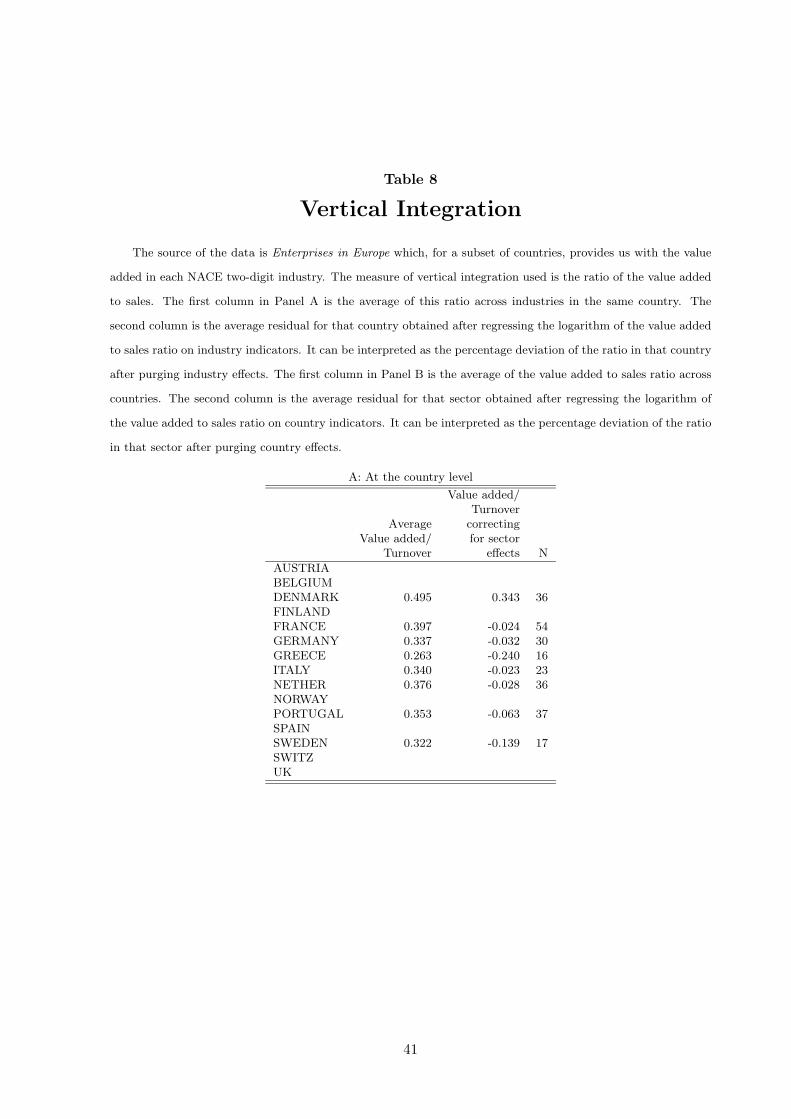
Table 8
Vertical Integration
The source of the data is Enterprises in Europe which, for a subset of countries, provides us with the value
added in each NACE two-digit industry. The measure of vertical integration used is the ratio of the value added
to sales. The first column in Panel A is the average of this ratio across industries in the same country. The
second column is the average residual for that country obtained after regressing the logarithm of the value added
to sales ratio on industry indicators. It can be interpreted as the percentage deviation of the ratio in that country
after purging industry effects. The first column in Panel B is the average of the value added to sales ratio across
countries. The second column is the average residual for that sector obtained after regressing the logarithm of
the value added to sales ratio on country indicators. It can be interpreted as the percentage deviation of the ratio
in that sector after purging country effects.
A: At the country level
Value added/Turnover
Average correctingValue added/ for sector
Turnover effects N
AUSTRIABELGIUMDENMARK 0.495 0.343 36FINLANDFRANCE 0.397 -0.024 54GERMANY 0.337 -0.032 30GREECE 0.263 -0.240 16ITALY 0.340 -0.023 23NETHER 0.376 -0.028 36NORWAYPORTUGAL 0.353 -0.063 37SPAINSWEDEN 0.322 -0.139 17SWITZUK
41

B: At the industry level
Average correctingValue added/ for country
Turnover effects N
Extraction solid fuels 0.507 0.328 2Coke ovens 0.164 -0.836 2Extraction petroleum 0.510 0.372 1Oil refining 0.208 -0.886 4Nuclear fuels 0.453 0.305 2Electricity 0.509 0.327 4Water supply 0.567 0.515 4Extraction-metal 0.378 0.084 4Production-metal 0.295 -0.289 3Extraction-other 0.425 0.150 4Manufacture-non metal 0.387 0.145 7Chemical industry 0.300 -0.139 7Man-made fibers 0.271 -0.205 2Manufacture- metal 0.358 0.024 7Mechanical engineering 0.378 0.119 7Office machinery 0.385 0.098 7Electrical engineering 0.347 0.030 7Motor vehicles 0.238 -0.344 8Other means transportation 0.317 -0.058 7Instrument engineering 0.435 0.245 7Food and tobacco 0.243 -0.343 8Textile 0.316 -0.067 7Leather goods 0.316 -0.053 7Footwear and clothing 0.335 -0.001 7Timber and furniture 0.335 0.012 8Paper products and publishing 0.378 0.129 8Rubber and plastic 0.319 0.025 7Other manufacturing 0.352 0.106 5Building and civil engin. 0.354 0.014 6Wholsale distrib. 0.145 -0.902 6Scrap and waste 0.223 -0.573 3Agents 0.134 -1.045 3Retail distribution 0.188 -0.641 6Hotels and catering 0.436 0.184 5Repair of consumer goods 0.334 -0.178 5Railways 0.954 0.999 1Other land transport 0.495 0.342 6Inland water transport 0.522 0.263 3Sea transport 0.298 -0.241 5Air transport 0.433 0.041 2Supporting services 0.737 0.704 4Travel agents 0.318 -0.220 7Communication 0.619 0.600 4Banking and finance 0.534 0.402 3Insurance 0.258 -0.269 3Auxiliary services 0.456 0.169 4Renting, leasing 0.450 0.108 3Letting of real estate 0.588 0.516 1Public administration 0.708 0.692 5Sanitary services 0.578 0.498 1Education 0.467 0.285 1Research and development 0.643 0.458 2Medical and others 0.430 0.092 3Recreational services 0.622 0.518 4Personal services 0
42

A Appendix
A.1 Formulas for Statistical Measures
Let ei denote the employment in bin i, and nidenote the number of firms in bin i for any given country-sector combination. Omit country-sector subscripts for convenience. Let E denote the total employmentfor the country-sector and N the total number of firms. The simple average is given by:
av =∑i
(niN
)( eini
)=E
N.
The employee-weighted average is given by:
ewav =∑i
(eiE
)( eini
).
The simple variance is given by:
var =∑i
(niN
)[( eini
)− av
]2
sd =√var.
The analagous quantity for the employee-weighted variance is:
ewvar =∑i
(eiE
)[( eini
)− ewav
]2
ewsd =√ewvar.
The simple coefficient of variation is given by:
cv =sd
av.
The analagous one for the employee-weighted measure is:
ewcv =ewsd
ewav.
The “employee-weighted mode” is defined by:
ewmode = arg max((ei
E
)( eini
)).
The average size of the modal bin is reported.The employee-weighted median will be the first i for which 1
ewav
∑i
(eiE
) (eini
)becomes ≥ 0.5.
Pearson’s measure for employee-weighted skewness is (ewmean−ewmode)ewsd .
A.2 Data Appendix
In this appendix, we discuss the data sources and the construction of our regression variables. In theinterest of brevity, we present only the main points on the construction of a unified database from dis-parate sources. More comprehensive notes are available from the authors.
43
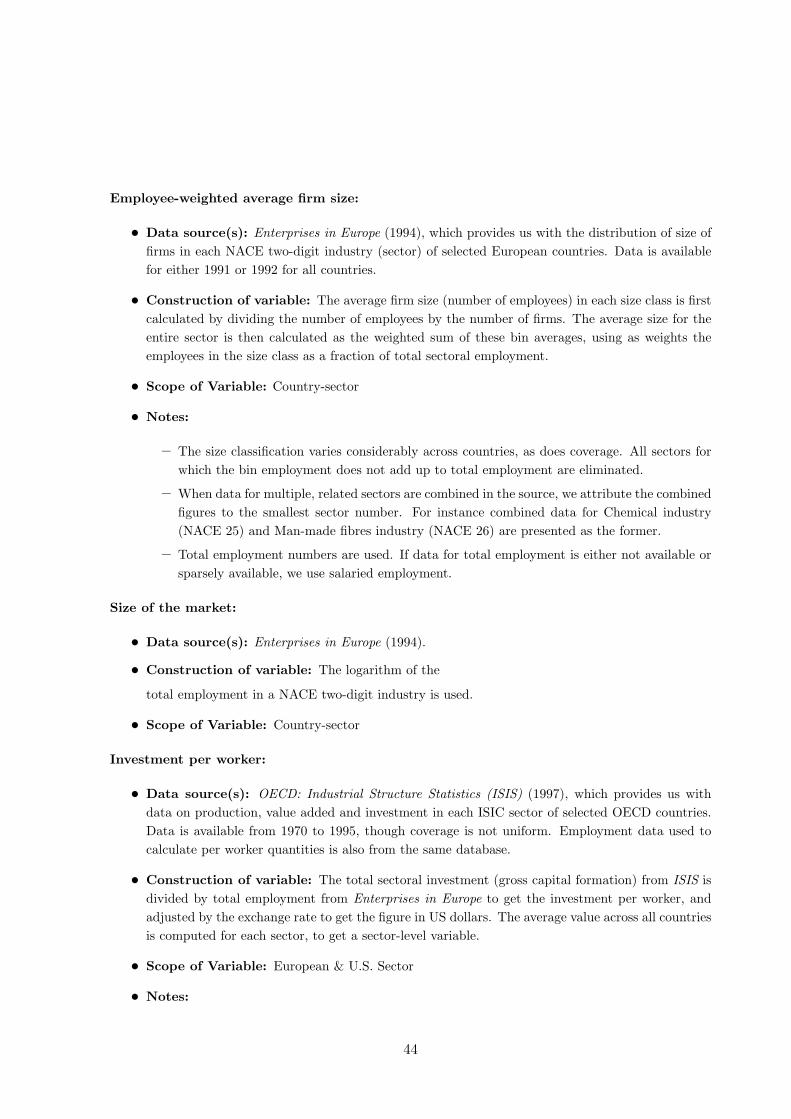
Employee-weighted average firm size:
• Data source(s): Enterprises in Europe (1994), which provides us with the distribution of size offirms in each NACE two-digit industry (sector) of selected European countries. Data is availablefor either 1991 or 1992 for all countries.
• Construction of variable: The average firm size (number of employees) in each size class is firstcalculated by dividing the number of employees by the number of firms. The average size for theentire sector is then calculated as the weighted sum of these bin averages, using as weights theemployees in the size class as a fraction of total sectoral employment.
• Scope of Variable: Country-sector
• Notes:
– The size classification varies considerably across countries, as does coverage. All sectors forwhich the bin employment does not add up to total employment are eliminated.
– When data for multiple, related sectors are combined in the source, we attribute the combinedfigures to the smallest sector number. For instance combined data for Chemical industry(NACE 25) and Man-made fibres industry (NACE 26) are presented as the former.
– Total employment numbers are used. If data for total employment is either not available orsparsely available, we use salaried employment.
Size of the market:
• Data source(s): Enterprises in Europe (1994).
• Construction of variable: The logarithm of the
total employment in a NACE two-digit industry is used.
• Scope of Variable: Country-sector
Investment per worker:
• Data source(s): OECD: Industrial Structure Statistics (ISIS) (1997), which provides us withdata on production, value added and investment in each ISIC sector of selected OECD countries.Data is available from 1970 to 1995, though coverage is not uniform. Employment data used tocalculate per worker quantities is also from the same database.
• Construction of variable: The total sectoral investment (gross capital formation) from ISIS isdivided by total employment from Enterprises in Europe to get the investment per worker, andadjusted by the exchange rate to get the figure in US dollars. The average value across all countriesis computed for each sector, to get a sector-level variable.
• Scope of Variable: European & U.S. Sector
• Notes:
44

– The use of investment per worker for capital per worker is based on the assumption thatthe economies studied were at their steady states. Direct data on capital per worker, at thesectoral level, is difficult to obtain for the countries being studied.
– The investment data is for the year closest to the one for employment data.
– Data for ISIC – Revision 2 classification is used wherever available; else, the data is for ISIC– Revision 3. These ISIC codes were translated to NACE codes; the translation used isavailable upon request. The ISIC data is available at the 3-digit level, and sometimes evenat the 4-digit level; this facilitates a fairly complete translation of codes.
– The market exchange rate (average over the year) provided by ISIS is used to convert invest-ment in local currency to US dollars.
Value added to sales:
• Data source(s): Enterprises in Europe (1994).
• Construction of variable: The total value added in a country-sector combination (thousandsof ECUs) is divided by reported turnover for that combination (also in thousands of ECUs).
• Scope of Variable: European Sector
Wages per worker:
• Data source(s): OECD: Industrial Structure Statistics (ISIS) (1997).
• Construction of variable: The total wages from ISIS is divided by total employment fromEnterprises in Europe to get the wages per worker, and adjusted by the exchange rate to get thefigure in US dollars. The average value across all countries is computed for each sector, to get asector-level variable.
• Scope of Variable: European & U.S. Sector
• Notes:
– The items on year of data, classification conversion, and the use of market exchange ratesmentioned under “capital intensity” apply here as well.
R & D intensity:
• Data source(s): OECD’s ANBERD Database.
• Construction of variable: The share of R&D done in that industry as a share of the country’stotal R&D is computed for the analogue of the NACE 2-digit sectors.
• Scope of Variable: European & U.S. Sector
• Notes:
– Unlike physical capital, we do not compute per worker intensity of R&D because R&D is anonrival input that impacts the whole firm.
45

External dependence:
• Data source(s): COMPUSTAT – Business Segment File, OECD: Industrial Structure Statistics(ISIS) (1997).
• Construction of variable: The fraction of capital expenditures that is financed externally forthe analogue of the NACE 2-digit sectors among publicly traded U.S. companies is multiplied bythe investment per worker in that sector for the European country. In other words, this is anestimate of external financing per worker in the given country-sector combination.
• Scope of Variable: Country-sector
• Notes:
– See Rajan and Zingales (1998a) for further details.
Utility & Transport sector:
• Data source(s): Enterprises in Europe (1994).
• Construction of variable: This is a dummy variable that is set to 1 if the NACE sector isone of Production and Distribution of Electricity (16), Railways (71), Air Transport (75), orCommunication (79).
• Scope of Variable: Sector dummy
Per capita income:
• Data source(s): Penn World Table (Mark 5.6), which provides us with country level data on realGDP, goverment expenditure, and human capital.
• Construction of variable: The logarithm of per capita GDP (“RGDPCH” in PWT) is used forthe relevant year.
• Scope of Variable: Country
Human capital:
• Data source(s): Barro and Lee’s dataset for a panel of 138 countries (1994).
• Construction of variable: The average schooling years in the total population over age 25, forthe year 1985, is used (“human85” in Barro and Lee).
• Scope of Variable: Country
• Notes:
– This is an attainment variable that changes very slowly over time. Therefore, the use of 1985data is not seen as a serious limitation.
Human capital inequality:
46
• Data source(s): Barro and Lee’s dataset for a panel of 138 countries (1994).
• Construction of variable:
Barro and Lee (1993) have data on the % of population over 25 in 4 categories of educationalattainment – none, primary, secondary, higher – for each country. They also have years of educationattainment of each type – PYR25, SYR25, and HYR25. We assign the following years of educationto the four-category frequency distribution mentioned above: 0, PYR25, PYR25+SYR25, andPYR25+SYR25+HYR25. The coefficient of variation is then computed the usual way and usedas a measure of human capital inequality. All human capital data is for the year 1985.
• Scope of Variable: Country
Judicial efficiency:
• Data source(s): Business International Corporation.
• Construction of variable: This variable is an assessment of the “efficiency and integrity of thelegal environment as it affects business, particularly foreign firms.” Data is found in a scale form,with scores ranging from zero to ten, where the lower scores mean lower efficiency levels.
• Scope of Variable: Country
• Notes:
– It is an average of the index between 1980 and 1983.
Patent protection:
• Data source(s): Ginarte and Park (1997).
• Construction of variable: Patent protection is an index that measures the strength of patentlaws, with higher values indicating greater protection.
• Scope of Variable: Country
• Notes:
– Ginarte and Park (1997) compute the index for 110 countries using a coding scheme applied tonational patent laws. The five aspects of patent laws examined were (1) the extent of coverage,(2) membership in international patent agreements, (3) provisions for loss of protection, (4)enforcement mechanisms, and (5) duration of protection. Each of these categories was scoredon a scale of 0 to 1, and the sum was the value of the index of patent protection, with highervalues indicating greater protection. We use value of the index computed in 1985.
Financial development:
• Data source(s): Center for International Financial Analysis and Research.
• Construction of variable: Financial development is proxied by a measure of accounting stan-dards. This variable measures the transparency of annual reports.
47

• Scope of Variable: Country
• Notes:
– See Rajan and Zingales (1998a) for further details.
48

References
Adelman, Morris A. 1955, “Concpet and Statistical Measurement of Vertical Integration”,in Business Concentration and Price Policy Princeton University Press, Princeton NJ.
Alchian, A. and H. Demsetz, 1972, “Production, Information Costs and Economic Organi-zation”, American Economic Review 777-705.
Audretsch, David B. and Talat Mahmood 1995, “New Firm Survival and the Technolog-ical Regime” , Review of Economics and Statistics 77:1, 97-103.
Bain, Joe S., 1956, Barriers to New Competition Harvard University Press, Cambridge, MA.
Baker, George, Robert Gibbons, and Kevin J. Murphy, (1997) “Implicit Contracts andthe Theory of the Firm,” Harvard Business School working paper.
Banz, Rolf W., 1981, “The Relationship Between Return and the Market Value of CommonStocks”, Journal of Financial Economics 9, 3-18.
Barro R. and J. Lee, 1993, “International Comparisons of Educational Attainment,” NBERWorking Paper.
Becker, Gary S., and Murphy, Kevin M. (1992). “The Division of Labor, CoordinationCosts, And Knowledge,” The Quarterly Journal of Economics, November 1992, 1137-1160.
Bresnahan, Timothy, F. and Peter C. Reiss (1991). “Entry in Monopoly Markets,” .Review of Economic Studies.
Campbell, J. and H. Hopenhayn (1999). “Market Size Matters,” University of ChicagoWorking Paper.
Caves, Richard E. (1998). “Industrial Organization and New Findings on the Turnover andMobility of Firms,” Journal of Economic Literature, December 1998, 1947-1982.
Caves, Richard E. and Thomas A. Pugel (1980). Intra-Industry Differences in Conductand Performance Monograph Series, New York University.
Coase, R., 1937, “The Nature of the Firm,” Economica 4:386-405.
Cohen, Wesley M. , and Klepper, Steven (1996). “Firm Size and the Nature of Innova-tion within Industries: The Case of Process and Product R&D,” The Review of Economicsand Statistics .
Davis, Steven J., and Henrekson, Magnus. (1997). “Explaining National Differences inthe Size and Industry Distribution of Employment,”
Working Paper, August 1997, The University of Chicago Graduate School of Business.
Fama, E. and M. Jensen (1983). “Separation of Ownership and Control,” Journal of Lawand Economics , June.
49
Gertler, Mark and Simon Gilchrist (1994). “Monetary Policy, Business Cycles, and theBehavior of Small Manufacturing Firms,” Quarterly Journal of Economics, 109: 309-341.
Ginarte, Juan Carlos and Walter G. Park (1997). “Determinants of Patent Rights: ACross-National Study,” mimeo, American University, Washington D.C.
Gollin, Douglas. (1998). “Nobody’s Business but My Own: Self Employment and SmallEnterprise in Economic Development,” Working Paper, June 1998, Williams College.
Grossman, S. and Hart, O. 1986, “The Costs and the Benefits of Ownership: A Theory ofVertical and Lateral Integration” Journal of Political Economy 691-719.
Harris, Milton and Artur Raviv 1990, “ The theory of capital structure ” Journal of Fi-nance 46, 297-355.
Hart, Oliver Firms, Contracts, and Financial Structure, (Oxford: Clarendon Press, 1995).
Hart, O. and J. Moore 1990, “Property Rights and the Nature of the Firm” Journal ofPolitical Economy 1119-1158.
Holmstrom, Bengt, 1999 “The Firm as a Subeconomy” Journal of Law, Economics andOrganization,15, no 1, 74-102.
Holmstrom, Bengt and J.Roberts 1998 “ The Boundaries of the Firm Revisited,” Journalof Economic Perspectives , 12: 73-94.
Hopenhayn, Hugo A. (1992). “Entry, Exit, and Firm Dynamics in Long Run Equilibrium,”Econometrica, September 1992, vol. 60, no. 5, 1127-1150.
Klein, Benjamin, Robert Crawford , and Armen Alchian. (1978). “Vertical Integra-tion, Appropriable Rents and the Competitive Contracting Process”, Journal of Law andEconomics, XXI (1978), 297-326.
Klepper, Steven (1996). “Entry, Exit, Growth, and Innovation over the Product Life Cycle,”American Economic Review, 86:3, 562-583.
Kremer, Michael. (1993). “The O-Ring Theory of Economic Development,” The QuarterlyJournal of Economics, August 1993, 551-575.
Jensen M. C. and W. Meckling. 1976, “Theory of the Firm: Managerial Behavior, AgencyCosts and Capital Structure”, Journal of Financial Economics 3: 305-360.
Jensen,M. and K.J. Murphy 1990, “Performance Pay and Top-Management Incentives”,Journal of Political Economy 98, 225-264.
Jovanovic, Boyan 1993, “The Diversification of Production”, Brookings Papers: Microeco-nomics, 197-247.
La Porta, R., Florencio, Lopez de Silanes, Andrei Shleifer, and Robert Vishny ,1997a, “The Legal Determinants of External Finance,” Journal of Finance, 52, 1131-1150.
La Porta, R., Florencio, Lopez de Silanes, Andrei Shleifer, and Robert Vishny ,1997b, “Trust in large organizations,” American Economic Review, 87:2, 333-338.
50

La Porta, R., Lopez-de-Silanes, F., Shleifer, A. and R. Vishny , 1998, “Law and Fi-nance”, Journal of Political Economy, 106, 1113-1155.
Lucas, Robert E., Jr. (1978). “On the Size Distribution of Business Firms,” Bell Journalof Economics, vol 9, 508-523.
Mata, Jose. (1996). “Markets, Entrepreneurs, and the Size of New Firms,” Economic Letters,52:1, 89-94.
Pagano, Marco, and F. Panetta and L. Zingales, , 1998, “Why Do Companies Go Pub-lic? An Empirical Analysis”] Journal of Finance, 53: 27-64
Pashigian, B. Peter, , 1968, “Market Concentration in the United States and Great Britain”] Journal of Law and Economics,, 11: 299-319.
Pakes, Ariel, and Richard Ericson, , forthcoming, “Empirical Implications of AlternativeModels of Firm Dynamics”, Journal of Economic Theory.
Penrose, E. T., 1959, Theory of the Growth of the Firm J. Wiley & Sons, New
York.
Petersen, M. and R. Rajan, 1997, Review of Financial Studies, 10:1, 661-691.
Rajan, R. and L. Zingales, 1995, ”What Do We Know about Capital Structure? SomeEvidence From International Data” Journal of Finance , 50: 1421-1460.
Rajan, R. and L. Zingales, 1998a, “Financial Dependence and Growth” The American Eco-nomic Review 88: 559-586.
Rajan, R. and L. Zingales, 1998b, “Power in a Theory of the Firm,” Quarterly Journal ofEconomics CXIII: 387-432.
Rajan, R. and L. Zingales, forthcoming, “The Firm as a Dedicated Hierarchy: A Theoryof the Origins and Growth of Firms,” Quarterly Journal of Economics.
Ringleb and Wiggins (1990) “Liability and Large-Scale, Long-Term Hazards,” Journal ofPolitical Economy 98.
Rosen, Sherwin. (1982). “Authority, Control, and the Distribution of Earnings,” Bell Journalof Economics, Autumn 1982, 311-323.
Shepard, Andrea. (1987). “Licensing to Enhance Demand for New Technologies,” RandJournal of Economics, 18, 360-368.
Smith, Adam (1776). The Wealth of Nations : An Inquiry into the Nature and Causes
Stigler, Geroge, 1968, ‘The Organization of Industry, Irwin, Homewood: IL.
Sutton, John, 1991, ‘Sunk Costs and Market Structure: Price Competition, Advertising, andthe Evolution of Concentartion, MIT Press, Cambridge: MA.
Sutton, John (1997). “Gibrat’s Legacy,” Journal of Economic Literature, 35:1, 40-59.
51

Williamson, O., 1975, ‘Market and Hierarchies: Analysis and Antitrust Implications, TheFree Press, New York.
Williamson, O., 1985, ‘The Economic Institutions of Capitalism, The Free Press, New York.
52