what comes out, must go in
TRANSCRIPT

pg.1
Macronutrient balance assessment of transitioning home garden systems in southern Ethiopia
NadineGalle(10850155)
Dr.L.H.CammeraatDr.G.W.J.vandeVenDr.K.K.E.DescheemaekerDrs.B.T.MellisseDr.B.Jansen
MasterEarthScience-UniversityofAmsterdamInstituteforBiodiversityandEcosystemDynamicsMSc.Thesis|UvA5264MTR30Y|WURPPS-80430
EnvironmentalManagement|30ECTS
October2015-April2016
April1,2016
Must Go In: What Comes Out,

pg.2
MAINAPPLICANT
NadineGalle
Schoolmeesterstraat24
1053MCAmsterdam
TheNetherlands
+31651554818
UniversityofAmsterdamInstituteforBiodiversityandEcosystemDynamics(IBED)Amsterdam,TheNetherlands5264MTR30YMasterThesisEarthSciences
EnvironmentalManagementTrack
StudentNo.10850155
Supervisor:Dr.L.H.(Erik)Cammeraat
Secondreader:Dr.B.(Boris)Jansen
WageningenUniversityandResearchCenterPlantProductionSystems(PPS)Wageningen,TheNetherlandsPPS-80430MasterThesisPlantProductionSystems
RegistrationNo.920610-249-130
Supervisor:Dr.G.W.J.(Gerrie)vandeVen
Co-Supervisor:Dr.K.K.E.(Katrien)Descheemaeker
HawassaUniversityHawassaUniversityCollegeofAgriculture
WondoGenetCollegeofForestryandNaturalResources
Hawassa,Sidama,Ethiopia
Dailysupervisor:Drs.B.T.(Beyene)Mellisse
IdeclarethattheworkIamsubmittingforassessmentcontainsnosectioncopiedinwholeorinpartfromanyothersourceunlessexplicitlyidentifiedinquotationmarksandwithdetailed,completeandaccuratereferencing.
Signed,NadineJ.Galle

pg.3
The cattle is only as good as the pasture in which it grazes.
EthiopianProverb

pg.4

pg.5
ABSTRACT
WhatComesOut,MustGoin:Macronutrientbalance
assessmentoftransitioninghomegardensinsouthernEthiopia
ByNadineGalle
Smallholder-operated home garden agroforestry systems are the backbone of Ethiopia’s
agricultural sector. In southern Ethiopia, the enset (Enset ventricosum) and coffee (Coffeaarabica) based home gardens have sustainedmillions of livelihoods for centuries, combining
subsistence agriculture with a small cash crop income. Enset withstands drought, produces
largevolumesoffoodperunitareaandisexclusivelyfertilizedwithorganicmatter,aninternal
input. The resilience of these systems relies on efficient nutrient cycling and multi-species
composition. However, population growth induced land fragmentation has led to rapid
replacement of enset and coffeewith khat (Catha edulis), a lucrative cash crop and popularstimulant. Khat has expanded at the expense of land allocated to enset and coffee and
threatenswell-established internal nutrient flowswithin home gardens. The transition called
forthedefinitionoffivedistincthomegardentypes:fourenset-oriented(enset-based,enset-
coffee,enset-cereal-vegetable,andenset-livestock)andonekhat-based.Thispaperdescribes
macronutrient (NPK)balances calculatedat componentand farm level inSidamaandGedeo,
southern Ethiopia. Fields with the same or similar crop were grouped into five farm
‘components’. Livestockwas also a component. Representative farms for each home garden
type were conceived based on component land use. Processes quantified included mineral
fertilizer, organic matter, internal fodder, external fodder and harvested products, removed
crop residues,household livestockconsumption,harvestedproducts soldoff-farmandwhole
livestockandlivestockproductssoldoff-farm.Component levelbalancesaddedvaluedtothe
study by permitting comparison of internal flows, demonstrating the inherent diversity and
complexitywithinhomegardensystems.Nutrientbalancesat the farm levelshowedpositive
nitrogen (N) balances, fluctuating phosphorus (P) balances and deficient potassium (K)
balances, amongst all representative farms. Component level balances were similar but
revealedthemostsevereKdeficiencieswereinthekhatcomponent.Measurementstoaddress
nutrientdeficiencies,suchasenset leavesascropresidueandpropermanurehandling,were
presentedandtheurgencytodevelopstrategiestoreversekhatexpansionattheexpenseof
ensetwasstressed.
Keywords: nutrient balance, nutrient management, nitrogen, phosphorus, potassium, home
garden,agroforestry,Enseteventricosum(enset),Coffeaarabica(coffee),Cathaedulis(khat)

pg.6

pg.7
TABLEOFCONTENTSMAINAPPLICANT 2ABSTRACT 5COVERPHOTO 10PROJECTTITLE 11GLOSSARY 11ACRONYMSANDABBREVIATIONS 12LISTOFTABLES,FIGURESANDEQUATIONS 13ACKNOWLEDGEMENTS 17
1.INTRODUCTION 18
1.1RESEARCHWITHINTHECASCAPEPROJECT 19
1.2SOCIETALANDSCIENTIFICSIGNIFICANCE 20
1.3OUTLINEOFTHETHESIS 21
2.RESEARCHOBJECTIVESANDQUESTIONS 223.THEORETICALFRAMEWORK 23
3.1DEFINITIONOFCONCEPTUALTERMS 23
3.1.1NUTRIENTBALANCES 233.1.2COMPONENTLEVELNUTRIENTBALANCE 243.1.3NUTRIENTFLOWS 24
3.2INFLOWSINTOTHEHOMEGARDENSYSTEM 26
3.2.1MINERALFERTILIZER(IN1) 263.2.2EXTERNALLIVESTOCKFODDER(IN4) 27
3.3OUTFLOWSFROMTHEHOMEGARDEN 28
3.3.1REMOVALINHARVESTEDPRODUCTSSOLDOFF-FARM(OUT5) 283.3.2LIVESTOCKOUTPUT(OUT3) 28
3.4INTERNALFLOWSINTHEHOMEGARDENSYSTEM 28
3.4.1ORGANICMATTER(IN2) 283.4.2INTERNALLIVESTOCKFODDER(IN3) 293.4.3REMOVALINALLHARVESTEDPRODUCTS(OUT1) 293.4.4REMOVALINCROPRESIDUES(OUT2) 303.4.5HOUSEHOLDLIVESTOCKCONSUMPTION(OUT4) 30

pg.8
4.METHODOLOGY 31
4.1STUDYAREA 31
4.2FARMTYPOLOGIES 34
4.3DATACOLLECTION 34
4.4EXPERIMENTALDESIGN 35
4.4.1THEREPRESENTATIVEFARM 354.4.2QUANTIFYINGNUTRIENTFLOWS 374.4.3MACRONUTRIENTINPUT 384.4.4MACRONUTRIENTOUTPUT 404.4.5THEHARVESTINDEX 414.4.6THEENSETEXCEPTION 414.4.7COMPONENTLEVELANDFARMLEVELMACRONUTRIENTBALANCE 43
4.5ETHICALCONSIDERATIONS 45
5.RESULTS 46
5.1THEREPRESENTATIVEFARMS 46
5.2FARMSIZE 48
5.3LIVESTOCKPOPULATION 50
5.4COMPONENTLEVELNUTRIENTBALANCEASSESSMENT 51
5.4.1ENSET-BASED 51
5.4.2ENSET-COFFEE 54
5.4.3ENSET-CEREAL-VEGETABLE 57
5.4.4ENSET-LIVESTOCK 60
5.4.5KHAT-BASED 63
5.5FARMLEVELNUTRIENTBALANCEASSESSMENT 68
5.6RESULTSPERHECTARE 72
6.DISCUSSION 75
6.1UNCERTAINTIES 75
6.2INTERPRETATIONANDDISCUSSIONOFRESULTS 77
6.2.1FARMSIZE 78

pg.9
6.2.2FARMLEVELNUTRIENTBALANCES 78
6.2.3COMPONENTLEVEL:ENSET 80
6.2.4COMPONENTLEVEL:COFFEEANDCOFFEE+ENSETINTERCROPPING 81
6.2.5COMPONENTLEVEL:ANNUALCEREALSANDVEGETABLES 82
6.2.6COMPONENTLEVEL:KHAT 82
6.2.7COMPONENTLEVEL:LIVESTOCK 84
6.3METHODOLOGICALIMPROVEMENTSANDSUGGESTIONSFORFURTHERRESEARCH 86
6.4MANAGEMENTRECOMMENDATIONS 87
6.4.1ENSETLEAVESASCROPRESIDUEORCOMPOSTADDITIVE 87
6.4.2PROPERMANUREHANDLING 88
6.4.3NUTRIENT-RELATEDCONSEQUENCESOFKHATEXPANSION 89
7.CONCLUSIONS 908.REFERENCES 927.APPENDICES 99
7.1CONVERSIONTABLE 99
7.2NUTRIENTCONTENT 100
7.3SURVEY:INPUTSANDOUTPUTSOFHOMEGARDENTYPESINSOUTHERNETHIOPIA 102

pg.10

pg.11
COVERPHOTO
Thephotographonthefrontcovershowstwoboysamongsttheirfamily’straditionalhome
gardenintheWondoGenetworeda.PhotobyNadineGalle(October2015).
ThephotographonpagetwoillustratesaviewofahomegardensystemintheMalgaworeda.
PhotobyNadineGalle(December2015).
PROJECTTITLE
“WhatComesOut,MustGoin:Macronutrientbalanceassessmentoftransitioninghome
gardensystemsinsouthernEthiopia”
GLOSSARYAgroforestry Theintentionalintegratedlandusemanagementsystem,whichcombines
treesandshrubswithcropsand/orlivestocktocreateenvironmental,
socialandeconomicbenefits.
Birr(ETB) TheEthiopiancurrency.
Bula Producedfromtheinnerpartofensetandproducedintofinepowderforhigh
qualitypancakes,porridgeordumplings.
Chartercity Acitywherethegoverningsystemisdefinedbyacity’scharter
document,ratherthanbyregionalornationallaws.InEthiopia,chartered
citiesbelongtothefirstlevelofadministrativedivision(sameaskililoch).
Fertilizer Anyorganicorinorganicmaterialofnaturalorsyntheticoriginaddedto
soilwiththeintenttosupplyoneormoreplantnutrientsessentialto
growth.Kebele Ethiopia’sfourthandlowestadministrativedivision.Kebeleshavesimilar
functiontoamunicipality,neighbourhoodsorward.
Kililoch Ethiopia’sfirstlevelofadministrativedivision.Since1995,Ethiopiais
constitutionallymadeupofnineethicallybasedregionalstates.The
word“kilil”means“reservation”or“protectedarea”.
Kocho Bulkoffermentedstarchfromtheensetstem,oftenmadeintoapancakefrom
themixtureofscrappedensetsheaths.
Woreda Ethiopia’sthirdlevelofadministrativedivision.Equivalenttoadistrict.
Zone Ethiopia’ssecondlevelofadministrativedivision.InEthiopia,kililochare
furthersubdividedinto68zones,thesearefurtherdividedintoworedas.
Zurba Abunchoffreshkhatleaves,weighingapproximately1kg.

pg.12
ACRONYMSANDABBREVIATIONSACV Annualcerealsandvegetables
AGP AgriculturalGrowthProgramme
BNF Biologicalnitrogenfixation
CASCAPE Capacitybuildingforscalingupofevidence-basedbestpracticesinagriculturalproductionin
EthiopiaCSA CentralStatisticalAgencyofEthiopia
DAP DiammoniumphosphateDCM DevelopmentofCompetitiveMarkets(Ethiopia)
DEP AtmosphericdepositionEATA EthiopiaAgriculturalTransformationAgency
ECI Ensetandcerealintercropping
ESC EthiopiaSugarCorporation
ETB EthiopianBirr
f1 Nutrientflow:feedstuffstakenfromfrontgrazingyard
f2 Nutrientflow:cowdungleftinfrontgrazingland
f3 Nutrientflow:milkandmeatconsumedbythefamily
f4 Nutrientflow:collectionoffarmyardmanure
f5 Nutrientflow:applicationoffarmyardmanureindifferentlandusetypef6 Nutrientflow:feedstufftakenfromdifferentlandusetypebylivestockf7 Nutrientflow:householdwasteaddedtomanureheapf8 Nutrientflow:familyconsumptionofbothperennialandannualcropsFGB Farm-GateNutrientBalance
FYM Farmyardmanure
GDP GrowthDomesticProduct
GOE GovernmentofEthiopia
GTP GrowthandTransformationPlan
HwU HawassaUniversity
IBED InstituteforBiodiversityandEcosystemDynamics
IN1 Macronutrientinflow:mineralfertilizer
IN2 Macronutrientinflow:organicmatter
IN3 Macronutrientinflow:internallivestockfodder
IN4 Macronutrientinflow:externallivestockfodder
L1 Lossesfromfrontgrazinglandbyleaching,volatilizationanderosion
L2 Lossesfromlivestock
L3 Lossesfromthemanureheapbyleachingandvolatilization
L4 Lossesduringapplicationofmanuretofields
L5 Lossesfromthehomegardenfieldsbyleachingandvolatilization
MSA MultivariateStatisticalAnalysis
NPK Nitrogen,PhosphorusandPotassium
NUE NutrientUseEfficiencyOUT1 Macronutrientoutflow:removalinallharvestedproducts
OUT2 Macronutrientoutflow:removalincropresidues
OUT3 Macronutrientoutflow:livestockoutput
OUT4 Macronutrientoutflow:householdlivestockconsumption
OUT5 Macronutrientoutflow:removalinharvestedproductssoldoff-farm
SNNPR SouthernNations,NationalitiesandPeoples’Region
TLU TropicalLivestockUnit
TSP Triplesuperphosphate
UvA UniversityofAmsterdamWUR WageningenUniversityandResearchCentre

pg.13
LISTOFTABLES,FIGURESANDEQUATIONSTables
Table4.1 Agro-ecologicalzoneswithcharacterizingaltitude,rainfall,temperatureand
predominantperennialcrops(Mellisseetal.,inprep.).
Table4.2 TropicalLivestockUnits(TLU)conversionchart(FAO,1987).
Table4.3 Macronutrientcontent(mean±SD)forthefourinputprocessesemployedin
calculatingnutrientbalances.
Table4.4 Outputprocessandtheirrespectiveoutputs.
Table4.5 Ensetoutputdrymattercontent(%DM)andnutrientcontents(mean±SD)(HU
AgriculturalCollegeSoilLab,2015;WondoGenetCollegeSoilLab,2015).
Table5.1 RegressionequationsandR-SquaredvaluesforGPSmeasuredlandsize
(ha,x-axis)vs.farmerreportedlandsize(ha,y-axis)bycomponent.
Table5.2 Componentlevelmacronutrientinflows(kg/farm/yr)andtotalsumofnutrient
(TSN)frommineralfertilizers(IN1),organicmatter(IN2),internalfodder(IN3)
andexternalfodder(IN4)(mean±SD)byfarmcomponent,acrossfive
representativefarms.
Table5.3 Componentlevelmacronutrientoutflows(kg/farm/yr)andtotalsumofnutrient
(TSN)fromremovalinharvestedproducts(OUT1),removalincropresidues
(OUT2),wholelivestockandlivestockproductssoldoff-farm(OUT3)and
householdlivestockconsumption(OUT4)(mean±SD)byfarmcomponent,across
fiverepresentativefarms.
Table5.4 Farmlevelmacronutrientinflows(kg/farm/yr)andtotalsumofnutrient(TSN)
frommineralfertilizers(IN1)andexternalfodder(IN4)(mean±SD)byfarm
component,acrossfiverepresentativefarms.
Table5.5 Farmlevelmacronutrientoutflows(kg/farm/yr)andtotalsumofnutrient(TSN)
fromremovalinharvestedproductssoldoff-farm(OUT5)andwholelivestock
andlivestockproductssoldoff-farm(OUT3)(mean±SD)byfarmcomponent,
acrossfiverepresentativefarms.
Table5.6 Componentlevelmacronutrientinflows,outflowsandbalances(kg/ha/yr)by
farmcomponent,acrossfiverepresentativefarms.
Table5.7 Farmlevelmacronutrientinflows,outflowsandbalances(kg/ha/yr)byfarm
component,acrossfiverepresentativefarms.
Table6.1 Nutrientbalanceanalysisinterpretationcriteria(expressedaskgofnutrientlost
(oradded)/ha/yr.
Table6.2 Farmnutrientbalances(kg/ha/yr)byrepresentativefarm,excludinglivestock
component.
Table6.3 Farmnutrientbalances(kg/ha/yr)fordifferenthouseholdgroups(Eliasetal.,
1998;adaptedfromRoyetal.,2013).
Table6.4 Ensetcomponentnutrientbalances(kg/ha/yr)byhomegardentype.
Table6.5 Coffeeandenset+coffeeintercropping(ECI)componentnutrientbalances
(kg/ha/yr)byhomegardentype.

pg.14
Table6.6 Annualcerealandvegetable(ACV)componentnutrientbalances(kg/ha/yr)by
homegardentype.
Table6.7 Khatcomponentnutrientbalances(kg/ha/yr)byhomegardentype.
Table6.8 Livestockcomponentnutrientbalances(kg/farm/yr)byhomegardentype.
Table6.9 Nutrientcomposition(%)(indrymatter)ofmanure(Eliasetal.,1998),Central
Kenyancompost(Lekasietal.,2003;Kimani&Lekasi,2004)andcompost(this
study).
Figures
Figure1.1 Fromlefttoright:1)thetraditionalhomegardenwithgrazinglandinthe
foregroundandbehindthat,thehomestead,thenensetinfieldsand
coffee/annualcerealsandvegetable/khatoutfields(Galle,2015),2)Ensetplants,
withDrs.BeyeneMellisseandourtranslatorforscale(Galle,2015),3)Women
harvestingtheensetplant(Mellisse,2015),4)Bunches(zurba)offreshkhat
leaves(CCTVAfrica,2014).
Figure3.1 Schematicmodelofnutrientinputsandoutputsacrossthefivehomegarden
types,includinginputs:atmosphericdeposition(DEP),biologicalnitrogen
fixation(BNF),purchasedfoodcrops,livestockandfarminputs(Market),cattle
whicharetakenfromotherfarmsforfatteningpurposes(Fat)(e.g.feedingthe
cattleforthreemonthsandthenreturningthemtotheowner).Themodelalso
showsoutputs:lossesfromfrontgrazinglandbyleaching,volatilizationand
erosion(L1),lossesfromlivestock(L2),lossesfromthemanureheapbyleaching
andvolatilization(L3),lossesduringapplicationofmanuretofields(L4),losses
fromthehomegardenfieldsbyleachingandvolatilization(L5).Nutrientflowson
individualhomegardeninclude:feedstuffstakenfromfrontgrazingyard(f1),
cowdungleftinfrontgrazingyard(f2)(especiallyduringdaytimesinceanimals
aretiedupin grazingyard),milkandmeatconsumedbythefamily(f3),
collectionoffarmyardmanure(FYM)(f4),applicationofFYMindifferentland
usetype(f5),feedstufftakenfromdifferentlandusetype(especially,enset
leaves)bylivestock(f6),householdwasteaddedtomanureheap(f7),family
consumptionofbothperennialandannualcrops(f8)(Mellisseetal.,inprep.).
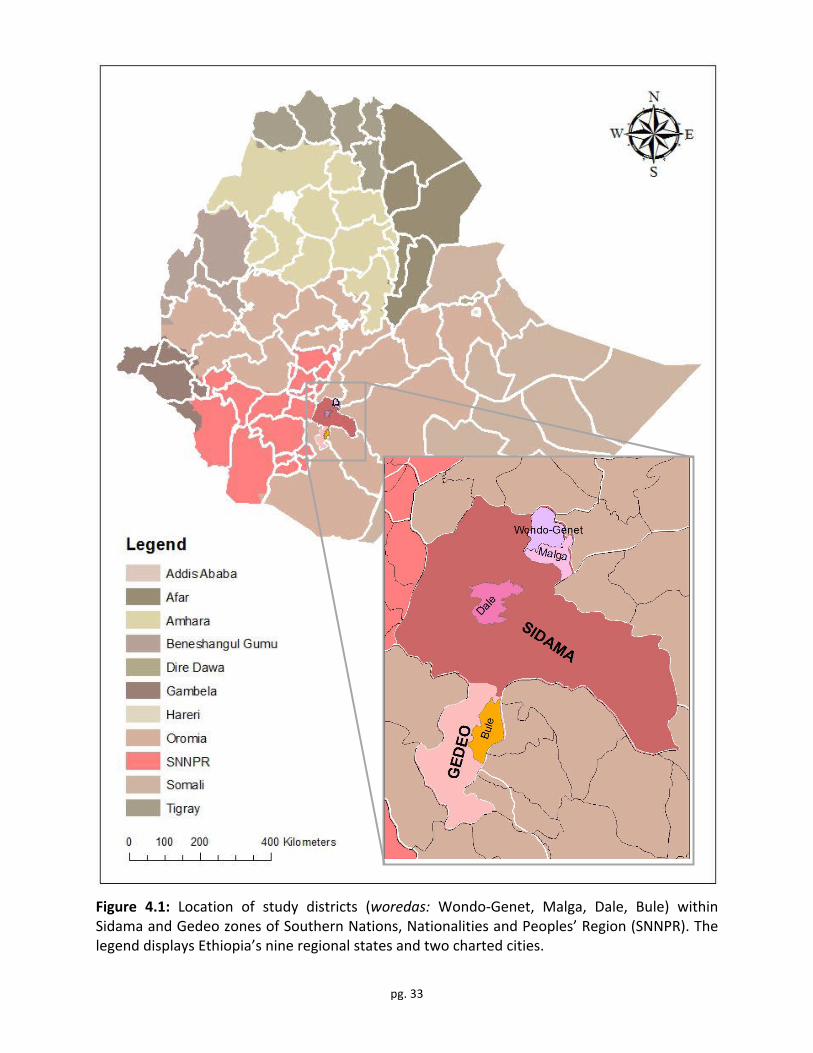
Figure4.1 Locationofstudydistricts(woredas:Wondo-Genet,Malga,Dale,Bule)within
SidamaandGedeozonesofSouthernNations,NationalitiesandPeoples’Region
(SNNPR).ThelegenddisplaysEthiopia’snineregionalstatesandtwocharted
cities.
Figure4.2 Conceptualworkflowshowingstepsandformulaeusedtoextractmacronutrient
contentfrominput.
Figure4.3 Ageneralnutrientflowdiagramofahomegardensystem.Theblackdashedline
denotesthecomponentlevelboundaryofthefarm.Inflowsandoutflows
outsidetheboundaryrepresentthoseatthefarmlevel.Thin,graydashedlines
denoterelationshipsexcludedfromthestudy.Labelsinitalicsignifyfactorsnot
quantified,forwhichitwasstillworthidentifyingtheirplacewithinthesystem.
Figure5.1 Landuseofrepresentativefarmsexpressedinareashares(%).

pg.15
Figure5.2 GPSmeasuredlandsize(ha)vs.farmerreportedlandsize(ha)byfarm
component.
Figure5.3 Areashareofgrazingland(ha)ineachrepresentativefarmvs.averageTropical
LivestockUnit(TLU)foreachrepresentativefarm,byhomegardentype.
Figure5.4 Componentlevelnutrientinflows,outflowsandbalancesforN,PandK
(kg/farm/yr)foranenset-basedrepresentativefarm.
Figure5.5 Nutrientflows(kg/farm/yr)thatinfluencesthenutrientbalanceofanenset-
basedsystem.Theasterisk(*)afterorganicmatter(IN2)denotesthatthisinput
likelycamefromanexternalsource,as0.43TLUcouldnothaveproducedthis
muchcompost.Theblackdashedlinedenotesthecomponentlevelboundaryof
thefarm.Inflowsandoutflowsoutsidetheboundaryrepresentthoseatthefarm
level.Thegraydashedlinesdenoterelationshipswhichwereexcludedfromthe
study.Labelsinitalicsignifyfactorsnotquantified,forwhichitwasstillworth
identifyingtheirplacewithinthesystem.
Figure5.6 Nutrientflows(kg/farm/yr)thatinfluencesthenutrientbalanceofanenset-
basedsystem.Theasterisk(*)afterorganicmatter(IN2)denotesthatthisinput
likelycamefromanexternalsource,as0.43TLUcouldnothaveproducedthis
muchcompost.Theblackdashedlinedenotesthecomponentlevelboundaryof
thefarm.Inflowsandoutflowsoutsidetheboundaryrepresentthoseatthefarm
level.Thegraydashedlinesdenoterelationshipswhichwereexcludedfromthe
study.Labelsinitalicsignifyfactorsnotquantified,forwhichitwasstillworth
identifyingtheirplacewithinthesystem.
Figure5.7 Nutrientflows(kg/farm/yr)thatinfluencesthenutrientbalanceofanenset-
coffeesystem.Theblackdashedlinedenotesthecomponentlevelboundaryof
thefarm.Inflowsandoutflowsoutsidetheboundaryrepresentthoseatthefarm
level.Thegraydashedlinesdenoterelationshipswhichwereexcludedfromthe
study.Labelsinitalicsignifyfactorsnotquantified,forwhichitwasstillworth
identifyingtheirplacewithinthesystem.
Figure5.8 Componentlevelnutrientinflows,outflowsandbalancesforN,PandK
(kg/farm/yr)foranenset-cereal-vegetablerepresentativefarm.
Figure5.9 Nutrientflows(kg/farm/yr)thatinfluencesthenutrientbalanceofanenset-
cereal-vegetablesystem.Theblackdashedlinedenotesthecomponentlevel
boundaryofthefarm.Inflowsandoutflowsoutsidetheboundaryrepresent
thoseatthefarmlevel.Thegraydashedlinesdenoterelationshipswhichwere
excludedfromthestudy.Labelsinitalicsignifyfactorsnotquantified,forwhich
itwasstillworthidentifyingtheirplacewithinthesystem.
Figure5.10 Componentlevelnutrientinflows,outflowsandbalancesforN,PandK
(kg/farm/yr)foranenset-livestockrepresentativefarm.
Figure5.11 Nutrientflows(kg/farm/yr)thatinfluencesthenutrientbalanceofanenset-
livestocksystem.Figure5.12 Componentlevelnutrientinflows,outflowsandbalancesforN,PandK
(kg/farm/yr)forakhat-basedrepresentativefarm.

pg.16
Figure5.13 Nutrientflows(kg/farm/yr)thatinfluencesthenutrientbalanceofakhat-based
system.Theblackdashedlinedenotesthecomponentlevelboundaryofthe
farm.Inflowsandoutflowsoutsidetheboundaryrepresentthoseatthefarm
level.Thegraydashedlinesdenoterelationshipswhichwereexcludedfromthe
study.Labelsinitalicsignifyfactorsnotquantified,forwhichitwasstillworth
identifyingtheirplacewithinthesystem.
Figure5.14 Farmlevelnutrientinflows,outflowsandbalancesforN,PandK(kg/farm/yr)
acrossrepresentativefarms.
Equations
Equation4.1 Landusepercentageforeachcomponent.Equation4.2 Averagecomponentpercentagestoequal100.
Equation4.3 Macronutrientamountfromoutput.Equation4.4 Totalsumofnutrient(TSN)foreachcomponent.
Equation4.5 Harvestindex.Equation4.6 Meanmacronutrientamountfromensetoutput.
Equation4.7 Macronutrientbalance.

pg.17
ACKNOWLEDGEMENTSThisresearchcouldnothavebeenrealizedwithoutthehelpofseveralinspiringpeople.Iwould
like to express my sincere gratitude towards Dr. Gerrie van de Ven and Dr. Katrien
Descheemaekerfortheirinterest,guidanceandwelcomingtoPlantProductionSystems(PPS).
InEthiopia,thankyoutomydailysupervisoratHawassaUniversity,Drs.BeyeneMellisse.This
thesiswouldnothavebeenpossiblewithoutyouradviceandfeedback,thankyoufortakingan
earthscientistunderyouragriculturalwing.Tocarryoutthisresearch,thankyoutothefarmers
across the Wondo Genet, Malga, Bule and Dale woredas, for welcoming this “faranji”
(foreigner)intoyourfarmandsharingyourvastknowledge.
AspecialthankstomysupervisorattheUniversityofAmsterdam,Dr.ErikCammeraat.Thank
youfortrustingmeintherealizationofthisproject.Iwouldalsoliketoextendmygratitudeto
Dr. Boris Jansen, who will act as my co-assessor and second reader at the University of
Amsterdam.Moreover,Iwanttothankmyfellowearthscientistsforthedetailedfeedbackon
myproposalandresearchworkshoppresentations.Constructivefeedback is invaluabletothe
thesisprocess.AtWageningenUniversity,IowegratitudetofellowPPSstudentsforchallenging
myproposalandinspiringmetopersevere.
Finally,aspecialmentiontoJolanda,WillemandNina.Wemaybespreadacrosstheglobebut
withyourcombinedsupport,mydreamsfeelinfinitelywithinreach.
NadineJoanneGalle
Amsterdam

pg.18
1.INTRODUCTION
Africa’ssmallholdersdominatetheagriculturalsector,whichremainsatthebasisofdeveloping
economies. InEthiopia,agricultureaccounts fornearly46%ofgrossdomesticproduct (GDP),
73% of employment and almost 80% of foreign export earnings (Ethiopia Agricultural
TransformationAgency [EATA],2014).Nationwide foodsecurityandEthiopian livelihoodsare
profoundly relianton the successof this sector. In theSidamaandGedeo zonesof southern
Ethiopia,theenset(Enseteventricosum)andcoffee(Coffeaarabica)basedhomegardenshave
sustainedmillionsoflivelihoodsforcenturies.Ensetisaspeciesofthebananafamilywherethe
pseudostem (not the fruit) is consumed. Its edible products kocho and bula are the region’s
staple food and its leaves offer construction material and protein-rich livestock feed. Enset
cultivationrequiresrelatively lowexternal inputs,hasa large foodperunitareacapacityand
holds a distinct resistance to drought. Coffee has long reigned as the dominant cash crop in
theseparts. In2005,according to theCentralStatisticalAgencyofEthiopia (CSA,2007), total
coffeesuppliedtomarketfromSidamaandGedeowas63,562tons,whichaccountedfor63%
oftheregional(SouthernNations,NationalitiesandPeoples’Region[SNNPR])and23%ofthe
nationalcoffeeproduction.
Owingtothetwodominantperennialcrops,thesetraditionalhomegardensareoftenreferred
toas ‘enset-coffee’homegardens.Thesesystemsarecharacterizedbythe farmingofannual
and perennial agricultural crops and livestock in close association with trees and/or shrubs
(Abebe, 2005; Kippie, 2002). Ninety percent of Ethiopian smallholders practice the home
garden system, typically cultivating less than one hectare. Despite their small size, home
gardens support dense populations, ensure consistent availability of multiple products and
generate employment and income through multi-species integration (Kumar & Nair, 2004).
Homegardenshavelongbeenestablishedasstablefarmingsystemsmanagedbyfamilylabour
with low external inputs. Efficient nutrient cycling within farms, offered by multi-species
composition,conservationofbio-culturaldiversityandproductdiversification,aresomeofthe
key factors contributing to the stability of these systems in SNNPR, oneof themost densely
populatedregionsinEthiopia(Abebe,2005).
Inrecentdecades,thetrendofhomegardenchangedrivenbyincreasingpopulationpressure
inducedlandfragmentation,hasledtorapidreplacementofensetandcoffeewithkhat(Cathaedulis) (Mellisse et al., in prep.). Khat, a lucrative cash crop grown for its financial gain and
chewed for its stimulating effects, has expanded at the expense of land allocated to enset,
coffeeandinsomecasesotherfoodcrops(e.g.cereals)andcashcrops(e.g.vegetables)(Abebe
etal.,2010).Comparedtocoffee,khatgenerateshigherfinancialreturns,useslesswaterand
canbeharvestedmultiple timesayear.Mellisseetal. (inprep.) reported that thecombined
area share of enset and coffee coveredmore than 45% of the farms in four study districts
(WondoGenet,Melga,BuleandDale)ofSidamaandGedeozonesin1991.Twodecadeslaterit
fellbelow25%inbothWondoGenetandMelga,whiletheshareofkhatrosefrom7%and5%
in 1991 to 36% and 33% in 2013, respectively (Mellisse et al., in prep.). Dale increased khat
shareby0.9%in1991to9%in2013.Incontrast,Buleexperiencedanexpansionratesolowit

pg.19
hardlywarrantsmention.Nonethelessitisevidenttheintroductionofkhatinthestudyarea’s
homegardensproducedrapidchangeinitscroppingandlandusepatterns.
The transition has called for the definition of five distinct home garden types: four enset-
oriented(enset-based,enset-coffee,enset-cereal-vegetable,andenset-livestock)andonekhat-
based. Enset-oriented farms rely heavily on internal inputs of organicmatter in the form of
compost.Farmscultivatingcereals,vegetablesandkhataremoredependentonexternalinputs
ofmineralfertilizers.Inadditiontoreleasingnutrients,compostimprovessoilstructureandits
water-holding capacity. Thesewell-established internal nutrient flows arewhat sustain these
homegardens;shiftingtoexternalinput-onlycropscouldaltertheseflows,inducedeficiencies
ofnutrientslackinginmineralfertilizersandimplicatethelong-termstabilityofthesesystems.
It is argued the future of Sidama and Gedeo agriculture hinges on the expansion of khat
monoculture (Mellisse et al., in prep.). Intensification without adequate restoration of soil
nutrientsupplymaythreatenthistransition’ssustainability.Ofthechemicalprocessesinvolved
in soil degradation, nutrient depletion is one of the most important as nutrient stocks are
central to crop production (Syers, 1997). Nutrient ‘hotspots’ can reveal depletion, or may
indicateanexcessofunusednutrientswhichcouldbebetterutilizedinotherareasofthefarm.
Theonceubiquitousenset-coffeehomegardenhastransitionedintofivedistincthomegarden
types.Thedividewithinaconfinedstudyareaoffersauniqueopportunitytocomparesystems
underthesameclimaticandbiologicalconditions.Assuch,analyzingtheimplicationsofrecent
transition inhomegardensystemscouldhighlightpotentialnutrient-relatedconsequencesof
theintroductionofkhat.Figure1.1displaysatraditionalhomegarden,ensetplants,harvestof
theensetplantandfreshkhatleaves.
1.1RESEARCHWITHINTHECASCAPEPROJECT
Despite Ethiopia’s technological advancements and accelerated agricultural growth in recent
years,lowagriculturalproductivitypersists.TheGovernmentofEthiopiaadoptedthefiveyear
Growth and Transformation Plan (GTP) in its hopes to eradicate poverty. Within GTP, the
AgriculturalGrowthProgramme(AGP)wasestablishedtorealizefullfoodsecurityandsupport
high economic and export growth. Scaling up best practices has the highest priority. The
‘Capacitybuildingforscalingupofevidence-basedbestpractices inagriculturalproduction in
Ethiopia’ (CASCAPE)projectwasdesigned to support the Ethiopian government in increasing
agricultural productivity for smallholder farmers by identifying and disseminating best
practices. Funded by the Ministry of Foreign Affairs of The Netherlands through the Dutch
embassy in Addis Ababa, CASCAPE collaborateswith six Ethiopian universities (Addis Ababa,
Bahir Dar, Haramaya, Hawassa, Jimma andMekelle) and ALTERRA atWageningenUniversity
andResearchCentre(WUR).Workingcloselywithregionalresearch institutesandBureausof
Agriculture,CASCAPEaimstostrengthenshareholderlinkagesandimprovesustainablefarming
strategies.

pg.20
Figure1.1Fromlefttoright:1)thetraditionalhomegardenwithgrazinglandintheforeground
and behind that, the homestead, then enset infields and coffee/annual cereals and
vegetable/khat outfields (Galle, 2015), 2) Enset plants, with Drs. Beyene Mellisse and our
translator for scale (Galle, 2015), 3) Women harvesting the enset plant (Mellisse, 2015), 4)
Bunches(zurba)offreshkhatleaves(CCTVAfrica,2014).
1.2SOCIETALANDSCIENTIFICSIGNIFICANCETo realizeanecologically sustainableand favourable socio-economic future for thepeopleof
Sidama and Gedeo, their home gardens must be resilient to this change in cultivation.
Currently, little is known on the nutrient accumulation, losses and management of these
systems. Research on the topic is either out of date (Eyasu, 1997), on a continental scale
(Stoorvogel, Smaling & Janssen, 1993) or at the national level (Roy et al., 2003).Moreover,
Ethiopiahas12diverseagro-ecologicalzones,renderingmuchoftheexistingresearchspatially

pg.21
irrelevantandunsuitableforcomparativeanalysis(Abera,2013;Abrham,2014;Haileslassieet
al.,2006;Kirosetal.,2014).
Furthermore, when confronted with new crop cultivation (e.g. khat, annual cereals and
vegetables), farmers turn to nation-wide blanket recommendations regardless of local soil
conditions.Reorientingextensioneffortsofblanketprescriptionsbypresentinghomegarden
type-specific information can empower smallholders to diagnose nutrient accumulations and
soildegradation.Aknowledgegapexiststobetterunderstandthealteredinflowsandoutflows
thatimpactthenutrientbalanceoftheseevolvingsystems,ideallywithsite-specificexpertise.
Traditionalhomegardensarehighlydependentonorganicfertilizersintheformofcompostfor
enset, coffee and some annual cereals and vegetable fields. But quantification of nutrient
amounts are lacking. According to Mwangi (1996), inorganic fertilizer use is assumed to be
relatively low. Wallace & Knausenberger (1997) have even argued for increased inorganic
fertilizer use withminimal environmental consequences, but socio-economic factors, lack of
credit and pricing policy hinder farmer accessibility. Investigating farm-specific inorganic
fertilizer use and its interactions with other internal and external homegarden inputs will
support the accurate quantification of the nutrient balance of these systems before they
transitionentirely.
SidamaandGedeoareataturningpoint.Thediversityofsystemsveeringawayfromtraditional
enset-coffeehomegardensisnovelandvastlyunderresearched.Askhatmonocultureissetto
increaseincomingdecades,thedistincthomegardentypeshaveneverbeenmoredivided.The
opportunityforcomparativeanalysisatpresent isexemplary.Andwiththistransitionalready
underway for over two decades (Mellisse et al., in prep.), the demand for this research has
neverbeengreater.
1.3OUTLINEOFTHETHESIS
The research is structured as follows. Chapter 2 presents the research aims and questions.
Chapter3consistsofabriefoverviewoftherelevanttheoriesandexistingresearchonnutrient
balanceassessments.Chapter4 gives anoverviewof the studyarea,data collectionand the
methodologies used in this research. Chapter 5 shows the results of the quantification and
comparisons. InChapter6 the results andmethodologyarediscussed in relation toprevious
research. In addition, methodological improvements, suggestions for further research and
management recommendations are provided. Chapter 7 completes the thesis with the
conclusions.Theappendixfeaturesadditionalfiguresandtablesthatareusedinthisresearch.

pg.22
2.RESEARCHOBJECTIVESANDQUESTIONS
Theobjectivesofthisresearchare:
1. Produce representative farms for each home garden type based on farm component
(e.g.crops,livestock)prevalence.
2. QuantifyN, P andK inflows, outflows and internal flows for the representative farms
across studydistricts ofWondoGenet,Malga,Dale andBule for the cropping season
2014/15.
3. Compare representative farms based on component level and farm level nutrient
balance assessments to assess nutrient depletion or accumulation under current
nutrientmanagement.
4. Improve and broaden understanding of inflows, outflows and internal flows that
influencethenutrientbalanceoftransitioninghomegardensystemsandrecommended
futuremanagementactions.
Theassociatedresearchquestionsare:
1.1 Basedon the representative farms,what farmcomponentsaremost significant in
eachhomegardentype?
2.1 HowdoN,PandKinflowsandoutflowsdifferamongstthehomegardentypes?
3.1 Howdonutrientbalancescompareacrosshomegardentypesatcomponent level,
andatfarmlevel?
3.2 Wheredo“hotspots”ofnutrientdepletionand/oraccumulationexist?
4.1 Whatfuturemanagementactionscanbetakentoimprovenutrientmanagement?

pg.23
3.THEORETICALFRAMEWORK
Overviewoftheexistingliteratureprovidesthebasisforthisstudy’stheoreticalframework.In
thischapter,keytermsaredefined(3.1)andtheinflows(3.2),outflows(3.3)andinternalflows
(3.4)ofthehomegardensystemaredescribed.
3.1DEFINITIONOFCONCEPTUALTERMS
Conceptualtermsnecessarytoanswerresearchquestionsandconductmethodsareexplained
inthissection.
3.1.1NUTRIENTBALANCESMuchlikeafinancialbalance,nutrientbalancesrevealsurplusesordeficits.Dobermann(2005)
expresses a surplus or deficit as either a measure of net depletion (output > input) or
enrichment(output<input).Asurplus,oranaccumulationofhighlevelsofnutrients,isoften
attributed to negative environmental consequences, in which case, the nutrients are
considered pollutants. A moderate surplus, however, could result in improved soil fertility.
Nutrientscanbeexportedfromfarmsintheformofrunoff(PandsomeN),leaching(NO3-and
someP) or its gaseous form via denitrification (NO3- toN2) or volatilization (NH4
+ toNH3). A
deficit, or nutrient loss, can indicate land degradation and lead to gradual soil depletion.
Ultimately,bothoutcomescanrenderagriculturalpracticeunsustainableinlong-term.
Byexamininginputs,outputsandstorageprocessesoffarmingsystems,nutrientbalancescan
helpinmanagingnutrientsbyidentifyingproductiongoalsandopportunitiesforimprovement
(Gourleyetal.,2007).Balancingnutrient inputsandoutputscan reduceundesirableoff-farm
nutrient consequences (e.g. eutrophication caused by excessive nitrogen runoff) and reduce
expenditureonfarminputs(e.g.fertilizersandfeedsupplements).Thebalancesareproduced
for various spatial and temporal boundaries. In brief, a balance tracks inputs, outputs and
stores of a defined systemover a fixedperiodof time, such as a specific year. Balances can
range from broad farm-gate analyses to those at specific field-level to detailed soil-level
studies.Thepurposeofthebalancedeterminesthedegreeofdatadetailnecessary.Naturally,
thisalsoworksintheoppositefashion,wheretheextentofdataavailabilitylimitsthebalance’s
detail.
Eachlevelofnutrientbalance—farm-gate,fieldandsoil—hasitsbenefitsandlimitations.Farm-
gatenutrientbalances (FGB)areproduciblewith readilyavailabledata,easily repeatableand
simpletocommunicate(Öbornetal.,2003).FGBsalsohavethecapacitytoaccountformultiple
nutrients,calculateoutcomesfinanciallyandareusefulforfarmbudgeting.However,theFGB
can overlook depletion caused by flows of nutrients within the farm (Cherry et al., 2008).
Internal flows can be significant; with shortages in some areas and accumulation in others.
Fluctuationsinlocalconditions(e.g.climateandsoilfertility)andnutrientfluxes(e.g.biological
nitrogenfixation(BNF),atmosphericdeposition(DEP)andleaching)aretypicallynotaccounted

pg.24
for because such detail is too much for the purposes of a FGB. Internal flows are better
analyzedinafield-levelbalance,whichexaminesthebalanceatthesoil-surfaceleveloneach
fieldwithin a farm. Field-level balances consider DEP, BNF, leaching and nutrient content of
manures and crops, but typically rely on estimates and assumptions for these components.
Localizedsurplusesanddeficitscanbebetteridentifiedandmanagedusingafield-levelbalance
(Cherry et al., 2008). Soil-level balances measure denitrification, volatilization and lateral
transport.Itistheonlybalancetoaccuratelyaccountforspatialandtemporalaspectsoffluxes
(Öbornetal.,2003),butrequireshighqualitydata.Soil-levelbalancesareausefultoolforsite-
specific researchanddevelopment.Onlywhen it is representativeof thegreatersystem,can
soil-level balances identify processes where problems occur and follow the fate of nutrient
sources(Wander,2015).
3.1.2COMPONENTLEVELNUTRIENTBALANCE
First,abalancemustdelineatestricttemporalboundariesandassuchourbalancewasannual,
examining the 2014/15 cropping season. Second, partial nutrient balances were used.
Agriculturalfieldstendtohaveresidualnutrientsandbecauseofthedifficultyinmeasuringall
individualoutputpathwaysintotheenvironment,residualswereassumedtobezero(Jackson-
Smith,2010).Third,abalancemustadheretospatialboundaries;thereforeacomponentlevel
nutrientbalancewasused.ThecomponentlevelapproachliesbetweenthecoarserFGBanda
morecomprehensivefield-levelbalance.Thefieldsaregroupedtogether intocomponentsby
landuse.Forexample, theannualcerealsandvegetablescomponentgroups togethermaize,
barley,onionandcabbagefields.Fordiversifiedfarmscultivatingmultiplecropsinasmallarea,
likeahomegarden, simplyusingaFGBwouldunderestimate the influenceof internal flows.
Field-levelassessmentscan identifymovementofnutrientswithin farms,but requireadetail
notfeasibleinthetimespanofthisproject.Groupingfieldstogetherincomponentsispractical
whileitstillprovidesageneralindicationofenvironmentalperformanceanddetailedinsightof
internalnutrientflows.Thechoicebehindacomponentlevelbalanceisespeciallyrelevantfor
home gardens in the study site, where land use allocation has changed and distinct home
gardentypeshaveemerged,thusdisruptinginternalflowsandcallingfortheircomparison.The
farmcomponents in thisstudyareenset,coffee,enset+coffee intercropping,annualcereals
andvegetables(ACV)andkhat.Livestockwasalsoacomponent.
3.1.3NUTRIENTFLOWS
Mellisseetal. (inprep.)producedaschematicmodelofnutrientoutflowsand inflowsof five
differenthomegardentypes(Figure3.1).Inthemodel,nutrientoutflowsfromthefarminclude
market, which are sales of livestock produce (e.g. meat, milk) and exported crops (chiefly,
coffee, vegetables and khat). Several nutrient losses are also defined, including: losses from
frontgrazinglandbyleaching,volatilizationanderosion(L1), lossesfromlivestock(L2), losses
fromthemanureheapbyleachingandvolatilization(L3), lossesduringapplicationofmanure
tofields(L4),lossesfromthehomegardenfieldsbyleachingandvolatilization(L5).

pg.25
NutrientinflowstothefarmincludeDEP,BNF,purchasedfoodcrops,livestockandfarminputs
(Market),andcattlewhicharetakenfromotherfarmsforfatteningpurposes(Fat)(e.g.feeding
thecattleforthreemonthsandthenreturningthemtotheowner)(Mellisseetal.,inprep.).
Figure3.1Schematicmodelofnutrientinputsandoutputsacrossthefivehomegardentypes,
including inputs: atmospheric deposition (DEP), biological nitrogen fixation (BNF), purchased
food crops, livestock and farm inputs (Market), cattlewhich are taken from other farms for
fatteningpurposes(Fat) (e.g. feedingthecattle forthreemonthsandthenreturningthemto
the owner). The model also shows outputs: losses from front grazing land by leaching,
volatilization and erosion (L1), losses from livestock (L2), losses from the manure heap by
leachingandvolatilization (L3), lossesduringapplicationofmanure to fields (L4), losses from
thehomegarden fieldsby leachingandvolatilization (L5).Nutrient flowson individualhome
gardeninclude:feedstuffstakenfromfrontgrazingyard(f1),cowdungleftinfrontgrazingyard
(f2) (especially during day time since animals are tied up in grazing yard), milk and meat
consumedbythefamily(f3),collectionoffarmyardmanure(FYM)(f4),applicationofFYMin
different land use type (f5), feedstuff taken from different land use type (especially, enset
leaves)by livestock (f6),householdwasteadded tomanureheap (f7), familyconsumptionof
bothperennialandannualcrops(f8)(Mellisseetal.,inprep.).
Theschematicmodel(Figure3.1)alsodisplaysinternalnutrientflowswithinanindividualhome
garden.Itisimportanttodistinguishbetweeninternalandexternalinputs.Internalinputsare
on-farm resources such as manure, enset leaves and grasses. External inputs are off-farm

pg.26
resources purchased for use on the farm such as livestock fodder, chemical fertilizers,
insecticides and/or pesticides. If manure or livestock fodder was purchased, rather than
produced on the farm where it is applied, it is considered an external input. In this study,
nutrient flows and nutrient balances allow understanding the interactions between home
gardencomponents.
3.2INFLOWSINTOTHEHOMEGARDENSYSTEMIn southern Ethiopia, farmers’ use of agricultural inputs is highly dependent on their
accessibility.Ethiopia’sBureauofAgriculture,theopenmarket,NGOsandneighbouringfarms
allsupplyfarmerswith inputs(Dessalegneetal.,2012).Thissectionhighlightsonlythemajor
nutrientresource inflowsthatareconsideredfor the farm levelnutrientbalanceassessment.
Atmospheric deposition (DEP) and biological nitrogen fixation (BNF) are excluded as inflows.
DEP can occur in two forms: wet deposition (rain and fog) and dry deposition (gases and
particles,withoutaidofprecipitation).BNFisdependentonseveralsoilfactors.Forexample,
thepresenceofphosphorus,thepresenceofappropriateRhizobiaandpH.Theapplicationof
fertilizers is by far themost commonway to supply crops with nitrogen. However, possibly
moresustainablepracticessuchascroprotationwithsymbioticN-fixationbyleguminouscrops
or planting them alongside N-fixing crops are being used as well. For the partial nutrient
balanceassessmentinthisstudy,DEPisexcludedduetodifficulties in itsaccurateestimation
(Munters, 1997). BNF is excluded, as only few legumes are grown in the study areas. Codes
assignedtoeachinflowarenotintendedtobeinnumericalorder.
3.2.1MINERALFERTILIZER(IN1)Nitrogenisoneofthemostabundantelementsonearth,butonlyintheformofnitrate(NO3
-)
andammonium(NH4+)isitavailableforplantuptake.Theapplicationofmineralfertilizersisby
far themostcommonwaytosupplycropswithnitrogen.Dessalegneetal. (2012) report low
mineral fertilizer use in Ethiopian home gardens. Despite projects like the Development of
Competitive Markets (DCM), reforms designed to encourage private sector participation in
fertilizer distribution, fertilizer use has remained low. The reasons are its high cost,
unavailability, limitedknowledgeabout itsbenefitsand little informationonhowtoproperly
applyit(Wallace&Knausenberger,1997).Devaluationsofdomesticcurrencyandlackofcredit
can also constrain fertilizer use in already impoverished areas. This is especially true in
unirrigated,rain-fedagriculturalzones,whichareconsideredtohavehighrisk.
However,uponcompletionin1995,DCMdidincreasefertilizersalesdrastically:from132,000
tonnesin1993to236,000tonnesin1995(Wallace&Knausenberger,1997).Kirosetal.(2012)
reportedEthiopianfertilizeruseroseto7kg/hain1997.ThisiscomparabletotheSub-Saharan
Africanaverageof6kg/habutstillverylowcomparedtotheglobalaverageof78kg/haatthat
time (Makken,1993).Results fromDCMarenearly twodecadesoldandwitha lackofmore
recentdataitisdifficulttodeducecurrenttrendsininorganicfertilizeruse.However,theprice
of inorganic fertilizer is still high due to its foreign production and poorly developed
pg.27
infrastructureinEthiopia.Abateetal.(2015)indicatedthatinorganicfertilizeruseremainson
the rise. Their research showed nationwide consumption of N and P for fertilizingmaize at
20,000 tonnes in 2004 to 68,000 tonnes in 2013—amore than 3-fold increase (Abate et al.,
2015).NandPaccountedforroughly67%and33%ofthisgrowth,respectively.
All of Ethiopia’s mineral fertilizer is imported (Abate et al., 2015). Currently, the most
commonlyusednitrogenfertilizerinEthiopiaisurea.Itcanbeinexpensivelymanufacturedand
is widely applicable to nearly all crops. Urea holds 46% nitrogen content. However, urea is
highlysolubleinwaterandmeasurestolimitnitrogenrunoffshouldbeprudentlyundertaken.
The nation’smost commonly used phosphate fertilizers are triple superphosphate (TSP) and
diammonium phosphate (DAP). Both fertilizers are in dry form andwhen dissolved have pH
valuesof1.5and8.0,respectively.OnbasicsoilsTSPmightbemoreeffective,whileonacidic
soilsDAPishazardousasdirectcontactwithseedsmaycauseseedlingdamage.TSPmaybeless
favourableeconomicallyasitismorecostlytoproduce.InSidamaandGedeoagriculture,urea
andDAPareavailablewhileTSPisnot.
Whilehighexternalinputorevenindustrialagriculturalnationsarerightfullyconcernedabout
thenegativeenvironmentalconsequencesofexcessivefertilizeruse,KellyandNaseem(2004)
argue Ethiopia faces negative environmental impacts of too little fertilizer use. Although
environmental damage from too little fertilizer is unlikely, its on-farm effects have serious
implications. For example, a soil that receives little to no inputs can rapidly losenutrients, a
process known as nutrient mining. This is especially true if inadequate biomass production
limitsnutrientrecyclingforfutureplantings.
3.2.2EXTERNALLIVESTOCKFODDER(IN4)
Externalfodder(IN4)comprisesofsugarcanetopsandwheatbran.Thesefoddersourcesoften
supplementinternalfodder.Ethiopiastrivestobeoneoftheworld’stop10sugarproducersby
2023 and sugarcane tops are abundant in sugar-growing countries. Through the state-run
Ethiopia Sugar Corporation (ESC), the Government of Ethiopia (GOE) has invested in new
processing factories, revitalizingolder factories andexpanding sugar cultivated land toboost
sugarproduction(Francom,2015).Onehectareofsugarcanecanyield30tons(freshweight)of
tops (Mahala et al., 2013). Sugarcane tops are primarily fed to fatten livestock, rather than
provide nutrients. They are highly palatable and can often sustain cattle with little protein
supplement(Leng&Preston,1976).
To livestock,wheatbran isalsoverypalatable.Asaby-productofthemilling industry,wheat
bran is diverse. Mixed wheat bran is widely considered of better quality due to its good
proportion of flour and husks (Gebremedhin et al., 2009). Coarse bran has poor nutritional
valuewhilefinebrancouldcausebloatinginlivestock.FarmersnearHawassapreferfinebran
forfatteninganimalsandcoarsebranfordairycattle(Gebremedhinetal.,2009).

pg.28
3.3OUTFLOWSFROMTHEHOMEGARDEN
This section highlights only themajor nutrient resource outflows relevant to the local home
garden systems. Outflows from fields such as leaching, gaseous loss and erosion were not
expounded for this assessment due to lack of data. The following outflowswere taken into
accountforthefarmlevelnutrientbalanceassessment.Theseoutflowsareexportedcropssold
off-farm,wholelivestockleavingthefarmandlivestockproductsales.Codesassignedtoeach
outflowarenotintendedtobeinnumericalorder.
3.3.1REMOVALINHARVESTEDPRODUCTSSOLDOFF-FARM(OUT5)Severaldifferentperennialandannualagriculturalcropsaregrown in theSidamaandGedeo
zones.Thetraditionalhomegardensaredominatedbyensetandcoffee.Accompanyingthese
twomaincropsarevegetables(e.g.onion,cabbage)andsomeannualcerealcrops(e.g.maize,
barley).Khathasbeenincreasinglycultivatedforitseconomiclureinrecentyears,whileatthe
expenseofensetandcoffee.Toquantifyandcompareinputsandoutputsatthefarmlevel,the
cropsmostoften sold are cash crops: onions, cabbage, coffee and khat.On someoccasions,
kochoorensetleaveswillbesoldoff-farm.Fibrousensetleavesaremulti-functionalandcould
besoldasbuildingmaterialortextileforclothing.
3.3.2LIVESTOCKOUTPUT(OUT3)Exportingwhole animals is another potential resource flowout of the home garden system.
Mostcommonly,chickens,goats,sheepandcattlearesoldforconsumption.However,whole
animalsforutilizationcanalsobesoldand/ortradedamongstfarmers.Livestockareprimarily
sustained by enset leaves and grasses (Mellisse et al., prep.). On occasion, their diet is
supplementedwithpurchasedexternalfodder(e.g.sugarcanetop,wheatbran).Thesenutrient
inputscyclebacktocropfieldsintheformofmanuremixedincompost(IN2).
Fromthemilkproducedbythecattle,partissoldandpartaccountsfornutrientlossfromthe
farm. Butter is also made from the milk, but has been grouped together with milk for this
assessment.Eggsarealsosoldandresultinnutrientlosses.Inthestudyarea,meatisnotsold
separately,onlyaswholeanimalsleavingthefarm.
3.4INTERNALFLOWSINTHEHOMEGARDENSYSTEM
Thissectiondescribesthe internalnutrient flowsrelevant tothehomegardensystem.Codes
assignedtoeachinternalflowarenotintendedtobeinnumericalorder.
3.4.1ORGANICMATTER(IN2)InEthiopia,organicfertilizerscanbecategorizedintoanimalmanuresandcompost.InSidama
andGedeo,livestockmanureisarguedtobetheprincipalfarminputtocrops(Mellisseetal.,in

pg.29
prep.).Applyingmanureimprovessoilfertilityanditsphysicalcondition(Elias,2002).Withthe
aimtosupplynutrients,manureisregularlyapplied.However,itseffectvarieswithapplication
amountsandmanurequality,andisoftendependentonlivestockandlabouravailability,which
is necessary to transport manure onto fields (Kiros et al., 2012). Use of manure on crops
competes with non-farm uses. For example, increasing shortage of fuel wood forces rural
Ethiopians to burn dried cattle dung. Kiros et al. (2012) found this to deprive soil of an
importantsourceoforganicmatterandnutrients.
Compost is the decomposed organic waste produced from crop residues, animal manure,
householdwasteand sludge. It is stabilizedbymacro-andmicro-organisms throughaerobic,
semi-aerobicandanaerobicbiologicalprocesses.InSidamaandGedeo,compostsmademainly
of cattle dung and household refuse ismost commonly used.Utilizing human excreta is still
widely considered taboo. Compost in itself is not a rich source of nutrients, but acts as an
important soil amendment by increasing microbial activity and soil fertility. Like manure,
applicationamountsvaryaccordingtolabouravailability.Asaresult,fieldslocatedclosetothe
homestead generally receive more compost compared to fields further away. Compost is
typically collected,decomposedand stored in anoutdoorpile close to thehomestead. From
thereitisdistributedtofields.Dessalegneetal.(2012)stipulatedfurtherresearchisessential
tosurveyifcompostaloneisenoughtoincreasehomegardenproductivity.
3.4.2INTERNALLIVESTOCKFODDER(IN3)
To feed livestock, internal fodder (IN3) consists of enset leaves and grasses collected from
enset, coffee and khat fields. Typically, internal fodder remainswithin the farmbymeansof
livestockmanure that is appliedon the crop fields,which is a characteristic of a closed-loop
system. Together with manures, crop residues can replenish the essential macronutrients;
contributetomaintainingsoilorganicmatterandthesoil’sstructure.Exportingtheseresources
off-farm can have negative nutrient-related consequences, should they not be replacedwith
inorganic fertilizer means. For example, in Ethiopia, complete removal of all crop residues
(internal fodder) is estimated to remove 101 and 168 kg/ha/yr of N and P nutrients,
respectively(Kirosetal.,2012).Whilefatteningsupplementsviaexternalfodderarecrucialin
livestockfeed,theroleofinternalfoddershouldnotbeundervalued.
3.4.3REMOVALINALLHARVESTEDPRODUCTS(OUT1)
Nutrientremovalinallharvestedproductsconsidersallcropsthatareproduced,notonlythose
thataresoldoff-farm.Cropsmostlikelytoremainwithinthehomegardenareensetproducts
(e.g.kocho,bula)andcereals(e.g.barley,maize).Thesecropsarepresumablyconsumedbythe
household.

pg.30
3.4.4REMOVALINCROPRESIDUES(OUT2)
Cropresiduesarerelevantonlyonmaizeandbarleyfieldswherestoverandstrawremainson
thesoilafterharvest.Theharvest index(HI)wasusedtodeterminetheseabove-groundcrop
residues.Onenset,coffeeandkhatfields,allgrassesarecollectedforinternallivestockfodder
(IN3) and no crop residues remain. Regarding vegetables, onion and cabbage are both
uprooted.Assuch,thesefieldscanalsobeconsideredacompleteharvest.
3.4.5HOUSEHOLDLIVESTOCKCONSUMPTION(OUT4)
Household crop consumption was not explicitly asked for in the input/output survey, but
household livestock consumptionwas.However, the survey only asked about the household
consumingwholeanimals insteadof livestockproducts.Sincehouseholdconsumptionofmilk
and eggs was not explicitly requested, it has been excluded from the nutrient balance
assessment.

pg.31
4.METHODOLOGY
To analyzenutrientmanagement and flowson transitioninghomegardens, component level
and farm levelmacronutrient balances are used to compare the nutrient amounts entering,
leaving and circulating (within) the farm. The methodology considers the system over the
2014/15croppingseason.Nutrientbalancescanbeindicatorsof(i)anutrientsurplus(inputs>
outputs),leadingtoanaccumulation,(ii)adeficit(outputs<inputs),depletingnutrientreserves
andheightenedriskofreducedcropyieldsduetonutrientmining–theunreplenishednutrient
removal by crops, or (iii) a neutral balance (Cuttle, 2002). The research strategy to quantify
nutrient inflows, outflows and internal flows and to calculate the farm level and component
levelnutrientbalancesaredescribedhere.
4.1STUDYAREA
Ethiopiahasacomplexhistoryofdividingitscountry.Asof2015,Ethiopiahas9regionalstates
(kililoch) and two chartered cities (Addis Ababa, Dire Dawa). Kililochs are based on ethnicterritorialityandfurthersubdividedinto68zones.Somezonesarefurtherdividedintodistricts
(woreda), which are then split into municipalities (kebele). Kebele are the smallest unit of
administrativedivisioninEthiopia.
The research was conducted in the Sidama and Gedeo zones of the Southern Nations,
NationalitiesandPeoples’Region(SNNPR)kililoch(regionalstate)insouthernEthiopia(Figure4.1).Encompassing7,672squarekilometers (Abebe,2005), Sidama is locatedat5°45’-6°45’N
latitude and38°-39°E longitude andhome to 3.5million inhabitants (CSA, 2007). The area is
densely populatedwith over 450 people per km2 (CSA, 2007). Some 95% of the inhabitants
speakSidaamuAfoo,thedistrict’sprimaryfirstlanguage.Incontrasttothemajorityofnorthern
Ethiopia’sarid landscape,Sidamais largely lushandgreenwithrollinghillsandfertilevalleys.
Sidama is subdivided into 19woredas (district), ofwhich three (WondoGenet,Malga, Dale)
werestudied.Theworedaswerechosenbasedonpopulationdensity,agro-ecologyandaccess
tomarkets.
Sidama surrounds the city of Hawassa. At an altitude of 1665 m a.s.l., Hawassa serves as
SNNPR’scapital.Hawassahas165,275inhabitantsrepresentingover50ethnicities.Nearlyhalf
ofthepopulationresides inHawassa’snearbykebeles(neighbourhood).Thecity liesadjacenttoLakeAwasa,thesmallestoftheGreatAfricanRiftValleylakes.Itsfishcombinedwiththatof
theneighboringAbayaLakeinGedeoprovidearobustlocalfishingindustry.
Gedeo is subdivided into eight woredas, of which one (Bule) was studied. Again, Bule was
selectedforitspopulationdensity,distinctagro-ecologyanddistancetomarkets(addtable).Its
isolationcontrastswellwithSidama’sselectedworedas,renderingadiverseandrepresentative
studyarea.Gedeo is1,347squarekilometers (Kippie,2002),hasapopulationof0.84million
and is located at 5°-7° N latitude and 38°-40° E longitude (CSA, 2007). Gedeo shows similar
variationinelevationtoSidama,witharangeof1268(atLakeAbaya)to2993m.a.s.l.(atHaro

pg.32
WolabuPond).Gedeozone isnamedafter itsGedeopeople,whichpredominantly speak the
Gedeo language.Although the languages are alike, theGedeopeople have a distinct culture
compared to theSidamapeople.However,both zones share identicalagriculturaleconomies
basedoncultivatingensetandcoffeewithintraditionalhomegardens.
Thezonesalsosharecomparablebimodalrainfalldistribution,rangingfrom1200to2000mm
perannum(Abebe,2005).Thelong(JunetoSeptember)andshort(MarchtoMay)rainyseason
createfavourableconditionsforthedominantperennial-basedhomegardensystems.Sidama
and Gedeo cover two agro-ecological zones (Table 4.1). Both zones support different
agricultureandlifestyles.
Table 4.1: Agro-ecological zones with characterizing altitude, rainfall, temperature and
predominantperennialcrops(Mellisseetal.,inprep.)
Agro-ecologicalzone Altitude(m.a.s.l.)
Averageannualrainfall(mm)
Averageannualtemperature(oC)
Moistmid-altitude,subtropicalzone
(Amharic:woinadega)1500-2300 1200-1600 16-22
Moisthighland,coolzone
(Amharic:dega)2300-3200 1600-2000 15-19
In SNNPR, there are 116meteorological stations recording climatedata. Stations inHawassa
andArbaMinch (270kmsouthofHawassa) are synoptic (large-scale) receiving satellitedata
andrecordingallweatherelements.Theother114stationsvaryandarelessdetailed.Altitude
andrainfallarethemaindeterminantsofclimateintheregion.DominantsoiltypesareNitosol,
CambisolandLithosol(Tsegaye,2001).
pg.33
Figure 4.1: Location of study districts (woredas: Wondo-Genet, Malga, Dale, Bule) within
SidamaandGedeozonesofSouthernNations,NationalitiesandPeoples’Region(SNNPR).The
legenddisplaysEthiopia’snineregionalstatesandtwochartedcities.

pg.34
4.2FARMTYPOLOGIES
Homegardensystemsarediverse.Tobetteranalyzetheirdifferences;Mellisseetal.(inprep.)
constructedafarmtypology.Differentfarmswithsimilarcharacteristicswerecategorizedinto
five types—four enset-oriented (enset-based, enset-coffee, enset-cereal-vegetable, enset-
livestock) and one khat-based. To construct the typology, data from the 240 surveyed
householdsandmultivariatestatisticalanalysis(MSA)wasused.Thefarmtypeswereidentified
basedonareasharesofenset,coffee,khat,annualcerealandvegetablesandgrazingland.
4.3DATACOLLECTION
The data for a partial macronutrient balances and MNUE was acquired through household
surveys.In2012/13,240householdsacrossthefourstudyworedasweresurveyed.Theheads
ofthehouseholdswereaskedtoreporttheyearofkhatintroduction,landallocationtovarious
perennialandannualcrops,totallandholdingsandlivestockherdsize(Mellisseetal.,inprep.).
Demographiccharacteristicssuchas familysizeand levelofeducation,productionobjectives,
sourcesofincome,constraintstocropproductionandlivestockrearinganddependencyonthe
market for family food,werealso requested.Secondarydataat theworedaandkebele level
werecollectedonpopulationdensity,populationsizeandkocho,coffeeandkhatprices.From
thisanalysis,thefarmtypologieswerecreated.
Of these 240 households, a sub-sample of 63 households was selected for the detailed
input/output survey. In this survey, data onmacronutrient inputs, outputs and stores of the
2014/15 cropping season for farmer’s home gardens was recalled. Household surveys also
requiredfarmerstospecify livestockkept,died,consumedorsold.Livestocktypeandgender
was also asked. The translated English version of this household survey questionnaire is
availableinAppendix7.3.Thedatacollectedfromthese63surveyswasenteredintoExcelfor
further analysis. This research project compiled all macronutrient inputs and outputs at the
component and farm level, conceived representative farms and conducted partial
macronutrientbalancesforeachhomegardentype.
Inadditiontodetailedsurveydata,compositesamplesofcrops, internal livestockfodderand
homegardencompostweretakenfornutrientcontentanalysispriortomyarrivalinEthiopia.
The samples were analyzed in the laboratory facilities of Hawassa University College of
AgricultureandtheWondoGenetCollegeofForestryandNaturalResources.Basedonnutrient
values anddrymatter, the amountof nutrients transported fromboth component and farm
level was quantified. A complete table of the nutrient content of all output is available in
Appendix7.2.Thenutrientcontentforcabbage,milkandeggsweretakenfromliterature(The
NationalAgriculturalLibrary,2015;Myburghetal.,2012;Roeetal.,2012).Thenutrientcontent
of animals leaving the farm was based on Van Heerden et al. (2002) and the Agricultural
ResearchCouncil[ARC](1984).Forexternallivestockfodder,whichincludessugarcanetopand
wheatbran,thenutrientcontentwasalsotakenfromliterature(Heuzéetal.,2015a;Heuzéet
al.,2015b).

pg.35
Literatureontypicalsub-SaharanAfricanmacronutrientinputsandnutrientbalancesforsimilar
smallholder subsistence systems was studied to develop a frame of reference for detecting
outliers. Outliersmay indicate either variability in themeasurements or experimental error.
Selectioncriteriafor identifyingoutlierswerebasedonEthiopia’sblanketrecommendationof
100 kg/ha of DAP and urea fertilizers. As Ethiopian authorities report fertilizer
recommendationsinkilograms,thesedatasetswereconvertedintoactualelementalnitrogen
andphosphorusnutrientsforstandardizedcomparisons.Thus,Ethiopiarecommends63kg/ha
ofN(DAP=18kgofN,urea=45kgofN)asDAPis18%Nandureais45%N.Toaccountfor
potential over-fertilization, any application ofmore than 125 kg/ha of N was isolated as an
outlier,butnooutlierswererevealedinthedataset.
4.4EXPERIMENTALDESIGN
In this section the experimental design and analytical techniques are described. The
representative farm for each home garden type is explained, as well as the approach for
extractingthenutrientamountfrominputsandoutputsandassessmentofthemacronutrient
balance for both crop and livestock. As Ethiopian farmers tend to use their own units, a
conversiontableforalllocalunitstokilogramscanbefoundinAppendix7.1.
4.4.1THEREPRESENTATIVEFARM
Drawing from the farm typologydesignedbyMellisse et al. (inprep.) for eachhomegarden
type a representative farm was formulated. The first phase is to categorize crops and
distinguishcomponentsofahomegarden.Thefivedeterminedcomponentsare:enset,coffee,
annual cereals and vegetables (ACV, including maize, barley, onion and cabbage), khat and
livestock.Annualcerealsandvegetablesweregroupedbasedontheirsimilarity in inputsand
thefactthattheyareannualcrops.Despitetheiropposingrolesasfoodandcashcrops,annual
cereals and vegetables are often found together. A trend of increasing ACV area to meet
household dietary and income needswas observed and resulted in a separate enset-cereal-
vegetablehomegardentype(Mellisseetal.,inprep.).
Second, a criterion to exclude or include the type of component from or to a specific
representative farmwassetbasedon itspresence.Accordingly,a component represented in
50%ormoreofthesurveyedfarmswasretainedandexcludedotherwise.Forexample,inthe
enset-coffeehomegardens,14ofthe18farmscultivatedcoffee,socoffeewas included.The
third phase is to determine the proportion of land allocated to each component in its
representative farm. For this, the allocated land area for each selected component over the
totalfarmer-reportedfarmsizewastaken.
!"#$&'((ℎ"/ℎ") = .//01.234/.54.63.706108905352
202./:;7.68<=>3
Note:FRdenotesfarmer-reported.
(Equation4.1)

pg.36
WHAT’SINANDWHAT’SOUT
(Equation4.2)
Inthisstudy,allfruitsandsomevegetablecropswere
nottakenintoaccount.Cropssuchasbananas,avocados,mangoes,guava,potatoesandfaba
beanswere excluded due to their negligible presence in the home gardens, as only 8 of 63
homegardenscultivatedthesecrops.
Equation4.1isrepeatedforeachcomponentoneachfarmandaveraged.Thisconstitutesthe
averagelanduseofeachcomponentwithintherepresentativefarm.Theaverageswillnotadd
upto100%,asexcludedcomponentsarenotaccountedfor.Therefore,thefollowingformula
(Equation4.2)isappliedtocalculatethealteredpercentages.
x%
+y%
z%=mustequal100%
(100/N) ∗ N% = 1 (100/N) ∗ P% = "%
(100/N) ∗ Q% = R%
"% + R% = 100%
Wherex=componentx
y=componenty
z=originalpercentagesum,beforealterations
a=alteredpercentageforcomponentx
b=alteredpercentageforcomponenty
The representative farm approach has the capability of providing insights into an otherwise
complexfarmtypology.
Togaingreaterunderstandingofthelivestockcomponent,TropicalLivestockUnit(TLU,250kg
bodyweight)wascalculatedforeachrepresentativefarmtoindicatethepotentialinfluenceof
livestockwithindifferenthomegardentypes.TLUarelivestocknumbersconvertedtoa
commonunit(Table4.2).
Table4.2:TropicalLivestockUnit(TLU)conversionchart(FAO,1987).
Species TLUconversionfactorCattle 0.70
Sheep 0.10
Goat 0.10
Chicken 0.01
Horse 0.80

pg.37
4.4.2QUANTIFYINGNUTRIENTFLOWS
Stoorvogel and Smaling (1990) pioneered the methodology behind nutrient balance
assessments. Subsequent studies have modified the methods to fit study objectives and
research location.Theiroriginalmodel included five inputand fiveoutputprocesses:mineral
fertilizer;organicmatter,comprisingmanureandhouseholdrefuseandleaflitter;atmospheric
deposition (DEP); biological N-fixation (BNF); and sedimentation (inflows) and removal in
harvested products; removal in crop residue; leaching; denitrification; and water erosion
(outflows). Inputandoutputprocessesquantified for this researchvariedon the component
andfarmlevelandwereadaptedtothelocalcontext.
Onthecomponentlevel,themajorinputflowsquantifiedwere
1. mineralfertilizer(IN1),
2. organicmatter(IN2),comprisingofmanureandhouseholdrefuse,
3. internalfodder(IN3),
4. externalfodder(IN4).
Thekeyoutputflowsquantifiedwere
1. removalinharvestedproducts(OUT1),
2. removalincropresidue(OUT2),
3. wholelivestockandlivestockproductssoldoff-farm(OUT3),
4. householdlivestockconsumption(OUT4).
Inputflows;DEP,BNFandsedimentationwereexcluded.DEPisexcludedduetodifficultiesin
its accurate estimation and lack of local data (Munters, 1997). BNF is excluded, as only few
legumes are grown in Sidama and Gedeo. Sedimentation is not relevant as there are no
irrigationschemesorfloodplainsinthestudyarea(Eliasetal.,1998).Outputflows;leaching,
denitrification and water erosion were excluded based on lack of regional-specific
measurements which are also subject to temporal variability. Household consumption of
livestockproducts(e.g.milkandeggs)wasexcludeddueto lackofexplicitdata.Manureasa
directoutputfromlivestockwasexcludedbecausenocompositesamplesweretakenoffresh
manure.
Onthefarmlevel,themajorinputflowsquantifiedwere
1. mineralfertilizer(IN1),
2. externalfodder(IN4).
Thekeyoutputflowsquantifiedwere
1. removalinharvestedproductssoldoff-farm(OUT5),
2. wholelivestockandlivestockproductssoldoff-farm(OUT3).

pg.38
4.4.3MACRONUTRIENTINPUT
ThesurveydatasuppliedDAP,ureaandcompost inputs inkilogram(kg)orgimbola(9.78kg).
The formulas used to extractmacronutrient amount from these inputs are presented in the
workflowbelow(Figure4.2):
Figure 4.2: Conceptualworkflow showing steps and formulae used to extractmacronutrient
contentfrominput.
The third step in the workflow mentions the nutrient content of the inputs (Table 4.3).
Livestocktotalswerederivedusingthesameconceptualworkflow(Figure4.2)tocalculatethe
nutrientcontentofinternalandexternalfodder.
Table 4.3: Macronutrient content (mean ±SD) for the four input processes employed in
calculatingpartialnutrientbalances.
Inputprocess
Codeandnutrients %DM N(%) P(%) K(%) Reference(N) Reference(P/K)
DAP(NH4)2HPO4
IN1(N&P)
- 18 20 - (Mitchell,2008) (Mitchell,2008)
UREACO(NH2)2
IN1(N)
- 45 - - (Mitchell,2008) (Mitchell,2008)
Organicmatter
IN2(N,P&K)
26.37 0.83 0.03 0.29(HUAgricultural
College,2015)
(WondoGenet
CollegeSoilLab,
2015)
Grass IN3(N,P&K) 33 1.63 0.49 1.96
(HUAgricultural
CollegeSoilLab,
2015)
(WondoGenet
CollegeSoilLab,
2015)
Ensetleaves
IN3(N,P&K) 13.7
1.32
(±0.22)0.45
(±0.09)4.6
(±0.48)
(HUAgricultural
CollegeSoilLab,
2015)
(WondoGenet
CollegeSoilLab,
2015)
Sugarcanetops
IN4(N,P&K) 26.8 0.78 0.12 1.87
(Heuzéetal.,
2015a)(Heuzéetal.,
2015a)
Wheatbran
IN4(N,P&K) 87 2.77 1.11 1.37
(Heuzéetal.,
2015b)(Heuzéetal.,
2015b)

pg.39
CONVERSIONTOELEMENTALFORM
Fertilizer inputs are expressed in elemental
formfornitrogen(N)butintheoxideformforphosphorus(P2O5)andpotassium(K2O).Forthis
study,nutrientsareexpressedinactualelementalform(suchasinTable4.2,4.2).Therefore,to
convertP2O5toP,multiplyby0.44.ToconvertK2OtoK,multiplyby0.83.
Tocalculatethemacronutrientamountinfodder,somespecialstepsmustbetaken:
1. Suminputspereachindividualfarm.
2. Multiplyeachsumby180daysor25weeks(ofthedryseason)basedonwhetherinput
wasreporteddailyorweekly.DryseasoninEthiopiaistypicallyfromDecembertoMay
(6months)andfodderissuppliedinthisperiod.
3. Convertfromlocalunit(Appendix7.1)tokg.
4. Convertto%drymatter(DM).
5. Multiplyby%N/P/K.
6. Averagemacronutrientamounttocalculatemean(±SD)foreachrepresentativefarm.

pg.40
4.4.4MACRONUTRIENTOUTPUT
Thenutrientcontentand%DMofalloutputsisavailableinAppendix7.2.Eachcomponenthas
severaloutputs(Table4.4).Outputscanhavedifferentfunctions.Typically,kocho,bula,barley
andmaize are consumed. Coffee, cabbage, onion, khat,milk, eggs, chicken, goat, sheep and
cattle tend to be sold.Only in rare instances iswhole livestock consumed. Enset leaves and
grassesfromenset,coffeeandkhatfieldsareusedforlivestockfodder.
Table4.4:Outputprocessandtheirrespectiveoutputs.
Outputprocess
Codeandnutrients Output
Removalinharvestedproduct
OUT1
(N,P&K)
Kocho,bula,ensetleaves,maizegrain,barleygrain,
cabbage,onionleafandroot,coffeeberry,coffeebean,
dwarfkhatleavesandtwigs,tallkhatleavesandtwigs
Removalincropresidue
OUT2
(N,P&K)Maizestover,barleystrawleftoveronfields
Livestockoutputsoldoff-farm
OUT3
(N,P&K)
Milk*,eggs,chicken(1.3kg),goat(30kg),sheep(30
kg),cattle(500kg)thataresoldproducts
Livestockhouseholdconsumption
OUT4
(N,P&K)
Chicken(1.3kg),goat(30kg),sheep(30kg),cattle(500
kg)thatareconsumedbyhousehold
Removalinharvestedproductsoldoff-farm
OUT5
(N,P&K)
Kocho,bula,ensetleaves,maizegrain,barleygrain,
cabbage,onionleafandroot,coffeeberry,coffeebean,
dwarfkhatleavesandtwigs,tallkhatleavesandtwigs
thataresoldproducts
* butterisincludedinthisoutputNote:Forlivestock,ifthewholeanimalissoldthewholeanimal’snutrientcontentisaccounted
for.AssumedbodyweightsarelistedinTable4.3.

pg.41
The formula used to extract macronutrient amount from these outputs is presented below
(Equation4.3):
Foreachindividualfarm’s(notrepresentativefarm)output:
`&a = b ∗ %cd ∗ #
e =`&a
f
Where`&a = g"hij#&aik(#a"gj&#ajl("hℎk#$kmk$&"nl"ig(kg/farm/yr)
b = l"ig(i − i(qjia($j&aq&ajl("hℎk#$kmk$&"nl"ig
%cd = q(ih(#a"r($iQg"aa(i
# = #&aik(#ahj#a(#a % jlj&aq&a
e = "m(i"r(g"hij#&aik(#a"gj&#aljii(qi('(#a"akm(l"ig(sr/l"ig/Qi)
f = #&gR(ijlk#$kmk$&"nl"ig'tkaℎk#i(qi('(#a"akm(l"ig
Onceeisestablishedforalloutputs,thesum(∑)canbetakenforeachcomponent(Equation
4.4).
uvf = w=
=
Equation4.4isrepeatedforeachmacronutrient(N/P/K).
4.4.5THEHARVESTINDEX
Nutrient removal in crop residue (OUT3) from maize and barley was calculated using the
harvest index (HI). The harvest index is defined as the kg of grain divided by the total kg of
abovegroundbiomass(stover/strawplusgrain).
x"im('ak#$(P = srjlri"k#/(srjl'ajm(i/'ai"t + srjlri"k#)
TheHIusedforbarleywas0.39andtheHIusedformaizewas0.52(Mellisseetal.,inprep.).
4.4.6THEENSETEXCEPTION
Determiningthemacronutrientcontentfromensetrequiresparticularattention.Forperennial
cashcropscoffeeandkhat,theyieldisharvestedtwotofourtimesayear.Annualcerealsand
vegetablesareannualcropswhichperformtheirentirelifecyclefromseedtoflowerwithinone
growingseason.
(Equation4.3)
(Equation4.4)
(Equation4.5)

pg.42
Enset isanexception.Withinthehomegarden,enset is theonlycropwhich isnotharvested
each year. In fact, as the primary subsistence crop and staple food, the enset harvest is
dependentonhouseholddemand.Onlysomeoftheavailableensetplantsareharvestedevery
year,andfourpossibleoutputsareproduced:kocho,bula,fibreandleaves.However,fibrewas
excludedfromthisstudyasitscarcelycontainsnutrientsandensetleavesareaccountedforas
internalfodder.Thatleaveskochoandbula.Thenutrientcontentfortheseoutputsarelistedin
thetablebelow(Table4.5).Ensetoutputsaretypicallyrecordedinchinet,whichequals50kg.
First,outputswereconvertedintokilogramsanddrymatter.Second,DM(kg)istakenoverthe
allocatedensetlandarea(ha)togettheharvestedyieldinDM(kg)perhaperyear.Third,the
yield (DMkg/farm/yr)wasmultipliedby thenutrientcontentof the respectiveoutput (%DM
output).Thiswastheresultperindividualfarmanditwasrepeatedforallindividualfarms,for
each macronutrient. The calculation was performed at component and farm level. For
componentlevel,allharvestedoutput(OUT1)wastakenintoaccount.Forthefarmlevel,only
theharvestedoutputthatissold(OUT5)istakenintoaccount.Amean(±SD)wastakenforeach
macronutrientforboththecomponentandfarmlevel,foreachrepresentativefarm.
P = Q ∗ 50sr
N = P ∗ %cd
R = >
.
h = R ∗ f/w/zhj#a(#ak#(#'(aj&aq&a(%cd(#'(aj&aq&a)
e =h
f
WhereP = "gj&#ajlli('ℎ(#'(aj&aq&a(sr) (Equation4.6) Q = "gj&#ajlli('ℎ(#'(aj&aq&a(k#hℎk#(a = 50sr)
N = "gj&#ajl(#'(aj&aq&ak#cd(sr)
" = n"#$"i(""nnjh"a($aj(#'(ah&nakm"akj#(ℎ")
R = "gj&#ajlcd(#'(aj&aq&a(sr/l"ig/Qi)
h = g"hij#&aik(#a"gj&#ajl(#'(aj&aq&a(sr/l"ig/Qi)
e = "m(i"r(g"hij#&aik(#a"gj&#ajl(#'(aj&aq&a(sr/l"ig/Qi)
f = #&gR(ijlk#$kmk$&"nl"ig'tkaℎk#("hℎi(qi('(#a"akm(l"ig
Table 4.5 Enset output dry matter content (%DM) and nutrient contents (mean ±SD) (HU
AgriculturalCollegeSoilLab,2015;WondoGenetCollegeSoilLab,2015).
Output %DM Ncontent(%) Pcontent(%) Kcontent(%)
Kocho 31.15 1.14(±0.67) 0.15(±0.02) 0.63(±0.25)
Bula 53.69 0.99(±0.05) 0.27(±0.07) 0.46(±0.14)

pg.43
4.4.7COMPONENTLEVELANDFARMLEVELMACRONUTRIENTBALANCEAftermacronutrientamountswerecalculatedfrominputsandoutputs,thetwowerebalanced
inatthecomponentlevelandfarmlevel.Toindicateeitheranutrientsurplusordeficitforall
macronutrients,thisformulawasused(Equation4.6):
d"hij#&aik(#aR"n"#h( = #&aik(#ak#q&a– #&aik(#aj&aq&a(4.7)
Note:Anutrientsurplus=inputs>outputsandanutrientdeficit=outputs>inputs.
Tofinish,nutrientflowdiagramsforeachrepresentativefarmwereproduced(Figure4.3).The
diagrampresentstheinflowsandoutflowsthatareaccountedforatthefarmlevel.Allnutrient
flowsaredeterminedinkg/farm/yr.

pg.44
Wherefh = g"hij#&aik(#a(fwz)hj#a(#a(sr/l"ig/Qi)
e = n"#$"i(""nnjh"a($ajhijqh&nakm"akj#(ℎ")
l = #&gR(ijll"ig'(PℎkRkak#rhjgqj#(#ajlk#a(i('a
a = aja"n#&gR(ijll"ig'tkaℎk#ℎjg(r"i$(#aQq(
Figure 4.3:Ageneralnutrient flowdiagramofahomegarden system.Theblackdashed line
denotesthecomponentlevelboundaryofthefarm.Inflowsandoutflowsoutsidetheboundary
representthoseatthefarmlevel.Thin,graydashed linesdenoterelationshipsexcludedfrom
thestudy.Labels in italicsignify factorsnotquantified, forwhich itwasstillworth identifying
theirplacewithinthesystem.

pg.45
4.5ETHICALCONSIDERATIONS
Methods for this researchareheavily reliantondetailedsurveydata from63homegardens.
Thedataextractedfromthesesurveysmustbetreatedwithcareandconfidentiality.Duringthe
surveyprocess,theparticipantswerefullyinformedoftheaimsofthesurveyandconsentwas
obtainedtoparticipate.Althoughsurveyresultshavebeentranslatedandenteredintothedata
set,distinguishing factorsof farmersmaybepresent. Therefore,discretion is takenbynever
leavingthedatasetunattendedandtreatingfarmer’sidentifyinginformationwiththeutmost
confidentiality.
Issuesofprivacyareespeciallyimportantinlightofkhatcultivation.Khat’shigheconomicprice
increasinglyattractsthieves,especiallyatharvesttime.Itisnotuncommonforkhatfieldstobe
guarded24hoursaday,atandjustpriortotimeofharvest.Althoughkhatcultivation,saleand
use are legal in Ethiopia, it remains a banned substance inmost of the world. Research on
MNUE of khat-based cultivation may be seen as a hindrance to economic profitability by
farmers.Toavoidemotionaldistressofkhatfarmersandtoprotectownpersonalsafety,Ionly
visitedhomegardensunder theguidanceofDrs.Mellisse.ThroughouthisPhDresearch,Drs.
Mellissehasestablishedlong-standingandtrustingrelationshipswithfarmers.Thesebondsare
crucialtothesuccessofmyandDrs.Mellisse’sresearchandshouldneverbejeopardized.
Therearealsoethicalconsiderations fordatacollection.Thisstudyhas littlecontrolover the
ethical considerationsof the surveydesignandexecution,whichoccurred in2013.However,
withinthisstudy,moredatawascollectedwhilecarryingouttheoutlieraccuracycheck.When
visiting home gardens and conversing with farmers (albeit via a translator), an ethical duty
exists to respect each individual participant’s autonomy. As well, although some farmers
participatedinthesurveyin2013,theymaynothavethesameinclinationsin2015.Anethical
dutyalsoexiststoresistsolicitingandrespectthisdecision.
While carryingout thedataanalysis, ethics alsoplaya role. Forexample, all resultswhether
positive, significant or negative should be reported. Failing to report negative findings is
misconductandwillseverelyweakenthestudy’sconclusions.Also,thedataIcollectedtouse
shouldbewell-preservedforpotentialfutureresearch.Changingthehypothesisofthepaper,
using other research’s words or data and/or editing or producing false data are major
misconductsandaretobeavoidedatallcosts.
Overall, this study aims to improve farmer and academic knowledge on the macronutrient
inflows, outflowsandbalances across five representative farms.However, the roleof ethical
considerations in a study of this nature is not to be understated. By taking ethical
considerationsfordatacollectionandanalysis intoaccount,thisstudycansuccessfullyrealize
itsobjectives.

pg.46
5.RESULTS
Inthischaptertheresultsarepresented.First,therepresentativefarms,farmsizeandlivestock
populationresultsareshown.Second,nutrientflowsatthecomponentlevel,followedbythe
farm level, are presented in figures, elaborated in tables and illustrated in a nutrient flow
diagram for eachhomegarden type. Third, results are converted toper hectarebasis to aid
discussionandcomparativeanalysis.
5.1THEREPRESENTATIVEFARMS
Land use of representative farms expressed in area shares is presented in Figure 5.1. The
representativefarmforanenset-basedhomegarden,basedonninefarms,was1.10ha.Land
usecomprisedtwo-thirds(66%)ensetcultivation,aquarter(28%)ACVandasmallarea(6%)of
grazingland.Fababeans,acropexcludedfromthisstudy,andcoffee,whichwasonlypresent
on3of9farms,wereunaccountedfor.Theenset-basedrepresentativefarmdidnotproduce
anybula,theironlyensetoutputswerekochoandgrassfromensetfields.TheaverageTLUfor
this representative farm was 0.43 and there was little household consumption of livestock,
averagingat0.18,0.04and0.02kg/farm/yrofN,PandK,respectively.
Therepresentativeenset-coffeehomegarden,basedon18farmswas1.21ha.Thisistheonly
homegardensystemwith intercroppingofensetandcoffee (23%)andtheonlyonetoshow
traditionallycombinedproductionofthefoodcropenset(36%)andthecashcropcoffee(24%),
togethertakingup83%ofthe landarea.Theremaining landwasallocatedtoACV(10%)and
grazingland(7%).Theareaunaccountedforwascoveredinkhat,butonlyon8outof18farms,
excludingitfromtheanalysis.TheaverageTLUforanenset-coffeehomegardenwas0.46with
householdlivestockconsumptioncomparabletothatinanenset-basedhomegarden.
Therepresentativeenset-cereal-vegetablehomegarden,basedonninefarms,was1.15ha. It
cultivatedACV(49%),enset(32%)andgrazingland(19%).Noareaorcropwasunaccountedfor
in this home garden. Enset-cereal-vegetable home gardens did not cultivate anymaize, only
barley, cabbage and onion. The average TLU was 0.64 with identical household livestock
consumptionasanenset-basedsystem.
The representative enset-livestock home garden, based on nine farms,was 1.12 ha. Grazing
land is represented by 39% in the enset-livestock system, more than in any other
representative farm. The remaining area is cultivatedwith enset (34%), khat (20%) and ACV
(7%).Noareaor cropwasunaccounted for in this homegarden. TheaverageTLUwas0.77,
morethaninanyotherhomegarden.Householdlivestockconsumptionwasalsohigherthanin
anyothersystem,with1.40,0.09and0.11kg/farm/yrofN,PandK,respectively.

pg.47
Figure5.1:Landuseofrepresentativefarmsexpressedinareashares(%).

pg.48
Therepresentativekhat-basedhomegarden,basedon18farms,was1.03ha.Khatcultivationcoveredalmosthalfofthearea(45%),withrelativelyequalsharesofenset(24%),ACV(16%)andgrazingland(15%).Landuseunaccountedforwas8%,likelyattributedtopotatoes,acropexcludedfromthisanalysis,andcoffee,whichwasonlypresenton8of18farms.TheaverageTLUwas0.62,therewasnolivestockconsumedbykhat-basedhouseholds.
5.2FARMSIZEThe average farm size per householdwas not substantially different amongst the five homegardentypes.Thelargest(1.21ha)farmsizewasobservedfortheenset-coffeesystem,whilethe smallest (1.03 ha) was the khat-based system. The farm size in the other three homegardenswerebetween these twohomegarden types. Theaccuracyof farmer-reported farmsize was crosschecked bymeasuring the area of each land use typewith Global PositioningSystem(GPS)devices(Figure5.2).Thiswasdonefor24ofthe63farmssurveyed.ThescatterplotofGPSmeasured(independentvariable)againstfarmer-reported(dependantvariable)hadastrongrelationship,witharangeofcoefficientofdetermination(R2)valuesof0.6 to 0.9, except for ACV (R2 = 0.1) (Table 5.1). The relationshipwas stronger for perennialcrops(enset,coffee,khat)andpermanentlanduseofgrazinglandthanannual-basedlandusetypes, such as ACV. Of the permanent crops, grazing land had strongest relationship with acoefficientofdetermination(R2)valueofclosetoone.Acrossallhomegardensystems,grazingland is ubiquitous and its generally small landallocation is constant. For enset, as the staplecrop,alsoreportedandmeasuredareaswereinreasonableagreementwithanR2valueof0.82.Anydatapointabovethey=xlinearreferencelinerepresentsunder-reportingoflandsize,anydatabelowthelinerepresentsover-reportingOverall, 12 of 24 farmers over-reported their total land size, the other half under-reported.However,when ACVwere excluded due to their significant divergence (R2 = 0.11), 15 of 24farmerswere over-reportingwith on average 0.2 ha. On the contrary,when farmers under-reportedtheydidsobyanaverageof0.1ha.Table5.1:RegressionequationsandR-SquaredvaluesforGPSmeasured landsize(ha,x-axis)vs.farmerreportedlandsize(ha,y-axis)bycomponent.
Farmcomponent Equationsofregressionlines R-Squared(R2)Enset y=1.30x-0.03 0.82Coffee y=1.17x+0.05 0.69ECI y=0.75x-0.04 0.57ACV y=0.44x+0.17 0.11Khat y=0.90x+0.09 0.57
Grazingland y=0.82x+0.05 0.96Note:ECI=Enset+coffeeintercrop,ACV=Annualcerealsandvegetables

pg.49
Figure5.2:GPSmeasuredlandsize(ha)vs.farmerreportedlandsize(ha)byfarmcomponent.

pg.50
5.3LIVESTOCKPOPULATIONLivestock isanessentialcomponentof thehomegardensystem.AverageTLUwascalculatedfor each representative farm and plotted against area share of grazing land (ha) for eachrepresentative farm(Figure5.3).Thedatapointsareclose to the linear trend linewithanR2valueof 0.90.A positive correlation also exists between TLU and area shareof grazing land.When TLU increases, the area share allocated to grazing land grows. A logical correlation ashigherTLUcharacteristicallyrequiresgreatershareofgrazingland.
Figure 5.3: Area share of grazing land (ha) in each representative farm vs. average TropicalLivestockUnit(TLU)foreachrepresentativefarm,byhomegardentype.
Enset-based
Enset-cereal-vegetable
Enset-coffee
Enset-livestock
Khat-based

pg.51
5.4COMPONENTLEVELNUTRIENTBALANCEASSESSMENTThe balances were calculated by aggregating the inflows and outflows across all farmcomponents (enset, coffee,enset+coffee intercropping,annual cerealsandvegetables,khatand livestock)within the representative farms.Allnutrientamountsare reported inkilogramper farm per year (kg/farm/yr). This section also presents nutrient flow diagrams for eachrepresentativefarm.
5.4.1ENSET-BASEDFigure 5.4 shows the component level nutrient inflows, outflows and balances for an enset-based representative farm. In an enset-based system, organicmatter (IN2) was the primarysourceofNPKtoenset.Itsupplies108kgofN,4kgofPand38kgofK.ThemajorinputsourceforACVwasmineralfertilizer(IN1),supplying14kgNand4kgP.Internalfodder(IN3)inputstolivestockcomponentwerelowestamongstallrepresentativefarmswith10kgN,4kgPand29 kg K. Enset-based farms also have the lowest TLU (0.43) indicating either a decreaseddemand for their own internal fodder use or the practice of feeding its internal fodder totemporarylivestock.Thispracticewouldnotbereportedontheinput/outputsurveybutcouldexplainthehighorganicmatteravailabletothesetypicallypoorer-farmers.Externalfodderwasverysmall,under0.5kgNPK.Outflows were primarily through removal in harvested products (OUT1), particularly ensetoutput(kocho)fromensetcomponentandACVoutput(barley).Cropresiduesweresosmall,N,PandKwereallunder0.5kgNPKfromACVcomponent.Removalthroughwholelivestockandlivestock products (OUT3) was 2 kg N from livestock component. Household livestockconsumption(OUT4)wasalsoverysmall,under0.5kgNPK.Nutrient balances in the components of enset-based farmswere nearly all positivewith theexceptionofasmallnegativeKbalanceintheACVcomponent.Nbalancesonensetfieldswerehighly positive, likely attributed to their exorbitant organicmatter inputs from their “guest”livestock. Pbalanceswere slightlypositiveorneutral throughout all three farmcomponents.ThelivestockKbalancewaspositive,butonlyduetoitshighKinputsfrominternalfodderandlack of K in its livestock outputs. Figure 5.5 presents the nutrient flows of the enset-basedsystem.

pg.52
Figure5.4:Componentlevelnutrientinflows,outflowsandbalancesforN,PandK(kg/farm/yr)foranenset-basedrepresentativefarm.

pg.53
Figure5.5:Nutrientflows(kg/farm/yr)thatinfluencesthepartialnutrientbalanceofanenset-basedsystem.Theasterisk(*)
afterorganicmatter(IN2)denotesthatthisinputlikelycamefromanexternalsource,as0.43TLUcouldnothaveproducedthismuchcompost.Theblackdashedlinedenotesthecomponentlevelboundaryofthefarm.Inflowsandoutflowsoutsidetheboundaryrepresentthoseatthefarm level. Thegraydashed linesdenoterelationshipswhichwereexcludedfromthestudy.Labelsinitalicsignifyfactorsnotquantified,forwhichitwasstillworthidentifyingtheirplacewithinthesystem.

pg.54
5.4.2ENSET-COFFEEFigure 5.6 shows the component level nutrient inflows, outflows and balances for an enset-coffeerepresentativefarm.Inanenset-coffeesystem,therewerelowermineralfertilizer(IN1)inputsthaninanenset-basedsystemanditwasonlyappliedtoACVfields.Theseinflowswerecalculatedtobe6kgNand2kgPintheACVcomponent.Itisalsothesmallestinfluxofmineralfertilizers amongst all representative farms. The other components (enset, coffee and ECI)reliedonorganicmatter.Themostwasappliedtointhecoffeecomponent,likelyprioritizedascoffeeistheprimarycashcropinthisrepresentativefarm.Farmersapplied11kgNand4kgKtothecoffeecomponent.Pamountonthesefieldswasunder0.5kg.Thelivestockcomponentreceived17kgN,5kgPand46kgKfrominternalfodder(IN3).Surprisingly,enset-coffeefarmshad the largest input of external fodder (IN4) amongst all representative farms. Inputs fromwheat bran and sugarcane tops combined were 5 kg N, 1 kg P and 8 kg K to the livestockcomponent.The amount of NPK removed from harvested products in enset-coffee farmswere relativelyequallydistributedamongsttheenset,coffeeandECIcomponents.Eachcomponentremoved5kgNand1kgP.Kvariedmore,with3kg,9kgand6kgremovedfromenset,coffeeandECIfields,respectively.NutrientremovalsfromtheACVcomponentwere2kgN,1kgPand1kgK.The enset-coffee representative farm was the only one with coffee and enset + coffeeintercropping and therefore the only home garden to display NPK influx and removal fromthese components. Nutrient removals from crop residues were negligible in the ACVcomponentandlivestockoutputswereslightwithjust2kgNinthelivestockcomponent.AcrossallcomponentsNbalanceswerepositive.Thehighestwas in the livestockcomponentwithanNsurplusof20kgN.Forenset,coffeeandECI,PandKbalanceswereallnegativewiththelargestoncoffeefields(-5kgK).AlthoughtheACVcomponenthadapositivePbalance,itsKbalancewasalsonegative. Inanenset-coffeerepresentative farm,ACV fields receivedonlymineral fertilizerswhichdonotgivea sourceofK.On theotherhand,enset, coffeeandECIfarms do not receive enough organic matter and consequently inadequate amounts of K.Livestockbalanceswerepositive,almostmatchingNPKinputsasthereissolittleoutputfromthelivestockcomponent.Figure5.7presentsthenutrientflowsoftheenset-coffeesystem.

pg.55
Figure5.6:Componentlevelnutrientinflows,outflowsandbalancesforN,PandK(kg/farm/yr)foranenset-coffeerepresentativefarm.

pg.56
Figure5.7:Nutrientflows(kg/farm/yr)thatinfluencesthepartialnutrientbalanceofanenset-coffeesystem.Theblackdashedlinedenotesthecomponentlevelboundaryofthefarm.Inflowsandoutflowsoutsidetheboundaryrepresentthoseatthefarmlevel. The gray dashed lines denote relationships which were excluded from the study. Labels in italic signify factors notquantified,forwhichitwasstillworthidentifyingtheirplacewithinthesystem.

pg.57
5.4.3ENSET-CEREAL-VEGETABLEFigure 5.8 presents the component level inflows, outflows and balances for an enset-cereal-vegetablerepresentativefarm.Inanenset-cereal-vegetablesystem,theensetcomponenthadorganicmatterinputsof23kgN,1kgPand8kgN.TheACVcomponenthadacombinationoforganicmatterandmineral fertilizerapplied, although itwasprimarily suppliedwithmineralfertilizers,with16kgNand8kgP.AsmallamountofK(2kg)wassuppliedwiththeorganicmatterintheACVcomponent.Acrossrepresentativefarms,bothenset-basedandenset-cereal-vegetable representative farms had the lowest influx of nutrients via internal fodder and noinputfromexternal fodder.NPK inputtothe livestockcomponentwas19kg,6kgand52kg,respectively.TheACVcomponentwasthelargestsourceofnutrientdepletioninanenset-cereal-vegetablesystembythenutrientremovalsofharvestedACVproducts,valuedat19kgN,7kgPand14kgK.Asignalthesystemisappropriatelynamedafteritsconsiderableannualcerealandvegetableproduction. The enset-cereal-vegetable systemwas the only one amongst all representativefarmstohaveanynutrientsremovedviacropresidues;thesewerevaluedat1kgNand1kgK.Thesecropresiduesareeitheraddedtothecompostpile,orusedaslivestockfeed.AsmallnegativePbalanceexisted intheensetcomponent.LargernegativePandKbalancesexisted in the ACV component. P was depleted by 7 kg and K was depleted 9 kg. Livestockbalanceswereverypositiveinthelivestockcomponent.Figure5.9presentsthenutrientflowsoftheenset-cereal-vegetablesystem.

pg.58
Figure5.8:Componentlevelnutrientinflows,outflowsandbalancesforN,PandK(kg/farm/yr)foranenset-cereal-vegetablerepresentativefarm.

pg.59
Figure5.9:Nutrientflows(kg/farm/yr)thatinfluencesthepartialnutrientbalanceofanenset-cereal-vegetablesystem.Theblackdashedlinedenotesthecomponentlevelboundaryofthefarm.Inflowsandoutflowsoutsidetheboundaryrepresentthoseatthefarm level. Thegraydashed lines denote relationshipswhichwereexcluded from the study. Labels in italic signify factorsnotquantified,forwhichitwasstillworthidentifyingtheirplacewithinthesystem.

pg.60
5.4.4ENSET-LIVESTOCKFigure5.10presentsthecomponentlevelinflows,outflowsandbalancesforanenset-livestockrepresentative farm. Enset-livestock farms have the largest land use allocated to livestock(grazingland=0.39ha)andthelargestTLU(0.77).However,theyhavelowerinfluxofexternalfodder than enset-coffee farms, with 1 kg N and 1 kg fromwheat bran and sugarcane top.Inputsofsugarcanetopswereonlyobservedin1of9surveyedfarmswithintheenset-livestockrepresentativefarm.Internalfodderinputswerehighestamongstallrepresentativefarms,butonlyslightly.Influxesofnutrientsfromensetleavesandgrasseswerecalculatedat22kgN,8kgPand66kgKtothelivestockcomponent.Theenset-livestockrepresentativefarmisoneoftwowhichallocateslandtokhat,theotherbeingthekhat-basedsystem.Thischangecausesaspikeinmineralfertilizer.Thekhatcomponentinenset-livestockfarmsreceived25kgNand4kgP.The ACV component received substantially lower mineral fertilizers with 1 kg N. The ensetcomponentreliedonorganicmatterwith13kgNand4kgK.Compared to enset-cereal-vegetable farms, enset-livestock systems saw a drastic drop ofmacronutrientsremovedviaharvestedACVproductswith1kgN,1kgPand1kgK,removed.Enset-livestockfarmsproduceverylittleACVoutput.Thekhatcomponentdepleted7kgN,2kgPand8kgK.Livestockoutputsrosesubstantiallywith17kgN,4kgPand3kgPremovedviaeitherwholelivestockorlivestockproducts.Householdlivestockconsumptionremovedonly1kg N but was the only representative farm to do so. Dismal figures for household livestockconsumptionacrossrepresentativefarmssuggestlivestockconsumptionisoflittlerelevanceinall of these systems andmay only occur for special occasions. Harvested products from theensetcomponentremoved9kgN,1kgPand7kgK.The introduction of khat, which receives only mineral fertilizers in an enset-livestockrepresentative farm,has introducedKdeficiencieson these fields. In thisassessment,khat isdepletingsoilof-8kgKperyear.TheensetcomponentalsoobservenegativebalancesforbothPandK; likelya resultof receiving too littleorganicmatter.TheACVcomponent receives solittleorganicmatter,only1kgNisappliedandvirtuallynonutrientsareremoved.Thisleavesanegative, but small, N balance. Figure 5.11 presents the nutrient flows of the enset-cereal-vegetablesystem.

pg.61
Figure 5.10: Component level nutrient inflows, outflows and balances for N, P and K(kg/farm/yr)foranenset-livestockrepresentativefarm.

pg.62
Figure 5.11: Nutrient flows (kg/farm/yr) that influences the partial nutrient balance of an enset-livestock system. The blackdashedlinedenotesthecomponentlevelboundaryofthefarm.Inflowsandoutflowsoutsidetheboundaryrepresentthoseatthefarm level. Thegraydashed lines denote relationshipswhichwereexcluded from the study. Labels in italic signify factorsnotquantified,forwhichitwasstillworthidentifyingtheirplacewithinthesystem.

pg.63
5.4.5KHAT-BASEDFigure 5.12 presents the component level inflows, outflows and balances for a khat-basedrepresentativefarm.Theinfluxesofmineralfertilizersinthissystemarethehighestamongstallrepresentativefarms. Inthekhatcomponent,83kgNand13kgPwasappliedtokhatfields.MineralfertilizerswerealsoappliedtoACVfieldswith9kgNand4kgP.Organicmatterwasapplied to theenset componentwith12 kgNand4 kgK added. Internal fodderwason thelowerspectrum,secondtolastamongstallrepresentativefarms.Theywerevaluedat14kgN,4kgPand39kgK.Externalfodderwerevaluedat4kgN,1kgPand3kgK,justbehindenset-coffeesystems,inthelivestockcomponent.Thekhat-basedrepresentativefarmwasaptlynamedforits10kgN,3gPand10kgKremovalfromthekhatcomponent,thelargestamongstallfarmtypes.Thesystemremoved4kgN,3kgPand3kgKfromitsACVcomponentand7kgN,1kgPand3kgKfromitsensetcomponent.Nutrientremovalfromwholelivestockandlivestockproductswas8kgN,2kgPand2kgKandhouseholdlivestockconsumptionwasnon-existentinthelivestockcomponent.The K balance for the ACV component was slightly negative. The N balance for the khatcomponentwasverypositiveindicatingexcessivemineralfertilizerapplication.Khatfieldshada severe K deficiency of -10 kg. The remaining balances (enset component, livestockcomponent)weremainly positivewith the K balance in the livestock component being veryhigh.Figure5.13presentsthenutrientflowsoftheenset-cereal-vegetablesystem.Table 5.2 elaborates on the mean (±SD) component level NPK inflows (kg/farm/yr) by farmcomponent for each representative farm. The table separates NPK inputs by input source:mineral fertilizer (IN1) isDAPand/orurea,organicmatter (IN2) is compost, internal livestockfodder(IN3)isgrassorensetleavesandexternallivestockfodder(IN4)issugarcanetopand/orwheat bran. A code is assigned to each farm component and its respective output(s). In thebracketsbehindtheoutputfunctioncode(OUT)isthatoutput’sproduct.Forinstance,OUT1issplitintokochoandbulaproducts.Table5.3doesthesameforcomponentlevelNPKoutflows(kg/farm/yr)byfarmcomponentforeachrepresentativefarm.

pg.64
Figure 5.12: Component level nutrient inflows, outflows and balances for N, P and K(kg/farm/yr)forakhat-basedrepresentativefarm.

pg.65
Figure5.13:Nutrientflows(kg/farm/yr)thatinfluencesthenutrientbalanceofakhat-basedsystem.Theblackdashedlinedenotesthecomponentlevelboundaryofthefarm.Inflowsandoutflowsoutsidetheboundaryrepresentthoseatthefarmlevel. The gray dashed lines denote relationshipswhichwere excluded from the study. Labels in italic signify factors notquantified,forwhichitwasstillworthidentifyingtheirplacewithinthesystem.

pg.66
n n n n n n n n n n n n n n n
IN2 108 (±72) 9 4 (±3) 9 38 (±25) 9 7 (±6) 16 0 (±0) 16 3 (±2) 16 23 (±26) 9 1 (±1) 9 8 (±9) 9 13 (±14) 9 0 (±1) 9 4 (±5) 9 12 (±10) 18 0 (±0) 18 4 (±3) 18
Total 108 4 38 7 0 3 23 1 8 13 0 4 12 0 4IN2 11 (±10) 14 0 (±0) 14 4 (±3) 14Total 11 0 4IN2 6 (±6) 10 0 (±0) 10 2 (±2) 10Total 6 0 2
IN1(DAP) 4 (±3) 8 4 (±3) 8 2 (±2) 11 2 (±2) 11 7 (±5) 21 8 (±6) 21 3 (±2) 14 4 (±2) 14IN1(urea) 10 (±8) 8 5 (±5) 11 9 (±12) 21 5 (±6) 14
IN2 0 (±1) 8 0 (±0) 8 0 (±0) 8 7 (±8) 21 0 (±0) 21 2 (±3) 21 1 (±1) 7 0 (±0) 7 0 (±0) 7Total 14 4 0 6 2 23 8 2 1 0 0 9 4 0
IN1(DAP) 4 (±2) 8 4 (±2) 8 0 11 (±9) 17 13 (±10) 17IN1(urea) 21 (±11) 8 0 0 71 (±35) 17
IN2 0 0 0 0 (±0) 17 0 (±0) 17 0 (±0) 17Total 25 4 0 83 13 0
IN3(grass) 2 (±1) 6 1 (±0) 6 2 (±2) 6 5 (±5) 16 1 (±1) 16 6 (±6) 16 7 (±3) 9 2 (±1) 9 9 (±4) 9 5 (±2) 9 2 (±1) 9 7 (±3) 9 4 (±2) 16 1 (±1) 16 5 (±3) 16IN3(EL) 8 (±5) 8 3 (±2) 8 27 (±19) 8 12 (±9) 15 4 (±3) 15 40 (±30) 15 12 (±7) 9 4 (±2) 9 43 (±24) 9 17 (±5) 9 6 (±2) 9 59 (±18) 9 10 (±5) 18 3 (±2) 18 34 (±19) 18IN4(SCT) 3 (±4) 7 0 (±1) 7 7 (±10) 7 0 (n/a) 1 0 (n/a) 1 1 (n/a) 1 1 (±1) 8 0 (±0) 8 2 (±2) 8IN4(WB) 0 (±0) 3 0 (±0) 3 0 (±0) 3 2 (±2) 16 1 (±1) 16 1 (±1) 16 0 (±1) 5 0 (±0) 5 0 (±0) 5 1 (±1) 6 0 (±0) 6 0 (±0) 6 3 (±3) 10 1 (±1) 10 1 (±2) 10Total 10 4 29 22 6 54 19 6 52 23 8 67 17 5 42TSN 132 12 67 52 8 62 65 15 62 62 13 72 120 22 46
NKPNKP NKPNKP KP
Khat
Livestock
Enset
Coffee
ECI
ACV
Farmtype Farmtype FarmtypeEnset-cereal-vegetable Enset-livestock Khat-basedComponent
Inputfunction(IN)
Farmtype FarmtypeEnset-based Enset-coffee
N
Table5.2:Componentlevelmacronutrientinflows(kg/farm/yr)frommineralfertilizers(IN1),organicmatter(IN2),internalfodder(IN3)andexternalfodder(IN4)(mean±SD)byfarmcomponent,acrossfiverepresentativefarms.Note:EL=ensetleaves,SCT=sugarcanetopandWB=wheatbran.N/A=notapplicable,writteniftherewasonlyoneobservation.

pg.67
Table 5.3: Component level macronutrient outflows (kg/farm/yr) from removal in harvested products (OUT1), removal in cropresidues(OUT2),wholelivestockandlivestockproductssoldoff-farm(OUT3)andhouseholdlivestockconsumption(OUT4)(mean±SD)byfarmcomponent,acrossfiverepresentativefarms.
Note:N/A=notapplicable,writteniftherewasonlyoneobservation.ECIoutputreportedashalfofensetmacronutrientoutputandhalf of coffeemacronutrient output, due todata availability. Thismethod couldnot produce a value for standarddeviation andnumberofobservationsfortheECIcomponent.Thisisdenotedwithasmalldash.
n n n n n n n n n n n n n n n
OUT1(kocho) 24 (±19) 9 3 (±3) 9 13 (±11) 9 5 (±5) 16 1 (±1) 16 3 (±3) 16 10 (±5) 9 1 (±1) 9 6 (±3) 9 9 (±6) 9 1 (±1) 9 5 (±3) 9 6 (±4) 18 1 (±1) 18 0 (±0) 18
OUT1(bula) 0 (±0) 16 0 (±0) 16 0 (±0) 16 0 (±0) 6 0 (±0) 6 0 (±0) 6 0 (±0) 9 0 (±0) 9 0 (±0) 9 0 (±0) 17 0 (±0) 17 0 (±0) 17OUT1(leaves) 0 (±0) 3 0 (±0) 3 0 (±0) 3 0 (±0) 9 0 (±0) 9 2 (±1) 9 1 (±1) 13 0 (±0) 13 3 (±3) 13
Total 24 3 13 5 1 3 11 1 6 9 1 7 7 1 3OUT1(coffeeberry) 4 (±2) 18 1 (±1) 17 8 (±5) 18OUT1(coffeebean) 1 (±1) 17 0 (±0) 17 1 (±1) 17
Total 5 1 9OUT1(enset) 3 - - 0 - - 1 - -OUT1(coffee) 2 - - 0 - - 4 - -
Total 5 1 6OUT1(barley) 1 (±1) 4 1 (±0) 4 1 (±1) 4 0 (n/a) 1 0 (n/a) 1 0 (n/a) 1 2 (±1) 8 1 (±1) 8 1 (±1) 8 0 (n/a) 1 0 (n/a) 1 0 (n/a) 1 1 (±2) 5 1 (±1) 5 1 (±1) 5OUT1(maize) 1 (±1) 2 0 (±0) 2 0 (±0) 2 1 2 9 1 (±1) 9 1 (±1) 9 0 (±1) 3 0 (±1) 3 0 (±0) 3 3 (±4) 10 1 (±2) 10 1 (±2) 10
OUT1(cabbage) 0 (±1) 2 0 (±1) 2 0 (±1) 2 4 (±2) 5 5 (±3) 5 3 (±2) 5 0 (n/a) 1 0 (n/a) 1 0 (n/a) 1OUT1(onion) 0 (n/a) 1 0 (n/a) 1 0 (n/a) 1 13 (±8) 8 2 (±1) 8 9 (±5) 8OUT2(barley) 0 (±0) 4 0 (±0) 4 0 (±0) 4 0 (n/a) 1 0 (n/a) 1 0 (n/a) 1 1 (±0) 8 0 (±0) 8 1 (±0) 8 0 (n/a) 1 0 (n/a) 1 0 (n/a) 1 0 (±0) 5 0 (±0) 5 0 (±1) 5OUT2(maize) 0 (±0) 2 0 (±0) 2 0 (±0) 2 0 (±0) 9 0 (±1) 9 0 (±0) 9 0 (±0) 3 0 (±0) 3 0 (±0) 3 0 (±1) 10 1 (±2) 10 1 (±1) 10
Total 2 1 1 2 1 1 19 7 14 1 1 1 4 3 3OUT1(leaves,twigs) 7 (±5) 8 2 (±2) 8 8 (±5) 8 10 (±6) 18 3 (±2) 18 10 (±7) 18
Total 7 2 8 10 3 10OUT3 2 (±1) 8 0 (±0) 8 0 (±0) 8 2 (±1) 8 0 (±0) 8 0 (±0) 8 6 (±3) 8 2 (±1) 8 1 (±1) 8 17 (±9) 9 4 (±2) 9 3 (±1) 9 8 (±4) 18 2 (±1) 18 2 (±1) 18OUT4 0 (±1) 2 0 (±1) 2 0 (±1) 2 0 (n/a) 1 0 (n/a) 1 0 (n/a) 1 0 (±1) 4 0 (±0) 4 0 (±0) 4 1 (±1) 3 0 (±0) 3 0 (±0) 3Total 2 0 0 2 0 0 6 2 1 18 4 3 8 2 2TSN 28 5 15 18 4 19 36 11 21 36 8 18 28 9 18
N NKPNKP KPNKPNKP
Livestock
ACV
Khat
Enset
Coffee
ECI
Farmtype Farmtype Farmtype FarmtypeEnset-coffee Enset-cereal-vegetable Enset-livestock Khat-basedComponent
Outputfunction(OUT)
FarmtypeEnset-based

pg.68
5.5FARMLEVELNUTRIENTBALANCEASSESSMENTFigure5.14presents the farm level inflows,outflowsandbalances forNPKby representativefarm type. For the farm level nutrient balance assessment onlymineral fertilizers (IN1) andexternalfodder(IN4)inflowsweretakenintoaccount.Theoutflowsconsideredwerenutrientremovalinharvestedproductssoldoff-farm(OUT5)andwholelivestockandlivestockproductssoldoff-farm(OUT3).Atthefarmlevel,Nbalancesweremostvariedatthefarmlevel.Thoseofenset-based and enset-coffee farms were slightly positive. The N balance for enset-cereal-vegetablefarmswas-8kgNnegative.However,Figure5.9revealsthisisduetoenset-cereal-vegetable farms high livestock output but lack of external fodder. Enset-livestock and khat-based farms have very highN balances due to their highmineral fertilizer inputs. The khat-basedNbalanceisparticularlyhighat94kgN.Pbalanceswereneutralamongstallrepresentativefarms,exceptforthekhat-basedsystem.Inthisrepresentativefarm,Pincreasedwith12kg.Thiswasattributedtokhat-basedpropensityforhighmineral fertilizerapplication. In thiscase,DAPwas inexcessas it is theonlymineralfertilizertosupplyP.Kbalanceswerenegativethroughoutallrepresentativefarms.Kdeficienciesinenset-basedandenset-cereal-vegetablewereespeciallynoticeable.Figure5.5showsthenutrientoutputwithinenset harvested products, but no external inputs to enset fields. As such the K, which issufficientfrominternal input, isdeemedinsufficient. Infact,enset-fieldsreceive22kgKfromorganic matter in enset-based farms. K deficiency in enset-cereal-vegetable farms can beattributed to the largenutrient removal fromharvestedACVproducts soldoff-farmbutonlyfertilized with mineral N and P fertilizers (Figure 5.9). Crops fertilized only with mineralfertilizerswillfaceKdeficiencies.Enset-coffee,enset-livestockandkhat-basedsystemsallhadrelativelysimilarKdeficienciesatthefarmlevel.Theenset-coffeerepresentativefarmdoesnotreceive adequate organicmatter tomeet the amounts removed via harvested crops (Figure5.7).CoffeeespeciallyisaK-richcrop.Coffeeberrieshave3.19%Kandcoffeebeanshave2.16%K (Hawassa University Agricultural College Soil Laboratory, 2015; Wondo Genet College SoilLaboratory, 2015). Enset-livestock and khat-based farms had K deficiencies as K was neverappliedthroughexternalinputs.K scarcity in internal input-reliant farms is exaggerated in the farm level analysis as theassessmentdoesnottakeK inputs fromorganicmatterand internal fodder intoaccount.Forinstance,thehighpositiveKbalancesfrominternalfodder(especiallyensetleaveswith4.60%Kcontent (4.60%K) to livestock that is seen across all representative farms is concealed fromfarm balances. Table 5.4 elaborates on the mean (±SD) farm level macronutrient inflows(kg/farm/yr)andtotalsumofnutrient(TSN)frommineralfertilizers(IN1)andexternalfodder(IN4)by farmcomponent,across fiverepresentativefarms.Table5.5doesthesamefor farmlevel macronutrient outflows (kg/farm/yr) and total sum of nutrient (TSN) from removal inharvestedproducts soldoff-farm (OUT5)andwhole livestockand livestockproducts soldoff-farm(OUT3)byfarmcomponent,acrossfiverepresentativefarms.

pg.69
Figure5.14:Farmlevelnutrientinflows,outflowsandbalancesforN,PandK(kg/farm/yr)acrossrepresentativefarms.

pg.70
n n n n n n n n n n n n n n n
IN1(DAP) 4 (±3) 8 4 (±3) 8 2 (±2) 11 2 (±2) 11 7 (±5) 21 8 (±6) 21 3 (±2) 14 4 (±2) 14
IN1(urea) 10 (±8) 8 5 (±5) 11 9 (±12) 21 5 (±6) 14
Total 13 4 6 2 16 8 9 4
IN1(DAP) 4 (±2) 8 4 (±2) 8 0 11 (±9) 17 13 (±10) 17
IN1(urea) 21 (±11) 8 0 0 71 (±35) 17Total 25 4 82 13
IN4(SCT) 3 (±4) 7 0 (±1) 7 7 (±10) 7 0 (n/a) 1 0 (n/a) 1 1 (n/a) 1 1 (±1) 8 0 (±0) 8 2 (±2) 8IN4(WB) 0 (±0) 3 0 (±0) 3 0 (±0) 3 2 (±2) 16 1 (±1) 16 1 (±1) 16 0 (±1) 5 0 (±0) 5 0 (±0) 5 1 (±1) 6 0 (±0) 6 0 (±0) 6 3 (±3) 10 1 (±1) 10 1 (±2) 10Total 0 0 0 5 1 8 0 0 0 1 0 1 3 1 3TSN 14 4 0 11 3 8 16 8 0 27 4 1 94 18 3
NKPN NKPNKP KP
Khat
Livestock
ACV
NKP
Enset-based Enset-coffee Enset-cereal-vegetable Enset-livestock Khat-basedComponentInput
function(IN)
Farmtype Farmtype Farmtype Farmtype Farmtype
Table5.4:Farmlevelmacronutrientinflows(kg/farm/yr)frommineralfertilizers(IN1)andexternalfodder(IN4)(mean±SD)byfarmcomponent,acrossfiverepresentativefarms.Note:SCT=sugarcanetopandWB=wheatbran.N/A=notapplicable,writteniftherewasonlyoneobservation.

pg.71
n n n n n n n n n n n n n n n
Enset OUT5(kocho) 5 (±7) 9 1 (±1) 9 3 (±4) 9 1 (±2) 10 0 (±0) 10 0 (±1) 10 2 (±1) 7 0 (±0) 7 1 (±1) 7 0 (±0) 9 0 (±0) 9 0 (±0) 9 1 (±0) 18 0 (±0) 18 1 (±1) 18
OUT5(bula) 0 (±0) 2 0 (±0) 2 0 (±0) 2 0 (±0) 5 0 (±0) 5 0 (±0) 5 0 (±0) 6 0 (±0) 6 0 (±0) 6 0 (±0) 12 0 (±0) 12 0 (±0) 12
OUT5(leaves) 0 (±0) 3 0 (±0) 3 0 (±0) 3 0 (±0) 9 0 (±0) 9 2 (±1) 9 1 (±1) 13 0 (±0) 13 3 (±3) 13Total 5 1 3 1 0 0 2 0 1 0 0 0 1 0 1
Coffee OUT5(coffeeberry) 4 (±2) 18 1 (±0) 18 8 (±5) 18OUT5(coffeebean) 1 (±1) 14 0 (±0) 14 1 (±1) 14
Total 5 1 9ECI OUT5(enset) 1 - - 0 - - 0 - -
OUT5(coffee) 2 - - 0 - - 4 - -Total 3 0 4
ACV OUT5(barley) 0 (±0) 2 0 (±0) 2 0 (±0) 2 0 (±1) 2 0 (±1) 2 0 (±1) 2 0 (n/a) 1 0 (n/a) 1 0 (n/a) 1OUT5(maize) 0 (±1) 9 0 (±0) 9 0 (±0) 9 1 (±2) 4 0 (±1) 4 0 (±1) 4
OUT5(cabbage) 1 (±0) 2 1 (±0) 2 0 (±0) 2 3 (±3) 5 3 (±4) 5 3 (±2) 5OUT5(onion) 0 (n/a) 1 0 (n/a) 1 0 (n/a) 1 13 (±7) 8 2 (±1) 8 9 (±5) 8
Total 1 1 0 0 0 0 16 5 12 0 0 0 1 0 0Khat OUT5(leaves,twigs) 5 (±4) 8 2 (±1) 8 5 (±4) 8 10 (±6) 18 3 (±2) 18 10 (±7) 18
Total 5 2 5 10 3 10Livestock OUT3 2 (±1) 8 0 (±0) 8 0 (±0) 8 2 (±1) 8 0 (±0) 8 0 (±0) 8 6 (±3) 8 2 (±1) 8 1 (±1) 8 17 (±9) 9 4 (±2) 9 3 (±1) 9 8 (±4) 18 2 (±1) 18 2 (±1) 18
Total 2 0 0 2 0 0 6 2 1 17 4 3 8 2 2TSN 8 2 3 10 2 14 24 7 14 22 6 8 19 5 13
PN KPNKPNKPN
Farmtype
Enset-based Enset-coffee Enset-cereal-vegetable Enset-livestock Khat-basedComponentOutputfunction(OUT)
Farmtype Farmtype Farmtype Farmtype
KPNK
Table 5.5: Farm levelmacronutrient outflows (kg/farm/yr) from removal in harvested products sold off-farm (OUT5) andwholelivestockandlivestockproductssoldoff-farm(OUT3)(mean±SD)byfarmcomponent,acrossfiverepresentativefarms.Note:N/A=notapplicable,writteniftherewasonlyoneobservation.ECIoutputreportedashalfofensetmacronutrientoutputandhalf of coffeemacronutrient output, due todata availability. Thismethod couldnot produce a value for standarddeviation andnumberofobservationsfortheECIcomponent.Thisisdenotedwithasmalldash.

pg.72
5.6RESULTSPERHECTAREToeasecomparativeanalysiswithliteratureinthediscussion,theresultsforcropcomponents(enset, coffee, ECI, ACV and khat) originally reported in kg/farm/yr have been converted tokg/ha/yr. The livestock component was not converted to a per hectare basis because theinherentnatureoflivestockasananimal(andnotacrop)doesnotallowthisconversion.Table5.6showscomponentlevelmacronutrientinflows,outflowsandbalances(kg/ha/yr).Table5.7showsfarmlevelmacronutrientinflows,outflowsandbalances(kg/ha/yr).

pg.73
N FS N P FS P K FS K N FS N P FS P K FS K N FS N P FS P K FS K N FS N P FS P K FS K N FS N P FS P K FS K
IN 108 0.72 150 4 0.72 5 38 0.72 53 7 0.45 16 0 0.45 1 3 0.45 6 23 0.37 61 1 0.37 2 8 0.37 21 13 0.38 34 0 0.38 1 4 0.38 12 12 0.25 47 0 0.25 2 4 0.25 16
OUT 24 0.72 33 3 0.72 4 13 0.72 18 5 0.45 11 1 0.45 2 3 0.45 6 11 0.37 29 1 0.37 4 6 0.37 16 9 0.38 24 1 0.38 3 7 0.38 19 7 0.25 29 1 0.25 3 3 0.25 12BAL 84 0.72 117 1 0.72 1 25 0.72 34 2 0.45 5 0 0.45 -1 0 0.45 -1 12 0.37 33 -1 0.37 -2 2 0.37 6 4 0.38 9 -1 0.38 -2 -3 0.38 -7 4 0.25 18 0 0.25 -2 1 0.25 4IN 7 0.29 25 0 0.29 1 3 0.29 9OUT 5 0.29 16 1 0.29 3 9 0.29 31BAL 3 0.29 9 -1 0.29 -2 -6 0.29 -22IN 6 0.28 21 0 0.28 0 2 0.28 7OUT 5 0.28 18 1 0.28 4 6 0.28 21BAL 1 0.28 4 -1 0.28 -4 -4 0.28 -14IN 14 0.07 194 4 0.07 56 0 0.07 1 6 0.12 52 2 0.12 13 0 0.12 0 23 0.56 40 8 0.56 14 2 0.56 4 1 0.08 11 0 0.08 0 0 0.08 4 9 0.16 54 4 0.16 24 0 0.16 0OUT 2 0.07 28 1 0.07 18 1 0.07 18 2 0.12 14 1 0.12 7 1 0.12 10 19 0.56 34 7 0.56 13 14 0.56 25 1 0.08 17 1 0.08 10 1 0.08 10 4 0.16 22 3 0.16 17 3 0.16 18BAL 12 0.07 167 3 0.07 38 -1 0.07 -17 5 0.12 38 1 0.12 7 -1 0.12 -10 3 0.56 6 0 0.56 1 -12 0.56 -21 0 0.08 -6 -1 0.08 -9 0 0.08 -6 5 0.16 32 1 0.16 7 -3 0.16 -18IN 25 0.22 116 4 0.22 20 0 0.22 0 83 0.46 180 13 0.46 28 0 0.46 0OUT 7 0.22 32 2 0.22 10 8 0.22 35 10 0.46 21 3 0.46 7 10 0.46 23BAL 18 0.22 84 2 0.22 9 -8 0.22 -35 73 0.46 159 10 0.46 21 -10 0.46 -22IN 10 4 29 22 6 54 19 6 52 23 8 67 17 5 42OUT 2 0 0 2 0 0 6 2 1 18 4 3 8 2 2BAL 8 4 29 20 6 54 13 4 51 5 4 64 10 3 40
Farmtype Farmtype Farmtype Farmtype
Enset
Coffee
ECI
ACV
Khat
Livestock
Component
FarmtypeEnset-based Enset-coffee Enset-cereal-vegetable Enset-livestock Khat-based
Table5.6:Componentlevelmacronutrientinflows,outflowsandbalances(kg/ha/yr)byfarmcomponent,acrossfiverepresentativefarms.
Note:Non-boldednutrient(N/P/K)denotesoriginallyreportedmacronutrientamount(kg/farm/yr).FSdenotesfieldsizeadjustedasperlanduseallocationinrespectiverepresentativefarm.Boldednutrient(N/P/K)denotesmacronutrientamount(kg/ha/yr).

pg.74
N FS N P FS P K FS K N FS N P FS P K FS K N FS N P FS P K FS K N FS N P FS P K FS K N FS N P FS P K FS K
IN 0.72 0 0.72 0 0.72 0 0.45 0 0.45 0 0.45 0 0.37 0 0.37 0 0.37 0 0.38 0 0.38 0 0.38 0 0.25 0 0.25 0 0.25 0
OUT 5 0.72 7 1 0.72 1 3 0.72 4 1 0.45 2 0 0.45 0 0 0.45 0 2 0.37 5 0 0.37 0 1 0.37 3 0 0.38 1 0 0.38 0 0 0.38 0 1 0.25 4 0 0.25 0 1 0.25 4
BAL -5 0.72 -7 -1 0.72 -1 -3 0.72 -4 -1 0.45 -2 0 0.45 0 0 0.45 0 -2 0.37 -5 0 0.37 0 -1 0.37 -3 0 0.38 -1 0 0.38 0 0 0.38 0 -1 0.25 -4 0 0.25 0 -1 0.25 -4
IN 0.29 0 0.29 0 0.29 0OUT 5 0.29 16 1 0.29 3 9 0.29 31BAL -5 0.29 -16 -1 0.29 -3 -9 0.29 -31IN 0.28 0 0.28 0 0.28 0OUT 3 0.28 10 0 0.28 1 4 0.28 16BAL -3 0.28 -10 0 0.28 -1 -4 0.28 -16IN 13 0.07 190 4 0.07 56 0.07 0 6 0.12 52 2 0.12 13 0.12 0 16 0.56 29 8 0.56 14 0.56 0 0.08 0 0.08 0 0.08 0 9 0.16 54 4 0.16 24 0.16 0OUT 1 0.07 14 1 0.07 14 0 0.07 0 0 0.12 0 0 0.12 0 0 0.12 0 16 0.56 29 5 0.56 9 12 0.56 21 0 0.08 3 0 0.08 1 0 0.08 2 1 0.16 6 0 0.16 0 0 0.16 0BAL 12 0.07 176 3 0.07 42 0 0.07 0 6 0.12 52 2 0.12 13 0 0.12 0 0 0.56 0 3 0.56 5 -12 0.56 -21 0.08 -3 0.08 -1 0.08 -2 10 0.16 48 4 0.16 24 0 0.16 0IN 25 0.22 116 4 0.22 20 0.22 0 82 0.46 179 13 0.46 28 0.46 0OUT 5 0.22 23 2 0.22 9 5 0.22 23 10 0.46 21 3 0.46 7 10 0.46 23BAL 20 0.22 93 2 0.22 10 -5 0.22 -23 73 0.46 158 10 0.46 21 -10 0.46 -23IN 0 0 0 5 1 8 0 0 0 1 0 1 3 1 3OUT 2 0 0 2 0 0 6 2 1 17 4 3 8 2 2BAL -1 0 0 3 1 8 -6 -2 -1 -16 -4 -2 -4 -1 1
Coffee
Enset
Livestock
Khat
ACV
ECI
Component
Farmtype Farmtype Farmtype Farmtype FarmtypeEnset-based Enset-coffee Enset-cereal-vegetable Enset-livestock Khat-based
Table5.7:Farmlevelmacronutrientinflows,outflowsandbalances(kg/ha/yr)byfarmcomponent,acrossfiverepresentativefarms.Note:Non-boldednutrient(N/P/K)denotesoriginallyreportedmacronutrientamount(kg/farm/yr).FSdenotesfieldsizeadjustedasperlanduseallocationinrespectiverepresentativefarm.Boldednutrient(N/P/K)denotesmacronutrientamount(kg/ha/yr).

pg.75
6.DISCUSSIONTheexpansionofkhatcultivationhasprovidedashort-term,butuniqueopportunitytoquantifyandcomparenutrientinflowsandoutflowsoffivedistincthomegardentypesunderthesameconditions.Theaimofthisresearchwastoproducerepresentativefarmsforeachhomegardentype,quantifytheirmacronutrientinflowsandoutflowsandcomparebasedoncomponentandfarm levelnutrientbalances to improveunderstandingof these transitioning systems. In thischapteruncertainties regardingpartialnutrientbalancesand its implicationson this researcharedescribedinsection6.1.Theresultsofthisstudyareinterpreted,discussedandcomparedto recent literature in section 6.2. In section 6.3 suggestions for improvedmethodology andpossibilities for future researchareoutlined.To finish, section6.4 recommendsmanagementactions that can be taken to address nutrient deficiencies, and explores the nutrient-relatedconsequencesofkhatexpansion.
6.1UNCERTAINTIESOenemaetal.(2003)distinguishedpossiblesourcesofbiasesanderrorsinnutrientbalances.Inthisstudy,fivepotentialsourcesofbiaswereidentified:(i)personalbiases,(ii)samplingbiases,(iii)measurementbiases,(iv)datamanipulationbiasesand(v)biasesduetofraud.
i. Personalbiases.Whenconstructinganutrientbalance,itsboundariesareintheopinionof the researcher. The partial nutrient balancewas produced for the component andfarm level. Parameters (e.g. DEP, BNF, leaching, etc.) have been excluded asquantitative, regional-specific datawasnot available (Elias et al., 1998).Hadoutflowssuch as leaching, denitrification andwater erosion been included, the chiefly positivebalancesmay have neared equilibriumor even been pressed into a deficit. However,Elias et al. (1998) determined removal in harvested products (OUT1) and removal incrop residue (OUT3)were themajor causes of N and P export from the soil inmostfields.Thissuggeststhatdespiteexcludingsomeparameters,OUT1andOUT3actuallyprovideagoodindicationofnutrientremovalfromthesoil.Eliasetal.(1998)didpointout leaching and denitrification could have a considerable role in nutrient removal,based on estimations and assumptions. However, Elias’ team (1998) questioned theaccuracyof this findingbecause it reliedonestimationsandassumptions.Due to thisand the little conclusive evidence on best practices for leaching, denitrification andwatererosionestimationsinthisspecificagro-ecologicalzone,itwaselectedtoexcludetheseparametersastheirestimationwouldlikelyonlyincreaseerror.
ii. Samplingbiases.Withinnutrientbalanceassessments,samplingcanbealargepotential
source of bias when quantifying all nutrient losses, including leaching, volatilization,erosion and runoff (Oenema et al., 2003). Since this study elected to exclude theselossesfromtheresearch,thispotentialforbiaswasmoreorlessexcludedtoo.

pg.76
iii. Measurement biases. Laboratory analysis of nutrient content was performed forlivestock manure and all crop outputs, with the exception of cabbage as it was notsampled byMellisse et al. (in prep.). Livestock output nutrient contentwas obtainedfromliterature.ThelaboratoryanalysiswascompletedatHawassaUniversityCollegeofAgricultureforNcontentandWondoGenetCollegeofForestryandNaturalResourcesforPandKcontent.Poorcalibrationofequipment, incompletedissolutionandrushedextraction of nutrients are all sources of measurement bias (Oenema et al., 2003).Althoughthisresearch is relianton laboratoryresults, thestudyhas littlecontroloverthesebiasesbutshouldbementionedforcomprehensiveness.
iv. Datamanipulationbiases.Inthisresearch,inputsandoutputsof63homegardenswere
averaged, generalized and grouped by home garden type. Home garden types weredevelopedintorepresentativefarmmodels.Theseprovidedthemeansforcomparativeanalysis but increasesdatamanipulationby simplifying thehomegarden.As a result,some farms components were never defined, such as faba beans, a legume withpotentialforBNFbutonlyappearedin3of63farms.Potatoes,acashcrop,werealsonever defined as part of a component as it occurred on just 4 of 63 farms. Anotherexample was coffee. The traditional cash crop only qualified for the enset-coffeerepresentativefarm,eventhoughitwaspresentin8of18khat-basedfarms,narrowlymissingthe50%ormorequalificationcut-off.Datamanipulationbiasesintroducedcanalteranalyzes,butboundariesmustbedrawninanynutrientbalanceassessment.Laboratoryresultsofnutrientcontentwerealsoaveragedtosimplifythequantificationof nutrient inflows and outflows. With this you may introduce an inaccuracy. Forexample, the nutrient content of kocho was averaged from 3 to 7-year-old kochosampleseventhoughNandKcontentbothreducewithage.Anotherinstancewasthenutrientcontentoforganicmatter(IN2),whichwasaveragedacrossallhomegardens,eventhoughheterogeneitywithinfarmsisknowntooccur.
v. Biasesduetofraud.Oenemaetal. (2003)refertobiasesduetofraudasstakeholdersthatmaymanipulatethebudget tominimizeeconomicconsequences. In thisstudy, itseems exaggerated to accuse farmers of deceitfulness. In lieu of fraud, there can bebiasesduetofarmererroranddeliberateornot,farmerscanmisreportinputs,outputsand land size. When farmers report inputs, some have the tendency to report therecommendeddosevs.theactualdose.Whetherornotthisisafrequentoccurrenceisdifficulttomeasure,assomefarmersmayactuallyapplytherecommendedapplication.Recommended doses came about after Murphy (1963) reported survey resultsdemonstratingNandPwerelimitingcropproductioninEthiopia.
Reportedinputsmayalsobeskewediffarmersmisreportfieldandfarmsizes.Toextractnutrient amount, intensification variables aremeasured in per hectare terms (e.g. kgDAP/ha). Beegle et al. (2012) uncovered under- or overestimation of farm size canamplifymeasurement errors at smaller farm sizes. A conclusion especially relevant in

pg.77
thisstudy;whererepresentativefarmswere1.10,1.21,1.15,1.12and1.03haforenset-based, enset-coffee, enset-cereal-vegetable, enset-livestock and khat-based systems,respectively. When the dependant variable is measured in per hectare terms,misreporting farm sizes amplifies per hectare measurement error at very small farmsizes.Inthiscaseinputsandoutputsaremeasuredperfarm,althoughtheaveragefarmsizeofanyhomegardenisequalto1.12ha.Toassessthemeasurementarea,GPSfieldmeasurementsfrom24farmswereplottedagainstfarmer-reportedfieldsize.Halfover-reportedandhalfunder-reported.HoweverwhenACVfieldmeasurementswereexcludedfromtheanalysisduetotheirsignificantdivergence(R2=0.1119),63%offarmerswerefoundtohaveover-reportedtheirfieldsizesbyanaverageof0.2ha.One-fifthofahectareonanaveragefarmsizeof1.12haissubstantial.Inthequantificationofthenutrientbalance,itwasdebatedwhethertouseGPS measured or farmer-reported field sizes. Eventually farmer-reported field sizeswerefavouredasonly38%ofallfarmsstudiedhadbeenmeasuredviaGPS.Inaddition,farmer-reportedvalueswererecordedsixmonthspriortowhentheGPSmeasurementsweretaken.Assuchannualcomponents,likeannualcerealsandvegetableshadalreadybeenharvestedandreplacedwithanothercroporlaidfallow,renderingacomparisonofGPSmeasuredversusfarmer-reportedvaluesatoddswithoneanother.
Errors canoriginate fromspatial and temporal variabilityand showupas variance in results.Twoerrortypeswerealsoidentified:(i)samplingerrorsand(ii)measurementerrors.
i. Samplingerrors.Thenutrientbalanceassessmentinthisstudyisa‘snapshotintime’asitconsidersall inflowsandoutflowsoveroneyear.Therefore, itgivesan indicationofthe nutrient balances within that time span, but can say little about balances overtemporalscalesorextrapolateacrossspatialscales.Whensamplingorganicmatter(IN2)andcropoutputs,thereisalwaysvarianceinsoils,cropsandanimalwastes.Thisiseventhecasewhenbalancemarginsarestrict,asisthecasewiththisresearch.
ii. Measurement errors. Variations introduced in the determination of volume and
composition of samples can result in measurement errors. The study is unlike fromsimilar,research(Abrham,2014;Eliasetal.,1998)asitanalyzedthenutrientcontentofall crop outputs (OUT1) and organic matter (IN2). It relies heavily on the accuratemeasurementofthiscontentforitsanalysis.
6.2INTERPRETATIONANDDISCUSSIONOFRESULTSTheresultsareinterpretedbydiscussingthenutrient inputs,outputsandbalancesinitiallyonthefarm-scaleandthennarrowingintothecomponentlevel,byfarmcomponent. Toassistincomparative analysis, the results originally reported in kg/farm/yr have been converted tokg/ha/yr(Table5.7).Thelivestockcomponenthasbeenexcludedfromthisconversionas it is

pg.78
not possible to express livestock inflows and outflows per hectare. In this discussion, theexpressions ‘very strong’, ‘strong’, ‘moderate’ and ‘slight’ are used to describe nutrientbalances. The classification was originally put forward by Smaling (1993) and used in thenutrient balance assessment by Elias et al. (1998) to classify depletion. As such, the originalterms refer to nutrients lost, but this discussion will apply the same ranges for nutrientsaccumulated(Table6.1).SinceEliasetal.(1998)onlyclassifiedNandP;Kclassificationwillbebasedonhalfof the suggestedN ranges,asKbalancesweregenerally found tobehalfofNbalancesinthisnutrientbalanceassessment.Table6.1Nutrientbalanceanalysis interpretationcriteria(expressedaskgofnutrient lost(oradded)/ha/yr.
Classification N P K+ - + - + -
Verystrong >40 <-40 >7 <-7 >20 <-20Strong 20to40 -20to-40 4to7 -4to-7 10to20 -10to-20Moderate 10to20 -10to-20 2to4 -2to-4 5to10 -5to-10Slight <10 >-10 <2 >-2 <5 >-56.2.1FARMSIZEAgricultural economists have expressed concern over farmers’ self-reporting of land size(Carlettoetal.,2013).Tovalidatethiscritique,Mellisseetal.(inprep.)measuredfieldandfarmsize of 24 of the 63 surveyed farms using Global Positioning System (GPS) devices. The GPSmeasurementsputsidebysidewithfarmer-reporteddimensionsFigure5.2.ThedivergenceofACVisattributedtothetimelagbetweenfarmerreportingandGPSmeasurement.Mellisseetal. (in prep.) reported this was done six months apart at which point farmers have eitherharvested their ACV or switched to another crop. This also explained the coefficient ofdetermination(R2)valueof0.1119(Table5.1)forACV.Forcoffee,ECI,andkhatwereR2valuesof0.6904,0.5700and0.5737,respectively.Apossibleexplanationcouldbethenatureofthesecropsas cashcrops. Farmersmaybemore likely tounder-report their landsizeofprofitablecrops,especiallywhenrequestedtoreporttogovernmentofficials.
6.2.2FARMLEVELNUTRIENTBALANCES
Table6.2presentsonly the farmnutrientbalancesby representative farm.At the farm level,across all five representative farms,N balancesweremoderately to very strongly positive. Palso had mainly positive balances, but fluctuated from slight to very strong balances. TworepresentativefarmshadmoderatetostrongnegativePbalanceswhichwastheenset-coffeefarm system and enset-cereal-vegetable system, respectively. K had moderately negativebalances across all representative farms; except for enset-based which was only slightlynegative.Theresultsatfarmlevelarelogical.ThemineralfertilizerureaprovideshighNinput

pg.79
(45kgN/100kgurea),DAPalsoprovidesNinput(18kgN/100kgDAP)andasmallquantityofP(20kgP/100kgDAP).ThereisnoinputsourceofKatthefarmlevel.Thesefarmbalancesareasharp contrast to Stoorvogel, Smaling and Janssen’s (1993) national report on Ethiopia’snutrient depletion to be rising at -122 kgN/ha/yr, -13 kg P/ha/yr and -41 kg K/ha/yr,whichwere very strong depletions according to Smaling’s (1993) own interpretation criteria.However,extensivelandscapedifferencesmakedirectcomparisonsofanationwidebalancetoa woreda (district) specific balance—such as this study—nearly impossible. Moreover, theStoorvogel,SmalingandJanssenassessmenttookplaceovertwentyyearsago. Inthisperiod,inorganic fertilizer use rose dramatically (Abate et al., 2015; Kiros et al., 2012; Wallace &Knausenberger,1997)andcouldatleastpartiallyexplainwhyEthiopia’ssoilwassodepletedin1993.Infact,Stoorvogel,SmalingandJanssen(1993)foundthemostdepletednutrienttobeN(-122kgN/ha/yr),thenutrientmostprevalentinmineralfertilizers.Tenyearslater,Royetal.(2003)alsoestimatedEthiopia’snutrientbalancetobenegativeforallmacronutrients,with lossesof -47, -7 and -32 kg/ha/yr ofN, P andK, respectively. Thesedeficiencieswereconsideredverystrong(Table6.1;Smaling,1993).ComparedtoStoorvogel,Smalingand Janssen (1993),Ethiopia’snutrient levelshad improved.Since,NandPbalanceshadespecially improvedandwere lessnegative; this couldbeevidenceof increasedmineralfertilizeruseacrossEthiopia.Again,comparingthisstudy’sassessmenttothoseonanationalscale should be preceded with caution. Ethiopia’s landscape, soils and crop cultivation arehighlydiverse.However,sincethisresearchhadseveralcasesofpositivenutrientbalances,thepopular suggestion that all Ethiopian soil suffers from nutrient mining, certainly cannot begeneralizedacrossthecountry.Table 6.2 Farm partial nutrient balances (kg/ha/yr) by representative farm. The livestockcomponentisexcluded,buttheinternalinputofcompostisincluded.Representativefarm N P K
Enset-based 169 40 -4
Enset-coffee 12 -2 -9
Enset-cereal-vegetable 20 -6 -5
Enset-livestock 20 2 -7
Khat-based 76 10 -7
Negativenutrientbalancesareoftengrantedasevidenceofsoilnutrientdepletiononthefarm,nationalor largerscale.Frequently, theyareacall foralarm.Ethiopiansmallholderfarmsaresourcesofsurvivalandassumedtobecontinuouslyfarmed,withlimitedtimetoliefallowandhavenutrientsrestock.Asaresult,ithasbeenwidelyacknowledgedtheseplotsandfarmsmusthave nutrient depleted soils. However, Vanlauwe and Giller (2006) argue not all nutrientbalances are always negative. In fact, some plots have very high positive balances, likelythroughconcentrationofnutrientsfromotherpartsofthefarm(Vanlauwe&Giller,2006).Table6.2showsanexceptionallystrongNbalance for theenset-basedfarm,comparedtoallotherrepresentativefarms.This isasurprisingfindingasenset-basedfarmsreceiverelatively

pg.80
littleexternalinput.Uponfurtherinvestigation,theNsurpluswasdeemedparticularlyhighduetoitsconversiontokg/ha/yr.Theenset-basedfarmcultivatessomeACVonaverysmallplotofland (0.07 ha) and when its original mineral fertilizer input (IN1) of 12 kg N/farm/yr wasconvertedtohectarebasis,thevalueincreaseddramatically.ThenutrientbalanceassessmentbyEliasetal. (1998)was themost spatially relevant to thisresearchastheyassessedfarmingsystemsintheKindoKoishadistrictofWollaitainsouthernEthiopia,some150kmwestofSidamaandGedeo.Comparingonthisregionalscale,Eliasetal.(1998) foundNbalances tobenegativeacrossallhouseholdgroups (rich,medium,poorandverypoor)and thePbalance tobepositive formost farms (Table6.3).However, their studyestimatedremovalinleaching,denitrificationandwatererosion.Theresultwasanuncertaintyrangethoughtto includethe‘real’value(Royetal.,2003).TheinclusionoftheseparameterscouldexplaintheshifttoanegativeNfarmbalanceintheEliasetal.(1998)assessmentversusthepositivefarmbalanceobservedinthisresearch.Table6.3Farmnutrientbalances(kg/ha/yr)fordifferenthouseholdgroups(Eliasetal.,1998;adaptedfromRoyetal.,2013).
Households N P
Highland
Rich -47 11.7Medium -51 4.8Poor -19 3.6Verypoor -6 1.1
Lowland
Rich -49 30.5Medium -41 17.3Poor -55 3.8Verypoor -20 -1.6
Eliasetal.(1998)didnotquantifytheKbalanceastheyidentifiedonlyNandPasparticularlydeficient.Inthepaper,Eliasetal.arguedthatpotassiumwascommonlyavailableinEthiopiansoils and sufficient enough to satisfy crop requirements. Yet, K had moderately negativebalancesinfourrepresentativefarms,aslightnegativebalanceinonerepresentativefarmandthe only nutrient to have negative balances across all representative farms. Based on thisfinding, one may conclude K is in fact the most important nutrient to include in a balanceassessment. The farm level analysis does not present a full representation of what occurswithinahomegardensystem.Thefollowinganalysiswillbeonthecomponentlevel.
6.2.3COMPONENTLEVEL:ENSETNandKensetnutrientbalancesrevealverystrongsurplusesintheenset-basedsystem(Table6.4).Thesefieldshadaccumulationsof117kgN/ha/yrand34kgK/ha/yr,whereasthesecondhighestNsurpluswas33kgN/ha/yr(enset-cereal-vegetablesystem)andthesecondhighestP

pg.81
surpluswas6 kgP/ha/yr in the same system. This findingwasnotable as enset-based farmshavethesmallestallocationofgrazingland(6%)andsmallestaverageTLU(0.43)(Figure5.3).Onepossibleexplanationisthepracticeofpoorer,enset-basedfarmersallowingricherfarmer’scattlegrazeon their landand in returncollect the livestock’smanure for theirownuse.Thiscouldbe5-6cowsatanygiventime.Enset-basedfarmersmaylacklargegrazinglandplotsbutthey have a large supply of internal fodder, especially enset leaves, which could potentiallymakeupthedifference.Table6.4Ensetcomponentnutrientbalances(kg/ha/yr)byhomegardentype.Representativefarm Component N P KEnset-based Enset 117 1 34Enset-coffee Enset 5 -1 -1Enset-cereal-vegetable Enset 33 -2 6Enset-livestock Enset 9 -2 -7Khat-based Enset 18 -2 4Enset-coffeefarmsalsohadsmallgrazingland(7%)andlowaverageTLU(0.46)yetlackedthehighN surpluses found in enset-based systems. Enset-coffee farmersmay practice the samelivestock grazing formanure trade, butmay spreadout their acquiredorganicmatter acrosstheirenset,coffeeandenset-coffeeintercroppingfields.Theseplotsreceiveexclusivelyorganicmatterastheirsoleinput.
6.2.4COMPONENTLEVEL:COFFEEANDCOFFEE+ENSETINTERCROPPINGThetraditionalcashcroponlyappearedinenset-coffeesystems.Itscounterpart,intercroppingofensetandcoffeewasalsoonlypresentinthisrepresentativefarm.Despiteitsorganicmatterinputs, thePbalanceswereslightlyandmoderatelynegativeandtheKbalanceswerestrongandverystronglynegative, suggestingorganicmatteralone,at least in its current form,maynotbesufficientforthesecomponents.TheNbalancewasslightlypositivewith9Nkg/ha/yrand4Nkg/ha/yroncoffeeandECIplots,respectively(Table6.5).Table6.5Coffeeandenset+coffeeintercropping(ECI)componentnutrientbalances(kg/ha/yr)byhomegardentype.Representativefarm Component N P K
Enset-coffeeCoffee 9 -2 -22ECI 4 -4 -14
NegativePandKbalances forcoffeesimplypromotearguments in favourofkhatcultivationversus the age-old practice of coffee farming. If this persists, coffee cultivationmay depletecoffee and ECI plots of its P and K. However, temporal projections should be treated withcautioninnutrientbalanceassessments.Enset-coffeefarmsarethelowestreceiversofmineral

pg.82
fertilizers likely due to their small ACV allocation (10% land share) compared to enset-basedfarmswiththesecondlargestACVallocation(28%landshare).RecommendationstoboastP&KincoffeeandECIplotsareputforward.
6.2.5COMPONENTLEVEL:ANNUALCEREALSANDVEGETABLESAnnualcerealsandvegetableswerepresentineveryrepresentativefarmandrevealedmainlyslight tovery strongpositiveNbalances,mainly slight tovery strongpositivePbalancesandmoderatetoverystrongnegativeKbalances(Table6.6).NalsohadoneslightnegativebalanceandPhadoneverystrongnegativebalance.ThesefindingsindicatenutrientbalancesforACVvarysubstantially.ACV is theonlycomponenttoreceivemineral fertilizer (IN1)withsporadicquantitiesoforganicmatter(IN2),whichcouldexplain itsnegativeKbalances.Theextremely‘very strong’NandPbalances in theenset-based systemaredue to the system’s small landallocationforACV(0.07ha).Table6.6Annualcerealandvegetable(ACV)componentnutrientbalances(kg/ha/yr)byhomegardentype.Representativefarm Component N P K
Enset-based ACV 167 38 -17Enset-coffee ACV 38 7 -10Enset-cereal-vegetable ACV 6 1 -21Enset-livestock ACV -6 -9 -6Khat-based ACV 32 7 -18IntheKindoKoishadistrict,Eliasetal.(1998)alsoanalyzedthenutrientcompositionofannualcereals and vegetables. However, the only overlapping crop with this study wasmaize. ThereportonlyconsideredNandP,buttheyfoundthenutrientcomposition(%DM)formaizewas1.25 and 0.18, respectively. This study found 1.13 and 0.54 (%DM) formaize, a comparablenutrient composition. All values fit into the Stoorvogel and Smaling (1990) reported meanvalues from several countries across sub-Saharan Africa, except for 0.54 %DM of P whichexceededStoorvogelandSmaling’s(1990)0.15-0.27range.However,thesearethelowestandhighestquartilesfromseveralcountriesanddonotrepresentregionalvariation.
6.2.6COMPONENTLEVEL:KHATKhat,unsurprisingly,receivedthehighestquantityofmineralfertilizers,withanextremely‘verystrong’positiveNbalanceof159kgN/ha/yrinakhat-basedfarm.Traditionally,onlyensetandcoffeereceiveorganicmatterandmineralfertilizersarereservedforkhat.Occasionallyorganicmatter is applied to khat plots, but only in the khat-based representative farm. This is likelybecausetherewasanexcessoforganicmatterandfarmerswanttoencourageprofitablekhatcultivationanywaypossible.Despiteoccasionalcompostapplication,khatfieldsoftenhavethe
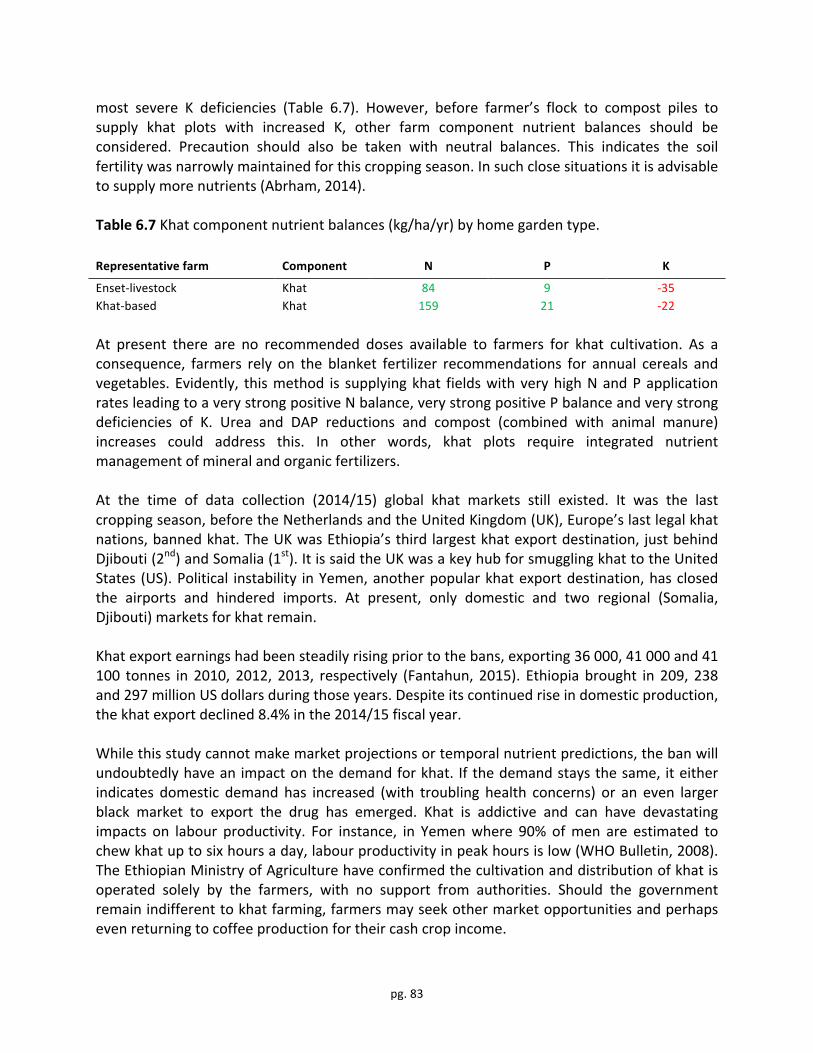
pg.83
most severe K deficiencies (Table 6.7). However, before farmer’s flock to compost piles tosupply khat plots with increased K, other farm component nutrient balances should beconsidered. Precaution should also be taken with neutral balances. This indicates the soilfertilitywasnarrowlymaintainedforthiscroppingseason.Insuchclosesituationsitisadvisabletosupplymorenutrients(Abrham,2014).Table6.7Khatcomponentnutrientbalances(kg/ha/yr)byhomegardentype.Representativefarm Component N P K
Enset-livestock Khat 84 9 -35Khat-based Khat 159 21 -22At present there are no recommended doses available to farmers for khat cultivation. As aconsequence, farmers rely on the blanket fertilizer recommendations for annual cereals andvegetables.Evidently, thismethod is supplyingkhat fieldswithveryhighNandPapplicationratesleadingtoaverystrongpositiveNbalance,verystrongpositivePbalanceandverystrongdeficiencies of K. Urea and DAP reductions and compost (combined with animal manure)increases could address this. In other words, khat plots require integrated nutrientmanagementofmineralandorganicfertilizers.At the time of data collection (2014/15) global khat markets still existed. It was the lastcroppingseason,beforetheNetherlandsandtheUnitedKingdom(UK),Europe’slastlegalkhatnations,bannedkhat.TheUKwasEthiopia’sthird largestkhatexportdestination, justbehindDjibouti(2nd)andSomalia(1st).ItissaidtheUKwasakeyhubforsmugglingkhattotheUnitedStates (US).Political instability inYemen,anotherpopularkhatexportdestination,hasclosedthe airports and hindered imports. At present, only domestic and two regional (Somalia,Djibouti)marketsforkhatremain.Khatexportearningshadbeensteadilyrisingpriortothebans,exporting36000,41000and41100 tonnes in 2010, 2012, 2013, respectively (Fantahun, 2015). Ethiopiabrought in 209, 238and297millionUSdollarsduringthoseyears.Despiteitscontinuedriseindomesticproduction,thekhatexportdeclined8.4%inthe2014/15fiscalyear.Whilethisstudycannotmakemarketprojectionsortemporalnutrientpredictions,thebanwillundoubtedlyhaveanimpactonthedemandforkhat. Ifthedemandstaysthesame, iteitherindicates domestic demand has increased (with troubling health concerns) or an even largerblack market to export the drug has emerged. Khat is addictive and can have devastatingimpacts on labour productivity. For instance, in Yemenwhere 90% ofmen are estimated tochewkhatuptosixhoursaday,labourproductivityinpeakhoursislow(WHOBulletin,2008).TheEthiopianMinistryofAgriculturehaveconfirmedthecultivationanddistributionofkhatisoperated solely by the farmers, with no support from authorities. Should the governmentremainindifferenttokhatfarming,farmersmayseekothermarketopportunitiesandperhapsevenreturningtocoffeeproductionfortheircashcropincome.

pg.84
6.2.7COMPONENTLEVEL:LIVESTOCKEthiopia’slivestockpopulationissaidtobethelargestinAfrica(CSA,2009).Ethiopiansassignhigh personal wealth and cultural value to the quality and quantity of their livestock. Thereplacementofensetwithkhatmonoculturehasinducedinternalfoddershortages.Mellisseetal.(inprep.)foundthistohavedirectrepercussionsonpercapitaherdsize,herdcompositionand the nutritional value of household diets. The main animal products sold off-farm aresourced from these livestock. More than any other component, livestock had slight tomoderatepositivebalancesforN,moderatetostrongpositivebalancesforPandverystrongpositivebalances forK (Table6.8).Thefollowingbalancesarepresented inkg/farm/yrasthelivestockcomponent(notacrop)cannotbeconvertedtokg/ha/yr.Table6.8Livestockcomponentnutrientbalances(kg/farm/yr)byhomegardentype.Representativefarm Component N P K
Enset-based Livestock 8 4 29Enset-coffee Livestock 20 6 54Enset-cereal-vegetable Livestock 13 4 51Enset-livestock Livestock 5 4 64Khat-based Livestock 10 3 40The livestock balance analyzed two inputs (IN3; IN4) and two outputs (OUT3; OUT4). Thelivestockbalancewaslikelyskewedpositivelyasitdoesnotaccountforlivestockthatremainsand circulates within the system for years. For this reason, livestock systems are inherentlydifferent fromcropping systemsand itsoutputs fromanimals andanimalsproducts soldoff-farm(OUT3)andhouseholdconsumption(OUT4)areonlyonepartoftheequation.Inaddition,twootheroutputswereexcluded:1)household consumptionofmilk andeggswasexcludedbecause there was no explicit data collected, and 2) manure as output from livestock wasexcludedbecausetherewerenocompositesamplestakenoffreshmanure.Freshmanureandcompost differ as compost is the mixture of manure and household refuse and throughcollectionandstoragehaslostsomeofitsoriginalnutrientcontent.The K influx from internal fodder (IN3) is 67 kg K/farm/yr at its largest in an enset-livestocksystem.TheKcontentofensetleavesislarge(4.60%)andmeanthighKinput.TheKsurplusisrevealed in Table 6.8 across all representative farms, but especially in the enset-livestocksystem(64kgK/ha/yr).Ensetleavessupplementgrassescollectedfromenset,coffeeandkhatfields.Relative tonutrient inflows from internal fodder,nutrient inputs fromexternal fodder(IN4)wassmall.Thelargestinputcameinanenset-coffeesystemwith14kgNPK/farm/yr.Eventhe enset-livestock supplied only 3 kgNPK/farm/yr of external fodder to its livestock. Enset-coffeefarmersspendanaverageof180ETB($8USD)onexternalfodder.Thisrepresents7%oftheiraveragetotalinputcosts.Forsuchsmallnutrientinflows,thismoneymaybebetterspentonotherfarmneeds.

pg.85
Ammonium volatilization of manure is likely a large nutrient loss factor in home gardens,particularlyinthelivestockcomponent.Inthisstudy,onlythenutrientcompositionofcompost(includingmanure)wasanalyzed.Ammoniumlossesareamplifiedwhenmanureisrepeatedlyhandled,stockpiledwhilstmoistand/ornotusedimmediately.Thisisespeciallytrueinwarm,dryconditionssimilartothoseinthestudyarea.Fieldobservationsrevealedtheorganicmatterwasstoredinanuncoveredpileclosetothehomestead.Nutrientcompositionoffreshmanurewasnottestedsoaveragelossescannotbeestimated.Norcouldaveragemanureproductionbased on TLU derive the amounts of manure necessary to meet nutrient requirements.However,Daviesetal. (2009)estimatedN lossesvaryfrom5-50%,P lossesvary3-30%andKlosses vary from 5-80%. Considering these potential losses, integration of better manurehandling techniques has vast potential to retain higher nutrient composition of manure,possibly correcting nutrient deficiencies. Overall, when negative nutrient balances areobserved,theyaremarginal,withthelargestat-9Kkg/ha/yr.Thisstudytookcompositesamplesofcompost,includingmanure,notfreshmanure.Compost(IN2)isappliedtofarmer’sfields,whilefreshmanureiscollected,mixedwithhouseholdwasteandstoredinanoutdoorpileuntilapplied.Similarcompositiondataofthisregionally-specificsort of compost could not be located in literature, but Elias et al. (1998) did sample freshmanureonsimilarhomegardens.Eliasetal.studiedfarmsinthehighlandsandlowlandsandsampledmanurefromeach.Forthepurposesofthiscomparison,onlythehighlandvaluesarepresented as this study’s farms were in the highlands andmidlands. Elias et al. (1998) alsoprovidedarangecollectedfromliteraturedata.ArangeforcompostfoundforCentralKenyanfarms(Lekasietal.,2003;Kimani&Lekasi,2004,ascitedinPauletal.,2009)isalsoincludedforacomparisonofcompost(Table6.9).Table6.9Nutrientcomposition(%)(indrymatter)ofmanure(Eliasetal.,1998),CentralKenyancompost(Lekasietal.,2003;Kimani&Lekasi,2004)andcompost(thisstudy).Material N(%) P(%) K(%)
Manure(Eliasetal.,1998) 1.68 0.23 Notsampled
Manurefromliteraturedata(Eliasetal.,1998) 1.1–1.7 0.13–0.26 NotincludedCentralKenyancompost(Lekasietal.,2003;Kimani&Lekasi,2004) 1.12(0.3-1.9) 0.3(0.1-0.8) 2.4(0.4-7)
Compost(IN2) 0.83 0.03 0.29
ComparedtothemanurenutrientcontentfromEliasetal.(1998),thecompostfromthisstudyhastwiceaslessNandseventimeslessP.Thisstudy’scompostnutrientlevelsarelowerthanthelowestendoftherangeprovidedfromliteraturedata(Eliasetal.,1998).However,Eliasandcolleagues(1998)providedvaluesformanurewhichwouldbeexpectedtobegreaterthanthatof compost, regardless. Inamoredirect comparison toCentralKenyancompost, this study’scompost does not fare any better. In fact, the P content given for Central Kenyan compost(0.3% P) exceeds that of manure by Elias et al. (1998) (0.23% P). N content of this study’scompost (0.83% N) was the only nutrient to fall into the Central Kenyan compost range

pg.86
(0.3%-1.9%). Overall, when compared to nutrient values of manure and compost fromliterature,thisstudy’scompostislowinallmacronutrients.6.3METHODOLOGICALIMPROVEMENTSANDSUGGESTIONSFORFURTHERRESEARCHDuring the courseof this research, three topics thatwerebeyond the scopeof this researchwere distinguished. These topics relate to parameter exclusion, comparative analysis andassemblyofthe‘ideal’homegarden.Dataavailabilitypreventeda‘complete’nutrientbalanceassessment. Quite often balance assessments rely on assumptions for their inflows andoutflows. In lieu of assumptions, this research elected to use farmer-reported survey data,laboratoryanalysisofcompositesamples,fieldobservationsandliteraturedata,butonlywhenacropwasnotsampled.Asaresultofnotassumingtheremainingprocessesnotcoveredunderthisdatacollection,notallnutrientlosseswereaccountedfor.ManynutrientbalanceassessmentsusetheearlierdevelopedmethodologybyStoorvogelandSmaling (1990) but use different transfer functions to estimate deposition, sedimentation,leaching and erosion. This results in methodological discrepancies and hinders regional,nationalandcontinentalcomparison.Lesschenetal.(2007)haveaimedtoimprovetheexistingmethodology by making it spatially explicit. Their study upgrades transfer functions andexplicitly models the uncertainties in estimations. Further research should demonstrate theeffectivenessofthisimprovedmethodology.For future balance assessments, composite samples should be taken for freshmanure. Thiswould add a significant outflow to the livestock component and give a more accuraterepresentation of the internal nutrient processes. Also a database of regionally specificassumptions for commonly excluded parameters could be constructed using the improvedmethodology(byLesschenetal.,2007).Thiscouldalsoimprovecomparativeanalysisbetweennutrientbalanceassessments.The ‘partial’ nutrient balance assessment as completed in this research really is partial. Itconsidersnutrientinputs,removalsandrecycling,butexcludesnutrientstocks.Toimprovethebalances,moresoil-andfield-levelmeasurementsarenecessary.Goodsamplingstrategiesarecrucial as soil properties are highly variable. Roy et al. (2003) insists soil property indicatorssuchas:clay/silt/sandcontent,pH,organiccarbon,etc.,needtobereadilymeasurableinordertopermittheexaminationoftheactual impactofalternativefarmingstrategies.Moreover, ifthe research aim is to influence management policies, nutrient balances are a much betterindicatorofsoilfertilitystatusiforiginalnutrientstocksaretakenintoaccount.Thisstudycomparedfarmlevelbalancesandcomponentlevelbalancestooneanother.Fromthesecomparisons, itcouldbetemptingtoassemblethe‘ideal’homegardenbycombiningamodelofmixedfarmcomponents.However,thisdependsonseveralfactorsbeyondthescope

pg.87
of this study, such as the socioeconomic status and personal wishes of the farmer.Socioeconomicstatusplaysaroleonthefarmer’saccessibilitytoexternalinputs(Mellisseetal.,in prep.). Further research could possibly establish the most ‘sustainable’ home garden butsustainabilitywouldrequirecleardefinitiontoaccomplishthis.Withamodelhomegarden inplace, and its effectiveness confirmed, it couldbe suggested to farmers as an alternative forkhatmonoculture.
6.4MANAGEMENTRECOMMENDATIONSComplete management decisions would require a complete nutrient balance assessment.However,thepartialnutrientbalanceassessmentcanprovideatoolformanagementpurposes.Through theuseofnutrienthotspot identification, threemanagement recommendations aresuggested. Thesemeasurements relate to enset leaves as crop residue or compost additive(6.4.1) and propermanure handling (6.4.2). To finish, the implications of khat expansion onnutrientflowsofthehomegardenaresummarized(6.4.3).Identifyingnutrienthotspotsindicateeitherlossesoraccumulationofnutrients.Slighttoverystrongnegativebalances(losses)shouldbeaddressedtopreventfurtherdepletion.Moderateto very strong positive balances (accumulation) should be addressed to exploit underusednutrients in other areas of the farm. Slight positive balances should remain to provide anutrient‘buffer’forfuturecroppingseasons.
6.4.1ENSETLEAVESASCROPRESIDUEORCOMPOSTADDITIVEOnthefarmlevel,K ismoderatelydeficient foreachrepresentativefarm.Onthecomponentlevel,slighttoverystrongKdeficienciesarevirtuallyubiquitousacrossallcomponentsamongstall representative farms,witha smallexceptionofpositivebalancesofensetcomponentsonthree representative farms. The other exception to the rule is the very strong positive Kbalancesoflivestockcomponents(Table6.8).TheseverystrongKbalancesshouldbeexploitedtoaddressthewidespreadKdeficiencies.ThepositiveKbalancesareattributedtothelargeKcontent(4.60%)ofensetleaves,theprimaryingredientininternalfodder.Althoughcompositesamplesonfreshmanurewerenotcollected,wecanderivefromthelownutrientcompositionofcompostthatitsKcontent(0.29%)maynotbeashighasitcouldbe.Insteadoffeedingallenset leaves, or selling excess for small profit, the leaves should be chopped and directlyappliedtoenset,coffee,ECI,ACVandkhatfields.Presently,allnaturally-occurringgrassesoncoffee,ACVand khat fields areharvested for additional livestock feed.Grasseshave someK(1.96%)butenset leavesboastovertwicetheKcontent.Addingenset leavesasadirectcropresiduecouldnotonlyaddressKdeficienciesbutalsoreplenishsoilorganicmatterandimprovesoil physical properties. This is especially relevant on ACV and khat fields which currentlyreceivenoorverylittleapplicationoforganicmatter.

pg.88
Anotheroptionisindirectapplicationbyaddingchoppedensetleavestocompost.Ensetleavesfedtolivestockwilleventuallyreturntothefieldasanimalwaste,butwilllikelyundergolargenutrientlossesbeforethen.Utilizingensetleavesasacompostadditivewillsupplementsomeofthisnutrientloss,especiallyK.
6.4.2PROPERMANUREHANDLINGAs seen in the comparative analysis of this study’s compost with that in the literature, thisstudy’scompostislowinN,PandK.Thissuggestscompostissubjecttolargenutrientlosses,whichresultinlower-nutrientcompost.Undermanurehandling,lossesarebyfarhighestforN,followedbyKandveryminimalforP.Atpresent,compostisstoredinanoutdoor,uncoveredpile,alsoreferredtoasfarmyardmanureintheliterature(Daviesetal.,2009).InZimbabwe,bettermanurequality andhighermaize yieldsdeduced lossesof ammoniaNwere lower formanurecompostedanaerobically(inapit)thancompostedaerobically(inanopen-airheapontheground)(Daviesetal.,2009).Therisk forN lossesaresaidto increasewithmoreaerobicstoragesystems(above-groundheaps).Rotz(2004)alsosuggestedundisturbednatural‘crusts’on topofamanurepitmaysubstantially reduceammonia losses. In the localcontext,wholeenset leaves placed over top of a dug-out pit of compost, may help retain better nutrientcontent.K losses, unlikeN losses, are not associatedwith high temperatures, but rather its ability toretain the liquidportionof themanure. Themost commonK loss fromcompost is from theleachingofsolublenutrients,particularlyfromurine.Urineisinherentlydifficulttomanage,butremainsthemostimportantprocesstoharnessKcontentincompost.Urineisideallystoredinaclosedpit.Anotheroption is that farmerscanaddurine tomanureheaps,but thismethodwouldrequireawater-tightbasetocollectleachedliquids.Neitheroftheseoptionsispracticalinthelocalcontextastheseimprovedsystemsdemandhigherlabourandfinancialinvestmentin storage facilities. Cheap and available ‘makeshift’ water-tight bases such as plastic oraluminum sheets could be tested, but further experimentation would be necessary to testeffectiveness.Farmerscouldalsocollecturineseparatelyanddraintheurinetoperennialcropsviachannels.However,eventhecollectionofurineposesaproblemaslivestockisconfinedtograzing land and their urine will infiltrate almost immediately. An additional suggestion toreduce K loss would be to applymanure directly as a nutrient source. Still this comes withconcerns about the quality of manure, as composting allows the killing of weed seeds,eliminationofpathogensandreductionofodorproblems.Losses of Pmay diminish under thesemanure handling strategies, but original P content inmanuretendstobeverylow,withlossesalreadyminimal.However,thereissomepotentialfortheimprovementofcompostmanagement,butitwillmainlyimproveNlosses.Implementingthesuggestedmanurehandlingpracticeofstoringcompactedcompostinanensetleaf-coveredpit,willreduceNlossandpossiblylessenKlosses.

pg.89
6.4.3NUTRIENT-RELATEDCONSEQUENCESOFKHATEXPANSIONRecommendationstointegrateorganicmatterandmineralfertilizeronnutrientdepletedfields(e.g. coffee,ACVandkhat)werenotofferedbecause increasingorganicmatter isanunlikelyoption, especially in light of khat expansion. Mellisse et al. (in prep.) have found thereplacementofensetwithkhatmonocultureto induce internal foddershortages,particularlyensetleaves.Thiswasestablishedtohavedirectrepercussionsonpercapitaherdsizeandherdcomposition. Abebe (2013) reported when livestock holding is low, manure productiondecreasesandresultsinreducedensetyieldsduetolackoforganicmatter.Instead, the management recommendations put the focus on maximizing the nutrientaccumulation revealed in the component and farm level nutrient balance assessments.However,theyrelyheavilyontheroleofenset.Abebe(2013)argues,“asensetproducesthehighestvolumeof foodperunitareaandtime,anddueto itsdifferentendusesanddiverseecologicalroles,thefutureofthesehomegardensdependonthemaintenanceofenset-basedstaple foodproduction,” (p.36).Thediversityand integrationof thesehomegardensupholdtheir stabilityandresilience.Expansionofkhatmonoculturenotonly threatensverystrongKdeficiencies, but forces home gardens into specialization. Ultimately puttingwell-establishedinternal nutrient flows in jeopardy. Khat’s profitability may prove to replace coffee as theprimary cash crop in Sidama and Gedeo, but tremendous caution should precede khatexpansiontothedetrimentofensetcultivation.Therefore,strategiesshouldbedevelopedtorapidlyreversekhatdevelopmentattheexpenseofenset.

pg.90
7.CONCLUSIONSTheaimof this researchwas to improve theunderstandingof inflows,outflowsand internalflows that make up the nutrient balance of transitioning home garden systems. In recentdecades,populationpressureinducedlandfragmentationhasdrivenhomegardenstorapidlyreplace enset and coffeewith khat. For proper insight in to the dynamics of this transition,representative farmswereconceived foreachhomegardentype—enset-based,enset-coffee,enset-cereal-vegetable, enset-livestock and khat-based—to illustratewhich farm componentsweremostsignificant ineachtype.Therepresentativefarmsrevealedenset,ACVandgrazinglandwereprevalentacrossalltypes,coffeeonlyexistedintheenset-coffeetypeandkhatwasprevalent in the enset-livestock and khat-based type.Macronutrient (NPK) inflows, outflowsand internal flows were quantified and the resulting balances were compared at thecomponentandfarmlevel.At the farm level, N balances were moderately to very strongly positive, P balances werestronglynegative to very stronglypositive andKbalancesweremoderatelynegative.On thecomponent level, N balances were slightly positive to very strongly positive and P balanceswereverystronglynegativetoverystronglypositive,acrossallrepresentativefarms.Kbalanceswere moderately to very strongly negative, with the exception of the enset and livestockcomponents. P balances fluctuate considerably based on internal and external inputs tocomponentsanditsnarrowinterpretationcriteria.Some inherent flaws to nutrient balance assessments and this study’s methodology wereoutlined. Methodological improvements and possibilities for future research included adatabase of regionally specific assumptions to aid local scale comparative analysis and soilnutrientstockanalysistobetterindicatesoilfertilitystatus.Most significantly, the balances revealed nutrient hotspots of very strong K depletion in thekhatcomponentandahotspotofverystrongKaccumulation in the livestockcomponent.TocapitalizeontheunderutilizedsupplyofK,asuggestiontouseensetleavesascropresidueoras a compost additive was offered. Use as a crop residue could directly boast the soil’s Kcontent.Reviewofliteratureshowedthecompostinthisstudyhaslowmacronutrientcontentin contrast to that in similar systems. Recommendations for proper manure handling weregiven.Althoughpotential forreductionsfrommanurenutrient lossexist,properhandlingwilllikelyimproveNandonlypartiallyimprovetheKcontent.Toconclude,itprovedvaluabletodevelopnotonlyafarmlevelnutrientbalanceassessment,butalsoacomponentlevelassessment,asitrevealedtheinherentdiversityandcomplexityofhome garden systems. Well-established internal nutrient flows sustain home gardens andcomponentlevelanalysisallowedcomparisonbetweentheseflows.Khatexpansionthreatensinternalflowsinapositivefeedback.Whenkhatexpansioninducesinternalfoddershortages,itcauses livestock holding to decrease, which cuts manure production. As a result, there is

pg.91
reduced enset cultivation, smaller enset yields and a consistent decline of internal fodder,especiallyensetleaves.Undercurrent trends,khatwill likely replacecoffeeas theprincipal cashcrop in the region’shomegardens(Mellisseetal.,inprep.).ThiswillintensifynutrientminingandinducefurtherKdeficiencies, a shortage which could be effectively addressed with the managementrecommendations put forward. However, these proposals are dependent on adequate ensetleafsupply. Ifkhatexpansionreduces leafsupply,strategiesshouldbeurgentlydevelopedtoreversekhatdevelopmentattheexpenseofensetplots.Forcenturies,thelong-termstabilityandsustainabilityofthesehomegardenswereattributedtoitsintimateassociationwithensetcultivation.Theresilientensetplanthasbeenhailedasthe‘treeagainsthunger’(Springetal.,1997)andcontributedtotheenvironmentbyimprovingnutrientbalancesinsoils(Eliasetal.,1998).Now,inthefaceofkhatexpansion,ensetleavesmayjustprovidethemeanstosecurethesurvivalofthehomegardensystem.

pg.92
8.REFERENCESAbate,T.,Shiferaw,B.,Menkir,A.,Wegary,D.,Kebede,Y.,Tesfaye,K.,Kassie,M.,Bogale,G.,Tadesse, B.& Keno, T. (2015). Factors that transformedmaize productivity in Ethiopia.FoodSecurity7:965–981.Abebe, T. (2005). Diversity in home garden agroforestry systems of southern Ethiopia. PhDDissertation,WageningenUniversity,TheNetherlands:1-143.Abebe,T.,Wiersum,K.F.,&Bongers,F.(2010).SpatialandtemporalvariationincropdiversityinagroforestryhomegardensofsouthernEthiopia.AgroforestrySystems78(3):309-322.Abebe,T.(2013).DeterminantsofcropdiversityandcompositioninEnset-coffeeagroforestryhomegardensofSouthernEthiopia.JournalofAgricultureandRuralDevelopmentintheTropicsandSubtropics114(1):29–38.Abera, K. (2013). Growth, productivity and nitrogen use efficiency ofmaize (Zeamays L.) asinfluenced by rate and time of nitrogen fertilizer application in Haramaya District. EasternEthiopia.Abrham,B.(2014).EstimatingSoilNutrientBalanceOfCerealLandsOfTigrayRegion,NorthernEthiopia(Doctoraldissertation,AAU).AgriculturalResearchCouncil[ARC].(1984).TheNutrientRequirementsofRuminantLivestockin:CommonwealthAgriculturalBureaux,FarnhamRoyal,UK.Amede, T. & Taboge, E. (2007). Optimizing Soil Fertility Gradients in the Enset (Enseteventricosum).Chapter26:SystemsoftheEthiopianHighlands:Trade-offsandLocalInnovations.In Advances in Integrated Soil Fertility management in Sub-Saharan Africa: Challenges andOpportunities,SpringerNetherlands:289-297.Araya, H., & Edwards, S. (2006). The Tigray experience: A success story in sustainableagriculture.EnvironmentandDevelopmentSeries4,ThirdWorldNetwork,Penang.RetrievedSeptember8,2015fromhttp://www.twnside.org.sg/title/end/ed04.htm.Beegle,K.,Carletto,C.,&Himelein,K.(2012).Reliabilityofrecallinagriculturaldata.JournalofDevelopmentEconomics98(1),34-41.Blazy, J.M., Ozier-Lafontaine, H., Doré, T., Thomas, A., &Wery, J. (2009). Amethodologicalframework that accounts for farmdiversity in theprototypingof cropmanagement systems.Applicationtobanana-basedsystemsinGuadeloupe.AgriculturalSystems101(1),30-41.

pg.93
Brandt,S.,Spring,A.,Hiebsch,C.J.,McCabe,T.,Tabogie,E.,Diro,M.,Wolde-Michael,G.,Yntiso,G., Shigeta, M., & Tesfaye, S. (1997). The 'Tree Against Hunger' Enset-Based AgriculturalsystemsinEthiopia,AmericanAssociationfortheAdvancementofScience.Carletto, C., Savastano, S., & Zezza, A. (2013). Fact or artifact: The impact of measurementerrorsonthefarmsize–productivityrelationship.JournalofDevelopmentEconomics103:254–261.CentralStatisticalAgencyofEthiopia[CSA]. (2007).The2007PopulationandHousingCensus:Resultsof SouthernNationsNationalitiesPeoplesRegion.Retrieved September3, 2015 fromhttp://unstats.un.org/unsd/censuskb20/Attachment489.aspx.Cherry,K.A.,M.Shepherd,P.J.A.Withers,andS.J.Mooney.2008.Assessingtheeffectivenessofactions tomitigatenutrient loss fromagriculture:Areviewofmethods.TheScienceof theTotalEnvironment406:1–23.CSA. (2007, December). Livestock Sample Survey (AgLVS 2006), version 1.0. RetrievedSeptember6,2015fromhttp://213.55.92.105/nada4/index.php/catalog/238.Cuttle,S.P.(2002).Nutrientbalancesasatoolforresearchersandfarmers.In:Powell,Janeandetal.,(Eds.)ProceedingsoftheUKOrganicResearch2002Conference,OrganicCentreWales,InstituteofRuralStudies,UniversityofWalesAberystwyth:153-156.Davies,O.,Wouters,A.P.,Gachimbi,L.,Zake,J.,Ergano,K.,Abduke,M.,&Keulen,H.V.(2009).Cattlemanuremanagement inEastAfrica:Reviewofmanurequalityandnutrient lossesandscenariosforcattleandmanuremanagement(No.258,p.47).Wageningen,theNetherlands:WageningenURLivestockResearch.Dessalegne,L.,Yesuf,M.,Bekele,A.,&Abera,D.(2012).Homegardensforfoodandnutritionsecurity:NationalappraisalandacasestudyinMeki-Zwayarea.StudyonHome GardenVegetableandFruitsProductioninEthiopia(CASCAPE):1-73.Dobermann, A.R. (2005). Nitrogen use efficiency–state of the art. University of Nebraska–LincolnAgronomy&HorticultureFacultyPublications:316-332.Elias,E. (2000).Soilenrichmentanddepletion insouthernEthiopia. International InstituteforEnvironmentandDevelopment:62-82.Elias, E. (2002). Farmers’ perceptions of soil fertility change andmanagement. ISD and SOS-SahelInternational(UK).EDMPrintingPress.AddisAbaba,Ethiopia.Elias, E.,Morse, S., & Belshaw, D. G. R. (1998). Nitrogen and phosphorus balances of KindoKoishafarmsinsouthernEthiopia.Agriculture,Ecosystems&Environment71(1),93-113.

pg.94
Esilaba, A. O., Nyende, P., Nalukenge, G., Byalebeka, J. B., Delve, R. J., & Ssali, H. (2005).Nutrient flows and nutrient balances for crop and animal production in smallholder farmingsystemsineasternUganda.Agriculture,Ecosystems&Environment109(3):192-201.Ethiopia Agricultural Transformation Agency [EATA]. (2014). Annual report 2013/2014:Transforming Agriculture in Ethiopia. Retrieved September 2, 2015 fromhttp://www.ata.gov.et/annualreport.Eyasu,E.(1997).SoilfertilitymanagementandnutrientbalanceinKindokoyishafarms:AcasestudyinNorthOmo,SouthernEthiopia,K.FRPtechnicalpamphlet,15.FAO.(1987).ICS-data,StatisticalDivision,FAO,Rome.Fantahun,A. (2015, July30).Ethiopia’skhatearnings indecline.EthiopiaObserver.RetrievedFebruary 12, 2016, from http://www.ethiopiaobserver.com/2015/08/ethiopias-khat-export-earnings-in-decline.Francom,M.G. (2015). Ethiopia aims to become one of theworld’s top 10 sugar producers.USDA Foreign Agricultural Service. Retrieved March 3, 2016 fromhttp://gain.fas.usda.gov/Recent%20GAIN%20Publications/Ethiopia%20Aims%20to%20/ecome%20One%20of%20the%20World%E2%80%99s%20Top%2010%20Sugar%20Producers%20_Addis%20Ababa_Ethiopia_11-5-2015.pdf.Gebremedhin, B., Hirpa, A., & Berhe, K. (2009). Feedmarketing in Ethiopia: Results of rapidmarketappraisal(No.15).InternationalLivestockResearchInstitute.Ghirotti, M. (1998). The role of livestock in mitigating land degradation, poverty and childmalnutrition in mixed farming systems: the case of coffee-growing midlands of Sidama,Ethiopia. Livestock and the Environment – International Conference: Animal Production andHealthDivisionbyFoodandAgricultureOrganizationoftheUnitedNations(FAO).Gourley,C.J.P.,Powell,J.M.,Dougherty,W.J.&Weaver,D.M.(2007).Nutrientbalancingasanapproach to improvingnutrientmanagementonAustraliandairy farms.Australian JournalofExperimentalAgriculture47:1064-1074.Haileslassie,A.,Priess, J.A.,Veldkamp,E.,&Lesschen, J.P. (2006). Smallholders’ soil fertilitymanagementintheCentralHighlandsofEthiopia:implicationsfornutrientstocks,balancesandsustainabilityofagroecosystems.NutrientCyclinginAgroecosystems75(1-3),135-146.HawassaUniversityAgriculturalCollegeSoilLaboratory.(2015).Hawassa,Ethiopia.Haque, T. (2006). Resource use efficiency in Indian agriculture. Indian Journal of AgricultureEconomics61(1):65-76.

pg.95
He,C.E.,Wang,X., Lui,X.,Fangmeier,A.,Christie,P.,&Zhang,F.Nitrogendepositionand itscontributiontonutrientinputstointensivelymanagedagriculturalecosystems.EcologyApplied20(1):80-90.Heuzé V., TranG., Baumont R., Noblet J., RenaudeauD., LessireM., Lebas F. (2015).Wheatbran.Feedipedia,aprogrammebyINRA,CIRAD,AFZandFAO.RetrievedOctober4,2015fromhttp://www.feedipedia.org/node/726.HeuzéV.,TranG.,ArchimèdeH.,LebasF.(2015).Sugarcanetops.Feedipedia,aprogrammebyINRA,CIRAD,AFZandFAO.RetrievedOctober4,2015fromhttp://feedipedia.org/node/558.Jackson-Smith,D.(2010).TowardSustainableAgriculturalSystemsinthe21stCentury.NationalAcademiesPress.Kelly, V.A., & Naseem, A. (2004). Fertilizer use in Sub-Saharan Africa: Types and amounts.AgriculturalSciences2:1-7.Kebede,M. (2012).Determinationof Soil P forOptimumDurumWheatProduction inAda’a,AkakiandChefeDonsaofTheEastShewa,OromiyaRegionalStateInCentralEthiopia.JournalofEnvironmentandEarthScience2(1):1-9.Kimani, S.K., & Lekasi, J.K. (2004). Managing manures throughout their production cycleenhancestheirusefulnessasfertilisers:Areview.In:BationoA.(Ed.)ManagingNutrientCyclestosustainSoilFertilityinSub-SaharanAfrica.CIAT-TSBF,Nairobi,Kenya.Kippie, K.T. (2002). 5000 years of sustainability? A case study on Gedeo land use. PhDDissertation,WageningenUniversity,TheNetherlands.Kiros,G.,Haile,M.,&Gebresamuel,G.(2012).Resourcesflowandnutrientsbalanceanalysis:Nutrientsflowassociatedwiththeresourcesandtheirimpactonsoilfertilitymanagement.PhDDissertation,AksumUniversity–ShireCampus.ISBN978-3-84-84-9928-1:1-69.Kiros, G., Haile, M., & Gebresamuel, G. (2014). Assessing the Input and Output Flows andNutrientsBalanceAnalysisatCatchmentLevelinNorthernEthiopia.JournalofSoilScienceandEnvironmentalManagement5(1),1-12.Kumar, B.M., & Nair, P.R. (2004). The enigma of tropical homegardens. In New vistas inagroforestry.SpringerNetherlands:132-152.Lekasi, J.K., Tanner, J.C., Kimani, S.K., Harris, P.J.C. (2003). Cattlemanure quality inMaraguaDistrict,CentralKenya:effectofmanagementpracticesanddevelopmentofsimplemethodsofassessment.Agriculture,EcosystemsandEnvironment94:289-298.

pg.96
Leng, R. A., & Preston, T. R. (1976). Sugar cane for cattle production, present constraints,perspectivesandresearchpriorities.TropicalAnimalProduction1:1-22.Lesschen,J.P.,Stoorvogel,J.J.,Smaling,E.M.A.,Heuvelink,G.B.M.,&Veldkamp,A.(2007).Aspatiallyexplicitmethodologytoquantifysoilnutrientbalancesandtheiruncertaintiesat thenationallevel.NutrientCyclinginAgroecosystems78(2):111-131.Mahala, A.G.,Mokhtar, A.M.S., Amasiab, E.O. & AttaElmnan, B.A. (2013). Sugarcane tops asanimal feed. International Research Journal of Agriculture Science and Soil Science 3(4): 147-151.Makken,F.(1993).NutrientsupplyanddistributionatcountrylevelcasestudyofMalawiandEthiopia.DutchAssociationofFertilizerProducers(VPK),Leidschendam:165-223.Mellisse, B.T., Van de Ven, G., & Descheemaeker, K. (in prep). Chapter One: Home gardensystem dynamics in Southern Ethiopia. PhD Dissertation, Wageningen University, TheNetherlands.MinistryofAgriculture (Ethiopia). (2000).Agro-ecological ZonationsofEthiopia.AddisAbaba,Ethiopia.Mitchell, C.C. (2008).Nutrient content of fertilizermaterials. AlabamaCooperative ExtensionSystem:AuburnUniversity.Munters, P. J. A. L. (1997). The Dutch Manure Policy: MINAS (Nutrient accounting system)ReportfromDutchDept.ofAgricultureoftheMinistryofAgriculture,NatureManagementandFisheries.FortheDanishFolketing.Murphy, H. F. (1963). Fertility and other data on some Ethiopian soils. Imperial EthiopianCollegeofAgricultureandMechanicalArts.Mwangi, W. M. (1996). Low use of fertilizers and low productivity in sub-Saharan Africa.NutrientCyclinginAgroecosystems47(2),135-147.Myburgh,J.,Osthoff,G.,Hugo,A.,DeWit,M.,Nel,K.,&Fourie,D.(2012).Comparisionofthemilk composition of free-ranging indigenous African cattle breeds. South African Journal ofAnimalScience42(1):2-14.Öborn,I.,Edwards,A.C.,Witter,E.,Oenema,O.,Ivarsson,K.,Withers,P.J.A.,...&Stinzing,A.R.(2003).Elementbalancesasatoolforsustainablenutrientmanagement:acriticalappraisalof their merits and limitations within an agronomic and environmental context. EuropeanJournalofAgronomy20(1):211-225.

pg.97
Oenema,O.,Kros,H.,&deVries,W.(2003).Approachesanduncertaintiesinnutrientbudgets:implications for nutrient management and environmental policies. European Journal ofAgronomy20(1),3-16.Paul, S.,Onduru,D.,Wouters, B.,Gachimbi, L., Zake, J.,& Ebanyat, P. (2009). CattlemanuremanagementinEastAfrica.Assessment94:289-298.Roe,M.,Pinchen,H.,Church,S.,&Finglas,P.(2012).Nutrientanalysisofeggs:analyticalreport.InstituteofFoodResearchUKDepartmentofHealth:2-44.Rotz, C.A. (2004). Management to reduce nitrogen losses in animal production. Journal ofAnimalScience82(13):119-137.Roy, R.N., Misra, R.V., Lesschen, J.P. & Smaling, E.M.A. (2003). Assessment of soil nutrientbalance: Approaches andmethodologies.FAO Fertilizer and PlantNutrition Bulletin 14. FoodandAgricultureOrganization,Rome.Smaling,E.M.A.(1993).Soilnutrientdepletioninsub-SaharanAfrica. In:VanReuler,H.,Prins,W.H. (Eds.),TheRoleofPlantNutrients forSustainableFoodCropProduction inSub-SaharanAfrica.DutchAssociationofFertilizerProducers(VKP),Leidschendam:232.Spring, A.,Hiebsch, C.,McCabe, J. T., Tabogie, E., Diro,M.,Wolde-Michael,G.,& Tesfaye, S.(1997).TheTreeAgainstHunger:Enset-BasedAgriculturalSysteminEthiopia.Washington,DC,USA:AmericanAssociationfortheAdvancementofScience.Stoorvogel,J.J.,&Smaling,E.M.A.(1990).AssessmentofsoilnutrientdepletioninSub-SaharanAfrica:1983-2000(Vol.1).Wageningen:WinandStaringCentre.Stoorvogel, J.J., Smaling, E.M.A., & Janssen, B.H. (1993). Calculating soil nutrient balances inAfricaatdifferentscales:I-supra-nationalscale.FertilizerResearch35:227-235.Syers, J.K. (1997).Managing soils for long-termproductivity. Philosophical TransactionsRoyalSocietyofLondon(B)352:1011-1021.Tadele, R. (2008). Farmer’s Perception of Environmental Degradation and Their Response toEnvironmentalManagement:ACaseofDaleWoreda,SidamaZone,SNNPR.Tena, W. & Beyene, S. (2011). Identification of growth limiting nutrient(s) in alfisols: Soilphysico-chemical properties, nutrient concentrations and biomass yield of maize. AmericanJournalofPlantNutritionandFertilizationTechnology1:23-35.The National Agricultural Library. (2015). United States Department of Agriculture.NationalNutrientDatabaseforStandardReferenceRelease28.

pg.98
Tizale,C.Y.(2007).ThedynamicsofsoildegradationandincentivesforoptimalmanagementintheCentralHighlandsofEthiopia.PhDDissertation,UniversityofPretoria,SouthAfrica.Tsegaye,Y.(2001).Coffee-Ensete-LivestockinteractionforsustainablelivelihoodintheSidamaareaofsouthernEthiopia.JournalofAgricultureintheTropicsandSubtropics102(2):119-131.United States Agency for International Development [USAID]. (2005). Southern Nations,Nationalities, and Peoples Region (SNNPR) Overview of Livelihood Profiles. USAID DisasterPrevention and Preparedness Commission (DPPC), The Government of Ethiopia. RetrievedOctober14,2015fromhttp://pdf.usaid.gov/pdf_docs/Pnadj867.pdf.Vanlauwe, B., & Giller, K. E. (2006). Popularmyths around soil fertilitymanagement in sub-SaharanAfrica.Agriculture,Ecosystems&Environment116(1),34-46.Van den Broek, J. & Van Hofwegen, G. (2013). Increasing nutrient use efficiency in Dutchagriculture. Retrieved September 20, 2015 from http://www.pbl.nl/sites/default/files/cms/publicaties/van_den_broek_-_verhoging_n-benutting.pdf.Van Ittersum, M.K., Claasen, G.D.H., Rossing, W.A.H., Schipper, R.A., Descheemaeker, K.,Stoorvogel, J.J., &De Ridder, N. (2014). Quantitative Analysis of LandUse SystemsQUALUS.Wageningen University PPS-30306 Course Guide: Plant Production Systems, OperationalResearchandLogistics,FarmingSystemsEcology,DevelopmentEconomics,SoilGeographyandLandscape.VanHeerden,S.M.,Schonfeldt,H.C.,Smith,M.F.,&JansenvanRensburg,D.M.(2002).NutrientcontentofSouthAfricanChickens.JournalofFoodCompositionandAnalysis15:47-64.Wallace,M.B.,&Knausenberger,W.I. (1997). Inorganic fertilizeruse inAfrica: Environmentaland economic distribution. Environmental and Natural Resources Policy and Training (EPAT)Project:WinrockInternationalEnvironmentalAlliance:1-53.Wander,M.(2015).Nutrientbalancebasicsfororganicfarming.eOrganic.RetrievedMarch3,2016 from http://articles.extension.org/pages/18794/nutrient-balance-basics-for-organic-farming-systems.Ward Jr, J.H. (1963). Hierarchical grouping to optimize an objective function. Journal of theAmericanStatisticalAssociation58(301),236-244.WondoGenetCollegeSoilLaboratory.(2015).WondoGenet,Ethiopia.

pg.99
7.APPENDICES
7.1CONVERSIONTABLE
Unit inkilogram(s)Chinet 50.00Cup(milk) 0.25Egg 0.06Ensetleaf 1.93Esir 1.00Gimbola 9.78Kutal 100.00Liter(milk) 1.00Shekim 12.48Zurba 1.00

pg.100
7.2NUTRIENTCONTENT
Croptype Specification Drymatter(%) N(ppm) TotalN(%) P(ppm) TotalP(%) K(ppm) TotalK(%) Reference(N) Reference(P&K)7year 31.15 4110 0.41 1301 0.13 3150 0.32 HawassaSoilLab(2015) WondoGenetSoilLab(2015)
6year 7520 0.75 1455 0.15 5175 0.52 HawassaSoilLab(2015) WondoGenetSoilLab(2015)
5year 8460 0.85 1828 0.18 9975 1.00 HawassaSoilLab(2015) WondoGenetSoilLab(2015)
4year 18330 1.83 1394 0.14 7200 0.72 HawassaSoilLab(2015) WondoGenetSoilLab(2015)
3year 18800 1.88 1642 0.16 6075 0.61 HawassaSoilLab(2015) WondoGenetSoilLab(2015)
Average 11444 1.14 1524 0.15 6315 0.637year 53.69 9870 0.99 1828 0.18 3650 0.37 HawassaSoilLab(2015) WondoGenetSoilLab(2015)
6year 9400 0.94 3321 0.33 6175 0.62 HawassaSoilLab(2015) WondoGenetSoilLab(2015)
5year 10340 1.03 3057 0.31 4050 0.41 HawassaSoilLab(2015) WondoGenetSoilLab(2015)
Average 9870 0.99 2736 0.27 4625 0.467year 12.85 13630 1.36 5187 0.52 44975 4.50 HawassaSoilLab(2015) WondoGenetSoilLab(2015)
6year 14.69 10340 1.03 4440 0.44 53000 5.30 HawassaSoilLab(2015) WondoGenetSoilLab(2015)
5year 15.11 16450 1.65 5560 0.56 45275 4.53 HawassaSoilLab(2015) WondoGenetSoilLab(2015)
4year 13.30 12220 1.22 3321 0.33 39625 3.96 HawassaSoilLab(2015) WondoGenetSoilLab(2015)
3year 12.76 13160 1.32 3881 0.39 47325 4.73 HawassaSoilLab(2015) WondoGenetSoilLab(2015)
Average 13.74 13160 1.32 4478 0.45 46040 4.60
Grass Fromkhat,enset
andcoffeefields33.00 16300 1.63 4900 0.49 19600 1.96 HawassaSoilLab(2015) WondoGenetSoilLab(2015)
Coffeeberry None 36.00 15510 1.55 3134 0.31 31875 3.19 HawassaSoilLab(2015) WondoGenetSoilLab(2015)
Coffeebean None 36.04 22090 2.21 4627 0.46 21625 2.16 HawassaSoilLab(2015) WondoGenetSoilLab(2015)
Grain 78.13 11750 1.18 6679 0.67 10200 1.02 HawassaSoilLab(2015) WondoGenetSoilLab(2015)
Grain 78.13 13160 1.32 7052 0.71 8200 0.82 HawassaSoilLab(2015) WondoGenetSoilLab(2015)
Grainaverage 78.13 12455 1.25 6866 0.69 9200 0.92Straw 71.24 7050 0.71 3694 0.37 2490 0.25 HawassaSoilLab(2015) WondoGenetSoilLab(2015)
Straw 71.24 5170 0.52 2388 0.24 14175 1.42 HawassaSoilLab(2015) WondoGenetSoilLab(2015)
Strawaverage 71.24 6110 0.61 3041 0.30 8333 0.83Grain 70.27 11280 1.13 5373 0.54 5075 0.51 HawassaSoilLab(2015) WondoGenetSoilLab(2015)
Stover 33.10 6580 0.66 16731 1.67 14175 1.42 HawassaSoilLab(2015) WondoGenetSoilLab(2015)
Cabbage None 25.00 20800 2.08 26000 2.60 16960 1.70 TheNationalAgriculturalLibrary(2015) TheNationalAgriculturalLibrary(2015)
Leaf 22.76 22090 2.21 5000 0.50 26750 2.68 HawassaSoilLab(2015) WondoGenetSoilLab(2015)
Root 22.76 49350 4.94 5000 0.50 24175 2.42 HawassaSoilLab(2015) WondoGenetSoilLab(2015)
Average 22.76 35720 3.57 5000 0.50 25463 2.55Dwarfleaf 33.79 11800 1.18 3838 0.38 13250 1.33 HawassaSoilLab(2015) WondoGenetSoilLab(2015)
Dwarftwigs 25.04 17400 1.74 5933 0.59 11125 1.11 HawassaSoilLab(2015) WondoGenetSoilLab(2015)
Tallleaf 34.40 14100 1.41 4254 0.43 18200 1.82 HawassaSoilLab(2015) WondoGenetSoilLab(2015)
Talltwigs 25.71 14100 1.41 4627 0.46 19750 1.98 HawassaSoilLab(2015) WondoGenetSoilLab(2015)
Average 29.74 14350 1.44 4663 0.47 15581 1.56Milk None n/a 3610 0.36 930 0.09 1550 0.16 Myburghetal.(2012) Myburghetal.(2012)
Butter Sameasmilk(forthis
study)n/a 3610 0.36 930 0.09 1550 0.16 Myburghetal.(2012) Myburghetal.(2012)
Eggs None n/a 2016 0.20 1450 0.15 1790 0.18 Roeetal.(2012) Roeetal.(2012)
Chicken
Bothmaleandfemale,
mineralsforraw
chickenmeatobtained
fromskin,whiteand
darkmeat(1.3kgbody
weightassumed)
n/a 84000 8.40 5380 0.54 6820 0.68 VanHeerdenetal.(2002) VanHeerdenetal.(2002)
Smallruminants(goat,sheep)
Male(30kgemptybody
weightassumed)n/a 25000 2.50 6000 0.60 2000 0.20 AgriculturalResearchCouncil(1984) AgriculturalResearchCouncil(1984)
Smallruminants(goat,sheep)
Female(30kgempty
bodyweightassumed)n/a 23000 2.30 6000 0.60 2000 0.20 AgriculturalResearchCouncil(1984) AgriculturalResearchCouncil(1984)
Largeruminant(cattle)
Bothmaleandfemale
(500kgtypicalmature
cowweightassumed)
n/a 24320 2.43 7233 0.72 1940 0.19 AgriculturalResearchCouncil(1984) AgriculturalResearchCouncil(1984)
Homegardencompost
Averageistaken.
Includesmanureand
householdleftovers
26.37 8300 0.83 300 0.03 2900 0.29 HawassaSoilLab(2015) WondoGenetSoilLab(2015)
Onion
Khat
Ensetkocho
Ensetbula
Ensetleaf
Barley
Maize

pg.101
Croptype Specification Drymatter(%) N(ppm) TotalN(%) P(ppm) TotalP(%) K(ppm) TotalK(%) Reference(N) Reference(P&K)7year 31.15 4110 0.41 1301 0.13 3150 0.32 HawassaSoilLab(2015) WondoGenetSoilLab(2015)
6year 7520 0.75 1455 0.15 5175 0.52 HawassaSoilLab(2015) WondoGenetSoilLab(2015)
5year 8460 0.85 1828 0.18 9975 1.00 HawassaSoilLab(2015) WondoGenetSoilLab(2015)
4year 18330 1.83 1394 0.14 7200 0.72 HawassaSoilLab(2015) WondoGenetSoilLab(2015)
3year 18800 1.88 1642 0.16 6075 0.61 HawassaSoilLab(2015) WondoGenetSoilLab(2015)
Average 11444 1.14 1524 0.15 6315 0.637year 53.69 9870 0.99 1828 0.18 3650 0.37 HawassaSoilLab(2015) WondoGenetSoilLab(2015)
6year 9400 0.94 3321 0.33 6175 0.62 HawassaSoilLab(2015) WondoGenetSoilLab(2015)
5year 10340 1.03 3057 0.31 4050 0.41 HawassaSoilLab(2015) WondoGenetSoilLab(2015)
Average 9870 0.99 2736 0.27 4625 0.467year 12.85 13630 1.36 5187 0.52 44975 4.50 HawassaSoilLab(2015) WondoGenetSoilLab(2015)
6year 14.69 10340 1.03 4440 0.44 53000 5.30 HawassaSoilLab(2015) WondoGenetSoilLab(2015)
5year 15.11 16450 1.65 5560 0.56 45275 4.53 HawassaSoilLab(2015) WondoGenetSoilLab(2015)
4year 13.30 12220 1.22 3321 0.33 39625 3.96 HawassaSoilLab(2015) WondoGenetSoilLab(2015)
3year 12.76 13160 1.32 3881 0.39 47325 4.73 HawassaSoilLab(2015) WondoGenetSoilLab(2015)
Average 13.74 13160 1.32 4478 0.45 46040 4.60
Grass Fromkhat,enset
andcoffeefields33.00 16300 1.63 4900 0.49 19600 1.96 HawassaSoilLab(2015) WondoGenetSoilLab(2015)
Coffeeberry None 36.00 15510 1.55 3134 0.31 31875 3.19 HawassaSoilLab(2015) WondoGenetSoilLab(2015)
Coffeebean None 36.04 22090 2.21 4627 0.46 21625 2.16 HawassaSoilLab(2015) WondoGenetSoilLab(2015)
Grain 78.13 11750 1.18 6679 0.67 10200 1.02 HawassaSoilLab(2015) WondoGenetSoilLab(2015)
Grain 78.13 13160 1.32 7052 0.71 8200 0.82 HawassaSoilLab(2015) WondoGenetSoilLab(2015)
Grainaverage 78.13 12455 1.25 6866 0.69 9200 0.92Straw 71.24 7050 0.71 3694 0.37 2490 0.25 HawassaSoilLab(2015) WondoGenetSoilLab(2015)
Straw 71.24 5170 0.52 2388 0.24 14175 1.42 HawassaSoilLab(2015) WondoGenetSoilLab(2015)
Strawaverage 71.24 6110 0.61 3041 0.30 8333 0.83Grain 70.27 11280 1.13 5373 0.54 5075 0.51 HawassaSoilLab(2015) WondoGenetSoilLab(2015)
Stover 33.10 6580 0.66 16731 1.67 14175 1.42 HawassaSoilLab(2015) WondoGenetSoilLab(2015)
Cabbage None 25.00 20800 2.08 26000 2.60 16960 1.70 TheNationalAgriculturalLibrary(2015) TheNationalAgriculturalLibrary(2015)
Leaf 22.76 22090 2.21 5000 0.50 26750 2.68 HawassaSoilLab(2015) WondoGenetSoilLab(2015)
Root 22.76 49350 4.94 5000 0.50 24175 2.42 HawassaSoilLab(2015) WondoGenetSoilLab(2015)
Average 22.76 35720 3.57 5000 0.50 25463 2.55Dwarfleaf 33.79 11800 1.18 3838 0.38 13250 1.33 HawassaSoilLab(2015) WondoGenetSoilLab(2015)
Dwarftwigs 25.04 17400 1.74 5933 0.59 11125 1.11 HawassaSoilLab(2015) WondoGenetSoilLab(2015)
Tallleaf 34.40 14100 1.41 4254 0.43 18200 1.82 HawassaSoilLab(2015) WondoGenetSoilLab(2015)
Talltwigs 25.71 14100 1.41 4627 0.46 19750 1.98 HawassaSoilLab(2015) WondoGenetSoilLab(2015)
Average 29.74 14350 1.44 4663 0.47 15581 1.56Milk None n/a 3610 0.36 930 0.09 1550 0.16 Myburghetal.(2012) Myburghetal.(2012)
Butter Sameasmilk(forthis
study)n/a 3610 0.36 930 0.09 1550 0.16 Myburghetal.(2012) Myburghetal.(2012)
Eggs None n/a 2016 0.20 1450 0.15 1790 0.18 Roeetal.(2012) Roeetal.(2012)
Chicken
Bothmaleandfemale,
mineralsforraw
chickenmeatobtained
fromskin,whiteand
darkmeat(1.3kgbody
weightassumed)
n/a 84000 8.40 5380 0.54 6820 0.68 VanHeerdenetal.(2002) VanHeerdenetal.(2002)
Smallruminants(goat,sheep)
Male(30kgemptybody
weightassumed)n/a 25000 2.50 6000 0.60 2000 0.20 AgriculturalResearchCouncil(1984) AgriculturalResearchCouncil(1984)
Smallruminants(goat,sheep)
Female(30kgempty
bodyweightassumed)n/a 23000 2.30 6000 0.60 2000 0.20 AgriculturalResearchCouncil(1984) AgriculturalResearchCouncil(1984)
Largeruminant(cattle)
Bothmaleandfemale
(500kgtypicalmature
cowweightassumed)
n/a 24320 2.43 7233 0.72 1940 0.19 AgriculturalResearchCouncil(1984) AgriculturalResearchCouncil(1984)
Homegardencompost
Averageistaken.
Includesmanureand
householdleftovers
26.37 8300 0.83 300 0.03 2900 0.29 HawassaSoilLab(2015) WondoGenetSoilLab(2015)
Onion
Khat
Ensetkocho
Ensetbula
Ensetleaf
Barley
Maize

pg.102
7.3SURVEY:INPUTSANDOUTPUTSINFIVEHOMEGARDENTYPESINSOUTHERNETHIOPIANameofhouseholdhead:Sex:
Woreda(District):
Kebele(Village):
Agro-ecology:Altitude:
DistancefromHawassa(km):
Distancefrommajorroads:Wealthstatus:
Coordinates:
Form1:Householdcomposition
HHM# Name Gender Age RelationtoHH Mainoccupation(1)
Mainoccupation(2) Educationlevel Presence(days
permonth)
HHM01
HHM02
HHM03
HHM04
HHM05
HHM06
HHM07
HHM08
HHM09
HHM10
HHM11
HHM12
HHM=householdmember

pg.103
Form2:Descriptionoffields(F)fromSeptember2014—August2015
Croptypeinspecificfield
Area(m2/ha)
DistancefromHS(m)
Inputtodifferentfields
Fertilizer Manure/compost Other DAP
(kg) Price When Urea(kg) Price When Quantity Unit When
(month)Herbicide(L/kg)
Priceperunit
When(month)
Frontyardgrazing
Enset Coffee Coffee+Enset
Khat Maize Barley Wheat Teff Vegetables Rootandtuber
Other Seed Malatine
(L/kg)Priceperunit(ዋጋ)
When(month)
DDT(L/kg)
Price(ዋጋ) When(month) Kilogram
Price(perkg)
Khat Maize Barely Wheat
Checklist:seed,fertilizer(e.g.DAP,urea),manure(e.g.FYMcattle,FYMchicken),pesticides(e.g.fungicide,herbicide,insecticide),hiredlabor(weedingforspecificF),machineryrent,croppingaids(sticks,plastic),fuelforirrigationandmore.

pg.104
Form2-I:Cropmanagement(inputsforeachspecificfield)
Nursery(seedbedpreparation) Transplanting/planting Weeding Harvesting/processing When
Date/MonthNo
labourPriceperunit/day
WhenDate/Month
Nolabour
Price/day
WhenDate/Month
Nolabour
Price/day
WhenDate/Month Nolabour Price/day
Enset
Coffee
Khat
Maize
Barley
Wheat
Teff
Vegetables
Rootandtuber

pg.105
Form2-O:Cropyields&residuemanagement(outputsfromeachfield)
Noensetharvested/cropyield Ensetleavesold No
FrequencyWhen
Date/MonthAmount(kg/localmeasurement) Amountsold(kg/localchinet)
Kocho Bula Kacha Kocho Price Bula Price Amountleave Price
Enset
Coffee Fresh Dry Fresh Price Dry Price
Timeofharvesting/year Harvest1 Harvest2 Harvest3 Harvest1 Price Harvest2 Price Harvest2 Price
1.September,2.March,3.June-July Nozurba Nozurba Nozurba Khat
Vegetables
Sugarcane Maize Barley Wheat Teff
Checklist:outputstoanywhere;cropproductsforsale(toEXT),forconsumption/storage(toSA),forprocessing(toOA);residuesforanimals(toAA)andcomposting.

pg.106
Form2A:Animalnumbersandchanges
AA(sub)type2014/2015 Sold(-) Born(+) Died(-) Consumed(-) Otherin(+) Otherout(-) Now(2015)
No. No No. No. No. No. No. No.LactatingCow Drycow Oxencastrated
Oxenintact(bull)
Heifer
Calves
Sheepadultmale Sheepyoungmale Sheepadultfemale
Sheepyoungfemale
Goatadultmale Goatyoungmale Goatadultfemale
Goatyoungfemale
Donkey Horse Chicken
Beestraditionalhive
Beesmodernhive

pg.107
Form2A-I:Animalfeeding&care(inputsinanimalactivities)
Checklist:inputsfromownfarm:ensetleaves,treetwigsandleaves,sugarcanetop,fodder.Purchased:purchasedfeeds(e.g.concentrates,cropresidues,saltlick,sugarcanetop),veterinaryservices.
Nameofproduct Ensetleave Grassfromyourfarm
(shekim) Concentrate Others Labour
Dryseason Rainyseason Rainyseason Dryseason Rainyseason Communalland Dry Rainy
No.enset(leaf/day) No.enset(leaf/day) Enset Coffee Khat Furushka
(kg) Price Furushka(kg) Price No.months
/year No No
Cattlecrossbred Cattleindigenous Sheep Goat Donkey Horse Chicken Treetwigsandleave Sugarcanetop Fodder Salt Medicine Dryseason Rainyseason Dry Rainy Dry Rainy Dry Price Rainy Price Cost(birr)Cattlecrossbred Cattleindigenous Sheep Goat Donkey Horse Chicken

pg.108
Form2-O:AA:Animalproduction(outputfromanimalactivities)
LivestocktypeMilk/butteroreggproduced(kg/liter) Sold
Milk/day Butter Egg/year Milk(kg)/day Price When Butter Price When Egg PriceCattlecrossbred Cattleindigenous Sheep Goat Chicken
Checklist:outputstoanywhere;animalproducts(milk,eggs,skins)forsale(toEXT)orforconsumption(toSA);manureandliveanimalforsale.
Form3-I:Manure&compostinputs(inputsinredistributionactivitiesortocompostpit)
Tocompostpit Tofieldsdirectly Ensetfield Coffeefield Khatfield
Cowdung Householdwaste Cowdung When(everydayorweekly
Cowdung
When(everydayorweekly
Cowdung
When(everydayorweekly
Cattle Sheep Goat Donkey Horse Chicken
Checklist:inputsfromoutsidepurchasedmanureandcompost,residuesforcomposting,compoststartersandenrichmentsorownfarm.

pg.109
Form3-O:Manure&compostmanagement(outputsfromredistributionactivitiesorfromcompostpit)
Fromcompostto... When(e.g.daily,weekly,monthly,
2timesayearetc.Quantityperapplicationtime
Unit Reason(saleorfields)
Ensetfield Coffeefield Ensetandcoffee Khatfield Maizefield Barleyfield Vegetablefield Assetsofthefarms No Price Cart Motorbike Car Mill Checklist:outputstoanywhere;compostandmanureforuseoncrops(toF)orsales(toEXT).

pg.110
Form4-I:Servicesobtainedathouseholdlevel(labourhirein)
To When What
No Date/Month Nameofservice/activities Quantity(no) Unit(mandayor---- Priceperunit Remarks
1 Khatfield
2 Ensetfield
3
4
5
6
7 Ext=externalchecklist.Form4-O:Off-farmlabor(servicesprovidedbyhouseholdmembersorlabourhireout)
HHM When What Responsible
No. Date/Month Nameofservice HHM# Quantity Unit(days) Priceperunit Remarks
1 Father
2 Son
3 Daughter
4
5
HHM;servicesprovidedbyhouseholdmembers;off-farmlabor(preferablyrecordedinno.ofdays),rentreceivedfromlandrentedout.

pg.111
Form5-I:Inputsintostock(externalinputsintostorageactivitiesorpurchaseditems)
No When What
Date/Month Nameofproduct Quantity Unit Priceperunit Remarks
1
2
3
4
5
Checklist:inputsfromoutside;purchasesofstaplefood(grainsandpulses)
Form5-O:Outputsfromstock(outputfromstorageactivities)
No When What
Date/Month Nameofproduct Quantity Unit Priceperunit Remarks(saleorsowing)
Checklist:outputstoanywhere;useofproductsinstockforsowing,sales(toEXT),andHouseholdconsumption.