what are the toxicological effects of mercury in arctic biota?
TRANSCRIPT

Chapter 6
What are the Toxicological Effects of Mercury in Arctic Biota?
Coordinating author: Rune Dietz
Co-authors: Niladri Basu, Birgit Braune, Todd O’Hara, Tony Scheuhammer, Christian Sonne
Data and sample contributors: Jon Aars, Magnus Andersen, Claus Andreasen, Dennis Andriashek, Gert Asmund, Aurore Aubail, Hans Baagøe, Erik Born, Hing Man Chan, Andrew E. Derocher, Phillippe Grandjean, Maja Kirkegaard, Katrina Knott, Nick Lunn, Francoise Messier, Marty Obbard, Morten T. Olsen,Sonja K. Ostertag, Elizabeth Peacock, Aristeo Renzoni, Frank F. Rigét, Janneche Utne Skaare, Gary Stern, Ian Stirling, Mitch Taylor, Øystein Wiig
investigation into toxicopathology and other measures of negative impacts (AMAP, 2004). Two approaches have generally been taken in identifying and estimating the risk of possible effects of Hg or other contaminants in Arctic species. The first involves a comparison of concentrations in Arctic species against known detrimental levels or toxicity thresholds. In most cases, the detrimental levels are derived from laboratory studies, semi-field studies or observations of affected animals in the wild, with varying levels of study design rigor and certainty with respect to the actual cause or causes. Extrapolation is routinely used in toxicology but difficulties in extrapolation relate generally to differences in sensitivity, where the same types of effects are seen but at different doses, or to differences in structure and function. These scenarios are also complicated by dose (exposure) reconstruction and range from high certainty of daily intake to very gross estimates. Comparison and extrapolation have some inherent weaknesses and lack of relevance, however. Laboratory animals are most often exposed to a single contaminant at high doses for short periods of time, and it is difficult to extrapolate the toxic effects seen at high acute doses to possible adverse effects at lower but chronic exposures. Wild animals are generally exposed to lower concentrations of Hg or other contaminants than laboratory animals, but they are exposed to mixtures of contaminants and other stressors, and they are exposed over their entire lifetime. In addition, captive animals tend to be housed under optimal conditions while free-ranging animals are experiencing a variety of stressors that may lower their resilience to toxicants. Differences in species sensitivities to the effects of contaminants make it difficult to know which of the tested species best represents those in the Arctic (e.g., Ross, 2000; O’Hara and Becker, 2003). The focus here has been on recent (i.e. post-2000) biotic concentration data from species and regions for which sufficient data are available. Only in cases where no post-2000 data were available or when clearly rising Hg trends were emerging were earlier data used to compare against toxicity threshold values. For some species and regions (stocks), the lack of raw data prevents an estimation of the percentage of the investigated populations exceeding reported threshold levels. The second approach involves the study of subtle indicators of biological responses (biomarkers) to contaminants. Examination of animals for responses known to be associated with the contaminants found in their tissues is possibly the only way to make a convincing case either for or against the hypothesis that potentially toxic substances are acting biologically on the animals. Biomarkers, typically, are measures
6.1. IntroductionPrevious AMAP assessments reported, as for other ecosystems, that the highest biological mercury (Hg) concentrations in the marine environment were found within the upper trophic levels (Dietz et al., 1998a,b; AMAP, 2005). Therefore, Hg effects assessments relating to those species considered at risk (i.e., with the highest presumed exposure) have been almost entirely carried out on species inhabiting this ecological niche both in the Arctic and at lower latitudes. For these reasons, this assessment focuses on addressing possible toxicological effects in marine animals with elevated Hg concentrations, as well as other higher trophic level species in the Arctic, rather than addressing the entire Arctic ecosystem. A recent review reported that Hg concentrations have increased over the past 150 years, resulting in more than 92% of the Hg body burden in higher trophic level species being of man-made origin (see Section 5.2; Dietz et al., 2009a). This means that many Arctic species are exposed to much higher Hg levels today than in historic times. Biological effects can be considered at different temporal and spatial scales and at varying levels of organization, from the molecular to the global level. Biomarkers measurable at the molecular level may respond early or at lower exposure concentrations than those at higher levels of organization but are not readily interpreted ecologically and may not easily be anchored with a phenotypic response (especially one that is clearly adverse). Bio-indicator measures with established ecological relevance, such as population declines or reduced reproductive rates, respond late or at higher concentrations in this cascade and usually involve multi-factorial scenarios that complicate diagnosis and thus implementation of preventive measures. Thus, these population level impacts are hard to detect and subtle, yet potentially significant for populations (especially those declining or targeted for recovery) and provide a difficult dilemma for scientists and managers. In the previous AMAP assessments (Dietz et al., 1998a,b; AMAP, 2005), there was limited information on the biological effects of heavy metals and persistent organic pollutants (POPs) in Arctic species, but concern was raised that the concentrations in some species put them at risk of adverse effects on reproduction, endocrine disruption, the immune system, and on subtle neurobehavioral functions. More recent studies of biomarkers linked to Hg and POPs exposure are beginning to show evidence that chemical contaminants may be present in sufficient quantities in some species to elicit biologically significant responses, that warrant further
113
86253_Mercury Scientific_r1.indd 113 12-10-2011 14:42:34

of normal processes that take on abnormal values as a result of exposure to the chemicals of interest. Another design, less commonly encountered, is the comparison of individuals within a group, to search for linkages between biomarker values and exposure as indicated by chemical residues. This is a valuable approach for those contaminants stable enough to remain identifiable as residues for long periods of time. There are limitations with such studies, however. It is not possible to determine causality, only that a statistical association has been found between a biomarker and the contaminant in question. Mercury bioaccumulates and biomagnifies in Arctic marine species; the focus to date has been on marine mammals. Ringed seals (Phoca hispida), bowhead whales (Balaena mysticetus) and beluga (Delphinapterus leucas) have been included as monitoring species due to their importance for indigenous peoples and because they reflect various levels of the marine food web. Pilot whales (Globicephala melas) from the Faroe Islands have been included in the AMAP monitoring program due to their high contaminant loads and their role as a human food source, and to supplement the monitoring various ‘effect studies’ have been undertaken since the late 1990s. Among the first Arctic initiatives was the investigation of ringed seal kidneys with high cadmium (Cd) concentrations from northwestern Greenland (Dietz et al., 1998c). Meanwhile in Alaska, a large multi-species program was initiated and many results have been reported in the international scientific literature including the histopathological reports (e.g., Wosh ner, 2000; Wosh ner et al., 2002; Rosa et al., 2008) discussed in Section 6.3.2. Polar bears (Ursus maritimus) have been included in research programs in Alaska and Greenland, among others, over the past 25 years or so in order to assess spatial distributions and temporal trends in Hg concentration (Dietz et al., 2006a; Cardona-Marek et al., 2009). The reason for including polar bears as a sentinel species is their ability to integrate concentrations within the majority of the marine ecosystem and their comparable trophic position to indigenous people. In previous investigations, the main focus of Hg studies has been on concentrations in tissues such as muscle, not least because of human exposure via intake and liver and kidney because they are target organs. In recent years, hair and blood have also been analyzed to harmonize and expand time series as well as to study the hair excretion pathway, these studies are conducted especially during live capture operations. Later studies have included whole blood or plasma as this can be obtained from live animals and represents circulating concentrations that would be very closely related to the exposure of key target organs, and studies on the brain and the central nervous system have lately attracted more attention as an important target organ worthy of assessment.
6.2. Combined effectsA number of biological effects are not contaminant-specific and so the presence of a lesion or a particular finding of concern does not automatically lead to a particular chemical or chemical class. In addition, many contaminants and other variables such as age and infection frequency may co-vary, which would raise the question as to whether the contaminant was definitely involved in generating the effect. Contaminants may either work as antagonists (see also Section 6.2.1) or in a synergistic manner (Section 6.2.2), with one another and with
nutrients (e.g., Hg and selenium; Se). Although quite different in nature, heavy metals and POPs are likely to interact; it is the significance of these interactions about which there is still much uncertainty. In some cases, determining the cause is not important and assessing the lesions or poor health indicator and potential impact on population health and dynamics should be the priority. Concern for contaminants must parallel the development of, and an appreciation for, measures of adverse health effects and condition indices (measures of robustness or resilience).
6.2.1. What is known about the combined effects of contaminants, and other types of environmental stressors?
In many cases, heavy metals and POPs positively co-vary (i.e., increase in parallel), and so it is difficult to establish causality between concentrations and effects for specific chemicals. This is also complicated by the form of the metal and the profile of the POPs present (i.e., the dominant congeners). Plus, there may be significant contaminants that are not analyzed for or that have an impact but which are then eliminated and so do not leave a detectable residue, that may be just as important, or the response may be the result of synergistic, additive or antagonistic effects of contaminant and nutrient mixtures. Biological variables such as age, sex, reproductive status, life stage, body condition, nutritional status, genetic predisposition, and the presence of disease or other stressors may act as confounding factors, in that they can cause similar biological effects to those due to the presence of heavy metals and POPs. For many of the biological effects reported in wildlife, confounding factors may have resulted in evidence for causal links with a specific chemical contaminant that may not actually be valid due to the correlative nature of the investigation. This is mainly due to the complex mixtures of contaminants present, a lack of chemical exposure data, a lack of data on the sensitivity of the species concerned, and a lack of knowledge about the mechanisms of action for the substances of concern. Understanding of the links between contaminants and health effects (e.g., brain effects, tissue damage, reproduction or immuno-suppression) is most likely to have come from studies on laboratory animals where mechanisms can be rigorously assessed. To establish causal evidence for chemical-induced effects on wildlife it is essential to undertake field operations based on hunter-killed animals, live capture and release, temporary or permanent captivity, and strandings, etc., or controlled laboratory studies using the wildlife species of concern. A major advantage with such studies is that it should be possible to have a control group with minimal exposure. However, differences in the exposed natural food sources versus control group food sources may, in addition to their contaminant load, contain differences (e.g., the presence of other contaminants, fatty acids, vitamins or micronutrients) that may confound the contaminant being investigated.
114 AMAP Assessment 2011: Mercury in the Arctic
86253_Mercury Scientific_r1.indd 114 12-10-2011 14:42:35

6.2.2. What role does mercury speciation play in uptake and toxic effects?
6.2.2.1. Mercury uptake and demethylation
More than 95% of the methylmercury (MeHg) in food items is taken up by mammals, whereas the corresponding proportion for inorganic Hg is only 15% (Berlin, 1986). Once the MeHg has been transported through the intestinal mucosa, lymph and blood vascular portal systems transport it into the organ in which it is being demethylated, stored or from which it is being excreted. The main organ where Hg occurs in the highest concentrations, as well as being demethylated, is the liver for marine mammals and birds. For terrestrial mammals, including polar bears, kidney has the highest Hg concentrations and hence may be the main target organ (see Section 6.2.2.2). Animals that show either less ability to demethylate MeHg or to increase Se uptake, may have a greater sensitivity to the toxic effects of MeHg. Indeed, some high trophic level predators, such as polar bears and pinnipeds, may use other strategies as well as demethylation in the liver, such as excreting MeHg into growing hair and excretion through urine and feces (e.g., Dietz et al., 2006a; Brookens et al., 2007, 2008; Cardona-Marek et al., 2009). Birds utilize a similar excretion strategy via feathers (e.g., Dietz et al., 2006b). Hair and feathers may represent a means to limit the bioavailability of MeHg to the central nervous system (Basu et al., 2009). Additional studies are needed to better explain interspecies differences in sensitivity to MeHg exposure, including the demethylation process and the role of Se.
6.2.2.2. Mercury-selenium relationships and interactions
For nearly four decades, scientists have documented strong positive correlations between the concentrations of Hg and Se in tissues (e.g., liver, kidney) of many fish-eating wildlife species, especially predatory marine mammals (Koeman et al., 1973; Koeman and van de Ven, 1975; Smith and Armstrong, 1978; and others). The Hg–Se relationship is a toxicant–nutrient interaction that has relevance for both basic biology
and environmental risk assessment; however, important physiological details of the relationship are still unclear. For further details regarding the different chemical forms of Se and their biological functions, see Shibata et al. (1992). High trophic level mammals and birds, especially those linked to marine or other aquatic food webs, may be partially protected against MeHg toxicity by a range of mechanisms including demethylation and subsequent binding of inorganic Hg with Se in an approximate 1:1 molar ratio (Figure 6.1), thereby sequestering Hg in a stable non-toxic complex. This complex probably represents a direct covalent (or other strong) interaction of Hg and Se. In some wild aquatic predatory bird and mammal species, it has been shown that MeHg predominates in the liver at low total Hg (THg) concentrations whereas at higher concentrations an increasingly large percentage of THg is present as inorganic Hg associated with Se, and some studies have identified this complex as HgSe (tiemanite) (Koeman and van deVen, 1975; Dietz et al., 1990, 1998a,b, 2000b,c; O’Shea, 1999; Scheuhammer et al., 1998, 2008; Wang et al., 2001; Wosh ner et al., 2001a,b, 2008; O’Hara et al., 2003; Arai et al., 2004; Ikemoto et al., 2004; Deh n et al., 2005, 2006; Eagles-Smith et al., 2009; Moses et al., 2009). The Figure 6.1 inflection point below which the majority of hepatic Hg is organic and above which the proportion of hepatic inorganic Hg increases, was reported to be about 2.2 μg/g ww based on 20 Greenland marine animal species (Dietz et al., 1990). This finding fits well with later studies on North American aquatic bird species (Scheuhammer et al., 2008; Eagles-Smith et al., 2009). These results are also consistent with the amount of organic Hg present in liver as well as the generally lower exposed kidney (except for polar bears). In muscle tissue, Se is present in a large molar surplus to Hg, and the Hg is entirely organic (Dietz et al., 1990, 2000c). Interspecies differences in MeHg demethylation have been reported. Eagles-Smith et al. (2009) observed that avocets (Recurvirostra sp.) and stilts (Himantopus sp.) had higher hepatic demethylation rates than terns (Sterna paradisaea). Scheuhammer et al. (2008) reported significant differences between common loons (Gavia immer) and bald eagles (Haliaeetus leucocephalus) with respect to Hg and Se
1000
100
10
10.01 0.1 10 100 10001
Mercury, nmol/g
1000
100
10
10.01 0.1 10 100 10001
Mercury, nmol/g
Selenium, nmol/g Selenium, nmol/g
Liver Kidney1000:1 100:1 10:1 1000:1 100:1 10:11:1
1:10
1:1
1:10
Polar bears
Toothed whalesBaleen whales Birds
Fish
Seals
Figure 6.1. The mercury-selenium relationship in liver (left) and kidney (right) tissue in various animal groups from Greenland. The lines represent different decadal molar ratios. Source: after Dietz et al. (2000c) and Dietz (2008).
115Chapter 6 · What are the Toxicological Effects of Mercury in Arctic Biota?
86253_Mercury Scientific_r1.indd 115 12-10-2011 14:42:35

accumulation in brain tissue, with eagles showing a highly significant co-accumulation of Se with Hg, and efficient demethylation of MeHg in brain, relative to loons. For loons, but not eagles, the molar ratio of Hg:Se in brain often exceeded 1 (Scheuhammer et al., 2008). Ralston et al. (2007) suggested that a molar excess of Hg over Se in target organs may be a major determinant of MeHg toxicity. Certain seleno-enzymes (e.g., thioredoxin reductase) are highly sensitive to inhibition by low nanomolar concentrations of Hg, and may be important early targets of MeHg toxicity at the molecular level (Carvalho et al., 2008). For some pinniped species, hepatic MeHg (as a percentage of THg) decreases rapidly with age, and reaches an asymptote (from 30-60%, to 5% or less) even as levels of THg continue to increase (Deh n et al., 2005; Brookens et al., 2007). For dolphins, detoxification has been proposed to involve demethylation of MeHg by reactive oxygen species. Measuring the amount of Hg present in the environment or food sources may not provide an adequate reflection of the potential for health risks if the protective effects of Se are not also considered. The involvement of Se is apparent throughout the Hg cycle, influencing its transport, biogeochemical exposure, bioavailability, toxicological consequences, and remediation. Likewise, many animal studies indicate that Se, present in many foods (including fish), protects against Hg toxicity. Studies have also shown that Hg exposure reduces the activity of Se-dependent enzymes. While seemingly separate, these concepts may actually be complementary perspectives of the Hg–Se binding interaction. Owing to the extremely high affinity between Hg and Se, Se sequesters Hg and reduces its biological availability. It is clear that the converse is also true; as a result of the high affinity complexes formed, Hg sequesters Se. This is important because Se is required for the normal activity of many Se-dependent enzymes.
6.2.2.3. Selenium as an antioxidant
Selenium can act directly or as a cofactor with other antioxidants to protect cells from oxidative stress due to exposure to Hg and/or other stressors. As an essential element and component of the amino acid seleno-cysteine, Se is physiologically regulated. Selenium is a constituent of many proteins, including the Se-dependent glutathione peroxidases, which have antioxidant properties (Brigelius-Flohé, 1999). Other seleno-enzymes include type I iodothyronine deiodinase, which converts thyroxine (T4) to the more active 5-tri-iodothyronine (T3), and impacts on metabolic rate can be linked to Se (Hawkes and Keim, 2003). Thus, the role of Se in the mechanism for Hg detoxification may not be completely due to covalent binding of Hg with Se, but may also involve seleno-proteins and/or other biomolecules (Wosh ner et al., 2001a, 2008). According to Raymond and Ralston (2004), if a toxicant can enter the brain and disrupt seleno-protein synthesis, detrimental effects would be expected. Methylmercury has the ability to cross the blood-brain barrier, and its exceptionally high affinity for Se may enable it to specifically sequester the Se in the central nervous system and diminish seleno-protein synthesis. The free selenides that form during each cycle of seleno-cysteine synthesis have a high affinity for Hg, and the low solubility mercury selenide precipitates that result are metabolically inert. It is reasonable then to assume that
not only does Se have an effect on Hg bioavailability, but that Hg may also have an effect on Se bioavailability. Therefore, the ‘protective effect’ of Se against Hg exposure may actually be in the opposite direction as well. Mercury propensity for Se sequestration in brain and endocrine tissues may inhibit formation of essential Se-dependent proteins (seleno-proteins). Hence, the ‘protective effect’ of Se against Hg toxicity may simply reflect the importance of maintaining sufficient free Se to support normal Se-dependent enzyme synthesis and activity. The role of compounds containing sulfhydryl groups (such as metallothionein and keratinized tissues), especially for binding of inorganic Hg (Satoh et al., 1997) might also be important, and other nutrients such as fatty acids may be involved (Wosh ner et al., 2001a, 2008). It is important to remember that the Hg–Se complex represents the end product of a process and that other factors may be important in producing this final interaction. The Hg-centric view of this interaction should also be considered, in that, in some instances, it might be proposed that the toxicity of Se is being prevented by the Hg, or that the formation of Hg–Se complexes promotes Se deficiency (Tinggi, 2003). Other metals, such as silver, have also been found in association with Se in tissues of some marine mammals (Becker et al., 1995), thus the elemental interactions may be more complicated for species such as beluga.
6.3. Is there any evidence that tissue mercury concentrations at present are harmful to Arctic biota?
6.3.1. Cerebral exposure and potential neurological effects of mercury on Arctic marine mammals
Characterizing Hg exposure and possible neurological outcomes is a critical component in assessing the health impacts of Hg. Much of the work on the central nervous system is new relative to previous assessments and the recently developed methods provide much needed effect information. Mercury has the potential to cause neurotoxicity in Arctic biota and human residents and this is of major concern; especially for women of childbearing age and the developing fetus. The neurotoxic potential of Hg was exemplified during well-documented, human poisoning events in Japan and Iraq (reviewed by U.S. EPA, 1997; ATSDR, 1999; Clarkson and Magos, 2006), and more recently from studies involving human populations in the Faroe Islands and Brazilian Amazon (Mergler et al., 2007). Besides humans, Hg is also neurotoxic to wildlife and Hg-associated poisoning events have been documented in some fish-eating species, such as mink (Mustela vison) and common loons (Scheuhammer et al., 2007). While all chemical forms of Hg have intrinsic neurotoxic properties, environmental public health is most concerned with organic Hg and in particular MeHg. Methylmercury biomagnifies through aquatic and marine ecosystems, including food chains in the Arctic (Atwell et al., 1998). Once ingested, MeHg is readily absorbed into the circulatory system and transported to all tissues mainly through the blood (see Section 6.3.3). Methylmercury can cross the blood-brain barrier (Asch ner and Asch ner, 1990), and the brain is considered the
116 AMAP Assessment 2011: Mercury in the Arctic
86253_Mercury Scientific_r1.indd 116 12-10-2011 14:42:35

primary target organ of MeHg toxicity in higher organisms. At sufficient concentrations, MeHg may disrupt a range of neurological processes within the brain owing to its high affinity for protein thiols (Clarkson and Magos, 2006). Characteristic outcomes of MeHg poisoning in both humans and mammalian wildlife include structural degeneration of the occipital cortex and the cerebellum which leads to paresthesia (numbness, tingling), ataxia (incoordination), sensory impairment, and memory loss (ATSDR, 1999; Clarkson and Magos, 2006; Basu et al., 2007a; Basu and Head, 2010). There is some concern that Hg levels in Arctic wildlife and humans may be approaching concentrations that can cause impacts on behavior and health. For example, an associative study on 43 Inuit children (Qaanaaq, Greenland) reported that Hg exposure may be related to subtle neurological deficits in a few cases examined (Weihe et al., 2002). Balancing the risks/benefits of Hg exposure via dietary pathways is an immense challenge as fish and marine mammals are the primary means by which Hg is transferred to humans and high trophic level wildlife but are also an excellent and critical source of nutrients for Arctic consumers. Substantial levels of Hg (both THg and MeHg) have been documented in various tissues of polar bears (Norstrom et al., 1986; Dietz et al., 1990, 2000b,c; Braune et al., 1991; Atwell et al., 1998; Wosh ner et al., 2001b; Rush et al., 2008) and ringed seals (Dietz et al., 1998b, 2000c; Wosh ner et al., 2001b; Deh n et al., 2005). However, little is known about the uptake of Hg into the brain tissue of Arctic marine mammals. The lack of understanding of brain Hg levels in Arctic wildlife limits the ability to accurately assess its health effects. In a recent study, THg and MeHg levels were evaluated in the lower medulla oblongata (brain stem) brain region of 82 polar bears collected by subsistence hunters in Greenland (Basu et al., 2009). In that
study, concentrations of THg of less than 1 µg/g were found (mean = 0.36 ± 0.12 µg/g dw; range 0.11 to 0.87 µg/g). In this same brain region, MeHg comprised 82.8% of the THg present. In a previous study of eight ringed seals from northern Quebec, the mean THg level in the cerebral cortex was 0.09 ± 0.05 µg/g ww (N. Basu, unpublished results based on animals from Basu et al., 2006a). Similar THg levels (0.13 ± 0.03 µg/g ww) were found in the brain tissue of six harp seal (Phoca groenlandica) pups collected from the Grise Fjord and Pangnirtung region of Nunavut (Ronald et al., 1984). A number of studies are underway to characterize the distribution of Hg in specific brain regions as this may enable a greater understanding of possible effects on animal behavior and health (Figure 6.2). Of particular note are recent findings from Canadian beluga showing brain mercury levels to be an order of magnitude greater than those in polar bears and seals (Ostertag et al., 2009). At a neurochemical level, MeHg may cause a range of sub-clinical effects and so neurochemical biomarkers have recently been used to assess the early risks of Hg to several fish-eating wildlife species that accumulate high levels of Hg. For example, changes in the levels of muscarinic cholinergic receptors (increased) and N-methyl-D-aspartate (NMDA) glutamate receptors (decreased) were related to concentrations of brain Hg in wild mink (Basu et al., 2005, 2007b), common eagles, and bald eagles (Scheuhammer et al., 2008). Several of these neurochemical effects have been substantiated in laboratory studies involving captive mink experimentally fed environmentally realistic MeHg doses (Basu et al., 2006b, 2007b). These results suggest that Hg at ecologically relevant levels may be exerting subtle, sub-clinical neurological changes in the 3 to 5 µg/g dw range (dry weight concentration in
Figure 6.2. Overview of mean mercury concentrations in brain from Arctic biota and humans. Red lines indicate the mean mercury concentrations in East Greenland polar bear brain stem that were associated with lower N-methyl-D-aspartate (NMDA) receptor levels and the mercury-associated neurochemical effect threshold in the 3 to 5 µg/g dw range based on previous studies on fish-eating mammals (Basu et al., 2006b, 2007b) and birds (Scheuhammer et al., 2008). For detailed data see Appendix Table A6.1.
0.01 0.1 1 10 100 1000 10000
Harp seal - Grise Fjord, Pangnirtung, 1976-78 (pups, m)Harp seal - Grise Fjord, Pangnirtung, 1976-78 (juveniles, m)
Harp seal - Grise Fjord, Pangnirtung, 1976-78 (adults, m)Harp seal - St. Lawrence, 1976-78 (pups, m)
Harp seal - St. Lawrence, 1976-78 (juveniles, m)Harp seal - St. Lawrence, 1976-78 (adults, m)
Harp seal - Newfoundland, 1976-78 (pups, m)Harp seal - Newfoundland, 1976-78 (juveniles, m)
Harp seal - Newfoundland, 1976-78 (adults, m)Grey seal - Nova Scotia, 1972
Ringed seal - Northern Quebec4 seal species - Norwegian Coast, 1989-90
Kuujjuaq, E. Canada, 2000-2003 (cerebral cortex, all)Ittoqqortoormiit, E. Greenland, 1999-2001 (brain stem, f )
Ittoqqortoormiit, E. Greenland, 1999-2001 (brain stem, m)
Canada, 2008 (cerebellum, m&f)Canada, 2008 (frontal lobe, m&f)
Canada, 2008 (temporal lobe, m&f )
Greenland (cerebral cortex, all)
Mercury in brain, μg/g ww
Observed e�ects on NMDA receptor in East Greenland polar bears
Neurochemical threshold (lower)
Neurochemical threshold (upper)
Polar bear
Humans(Inuit)
Beluga
Seals
117Chapter 6 · What are the Toxicological Effects of Mercury in Arctic Biota?
86253_Mercury Scientific_r1.indd 117 12-10-2011 14:42:36

brain tissue) in several fish-eating wildlife species. It should be emphasized that these results are limited as they do not necessarily indicate toxic damage, and are correlative in nature, although additional field- and laboratory-based studies are underway to address the physiological significance of these findings. Neurochemical biomarkers have recently been applied to studies on Arctic biota (Basu et al., 2009). Despite finding relatively low levels of Hg in the lower brain stem of polar bears, a negative association between brain Hg levels and NMDA receptors was observed similarly to other organisms (Figure 6.3). In these polar bear tissues, several chlorinated and brominated organic chemicals were measured and did not associate with Hg levels or neurochemical biomarkers (Basu et al., 2009). In a captive mink study, ingestion of food containing MeHg levels as low as 0.1 ppm (corresponding to brain Hg concentration of 1 to 2.2 μg/g ww) was linked to decreased NMDA receptors levels (Basu et al., 2007b). A decreased level of brain glutamate NMDA receptors is potentially of ecological and physiological concern because glutamate is the main excitatory neurotransmitter, and glutamate receptors have essential roles in multiple facets of animal health, behavior, reproduction, and survival (Siegel et al., 2006). Changes to these receptors may represent one of the earliest and most sensitive biochemical indicators of MeHg exposure and effect. To substantiate the importance of these neurochemical findings in the polar bear, future efforts need to explore Hg-associated neurochemical changes in other high trophic level Arctic species, in other brain regions shown to accumulate more Hg than the brain stem, and to examine linkages (via modeling or carefully designed laboratory experiments) between neurochemical effects and possible changes in animal neurobehavior.
6.3.2. Mercury-related histopathology of Arctic marine mammals
Few studies have investigated the histopathology of Hg in Arctic wildlife. It is important to understand that all Arctic marine mammals are contaminated with a range of toxic substances. Histopathological investigations have largely focused on Hg- and Cd-related lesions. Histopathological effects in relation
to Hg exposure are the focus of the following section, but references to Cd are also included. It should also be emphasized that in addition to these heavy metals, POPs (organochlorines, brominated flame retardants and perfluorinated compounds) bioaccumulate in kidney and liver tissue and that these compounds may interact with heavy metals to cause tissue lesions in an additive or synergistic manner. In the following sections, threshold Hg levels for harmful and lethal impacts in terrestrial mammals (30 μg/g ww; Thompson, 1996) and marine mammals (60 μg/g ww; Law, 1996) have been used.
6.3.2.1. Liver lesions
The functions of the liver are to serve as lymphatic and intestine drainage, to support metabolic processes and to synthesize plasma proteins and coagulation factors, as well as being an endocrine / immunological modulator and storage site of energy (glycogen) (Janeway et al., 2001; Ganong, 2005; Klaassen et al., 2007). In addition, the liver is the key site where xenobiotic compounds are biotransformed (Janeway et al., 2001; Ganong, 2005; Klaassen et al., 2007). Studies of Hg hepatotoxicity have been conducted both in the laboratory and in the field in recent decades (Kelly, 1993; MacLachlan and Cullen, 1995; Law, 1996; Thompson, 1996; AMAP, 1998, 2005; Klaassen et al., 2007). In the Arctic, investigations of histopathological lesions in hepatic tissue from Arctic wildlife have focused on polar bears, pilot whales, bowhead whales, beluga and ringed seals (e.g., Wosh ner, 2000; Wosh ner et al., 2002; Sonne et al., 2007, 2010). Various liver lesions have been found in these five species in relation to Hg (and Cd) concentrations, and the nature of these associations is similar across species. Briefly, measured lesions are of parenchymal (zonary hepatocytic lipid accumulation) and of non-parenchymal (lipid-filled Ito cells, bile duct proliferation, focal lipid granulomas, cell infiltrations and necrosis) origin (Kelly, 1993; MacLachlan and Cullen, 1995; Thompson, 1996). Most of these lesions are due to age, exposure to toxic substances such as contaminants and to infection/inflammatory reactions. In the case of Ito cell lipid accumulation this is ascribed to vitamin A deposition (Leighton et al., 1988). However, the significance of these lesions to the overall health of the organ and the organism requires further investigation within the context of other health measures (e.g., clinical chemistries, biochemical measures and others). Hepatocytes react to exposure to POPs/Hg in a biochemical manner that includes three major pathways: induction of the sER (smooth endoplasmic reticulum, including CYP-450); disruption of the ADP→ATP pathway; and free radical oxidative stress of the cell membrane resulting in hypoxia and hepatomegaly (enlarged liver) as a first sign of liver toxicosis (Kelly, 1993; MacLachlan and Cullen, 1995; Klaassen et al., 2007). Therefore, liver weight may be a preliminary indicator (invasive biomarker) for POPs/Hg exposure and effects in Arctic marine mammals, while non-specific histopathological changes such as intracellular hepatocytic steatosis (foamy cytoplasm), inflammation (lymphocytic and multinuclear cells) and necrosis also occur but cannot be used as specific contaminant biomarkers (Kelly, 1993, MacLachlan and Cullen, 1995; Klaassen et al., 2007). In the wild, only a few studies have associated metal exposure to pathological changes in the liver. For example, Hg in Atlantic
2100
1800
1500
1200
900
600
300
00 0.1 0.2 0.3 0.4 0.5 0.6 0.7 0.8 0.9 1.0
Hg concentration, μg/g dw
NMDA receptor concentration, fmol/mg
Total HgOrganic Hg
Figure 6.3. Correlation between glutamate N-methyl-D-aspartate (NMDA) receptor levels and total mercury (n = 60; r = -0.34, p < 0.01) and methylmercury (n = 6; r = -0.89; p < 0.05) in the medulla oblongata brain region of free-ranging East Greenland polar bears. Source: adapted from Basu et al. (2009).
118 AMAP Assessment 2011: Mercury in the Arctic
86253_Mercury Scientific_r1.indd 118 12-10-2011 14:42:36

bottlenose dolphins (Tursiops truncatus) showed that liver abnormalities and lysosomal Hg granula were associated with high Hg concentrations (Rawson et al., 1993). The histopathological changes found in the liver of Arctic marine mammals (i.e., Arctic beluga, polar bear, bowhead whale, pilot whale and ringed seal) are similar to those observed in other Hg-exposed marine and laboratory mammals (Wosh ner, 2000; Wosh ner et al., 2002; Sonne et al., 2007, 2010). In these studies, however, histopathological changes are also ascribed to age and dietary composition (lipid content), creating some difficulty in ascribing the lesions specifically to Hg. Figure 6.4 shows the mean liver Hg concentrations in polar bears of several age classes from various Arctic locations. By plotting these mean values against an estimated toxic threshold value for marine mammals of 60 μg/g ww it is evident that the only polar bears that exceeded this threshold were from Southwest Melville Island in 1991 (Law, 1996). Comparing the results to the terrestrial toxic threshold value of 30 μg/g ww, indicates that eastern Beaufort Sea polar bear means are above this level, which may indicate a risk of Hg-induced adverse health effects (Thompson, 1996). Lacking access to the raw data precluded an estimate of the percentage of bears from different regions that exceeded the threshold concentrations, however, it is likely that different pre-1990 populations may have exceeded the terrestrial threshold. The recent increases observed in hair Hg concentrations indicate that liver concentrations may also have increased in some populations (Dietz et al., 2006a). The prediction of the northeastern Canadian bears as being at risk of Hg toxicity fits well with the hair data in Section 6.3.4. Figure 6.5 shows the mean liver Hg concentration in different seal species. The only population where the mean value exceeded the threshold value for toxic effects in marine mammals (60 μg/g ww) was for hooded seals (Cystophora cristata) from Davis Strait sampled in 1984 (mean 78 μg/g ww; no later data available from this region). Several other species and populations, such as ringed seals (>5 years) from Grise Fiord (in 1998) and hooded seals from the Greenland Sea
(in 1999) had means that approached the terrestrial mammal toxic threshold value of 30 μg/g ww. Again, the paucity of raw data prevents an estimate of the percentage of seals from all populations exceeding the threshold. It is unclear to what extent Arctic seals have shown any increase in concentration over recent years (see Chapter 5). The prediction of the northeastern Canadian seals as being at risk of Hg toxicity fits well with the polar bear liver, kidney and hair data described elsewhere in this section and in Section 6.3.4. Figure 6.6 shows the mean Hg concentrations in liver tissue from baleen and toothed whales. All baleen whale populations had liver Hg concentrations far below the toxic threshold levels. However, pilot whales from the Faroe Islands had liver concentrations above the 60 μg/g ww toxic threshold value (Hoydal and Damm, 2009; Sonne et al., 2010) for marine mammals provided by Law (1996). Beluga from the St Lawrence River and Point Lay had mean liver concentrations close to the 30 μg/g ww toxic threshold value for terrestrial mammals provided by Thompson (1996).
6.3.2.2. Renal lesions
Renal lesions can be divided into those of the parenchyma (tubular and glomerular) and the interstitium (Maxie, 1993; Churg et al., 1995; Cotran et al., 1999). Briefly, the pathogenesis underlying inorganic Hg (and Cd) tubular toxicity is a co-enzyme inhibition via high affinity to various microsome and mitochondria SH-group enzymes, while glomerular changes are due to immune complex interactions with the capillary basement membrane (Maxie, 1993; Churg et al., 1995; Cotran et al., 1999). Lesions to the kidney are of health concern since this organ has endocrine functions, acts as a blood filter that clears metabolic waste products such as urea, and maintains calcium and phosphorus homeostasis, blood pressure, water and electrolyte levels as well as activating vitamin D (Ganong, 2005). Several studies of Arctic marine mammals have shown measurable and species-dependent prevalence of tubular and
Figure 6.4. Mercury concentrations in polar bear liver for selected regions of the Arctic and selected periods (for full datasets see Appendix Table A6.2.). The lethal/harmful effects level for terrestrial free-ranging wildlife (30 μg/g ww; Thompson, 1996) and the observed effects level for marine mammals associated with liver lesions in bottle-nosed dolphins (60 μg/g ww; Law, 1996) are also shown.
0.01 0.1 1 10 100 1000 10000
Mercury in polar bear liver, μg/g ww
Observed e�ects level in terrestrial mammals
Observed e�ects level in marine mammals
Eastern Beaufort Sea, Canada, 1991 (age adjusted 6.9 years)Southwest Melville Island, Canada, 1991 (age adjusted 6.9 years)
Cumberland Peninsula, Canada, 1991 (age adjusted 6.9 years)Cape Mercy, Canada, 1991 (age adjusted 6.9 years)
Avanersuaq (north), Greenland, 1988-90 (age 2-6 years)Avanersuaq (north), Greenland, 1988-90 (age >6 years)
Avanersuaq (south), Greenland, 1988-90 (age 1 year)Avanersuaq (south), Greenland, 1988-90 (age 2-6 years)Avanersuaq (south), Greenland, 1988-90 (age >6 years)
Ittoqqortoormiit, Greenland, 1999-2001 (all ages)Ittoqqortoormiit, Greenland, 1999-2001 (adult male)
Ittoqqortoormiit, Greenland, 1999-2001 (adult female)Ittoqqortoormiit, Greenland, 1999-2001 (subadult)
Ittoqqortoormiit (north), Greenland, 1983-90 (age 1 year)Ittoqqortoormiit (north), Greenland, 1983-90 (age 2-6 years)Ittoqqortoormiit (north), Greenland, 1983-90 (age >6 years)Ittoqqortoormiit (south), Greenland, 1983-90 (age <1 year)
Ittoqqortoormiit (south), Greenland, 1983-90 (age 2-6 years)Ittoqqortoormiit (south), Greenland, 1983-90 (age >6 years)
119Chapter 6 · What are the Toxicological Effects of Mercury in Arctic Biota?
86253_Mercury Scientific_r1.indd 119 12-10-2011 14:42:37

Figure 6.6. Mercury concentrations in whale liver for selected regions of the Arctic and selected periods (for full datasets see Appendix Table A6.4.). The observed effects level for marine mammals associated with liver lesions in bottle-nosed dolphins (60 μg/g ww; Law, 1996) is also shown.
0.01 0.1 1 10 100 1000 10000
Mercury in whale liver, μg/g ww
Observed e�ects level in marine mammals
Faroe Islands, 2001-07 (all ages)Faroe Islands, 2007 (all ages)
Point Hope/Lay, Alaska, 1992-99 (365 cm)Barrow, Alaska
Barrow, Alaska, 1992-99 (365 cm)Cook Inlet, Alaska, 1992-99 (398 cm)
Mackenzie Delta, Canada, 1984 (age 5.6 years)Grise Fiord, Canada, pre-1990 (age 13.9 years)
St. Lawrence, Canada, 1984 (age 17.5 years)Upernavik, Greenland, 1984-86 (age 0-6 years)
Upernavik, Greenland, 1984-86 (age 7-13 years)Upernavik, Greenland, 1984-86 (age >13 years)
Avanersuaq, Greenland, 1984 (age >3 years, f )Avanersuaq, Greenland, 1984 (age >3 years, m)Uummannaq, Greenland, 1993 (age >3 years, f )
Uummannaq, Greenland, 1993 (age >3 years, m)
Central West Greenland, 1988-89 (all ages)Central West Greenland, 1988-89 (age >7 years)
West Greenland, 1998 (all ages)East Greenland, 1998 (all ages, f )
Jan Mayen, 1998 (all ages)Lofoten, Norway, 1998 (all ages)
Svalbard, Norway, 1998 (all ages)Barents Sea, Norway, 1998 (all ages)
Barrow, Alaska, 1992-99 (1093 cm)
Lorino Lavrentia, Russia, 2001 (978 cm)Mechigmenskiy, Russia, 2001 (840 cm)
Pilot whale
Beluga
Narwhal
Harbour porpoise
Minke whale
Bowhead whale
Grey whale
0.01 0.1 1 10 100 1000 10000
Mercury in seal and walrus liver, μg/g ww
Observed e�ects level in marine mammals
Barrow, Alaska, 1995-1997 (age 0-5 years)Barrow, Alaska, 1995-1997 (age >5 years)
Sachs Harbour, Canada, 2001 (age 0-5 years)Sachs Harbour, Canada, 2001 (age >5 years)
Grise Fiord, Canada, 1998 (age 0-5 years)Grise Fiord, Canada, 1998 (age >5 years)Arctic Bay, Canada, 2000 (age 0-5 years)
Arctic Bay, Canada, 2000 (age >5 years)Pond Inlet, Canada, 2000 (age 0-5 years)
Pond Inlet, Canada, 2000 (age >5 years)Avanersuaq, Greenland, 1998 (age 2-4 years)
Avanersuaq, Greenland, 1998 (age 5-10 years)Avanersuaq, Greenland, 1998 (age 11-15 years)
Uummannaq, Greenland, 1998 (age 2-4 years)Uummannaq, Greenland, 1998 (age 5-10 years)
Uummannaq, Greenland, 1998 (age 11-15 years)Ittoqqortoormiit, Greenland, 1998 (age 2-4 years)
Ittoqqortoormiit, Greenland, 1998 (age 5-10 years)Ittoqqortoormiit, Greenland, 1998 (age 11-15 years)
Svalbard, Norway, 1996 (age 0-5 years)Svalbard, Norway, 1996 (age >5 years)
White Sea, Russia, 2001 (age 0-5 years)White Sea, Russia, 2001 (age >5 years)
Upernavik, Greenland, 1985 (age 5-10 years)Greenland Sea, Greenland, 1999 (age 12 years)
Davis Strait, Greenland, 1984 (all ages)Ammassalik, Greenland, 1984 (age 1 year)
Greenland Sea, Greenland, 1999 (age 9 years)
Foxe Basin, Canada, 1982-1988 (all ages)Avanersuaq, 1975-1977 (age 11 years)
Ringed seal
Harp seal
Hooded seal
Walrus
Figure 6.5. Mercury concentrations in seal and walrus liver for selected regions of the Arctic and selected periods (for full datasets see Appendix Table A6.3.). The observed effects level for marine mammals associated with liver lesions in bottle-nosed dolphins (60 μg/g ww; Law, 1996) is also shown.
120 AMAP Assessment 2011: Mercury in the Arctic
86253_Mercury Scientific_r1.indd 120 12-10-2011 14:42:37

glomerular lesions. The lesions found include glomerular sclerosis and obliteration, immune complex-like glomerulonephritis, tubular hyalinization and tubular necrosis, as well as interstitial fibrosis and multifocal lymphohistiocytic and/or mononuclear cell infiltrations (Wosh ner, 2000; Wosh ner et al., 2002; Sonne et al., 2007, 2010; Rosa et al., 2008). The glomerular lesions reported resemble those of heavy metal and organohalogen polluted Baltic grey seals (Halichoerus grypus) and ringed seals and bottlenose dolphins (Lavery et al., 1999; Bergman et al., 2001). Studies have shown that age and micro-pathogens (e.g., bacteria and parasites) are important co-factors in the development of renal lesions in Arctic marine mammals which must be considered when evaluating metal toxicosis (Wosh ner, 2000; Wosh ner et al., 2002; Sonne et al., 2007, 2010; Rosa et al., 2008). Furthermore, the concentrations of many metals co-vary with age (increase), as do histological lesions, which makes it difficult to establish cause-effect relationships between Hg exposure and renal endpoints (Maxie, 1993; Banerjee et al., 1994; Churg et al., 1995; Cotran et al., 1999; Rumbeiha et al., 2000; Afonne et al., 2002; Sonne, 2010). According to Dietz et al. (1996, 2000b,c), Hg:Se molar ratios in the renal tissues of several East Greenland polar bears exceeded 1, which indicates that a large amount of the THg was in the ionic form, suggesting a toxic potential. In Alaskan beluga, bowhead whales and ringed seals, Wosh ner (2000) showed that the Hg:Se ratio was <1 in renal tissue indicating that Se was in molar surplus. Metallothionein also binds and thereby detoxifies Hg (Klaassen et al., 2007, 2009), but in the Arctic only a single study (in Greenland and Barents Sea ringed, hooded and harp seals) has been conducted on its relationship to Hg (Sonne et al., 2010). Based on metallothionein concentrations, the metallothionein metal-binding capacity was higher in kidney than liver for all three species and increased in the order ringed seals < hooded seals < harp seals. It was suggested that species differences exist in the sub-cellular handling of heavy metals which implies differences in Hg sensitivity. Figure 6.7 shows Hg concentrations in renal tissue from
polar bears. It is clear that two populations where kidney mean concentrations exceeded the toxic threshold value for marine mammals (60 μg/g ww) were from Southwest Melville Island and the eastern Beaufort Sea (sampled prior to 1991). These values were, however, calculated from tissue ratios from Greenland bears as no kidney data were available from these regions. If, on the other hand, the terrestrial toxic threshold value of 30 μg/g ww is used then polar bears from East Greenland also exceeded the threshold level. Lacking access to raw data precluded an estimate of the percentage of bears exceeding the threshold levels but it is likely that a substantial proportion of the pre-1990 bears older than six years from northwestern Greenland exceeded the terrestrial threshold level. The increases observed in Hg concentration in polar bear hair in recent years indicate that kidney concentrations have increased in some of the northern populations (Dietz et al., 2006a, and Section 6.3.4). The prediction of the northeastern Canadian bears as being at risk of Hg toxicity fits well with the liver and hair data described above and in Section 6.3.4. Figure 6.8 shows mean Hg concentrations in renal tissue for various seal species. None of the seal populations have renal Hg concentrations that reach the 60 μg/g ww toxic threshold value for marine mammals or the 30 μg/g ww toxic threshold value for terrestrial mammals. Figure 6.9 shows mean Hg concentrations in renal tissue from baleen and toothed whales. All baleen whale populations had lower kidney Hg concentrations than the toothed whales. No whale population had kidney concentrations that reach the 60 μg/g ww toxic threshold value for marine mammals or the 30 μg/g ww toxic threshold value for terrestrial mammals.
6.3.2.3. Other tissues
Multiple tissue histological examinations have been conducted on polar bears, ringed seals, bowhead whales and beluga by Wosh ner (2000) and others. These comprehensive examinations and reports have not shown any particular relationships with
Figure 6.7. Mercury concentrations in polar bear kidney for selected regions of the Arctic and selected periods (for full datasets see Appendix Table A6.2.). The lethal/harmful effects level for terrestrial free-ranging wildlife (30 μg/g ww; Thompson, 1996) and the observed effects level for marine mammals associated with liver lesions in bottle-nosed dolphins (60 μg/g ww; Law, 1996) are also shown.
0.01 0.1 1 10 100 1000 10000
Mercury in polar bear kidney, μg/g ww
Observed e�ects level in terrestrial mammals
Observed e�ects level in marine mammals
Eastern Beaufort Sea, Canada, 1991 (age adjusted 6.9 years)Southwest Melville Island, Canada, 1991 (age adjusted 6.9 years)
Cumberland Peninsula, Canada, 1991 (age adjusted 6.9 years)Cape Mercy, Canada, 1991 (age adjusted 6.9 years)
Avanersuaq (north), Greenland, 1988-90 (age 2-6 years)Avanersuaq (north), Greenland, 1988-90 (age >6 years)
Avanersuaq (south), Greenland, 1988-90 (age 1 year)Avanersuaq (south), Greenland, 1988-90 (age 2-6 years)Avanersuaq (south), Greenland, 1988-90 (age >6 years)
Ittoqqortoormiit (north), Greenland, 1983-90 (age 1 year)Ittoqqortoormiit (north), Greenland, 1983-90 (age 2-6 years)Ittoqqortoormiit (north), Greenland, 1983-90 (age >6 years)Ittoqqortoormiit (south), Greenland, 1983-90 (age <1 year)
Ittoqqortoormiit (south), Greenland, 1983-90 (age 2-6 years)Ittoqqortoormiit (south), Greenland, 1983-90 (age >6 years)
Ittoqqortoormiit, Greenland, 1999-2001 (all ages)Ittoqqortoormiit, Greenland, 1999-2001 (adult male)
Ittoqqortoormiit, Greenland, 1999-2001 (adult female)Ittoqqortoormiit, Greenland, 1999-2001 (subadult)
121Chapter 6 · What are the Toxicological Effects of Mercury in Arctic Biota?
86253_Mercury Scientific_r1.indd 121 12-10-2011 14:42:37

0.01 0.1 1 10 100 1000 10000
Mercury in seal and walrus kidney, μg/g ww
Observed e�ects level in marine mammals
Barrow, Alaska, 1995-97 (age 0-5 years)Barrow, Alaska, 1995-97 (age >5 years)
Sachs Harbour, Canada, 2001 (age 0-5 years)Sachs Harbour, Canada, 2001 (age >5 years)
Grise Fiord, Canada, 1998 (age 0-5 years)Grise Fiord, Canada, 1998 (age >5 years)Arctic Bay, Canada, 2000 (age 0-5 years)Arctic Bay, Canada, 2000 (age >5 years)
Pond Inlet, Canada, 2000 (age 0-5 years)Pond Inlet, Canada, 2000 (age >5 years)
Avanersuaq, Greenland, 1998 (age 2-4 years)Avanersuaq, Greenland, 1998 (age 5-10 years)
Avanersuaq, Greenland, 1998 (age 11-15 years)Uummannaq, Greenland, 1998 (age 2-4 years)
Uummannaq, Greenland, 1998 (age 5-10 years)Uummannaq, Greenland, 1998 (age 11-15 years)
Ittoqqortoormiit, Greenland, 1998 (age 2-4 years)Ittoqqortoormiit, Greenland, 1998 (age 5-10 years)
Ittoqqortoormiit, Greenland, 1998 (age 11-15 years)Svalbard, Norway, 1996 (age 0-5 years)Svalbard, Norway, 1996 (age >5 years)White Sea, Russia, 2001 (age 0-5 years)White Sea, Russia, 2001 (age >5 years)
Upernavik, Greenland, 1985 (age 5-10 years)Greenland Sea, Greenland, 1999 (age 12 years)
Davis Strait, Greenland, 1984 (all ages)Ammassalik, Greenland, 1984 (age 1 year)
Greenland Sea, Greenland, 1999 (age 9 years)
Foxe Basin, Canada, 1982-88 (all ages)Avanersuaq, 1975-77 (age 11 years)
Ringed seal
Harp seal
Hooded seal
Walrus
Figure 6.8. Mercury concentrations in seal and walrus kidney for selected regions of the Arctic and selected periods (for full datasets see Appendix Table A6.3.). The observed effects level for marine mammals associated with liver lesions in bottle-nosed dolphins (60 μg/g ww; Law, 1996) is also shown.
Figure 6.9. Mercury concentrations in baleen and toothed whale kidney for selected regions of the Arctic and selected periods (for full datasets see Appendix Table A6.4.). The observed effects level for marine mammals associated with liver lesions in bottle-nosed dolphins (60 μg/g ww; Law, 1996) is also shown.
0.01 0.1 1 10 100 1000 10000
Faroe Islands, 2001-07 (all ages)Faroe Islands, 2007 (all ages)
Barrow, AlaskaBarrow, Alaska, 1992-99 (365 cm)
Mackenzie Delta, Canada, 1984 (age 5.6 years)Grise Fiord, Canada, pre-1990 (age 13.9 years)
St. Lawrence, Canada, 1984 (age 17.5 years)Upernavik, Greenland, 1984-86 (age 0-6 years)
Upernavik, Greenland, 1984-86 (age 7-13 years)Upernavik, Greenland, 1984-86 (age >13 years)
Avanersuaq, Greenland, 1984 (age >3 years, f )Avanersuaq, Greenland,1984 (age >3 years, m)
Uummannaq, Greenland, 1993 (age >3 years, f )Uummannaq, Greenland, 1993 (age >3 years, m)
Central West Greenland, 1988-89 (all ages)Central West Greenland, 1988-1989 (age >7 years)
West Greenland, 1998 (all ages)East Greenland, 1998 (all ages, f )
Jan Mayen, 1998 (all ages)Lofoten, Norway, 1998 (all ages)
Svalbard, Norway, 1998 (all ages)Barents Sea, Norway, 1998 (all ages)
Barrow, Alaska, 1992-99 (1093 cm)
Lorino Lavrentia, Russia, 2001 (978 cm)Mechigmenskiy, Russia, 2001 (840 cm)
Mercury in whale kidney, μg/g ww
Observed e�ects level in marine mammals
Pilot whale
Beluga
Narwhal
Harbour porpoise
Minke whale
Bowhead whale
Grey whale
122 AMAP Assessment 2011: Mercury in the Arctic
86253_Mercury Scientific_r1.indd 122 12-10-2011 14:42:38

Hg or other heavy metals. However, an examination by Rosa et al. (2008) linked pulmonary fibromuscular hyperplasia to Cd in bowhead whales and also to age. Again, this shows that metals and histopathology co-vary with age and that it is difficult to isolate the possible impact of Hg from co-variables.
6.3.2.4. Ecological significance and interpretations
The relationships between Hg concentration, histopathology and health impacts could not be confidently evaluated as the studies were not conducted under controlled circumstances. However, despite the possible detoxification mechanisms via Se binding and metallothionein regulation, Hg may in the future represent a stressor to the animals. This is possible because of the rising trends in Hg concentration in the western Arctic and because climate change may induce shifts in pathogen organisms, food access, and contaminant transfer and bioaccumulation in the marine food webs which, ultimately, may have additive health impacts at least on the most susceptible individuals.
6.3.3. Blood mercury in high trophic level Arctic species in comparison with human health guidelines
Because blood represents one of the few minimally invasive monitoring matrices for live vertebrates and because multiple organs are being exposed through blood, this matrix is widely used in toxicology studies. Mercury concentrations in blood are mainly in the methylated form (MeHg) and represent post-
absorptive processing (diet), and release (mobilized) of stored sources (e.g., MeHg in muscle, liver). Guideline values for Hg in blood have also been established in conjunction with hair Hg concentrations (a less invasive procedure). Many studies have used these tissue types – this assessment focuses on recent studies in polar bears; because of a lack of recent blood data from other Arctic mammals some pre-2000 data from harp seals are included for comparative purposes (Figure 6.10). The blood Hg concentrations for polar bears were in the same range as for harp seals from St. Lawrence, northeastern Canada and West Greenland, but greater than levels in the Labrador harp seals. Only blood Hg concentrations in Inuit women from Qaanaaq, northwestern Greenland, were similar to levels in polar bear. The geographical pattern has previously been monitored in liver and polar bear hair (e.g., Eaton and Farant, 1982; Renzoni and Norstrom, 1990; Born et al., 1991; Braune et al., 1991; Dietz et al., 1995, 1996, 1998a, 2000a; Cardona-Marek et al., 2009). Previous data and the more recent data presented here, show that the highest Hg concentrations in liver and hair are found in the northern Canadian Arctic, with polar bears from Hudson Bay, Svalbard and the Russian regions having the lowest concentrations. Blood does not have a similarly high resolution in the spatial coverage, but does show a similar pattern with the lowest concentrations in western Hudson Bay and comparable concentrations between Alaska and the somewhat seasonally variable concentrations in East Greenland (Cardona-Marek et al., 2009; Dietz et al., unpubl.). Total Hg concentrations in blood of southern Beaufort Sea polar bears did not differ much by year (2005, 2007), age, or sex. Cardona-Marek et al. (2009) assessed sub-adults (3 to 5 years) and dependent young (1 to 2 years) and found a considerable amount of Hg in both blood
Figure 6.10. Mean blood mercury concentrations in Arctic marine mammals, Arctic Inuit populations and guideline levels for wildlife and humans. For sources and raw data see Appendix Table A6.5.
0.01 0.1 1 10 100 1000 10000
Mercury in mammalian blood, μg/L
Increased risk range, Health Canada
Clinical symptoms of neurotoxicity
Risk range, Health Canada
Benchmark dose lower limit (BMDL)
Informal human blood guideline value for mercury
St Lawrence, Canada,1976-78 (pups, m)St Lawrence, Canada, 1976-78 (juveniles, m)
St Lawrence, Canada, 1976-78 (adults, m)Labrador, Canada, 1976-78 (pups)
Labrador, Canada, 1976-78 (juveniles, m)Labrador, Canada, 1976-78 (adults, m)
Grise Fjord, Pangnirtung, Canada and NW Greenland, 1976-78 (juveniles, m)Grise Fjord, Pangnirtung, Canada and NW Greenland, 1976-78 (adults, m)
Alaska, 2005Western Hudson Bay, Canada, August/September 2006-08
Southern Ba�n Bay, Canada, April 2006East Greenland, Winter 1999-2001East Greenland, Spring 1999-2001
East Greenland, Summer 1999-2001East Greenland, Autumn 1999-2001
North Slope, Alaska, 1999-2003Canada, 2005
Nunavik, Canada, 2004Greenland, 1999-2006
Qaanaaq, Greenland, 2003Kola Peninsula, Russia, 2001-2003
Harp seal
Polar bear
Humans(Inuit women)
123Chapter 6 · What are the Toxicological Effects of Mercury in Arctic Biota?
86253_Mercury Scientific_r1.indd 123 12-10-2011 14:42:38

and hair. Mercury in dependent young was suggested to be via maternal sources of Hg (i.e., during gestation and/or lactation). This is an important exposure route for Hg in young animals, and indicates an important elimination route for reproductive females. Concentrations of THg in adult polar bears ranged from 7 to 210 μg/L for blood, with adult females having a greater concentration of THg in hair than adult males, again indicating a cohort of concern exposed to higher Hg (i.e., the fetus and neonate) as reported by Cardona-Marek et al. (2009). The explanation for this difference may be due to a higher dietary exposure of pregnant or lactating female polar bears as they may eat more high protein and high Hg-exposed tissues than males, who tend preferentially to eat blubber which is low in Hg. Also, Alaskan female bears may target species higher in Hg (smaller pinnipeds), while males may target larger species with less Hg (bowhead whales, bearded seals and walrus) simply based on larger males taking larger prey. The implication of maternal transfer of Hg to polar bear offspring is unknown and further research should examine the potential of Hg accumulation (and resulting effects) on the developing organism. The data from Appendix Table A6.5. also indicate a seasonal difference linked to the seasonality of polar bear feeding in East Greenland (Dietz et al., unpubl.). Hence the spring and autumn Hg concentrations in polar bear blood are higher than during summer, when limited sea ice is available on which to hunt, and during winter when females hibernate and seals are harder to access. In the absence of ursid-specific guidelines for Hg in blood, Hg blood concentrations in polar bears are compared to those derived for humans. The caveats for such an approach are fully respected and comparisons with human guidelines are made for illustrative purposes only. The blood guideline established by Health Canada for Hg considers concentrations below 20 μg/L in human blood to be within an acceptable range (Health Canada, 1984). Individuals with Hg concentrations between 20 and 100 μg/L have been determined to be at ‘increasing risk’, whereas individuals with blood Hg concentrations that exceed 100 μg/L are considered to be ‘at risk’. Following the observations at Minamata Bay, Japan where thousands of people suffered from MeHg poisoning, it was concluded that 200 μg Hg/L whole blood may be considered a value associated with clinical symptoms of neurotoxicity (Clarkson and Magos, 2006). Based on a review of human epidemiological data from studies from the Faroe Islands and New Zealand, the NAS/NRC (U.S. National Academy of Sciences / U.S. National Research Council) derived a benchmark dose lower limit (BMDL) of 58 µg/L Hg in cord blood. The U.S. National Research Council re-evaluated the Hg risk assessment (NRC, 2000). The NRC report suggested that a ten-fold uncertainty factor should be applied in the development of a Tolerable Daily Intake (NRC, 2000). Based on this evaluation an informal blood guideline value for Hg of 5.8 μg/L in blood has been developed (see AMAP, 2003, section 9.3.1 for further details about Hg guidelines).When this guideline value is applied to the polar bear, it is clear that most bears possess blood Hg levels that would be of health concern in humans. It should be emphasized that variable sensitivity to Hg exists across species and that the human 5.8 μg/L guideline is highly conservative and may not apply to mammals in general. For example, primates with blood Hg levels exceeding 1000
μg/L did not show any signs of clinical toxicity (Clarkson and Magos, 2006). As in humans (fellow omnivores) the feeding ecology of bears complicates this assessment. Mercury was measured in whole blood of 64 southern Beaufort Sea polar bears and the variability observed was likely to be due to intraspecific variation in prey selection (including tissue-specific consumption) and movement patterns rather than strictly trophic level interactions (Cardona-Marek et al., 2009). Thus, as in humans, feeding is not simply ‘bear eats seal’ because the concentrations of Hg vary greatly within a seal and among seal species. Cardona-Marek et al. (2009) indicated that circulating concentrations of blood Hg during spring were similar between sexes for Hg, but that feeding ecology may drive cohort differences (e.g., sex and age interactions). This is currently being evaluated. Thus, the changes in prey abundance and distribution patterns predicted with future reductions in sea ice in the southern Beaufort Sea may alter dietary exposure and subsequent tissue distribution based on bear condition. Because many bears are above the human ‘increasing risk’ (20 and 100 μg/L) and the ‘at risk’ (over 100 μg/L) criteria levels, this raises questions about possible implications for polar bear health. In addition, Cardona-Marek et al. (2009) reported that the highest Hg concentration in blood (213 μg/L) was from a 16-year old female captured near Barrow. The maximum concentrations observed in the East Greenland, southern Baffin Bay and western Hudson Bay populations were 287, 739 and 56 μg/L, respectively (Dietz et al., unpubl.) Thus, the study of blood Hg concentrations in polar bears from the Chukchi Sea, East Greenland, and southern Baffin Bay is warranted in order to examine the trends and effects of Hg concentrations. The northern Arctic Canada and northwestern Greenland populations are likely to have even higher levels of blood Hg, as indicated in the geographical Hg exposure pattern for polar bear liver and hair (Dietz et al., 1998a, 2000a).
6.3.4. Comparison of polar bear hair concentrations with effect guidelines
As polar bear hair has been analyzed extensively over time and across regions, and as the Hg levels relate to effects thresholds, this matrix was used to evaluate circumpolar temporal trends in Hg exposure. Hair represents a good biomarker of Hg exposure since it accumulates organic Hg from blood and can be collected through minimally invasive sampling methods. Hair is a well established research matrix for Hg among humans, from which effect guidelines have been set. As for blood, it is not known to what extent these effect levels are applicable to wildlife or polar bears in particular. Dietz et al. (2006a; 2011) reported that Hg concentrations in polar bear hair have increased more than 14-fold since pre-industrial times in Greenland, indicating a trend that is likely to involve anthropogenic sources. These increases are in accordance with increases in other hard tissue from high trophic level Arctic species (see Section 5.2; Dietz et al., 2009a). Such increases require an assessment of the recent temporal trends in Hg in a harmonized substrate that has been analyzed over time for a number of different regions. Polar bear hair represents such a substrate and is one for which effect levels exist, and from which therefore a risk assessment can be developed.
124 AMAP Assessment 2011: Mercury in the Arctic
86253_Mercury Scientific_r1.indd 124 12-10-2011 14:42:39

For mammalian wildlife, such as mink and river otters, fur Hg levels exceeding 30 μg/g dw may be considered a threshold for clinical effects (i.e., sublethal and clinical health responses) according to Basu et al. (2007a) and Evers et al. (2007). A somewhat lower threshold of 20 μg/g dw was set by Thompson (1996) for terrestrial mammals (Table 6.1). Recent studies on polar bears from the East Greenland coast have documented Hg-associated reduction of the NMDA receptor levels and of genomic DNA methylation status in the brain stem (Table 6.1; Basu et al., 2009; Pilsner et al., 2010). These sub-clinical, biochemical alterations have been reported for populations with hair Hg means of about 5.4 μg/g dw. These means are 4- to 6-fold lower than the wildlife clinical effect thresholds, but comparable to the revised NOEL (No Observed Effect Level) for Hg in human hair (6.0 μg/g dw) from the Faroe Islands as suggested by Grandjean and Budtz-Jørgensen (2007). The revised NOEL from the Faroe Island human population is half the previous NOEL (12.0 μg/g dw) set for the region (FAO/WHO, 2003). The U.S. EPA Hg guideline value of 1.0 μg/g dw for human hair is among the lowest guideline values and is based on a NOEL of 12.0 μg/g dw with a safety factor of about 10 (U.S. EPA, cited in FAO/WHO, 2003).
As seen from Figure 6.11 (and Table 6.2) some populations of polar bears like those in Svalbard and western Hudson Bay have among the lowest hair Hg median concentrations. These levels are below the neurochemical effect level of 5.4 μg/g dw observed in East Greenland (Basu et al., 2009) and the NOEL of 6.0 μg/g dw in humans on the Faroe Islands (Grandjean and Budtz-Jørgensen, 2007). No bears from Svalbard exceeded the brain stem effect level or any of the higher effect levels (Table 6.2), but 6.8% and 1.7% of the western Hudson Bay bears exceeded the brain stem effect level and the Faroe Islands NOEL, respectively (Table 6.2). None of the bears from western Hudson Bay exceeded any of the higher Hg threshold levels – from 12 to 30 μg/g dw. Among East Greenland bears, those sampled between 1973 and 2000 and between 2001 and 2008 exceeded the brain stem effect limit in 46.3% and 60.5% of cases, respectively. Conversely, among the bear fur samples from 1892 to 1950 sampled by Dietz et al. (2006a), none exceeded this effect level. The 12 μg/g dw NOEL level was exceeded in 4.0% to 5.1% of the bears sampled between 1973 and 2000 and between 2001 and 2008 (Table 6.2). In northwestern Greenland the exceeding percentages were greater than for East Greenland, but still none of the
Group Hg μg/g dw Symptoms Source
Fish-eating wildlife > 20 Neurological effect levels Thompson, 1996 > 30 Neurological effect levels Evers et al., 2007 > 30 Neurological effect levels Basu et al., 2007a
Polar bear 5.4 Reduction in NMDA receptor levels Basu et al., 2009 5.4 Reduction in genomic DNA methylation Pilsner et al., 2010
Human 12 NOEL and BMDL for the Faroese population FAO/WHO, 2003 6 Revised NOEL and BMDL for the Faroese population Grandjean and Budtz-Jørgensen, 2007 1 U.S. EPA guideline values U.S. EPA cited in FAO/WHO, 2003
Table 6.1. Suggested thresholds for mercury in wildlife and polar bear and effects guidelines in human hair.
0.01 0.1 1 10 100 1000 10000
Mercury in mammalian hair, μg/g dw
Neurological e�ect level, �sh-eating wildlife
Neurological e�ect level, �sh-eating wildlife
Polar bears: Reduction of the NMDA receptor levels
Humans: NOEL and BMDL for the Faroese population
Humans: Revised NOEL and BMDL for the Faroese population
Humans: US EPA guideline value
Alaskan Beaufort Sea, 2005Western Hudson Bay, Canada, 1993-2008
Lancaster Sound, Canada, 1992-99Lancaster Sound, Canada, 2001 (estimated)
Northwest Greenland, 1892-1960Northwest Greenland, 1973-2000
Northwest Greenland, 2000-08Northwest Greenland, 2049 (estimated)
East Greenland, 1892-1950East Greenland, 1973-2000
East Greenland, 2001-08East Greenland, 2030 (estimated)
Svalbard, 1990-2000Svalbard, 2000-08
Qaanaaq, Greenland, 1995 (age 8.4 years)Inuit women - Qaanaaq, Greenland, 1995
Newborn children - Faroe Islands, 1999
Polar bear
Humans
Figure 6.11. Average and ranges (bars) for mercury concentrations in polar bear hair from northwestern Greenland, East Greenland, Svalbard, two Canadian management zones and the Southern Beaufort Sea. Future (relative to latest available) average values were estimated in three cases where significant upward trends were observed (purple bars). Selected mean mercury concentrations in human hair are also presented, together with the effect threshold limits given in the text and see Appendix Table A6.6., where data sources can be found.
125Chapter 6 · What are the Toxicological Effects of Mercury in Arctic Biota?
86253_Mercury Scientific_r1.indd 125 12-10-2011 14:42:39

bears exceeded the 20 and 30 μg/g dw threshold limits. The population with the highest Hg concentrations and hence the population of greatest concern was the Lancaster Sound bears sampled between 1992 and 1999. Here the three lowest effect levels were exceeded by 98.1% to 100% of the bears and even the 20 and 30 μg/g dw effect thresholds limits were exceeded in 27.8% and 13.0% of bears, respectively. Whether hair Hg levels in this population have continued to increase as they have in the Greenland bears sampled after 2000 is uncertain, but the high concentrations certainly call for updated hair analysis and accompanying effect studies in the brain and other relevant target organs. The steep increases observed in the Lancaster Sound (1992 to 1999) polar bears were predicted to have reached the 30 μg/g dw level by around 2001. If the increases observed in Greenland continue, then the median concentrations will have reached the 20 μg/g dw level by around 2049 in northwestern Greenland and 10 to 12 μg/g dw by around 2030 in East Greenland (Figure 6.11). Polar bears sampled in East Greenland around 2000 exhibiting neurochemical effects in the brain stem had mean hair Hg concentrations of 5.4 μg/g dw. The finding of Hg concentrations continuing to increase in some regions since then, and the higher Hg levels in the northwestern Greenland and northern Canadian High Arctic populations, gives rise to concern for these populations. Finally there are parts of the polar bear brain that contain even higher Hg concentrations (such as the pituitary gland, which has about 6-fold higher concentrations) than the brain stem, where more severe effects may be expected (see Section 6.3.1). The hair Hg future scenarios draw attention to quite high Hg levels in polar bear fur, which have increased dramatically compared to the pre-industrial average concentration and which, in several regions, continue to increase. However, high Hg concentration in hair is also an effective way of excreting Hg from the body. Other species have less fur, such as seals and walruses, and in toothed whales (beluga, narwhal, pilot whale) this excretion route is non-existent. Toothed whales are thus more at risk from Hg, and this is also reflected in their higher concentrations in brain, liver and muscle (Olsen et al., 2003;
Hoydal and Dam, 2005, 2009; Ostertag et al., 2009; Sonne et al., 2010).
6.3.5. Comparison of safe guidelines in bird eggs with Arctic seabirds
Dietary Hg is rapidly transferred to avian eggs on a dose-dependent basis, making reproduction one of the most sensitive endpoints of Hg toxicity in birds (Wolfe et al., 1998). Nearly all of the Hg transferred to eggs is in the form of MeHg, with the majority (about 85% to 95%) deposited in the albumen (Wiener et al., 2003). Mercury concentrations in the egg are a good indicator of Hg risk to avian reproduction (Wolfe et al., 1998). Some of the documented effects of Hg on avian reproduction include reduced hatchability due to increases in early mortality of embryos, reduced clutch size, and embryonic deformity (Thompson, 1996; Wolfe et al., 1998). A strong positive relationship between female blood Hg and egg Hg concentration has been used to demonstrate adverse reproductive effects in the common loon (Evers et al., 2003). By using this relationship and integrating a number of other endpoints related to MeHg exposure into a population matrix model, Evers et al. (2008) were able to characterize certain North American loon breeding populations which were experiencing reduced fledging success as ‘population sinks’, that is, as having negative population-level impacts. Overall, reproductive success in birds can decrease by 35-50% from a level of dietary MeHg exposure that is insufficient to cause obvious signs of toxicity in adults (Wolfe et al., 1998). The currently accepted lowest observed adverse effect level (LOAEL) for Hg in avian eggs is 0.5 µg/g ww (range 0.5 to 1.0 µg/g ww) as determined from multi-generational feeding studies in ring-necked pheasants (Phasianus colchicus) and mallards (Anas platyrhynchos) (Fimreite, 1971; Heinz, 1976). Based on a review of the literature, Thompson (1996) concluded that, overall, Hg concentrations in excess of 2.0 µg/g ww in eggs appear to have some detrimental effect, leading to the suggestion that Hg concentrations of 0.5 to 2.0 µg/g ww in eggs are sufficient to induce impaired reproductive success in a range of bird species. However, a recent study, in which eggs of
Table 6.2. Polar bear populations and periods exceeding the selected effect levels given in Table 6.1.
Population PeriodMedian Hg,
μg/g dw N
Percentage exceeding the hair effect levels listed in Table 6.1. The effects levels below are expressed in μg/g dw
Data source1 5.4 6 12 20 30
Alaskan Beaufort Sea 2005 6.5 52 96.2 65.4 59.6 9.6 1.9 0 Cardona-Marek et al., 2009Western Hudson Bay 1993 – 2008 4.1 59 100.0 6.8 1.7 0 0 0 Dietz et al., unpubl.Lancaster Sound 1992 – 1999 16.0 54 100.0 98.1 98.1 75.9 27.8 13.0 Dietz et al., unpubl.Northwestern 1892 – 1960 3.5 10 90.0 10.0 10.0 0 0 0 Dietz et al., 2006a, 2011Greenland 1973 – 2000 7.3 76 100.0 84.2 73.7 6.6 0 0 Dietz et al., 2006a, 2011
2000 – 2008 9.4 31 100.0 93.5 93.5 25.8 0 0 Dietz et al., 2006a, 2009b, 2011East 1892 – 1950 1.0 9 55.6 0 0 0 0 0 Dietz et al., 2006aGreenland 1973 – 2000 5.2 296 100.0 46.3 38.9 5.1 0.3 0 Dietz et al., 2006a
2001 – 2008 6.1 124 99.2 60.5 50.8 4.0 0 0 Dietz et al., 2006a, 2009bSvalbard 1990 – 2000 1.8 203 93.1 0 0 0 0 0 Dietz et al., 2009b
2000 – 2008 1.8 28 93.8 0 0 0 0 0 Dietz et al., 2009b
0% Not occurring 0% – 10% Seldom occurring 10% – 90% Occurring 90% – 100% Very common
126 AMAP Assessment 2011: Mercury in the Arctic
86253_Mercury Scientific_r1.indd 126 12-10-2011 14:42:39

26 species of birds were dosed with MeHg, demonstrated that the sensitivity of avian embryos to MeHg can vary dramatically among species with median lethal concentrations (LC50) ranging from 1 µg/g ww or more in eggs of the low sensitivity group (e.g., hooded merganser, Lophodytes cucullatus; lesser scaup, Aythya affinis; double-crested cormorant, Phalocrocorax auritus; laughing gull, Larus atricilla) to less than 0.25 µg/g ww in eggs of those species exhibiting high sensitivity (e.g., osprey, Pandion haliaetus; white ibis, Eudocimus albus; snowy egret, Egretta thula) (Heinz et al., 2009). A survey of recently published concentrations of Hg in eggs of Arctic birds (Figure 6.12) shows that none of the mean Hg concentrations reported for eggs of a wide range of aquatic birds exceeded 2.0 µg/g ww and that only mean values for glaucous gull (Larus hyperboreus) and ivory gull (Pagophila eburnea) eggs from the Canadian Arctic, and black guillemot (Cepphus grylle) eggs from the Canadian Arctic and the Faroe Islands approached or exceeded 0.50 µg/g ww. Braune et al. (2006)
noted that two of the six ivory gull (Pagophila eburnea) eggs sampled in the Canadian Arctic exceeded Hg concentrations of 2.0 µg/g ww and five out of six eggs exceeded 0.50 µg/g ww, compared with the maximum concentrations for ivory gull eggs from the Russian Arctic which ranged from 0.24 to 0.48 µg/g ww (Miljeteig et al., 2009). Although mean Hg concentrations were similar in black guillemot eggs from the Canadian Arctic and the Faroe Islands, maximum Hg concentrations were higher in eggs from the Faroe Islands, ranging from 0.898 µg/g ww in 2002 to 1.31 µg/g ww in 2006, compared with maximum values of 0.60 to 0.84 µg/g ww at three colonies in the Canadian Arctic in 2004 (see Figure 6.12, Braune et al., 2006; Hoydal and Dam, 2005, 2009). Knudsen et al. (2005) reported a maximum Hg concentration of 0.4 µg/g ww in glaucous gull eggs from northern Norway which is similar to the mean Hg concentrations found in thick-billed murre (Uria lomvia) eggs from Prince Leopold Island and northern fulmar (Fulmarus glacialis) eggs from two locations
Figure 6.12. Mean total mercury concentrations in eggs from a range of Arctic bird species as summarized from the literature, in comparison with effect levels for potential reproductive impairment from Thompson (1996). The bars indicate maximum range values, where available. For sources and raw data see Appendix Table A6.7.
0.01 0.1 1 10 100 1000 10000
Mercury in bird eggs, μg/g ww
LOAEL low
LOAEL high
St. George I., Alaska, 2000Bogoslof I., Alaska, 2000
St. Lazaria I., Alaska, 2001Prince Leopold I., Canada, 2003
Coats I., Canada, 2003
Little Diomede I., Alaska, 1999St. George I., Alaska, 1999
East Amatuli I., Alaska, 1999Bogoslof I., Alaska, 2000
St. Lazaria I., Alaska, 2001St. Lazaria I., Alaska, 1999
Prince Leopold I., Canada, 2004Devon I., Canada, 2004
Southampton I., Canada, 2004Faroe Islands, 2002Faroe Islands, 2004Faroe Islands, 2006
Aleutians - Adak, Alaska, 2004Aleutians - Amchitka, Alaska, 2004
Aleutians - Kiska, Alaska, 2004Prince Leopold I., Canada, 2003
Bjørnøya, Norway, 2002
Seymour I., Canada, 2004Svenskøya, Norway, 2007
Nagurskoe, Russia, 2006Cape Klyuv, Russia, 2006Domashny, Russia, 2006
Hornøya, Norway, 2003
Prince Leopold I., Canada, 2003Devon I., Canada, 2003
Prince Leopold I., Canada, 2003Hornøya, Norway, 2003
Arctic Coastal Plain, Alaska, 1999-2002Cape Espenberg, Alaska, 1999-2002
Yukon-Kushokwim Delta, Alaska, 1999-2002Copper River Delta, Alaska, 1999-2002
Alaska, 1992-1998
Yukon-Kushokwim Delta, Alaska, 2002-03
Hornøya, Norway, 2003Hjelmsøy, Norway, 2003
Thick-billed murre
Common murre
Black guillemot
Glaucous and Glaucous-winged gulls
Ivory gull
Herring gull
Northern fulmar
Black-legged kittiwake
Red-throated loon
Common loon
Greater scaup
Atlantic pu�n
Thresholds = ?
Some questions on ranges (80% grey bars)
127Chapter 6 · What are the Toxicological Effects of Mercury in Arctic Biota?
86253_Mercury Scientific_r1.indd 127 12-10-2011 14:42:40

in the Canadian Arctic (see Figure 6.12, Braune et al., 2006; Braune, 2007). Schmultz et al. (2009) reported a maximum Hg concentration of 0.60 µg/g ww in eggs of red-throated loons (Gavia stellata) from Alaska compared with a maximum of 0.50 µg/g ww in eggs of common loons from Alaska (Evers et al., 2003). Burger et al. (2009) suggested that the Hg concentrations found in the eggs of glaucous-winged gulls (Larus glaucescens) from the Aleutian Islands off Alaska were within the range known to affect avian predators although these latter authors also noted that seabirds seem to be less vulnerable to Hg than other birds. Thompson (1996) suggested that pelagic seabirds have yet to be exposed to sufficiently high burdens of Hg to induce measurable effects on reproduction or survival. This could well be due to the ability of some seabirds to demethylate MeHg in the liver (Kim et al., 1996) although the capacity for demethylation appears to vary among species (Kim et al., 1996; Eagles-Smith et al., 2009). Nevertheless, Hg concentrations in eggs, which approach or exceed published threshold values for reproductive impairment, have been reported recently for a number of aquatic birds breeding in the Arctic. Furthermore, although there is no conclusive evidence to date, that the Hg exposure levels found in the Arctic aquatic environment are resulting in adverse biological effects in the birds studied, it is generally acknowledged that it is difficult to attribute population-level impacts to a specific factor.
6.3.6. Comparison of fish effect levels with mercury concentrations in Arctic fish species
Mercury toxicology in fish was not extensively studied before the late 1990s. Indeed, it was commonly believed that fish were important mainly as vectors of MeHg transfer to humans and fish-eating wildlife. This view was partially supported by the observation that direct mortality due to MeHg exposure in fish was observed only at very high tissue Hg concentrations (over 5 μg/g ww in muscle) that were characteristic solely of highly contaminated local environments (Wiener and Spry, 1996). However, more recent studies have reported a range of toxic effects in fish at much lower Hg concentrations. It is now believed that current levels of exposure to environmental MeHg are sufficiently high to be chronically toxic to a number of predatory freshwater fish in many environments (Scheuhammer et al., 2007). For example, in some independent field studies, body condition in fish of various species was reported to be inversely correlated with tissue Hg over a range of about 0.1 to 1.0 μg/g ww in liver or axial muscle (Munn and Short, 1997; Cizdziel et al., 2003; Drevnick et al., 2008). In a controlled feeding study, Webber and Haines (2003) reported that golden shiners (Notemigonus crysoleucas) with whole-body Hg concentrations averaging 0.52 μg/g ww were hyperactive and had altered shoaling behavior relative to fish with lower Hg concentrations. However, the most important negative effects of Hg exposure reported in fish may be on reproductive parameters, such as impaired spawning behavior, mediated through a disruption of normal neuroendocrine function (Hammerschmidt et al., 2002; Drevnick and Sandheinrich, 2003; Klaper et al., 2006; Sandheinrich and Miller, 2006; Crump and Trudeau, 2009). In a critical review of the recent literature, Sandheinrich and Wiener (2010) concluded that changes in
biochemical processes, damage to cells and tissues, and reduced reproduction in fish occur at MeHg concentrations of about 0.5 to 1.2 μg Hg/g ww in axial muscle. The lower values of this range are common in some larger freshwater piscivorous fish throughout eastern North America (Kamman et al., 2005) and elsewhere. The principal effects of MeHg on fish populations at existing exposure levels in North American freshwaters are most likely to be mediated through sublethal damage to tissues and depressed reproduction (Sandheinrich and Wiener, 2010). As shown in Figure 6.13, the minimum Hg toxicity threshold in fish muscle of 0.5 μg/g ww, based on the review by Sandheinrich and Wiener (2010), is seldom exceeded in Arctic marine fish species. Similarly, a survey of Hg in muscle of fish species from the Barents Sea reported that mean Hg concentrations did not exceed 0.25 μg/g ww in any species (Zauke et al., 1999). Arctic freshwater species tended to have higher Hg concentrations than marine species (Figure 6.13), but most species from most locations sampled between 1990 and 2008 had mean Hg concentrations in muscle of less than 0.5 μg/g ww. However, the putative toxicity threshold was approached or exceeded for some freshwater predatory species such as lake trout (Salvelinus namaycush), northern pike (Esox lucius), and landlocked Arctic char (Salvelinus alpinus) from some sampling sites (Figure 6.13; Evans et al., 2005a; Lockhart et al., 2005a). The highest mean Hg value (1.78 μg/g ww; Figure 6.13) was for landlocked Arctic char sampled from Amituk Lake, Cornwallis Island, Canada; however, as discussed by Lockhart et al. (2005a), this value is an adjusted (not a measured) value based on a length regression, and may be erroneously high. Nevertheless, landlocked char in general have higher Hg concentrations than sea run char (Rigét et al., 2004; Lockhart et al., 2005a). The range of fish Hg toxicity thresholds (0.5 to 1.2 μg/g ww in muscle) suggested by Sandheinrich and Wiener (2010) was based on a review of the fish toxicology literature which deals almost exclusively with freshwater species. Although Arctic marine fish species tended to have relatively low muscle Hg concentrations, it is uncertain how well toxicity thresholds based on freshwater fish may be applied to marine species. There is far less information on the effects of MeHg on saltwater fish, and the issue of the interaction between Se and Hg in marine species adds potential complexity to the issue. In addition, there do not appear to be any Hg data for large predatory marine fish such as sharks in Arctic waters, for which Hg levels would be expected to be considerably higher than for the species shown in Figure 6.13. Nonetheless, currently available data on Hg in Arctic fish does not indicate a significant risk of toxicity for most species analyzed to date, with the possible exception of some larger freshwater predatory species. As the vast majority of fish Hg data concern muscle concentrations, the above assessment was based on muscle levels alone. To what extent additional information could be obtained by analyzing Hg in other fish tissues such liver, kidney and brain remains unanswered in the present assessment.
Marine
0.01 0.1 1 10 100 1000 10000
Mercury in �sh muscle, μg/g ww
Fish toxicity threshold (freshwater)
Mackenzie R. Basin, Canada, 1999-2001Great Slave Lake, Canada, 1999-2002
Lake Kusawa (Yukon), Canada, 1993-2002Lake Laberge (Yukon), Canada, 1993-2002
Mackenzie R. Basin, Canada, 1999-2002
Mackenzie R. Basin, Canada, 1999-2002Great Slave Lake, Canada, 1999-2002
Storvindeln, Sweden, 1968-2005
North L., Canada, 2000Boomerang L., Canada, 2002
Resolute L., Canada, 1999-2002Amituk L., Canada, 2002
Char L., Canada, 1999 Sapphire L., Canada, 1999
Greenland, 2004-2008 Faroe Islands, 2000-2007
Abiskojuare, Sweden, 1981-2000
Byron Bay, Canada, 1990Lauchian R., Canada, 1993
Cambridge Bay, Canada, 1991-93Foggy Bay, Canada, 1993Ellice R., Canada, 1990-93
Surrey R., Canada, 1990-93Netling, Canada, 1990
Silvia Grin R., Canada, 1991Ferguson R., Canada, 1992
Wilson R., Canada, 1993Rankin Inlet, Canada, 1991-93
Chester�eld Inlet, Canada, 1991-93Gore Bay, Canada, 1992
Hall Beach, Canada, 1992Richmond Gulf, Canada, 1994
Pangnirtung Giord, Canada, 1992Northern Quebec, Canada, 1990s
Labrador, Canada, 1990sSandy Point, Canada, 1992-93
Labrador/Newfoundland, Canada, 1990Iceland, 1990-92
NW Iceland, 2000-07SW Iceland, 2001
NE Iceland, 2000-07SE Iceland, 2001-03
Faroe Island, 2000-07Faroe Islands, 1994
Haltenbanken, Norway, 1994Stokken, Norway, 2005
Froan/Stokken, Norway, 1993-94Lille Molla, Norway, 2002-06
Lofoten/Lille Molla, Norway, 1992-94Kvunangen, Norway, 2006-07
Varanger�orden, Norway, 2000-07Varanger�orden, Norway, 1994
Finnsnes, Norway, 1994Hammerfest, Norway, 1994
Svalbard, Norway, 1993Barents Sea, Norway, 1993
Lille Moalla, Norway, 2000-06Skogeray, Norway, 2000-07
Cape Farvel, Greenland, 1994Denmark Strait, Greenland, 1994
Iceland, 1994Faroe Islands, 1994
Haltenbanken, Norway, 1994
Svalbard, 1993Barents Sea (Norway), 1992-93
Iceland, 1990-91
Burbot
Lake trout
Pike
Char(landlocked)
Char(sea run)
Atlantic cod
Plaice
Red�sh
Long rough dab
Common dab
128 AMAP Assessment 2011: Mercury in the Arctic
86253_Mercury Scientific_r1.indd 128 12-10-2011 14:42:40

Figure 6.13. Mean total mercury concentrations in muscle summarized from data for selected Arctic fish species sampled from locations in Arctic Canada, Norway, Iceland, Greenland, the Faroe Islands and Sweden. Plotted values are means for five or more individuals per location sampled between 1990 and 2009. The solid red line indicates the lowest suggested threshold in dorsal muscle for mercury toxicity in fish (0.5 μg/g; Sandheinrich and Wiener, 2010). The fish mercury data are from a range of sources (Hellou et al., 1992; Maage et al., 1996; Stange et al., 1996; Rigét et al., 1997; Larsen and Dam, 2003; Evans et al., 2005a; Lockhart et al., 2005a; OSPAR, unpubl. data; A. Bignert, Swedish Museum of Natural History, Sweden, unpubl. data; F. Rigét, National Environmental Research Institute, Denmark, 2009 unpubl. data; G. Stern, Fisheries and Oceans Canada, 2009 unpubl. data). See Appendix Table A6.8. for further details.
Freshwater
Marine
0.01 0.1 1 10 100 1000 10000
Mercury in �sh muscle, μg/g ww
Fish toxicity threshold (freshwater)
Mackenzie R. Basin, Canada, 1999-2001Great Slave Lake, Canada, 1999-2002
Lake Kusawa (Yukon), Canada, 1993-2002Lake Laberge (Yukon), Canada, 1993-2002
Mackenzie R. Basin, Canada, 1999-2002
Mackenzie R. Basin, Canada, 1999-2002Great Slave Lake, Canada, 1999-2002
Storvindeln, Sweden, 1968-2005
North L., Canada, 2000Boomerang L., Canada, 2002
Resolute L., Canada, 1999-2002Amituk L., Canada, 2002
Char L., Canada, 1999 Sapphire L., Canada, 1999
Greenland, 2004-2008 Faroe Islands, 2000-2007
Abiskojuare, Sweden, 1981-2000
Byron Bay, Canada, 1990Lauchian R., Canada, 1993
Cambridge Bay, Canada, 1991-93Foggy Bay, Canada, 1993Ellice R., Canada, 1990-93
Surrey R., Canada, 1990-93Netling, Canada, 1990
Silvia Grin R., Canada, 1991Ferguson R., Canada, 1992
Wilson R., Canada, 1993Rankin Inlet, Canada, 1991-93
Chester�eld Inlet, Canada, 1991-93Gore Bay, Canada, 1992
Hall Beach, Canada, 1992Richmond Gulf, Canada, 1994
Pangnirtung Giord, Canada, 1992Northern Quebec, Canada, 1990s
Labrador, Canada, 1990sSandy Point, Canada, 1992-93
Labrador/Newfoundland, Canada, 1990Iceland, 1990-92
NW Iceland, 2000-07SW Iceland, 2001
NE Iceland, 2000-07SE Iceland, 2001-03
Faroe Island, 2000-07Faroe Islands, 1994
Haltenbanken, Norway, 1994Stokken, Norway, 2005
Froan/Stokken, Norway, 1993-94Lille Molla, Norway, 2002-06
Lofoten/Lille Molla, Norway, 1992-94Kvunangen, Norway, 2006-07
Varanger�orden, Norway, 2000-07Varanger�orden, Norway, 1994
Finnsnes, Norway, 1994Hammerfest, Norway, 1994
Svalbard, Norway, 1993Barents Sea, Norway, 1993
Lille Moalla, Norway, 2000-06Skogeray, Norway, 2000-07
Cape Farvel, Greenland, 1994Denmark Strait, Greenland, 1994
Iceland, 1994Faroe Islands, 1994
Haltenbanken, Norway, 1994
Svalbard, 1993Barents Sea (Norway), 1992-93
Iceland, 1990-91
Burbot
Lake trout
Pike
Char(landlocked)
Char(sea run)
Atlantic cod
Plaice
Red�sh
Long rough dab
Common dab
129Chapter 6 · What are the Toxicological Effects of Mercury in Arctic Biota?
86253_Mercury Scientific_r1.indd 129 12-10-2011 14:42:40
6.4. Conclusions and recommendationsConclusions (in numbered bullets) are organized under section headings, followed by knowledge gaps / recommendations (in italics) when appropriate.
What is known about the combined effects of contaminants, and other types of environmental stressors?
1. Interactions between Hg and other chemical stressors (e.g., Cd, POPs), nutritional factors (e.g., Se, food availability, vitamin status), and environmental changes (e.g., climate change and its impacts on sea-ice habitat loss, prey availability) are relevant to health concerns about Arctic biota, and are complicated.
Investigations that explore combined effects under a multiple stressor framework should be initiated to improve understanding of how chemical and non-chemical stressors interact to affect the health of Arctic biota and the broader Arctic ecosystem.
What role does mercury speciation play in uptake and toxic effects?
2. Many high trophic level predators associated with marine and other aquatic ecosystems are exposed to Hg primarily as MeHg in their diet (via muscle, epidermis); however, a variable proportion of absorbed MeHg is demethylated, and some tissues (such as liver and kidney) can accumulate high inorganic Hg concentrations bound to Se reaching an approximate 1:1 molar ratio. This process of demethylation and sequestration with Se is speculated to be a protective mechanism by which some animals can detoxify MeHg.
The possible interspecies differences in the effectiveness of demethylation, selenium biochemistry, and sensitivity to MeHg exposure would be highly relevant to future studies on Arctic species. The antioxidant role of Se directly and indirectly (e.g., as cofactor for glutathione peroxidase) should also be investigated. Future studies should also consider sequestration of Se by Hg, which may result in Se deficiency.
Is there any evidence that tissue mercury concentrations at present are harmful to Arctic biota?
Summary on mercury and effects in brains
3. The overall results show that the highest concentrations in brain tissue are found in toothed whales and that these are in the range of Hg-associated neurochemical effects. Despite relatively high levels of Hg in liver and kidney, Hg levels are surprisingly low in the polar bear brain stem. Despite these lower-than-expected Hg levels, significant correlations were found between brain Hg levels and changes in neurochemical biomarkers in a manner consistent with other fish-eating wildlife. These results indicate that excretion through fur may substantially reduce the brain exposure in fur-bearing species compared to species without such excretion possibilities, for example whales.
Owing to the importance of brain neurochemistry in multiple aspects of animal health, the ecological and physiological
significance of prolonged disruption to brain neurochemistry needs to be addressed. Future studies should also evaluate Hg exposure and effects in other high trophic level Arctic wildlife and in other brain regions that may accumulate more Hg than the brain stem. Other toothed whales, such as pilot whales and narwhal, should be investigated to see if Hg concentrations as high as those in beluga can be detected.
Histopathology of Arctic marine mammals
4. Histopathological changes in liver and kidney tissues have been observed in polar bears from East Greenland, beluga, bowhead whales and ringed seals from Alaska, and pilot whales from the Faroe Islands. Some of these changes have been related to tissue Hg levels, although links with other key parameters such as age, disease and other contaminants have also been found. The significance of these tissue lesions on the individual and at population level is uncertain.
5. Mean liver Hg concentrations and probably also kidney concentrations in polar bears from southwestern Melville Island and the eastern Beaufort Sea exceeded the general toxic threshold Hg values for terrestrial and marine mammals. These regional patterns and findings fit well with the areas of concern based on hair Hg measurement. Few recent data are available to evaluate the recent loads in the most exposed seals, such as hooded seals.
6. Pilot whales from the Faroe Island and in some cases beluga populations from St. Lawrence and Point Lay have mean Hg liver concentrations exceeding the threshold values for liver damage.
The populations having tissue concentrations of concern should be investigated for Hg-induced health effects. Future histopathological work should include other physiologically important tissues such as the brain, reproductive organs, and the developing organism.
7. Although the developing fetus is known to be sensitive to MeHg, no investigations have been carried out on Hg-related impairments to reproduction and neurodevelopment in Arctic marine mammals.
Comparison of observed blood mercury levels in high trophic level species with effect concentrations and safe guidelines
8. Blood Hg concentrations are useful in assessing ongoing target organ exposure and mostly represent recent dietary exposures, thus this minimally invasive sampled matrix has utility in combination with hair Hg data to offer insight into toxicity if carefully compared to human guidelines, while considering the numerous caveats (e.g., cross species extrapolation, highly conservative nature of human derived guidelines).
Continued sampling of blood should include measures of Se and Se-associated enzymes to better assess the Hg-Se interaction in the blood and to assess Se as a nutrient (not just in countering Hg toxicity), along with measures of carbon-, nitrogen- and sulfur-stable isotopes and fatty acids to better assess pathways of exposure (diet).
130 AMAP Assessment 2011: Mercury in the Arctic
86253_Mercury Scientific_r1.indd 130 12-10-2011 14:42:40

Comparison of polar bear hair mercury concentrations with effect thresholds and guidelines
9. High Hg concentrations in polar bear hair indicative of high concentrations in other tissues such as brain and liver raise concern about Hg exposure and possible health effects in some regions of the Arctic (northern Canada and Greenland) especially taking the observed temporal increases into account.
Effect studies that correlate Hg exposure with biological responses should be carried out on polar bears in northern Canada and northwestern Greenland (as well as reference areas) showing upward Hg trends and hair and (other tissue) concentrations of concern.
Comparison of bird safe guidelines in eggs with Arctic seabirds
10. Some bird species (ivory gull, black guillemot) have Hg levels in their eggs sufficiently high to raise concern about negative effects on reproductive success.
A MeHg egg-injection study was recently conducted on thick-billed murres to develop toxicity thresholds, and this should be extended to include other relevant Arctic species.
Comparison of fish effect levels with Arctic fish species concentrations
11. Arctic fish species (especially marine species) generally have Hg concentrations below suggested toxicity thresholds, and only for a few species (e.g., landlocked Arctic char) are the guideline limits exceeded.
Additional studies should be undertaken to determine Hg levels and possible effects in a wider range of marine species, especially including top predatory species such as sharks.
Overall conclusion and recommendation
12. Compared to the amount of contaminant data available for the Arctic region, knowledge of the effects of these contaminant loads are very limited.
Additional studies to determine levels and possible effects in species at risk should be conducted, especially studies on top predators from areas with the highest contaminant loads.
Chapter 6 Appendix
Table A6.1. Mercury concentrations in brain tissue from Arctic biota and humans 136
Table A6.2. Mercury concentrations in polar bear liver and kidney 136
Table A6.3. Mercury concentrations in seal and walrus liver and kidney 137
Table A6.4. Mercury concentrations in whale liver and kidney 138
Table A6.5. Mercury concentrations in mammalian blood 139
Table A6.7. Mercury concentrations in bird eggs 140
Table A6.8. Mercury concentrations in fish muscle 141
131Chapter 6 · What are the Toxicological Effects of Mercury in Arctic Biota?
86253_Mercury Scientific_r1.indd 131 12-10-2011 14:42:41

Table A6.1. Mercury concentrations in brain tissue from Arctic biota and humans. Concentrations expressed in μg/g ww. See also Figure 6.2.
Species Location Tissue Year Age/size Sex N Mean SD Min Max Source
Harp seal Newfoundland Brain 1976-1978 Pups M 4 0.09 0.04 Ronald et al., 1984 Newfoundland Brain 1976-1978 Juveniles M 2-18 0.12 0.04 Ronald et al., 1984 Newfoundland Brain 1976-1978 Adults M 1-2 0.21 0.08 Ronald et al., 1984 St. Lawrence Brain 1976-1978 Pups M 10-28 0.08 0.04 Ronald et al., 1984 St. Lawrence Brain 1976-1978 Juveniles M 10 0.1 0.05 Ronald et al., 1984 St. Lawrence Brain 1976-1978 Adults M 2 0.15 0.02 Ronald et al., 1984 Grise Fjord, Pangnirtung and NW Greenland
Brain 1976-1978 Pups M 1 0.08 Ronald et al., 1984
Grise Fjord, Pangnirtung and NW Greenland
Brain 1976-1978 Juveniles M 1-8 0.17 0.05 Ronald et al., 1984
Grise Fjord, Pangnirtung and NW Greenland
Brain 1976-1978 Adults M 1-4 0.16 0.03 Ronald et al., 1984
Grey seal Nova Scotia Brain 1972 0.40 0.06 Freeman and Horne, 1973
4 seal species Norwegian Coast
Brain 1989-1990 0.06 0.06 0.01 0.1 Skaare et al., 1994
Ringed seal Northern Quebec
Cerebral cortex
0.13 0.19 0.01 0.15 Basu unpubl. based on Basu et al., 2006a
Polar bear Ittoqqortoormiit, East Greenland
Brain stem 1999-2001 All ages F 37 0.104 0.028 0.217 Basu et al., 2009
Ittoqqortoormiit, East Greenland
Brain stem 1999-2001 All ages M 45 0.092 0.042 0.197 Basu et al., 2009
Kuujjuaq, Eastern Canada
Cerebral cortex
2000-2003 All ages M&F 21 0.08 Krey et al., 2008, Poster Setac
Beluga Canada Cerebellum 2008 Adults M&F 21 2.9 2.0 0.04 7.3 Ostertag et al., 2009Canada Frontal lobe 2008 Adults M&F 18 4.7 4.7 0.1 20.3 Ostertag et al., 2009Canada Temporal
lobe2008 Adults M&F 20 5.5 4.8 0.04 20.7 Ostertag et al., 2009
Inuit Greenland Cerebral cortex
All ages M&F 17 0.17 0.059 4.782 Pedersen et al., 1999
Table A6.2. Mercury concentrations in polar bear liver and kidney. Concentrations expressed in μg/g ww. See also Figures 6.4 and 6.7.
Liver Kidney
Species Location Year Age/sex N Mean Min Max Mean Min Max Source
Polar bear
Ittoqqortoormiit, Greenland 1983-1990 <1 2.1 2.9 Dietz et al., 2000aa
Ittoqqortoormiit, Greenland 1983-1990 2-6 7.5 11.2 Dietz et al., 2000aa Ittoqqortoormiit, Greenland 1983-1990 >6 13.4 32 Dietz et al., 2000aa Ittoqqortoormiit, Greenland 1999-2001 Subadult 6.3 7.2 Sonne et al., 2007Ittoqqortoormiit, Greenland 1999-2001 Adult females 15.8 18 Sonne et al., 2007Ittoqqortoormiit, Greenland 1999-2001 Adult males 15.0 29.4 Sonne et al., 2007Ittoqqortoormiit, Greenland 1999-2001 All 59 10.0 1 36 14 1 50 Sonne et al., 2007Avanersuaq North, Greenland 1988-1990 2-6 12.4 10.7 Dietz et al., 2000aa Avanersuaq North, Greenland 1988-1990 >6 21.0 12.7 Dietz et al., 2000aa Avanersuaq South, Greenland 1988-1990 1 4.3 4.2 Dietz et al., 2000aa Avanersuaq South, Greenland 1988-1990 2-6 12.9 12.6 Dietz et al., 2000aa Avanersuaq South, Greenland 1988-1990 >6 22.0 28.1 Dietz et al., 2000aa Cumberland Peninsula, Canada 1991 6.9 6.7 Braune et al., 1991bb
Cape Mercy, Canada 1991 6.9 16.7 Braune et al., 1991bb
Eastern Beaufort Sea, Canada 1991 6.9 53.0 Braune et al., 1991bb
Southwest Melville Island, Canada
1991 6.9 71.1 Braune et al., 1991bb
a Geometric mean; b age normalized data.
132 AMAP Assessment 2011: Mercury in the Arctic
86253_Mercury Scientific_r1.indd 132 12-10-2011 14:42:41

Tabl
e A
6.3.
Mer
cury
con
cent
ratio
ns in
seal
and
wal
rus l
iver
and
kid
ney.
Con
cent
ratio
ns e
xpre
ssed
in μ
g/g
ww.
See
also
Fig
ures
6.5
and
6.8
.
Live
rK
idne
y
Spec
ies
Loca
tion
Year
Age
Mea
nM
inM
axSD
95 %
CL
low
er95
% C
Lhi
gher
Mea
nM
inM
axN
SD95
% C
Llo
wer
95 %
CL
high
erSo
urce
Wal
rus
Beri
ng S
trai
t19
81-1
984
All
1.23
120
1.23
01.
230
Wag
eman
n an
d St
ewar
t, 19
94Fo
xe B
asin
, Can
ada
1982
-198
8A
ll 1.
40.
3212
01.
400
1.40
0W
agem
ann
and
Stew
art,
1994
Hud
son
Bay,
Can
ada
1990
11
213
2.00
02.
000
Kin
gsle
y, 19
94Av
aner
suaq
1975
-197
711
1.
780.
0946
1.78
01.
780
Born
et a
l., 1
981
Ring
ed se
alBa
rrow
, Ala
ska
1995
-199
70-
5 0.
734
0.65
3-0
.545
882.
0138
80.
379
0.28
50.
175
1.29
3Ri
gét e
t al.,
200
5Ba
rrow
, Ala
ska
1995
-199
7>5
4.
785.
72-6
.431
215
.991
20.
551
0.27
14.
249
5.31
1Ri
gét e
t al.,
200
5Sa
chs H
arbo
ur, C
anad
a20
010-
5 19
.223
.6-2
7.05
665
.456
2.23
1.24
16.7
7021
.630
Rigé
t et a
l., 2
005
Sach
s Har
bour
, Can
ada
2001
>5
19.1
9.6
0.28
437
.916
2.04
0.81
17.5
1220
.688
Rigé
t et a
l., 2
005
Hol
man
, Can
ada
2001
0-5
19.6
100
39.2
19.6
0019
.600
Rigé
t et a
l., 2
005
Hol
man
, Can
ada
2001
>5
29.9
26.5
-22.
0481
.84
29.9
0029
.900
Rigé
t et a
l., 2
005
Arc
tic B
ay C
anad
a20
000-
5 7.
427.
11-6
.515
621
.355
61.
380.
895.
676
9.16
4Ri
gét e
t al.,
200
5A
rctic
Bay
Can
ada
2000
>5
12.4
14.4
-15.
824
40.6
241.
780.
9510
.538
14.2
62Ri
gét e
t al.,
200
5G
rise
Fio
rd, C
anad
a19
980-
5 19
.610
039
.22.
310.
8717
.895
21.3
05Ri
gét e
t al.,
200
5G
rise
Fio
rd, C
anad
a19
98>5
29
.926
.5-2
2.04
81.8
43.
191.
4826
.999
32.8
01Ri
gét e
t al.,
200
5Po
nd In
let,
Can
ada
2000
0-5
6.84
16.9
-26.
284
39.9
641.
040.
455.
958
7.72
2Ri
gét e
t al.,
200
5Po
nd In
let,
Can
ada
2000
>5
14.9
14.9
-14.
304
44.1
042.
540.
7313
.469
16.3
31Ri
gét e
t al.,
200
5Av
aner
suaq
, Gre
enla
nd19
980-
5 4.
594.
2-3
.642
12.8
224.
590
4.59
0Ri
gét e
t al.,
200
5Av
aner
suaq
, Gre
enla
nd19
98>5
9.
156.
58-3
.746
822
.046
89.
150
9.15
0Ri
gét e
t al.,
200
5Q
eqer
tars
suaq
, Gre
enla
nd19
99-2
000
0-5
1.23
2.66
-3.9
836
6.44
361.
230
1.23
0Ri
gét e
t al.,
200
5Q
eqer
tars
suaq
, Gre
enla
nd19
99-2
000
>5
2.91
2.03
-1.0
688
6.88
882.
910
2.91
0Ri
gét e
t al.,
200
5Itt
oqqo
rtoo
rmiit
, Gre
enla
nd19
99-2
000
0-5
4.78
4.35
-3.7
4613
.306
4.78
04.
780
Rigé
t et a
l., 2
005
Ittoq
qort
oorm
iit, G
reen
land
1999
-200
0>5
7.
965.
08-1
.996
817
.916
87.
960
7.96
0Ri
gét e
t al.,
200
5Sv
alba
rd, N
orw
ay19
960-
5 0.
641
0.31
70.
0196
81.
2623
20.
460.
114
0.41
80.
864
Rigé
t et a
l., 2
005
Sval
bard
, Nor
way
1996
>5
1.19
0.74
-0.2
604
2.64
040.
510.
74-0
.260
2.64
0Ri
gét e
t al.,
200
5W
hite
Sea
, Rus
sia20
010-
5 1.
871.
44-0
.952
44.
6924
0.43
0.10
61.
662
2.07
8Ri
gét e
t al.,
200
5W
hite
Sea
, Rus
sia20
01>5
2.
412.
41-2
.313
67.
1336
0.79
0.40
41.
618
3.20
2Ri
gét e
t al.,
200
5
Har
p se
alG
reen
land
Sea
, Gre
enla
nd19
9912
0.19
0.13
0.28
0.04
0.11
160.
2684
0.23
0.03
0.66
250.
040.
112
0.26
8Br
uunb
org
et a
l., 2
006
Upe
rnav
ik, G
reen
land
1985
5-10
1.01
1.01
1.01
0.79
Die
tz e
t al.,
199
8
Hoo
ded
seal
Dav
is St
rait,
Gre
enla
nd19
84A
ll 77
.922
.234
.388
121.
412
0.79
3D
ietz
et a
l., 1
996
Am
mas
salik
, Gre
enla
nd19
841
7.85
0.79
Die
tz e
t al.,
199
6G
reen
land
Sea
, Gre
enla
nd19
999
290.
79Br
uunb
org
et a
l., 2
006
133Chapter 6 · What are the Toxicological Effects of Mercury in Arctic Biota?
86253_Mercury Scientific_r1.indd 133 12-10-2011 14:42:42

Table A6.4. Mercury concentrations in whale liver and kidney. Concentrations expressed in μg/g ww. See also Figures 6.6 and 6.9.
Liver Kidney
Species Location Year Age/sex N Mean Min Max Mean Min Max Source
Baleen whales
Grey whale Lorino Lawrentia, Russia
2001 978 cm 0.02 0 0.07 0.01 0 0.03 Deh n et al., 2006
Mechigmenskiy, Russia
2001 840 cm 0.16 0.03 Tilbury et al., 2002
Bowhead whale Barrow, Alaska 1992-1999 1093 cm 0.05 0 0.1 0.03 0 0.1 Wosh ner, 2000
Minke whale West Greenland
1998 All 45 1 0.9 Born et al., 2003
East Greenland 1998 Females all ages
4 1.9 2.7 Born et al., 2003
Jan Mayen 1998 All 24 2 2.4 Born et al., 2003Svalbard, Norway
1998 All 16 0.7 0.7 Born et al., 2003
Barents Sea, Norway
1998 All 33 1.1 1.2 Born et al., 2003
Lofoten, Norway
1998 All 14 1.7 1.2 Born et al., 2003
Toothed whales
Harbour porpoise Central West Greenland
1988-1989 All 4.3 0.92 Paludan-Müller et al., 1993
Central West Greenland
1988-1989 >7 8.2 1.3 Paludan-Müller et al., 1993
Beluga Barrow, Alaska 45 23 0 82 5 0.2 17 Wosh ner et al., 2003Barrow, Alaska 1992-1999 365 cm 48 16 4.4 Wosh ner et al., 2001aUpernavik, Greenland
1984-1986 0-6 1 0.7 Hansen et al., 1990
Upernavik, Greenland
1984-1986 7-13 3 0.95 Hansen et al., 1990
Upernavik, Greenland
1984-1986 >13 16.4 4.2 Hansen et al., 1990
Grise Fiord, Canada
<1990 13.9 25 12 2.2 Dietz et al., 2004
Mackenzie Delta, Canada
1984 5.6 25 2.1 1.5 Dietz et al., 2004
St. Lawrence, Canada
1984 17.5 25 33.5 6.5 Dietz et al., 2004
Narwhal Avanersuaq, Greenland
1984 Females >3
25 11.4 1.8 Dietz et al., 2004
Avanersuaq, Greenland
1984 Males >3 11 16.3 2.3 Dietz et al., 2004
Uummannaq, Greenland
1993 Females >3
14 10.8 1.3 Dietz et al., 2004
Uummannaq, Greenland
1993 Males >3 28 6.3 1.8 Dietz et al., 2004
Pilot whale Faroe Islands 2001-2007 All age groups
50 75 54 574 64.6 7 188 Hoydal and Damm, 2009a
Faroe Islands 2007 All age groups
14 138 54 351 15 7 31 Sonne et al., 2009
a Median values.
134 AMAP Assessment 2011: Mercury in the Arctic
86253_Mercury Scientific_r1.indd 134 12-10-2011 14:42:42
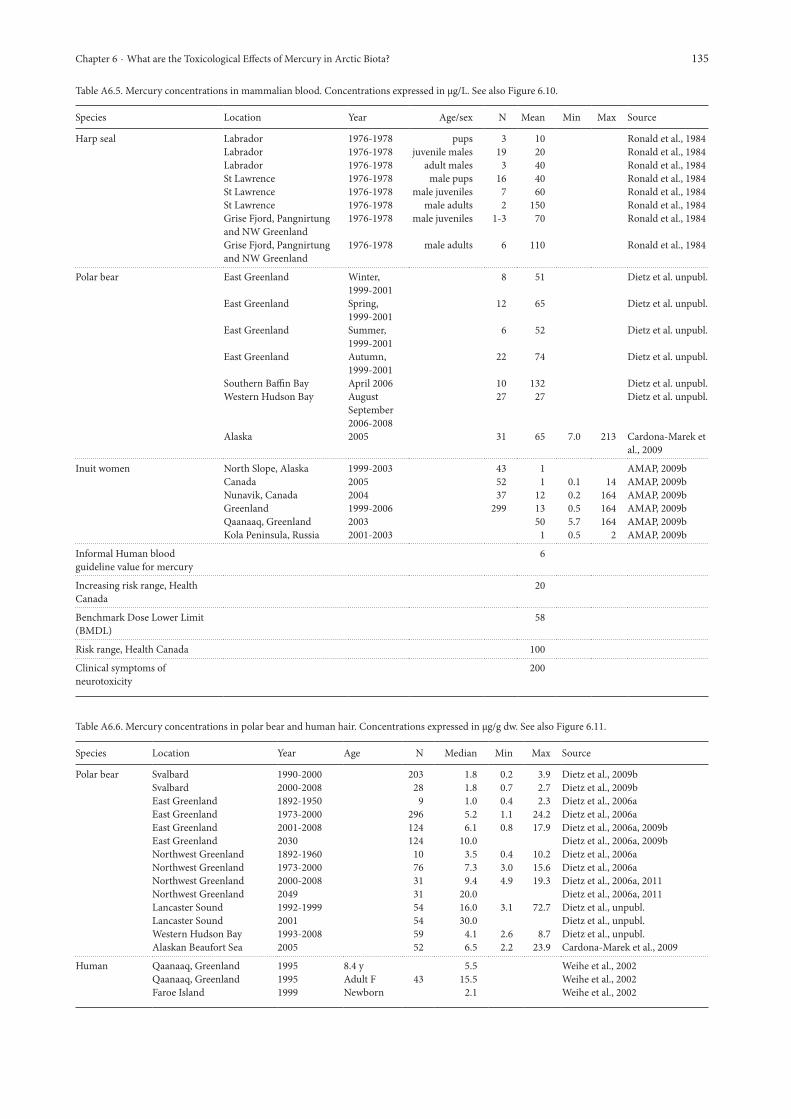
Table A6.5. Mercury concentrations in mammalian blood. Concentrations expressed in μg/L. See also Figure 6.10.
Species Location Year Age/sex N Mean Min Max Source
Harp seal Labrador 1976-1978 pups 3 10 Ronald et al., 1984Labrador 1976-1978 juvenile males 19 20 Ronald et al., 1984Labrador 1976-1978 adult males 3 40 Ronald et al., 1984St Lawrence 1976-1978 male pups 16 40 Ronald et al., 1984St Lawrence 1976-1978 male juveniles 7 60 Ronald et al., 1984St Lawrence 1976-1978 male adults 2 150 Ronald et al., 1984Grise Fjord, Pangnirtung and NW Greenland
1976-1978 male juveniles 1-3 70 Ronald et al., 1984
Grise Fjord, Pangnirtung and NW Greenland
1976-1978 male adults 6 110 Ronald et al., 1984
Polar bear East Greenland Winter, 1999-2001
8 51 Dietz et al. unpubl.
East Greenland Spring, 1999-2001
12 65 Dietz et al. unpubl.
East Greenland Summer, 1999-2001
6 52 Dietz et al. unpubl.
East Greenland Autumn, 1999-2001
22 74 Dietz et al. unpubl.
Southern Baffin Bay April 2006 10 132 Dietz et al. unpubl.Western Hudson Bay August
September 2006-2008
27 27 Dietz et al. unpubl.
Alaska 2005 31 65 7.0 213 Cardona-Marek et al., 2009
Inuit women North Slope, Alaska 1999-2003 43 1 AMAP, 2009bCanada 2005 52 1 0.1 14 AMAP, 2009bNunavik, Canada 2004 37 12 0.2 164 AMAP, 2009bGreenland 1999-2006 299 13 0.5 164 AMAP, 2009bQaanaaq, Greenland 2003 50 5.7 164 AMAP, 2009bKola Peninsula, Russia 2001-2003 1 0.5 2 AMAP, 2009b
Informal Human blood guideline value for mercury
6
Increasing risk range, Health Canada
20
Benchmark Dose Lower Limit (BMDL)
58
Risk range, Health Canada 100
Clinical symptoms of neurotoxicity
200
Table A6.6. Mercury concentrations in polar bear and human hair. Concentrations expressed in μg/g dw. See also Figure 6.11.
Species Location Year Age N Median Min Max Source
Polar bear Svalbard 1990-2000 203 1.8 0.2 3.9 Dietz et al., 2009bSvalbard 2000-2008 28 1.8 0.7 2.7 Dietz et al., 2009bEast Greenland 1892-1950 9 1.0 0.4 2.3 Dietz et al., 2006aEast Greenland 1973-2000 296 5.2 1.1 24.2 Dietz et al., 2006aEast Greenland 2001-2008 124 6.1 0.8 17.9 Dietz et al., 2006a, 2009bEast Greenland 2030 124 10.0 Dietz et al., 2006a, 2009bNorthwest Greenland 1892-1960 10 3.5 0.4 10.2 Dietz et al., 2006aNorthwest Greenland 1973-2000 76 7.3 3.0 15.6 Dietz et al., 2006aNorthwest Greenland 2000-2008 31 9.4 4.9 19.3 Dietz et al., 2006a, 2011Northwest Greenland 2049 31 20.0 Dietz et al., 2006a, 2011Lancaster Sound 1992-1999 54 16.0 3.1 72.7 Dietz et al., unpubl.Lancaster Sound 2001 54 30.0 Dietz et al., unpubl.Western Hudson Bay 1993-2008 59 4.1 2.6 8.7 Dietz et al., unpubl.Alaskan Beaufort Sea 2005 52 6.5 2.2 23.9 Cardona-Marek et al., 2009
Human Qaanaaq, Greenland 1995 8.4 y 5.5 Weihe et al., 2002Qaanaaq, Greenland 1995 Adult F 43 15.5 Weihe et al., 2002Faroe Island 1999 Newborn 2.1 Weihe et al., 2002
135Chapter 6 · What are the Toxicological Effects of Mercury in Arctic Biota?
86253_Mercury Scientific_r1.indd 135 12-10-2011 14:42:42

Table A6.7. Mercury concentrations in bird eggs. Concentrations expressed in µg/g ww. See also Figure 6.12.
Species Location Yeara N Meanb ww Meanb dw Source
Common murre Bogoslof I, Alaska 2000 9 0.031 Day et al., 2006St. Lazaria I, Alaska 1999 10 0.207 Christopher et al., 2002St. Lazaria I, Alaska 2001 10 0.150 Day et al., 2006Little Diomede I, Alaska 1999 9 0.053 Christopher et al., 2002St. George I, Alaska 1999 11 0.026 Christopher et al., 2002East Amatuli I, Alaska 1999 11 0.200 Christopher et al., 2002
Thick-billed murre St. George I, Alaska 2000 7 0.037 Day et al., 2006Bogoslof I, Alaska 2000 10 0.086 Day et al., 2006St. Lazaria I, Alaska 2001 10 0.104 Day et al., 2006
Glaucous-winged gull Aleutians – Adak, Alaska 2004 8 0.184c 0.734 Burger et al., 2009Aleutians – Amchitka, Alaska 2004 7 0.123c 0.490 Burger et al., 2009Aleutians – Kiska, Alaska 2004 6 0.228c 0.910 Burger et al., 2009
Red-throated loon Arctic Coastal Plain, Alaska 1999-2002 12 0.14 Schmutz et al., 2009Cape Espenberg, Alaska 1999-2002 10 0.19 Schmutz et al., 2009Yukon-Kushokwim Delta, Alaska 1999-2002 15 0.32 Schmutz et al., 2009Copper River Delta, Alaska 1999-2002 8 0.22 Schmutz et al., 2009
Common loon Alaska 1992-1998 10 0.25 Evers et al., 2003
Greater scaup Yukon-Kushokwim Delta, Alaska 2002-2003 6 ≤ 0.05c ≤ 0.2d Badzinski et al., 2009
Thick-billed murre Prince Leopold I, Canada 2003 15 0.37e 1.33 Braune, 2007Coats I, Canada 2003 15 0.15e 0.56 Braune et al., 2006
Northern fulmar Prince Leopold I, Canada 2003 15 0.36e 1.41 Braune, 2007Devon I, Canada 2003 14 0.42e 1.57 Braune et al., 2006
Black-legged kittiwake Prince Leopold I, Canada 2003 12 0.19e 0.82 Braune, 2007
Glaucous gull Prince Leopold I, Canada 2003 15 0.58e 2.57 Braune et al., 2006
Black guillemot Prince Leopold I, Canada 2004 15 0.49e 1.92 Braune et al., 2006Devon I, Canada 2004 9 0.75e 2.65 Braune et al., 2006Southampton I, Canada 2004 9 0.45e 1.71 Braune et al., 2006
Ivory gull Seymour I, Canada 2004 6 1.61e 6.37 Braune et al., 2006
Black guillemot Faroe Islands 2002 17 0.404 Hoydal and Dam, 2009Faroe Islands 2004 17 0.479 Hoydal and Dam, 2005Faroe Islands 2006 20 0.583 Hoydal and Dam, 2009
Herring gull Hornøya, Norway 2003 5 0.09 Helgason et al., 2008
Black-legged kittiwake Hornøya, Norway 2003 5 0.08 Helgason et al., 2008
Atlantic puffin Hornøya, Norway 2003 5 0.10 Helgason et al., 2008Hjelmsøy, Norway 2003 5 0.10 Helgason et al., 2008
Glaucous gull Bjørnøya, Norway 2002 4 0.3 Knudsen et al., 2005
Ivory gull (Svenskøya, Norway 2007 10 0.15 Miljeteig et al., 2009(Nagurskoe, Russia 2006 6 0.21 Miljeteig et al., 2009Cape Klyuv, Russia 2006 7 0.26 Miljeteig et al., 2009Domash ny, Russia 2006 12 0.15 Miljeteig et al., 2009
a Collection year(s); b arithmetic mean; c data reported on a dw basis, ww concentrations estimated assuming a typical egg moisture content of 75%; d mean THg concentration for whole egg contents based on authors’ estimate using THg concentrations measured in egg yolk and albumen; e data reported on a dw basis, ww concentrations calculated using measured moisture content data for samples.
136 AMAP Assessment 2011: Mercury in the Arctic
86253_Mercury Scientific_r1.indd 136 12-10-2011 14:42:43

Table A6.8. Mercury concentrations in fish muscle. Concentrations expressed in μg/g ww. See also Figure 6.13.
Species Location Year Mean Source
Burbot Mackenzie R. Basin, Canada 1999-2001 0.37 Evans et al., 2005aGreat Slave Lake, Canada 1999-2002 0.13 Evans et al., 2005a
Lake trout Kusawa (Yukon), Canada 1993-2002 0.24 Evans et al., 2005aLaberge (Yukon), Canada 1993-2002 0.37 Evans et al., 2005aMackenzie R. Basin, Canada 1999-2002 0.49 Evans et al., 2005a
Pike Mackenzie R. Basin, Canada 1990-2002 0.43 Evans et al., 2005aGreat Slave Area, Canada 1999-2002 0.18 Evans et al., 2005a; Lockhart et al., 2005aStorvindeln, Sweden 1968-2005 0.306 A. Bignert, unpubl. data
Char (landlocked) Amituk L., Canada 2002 1.3 Evans et al., 2005aBoomerang L., Canada 2002 0.21 Evans et al., 2005aChar L., Canada 1999 0.55 Evans et al., 2005aNorth L., Canada 2000 0.2 Evans et al., 2005aResolute L., Canada 1999-2002 0.16 Evans et al., 2005aSapphire L.,Canada 1999 0.29 Evans et al., 2005aGreenland 2004-2008 0.96 F. Rigét, unpubl. dataFaroe Islands 2000-2007 0.26 F. Rigét, unpubl. dataAbiskojuare, Sweden 1981-2000 0.030 A. Bignert, unpubl. data
Char (sea run) Northern Quebec, Canada 1990s 0.044 Evans et al., 2005aLabrador, Canada 1990s 0.035 Evans et al., 2005aCambridge Bay, Canada 1991-1993 0.047 Lockhart et al., 2005aLauchian R., Canada 1993 0.055 Lockhart et al., 2005aByron Bay, Canada 1990 0.026 Lockhart et al., 2005aHall Beach, Canada 1992 0.051 Lockhart et al., 2005aFoggy Bay, Canada 1993 0.076 Lockhart et al., 2005aEllice R., Canada 1990-1993 0.051 Lockhart et al., 2005aSurrey R., Canada 1990-1993 0.029 Lockhart et al., 2005aNetling, Canada 1990 0.035 Lockhart et al., 2005aGore Bay, Canada 1992 0.024 Lockhart et al., 2005aPangnirtung Giord, Canada 1990-1992 0.031 Lockhart et al., 2005aSilvia Grin R., Canada 1991 0.08 Lockhart et al., 2005aChesterfield Inlet, Canada 1991-1993 0.044 Lockhart et al., 2005aRankin Inlet, Canada 1991-1993 0.043 Lockhart et al., 2005aWilson R., Canada 1993 0.067 Lockhart et al., 2005aFerguson R., Canada 1992 0.029 Lockhart et al., 2005aSandy Point, Canada 1992-1993 0.053 Lockhart et al., 2005aRichmond Gulf, Canada 1994 0.055 Lockhart et al., 2005a
Atlantic cod Labrador/Newfoundland, Canada 1990 0.12 Hellou et al., 1992Iceland 1990-1992 0.036 OSPAR, unpubl.datanortheastern Iceland 2000-2007 0.025 F. Rigét, unpubl. data northwestern Iceland 2000-2007 0.03 F. Rigét, unpubl. datasoutheastern Iceland 2001-2003 0.018 F. Rigét, unpubl. datasouthwestern Iceland 2001 0.034 F. Rigét, unpubl. dataFaroe Islands 2000-2007 0.031 F. Rigét, unpubl. dataFaroe Islands 1994 0.01 Stange et al., 1996Stokken, Norway 2005 0.054 F. Rigét, unpubl. dataFroan/Stokken, Norway 1993-1994 0.069 OSPAR, unpubl.dataLille Molla, Norway 2002-2006 0.083 F. Rigét, unpubl. dataLofoten/Lille Molla, Norway 1992-1994 0.069 OSPAR, unpubl.dataKvunangen, Norway 2006-2007 0.036 F. Rigét, unpubl. dataVarangerfjordan, Norway 2000-2007 0.016 F. Rigét, unpubl. dataVarangerfjordan, Norway 1994 0.05 OSPAR, unpubl.dataFinnsnes, Norway 1994 0.063 OSPAR, unpubl.dataHammerfest, Norway 1994 0.036 OSPAR, unpubl.dataHalten Banken, Norway 1994 0.05 OSPAR, unpubl.dataSvalbard, Norway 1993 0.04 OSPAR, unpubl.dataBarents Sea, Norway 1993 0.01 OSPAR, unpubl.data
Plaice Lille Moalla, Norway 2000-2006 0.057 F. Rigét, unpubl. dataSkogeray, Norway 2000-2007 0.025 F. Rigét, unpubl. data
Redfish Kap Farvel, Greenland 1994 0.19 Stange et al., 1996Denmark Str., Greenland 1994 0.21 Stange et al., 1996Halten Banken, Norway 1994 0.07 Stange et al., 1996Iceland 1994 0.03 Stange et al., 1996Faroe Islands 1994 0.18 Stange et al., 1996
Long rough dab Svalbard, Norway 1993 0.02 Maage et al., 1996Barents Sea, Norway 1992-1993 0.01 Maage et al., 1996
Common dab Iceland 1990-1991 0.049 OSPAR, unpubl.data
137Chapter 6 · What are the Toxicological Effects of Mercury in Arctic Biota?
86253_Mercury Scientific_r1.indd 137 12-10-2011 14:42:43