what are the sources of bacteria in your watershed? they may not be what you expect
TRANSCRIPT

What’re the sources of bacteria in your watershed? They may not
be what you expect
2015 Waste to Worth Conference March 31, 2015
Kevin Wagner, Terry Gentry, Daren Harmel,George Di Giovanni, Lucas Gregory, Elizabeth
Casarez, R. Karthikeyan

Bacteria The #1 Cause of Water Quality Impairment
in Texas
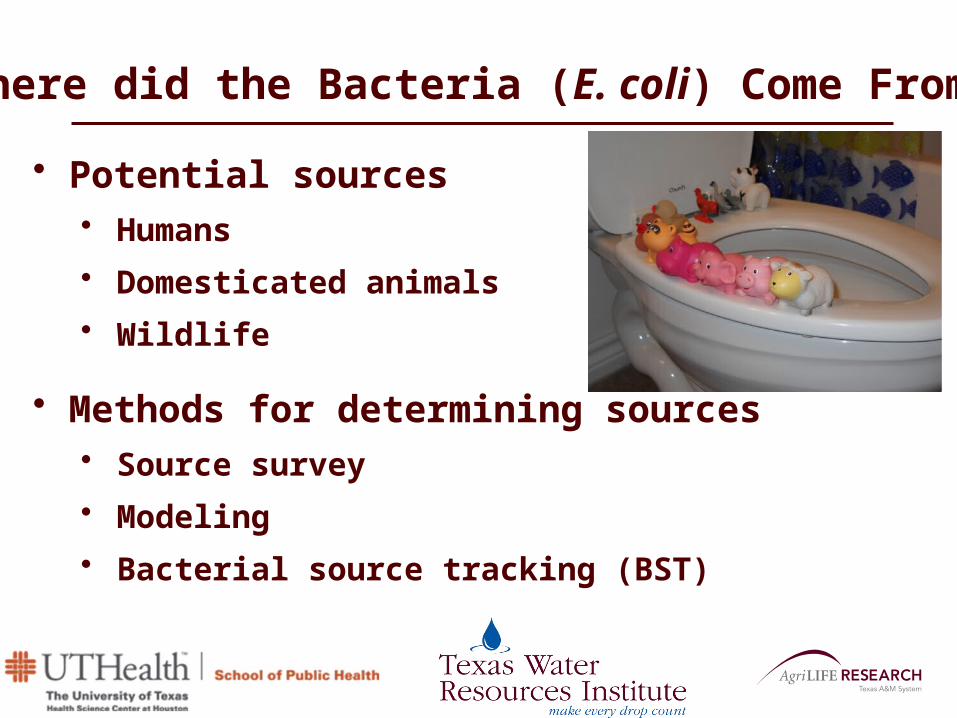
Where did the Bacteria (E. coli) Come From?
• Potential sources• Humans
• Domesticated animals
• Wildlife
• Methods for determining sources• Source survey
• Modeling
• Bacterial source tracking (BST)
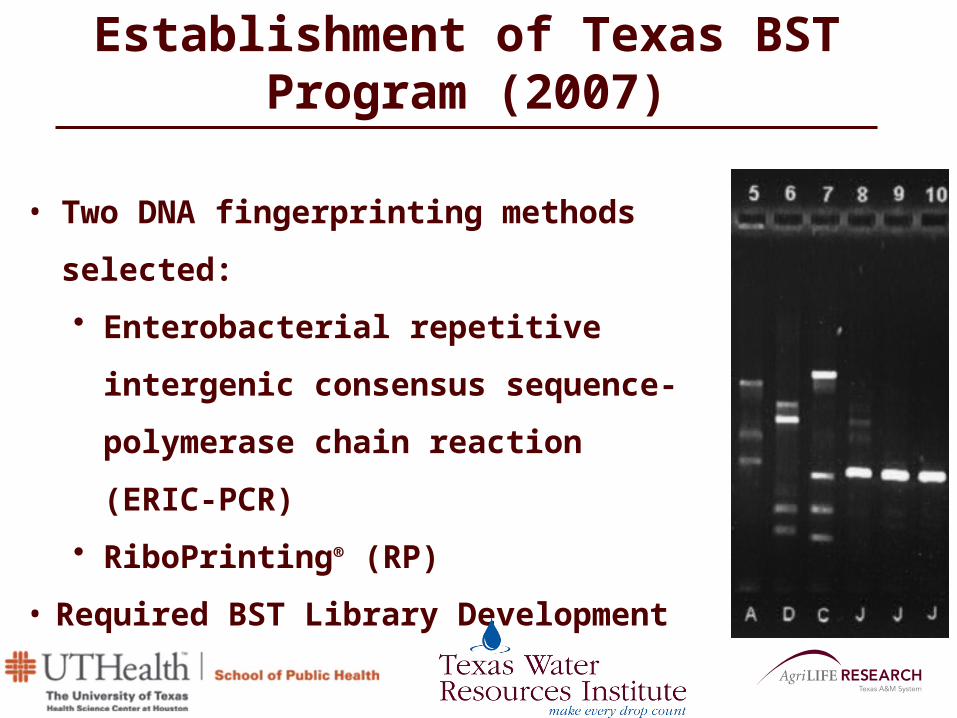
Establishment of Texas BST Program (2007)
• Two DNA fingerprinting methods selected:
• Enterobacterial repetitive intergenic
consensus sequence-polymerase chain
reaction (ERIC-PCR)
• RiboPrinting® (RP)
• Required BST Library Development

Development of TexasE. coli BST Library
Sources
Isolate
E. coli
DNA
Fingerprint
Add to
Library

Texas E. coli BST Library
• Contains • 1,632 E. coli isolates • From 1,423 different
fecal samples • Representing >50
animal subclasses• Collected from 13
watersheds (& growing) across Texas
Wildlife41%
Domestic Animals
34%
Human25%
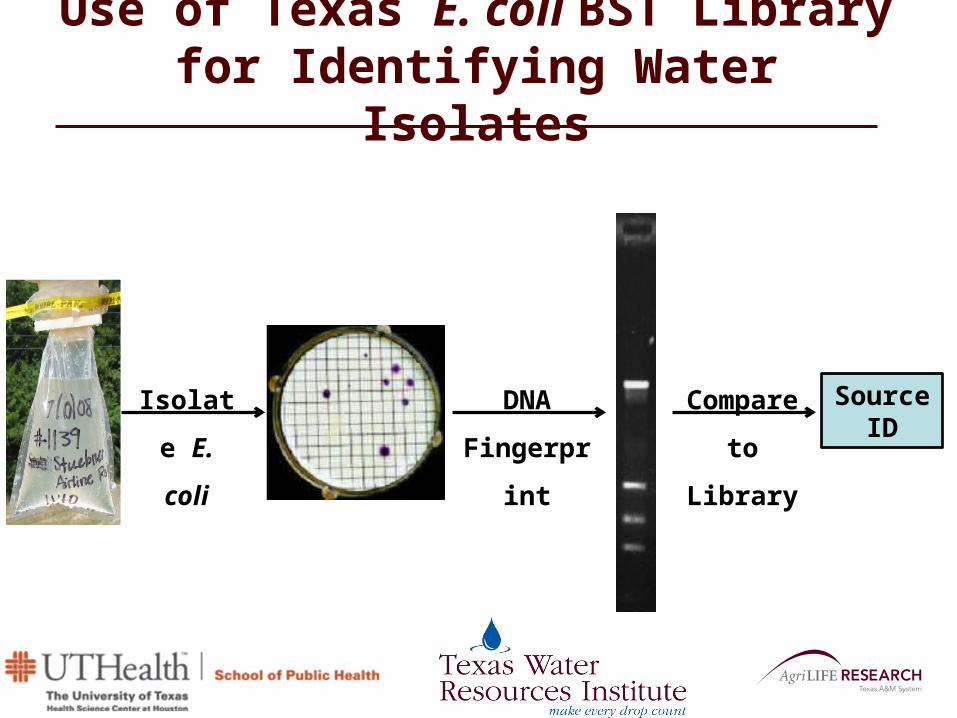
Use of Texas E. coli BST Library for Identifying Water Isolates
Isolate
E. coli
DNA
Fingerprint
Compare
to Library
Source ID
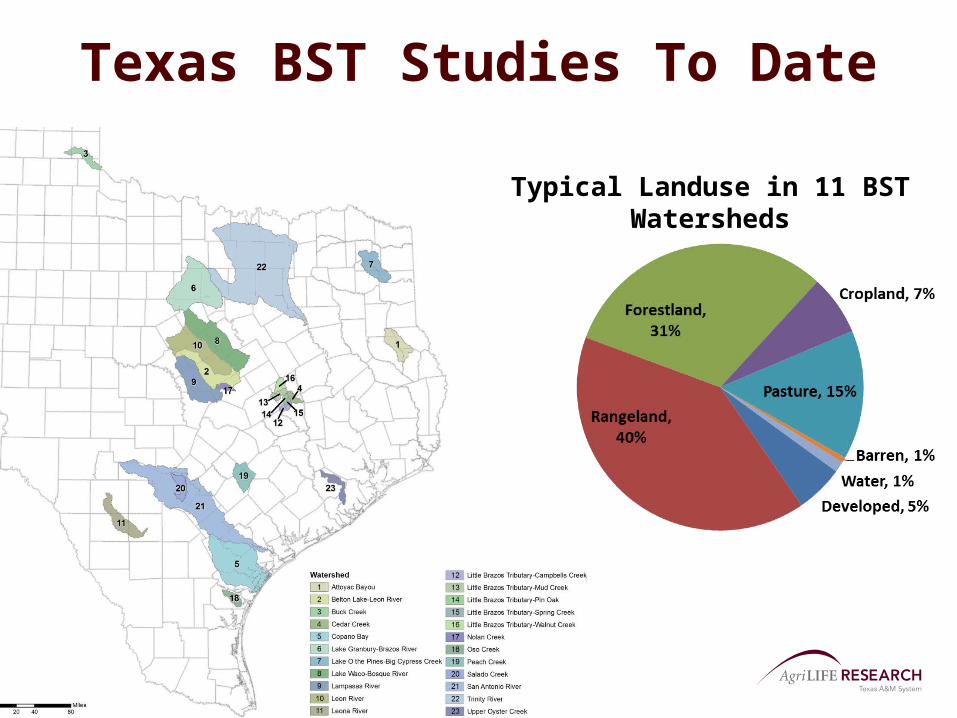
Texas BST Studies To Date
Typical Landuse in 11 BST Watersheds
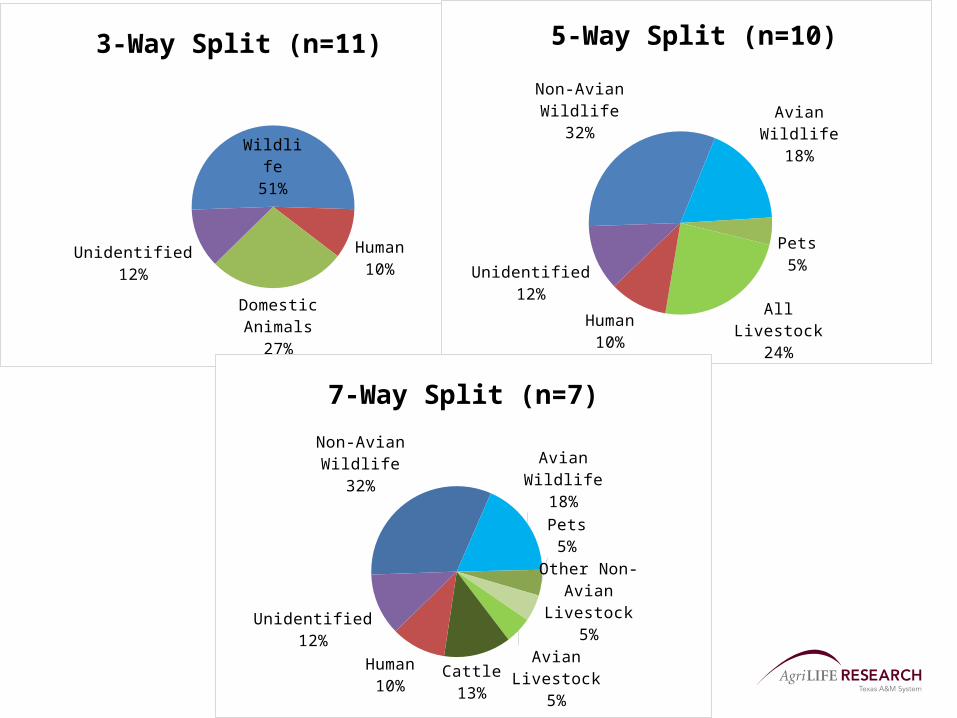
Wildlife51%
Human10%
Domestic An-imals27%
Unidentified12%
3-Way Split (n=11)
Non-Avian Wildlife
32% Avian Wildlife18%
Pets5%
All Livestock24%
Human10%
Unidentified12%
5-Way Split (n=10)
Non-Avian Wildlife
32%
Avian Wildlife18%
Pets5%Other Non-
Avian Livestock5%
Avian Livestock5%
Cattle13%
Human10%
Unidentified12%
7-Way Split (n=7)

Typical landuse in BST watershedsRelation of Landuse to BST ResultsDeveloped vs Pet & Human Contributions
Significant correlation between % of watershed developed and % of isolates from petsNo correlation between % of watershed developed and % of isolates from human
0% 5% 10% 15% 20% 25% 30%-2%0%2%4%6%8%
10%12%14%16%18%
R² = 0.576711679898713
% of watershed developed
% o
f iso
late
s fr
om p
ets
0% 5% 10% 15% 20% 25% 30%0%2%4%6%8%
10%12%14%16%18%
R² = 0.113328300080188
% of watershed developed
% o
f iso
late
s fr
om h
uman
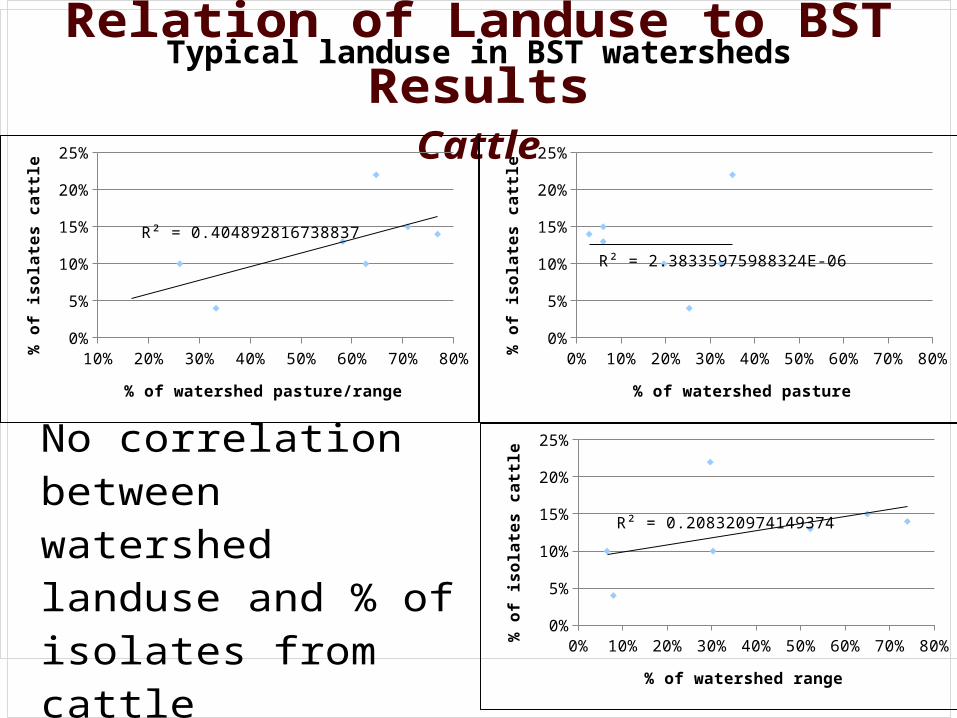
Typical landuse in BST watershedsRelation of Landuse to BST ResultsCattle
No correlation between watershed landuse and % of isolates from cattle
10% 20% 30% 40% 50% 60% 70% 80%0%
5%
10%
15%
20%
25%
R² = 0.404892816738837
% of watershed pasture/range
% o
f iso
late
s ca
ttle
0% 10% 20% 30% 40% 50% 60% 70% 80%0%
5%
10%
15%
20%
25%
R² = 2.38335975988324E-06
% of watershed pasture
% o
f iso
late
s ca
ttle
0% 10% 20% 30% 40% 50% 60% 70% 80%0%
5%
10%
15%
20%
25%
R² = 0.208320974149374
% of watershed range
% o
f iso
late
s ca
ttle

Typical landuse in BST watershedsRelation of Landuse to BST ResultsWildlife
Only one significant correla-tion observed: Btwn % of watershed as pasture/range/forest & % of isolates as non-avian wildlife
80% 82% 84% 86% 88% 90% 92% 94% 96% 98% 100%0%
10%
20%
30%
40%
50%
60%
70%
R² = 0.00673601610141417
% of watershed pasture/forest/range
% o
f iso
late
s w
ildlif
e
80% 82% 84% 86% 88% 90% 92% 94% 96% 98% 100%0%
10%
20%
30%
40%
50%
60%
70%
R² = 0.498558153563506
% of watershed pasture/forest/range
% o
f iso
late
s no
n-av
ian
wild
life
80% 82% 84% 86% 88% 90% 92% 94% 96% 98% 100%0%
10%
20%
30%
40%
50%
60%
70%
R² = 0.207255593935729
% of watershed pasture/forest/range
% o
f iso
late
s av
ian
wild
life

Grazing Evaluation (Wagner et al. 2012)
Objective– Evaluate effects of grazing management on bacteria
runoff from rangeland and improved pasture
3 Treatments Tested (7 total sites)– Heavily stocked (2 x recommended rate) – 1 location– Moderately stocked (at recommended rates) – 3
locations– No grazing – 3 locations
Methods– Edge-of-field runoff collected over 3 yrs– E. coli - EPA Method 1603– BoBac & AllBac (Layton et al., 2006)
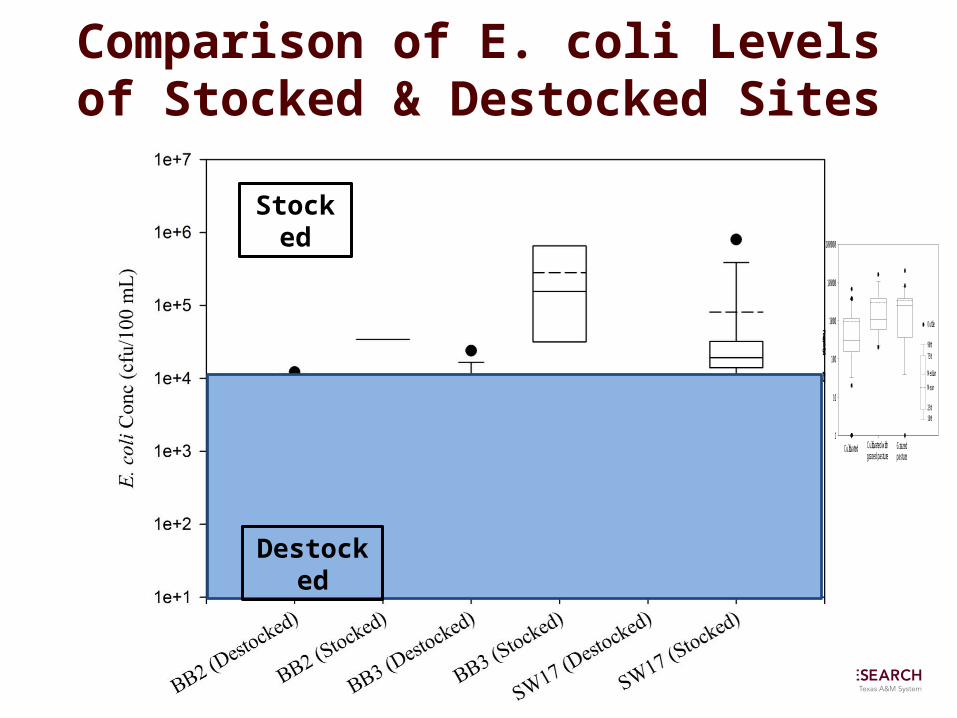
Comparison of E. coli Levelsof Stocked & Destocked Sites
Cultivated Cultivated with grazed pasture
Grazed pasture
E. coli
(cfu p
er 100 m
L)
1
10
100
1000
10000
100000
Outlier 90th 75th Median Mean 25th 10th
Stocked
Destocked
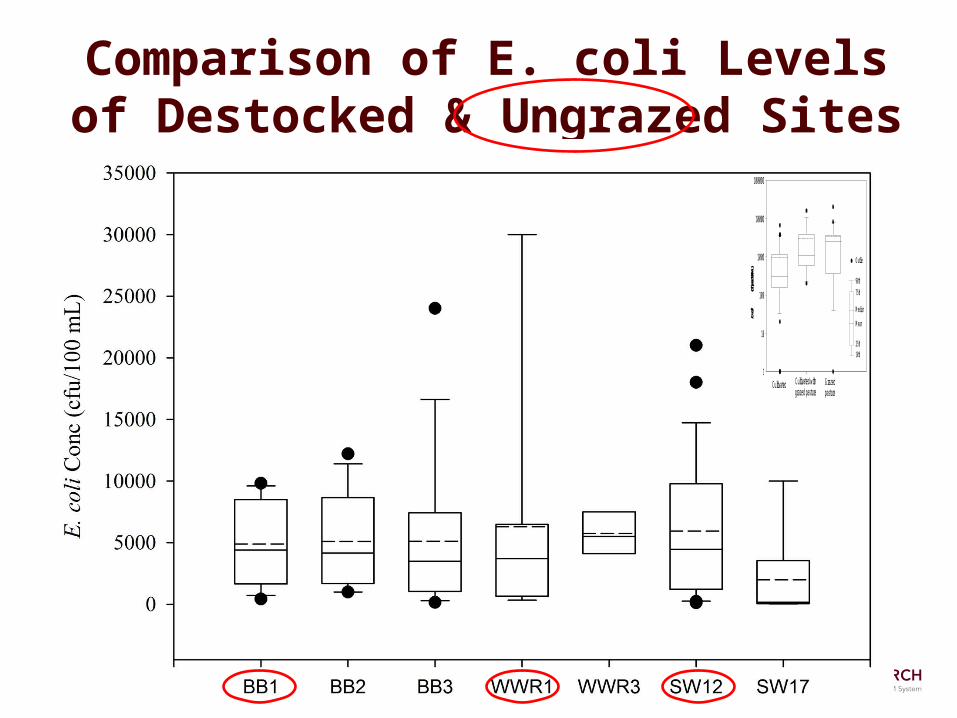
Comparison of E. coli Levels of Destocked & Ungrazed Sites
Cultivated Cultivated with grazed pasture
Grazed pasture
E. coli
(cfu p
er 100 m
L)
1
10
100
1000
10000
100000
Outlier 90th 75th Median Mean 25th 10th

Mean Background Levels in Runoff
Site
Fecal Coliform
(#/100 mL)
E. coli(cfu/100
mL) Reference
Ungrazed pasture 10,000Robbins et al.
1972
Ungrazed pasture 6,600Doran et al.
1981
Control plots 6,800Guzman et al.
2010Pasture destocked >2 mos. 103 to 104
Collins et al. 2005
Ungrazed pasture6,200-11,000
Wagner et al. 2012
Pasture destocked >2 wks.
2,200-6,000
Wagner et al. 2012

Impacts of Migratory Wildlife
Date BB1 BB2 BB3
3/13/09 140
3/25/09 1,200
3/26/09 1,000 7,200
3/27/09 2,000
4/17/09 1,155 980 450
4/18/09 4,400 2,225 2,100
4/28/09 7,600 12,200 24,000
10/4/09 57,000 5,114 3,065
10/9/09 36,000 24,043 15,000
10/13/09 42,851 23,826 5,591
10/22/09 172,500
10/26/09 261,000 181,000 45,000
Mar
-09
Apr-0
9
May
-09
Jun-
09
Jul-0
9
Aug-0
9
Sep-
09
Oct-0
9
Nov-0
9
Dec-0
9
Jan-
10
Mar
-10
Apr-1
0
May
-10
Jun-
10 -
50,000
100,000
150,000
200,000
250,000
300,000
E. coli concentrations at ungrazed site BB1 (2009-2010)
E.
coli C
once
ntr
ati
on (
cfu/1
00 m
L)
>80% of E. coli loading from wildlife at 3 sites in 2009

Conclusions
• BST tremendously helpful in identifying significant bacteria sources
• Wildlife is source of 50% of isolates in predominately rural watersheds
• Generally no correlations between landuse and isolate source
• Edge of field monitoring confirms significance of background sources & impacts

Implications/QuestionsImplications: • Background/wildlife loadings need to be considered
when: – Applying water quality standards– Developing tmdls and watershed based plans
• Ignoring background concentrations may lead to:– Nonattainment of water quality standards– Inaccurate load allocations and reductions
Questions remain including:• How do we better integrate background/wildlife
loadings into water quality management?• What can/should we do to address wildlife loads?• What are sources of “unidentified” isolates?

“In wine there is wisdom, in beer there is strength, in water there is bacteria”
German Proverb