what are the projected impacts of climate change on food … · 2016-08-02 · this report...
TRANSCRIPT

v1: Dec5th 2007
What are the projectedimpacts of climate changeon food crop productivity inAfrica and S Asia?
DFID Systematic Review
Final Report
J.W. Knox, T.M. Hess,A. Daccache and M. Perez Ortola
12th April 2011

Executive SummaryIn many developing countries, agriculture is the cornerstone of their economy, the basis of economicgrowth and the main source of livelihood. But agriculture in the developing world is often cited asbeing one of the sectors most vulnerable to climate change. In Africa, for example, the majority ofavailable fresh water is used for agriculture; farming techniques are relatively simple; and much ofthe continent is already hot and dry. Any changes in precipitation and temperature patterns will thushave major impacts on the viability and yields in crop production. To exacerbate the situation, recentstudies warn of an unprecedented confluence of pressures on agriculture – with population growthand development driving up global demand for food and competition for land, water and energyintensifying as the impacts of climate change starts to take effect. In this context, any strategy toenhance agricultural productivity in Africa and South Asia needs to ensure that natural resources aremanaged sustainably and adapted to climate change.
In order to inform policy and practice options, including resource allocation, DFID commissionedCranfield University to undertake a Systematic Review (SR) of the impacts of climate change on cropproductivity in Africa and South Asia. This report summarises that review, and provides a detailedaccount of the protocol and methodology, data collection, meta-analyses and synthesis. The projectcommenced in June 2010 and was completed in March 2011. The review focussed on eight foodcrops, namely rice, wheat maize, sorghum, millet, cassava, yam, plantain and sugarcane, whichcollectively account for over 80% of total agricultural production in Africa and South Asia. A protocolwas produced detailing the methodology; search strategy and search terms; study inclusion criteria;database sources; and approaches for data synthesis and presentation. For this, the authors followedthe Guidelines for Systematic Reviews in Environmental Management developed by the Centre forEvidence Based Conservation (CEBC) (CEE, 2010). After completing the searches of published andgrey literature, 1144 sources were identified. These were ultimately filtered down to 53 based ontitle and abstract screening (representing 257 observations).
For each crop and region, data were extracted on the projected impacts of climate change on cropproductivity (principally yield) expressed as a yield “variation” (that is projected yield for the givenfuture scenario as a percentage of current, or baseline, yield). The review was constrained to studiesusing bio-physical models for impact assessment rather than statistical sensitivity analyses. Followingan initial scoping, a narrative synthesis with quantitative evidence was proposed. Various meta-analyses were subsequently undertaken, although the results need to be interpreted with cautiongiven the wide range of ‘effect modifiers’. These include, for example, the use of different generalcirculation models (GCM), downscaling approaches, emissions scenarios, crop varieties, husbandrytechniques, agro-ecological conditions and reported scale of enquiry (local to regional). The reportedyield variations thus inevitably include both the potential impacts of climate change as well as theeffect of many other factors implicit in the studies. Notwithstanding these limitations, the keyfindings are summarised below, and for all crops and by region overleaf (Tables 1 and 2).
A mean overall reduction (-8%) in crop yield due to climate change was identified, withsignificant variations for wheat (-12%), maize (-7%), sorghum (-13%) and millet (-9%);
The yield impacts were crop-specific in S Asia and Africa. In S Asia, crops with significant yieldvariation included maize (-16%) and sorghum (-11%). In Africa, the crops with significant yieldvariation included wheat (-17 %), maize (-5%), sorghum (-15%) and millet (-10%);
For rice the mean yield variation (-3%) was not statistically significant, regional differences werestrongly influenced by the small number of studies for Africa, and there was no consistentmessage regarding potential impact of climate change on rice yield over time;
As the climate signal increases, the yield impact increases; however, only projected variations forthe 2050s and beyond were found to be statistically significantly different from zero, and;
For cassava, sugarcane and yams there were too few studies to comment on whether there were
any significant yield impacts or any regional differences.

Table 1 Summary of reported impacts of climate change on yield for (i) all crops, (ii) for S. Asia and(iii) Africa, by region.
Crop n Meanvariation
(%)
Crops withsignificantvariation
n Meanvariation
(%)
Crops with non-significantvariation1
n
All crops 257 -7.7 WheatMaizeSorghumMillet
37129
239
-12.1-7.2
-13.0-8.8
RiceCassavaSugarcane
4387
S Asia 94 -7.7 MaizeSorghum
2310
-15.9-10.8
RiceWheatSugarcane
3817
4
South Asia 74 -8.7 MaizeSorghum
2110
-17.6-10.8
RiceWheatSugarcane
2613
3
South EastAsia
20 -3.6(NS)
- - - RiceWheatMaize
1242
Africa 163 -7.7 WheatMaizeSorghumMillet
20106
138
-17.2-5.4
-14.6-9.6
RiceCassavaSugarcane
573
CentralAfrica
14 -14.9 Maize 8 -13.1 Wheat 2
East Africa 35 0.4(NS)
- - - WheatMaize
229
NorthAfrica
22 0.8(NS)
- - - WheatMaize
1012
Sahel 24 -11.3 MaizeMillet
136
-12.6-10.6
Sorghum 3
SouthernAfrica
33 -11.0 Maize 24 -11.4 WheatSorghumSugarcane
232
West Africa 34 -12.5 Maize 19 -7.4 WheatSorghumCassava
354
Notes
1. See Appendix for a list of countries included within each region;2. n = number of reported mean yield variations. This may include several from the same source for different
countries or time-slices; NS – not significant.3. Significance tested at 0.05% level by comparing the confidence interval of the mean with a zero response;4. Data was not necessarily available for all crops in all regions
1 Only crops with more than one observation included.

Table 2 Summary of reported impacts of climate change on yield in Africa and S Asia, for (i) all crops, (ii) C3 and C4 crops, and (ii) individual crop types.
Crop n Meanvariation
(%)
Overall variation Regional differences Time-slice
SAsia
Africa
All crops 94 163 -7.7 An overall reduction in crop yield due toclimate change.
The projected variation for both S Asia(-7.7%) and Africa (-7.7%) issignificant.
Only projectedvariations for 2050s andbeyond are significantlydifferent from zero.
C3 crops2 56 33 -7.3 An overall reduction in crop yield due toclimate change.
A significant negative mean variationfor Africa (-12.7%). Not significant for SAsia.
Only projectedvariations for 2030s and2050s are significantlydifferent from zero.
C4 crops3 38 130 -7.9 An overall reduction in crop yield due toclimate change.
A significant negative mean variationfor S Asia (-13.0%) and Africa (-6.4%).
Only projectedvariations for 2050s andbeyond are significantlydifferent from zero.
Rice 38 5 -2.8(NS)
No significant response. Some sources(40%) project an increase and some (60%) adecrease in mean yield and for several, therange of projections straddle the “noeffect” line.
Variability in projections is smaller forAfrica than for S Asia, although thislargely reflects a smaller number ofstudies.
No consistent message.
Wheat 17 20 -12.1% Average response is negative, but someproject –ve and others +ve mean variation,and for several the range of projectionsstraddles the “no effect” line.
A significant negative mean variationfor Africa (-17.2%). Not significant for SAsia.
Too few studies haveconsidered all time slicesto comment
2Cassava, Rice, Wheat and Yam
3Maize, Millet, Sorghum and Sugarcane

Crop n Meanvariation
(%)
Overall variation Regional differences Time-slice
SAsia
Africa
Maize 23 106 -7.2 An overall reduction in crop yield due toclimate change.
A significant variation for both S Asia(-15.9%) and Africa (-5.4%). Greaterrange of projections in eastern andsouthern Africa, possibly due to greaternumber of studies.
Only projections beyond2050s are significantlydifferent from zero.
Sorghum 10 13 -13.0 An overall –ve mean variation although theprojected range of some straddles the “noeffect” line.
Significant for both Africa and S Asia. The results of the fewstudies suggest asignificant impact for2080s only.
Millet 1 8 -8.8 An overall –ve mean variation although theprojected range of some straddles the “noeffect” line.
A significant variation for Africa, buttoo few studies to comment on S Asia.
Too few studies tocomment.
Cassava 1 7 -9.4(NS)
No significant response. Most studiesproject an overall –ve mean variationalthough the projected range of somestraddles the “no effect” line. One studyprojected an overall +ve mean variation.
Too few studies to comment. Too few studies tocomment.
Sugarcane 4 3 -1.6(NS)
No significant response. Some sourcesproject an increase and some a decrease inmean yield and for several, the range ofprojections straddle the “no effect” line.
Too few studies to comment. Too few studies tocomment.
Yams 0 1 -5.0(NS)
Too few studies to comment. Too few studies to comment. Too few studies tocomment.
Notes:
1. See Appendix for a list of countries included within each region;
2. n = number of reported mean yield variations. This may include several from the same source for different countries or time-slices; NS – not significant.
3. Significance tested at 0.05% level by comparing the confidence interval of the mean with a zero response;
4. Data was not necessarily available for all crops in all regions.

Table of Contents1 BACKGROUND ...................................................................................................................... 1
2 REVIEW OBJECTIVE AND PRIMARY QUESTION ....................................................................... 3
3 METHODOLOGY.................................................................................................................... 4
3.1 SEARCH STRATEGY........................................................................................................................ 43.2 STUDY INCLUSION CRITERIA............................................................................................................ 63.3 POTENTIAL EFFECT MODIFIERS AND REASONS FOR HETEROGENEITY....................................................... 73.4 STUDY QUALITY ASSESSMENT ......................................................................................................... 73.5 DATA EXTRACTION STRATEGY, SYNTHESIS AND PRESENTATION ............................................................. 73.6 SCOPING STUDY AND FULL REVIEW .................................................................................................. 73.7 POTENTIAL SOURCES OF CONFLICT AND SOURCES OF SUPPORT ............................................................. 7
4 RESULTS ............................................................................................................................... 8
4.1 SUMMARY ANALYSIS OF THE LITERATURE REVIEWED........................................................................... 84.2 QUANTITATIVE SYNTHESIS OVERALL SUMMARY................................................................................ 154.3 QUANTITATIVE SYNTHESIS BY CROP TYPE ........................................................................................ 25
4.3.1 Rice ................................................................................................................................ 254.3.2 Wheat ............................................................................................................................ 314.3.3 Maize ............................................................................................................................. 374.3.4 Sorghum ........................................................................................................................ 454.3.5 Millet.............................................................................................................................. 514.3.6 Cassava.......................................................................................................................... 544.3.7 Sugarcane...................................................................................................................... 574.3.8 Yams .............................................................................................................................. 60
5 SYNTHESIS .......................................................................................................................... 61
5.1 BY CROP ................................................................................................................................... 615.2 BY REGION................................................................................................................................ 63
6 REVIEW LIMITATIONS ......................................................................................................... 65
7 REFERENCES........................................................................................................................ 65
8 ACKNOWLEDGEMENT ......................................................................................................... 69
9 APPENDICES ....................................................................................................................... 70
9.1 CROP PRODUCTION AND REVENUE STATISTICS ................................................................................. 709.2 COUNTRIES BY REGION................................................................................................................ 71

DFID Climate change impacts on crop productivity in Africa and S Asia
1
1 BackgroundFood security is one of this century’s key global challenges. By 2050 the world will need to increasecrop production to feed its projected 9 billion people. For many developing countries, agriculture isthe cornerstone of their economy, the basis of economic growth and main source of livelihood forthree out of four of the world’s poor (DFID, 2009). DFID (2009) set out a vision of doublingagricultural production in Africa over the next 20 years, and doubling the rate of agricultural growthin South Asia over the same period. This must be done in the face of changing consumption patterns,the impacts of climate change and the growing scarcity of water and land (Royal Society, 2009).which will impact on the drive for increased productivity in many developing nations, and hamperprogress to meeting specific Millennium Development Goals (MDG 1). The vision to enhanceagricultural productivity in Africa and South Asia thus needs to be in ways that manage naturalresources sustainably and are adapted to climate change.
Although agricultural production is sufficient to meet current food demands, 1 billion people are stillundernourished. Many of the poorest producers farm in locations where the climate is alreadymarginal for production (CCAFS, 2009) and farmers with limited access to agricultural knowledge andtechnology will also be less able to adapt their farming practices to climate change. For thesereasons, the poorest farmers are those most vulnerable to the potential impacts of climate change.Despite international negotiations to reduce greenhouse emissions (GHG), a 20-30 year lag in ourglobal climate system means we are already committed to a world that will be 0.6oC warmer, withassociated changes in rainfall patterns, by the end of the century (IPCC AR4 Report, 2007). Futurecrop production will thus have to adapt to changes in climate to which we are already committed.
Many studies in the research literature describe how agriculture in Africa will be one of the sectorsmost vulnerable to climate change and variability (Slingo et al., 2005). This is because a significantproportion of the African economy is dependent on agriculture (Benhin, 2008), most of Africa’s water(85%) is used for agriculture (Downing et al., 1997), farming techniques are relatively primitive andthe majority of the continent is already hot and dry. Spatial and temporal changes in precipitationand temperature patterns will shift agro-ecological zones (Kurukulasuriya and Mendelsohn, 2008)and thus have major impacts on the viability of both dryland (Challinor et al., 2005) and irrigatedfarming (Knox et al., 2010).
Similarly, agriculture is critical to South Asia’s development. More than 75 percent of the region’spoor live in rural areas and are dependent on rainfed agriculture, livestock, and fragile forests fortheir livelihoods. The Green Revolution increased food grain productivity, improved food security andrural wages bringing a significant reduction in rural poverty. But the challenge now is to replicate andsustain these achievements in the future with a more variable and unpredictable climate (WorldBank, 2009).
The constraints on food crop production and distribution differ between regions and, in particular,between industrialised and developing countries. Climate change has the potential to exacerbate thestresses on crop plants, potentially leading to catastrophic yield reductions. It is likely to affecthydrological water balances, the availability of fresh water supplies for irrigation and soil moisturebalances, with consequent impacts on agricultural productivity. Soils are another essential but non-renewable resource for food crop production so maintaining soil fertility, health and nutrientavailability is vital. Significant losses in crop yields also occur through pests, diseases and weedcompetition, accounting for major inefficiencies in resource use (water, fertiliser, energy and labour).Reducing these losses represents one of the most accessible means of increasing food supplies.
Climate change will aggravate the effects on crops of stresses such as heat, drought, salinity andsubmergence in water (Kang et al., 2009). Lobell et al. (2008) conducted an analysis of these climaterisks for crops in 12 food-insecure regions to identify adaptation priorities based on crop models and

DFID Climate change impacts on crop productivity in Africa and S Asia
2
climate projections for the 2030s. Their analysis reinforced the importance of improved cropgermplasm (based on access to and use of crop genetic resources collections) and improvedagronomic practices as a strategy for climate change adaptation in agriculture, and that a few targetcrops will be particularly vulnerable in different regions. Adaptation strategies for these crops mustbe carried out in the face of other constraints such as labour shortages and rising energy costs.
As climate is a primary determinant of agricultural productivity, any significant changes in climate inthe future will influence crop and livestock productivity, hydrologic balances, input supplies andother components of managing agricultural systems. However, the nature of these biophysicaleffects and human responses are complex and uncertain (Adams et al., 1998).
In this context and particularly the need to focus more on evidence-informed decision making, DFIDcommissioned Cranfield University to undertake a Systematic Review (SR) of the impacts of climatechange on agricultural productivity in Africa and South Asia. The review will help inform DFID policyand practice options, including resource allocation, for agricultural systems in these areas under achanging climate. This report summarises the systematic review that has been undertaken. Itincludes a detailed account of the protocol and methodology, the data extraction strategy, datacollection, meta-analyses and synthesis of results. The project commenced in June 2010 and wascompleted in January 2011. The study followed the Guidelines for Systematic Reviews inEnvironmental Management developed by the Centre for Evidence–Based Conservation (CEBC) forthe Collaboration for Environmental Evidence (CEE, 2010).

DFID Climate change impacts on crop productivity in Africa and S Asia
3
2 Review objective and primary questionAs in all systematic reviews, one of the most important aspects is the formulation of the primaryquestion. But defining the question is inevitably a compromise between taking a holistic approach,involving a large number of variables and relevant studies, and a reductionist approach that limitsthe review's relevance, utility, and value (Pullin et al., 2009). The subject of climate change impactson agriculture falls into the former category as the available literature is vast, so it is essential toframe the question very carefully to focus the review but without limiting its external credibility.Thus the primary research question for this SR will be:
“What are the projected impacts of climate change on food crop productivity in Africa and S Asia?”
The terms ‘adaptation’ and ‘agriculture’ were omitted from the primary question as these wouldexcessively broaden the scope of the SR – the adaptation of agriculture to climate change is itself aseparate discipline and ‘agriculture’ could be interpreted to include aspects such as livestockproduction and forestry. This SR will focus specifically on the biophysical aspects of crops and theimpact that climate change might have on crop productivity (i.e. yield per unit area). Similarly, thereview will not consider ‘food production’, as this is dependent on non-biophysical factors, such asinvestment in irrigation, international trade policy and world market prices. Nor will it consider theimpact of climate related ‘shocks’ (flood, drought, pest attacks) on food production. Following SRconvention, the research question needs to be broken down into components (PICO/PECO) (Table 3).
Table 3 Breaking down the research question (PICO/PECO).
PICO/PECO Description
Population Agriculture – narrow down to food crops. Exclude grassland, fibre, commodity /industrial crops, fruit, and vegetablesCrops included in review: Rice, wheat, maize, sorghum, millet, cassava, yams,plantain, and sugarcane. These are the most important crops accounting for 80%of total production in Africa and S Asia based on FAO STAT, see Annex 1)Africa and S Asia: Study will include all African countries, rather than selected areas(e.g. Sub-Saharan Africa) or only DFID target countries.In this review S Asia will include India, Pakistan, Bangladesh, Sri Lanka, Nepal,Bhutan and Afghanistan
Intervention Climate change is the intervention as projected by various GCMsTime-scale to be used is from the current (2010) up to the 2050sClimate variables to be included are temperature (mean, seasonal variation) andrainfall (mean annual and seasonality)Changes in C02 concentration will be included
Comparator Baseline climate, typically 1961-90 (note there will be other defined ‘baselines’reported in the literature which may constitute an ‘effect modifier’
Outcome Change in average yield and change in variability of yieldChange in irrigation needChange in fertilizer / pesticide needChange in crop suitability / sustainability

DFID Climate change impacts on crop productivity in Africa and S Asia
4
3 MethodologyThere is extensive literature on climate change impacts and agriculture in the academic and publicdomains. This review has not repeated existing reviews conducted by the IPCC (2007), IAASTD (2009)and others, but of course needed to consider the evidence from these studies. The boundaries of thereview included:
biophysical studies only, recognising that agriculture is practiced within an economic and socialcontext that is often location-specific;
studies that only use climate projections, or that study past climate events, but not thoseconcerned with the underlying science of the response of crops and animals to one or moreclimate factors;
studies that focus on productivity of food crops and the sustainability of food systems from oneyear to the next, and;
studies that focus on crop productivity, omitting the forestry, fisheries, livestock and other non-food crop agricultural sectors.
It is important to note, that this topic is not ideally suited to a systematic review in its usual form. Theapproach is generally used to synthesise results from experimental trials. In this case, by definition, itis impossible to evaluate the impact of future climate on agriculture through experimentation.Scientific studies of the topic will inevitably be based on models; both of climate and crop response.As the number of models available to do this is limited there is a danger that the results of a meta-analysis are biased by assumptions made in the models.
3.1 Search strategy
The main database sources, search websites and organisation websites used in the review aresummarised in Table 4. Academic database sources were sampled first, to avoid duplication laterfrom less specialised databases. During the review, a maximum of 50 ‘hits’ were considered fromeach search website. The search terms used in the review are summarized in Table 5.
Table 4 Database sources and websites.
Database sources Search websites Organisation websites
ISI Web of Knowledge (WoK) google.com World BankScopus googlescholar.com FAOEBSCO GreenFILE dogpile.com Resources for the FutureCSA Natural Sciences scirus.com World BankDirectory of Open AccessJournals
Consultative Group on InternationalAgricultural Research (CGIAR)
ScienceDirect International Water Management InstituteIngenta Connect Asian Development BankInTute Climate InstituteFAO Corporate DocumentRepository
Centre for Environmental Economics andPolicy in AfricaScience and Development NetworkInternational Fund for AgriculturalDevelopment (IFAD)

DFID Climate change impacts on crop productivity in Africa and S Asia
5
Table 5 Summary of search terms used in the systematic review.
Population, Subject Interventions Comparators Outcomes
Agriculture Climate change YieldCrop Temperature FertiliserWheat CO2 IrrigationRice Rainfall Crop failureMaize DiseaseMillet DroughtCassava Soil degradationSorghum SalinityMillet Farm incomeYamPlantainSugarcane
All the references retrieved from the various computerised databases (WoK etc) were then exportedinto a bibliographic software package (Refworks) prior to assessment of relevance using the inclusioncriteria. The bibliographies of that material were also searched for any relevant references. Onlyliterature published in English was reviewed. Searches were limited to sources published from 1990.
Regional terms (such as “Africa” or “South Asia” and specific countries were not used as specificsearch terms, as these could restrict the search and exclude studies that have taken a wider or globalperspective. Instead, these were screened later using the ‘inclusion criteria’. Searches were initiallytrialled during the protocol phase using the following English language search terms (*and ? denotewildcards) (Table 6).
Table 6 Search terms trialled in Web of Science (25 Aug 2010) and reported number of hits.
Search term All intitle
CC intitle
All intopic
Comments
“Climate change” AND Agricultur* 296 922 3,297 Search term is too broad asagriculture encompasses foodand non-food (e.g. forestry)production as well as livestock. Italso includes mitigation aspectsof climate change and agriculturewhich are not relevant to this SR
“Climat* change” AND AgricultureAND Adapt*
20 253 498 As above (too general), butincludes adaptation
“Climat* change” AND crop* ANDAdapt*
17 217 492 Good search which captures croprelated adaptation
“Climate change” AND Agricultur*AND (Temperature OR Rain* ORCO2)
9 479 1,536 Inclusion of secondaryintervention terms makes searchtoo specific
“Climate change” AND (Yield ORFertili?er OR Irrigation OR FailureOR Disease OR Drought OR Soil ORSalinity)
410 2,081 10,461 A good search which captures thekey impacts of climate change oncrop productivity
“Climate change” AND crop* 170 601 1,540 Search term too broad

DFID Climate change impacts on crop productivity in Africa and S Asia
6
“Climate change” AND (Rice ORwheat OR maize OR sorghum ORmillet OR cassava OR yam* ORplantain* OR sugar*)
160 338 1,384 A good search if the secondaryterms are included in the topic
“Climate change” AND (Yield ORFertili?er OR Irrigation OR FailureOR Disease OR Drought OR Soil ORSalinity) AND (Rice OR wheat ORmaize OR sorghum OR millet ORcassava OR yam* OR plantain* ORsugar*)
37 273 989 Included in above search
“Climate change” AND “farm*income”
0 7 18 Too restrictive search term withtoo few hits for meta-analysis.
The searches given in bold represent those ultimately used in the systematic review
3.2 Study inclusion criteria
All the literature retrieved was then screened for relevance using the following study inclusioncriteria given below.
Relevant subjects:
Any countries / regions in Africa and S Asia (as defined above);
Any scale from field to region;
Any crops (as defined above);
Include small-scale and commercial agriculture.
Type of intervention:
Climate change emission scenarios for time slices up to the 2050s;
Emission scenarios based on IPCC scenarios;
Projected changes in mean, total or seasonality.
Comparator:
Compares future outcomes with present / baseline outcomes;
Method:
Controlled experiments or biophysical modelling
Outcomes:
Studies that considered the change in crop suitability, performance, variability and/or sustainability.
The published date of literature included in the review was an important feature as GCMs andemissions scenario are continually being updated. For this review, any literature precedingpublication of the Third IPCC Assessment Report (IPCC, 2001) was excluded. The initial filtering wasundertaken based on the title of the literature source; a second filter was then based on the contentin the abstract, and then only the full text reviewed for those articles, reports and papers that passedall inclusion criteria. This stage was undertaken by 2 researchers (Knox and Daccache), workingindependently, to screen the literature datasets. A cross comparison was then completed to ensureconsistency between the researchers in the acceptance/rejection criteria being applied.

DFID Climate change impacts on crop productivity in Africa and S Asia
7
3.3 Potential effect modifiers and reasons for heterogeneity
Systematic reviews are generally best applied to studies where there is good primary data. However,this review was limited to assessing modelled outputs from a wide range of climate change impactstudies, all of which will inevitably contained a number of ‘effect modifiers’, including:
Alternative general circulation models (GCM);
Different emission scenarios and ensembles;
Different crop varieties and husbandry techniques;
Different agro-ecological conditions, and;
Varying assumed methods of irrigation and levels of mechanisation/crop husbandry
3.4 Study quality assessment
To avoid bias, care needed to be exercised in interpreting studies reporting climate change impactsacross similar agricultural systems but conducted using different methodologies, as there is no singlediscriminator that can be used to determine which model/approach is best. For example, contrastingcrop models, model parameterisation, calibration and validation, the use of different models andmethods for GCM downscaling and the appropriateness of temporal and spatial scales, will allinevitably have an impact on the reported outputs, and hence result in high potential for bias wherelow quality data might have been used.
In other disciplines, a ‘hierarchy of research methodologies’ has typically been used to score data interms of scientific rigour. This approach did not work in this review because the environmentalcontext of each study provides too much ‘internal’ variability. Climate change studies areintentionally conducted at river basin or region levels, and not intentionally designed to becomparable to other studies. The data was therefore assessed against whether they used recognisedcrop models, GCMs, data sources and emissions scenarios. Qualitative research was not included.
3.5 Data extraction strategy, synthesis and presentation
Following the literature searches, a wide range of empirical data was identified, ranging from dataform detailed case studies (catchments/regions) using regional downscaling (RCM) to much broaderscale assessments using single GCM outputs and spatial (GIS) modeling. The approach used wastherefore to extract all relevant data based on the ‘outcome’ search terms and inclusion criteria, andthen to collate the information by crop type and region using spreadsheets (MS Excel). From thesedata, the meta-analyses were then conducted. Originally, the review was to be based on a narrativesynthesis supported by quantitative evidence. This approach was considered to be suited to studiessuch as climate change impacts where the subject content is broad and the range of potentialoutcomes disparate. However, following the data extraction phase it was apparent that some meta-analyses were possible (see Results Section 5.3).
3.6 Scoping study and full review
The SR protocol was drafted and reviewed by DFID in Summer 2010. A scoping study was thenundertaken to test the search strategy and gauge the scale of available literature based on the searchterms. Based on the scoping study and feedback from DFID, the protocol was updated and the full SRimplemented. This was completed in December 2010.
3.7 Potential sources of conflict and sources of support
There were no known sources of conflict. The study was funded by the UK Department ofInternational Development (DFID).

DFID Climate change impacts on crop productivity in Africa and S Asia
8
4 Results
4.1 Summary analysis of the literature reviewed
The relevant literature was selected and screened in four stages (Figure 1):
1. Using the agreed keywords and databases, relevant literature was identified and assembled in a
database (RefWorks).
2. Duplicates were removed, leaving a total of 1,114 unique sources that matched the search
criteria.
3. Sources were screened on the basis of title to remove those that clearly did not meet the
inclusion criteria, reducing the total to 333.
4. A similar screening was carried out on the basis of abstracts leaving a total of 52 relevant sources
that met the inclusion criteria (this included 256 independent observations for analysis).
Figure 1 Schematic overview of the individual stages in the systematic review.

DFID Climate change impacts on crop productivity in Africa and S Asia
9
Figure 2 shows the number of sources (papers, reports and grey literature) reviewed at each stage ofthe data screening. The final set of sources was dominated by papers focussing on rice, maize andwheat and cassava, yam, sugarcane and plantain were the crops with the lowest number ofreferences. This highlights an important knowledge gap where resources could be focussed to helprebalance the level of understanding of climate change impacts in particular cropping systems.
Figure 2 Number of references identified and filtered at each screening stage.
Table 7 shows that the majority (83%) of the sources selected were in peer reviewed scientificjournals. Other sources used including conference papers, book chapters, and technical reportsaccounted for the remainder. There was roughly an equal split in the data sources identified betweenAfrica and South Asia.
Table 7 Number of peer review scientific papers and other sources, aggregated by region.
Data source Asia only Africa only Both Asiaand Africa
Total
Peer review scientific paper 21 20 2 43Other 4 3 2 9
Total 25 23 4 52
An analysis of the total number of papers used in the review based on their year of publication issummarised in Figure 3. The trend is strongly positive, increasing from two relevant published journalpapers from 1990-94 to 19 in the last 5 years.
0 200 400 600 800 1000 1200 1400
Selection based onsearch criteria
Selection basedtitle
Selection based onabstract
Final selection

DFID Climate change impacts on crop productivity in Africa and S Asia
10
Figure 3 Summary of papers used in the review, based on number and year of publication.
A summary of the scientific journals from which the papers used in this review were found is shownin Figure 4. The journals ‘Agriculture, Ecosystems and Environment’, ‘Agriculture and ForestMeteorology’, ‘Climate Research’, ‘Global Environmental Change’ and ‘Climatic Change’ were themost common, accounting for 19% of the final selection. There were 17 other journals or sourcesthat only contributed one paper each.
0
1
2
3
4
5
6
7
1990
1991
1992
1993
1994
1995
1996
1997
1998
1999
2000
2001
2002
2003
2004
2005
2006
2007
2008
2009
2010
Tota
lnu
mb
ero
fp
ape
rs

DFID Climate change impacts on crop productivity in Africa and S Asia
11
Figure 4 Sources of published papers used in the SR analysis.
Some sources were concerned with a single country; others with multiple countries and some withentire regions. Figure 5 summarises the number of studies that referred to each country and region.
India has been the most widely studied country regarding climate change effects on yieldproductivity (15 sources) followed by Bangladesh (6 sources) and then South Africa (5 sources).
0 1 2 3 4 5 6
Agriculture, Ecosystems and Environment
Climatic change
Agricultural and Forest Meteorology
Climate research
GlobalEnvironmentalChange
Journalof Agrometeorology
Agricultural Systems
Agricultural WaterManagement
Globaland Planetary Change
International Journalof Climatology
Agronomy for Sustainable Development
Climate change and agriculture: analysis of…
Ecological Modelling
EnvironmentalManagement
FAO
Field crops research
Journalof Arid Environments
Journalof Environmental Informatics
Mitigation & Adaptation Strategies for Global…
Nature
Physiscs and Chemistry of the Earth
Science
South African Journalof Science
Singapore Journalof Tropical Geography
South African Journalof Science
Systems Approaches for Agricultural…
Number of published papers

DFID Climate change impacts on crop productivity in Africa and S Asia
12
Figure 5 Published peer review papers relevant to the SR, aggregated by region and country.
Many of the earlier climate change impact studies on crop productivity were based on a simplesensitivity analysis, typically adjusting the historical climate (e.g. rainfall and temperature) by fixedamounts (e.g. +10%, +20%, +1°C, +2°C, etc.). In this study, such simple sensitivity analyses arereferred to as ‘CC-simple’ methods; these accounted for 38% of the selected studies. More recently,impact assessments have tended to rely on downscaled outputs from a global circulation model(GCM) or ensemble of GCMs and the outputs then used as the climate input into a crop growth
0 2 4 6 8 10 12 14 16
Algeria
Angola
Benin
Botswana
Burkina Faso
Burundi
Cameroon
Central Afr Rep
Chad
Congo
Côte d'Ivoire
DR Congo
Egypt
Equatorial Guinea
Eritrea
Ethiopia
Gabon
Gambia
Ghana
Guinea
Guinea-Bissau
Kenya
Lesotho
Liberia
Lybia
Madagascar
Malawi
Mali
Mauritania
Morocco
Mozambique
Namibia
Niger
Nigeria
Rwanda
Senegal
Sierra Leone
Somalia
South Africa
Sudan
Swaziland
Tanzania
Togo
Tunisia
Uganda
Zambia
Zimbabwe
Bangladesh
Bhutan
India
Nepal
Pakistan
Sri Lanka
Afr
ica
Asi
a
Totalnumber of papers

DFID Climate change impacts on crop productivity in Africa and S Asia
13
model to simulate future changes in productivity (e.g. Daccache et al., 2010). In this review, these arereferred to as ‘CC-complex’ methods and they accounted for 58% of the studies reviewed. It isimportant to distinguish between these contrasting methods as they are strong ‘effect modifiers’ onthe observed/reported impacts. The most widely reported crop models used in these ‘CC-complex’studies were the CERES suite of models (accounting for 35% of all studies), InfoCrop (4%), Oryza1(4%) and CropSyst (3%). Other crop models used included EPIC, the FAO/IIASA AEZ model, CANEGRO,ACRU, CROPSIM, SIMRIW and the SWAT model.
This systematic review also highlighted the different methods being used to model crop productivity.Early studies were predominantly based on an analysis of historical trends in yield and then relatingthis to past and future climate variability. The alternative, more robust method involves theparameterisation and application of specific biophysical crop growth models to simulate potentialchanges in crop growth and yield taking into account crop agronomy, land and water managementpractices. In this study, these two approaches have been defined as ‘Crop-trend’ and ‘Crop-model’.The proportion of studies in this review based on these were 15% and 85%, respectively. The CERESsuite of models, including CERES-Maize, CERES-Wheat and CERES-Rice were widely used. Other cropmodels including InfoCrop, ORYZA1 and CropSyst were also popular (Figure 6). The choice of thesemodels of course strongly reflects the range crop types being cultivated in Africa and S. Asia.
Figure 6 Reported crop modelling approaches (Crop-trend - grey; Crop-model – blue) used in papersrelevant to the systematic review.
In order to assess whether there was any underlying temporal trend in the climate changemethodologies being used, the number of studies using CC-simple and CC-complex approaches since1990 were assessed (Figure 7). This shows that the number of studies based on CC-complexapproaches has increased with time whilst the methods based on applying fixed changes in climate(CC-simple) have remained more or less constant.
0
2
4
6
8
10
12
14
16
Tota
lnu
mb
ero
fp
ape
rs

DFID Climate change impacts on crop productivity in Africa and S Asia
14
Figure 7 Trend in use of ‘CC-complex’ and ‘CC-simple’ (blue) methodologies from 1990 to 2010.
The choice of GCM is also a strong effect modifier. Figure 8 summarises the GCMs used in thereported studies. The most widely used GCM was the HadCM usually in combination with GISS. TheGFDL, GISS and UKMO GCMs were also commonly used.
Figure 8 Reported GCM models and approaches used in papers relevant to the systematic review.
The research by Mati (2000) studied maize productivity and climate change impacts in five locationsin Kenya. Although projected yield responses to climate change were low (<0.5 t ha-1) in all cases the
0
2
4
6
8
10
12
14
16
18
20
1990-1994 1995-1999 2000-2005 2006-2010
Nu
mb
ero
fpap
ers
CC-Simple GDFL
GISS UKMO
CCCM HadCM (1, 2, 3)
Probabilistic (many GCM's) Other GCM's
Total published
0
1
2
3
4
5
6
7
8
9
Nu
mb
ero
fpap
ers
DFID
low current yield in some marginal areas (e.g. 0.123 t haincreases, which distort the statistical analysexcluded from all analyses.
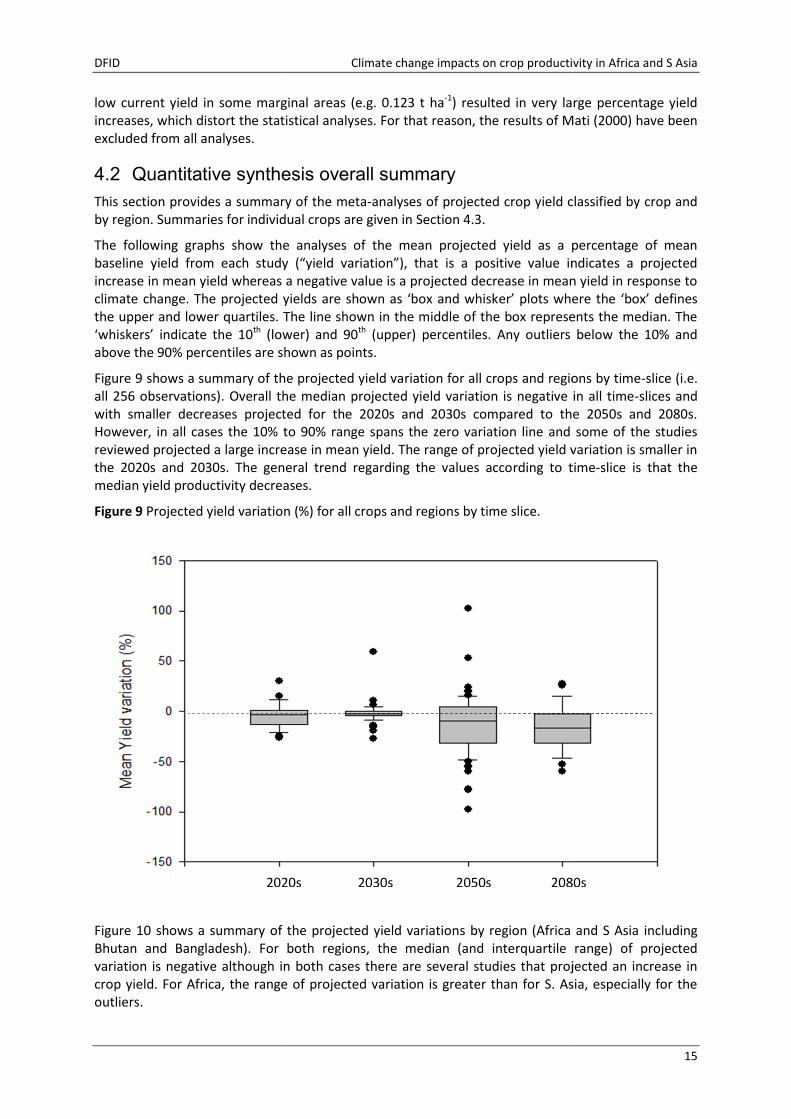
4.2 Quantitative synthesis overall summary
This section provides a summary of the metaby region. Summaries for individual crops are given in
The following graphs show the analyses of the mean projected yield as a percentage of meanbaseline yield from each study (“yield variation”), that is a positive value indicates a projectedincrease in mean yield whereas a negative value is a projected decrease in mean yield in response toclimate change. The projected yields are shown as ‘box and whiskthe upper and lower quartiles. The line shown in the middle of the box represents the median. The‘whiskers’ indicate the 10th (lower) and 90above the 90% percentiles are shown as points.
Figure 9 shows a summary of the projected yield vaall 256 observations). Overall the median projected yield variation is negative in all timewith smaller decreases projected for the 2020s and 2030s compared to the 2050s and 2080s.However, in all cases the 10% toreviewed projected a large increase in mean yield. The range of projected yield variation is smaller inthe 2020s and 2030s. The general trend regarding the values accomedian yield productivity decreases.
Figure 9 Projected yield variation
Figure 10 shows a summary of the projected yield variationBhutan and Bangladesh). For both regionsvariation is negative although in both cases there are several studies that projected an increase incrop yield. For Africa, the range of projected variation is greater than for S. Asia, especially for theoutliers.
2020s
Climate change impacts on crop productivity
rginal areas (e.g. 0.123 t ha-1) resulted in very large percentage yielddistort the statistical analyses. For that reason, the results of Mati (2000) have been
Quantitative synthesis overall summary
n provides a summary of the meta-analyses of projected crop yield classified by crop andby region. Summaries for individual crops are given in Section 4.3.
graphs show the analyses of the mean projected yield as a percentage of meanyield from each study (“yield variation”), that is a positive value indicates a projected
increase in mean yield whereas a negative value is a projected decrease in mean yield in response toclimate change. The projected yields are shown as ‘box and whisker’ plots where the ‘box’ definesthe upper and lower quartiles. The line shown in the middle of the box represents the median. The
(lower) and 90th (upper) percentiles. Any outliers below the 10% andabove the 90% percentiles are shown as points.
shows a summary of the projected yield variation for all crops and regions by time. Overall the median projected yield variation is negative in all time
with smaller decreases projected for the 2020s and 2030s compared to the 2050s and 2080s.to 90% range spans the zero variation line and some of the studies
reviewed projected a large increase in mean yield. The range of projected yield variation is smaller inthe 2020s and 2030s. The general trend regarding the values according to timemedian yield productivity decreases.
Projected yield variation (%) for all crops and regions by time slice.
shows a summary of the projected yield variations by region (Africa and S AsiaFor both regions, the median (and interquartile range) of projected
hough in both cases there are several studies that projected an increase incrop yield. For Africa, the range of projected variation is greater than for S. Asia, especially for the
2020s 2030s 2050s 2080s
crop productivity in Africa and S Asia
15
) resulted in very large percentage yieldthat reason, the results of Mati (2000) have been
analyses of projected crop yield classified by crop and
graphs show the analyses of the mean projected yield as a percentage of meanyield from each study (“yield variation”), that is a positive value indicates a projected
increase in mean yield whereas a negative value is a projected decrease in mean yield in response toer’ plots where the ‘box’ defines
the upper and lower quartiles. The line shown in the middle of the box represents the median. The(upper) percentiles. Any outliers below the 10% and
riation for all crops and regions by time-slice (i.e.. Overall the median projected yield variation is negative in all time-slices and
with smaller decreases projected for the 2020s and 2030s compared to the 2050s and 2080s.90% range spans the zero variation line and some of the studies
reviewed projected a large increase in mean yield. The range of projected yield variation is smaller inrding to time-slice is that the
by region (Africa and S Asia includingthe median (and interquartile range) of projected
hough in both cases there are several studies that projected an increase incrop yield. For Africa, the range of projected variation is greater than for S. Asia, especially for the
2080s

DFID Climate change impacts on crop productivity in Africa and S Asia
16
Figure 10 Projected yield variation (%) for all crops, by region.
Figure 11 shows the frequency distribution of the yield variation for all the observations given in 10%increments.
Figure 11 Frequency distribution of the yield variation for all the observations
Asia Africa
Figure 12 shows a summary of the projected yield variations, by sub-region. Again, most of the sub-regions show a negative median yield variation as a result of climate change. However, the mediansfor East Africa and the Sahel are both close to the ‘no effect’ (zero) line; therefore as manyprojections showed a positive change as a negative one. The regions with the largest proportion ofnegative values are in Central and West Africa. The highest range in yield variation is for East Africa.
Asia Africa

DFID Climate change impacts on crop productivity in Africa and S Asia
17
Figure 12 Projected yield variation (%) for all crops, by sub-region. South Asia (including Bhutan andBangladesh), East, Central, Southern, West, Sahel and Northern Africa.
Figure 13 shows a summary of the projected yield variations depending on the climate changemodelling approach (i.e. ‘CC-simple’ or ‘CC-complex’). Both medians are below the zero (no change)threshold although the inter-quartile range for the ‘CC-Simple’ approach spans the zero line.However, the projected variation based on using GCM outputs (CC-complex) show much greaterdispersion with many data points located outside the 10th and 90th percentiles.
Figure 13 Projected yield variation (%) for all crops and time slices, aggregated by climate changemodelling approach (CC-simple, CC-complex).
Methodology
0 1 2 3
Yie
ldva
ria
tion
-200
-100
0
100
200
300
400
Region
0 1 2 3 4 5 6 7 8
Yie
ldva
riatio
n(%
)
-150
-100
-50
0
50
100
150
CC-simple CC-complex
S Asia East Central South West Sahel NorthAfrica Africa Africa Africa Africa

DFID Climate change impacts on crop productivity in Africa and S Asia
18
Figure 14 shows the projected yield variation according to the climate change modelling approach.These have been divided into ‘Physical’ approaches; those based on a single GCM (Single GCM);those based on less than three GCMs (less than 3); and those based on multiple GCMs (‘Multiple’).The medians of all four groups are negative, but the variation of the observations is smallest for theprojections based on multiple GCMs. However, it should be noted that many of the ‘multiple’projections are based on one source, whereas the others are aggregates of multiple sources.
Figure 14 Projected yield variation (%) for all crops and time slices, aggregated by climate changemodelling approach (CC-simple, CC-complex).
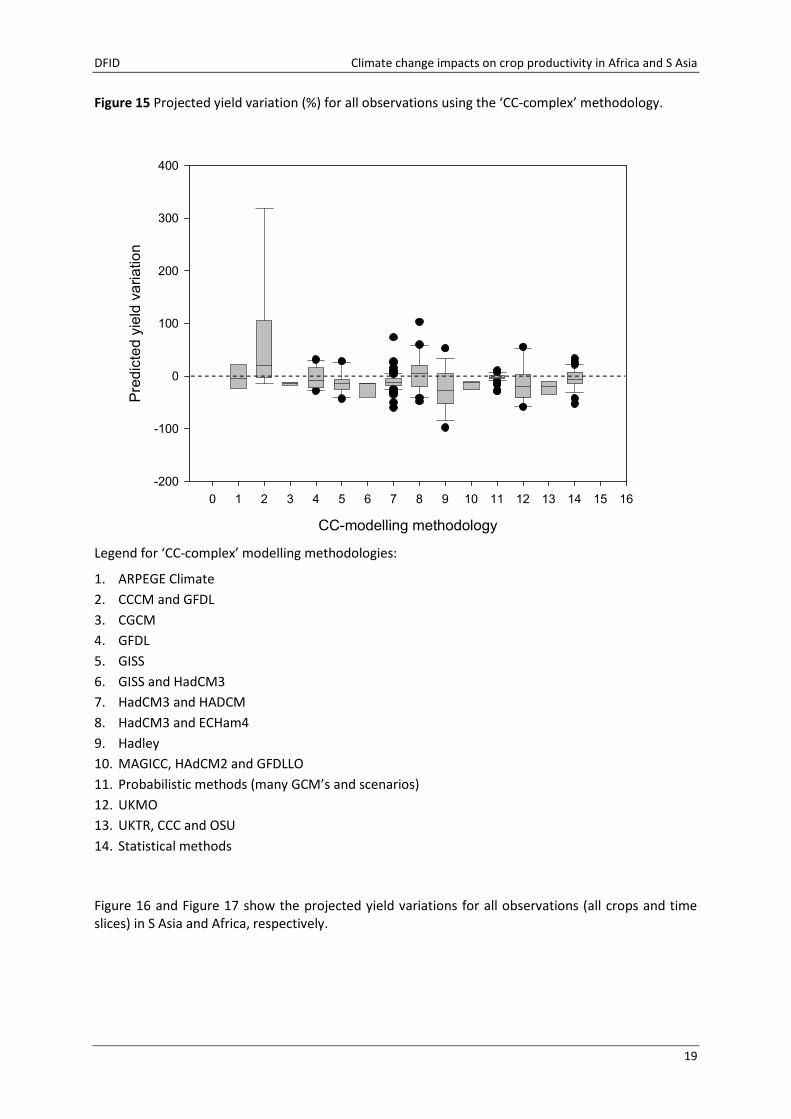
Figure 15 shows a summary of the projected yield variations for studies using various ‘CC-complex’methods. From this, it is evident that the projected yield variations derived from using the GCM’sCCCM and GFDL, HadCM3 and ECHAM4 all have positive medians. The highest dispersion in theresults is for CCCM and GFDL, although most of them are in the lower area. For studies using theCGCM, GISS and HadCM3, MAGICC, HadCM2 and GFDLLO, or UKMO climate models, every projectedcrop yield impact was negative. The smallest variability within the 10th and 90th percentiles is shownby the values corresponding to CGCM (only 3 values available), followed by the HadCM3 and HADCMGCM models.
Climate Change simulation
0 1 2 3 4 5
Yie
ldvari
atio
n(%
)
-150
-100
-50
0
50
100
150
Physical Single GCM Less than 3 Multiple
DFID Climate change impacts on crop productivity in Africa and S Asia
19
Figure 15 Projected yield variation (%) for all observations using the ‘CC-complex’ methodology.
CC-modelling methodology
0 1 2 3 4 5 6 7 8 9 10 11 12 13 14 15 16
Pre
dic
ted
yie
ldva
ria
tion
-200
-100
0
100
200
300
400
Legend for ‘CC-complex’ modelling methodologies:
1. ARPEGE Climate
2. CCCM and GFDL
3. CGCM
4. GFDL
5. GISS
6. GISS and HadCM3
7. HadCM3 and HADCM
8. HadCM3 and ECHam4
9. Hadley
10. MAGICC, HAdCM2 and GFDLLO
11. Probabilistic methods (many GCM’s and scenarios)
12. UKMO
13. UKTR, CCC and OSU
14. Statistical methods
Figure 16 and Figure 17 show the projected yield variations for all observations (all crops and timeslices) in S Asia and Africa, respectively.

DFID Climate change impacts on crop productivity in Africa and S Asia
20
Figure 16 Predicted yield variations (% change) for all observations in S Asia.
In Figure 18, the observations have been aggregated for both Africa and S. Asia, and the crop typesgrouped according to whether they are C3 or C4 plant species.
-100
-80
-60
-40
-20
0
20
40
60
80
Yam Sugarcane Sorghum Millet Cassava Rice Maize Wheat
South Asia South East Asia
Ind
ia
Nep
al
Pak
ista
n
SriL
anka
Ban
glad
esh
Bh
uta
n

DFID Climate change impacts on agriculture in Africa and S Asia
21
Figure 17 Summary of reported yield variations (%) for all observations in Africa.
-100
-50
0
50
100
150
Yie
ldva
ria
tio
n(%
)
Maize Yam Sugarcane Sorghum
Millet Cassava Rice Wheat
East Africa Central Africa Southern Africa West Africa Sahel Northern Africa

DFID Climate change impacts on agriculture in Africa and S Asia
22
Figure 18 Summary of reported yield variations (%) for all C4 (yellow) and C3 (green) crops and all time slices in Asia and Africa.
-100
-50
0
50
100
150
Yiel
dva
riat
ion
(%)
Maize Yam Sugarcane Sorghum
Millet Cassava Rice Wheat
South South East East Africa Central Africa Southern Africa West Africa Sahel Northern Africa
Asia Asia
DFID Climate change impacts on agriculture in Africa and S Asia
23
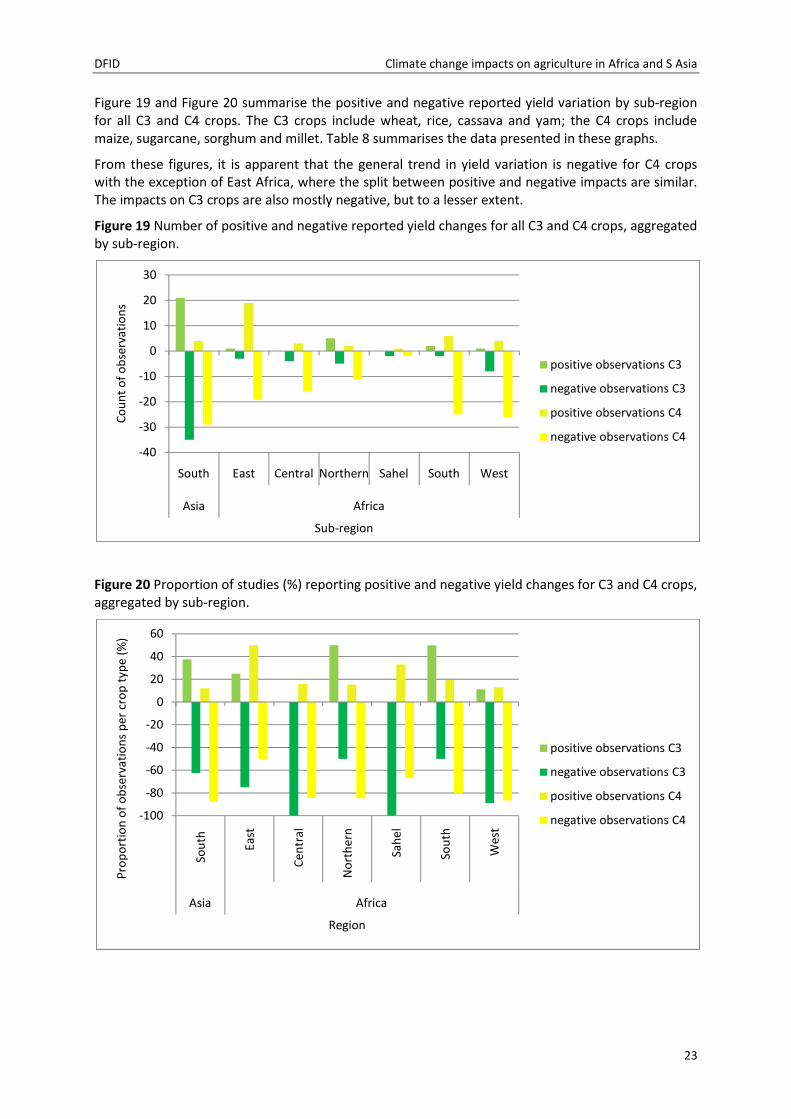
Figure 19 and Figure 20 summarise the positive and negative reported yield variation by sub-regionfor all C3 and C4 crops. The C3 crops include wheat, rice, cassava and yam; the C4 crops includemaize, sugarcane, sorghum and millet. Table 8 summarises the data presented in these graphs.
From these figures, it is apparent that the general trend in yield variation is negative for C4 cropswith the exception of East Africa, where the split between positive and negative impacts are similar.The impacts on C3 crops are also mostly negative, but to a lesser extent.
Figure 19 Number of positive and negative reported yield changes for all C3 and C4 crops, aggregatedby sub-region.
Figure 20 Proportion of studies (%) reporting positive and negative yield changes for C3 and C4 crops,aggregated by sub-region.
-40
-30
-20
-10
0
10
20
30
South East Central Northern Sahel South West
Asia Africa
Co
un
to
fo
bse
rvat
ion
s
Sub-region
positive observations C3
negative observations C3
positive observations C4
negative observations C4
-100
-80
-60
-40
-20
0
20
40
60
Sou
th
East
Cen
tral
No
rth
ern
Sah
el
Sou
th
Wes
t
Asia Africa
Pro
po
rtio
no
fo
bse
rvat
ion
sp
ercr
op
typ
e(%
)
Region
positive observations C3
negative observations C3
positive observations C4
negative observations C4

DFID Climate change impacts on agriculture in Africa and S Asia
24
Table 8 Number of reported observations showing positive and negative yield variations, aggregatedby region and by crop type (C3 or C4).
CropAsia Africa
TotalEast Central Northern Sahel South West
Positive C3 21 1 0 5 0 2 1 30
Negative C3 35 3 4 5 2 2 8 59
Positive C4 2 19 3 2 1 6 4 39
Negative C4 29 19 16 11 2 25 6 128

DFID Climate change impacts on agriculture in Africa and S Asia
25
4.3 Quantitative synthesis by crop type
The following sections provide a synthesis of the projected yield variations due to climate change bycrop type, for each region. The figures show the mean projected yield variation and, where reported,the range as error bars.
For each crop, five sets of analyses are presented. Firstly, for all observations (i), then by time-slice(ii), then by ‘CC-simple’ and ‘CC-complex’ methodologies (iii), then by CC-complex only (iv) and finallyby ‘CC-simple’ only. This helps to identify the impact of the various climate change modelling and thecrop modelling approach on the results and hence the likely impact of these effect modifiers on theoverall trends.
4.3.1 Rice
4.3.1.1 Data sources
The review identified 25 sources relating to climate change impacts on rice productivity in Asia (Table9). 19 of these were in peer reviewed journals; the majority (16) of which were published in 12journals whilst the others were technical/conference papers (Palanisami et al., 2008; Mohandass andRanganathan, 1997) and a book chapter (Modandass et al., 1997). A further 6 ‘other’ sources of datawere also used.
Table 9 Summary of peer review papers included in the review for rice in Asia.
Author and year Country/region Journal
ASIADe Costa et al. (2006) Sri Lanka Field Crops ResearchDevries (1993) India Systems Approaches for Agricultural
DevelopmentDroogers (2004) Sri Lanka Agricultural Water ManagementDe Silva et al. (2007) Sri Lanka Agricultural Water ManagementFaisal and Parveen (2004) Bangladesh Environmental ManagementGeethalaksmi et al (2008) India Journal of AgrometeorologyDas et al. (2007) Bangladesh Journal of AgrometeorologyMasutomi et al (2009) Pakistan, Bangladesh,
Sri Lanka, Nepal,Bhutan
Agriculture, Ecosystems and Environment
Krishnan et al (2007) India Agriculture, Ecosystems and EnvironmentLobell (2007) India Agricultural and Forest MeteorologyLal et al. (1998) India Agricultural and Forest MeteorologyLobell et al. (2008) Global ScienceMahmood (1998) Bangladesh Ecological ModellingMatthews et al. (1997) India, Bangladesh Agricultural SystemsSaseendran et al. (2000) India Climatic ChangeSwain and Yavad (2009) India Journal of Environmental Informatics
AFRICALobell et al. (2008) Global ScienceOdingo (1990) Regional Book chapterAdejuwon (2005) Nigeria Singapore Journal of Tropical Geography

DFID Climate change impacts on agriculture in Africa and S Asia
26
Figure 21. Number of published data sources used assessing climate change impacts on rice in Africaand Asia
Only 3 sources were identified for rice production in Africa. Two of these were published in peerreviewed journals whilst the third is a book chapter (Odingo, 1990). In addition, Leemans andSolomon (1993) published a study regarding climate change effects on several crops in Africa andAsia in Climate Research.
Some of the studies focused on a specific country or region (e.g. Adejuwon, 2005, in Nigeria;Saseendran et al., 2000, Mohandass and Ranganathan, 1997, Geethalaksmi et al., 2008, and Krishnanet al., 2007, in India; Faisal and Parveen, 2004, Mahmood, 1998, and Das et al., 2007, in Bangladesh;and Droogers, 2004, in Sri Lanka) whilst others studied much larger geographical areas and providedresults for different countries (Masutomi et al., 2009, and Matthews et al., 1997) or regions (Lobell etal., 2008). The results from Adejuwon (2005) are not included in the following analyses, because theirdata were not in a comparable format to those presented by other authors.
4.3.1.2 Overall results
Figure 22 summarises the results for all observations relating to rice in Africa and S Asia. Thiscontains the results corresponding to different time slices (2020s, 2030s, 2050s and 2080s), GCMs(GISS, GFDL, UKMO) with no specified prediction period, other possible future scenarios (e.g.temperature increase by 2⁰C), and studies based on variation in the average temperature and diurnal temperature range.
0
5
10
15
20
25
30
Asia Africa

DFID Climate change impacts on agriculture in Africa and S Asia
27
Figure 22 Reported variations in rice yield (%) for all observations.
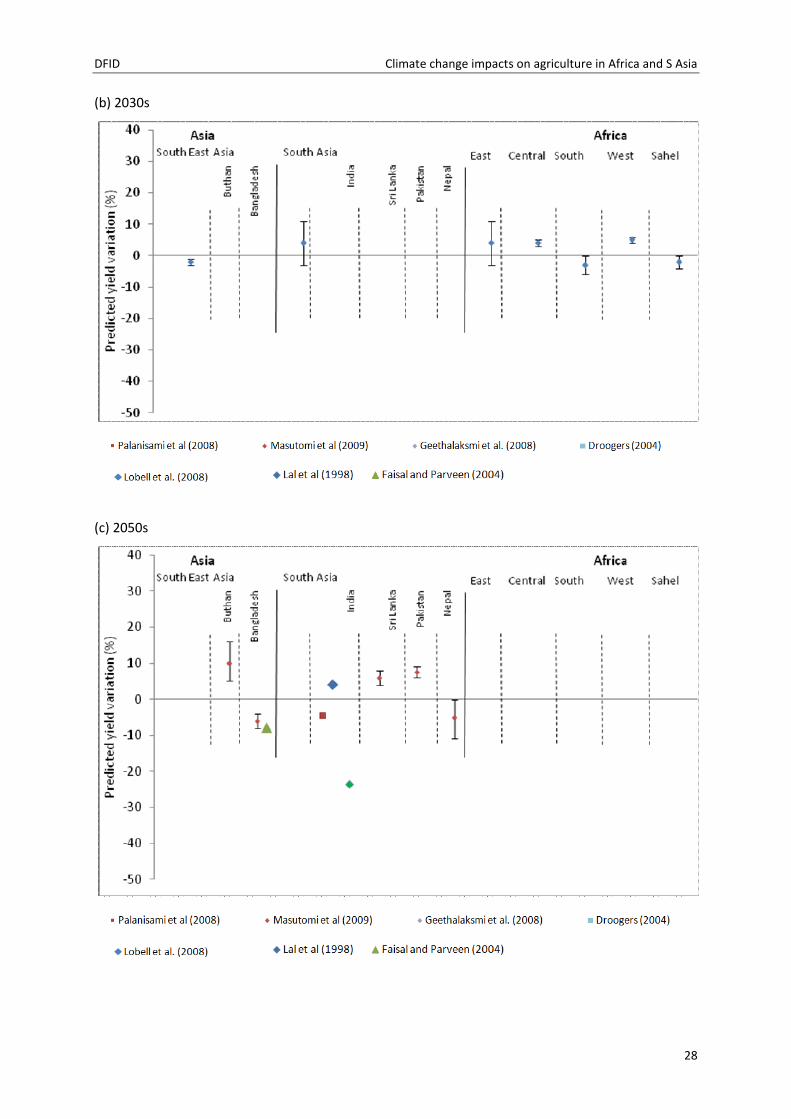
4.3.1.3 Results by time slice
Figure 23 shows the projected impact on yield variation by time-slice. There were no impactsreported for rice in Africa for the 2020s, 2050s and 2080s.
Figure 23 Reported variations in rice yield (%) for four time-slices.
(a) 2020s
-70
-60
-50
-40
-30
-20
-10
0
10
20
30
40
Pre
dic
ted
yie
ldva
riat
ion
(%)
Lobell et al. (2008) Palanisami et al. (2008) Lal et al (1998)
Mohandass and Renganathan (1997) Masutomi et al (2009) Krishman et al. (2007)
Lobell (2007) Faisal and Parveen (2004) Matthews et al. (1997)
Geethalaksmi et al. (2008) Droogers (2004) Matthews et al. (1997)
Mahmood (1998)
South East Asia
Asia Africa
Bu
tha
n
Ba
ng
lad
esh
South Asia
Ind
ia
Sri
Lan
ka
Pa
kist
an
Central Southern West Sahel
DFID Climate change impacts on agriculture in Africa and S Asia
28
(b) 2030s
(c) 2050s
DFID Climate change impacts on agriculture in Africa and S Asia
29
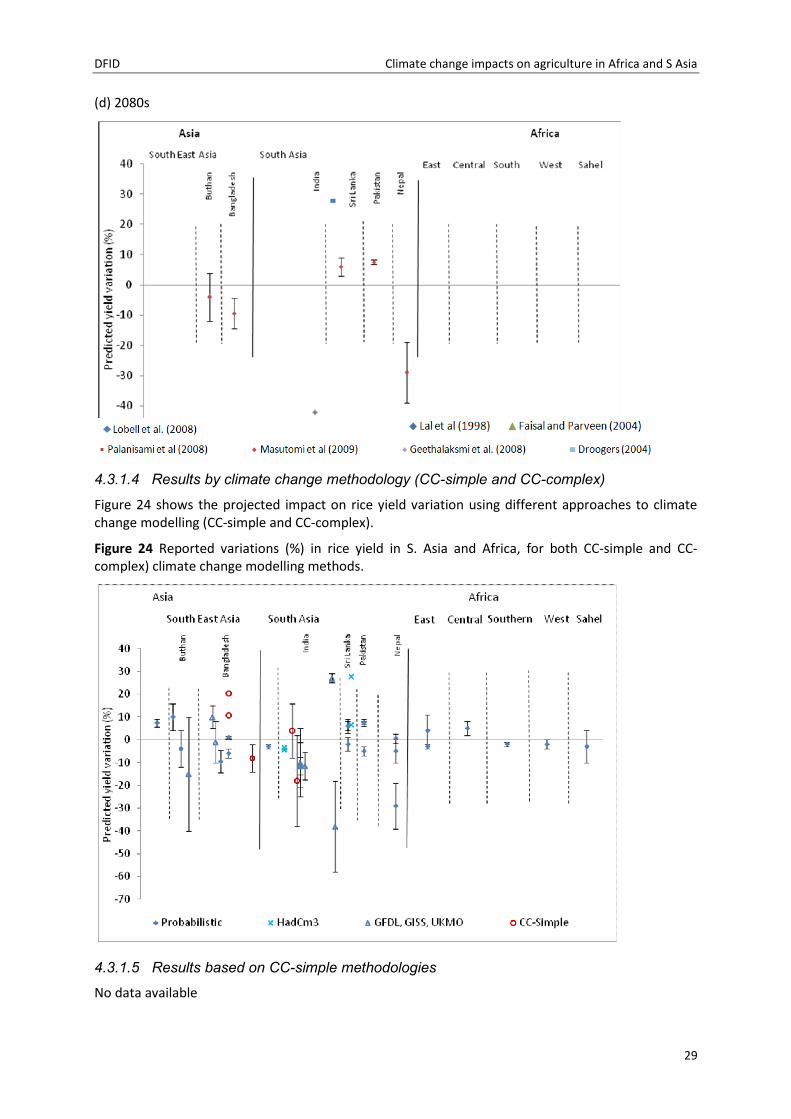
(d) 2080s
4.3.1.4 Results by climate change methodology (CC-simple and CC-complex)
Figure 24 shows the projected impact on rice yield variation using different approaches to climatechange modelling (CC-simple and CC-complex).
Figure 24 Reported variations (%) in rice yield in S. Asia and Africa, for both CC-simple and CC-complex) climate change modelling methods.
4.3.1.5 Results based on CC-simple methodologies
No data available

DFID Climate change impacts on agriculture in Africa and S Asia
30
4.3.1.6 Results by CC-complex methodologies
Figure 25 shows the results for simulations carried out using CC-complex methodologies i.e. using theGCM’s GISS, GFDL and UKMO (Mohandass and Reganathan, 1997; Krishman, 2007; Matthews et al.,1997; Mohandass et al., 1997), for an increase in temperature of 2⁰C (Mahmood, 1998) and an increase in average temperature and diurnal temperature range (Lobell 2007). Mohandass et al.,(1997) show the results for the predictions in rice yield variation in the main season (+27%) and thesecondary season (-38%).
Figure 25 Reported impacts on rice yield for the CC-complex methodologies.
DFID Climate change impacts on agriculture in Africa and S Asia
31
4.3.2 Wheat
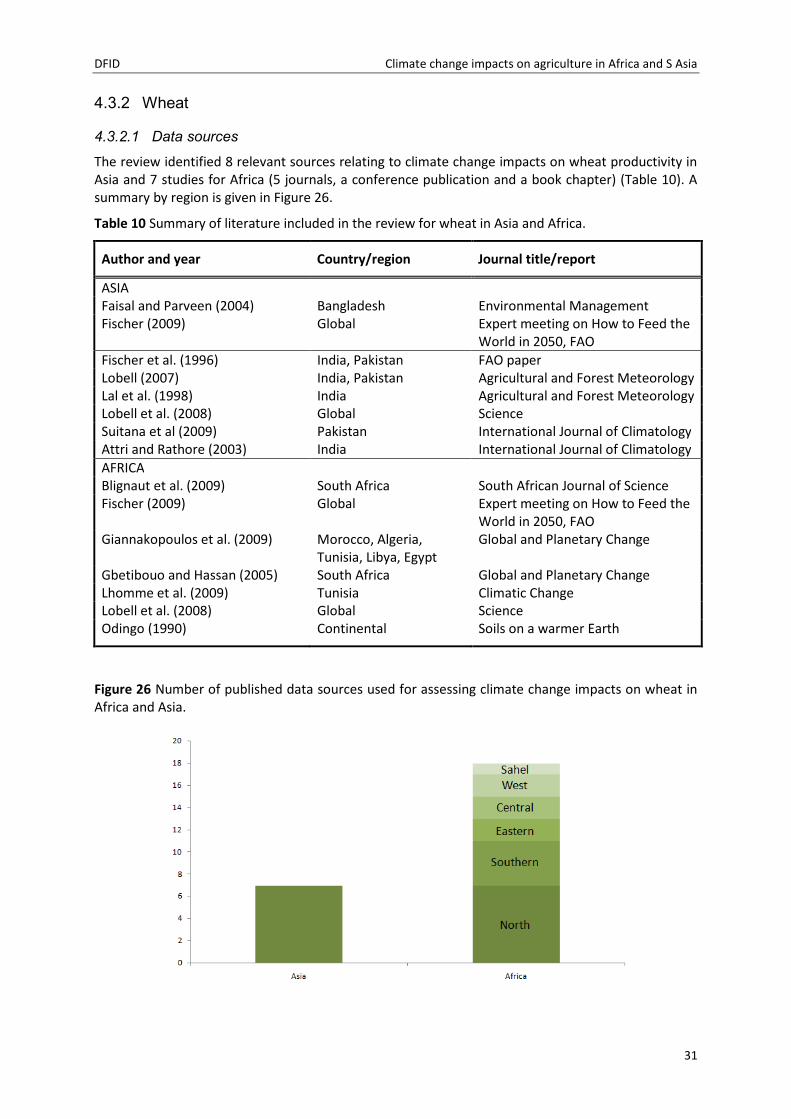
4.3.2.1 Data sources
The review identified 8 relevant sources relating to climate change impacts on wheat productivity inAsia and 7 studies for Africa (5 journals, a conference publication and a book chapter) (Table 10). Asummary by region is given in Figure 26.
Table 10 Summary of literature included in the review for wheat in Asia and Africa.
Author and year Country/region Journal title/report
ASIAFaisal and Parveen (2004) Bangladesh Environmental ManagementFischer (2009) Global Expert meeting on How to Feed the
World in 2050, FAO
Fischer et al. (1996) India, Pakistan FAO paperLobell (2007) India, Pakistan Agricultural and Forest MeteorologyLal et al. (1998) India Agricultural and Forest MeteorologyLobell et al. (2008) Global ScienceSuitana et al (2009) Pakistan International Journal of ClimatologyAttri and Rathore (2003) India International Journal of Climatology
AFRICABlignaut et al. (2009) South Africa South African Journal of ScienceFischer (2009) Global Expert meeting on How to Feed the
World in 2050, FAOGiannakopoulos et al. (2009) Morocco, Algeria,
Tunisia, Libya, EgyptGlobal and Planetary Change
Gbetibouo and Hassan (2005) South Africa Global and Planetary ChangeLhomme et al. (2009) Tunisia Climatic ChangeLobell et al. (2008) Global ScienceOdingo (1990) Continental Soils on a warmer Earth
Figure 26 Number of published data sources used for assessing climate change impacts on wheat inAfrica and Asia.

DFID Climate change impacts on agriculture in Africa and S Asia
32
4.3.2.2 Overall results
Figure 27 shows the published results regarding the projected variation in future wheat productivityin Asia and Africa, by sub-region. The general overall trend is negative. This data contains resultscorresponding to different time slices (2030s, 2050s and 2080s), emissions scenarios (Fischer et al.,1996), and studies based on variations in average temperature and diurnal temperature range(Lobell, 2007).
The yield variations were obtained using different climate scenarios (Lal et al., 1998; Attri andRathore, 2003), different GCM’s (Fischer et al., 1996) and studies based on increasing temperatureand diurnal temperature range. Attri and Rathore (2003) estimated yield variation for two differentclimatic scenarios and under irrigation and rain-fed conditions showing four different results.
Figure 27 Reported variation in wheat yield (%) with climate change for all observations.
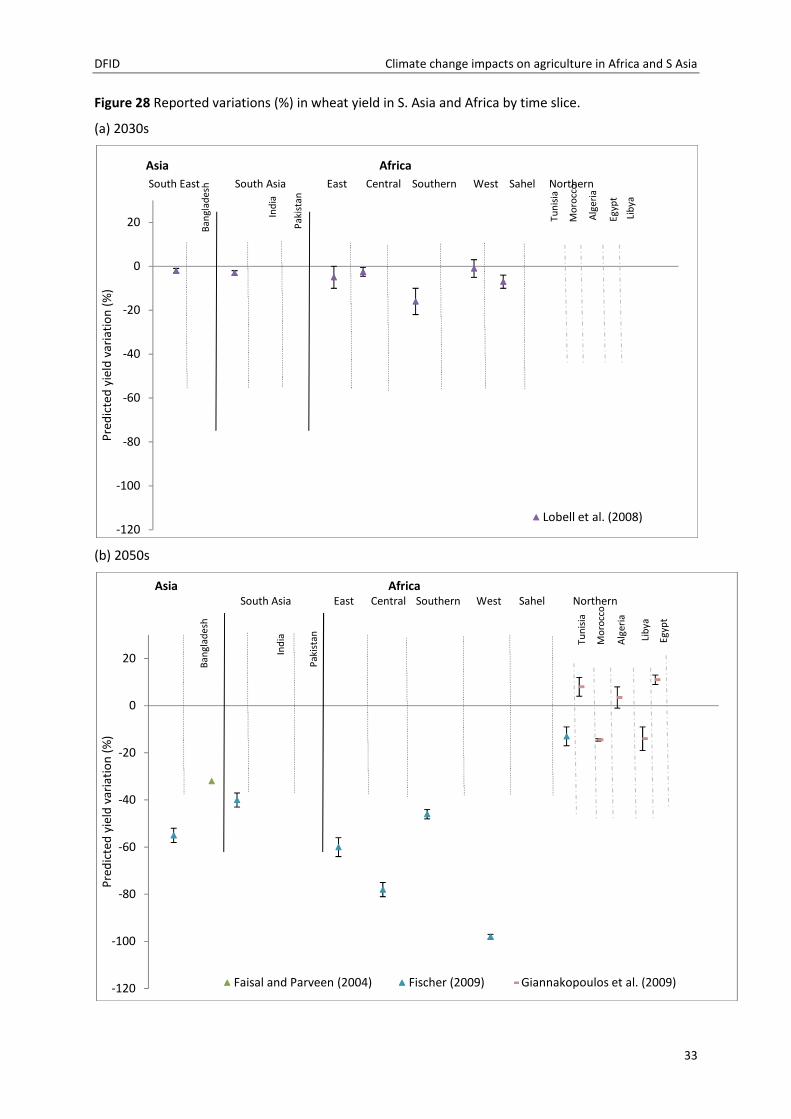
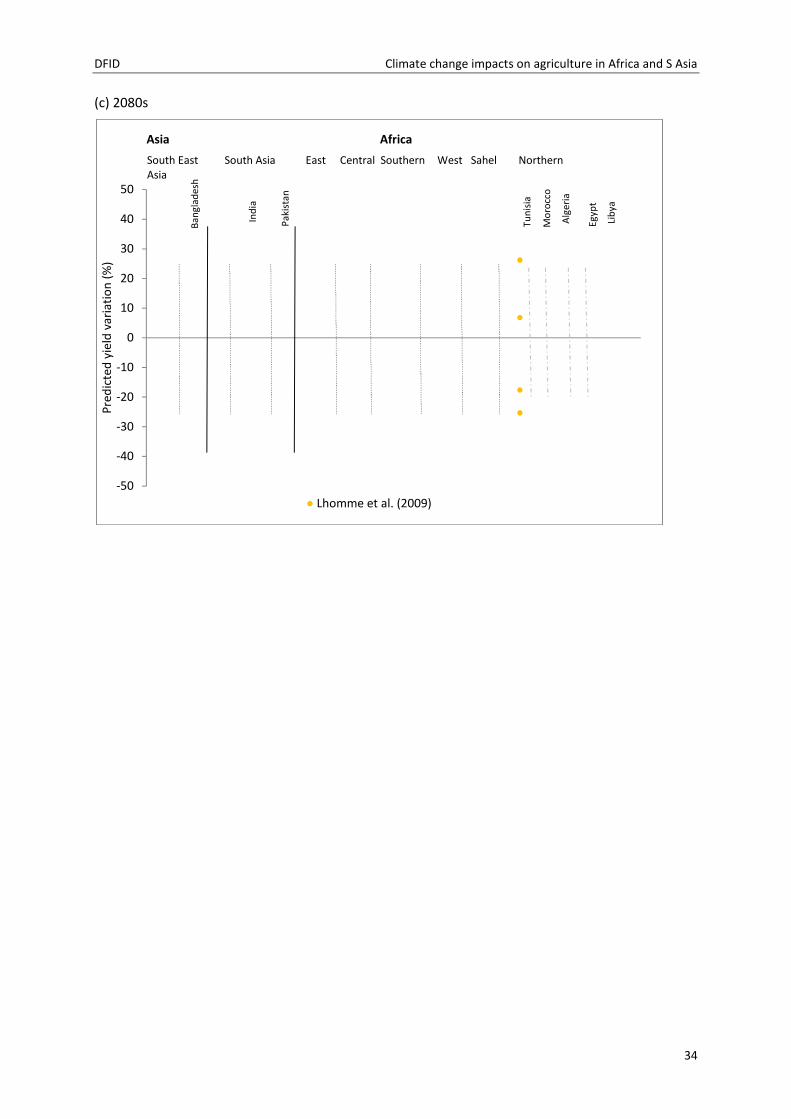
4.3.2.3 Results by time slice
Figure 28 shows the projected impact on wheat yield variation by time-slice. The predictions are allnegative. For the 2050s, the results from Giannakopoulos et al. (2009) show a predicted negativeimpact on yield for all regions, except for Northern Africa, where a small increase is predicted forwheat production in Tunisia, Algeria and Libya.
The yield variation predicted for the 2080s based on Lhomme et al. (2009) is for two differentlocations in Tunisia (Kairouan and Jendouba) and for two planting conditions. In Kaironan the yield isprojected to increase in both cases. In the case of “not prescribed sowing date” (1) the increasewould be of 26.2% and 6.8% at “Prescribed sowing date and supplemental irrigation” (2). InJendouba, climate change would have a negative impact under both conditions, namely -17.6% (1)and -25.3% (2), respectively.
-80
-60
-40
-20
0
20
40
60
Pre
dic
ted
yiel
dva
riat
ion
(%)
Lal et al (1998) Lobell (2007) Fischer et al. (1996) Attri and Rathore (2003)
South EastAsia
Asia Africa
Ban
glad
esh
South Asia
Ind
ia
Central Southern WestEast
Pak
ista
n
Tun
isia
Mo
rocc
o
Alg
eria
Egyp
t
Lib
ya
DFID Climate change impacts on agriculture in Africa and S Asia
33
Figure 28 Reported variations (%) in wheat yield in S. Asia and Africa by time slice.
(a) 2030s
(b) 2050s
-120
-100
-80
-60
-40
-20
0
20
Pre
dic
ted
yiel
dva
riat
ion
(%)
Lobell et al. (2008)
South East South Asia East Central Southern West Sahel Northern
Asia Africa
Ban
glad
esh
Ind
ia
Pak
ista
n
Tun
isia
Mo
rocc
o
Alg
eria
Egyp
t
Lib
ya
-120
-100
-80
-60
-40
-20
0
20
Pre
dic
ted
yiel
dva
riat
ion
(%)
Faisal and Parveen (2004) Fischer (2009) Giannakopoulos et al. (2009)
Asia Africa
Ban
glad
esh
South Asia
Ind
ia
Central Southern West SahelEast
Pak
ista
n
Tun
isia
Mo
rocc
o
Alg
eria
Egyp
t
Lib
ya
Northern
DFID Climate change impacts on agriculture in Africa and S Asia
34
(c) 2080s
-50
-40
-30
-20
-10
0
10
20
30
40
50
Pre
dic
ted
yiel
dva
riat
ion
(%)
Lhomme et al. (2009)
Sahel NorthernSouth EastAsia
Asia Africa
Ban
glad
esh
South Asia
Ind
ia
Central Southern WestEast
Pak
ista
n
Tun
isia
Mo
rocc
o
Alg
eria
Egyp
t
Lib
ya

DFID Climate change impacts on agriculture in Africa and S Asia
35
4.3.2.4 Results by climate change methodology (CC-simple and CC-complex)
Figure 29 shows the projected impact on wheat yield variation using different approaches to climatechange modelling (CC-simple and CC-complex).
Figure 29 Reported variations (%) in wheat yield in S. Asia and Africa using different climate changemodelling methods.
-120
-100
-80
-60
-40
-20
0
20
40
60
Pre
dic
ted
yiel
dva
riat
ion
(%)
many GCM`s Hadley GFDL, GISS, UKMO CC-simple HadCM3 ARPEGE Climate
South East Asia
Asia Africa
Ban
glad
esh
South AsiaIn
dia
Central Southern West SahelEast
Pak
ista
n
Tun
isia
Mo
rocc
o
Alg
eria
Egyp
t
Lib
ya
Northern

DFID
4.3.2.5 Results by CC-complex methodologies
Figure 30 shows the results for simulations carried out
Figure 30 Reported variations (%) in wheat yield in S. Asia and Africamethodologies.
-120
-100
-80
-60
-40
-20
0
20
40
60
Pre
dic
ted
Yiel
dva
riat
ion
(%)
Lal et al (1998)
Lobell et al. (2008)
Attri and Rathore (2003)
AsiaB
angl
ades
h
Ind
ia
South EastAsia
South Asia
Climate change impacts on agriculture in Africa and S Asia
complex methodologies
shows the results for simulations carried out using CC-complex methodologies.
Reported variations (%) in wheat yield in S. Asia and Africa for
Lobell (2007) Faisal and Parveen (2004)
Fischer (2009) Fischer et al. (1996)
Giannakopoulos et al. (2009) Lhomme et al. (2009)
Africa
Pak
ista
n
Tun
isia
Mo
rocc
o
Alg
eria
Central Southern West Sahel NorthernEast
Climate change impacts on agriculture in Africa and S Asia
36
complex methodologies.
for CC-complex based
Faisal and Parveen (2004)
Fischer et al. (1996)
Lhomme et al. (2009)
Alg
eria
Lib
ya
Egyp
t
Sahel Northern

DFID Climate change impacts on agriculture in Africa and S Asia
37
4.3.3 Maize
4.3.3.1 Data sources
For this review, evidence on the impacts of climate change on maize productivity in Asia were drawnfrom 5 peer review papers (4 journals and a conference paper). For Africa, 22 studies were analysedwith data extracted from 13 journals, two book chapters and conference proceedings (Table 11).Evidence was also drawn from Leemans and Solomon (1993) who published a study on climatechange impacts on several crops including wheat in Africa and Asia. Within the literature, a numberof studies provide data on a specific country basis.
Table 11 Summary of literature included in the review for maize in Asia and Africa.
Author and year Country/region Journal title/report
ASIALobell (2007) India Agricultural and Forest MeteorologyPatel et al. (2008) India Journal of AgrometeorologyLobell (2008) Global ScienceByjesh et al. (2010) India Mitigation & Adaptation Strategies
for Global ChangeFischer (2009) Global Expert meeting How to Feed the
World in 2050, FAO
AFRICAButt et al. (2005) Mali Climatic ChangeTingem et al. (2008) Cameroon Agronomy for Sustainable
DevelopmentTingem et al. (2009) Cameroon Climate researchLaux et al. (2010) Cameroon Agricultural and Forest MeteorologyLobell and Burke (2010) Sub-saharan Agricultural and Forest MeteorologyChipanshi et al. (2003) Botswana Climatic changeAdejuwon (2005) Nigeria Singapore Journal of Tropical
GeographyBlignaut et al. (2009) South Africa South African Journal of ScienceWalker and Schulze (2008) South Africa Agriculture, Ecosystems and
EnvironmentMati (2000) Kenya Journal of Arid EnvironmentsWalker and Schulze (2008) South Africa Physics and Chemistry of the EarthGiannakopoulos et al. (2009 Morocco, Algeria, Tunisia,
Libya, EgyptGlobal and Planetary Change
Gbetibouo and Hassan(2005)
South Africa Global and Planetary Change
Thornton et al. (2009 Eastern Africa Global Environmental ChangeSchulze et al (1993) Southern Africa Global Environmental ChangeJones and Thornton (2003) Angola, Benin, Botswana,
Burkina Faso, Burundi,Cameroon, Central Africa,Chad, DR Congo, Congo, Côted’Ivoir, Equatorial Guinea,Eritrea, Ethiopia, Gabon,Gambia, Ghana, Guinea,Guinea-Bissau, Kenya,Lesotho, Liberia, Madagascar,
Global Environmental Change

DFID Climate change impacts on agriculture in Africa and S Asia
38
Malawi, Mali, Mauritania,Morocco, Mozambique,Namibia, Niger, Nigeria,Rwanda, Senegal, SierraLeone, Somalia, Sudan,Swaziland, Tanzania, Togo,Uganda, Zambia, Zimbabwe
Abraha and Savage (2006) South Africa Agriculture, Ecosystems andEnvironment
Makadho (1996) Zimbabwe Climate ResearchMuchena and Iglesias (1995) Zimbabwe Climate Change and Agriculture:
Analysis of Potential InternationalImpacts (Book)
Odingo (1990) Continantal Soils on a Warmer Earth (Book)Lobell et al (2008) Global ScienceFischer (2009) Global FAO Expert Meeting on How to Feed
the World in 2050
Other studies report their findings for larger regions: Jones and Thornton (2003), Lobell et al. (2008),Leemans and Solomon (1993), Odingo (1990), Fischer (2009), Thornton et al. (2009), Schulze et al(1993), Lobell and Burke (2010). An overall summary of the published sources for each sub-region inAsia and Africa is given in Figure 31. However, it is important to note that in some instances a singlepublication (e.g. Jones and Thornton, 2003) can often refer to a large number of countries, thusdistorting the split between regions.
Figure 31 Number of published data sources used for assessing climate change impacts on maize inAfrica and Asia.
4.3.3.2 Overall results
Figure 32 shows the projected variations in maize yield in Asia for all time slices, and the results ofthe scenarios simulated by Lobell (2007) who predicted yield using increasing average temperatureand the diurnal temperature range. The results of the study driven by Byjesh et al. (2010) are givenfor monsoon and winter maize for 3 regions in India: the Upper Indo-Gangic Plain (UIGP), Middle andEastern Ingo-Gangic Plain (MIGP), and Southern Plateau (SP).

DFID Climate change impacts on agriculture in Africa and S Asia
39
Figure 32 Reported variation in maize yield with climate change in Asia for all time slices and byincreasing average temperature and diurnal temperature range.
4.3.3.3 Results by time slice
Figure 33 shows the predictions in maize yield variation for all time slices (2020s, 2030s, 2050s, and2080s) in Africa. For the 2020s, results relate to Cameroon (Laux et al., 2010; Gbetibouo and Hassan,2005) and for 4 regions in Kenya (Thornton et al., 2009). The impacts of climate change in the 2020’sappear to be positive in Cameroon, and West and central Kenya, where the increase in productivitycould be as much as 30% (Thornton et al., 2009). The forecasted yield variation for the decade of the2030’s contains the predictions of the global study by Lobell et al. (2008), and the work on Kenyanproductivity from Thornton et al. (2009), and Mati (2000). Climate change effects will be positive inKenya (60% and 10% increase estimated by Thornton et al., 2009; and only in Kichaka Simba theestimated yield variation is negative, against the other 3 regions (Mati, 2000).
Figure 33c shows what the variation in productivity in the 2050’s will look like according to Fischer(2009) and Thornton et al. (2009) for large regions, and to Giannakopoulos et al. (2009), Byjesh et al.(2010), Chipanshi et al. (2003), Thornton et al. (2009),and Jones and Thornton (2003) for severalcountries. It has to be noted, that the original work of Giannakopoulos et al. (2009) expresses theyield variation for 2031-2060, but has been included in this as part of the predictions for the 2050s.Most of the predictions for this decade are negative, however, for some regions like West Kenya,Lesotho and Morocco the predictions are positive. According to Fischer (2009), maize yield variationwill be positive in East, Central and Northern Africa. The forecasted yield variation in Africa for the2080s includes data from Tingem et al. (2009) and Laux et al. (2010). The effects of climate changeare forecast to negatively affect maize productivity in Cameroon in the 2080s (see Figure 33d).
-70
-60
-50
-40
-30
-20
-10
0
10
20
Pre
dic
ted
yiel
dva
riat
ion
(%)
Lobell (2007) Fischer (2009): 2050's Lobell et al (2008):2030's
Byjesh et al. (2010):2020's Byjesh et al. (2010):2050's Byjesh et al. (2010):2080's
Ind
ia
MIGP SP
Mo
nso
on
Win
ter
Mo
nso
on
Win
ter
South East Asia South Asia
Ind
ia
UIGP
Mo
nso
on
Win
ter

DFID Climate change impacts on agriculture in Africa and S Asia
40
Figure 33 Summary of projected variations in maize yield (%) in Africa by time slice.
(a) 2020s
(b) 2030s
-100
-50
0
50
100
150
Yie
ldva
riat
ion
(%)
Laux et al (2010) Thornton et al. (2009) Gbetibouo and Hassan (2005)
East Africa Central Africa Southern Africa West Africa Sahel Northern Africa
Ken
ya
Cam
ero
on
-100
-50
0
50
100
150
Yiel
dva
riat
ion
(%)
Lobell et al (2008) Thornton et al. (2009)
East Africa Central Africa Southern Africa West Africa Sahel Northern Africa
Ken
ya
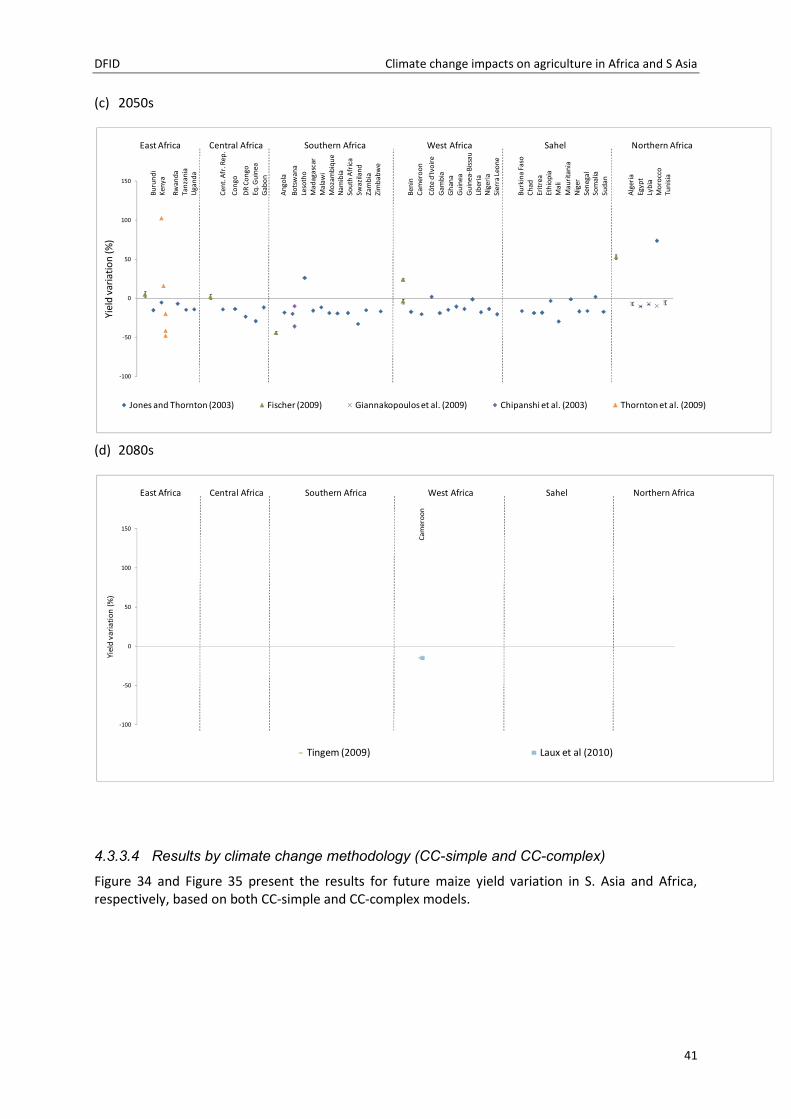
DFID Climate change impacts on agriculture in Africa and S Asia
41
(c) 2050s
(d) 2080s
4.3.3.4 Results by climate change methodology (CC-simple and CC-complex)
Figure 34 and Figure 35 present the results for future maize yield variation in S. Asia and Africa,respectively, based on both CC-simple and CC-complex models.
-100
-50
0
50
100
150
Yiel
dva
riat
ion
(%)
Jones and Thornton (2003) Fischer (2009) Giannakopoulos et al. (2009) Chipanshi et al. (2003) Thornton et al. (2009)
East Africa Central Africa Southern Africa West Africa Sahel Northern AfricaB
uru
nd
iK
enya
Rw
and
aTa
nza
nia
Uga
nd
a
Cen
t.A
fr.R
ep.
Co
ngo
DR
Co
ngo
Eq.G
uin
eaG
abo
n
An
gola
Bo
tsw
ana
Leso
tho
Mad
agas
car
Mal
awi
Mo
zam
biq
ue
Nam
ibia
Sou
thA
fric
aSw
azila
nd
Zam
bia
Zim
bab
we
Ben
inC
amer
oo
n
Cô
ted
'Ivo
ire
Gam
bia
Gh
ana
Gu
inea
Gu
inea
-Bis
sau
Lib
eria
Nig
eria
Sier
raLe
on
e
Bu
rkin
aFa
soC
had
Erit
rea
Eth
iop
iaM
ali
Mau
rita
nia
Nig
erSe
neg
alSo
mal
iaSu
dan
Alg
eria
Egyp
tLy
bia
Mo
rocc
oTu
nis
ia
-100
-50
0
50
100
150
Yiel
dva
riat
ion
(%)
Tingem (2009) Laux et al (2010)
East Africa Central Africa Southern Africa West Africa Sahel Northern Africa
Bu
run
di
Ken
ya
Rw
and
aTa
nza
nia
Uga
nd
a
Cen
t.A
fr.R
ep.
Co
ngo
DR
Co
ngo
Eq.G
uin
eaG
abo
n
An
gola
Bo
tsw
ana
Leso
tho
Mad
agas
car
Mal
awi
Mo
zam
biq
ue
Nam
ibia
Sou
thA
fric
aSw
azila
nd
Zam
bia
Zim
bab
we
Ben
inC
amer
oo
n
Cô
ted
'Ivo
ire
Gam
bia
Gh
ana
Gu
inea
Gu
inea
-Bis
sau
Lib
eria
Nig
eria
Sier
raLe
on
e
Bu
rkin
aFa
soC
had
Erit
rea
Eth
iop
iaM
ali
Mau
rita
nia
Nig
erSe
neg
alSo
mal
iaSu
dan
Alg
eria
Egyp
tLy
bia
Mo
rocc
oTu
nis
ia

DFID Climate change impacts on agriculture in Africa and S Asia
42
Figure 34 Summary of reported variations in maize yield (%) in S. Asia using different climatemethods (CC-simple and CC-complex).
Figure 35 Summary of projected variations in maize yield (%) in Africa with different methods (CC-simple and CC-complex).
-70
-60
-50
-40
-30
-20
-10
0
10
20
Pre
dic
ted
yiel
dva
riat
ion
(%)
Hadley Statistical Probabilistic HadCM3
Ind
ia
MIGP SP
Mo
nso
on
Win
ter
Mo
nso
on
Win
ter
Mo
nso
on
Win
ter
UIGP
South East Asia South Asia
-100
-50
0
50
100
150
Yiel
dva
riat
ion
(%)
HadCM3 CC-Simple Hadley many GCM's HADCM GISS, HadCM3 UKTR, CCC, OSU HadCM3, ECHam4 GISS, GFDL, UKMO CGCM GFDL, CCCM
East Africa Central Africa Southern Africa West Africa Sahel Northern Africa
Bu
run
di
Ken
ya
Rw
and
aTa
nza
nia
Uga
nd
a
Cen
t.A
fr.R
ep.
Co
ngo
DR
Co
ngo
Eq.G
uin
eaG
abo
n
An
gola
Bo
tsw
ana
Leso
tho
Mad
agas
car
Mal
awi
Mo
zam
biq
ue
Nam
ibia
Sou
thA
fric
aSw
azila
nd
Zam
bia
Zim
bab
we
Ben
inC
amer
oo
n
Cô
ted
'Ivo
ire
Gam
bia
Gh
ana
Gu
inea
Gu
inea
-Bis
sau
Lib
eria
Nig
eria
Sier
raLe
on
e
Bu
rkin
aFa
soC
had
Erit
rea
Eth
iop
iaM
ali
Mau
rita
nia
Nig
erSe
neg
alSo
mal
iaSu
dan
Alg
eria
Egyp
tLy
bia
Mo
rocc
oTu
nis
ia

DFID Climate change impacts on agriculture in Africa and S Asia
43
4.3.3.5 Results by climate change methodology (CC-complex)
Figure 36 Summary of projected variations in maize yield (%) in Africa for all time slices, based on CC-complex methodologies.
Figure 37 shows the results of Butt et al. (2005), Odingo (1990), Thornton et al. (2009), Walker andSchulze (2008), Schulze et al. (1993), Makadho, (1996), Lobell and Buerke (2010), and Muchena andIglesias (1995), for different GCM’s (Walker and Schulze, 2008; Muchena and Iglesias, 1995) and fixscenarios (Lobell and Burke, 2010). The predicted effects are negative for Mali (Butt et al., 2005),South Africa (Schulze et al., 1993; Walker and Schulze, 2008) and Central Africa (Lobell and Burke,2010). In Zimbabwe, Makadho (1996) predicted positive effects (up to 140%) in different location andunder different planting dates, while Muchena and Iglesias (1995) predicted yield variations of -50%to -14% in others.
-100
-50
0
50
100
150
Yiel
dva
riat
ion
(%)
Jones and Thornton (2003) Lobell (2007) Fischer (2009) Lobell et al (2008):2030's Byjesh et al. (2010):2020's Lobell et al (2008)
Butt et al. (2005) Tingem (2009) Chipanshi et al. (2003) Laux et al (2010) Thornton et al. (2009) Walker and Schulze (2008)
Schulze et al. (1993) Makadho, 1996 Lobell and Burke (2010) Giannakopoulos et al. (2009) Gbetibouo and Hassan (2005) Muchena and Iglesisas (1995)
East Africa Central Africa Southern Africa West Africa Sahel Northern Africa

DFID Climate change impacts on agriculture in Africa and S Asia
44
Figure 37 Predicted variation of maize yield under climate change effects in Africa using GCM's (GISS,GFDL, UKMO, HadCM2, and CSM) and non specific time slices.
-100
-50
0
50
100
150
Yiel
dva
riat
ion
(%)
Butt et al. (2005) Walker and Schulze (2008) Schulze et al. (1993) Makadho (1996) Lobell and Burke (2010) Muchena and Iglesisas (1995)
East Africa Central Africa Southern Africa West Africa Sahel Northern AfricaB
uru
nd
iK
enya
Rw
and
aTa
nza
nia
Uga
nd
a
Cen
t.A
fr.R
ep.
Co
ngo
DR
Co
ngo
Eq.G
uin
eaG
abo
n
An
gola
Bo
tsw
ana
Leso
tho
Mad
agas
car
Mal
awi
Mo
zam
biq
ue
Nam
ibia
Sou
thA
fric
aSw
azila
nd
Zam
bia
Zim
bab
we
Ben
inC
amer
oo
n
Cô
ted
'Ivo
ire
Gam
bia
Gh
ana
Gu
inea
Gu
inea
-Bis
sau
Lib
eria
Nig
eria
Sier
raLe
on
e
Bu
rkin
aFa
soC
had
Erit
rea
Eth
iop
iaM
ali
Mau
rita
nia
Nig
erSe
neg
alSo
mal
iaSu
dan
Alg
eria
Egyp
tLy
bia
Mo
rocc
oTu
nis
ia

DFID Climate change impacts on agriculture in Africa and S Asia
45
4.3.4 Sorghum
4.3.4.1 Data sources
For this review, evidence on the impacts of climate change on sorghum productivity in Asia wasdrawn from 3 peer review papers (2 journals and a book chapter). For Africa, 7 papers were analysedwith data extracted from 6 journals (Table 12).
Table 12 Summary of literature included in the review for sorghum in S. Asia and Africa.
Author and year Country/region Journal title/report
ASIALobell et al (2008) Global ScienceSrivastava et al. (2010) India Agriculture, Ecosystems and EnvironmentRao et al. (1995) India Climate change and agriculture: analysis of
potential international impacts
AFRICALobell et al. (2008) Global ScienceTingem et al. (2009) Cameroon Agronomy for Sustainable DevelopmentTingem et al (2008) Cameroon Climate ResearchButt et al. (2005) Mali Climatic ChangeChipanshi et al. (2003) Botswana Climatic ChangeGbetibouo and Hassan (2005) South Africa Global and Planetary ChangeAdejuwon (2005) Nigeria Singapore Journal of Tropical Geography
Many of the studies are country specific, for example, Tingem et al. (2008; 2009) focus in Cameroon,Butt et al. (2005) in Mali, Chipanshi et al. (2003) in Botswana, Gbetibouo and Hassan (2005) in SouthAfrica, Adejuwon (2005) in Nigeria, and Srivastava et al. (2010) and Rao et al. (1995) in India. Thestudy reported here by Lobell et al (2008) provides a global assessment. As before, data fromAdejuwon (2005) and Gbetibouo and Hassan (2005) are not included in the following analyses, sincetheir data is not compatible with the other studies. An overall summary of the published sources foreach sub-region in Asia and Africa is given in Figure 38.
Figure 38 Number of published data sources used for assessing climate change impacts on sorghumin Africa and Asia.
SouthAsia

DFID Climate change impacts on agriculture in Africa and S Asia
46
4.3.4.2 Overall results
A summary of the results for all observations for sorghum in S. Asia and Africa is given Figure 39.
Figure 39 Reported variation in sorghum yield with climate change in Asia and Africa for allobservations.
4.3.4.3 Results by time slice
Figure 40 shows the predicted variation in yield productivity for the time period of the 2020’s. Itshows the results of Srivastrana (2010) for India. Sorghum yield is predicted to reduce in the 2020’sby 2% in the South-Central Zone (SCZ), and by 14% in the Central Zone (CZ) and South-West Zone(SWZ) in monsoon season. Winter productivity was estimated to reduce by 7% (Srivastava, 2010).
-50
-40
-30
-20
-10
0
10
20
Pre
dic
ted
yie
ldva
riat
ion
(%)
Lobell et al. (2008) Srivastava (2010) Rao et al. (1995)
Tingem et al. (2009) Chipanshi et al. (2003) Butt et al. (2005)
South AsiaIn
dia
Bo
tsw
an
a
Cam
ero
on
Ma
li
Asia Africa
East Central Southern West Sahel

DFID Climate change impacts on agriculture in Africa and S Asia
47
Figure 40 Summary of projected variations in sorghum yield (%) in Asia and Africa by time slice.
(a) 2020s
(b) 2030s
-20
-15
-10
-5
0
5
10
15
20
Pre
dic
ted
yie
ldva
riat
ion
(%)
Srivastrava (2010) Gbetibouo and Hassan (2005)
South Asia
Ind
ia
Cam
ero
on
East Central Southern West Sahel
Asia Africa
-15
-10
-5
0
5
10
15
20
Pre
dic
ted
yie
ldva
riat
ion
(%)
Lobell et al (2008)
South Asia
Indi
a
Cam
ero
on
East Central Southern West Sahel
Asia Africa

DFID Climate change impacts on agriculture in Africa and S Asia
48
(c) 2050s
(d) 2080s
In Figure 41 the projections for the 2020s (green), 2050s (red) and 2080s (blue) shows the forecastchanges in sorghum productivity over time. It is apparent that yield is forecast to reduce in India.
-40
-30
-20
-10
0
10
20
Pre
dic
ted
yie
ldva
riat
ion
(%)
Srivastava (2010):2050 Chipanshi et al. (2003)
South Asia CentralAfrica
SouthernAfrica
WestAfrica
SahelEastAfrica
Asia Africa
Ind
ia
Bo
tsw
ana
-50
-40
-30
-20
-10
0
10
20
Pre
dic
ted
yie
ldva
riat
ion
(%)
Srivastava (2010): 2020 Gbetibouo and Hassan (2005)
Tingem et al. (2009)
South Asia
Ind
ia
Central
Africa
Southern
Africa
West
Africa
Sahel
Cam
ero
on
East
Africa
Asia Africa

DFID Climate change impacts on agriculture in Africa and S Asia
49
Figure 41 Predicted variation of sorghum yield productivity under climate change effects in Africaand Asia, by the 2020s, 2050s, and 2080s.
Figure 42 shows the variation obtained using the HadCM and CGCM GCMs (Butt et al., 2005) andfixed scenarios combining CO2 atmospheric concentration variations and crop stress status.
Figure 42 Predicted variation of sorghum yield productivity under climate change effects in Africaand Asia, based on predictions using GCM's (HadCM and CGCM) and fixed scenarios.
-50
-40
-30
-20
-10
0
10
20
Pre
dic
ted
yie
ldva
riat
ion
(%)
Srivastava (2010): 2020 Gbetibouo and Hassan (2005)
Srivastava (2010):2050 Chipanshi et al. (2003)
Srivastava (2010):2080 Tingem et al. (2009)
Gbetibouo and Hassan (2005)
South Asia
Ind
ia
Central
Africa
SouthernAfrica
WestAfrica
Sahel
Cam
ero
on
Bo
tsw
ana
East
Africa
Asia Africa
-20
-15
-10
-5
0
5
10
15
20
Pre
dic
ted
yie
ldva
riat
ion
(%)
Rao et al (1995) Butt et al. (2005)
South Asia
Ind
ia
Central
Africa
Southern
Africa
West
Africa
Sahel
Mal
i
East
Africa
Asia Africa
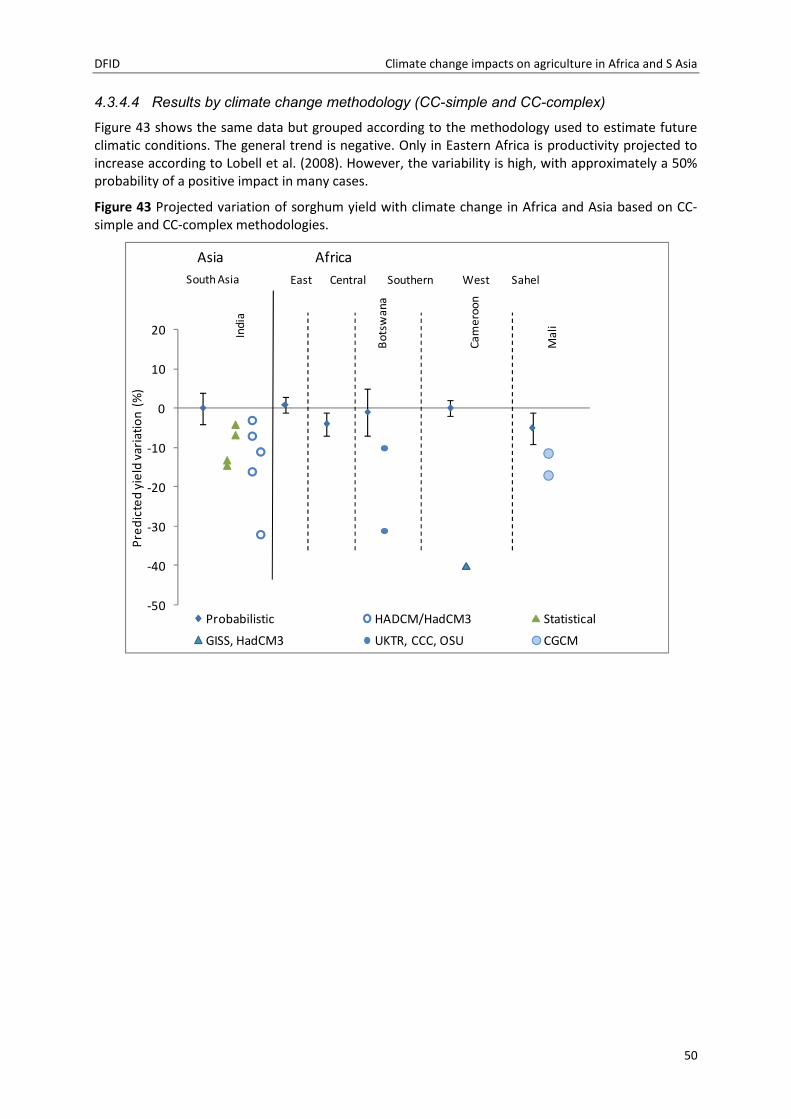
DFID Climate change impacts on agriculture in Africa and S Asia
50
4.3.4.4 Results by climate change methodology (CC-simple and CC-complex)
Figure 43 shows the same data but grouped according to the methodology used to estimate futureclimatic conditions. The general trend is negative. Only in Eastern Africa is productivity projected toincrease according to Lobell et al. (2008). However, the variability is high, with approximately a 50%probability of a positive impact in many cases.
Figure 43 Projected variation of sorghum yield with climate change in Africa and Asia based on CC-simple and CC-complex methodologies.
-50
-40
-30
-20
-10
0
10
20
Pre
dic
ted
yie
ldva
riat
ion
(%)
Probabilistic HADCM/HadCM3 Statistical
GISS, HadCM3 UKTR, CCC, OSU CGCM
South Asia
Ind
ia
Bo
tsw
an
a
Ca
me
roo
n
Ma
li
East Central Southern West Sahel
Asia Africa
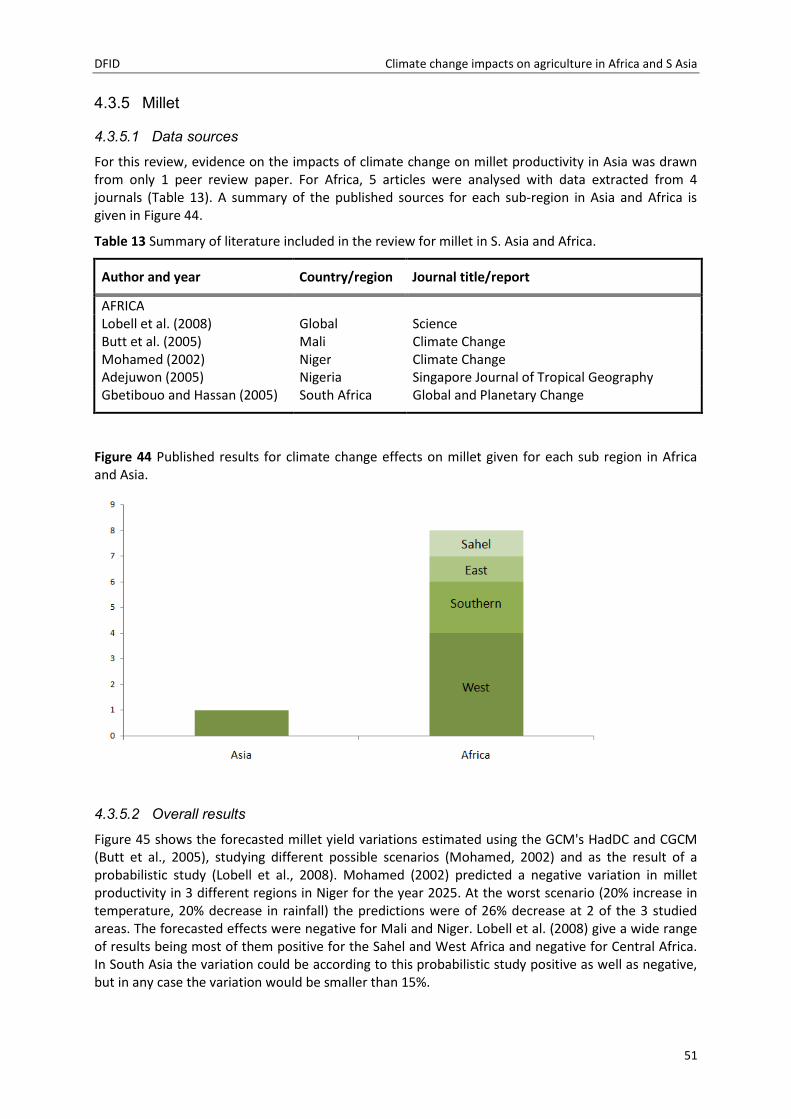
DFID Climate change impacts on agriculture in Africa and S Asia
51
4.3.5 Millet
4.3.5.1 Data sources
For this review, evidence on the impacts of climate change on millet productivity in Asia was drawnfrom only 1 peer review paper. For Africa, 5 articles were analysed with data extracted from 4journals (Table 13). A summary of the published sources for each sub-region in Asia and Africa isgiven in Figure 44.
Table 13 Summary of literature included in the review for millet in S. Asia and Africa.
Author and year Country/region Journal title/report
AFRICALobell et al. (2008) Global ScienceButt et al. (2005) Mali Climate ChangeMohamed (2002) Niger Climate ChangeAdejuwon (2005) Nigeria Singapore Journal of Tropical GeographyGbetibouo and Hassan (2005) South Africa Global and Planetary Change
Figure 44 Published results for climate change effects on millet given for each sub region in Africaand Asia.
4.3.5.2 Overall results
Figure 45 shows the forecasted millet yield variations estimated using the GCM's HadDC and CGCM(Butt et al., 2005), studying different possible scenarios (Mohamed, 2002) and as the result of aprobabilistic study (Lobell et al., 2008). Mohamed (2002) predicted a negative variation in milletproductivity in 3 different regions in Niger for the year 2025. At the worst scenario (20% increase intemperature, 20% decrease in rainfall) the predictions were of 26% decrease at 2 of the 3 studiedareas. The forecasted effects were negative for Mali and Niger. Lobell et al. (2008) give a wide rangeof results being most of them positive for the Sahel and West Africa and negative for Central Africa.In South Asia the variation could be according to this probabilistic study positive as well as negative,but in any case the variation would be smaller than 15%.

DFID Climate change impacts on agriculture in Africa and S Asia
52
Figure 45 Estimated millet yield variations according to Lobell et al. (2008), Butt et al. (2005), andMohamed (2002) for the 2030s.
4.3.5.3 Results by time slice
Insufficient data for analysis
-30
-25
-20
-15
-10
-5
0
5
10
Pre
dic
ted
yie
ldva
riat
ion
(%)
Lobell et al. (2008) Butt et al. (2005) Mohamed (2002)
South Asia West Africa Central Africa Sahel
Mal
i
Nig
er
Asia Africa
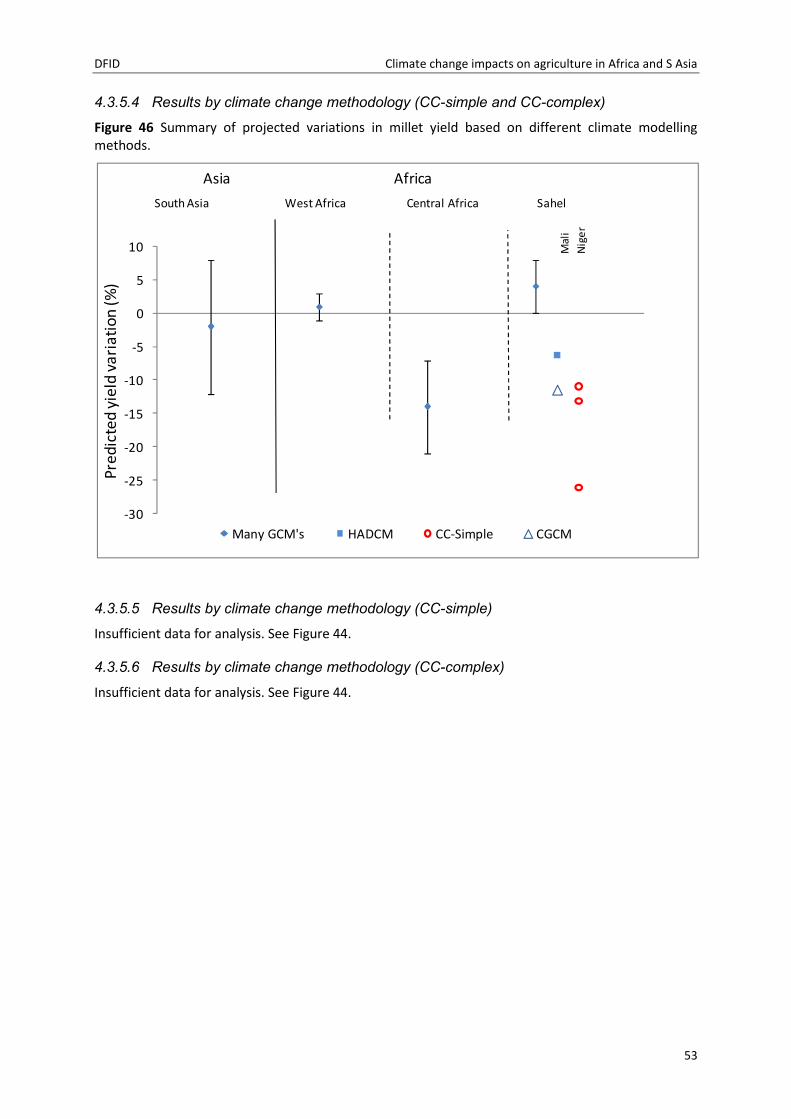
DFID Climate change impacts on agriculture in Africa and S Asia
53
4.3.5.4 Results by climate change methodology (CC-simple and CC-complex)
Figure 46 Summary of projected variations in millet yield based on different climate modellingmethods.
4.3.5.5 Results by climate change methodology (CC-simple)
Insufficient data for analysis. See Figure 44.
4.3.5.6 Results by climate change methodology (CC-complex)
Insufficient data for analysis. See Figure 44.
-30
-25
-20
-15
-10
-5
0
5
10
Pre
dic
ted
yie
ldva
ria
tio
n(%
)
Many GCM's HADCM CC-Simple CGCM
Mal
i
Nig
er
South Asia West Africa Central Africa Sahel
Asia Africa

DFID Climate change impacts on agriculture in Africa and S Asia
54
4.3.6 Cassava
4.3.6.1 Data sources
For this review, evidence on the impacts of climate change on cassava productivity in Asia was drawnfrom 1 peer review paper. For Africa, 2 papers were analysed with data extracted from a journal andenvironmental report (Table 14).
Table 14 Summary of literature included in the review for cassava in S. Asia and Africa.
Author and year Country/region Journal title/report
ASIALobell et al. (2008) Global Science
AFRICALobell et al (2008) Global ScienceAdejuwon (2005) Nigeria Singapore Journal of Tropical GeographySagoe (2008) Ghana Environmental Protection Agency (EPA), Accra-Ghana
The global probabilistic study by Lobell et al. (2008) presents the results at a continental or regionalbasis. A summary of the published sources for each sub-region in Asia and Africa is given in Figure 47.
Figure 47 Number of published data sources used for assessing climate change impacts on cassava inAfrica and Asia.
4.3.6.2 Overall results
Figure 48 shows the predicted yield variation in cassava crop productivity with climate change in Asiaand Africa. The results are for the decade of the 2030’s (Lobell et al., 2008), for two differentlocations and scenarios (Mohamed, 2002), and estimated using the GCM’s HadCM and CGCM (Buttet al., 2005). Leemans and Solomon (1993) predict a small increase in the overall productivity of Asiaand Africa. The forecasted variability is positive for West African cassava productivity (Lobell et al.,2008), but not for Ghana, where by 2080 the decrease will be up to 53% (Regina, 2006). In South EastAsia, and Eastern and Central Africa the effects might be slightly negative, while in Southern Africathe productivity will remain approximately the same. It could be said that the effects on millet crop

DFID Climate change impacts on agriculture in Africa and S Asia
55
productivity will not be very severe for the first half of the 21st century, but they will be in Ghana inthe 2080s.
Figure 48 Predicted yield variation in cassava under climate change effects in Asia and Africaaccording to Lobell et al. (2008), Mohamed (2002) and Butt et al. (2005).
4.3.6.3 Results by time slice
Insufficient data for analysis.
4.3.6.4 Results by climate change methodology (CC-simple and CC-complex)
Figure 49 Predicted yield variation for cassava under climate change effects estimated with CC-complex and C-simple methods.
-60
-50
-40
-30
-20
-10
0
10
Pre
dic
ted
yiel
dva
riat
ion
(%)
Lobell et al. (2008) Regina (2006) Leemans and Solomon (1993)
Asia andAfrica
Asia Africa
South East East Central Southern West
Gh
ana
-60
-50
-40
-30
-20
-10
0
10
Pre
dic
ted
yiel
dva
riat
ion
(%)
Many GCM's CC-simple GFDL
Asia andAfrica
Asia Africa
South East East Central Southern West
Gh
ana

DFID Climate change impacts on agriculture in Africa and S Asia
56
4.3.6.5 Results by climate change methodology (CC-simple)
Insufficient data for analysis.
4.3.6.6 Results by climate change methodology (CC-complex)
Insufficient data for analysis.

DFID Climate change impacts on agriculture in Africa and S Asia
57
4.3.7 Sugarcane
4.3.7.1 Data sources
For this review, evidence on the impacts of climate change on sugarcane productivity in Asia wasdrawn from 2 peer review papers. Similarly, for Africa, 2 papers were analysed with data extractedfrom 2 journals (Table 15). Whilst the study by Lobell et al. (2008) is a global scale assessment, theother publications focus on sugarcane productivity in India and Swaziland. A summary of thepublished sources for each sub-region in Asia and Africa is given in Figure 50.
Table 15 Summary of literature included in the review for sugarcane in S. Asia and Africa.
Author and year Country/region Journal title/report
ASIALobell et al. (2008) Global SciencePalanisami et al (2008) India
AFRICALobell et al (2008) Global ScienceKnox et. al (2010) Swaziland Agricultural Systems
Figure 50 Number of published data sources used for assessing climate change impacts on sugarcanein Africa and Asia.
4.3.7.2 Overall results
Figure 51 shows the results of the studies for the future periods 2020s, 2030s and 2050s. Thepredictions for Indian sugarcane yield variation for the 2020s and 2050s were estimated using theGCM HadCM3 (Palanisami et al., 2008). The predictions for Swaziland are the result of the study ofirrigation requirements by year 2050 (Knox et al., 2010). Lobell et al. (2008) predicts positive effectson sugarcane productivity for the 2030s in South East Asia and negative in Southern Africa. The rangeof values that the variability could take in South Asia and East Africa are positive and negativeaccording to this study. However, in India the predicted yield variation in the 2020s and 2050s isnegative (-13% and -9%), being more severe in 2020 than in 2050 (Palanisami et al., 2008). The studyby Knox et al. (2010) predicts an increase in sugarcane crop yield in Swaziland for an increase inirrigation requirements in the 2050s.

DFID Climate change impacts on agriculture in Africa and S Asia
58
Figure 51 Reported variation in sugarcane yield with climate change in Asia and Africa for allobservations.
4.3.7.3 Results by time slice
Insufficient data for analysis
4.3.7.4 Results by climate change methodology (CC-simple and CC-complex)
Figure 52 Projected yield variation in sugarcane with climate change in S. Asia and Africa using CC-simple and CC-complex modelling methods.
-15
-10
-5
0
5
10
15
20
Pre
dic
ted
yiel
dva
riat
ion
(%)
Lobell et al. (2008) Palanisami et al. (2008) Knox et al. 2010
South East Asia South Asia
Africa
East Africa Southern Africa
Asia
Ind
ia
Swaz
ilan
d
-15
-10
-5
0
5
10
15
20
Pre
dic
ted
yie
ldva
riat
ion
(%)
many GCM's HadCM3
South East Asia South Asia
Africa
East Africa Southern Africa
Ind
ia
Swaz
ilan
d

DFID Climate change impacts on agriculture in Africa and S Asia
59
4.3.7.5 Results by climate change methodology (CC-simple)
Insufficient data for analysis.
4.3.7.6 Results by climate change methodology (CC-complex)
Insufficient data for analysis.
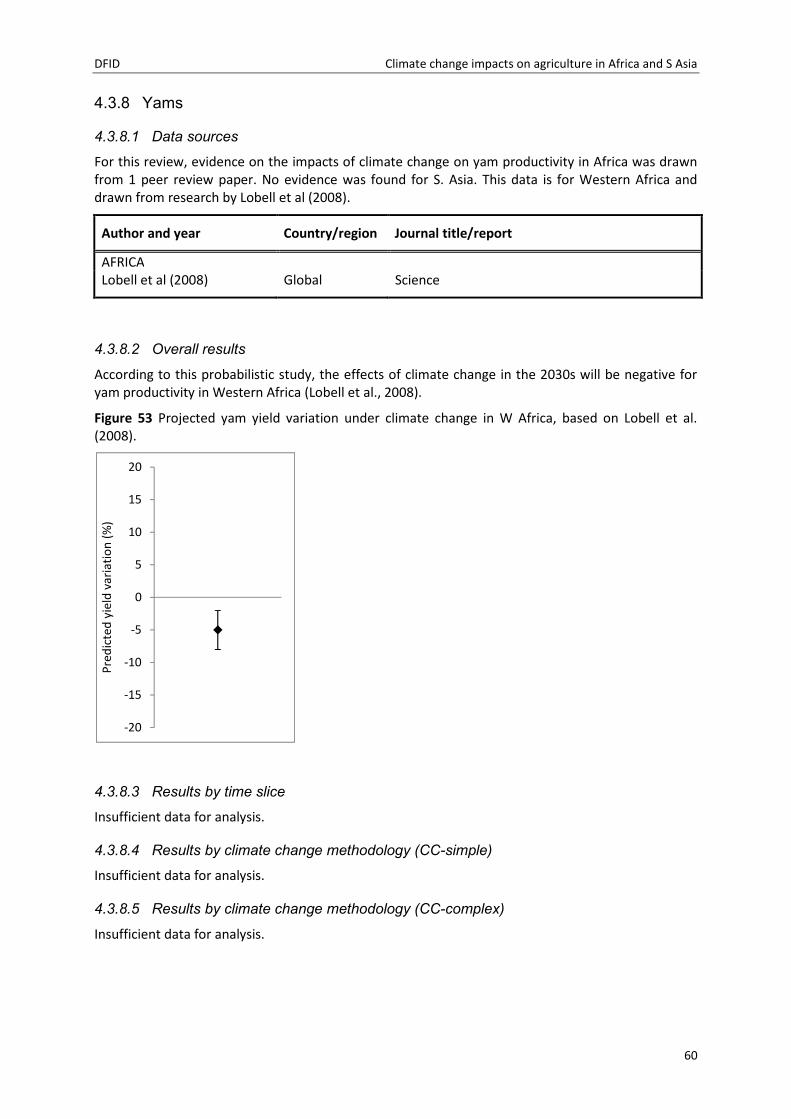
DFID Climate change impacts on agriculture in Africa and S Asia
60
4.3.8 Yams
4.3.8.1 Data sources
For this review, evidence on the impacts of climate change on yam productivity in Africa was drawnfrom 1 peer review paper. No evidence was found for S. Asia. This data is for Western Africa anddrawn from research by Lobell et al (2008).
Author and year Country/region Journal title/report
AFRICALobell et al (2008) Global Science
4.3.8.2 Overall results
According to this probabilistic study, the effects of climate change in the 2030s will be negative foryam productivity in Western Africa (Lobell et al., 2008).
Figure 53 Projected yam yield variation under climate change in W Africa, based on Lobell et al.(2008).
4.3.8.3 Results by time slice
Insufficient data for analysis.
4.3.8.4 Results by climate change methodology (CC-simple)
Insufficient data for analysis.
4.3.8.5 Results by climate change methodology (CC-complex)
Insufficient data for analysis.
-20
-15
-10
-5
0
5
10
15
20
Pre
dic
ted
yiel
dva
riat
ion
(%)

DFID Climate change impacts on agriculture in Africa and S Asia
61
5 Synthesis
5.1 By crop
Rice
Unsurprisingly, most of the studies reported on rice focus on Asia. There is no common pattern tothe trend of the predictions, with positive to negative forecasts in the ratio of 2:3. Most of thestudies suggest small variations. For the predictions on a country by country basis, the results aresensitive to the study area and methodology used, and the effects being predicted.
In Bhutan the forecast is positive for the 2020s and 2050s (up to 10% increase), but not for the 2080s(-4%). For Bangladesh they are negative according to different studies in different time slices. Theyvary from -5% (2020s) to -10% (2080s). However, some studies based on fixed scenarios give positivevariations when considering only temperature increases (up to 20%). In India there are estimations ofup to 27% (main season rice) as well as reductions in yield productivity over by 40% by the 2080s,depending on the location of the study area. However, yield reduction is estimated to increase withtime. In Sri Lanka the effects of climate change have produced positive variation on rice yieldproductivity by up to 10%. In Pakistan productivity is expected to be reduced by half by the 2080s.
The predictions for African rice are both positive (Eastern, Central and Western Africa) as well asnegative, depending on the region, but they don’t exceed ±10%.
Wheat
A similar number of studies for Africa and Asia have been reported. Most of the predictions arenegative for both continents. The forecast yield variation for large areas in the 2030s is generallynegative but rarely exceeds 10%, excluding Southern Africa, where variability in wheat productivitycould be up to 20%. General predictions for the 2050s forecast a higher decrease especially inWestern Africa (up to 100%), Central Africa (80%), Eastern Africa and South East Asia (about 60%).Less severe effects were estimated for Northern Africa (less than 20% decrease).
In Bangladesh productivity is expected to be reduced in the 2050s as well as in other periods. InTunisia the forecast is positive for the 2050s, but varies for the 2080s according to the region studied(e.g. an increase in Kairouan of 6-26% and a decrease in Jendouba of 18-25%). Libya and Morocco areexpected to suffer a variation in wheat productivity of 10-20% in the 2050s, and Tunisia, Algeria andEgypt an increase of up to 15%. However, other studies predict a negative impact in Egypt. In Indiathe projections vary depending on the region and methodology used to estimate climatic conditions;but some are negative and some positive depending on the study.
Maize
Most of the published studies regarding climate change on maize productivity focus in the Africancontinent. Most predictions for Asia are negative. General predictions for South East Asia for the2030s forecast a small variability in yield production that could lead to positive or negative effects onmaize yield, which will not exceed 10%. For the 2050s the effects are expected to be positive (up to10%). The same studies regarding the South Asian region predict negative effects that increase withtime (-10% to -40%).
In India maize yield productivity is expected decrease. In general, winter maize has shown to be morevulnerable to climate change than monsoon wheat. The most severe consequences are forecasted tobe on winter maize in the MIGP and will worsen with time (from -25% in the 2020s up to -60% in the2080s). Nevertheless, monsoon maize productivity is expected to remain stable without significantvariation.
DFID Climate change impacts on agriculture in Africa and S Asia
62
The general trend on African maize production appears to be negative. For the 2030s the predictedvariation was slightly negative (up to 5%) for East, Central, West Africa and the Sahel. The mostsevere effect was forecasted to take place in Southern Africa (-27%). For the 2050s predictions areslightly positive (up to 5%) in Eastern and Central Africa, and slightly negative in Western Africa. Thehighest decrease in production was predicted for Southern Africa (-44%) and the highest increasewas for Northern Africa (53%).
In Kenya in the 2020s, the effect will be positive (up to 30%). In Cameroon, it is expected to increaseby 15% in the 2020s, and decrease in the 2030s (20%) and 2080s. Studies made to predict yieldvariation in the 2050s forecast negative variation (up to -30%) for most countries, except for Somalia(+1.9%), Côte d’Ivoire (+1.6%), Lesotho (+26%), and Morocco (+73.5%). In Zimbabwe, depending onthe study, planting data and area, the yield variation can be forecasted from -100% until over 100%.
Sorghum
Effects of climate change on sorghum appear to be negative when studying specific countries andaround zero with the possibility of having positive and negative effects when regarding larger areas,with exception of the Sahel, where yield variation is forecast to be negative.
In India in the 2020s, yield could be reduced by 3% (SCZ) and by 14% (SWZ and CZ). In the 2050s thepredicted variation is between -11% and -32% for the 2080s. Sorghum yield variations predicted forthe 2030s are slightly negative in Sahel and Central Africa (less than 10%) and around zero with ahigh uncertainty for South Asia, Eastern, Southern and Western Africa. In Botswana in the 2050s,sorghum yield is forecast to be reduced by 10% in the Hard Veldt Region and 31% in the Sand VeldtRegion. In Cameroon, the productivity is forecasted to be reduced by 40% in the 2080’s. In Mali,there is expected to be a reduction in productivity of 11-17%.
Millet
Future changes in millet productivity have been studied more extensively for African regions than forSouth Asia. However, the predicted effects are reported to be both negative and positive when noadaptation measures are taken, again depending on the study area. In the 2030s millet yield couldincrease or reduce by about 10% in South Asia, and increase up to 8% in the Sahel. In Western Africait might increase by up to 4% or decrease by 1%, while in the Central African region it is predicted toreduce by up to 20%. In Mali, the effects are expected to cause a reduction in productivity from 6%to 11%. In Niger by the 2020s, the yield decrease could range from 11% to 26%.
Cassava
Cassava’s future productivity estimations are mostly estimated for African regions. The predictionsfor the 2030’s for South East Asia, Eastern, Central and Southern are of negative small impacts (lessthan 10%) with some chances of becoming zero or positive. Positive effects on cassava’s productivityare expected to occur in Western Africa (up to 4%). In Ghana, cassava yield productivity is expectedto be reduced by 3%, 13% and 53% in the 2020’s, 2050’s and 2080’s.However, it is forecasted, thatthe productivity in Asia and Africa rises by 3.5% by 2050.
Sugarcane
Sugarcane yield variation estimated for the 2030s show small positive effects in South East Asia (upto 9%) and positive or negative effects in South Asia (not higher than 5%). The predictions for Easternand Southern Africa are slightly negative (less than 10%). In India, sugarcane productivity coulddecrease in the 2020s by 13% and by 9% in the 2050s.In Swaziland for the 2050s the yield isprojected to increase by 15% assuming crop water requirements are satisfied.

DFID Climate change impacts on agriculture in Africa and S Asia
63
5.2 By region
South Asia
The studies made regarding crop yield variation in South Asia show a general negative trend,especially on maize and sorghum in India and reduction expected on rice yield in Nepal, but increasein Sri Lanka. During the 2020s the most affected crop in this region seems to be maize, especiallymonsoon maize in the SP (-21%) and winter maize in the MIGP (-25%). Sorghum, sugarcane and ricewill decrease by up to 13% in India and rice productivity by 2% in Nepal. In Pakistan and Sri Lanka riceyield will increase by 7% and 1%, respectively. Estimations for the 2030s forecast negative variation(up to 12%) for maize, wheat, millet, rice, sugarcane, and sorghum with a range of uncertaintieswhich show the chance of increasing up to 8% (wheat) or 4% (millet). In Sri Lanka the effects ofclimate change appear to be positive on rice productivity (+6.6%). The predictions for the 2050s arenegative for maize and wheat when considering the whole area (-40%). In India the climate changeimpacts on sugarcane, rice, sorghum and maize are negative, having the greatest impact on wintermaize in the MIGP (-50%). However, in Sri Lanka and Pakistan, the rice productivity might bepositively affected rising by 6 and 7.5%, respectively. In the 2080s, the consequences of climatechange would be similar to the ones predicted for the 2050s, but more extreme. Indian sorghum andrice crop productivity would be reduced by 32 and 42%, respectively, and the worst prediction is befor winter wheat in the MIGP (-60%). Rice in Nepal would also be reduced (up to 39%). Pakistan(+7.5%) and Sri Lanka (+6 and +28%) are expected to benefit form the projected changes.
Other studies with no specified time slice predict an increase of up to 37% in wheat productivity inNW India, depending on the cultivar and a reduction of about 40% when ignoring CO2 effects. Themost favourable predictions were for cultivar WH542 in Hisar. Main season rice productivity might bepositively affected (+27%) while second season is predicted to be reduced (-38%). Sorghum isforecast to reduce by up to 13% under rain-fed and no-stress conditions. In Pakistan, the predictionsfor wheat are negative (up to -31% and higher when CO2 fertilisation is ignored). However, theuncertainty is high, with a potential positive (up to 30%) forecast also reported.
South East Asia
The predictions for the 2020s in South East Asia are slightly negative for rice in Bangladesh (up to -7%) and in Bhutan rice productivity could have some variation around current levels (±2%). Generalforecasts for the region predict a positive effect on sugarcane (up to +9%), and a small negativevariation for cassava, wheat, rice, and maize, the latter being the worst (-7%). The 2050s climateconditions will affect wheat productivity most, on average halving yield in the region or by -32% inBangladesh. Rice production will also be reduced in Bangladesh (-8%) but increased in Bhutan.Forecasted variations for the 2080s give general negative impacts on rice yield in Bangladesh (up to -14%) and in Bhutan (up to -12%) with some chances of an increase (+2%). Other studies predictpositive effects on rice productivity in Bangladesh (up to +20%) and wheat variability but with ahigher chance of it being negative (up to -15%) than positive (+5%).
East Africa
In the 2020s East African maize will benefit from climate change in central (+30% productivity) andwest Kenya. In southern and eastern Kenya maize yield is forecast to reduce by 2% and 12%,respectively. In the 2030s, rice productivity is predicted to rice by up to 11%, while sugarcane, wheatand cassava are all expected to experience reduced yields by up to 10%. Maize might be favoured byclimate change. Kenyan maize productivity is predicted to be reduced in the southern regions. Wheatis expected to decrease by up to 60% in the 2050s and maize increase from 1 to 9% in the Easternregion. However, in Kenya maize productivity is forecast to increase in the Central (+100%) andWestern (+20%) area of the country, while it may decrease by around 40% in the Southern andEastern areas.
DFID Climate change impacts on agriculture in Africa and S Asia
64
Central Africa
Forecasts for Cameroon by the 2020s predict positive effects on maize (up to 25%) and negative onsorghum (-7%). The predictions for this region by the 2030s are slightly negative for sorghum, wheat,cassava, yam and maize, having the worst forecast millet productivity (up to -21%). Wheatproductivity is predicted to decrease by 80% in Western Africa in the 2050s, while average maizeproductivity will remain stable. In Cameroon, Central African Republic, Chad, DR Congo, Congo,Gabon and Tanzania, maize productivity is forecast to reduced by between 10 and 20%. Estimationsof Cameroon crop variation are negative for sorghum (-40%) and for maize (up to 15%) by the 2080s.In case of a temperature increase of 2⁰C and rain decrease of 20%, maize productivity will decrease by 11-14%.
West Africa
Predictions for the 2020s show a negative effect on cassava in Ghana (-3%) and on millet in Niger forseveral scenarios by up to -26%. Small variation is predicted for the 2030s, being rice the mostaffected crop (-8%). Wheat productivity is predicted to decrease by 99% in Western Africa in the2080s, while maize productivity will have a smaller response to climate change, with productivityreduced by 1 to 7%. Maize productivity is forecast to slightly increase (1.6%) in Côte d’Ivoire, anddecrease in Liberia and Mauritania (-1.5%). Reductions of 15-30% are expected in Benin, BurkinaFaso, Equatorial Guinea, Gambia, Ghana, Guinea, Guinea-Bissau, Liberia, Mali, Mauritania, Niger,Nigeria, Senegal, Sierra Leone, and Togo. Cassava production is forecast to reduce by 13% in Ghana.Cassava productivity in Ghana is estimated to decrease by the 2080s by about 53%. Other studiespredict a yield decrease in West African sorghum (11-17%), millet (6-11%), and maize (11-13%).
Southern Africa
Studies show that the effects of climate change by the 2030s on Southern African crop productivitywill be negative, except for rice (+8%). Most affected crops will be maize (-35%) and wheat (-22%).South African maize could be reduced by 8%. Predictions for the 2050s for Southern Africa forecasthalving maize and wheat productivity. Maize yield is expected to be reduced by 10-35% in Angola,Botswana, Madagascar, Malawi, Mozambique, Namibia, South Africa, Zambia and Zimbabwe, andincreased by 26% in Lesotho. Sorghum in Botswana is forecasted to decrease by 10% and 36% in theHard Veldt and the Sand Veldt Regions, respectively. In Swaziland sugarcane productivity is expectedto increase by 15% if crop water requirements are satisfied. Different planting dates and scenariosresulted in a positive effect on maize productivity at early and mid planting dates in Gweru (+160%and +12-37%, respectively), and in Beit Bridge (up to 170%) at mid planting dates. Late planting wasestimated to have severe negative impacts, reducing maize yield by 40-98%.
Northern Africa
By the 2030s, an increase of 50-56% in average maize productivity is forecast. By the 2050s averagemaize productivity in this region is expected to rise by about 50% but with wheat yields reduced by10-14%. In Sudan, maize productivity might decrease by 17%. The forecast variation in theMediterranean coastal countries (Algeria, Tunisia, Libya, and Egypt) is predicted to decrease by 5-10% for 2031-2060. In Morocco, a study shows a positive impact (+70%) for the 2050s, while anotherreports a reduction of 10%. Climate change effects on wheat productivity in the 2050s are reportedto be positive in Algeria, Tunisia and Egypt (4-11%) and negative in Morocco and Libya (-14%). InTunisia, two positive and negative effects are expected in wheat productivity between 2071 and2100. In Kairona, yield is forecast to increase (by 6-26%) and in Jendouba to decrease (by 17-25%).
Sahel
By the 2030s, a reduction in rice, maize and wheat (up to 10%) is reported, and a positive responsefor millet productivity (+8%).
DFID Climate change impacts on agriculture in Africa and S Asia
65
6 Review limitationsThe systematic review had a number of methodological limitations which need to be recognised:
1. Access to published literature. Some papers identified in the searches were not available (e.g.Tingem et al., 2008; Das et al., 2007; Geethalasksmi et al., 2008). It was also difficult to sourcesome conference papers (e.g. Mohandass and Ranganathan, 1997). In these instances, theresults were extracted from the abstract, where feasible.
2. Crop model validation studies. Many of the papers found in the systematic review were actuallystudies to assess the suitability of specific crop growth models to predict yield response underfuture conditions, rather than climate change impact studies per se.
3. Lack of detail and confounding impacts. Many articles and reports identified in the review weresimply too general to extract useful data, whilst others provided vague results and confoundingdiscussion.
4. Difficulties in directly comparing results. Each study included in the review focused on adifferent location, area, region, country or a continent, a unique approach to modelling yield(specific crop model) and differing approaches to assessing climate change (different GCMs,different downscaling approaches etc). This made direct comparisons between studies extremelydifficult, with the results highly influenced by these ‘effect modifiers’.
5. Differences in reporting data. The most frequent and useful results were those expressed as ayield variation in percentage. However, some studies gave predictions as yield variation in t ha-1
year-1 (e.g. Schulze et al., 1993) or as yield deficit index (e.g. Lhomme et al., 2009) and thus hadto be converted to percentage yield variation. Studies considering the economic aspects ofclimate change effects on agriculture predicted the impacts as a revenue variation (e.g.Gbetibouo and Hassan, 2005). Some studies presented their outputs as maps (e.g. Thornton etal., 2009, and Schulze et al., 1993). These are useful for understanding spatial impacts of climatechange but difficult to extract specific representative values for particular regions and/orcountries.
6. Differences in modelling approach. The reported differences in yield variation depend largely onthe methodology adopted. For example, in many studies that used several GCM’s the resultswere slightly different (e.g. Muchena and Iglesisas, 1995 or Modandass et al., 1997). Matthews etal. (1997) demonstrated that different crop models can also predict different yields underclimate change conditions. These difference could therefore be a consequence of the modelparameterisation rather the than impact of a changing climate.
7. Regional differences. It was noted that even within the same country differences in the effects ofclimate change can be very significant depending on location and crop type (e.g. Thornton et al.,2009, and Mati, 2000). It is thus difficult to compare the predictions for a catchment with theforecast yield variation in a larger region. The difference in the results will be highly dependenton the assumptions made and on the methodology adopted.
7 ReferencesAbraha, M. G. and Savage, M. J. (2006). Potential impacts of climate change on the grain yield ofmaize for the midlands of KwaZulu-Natal, South Africa. Agriculture, Ecosystems and Environment:115(1-4): 150-160.
Adams, R.M., Hurd, B.H., Lenhart, S., and Leary, N. (1998). Effects of global climate change onagriculture: an interpretative review. Climate Research 11: 19-30.
Adejuwon, J. O. (2006). Food crop production in Nigeria. II. Potential effects of climate change.Climate Research: 32(3): 229-245.

DFID Climate change impacts on agriculture in Africa and S Asia
66
Adejuwon, J. O. (2005). Assessing the suitability of the epic crop model for use in the study of impactsof climate variability and climate change in West Africa. Singapore Journal of Tropical Geography:26(1): 44-60.
Attri, S. D. and Rathore, L. S. (2003). Simulation of impact of projected climate change on wheat inIndia. International Journal of Climatology: 23(6): 693-705.
Ben Mohamed, A., Van Duivenbooden, N. and Abdoussallam, S. (2002). Impact of climate change onagricultural production in the Sahel - Part 1. Methodological approach and case study for millet inNiger. Climatic Change: 54(3): 327-348.
Benhin, J.K.A., 2008. South African crop farming and climate change: an economic assessment ofimpacts. Global Environmental Change 18 (4), 666–678.
Blignaut, J., Ueckermann, L. and Aronson, J. (2009). Agriculture production's sensitivity to changes inclimate in South Africa. South African Journal of Science: 105(1-2): 61-68.
Butt, T. A., McCarl, B. A., Angerer, J., Dyke, P. T. and Stuth, J. W. (2005).The economic and foodsecurity implications of climate change in Mali. Climatic Change. 68(3): 355-378.
Byjesh, K., Kumar, S. N. and Aggarwal, P. K. (2010).Simulating impacts, potential adaptation andvulnerability of maize to climate change in India. Mitigation & Adaptation Strategies for GlobalChange: 15(5): 413-431.
CCAFS (2009). Climate Change, Agriculture and Food Security. A CGIAR Challenge Program. ReportNo. 1. The Alliance of the CGIAR Centre and ESSP, Rome and Paris.
Challinor, A., Wheeler, T., Garforth, C., Crauford, P., and Kassam, A. (2007). Assessing thevulnerability of food crop systems in Africa to climate change. Climatic Change 83: 381-399.
Chipanshi, A. C., Chanda, R. and Totolo, O. (2003).Vulnerability assessment of the maize and sorghumcrops to climate change in Botswana. Climatic Change: 61(3): 339-360.
Das, L., Lohar, D., Sadhukhan, I., Khan, S. A., Saha, A. and Sarkar, S. (2007).Evaluation of theperformance of ORYZA2000 and assessing the impact of climate change on rice production inGangetic West Bengal. Journal of Agrometeorology: 9(1): 1-10.
De Costa, W. A. J. M., Weerakoon, W. M. W., Herath, H. M. L. K., Amaratunga, K. S. P. andAbeywardena, R. M. I. (2006).Physiology of yield determination of rice under elevated carbon dioxideat high temperatures in a subhumid tropical climate. Field Crops Research: 96(2-3): 336-347.
De Silva, C. S., Weatherhead, E. K., Knox, J. W. and Rodriguez-Diaz, J. A. (2007).Predicting the impactsof climate change - A case study of paddy irrigation water requirements in Sri Lanka. AgriculturalWater Management: 93: 19-29.
Devries, F. W. T. P. (1993).Rice production and climate change. Systems Approaches for AgriculturalDevelopment: 2: 175-189.
Droogers, P. (2004).Adaptation to climate change to enhance food security and preserveenvironmental quality: Example for southern Sri Lanka. Agricultural Water Management: 66(1): 15-33.
Faisal, I. M. and Parveen, S. (2004).Food security in the face of climate change, population growth,and resource constraints: Implications for Bangladesh. Environmental management: 34(4): 487-498.
Fischer, G. (2009).World Food and Agriculture to 2030/50: How do climate change and bioenergyalter the long-term outlook for food, agriculture and resource availability?.
Fischer, G., Frohberg, K., Parry, M. and Rosenzweig C. (1996).Global climate change and agriculturalproduction. Direct and indirect effects of changing hydrological, pedological and plant physiologicalprocesses.

DFID Climate change impacts on agriculture in Africa and S Asia
67
Gbetibouo, G. A. and Hassan, R. M. (2005). Measuring the economic impact of climate change onmajor South African field crops: a Ricardian approach. Global and Planetary Change: 47(2-4): 143-152.
Geethalaksmi, V., Kokilavani, S., Nagarajan, R., Babu, C. and Poornima, S. (2008).Impacts of climatechange on rice and ascertaining adaptation opportunities for Tamil Nadu. Journal ofAgrometeorology: 10: 282-285.
Giannakopoulos, C., Le Sager, P., Bindi, M., Moriondo, M., Kostopoulou, E. and Goodess, C. M.(2009).Climatic changes and associated impacts in the Mediterranean resulting from a 2 °C globalwarming. Global and Planetary Change: 68(3): 209-224.
IAASTD (2009). Agriculture at a Crossroads: Synthesis Report. International Assessment ofAgricultural Knowledge, Science and Technology for Development.
IPCC (2007). Climate Change 2007. Synthesis Report. Contribution of Working Groups I, II and III tothe Fourth Assessment Report of the Intergovernmental Panel on Climate Change. IPCC, Geneva,Switzerland. pp 104.
Jones, P. G. and Thornton, P. K. (2003). The potential impacts of climate change on maize productionin Africa and Latin America in 2055. Global Environmental Change: 13(1): 51-59.
Kang, Y., Khan, S., and Ma, X. (2009). Climate change impacts on crop yield, crop water productivityand food security – a review. Progress in Natural Science 19: 1665-1674.
Knox, J.W., Rodríguez Díaz, J.A., Nixon, D.J., and Mkhwanazi, M. (2010). A preliminary assessment ofclimate change impacts on sugarcane in Swaziland. Agricultural Systems 103: 63–72.
Kurukulasuriya, P., Mendelsohn, R., 2008. How will climate change shift agroecological zones andimpact African agriculture? Policy Research Working Paper 4717. World Bank Development ResearchGroup.
Krishnan, P., Swain, D. K., Chandra Bhaskar, B., Nayak, S. K. and Dash, R. N. (2007). Impact of elevatedCO2 and temperature on rice yield and methods of adaptation as evaluated by crop simulationstudies. Agriculture, Ecosystems and Environment: 122(2): 233-242.
Lal, M., Singh, K. K., Rathore, L. S., Srinivasan, G. and Saseendran, S. A. (1998). Vulnerability of riceand wheat yields in NW India to future changes in climate. Agricultural and Forest Meteorology:89(2): 101-114.
Laux, P., Jäckel, G., Tingem, R. M. and Kunstmann, H. (2010). Impact of climate change on agriculturalproductivity under rainfed conditions in Cameroon-A method to improve attainable crop yields byplanting date adaptations. Agricultural and Forest Meteorology: 150(9): 1258-1271.
Leemans, R. and Solomon, A. M. (1993). Modeling the potential change in yield and distribution ofthe earth's crops under a warmed climate. Climate Research: 3(1-2): 79-96.
Lhomme, J. P., Mougou, R. and Mansour, M. (2009).Potential impact of climate change on durumwheat cropping in Tunisia. Climatic Change: 96(4): 549-564.
Lobell, D. B. (2007).Changes in diurnal temperature range and national cereal yields. Agricultural andForest Meteorology: 145(3-4): 229-238.
Lobell, D.B., Burke, M.B., Tebaldi, C., Mastrandrea, M.D., Falcon, W.P., and Naylor, R.L. (2008).Prioritizing climate change adaptation needs for food security in 2030. Science 319(5863): 607 – 610.
Lobell, D. B. and Burke, M. B. (2010).On the use of statistical models to predict crop yield responsesto climate change. Agricultural and Forest Meteorology: 150(11): 1443-1452.

DFID Climate change impacts on agriculture in Africa and S Asia
68
Mahmood, R. (1998).Air temperature variations and rice productivity in Bangladesh: a comparativestudy of the performance of the YIELD and the CERES-Rice models. Ecological Modelling: 106(2-3):201-212.
Makadho, J. M. (1996).Potential effects of climate change on corn production in Zimbabwe. ClimateResearch: 6(2): 147.
Masutomi, Y., Takahashi, K., Harasawa, H. and Matsuoka, Y. (2009).Impact assessment of climatechange on rice production in Asia in comprehensive consideration of process/parameter uncertaintyin general circulation models. Agriculture, Ecosystems and Environment: 131(3-4): 281-291.
Mati, B. M. (2000).The influence of climate change on maize production in the semi-humid-semi-aridareas of Kenya. Journal of Arid Environments: 46(4): 333-344.
Matthews, R. B., Kropff, M. J., Horie, T. and Bachelet, D. (1997).Simulating the impact of climatechange on rice production in asia and evaluating options for adaptation. Agricultural Systems: 54(3):399-425.
Mohandass, S. and Ranganathan, T. B. (1997).Mitigating climate change effects on rice yield.Applications of Systems Approaches at the Field Level: 6: 169-176.
Muchena, P. and Iglesias, A. (1995).Vulnerability of maize yields to climate change in differentfarming sectors in Zimbabwe. Climate change and agriculture: analysis of potential internationalimpacts, 229-239.
Odingo, R. S. (1990).Implications for African agriculture of the greenhouse effect. Soils on a warmerEarth.Proc.international workshop, Nairobi, 1990. 231-248.
Patel, H. R., Patel, V. J. and Pandey, V. (2008).Impact assessment of climate change on maize cultivarsin middle Gujarat agro-climatic region using CERES-maize model. Journal of Agrometeorology: 10:292-295.
Palanisami, K., Paramasivam, P., Ranganathan, C.R., Aggarwal P.K., and Senthilnathan S., (2008).Quantifying Vulnerability and Impact of Climate Change on Production of Major Crops in Tamil Nadu,India.
Rao, D. G., Katyal, J. C., Sinha, S. K. and Srinivas, K. (1995).Impacts of climate change on sorghumproductivity in India: simulation study. Climate change and agriculture: analysis of potentialinternational impacts. 325-337.
Robin B. Matthews, Martin J. Kropff, Dominique Bachelet and H.H.-van Laar (1997). Modeling theimpact of climate change on rice production in Asia. CAB International, Wallingford, UK.
Rosenzweig, C. and Parry, M. L. (1994). Potential impact of climate change on world food supply.Nature: 367(6459): 133-138.
Royal Society (2009). Reaping the Benefits: Science and the sustainable intensification of globalagriculture. RS Policy Document 11/09. pp 77.
Sagoe R, (2006). Climate change and root production in Ghana. Available at:http://www.nlcap.net/fileadmin/NCAP/Countries/Ghana/ROOT_TUBERS_DRAFT_FINAL_REPORT.pdf(last access 11th January 2010)
Saseendran, S. A., Singh, K. K., Rathore, L. S., Singh, S. V. and Sinha, S. K. (2000). Effects of climatechange on rice production in the tropical humid climate of Kerala, India. Climatic Change: 44(4): 495-514.
Schulze, R. E., Kiker, G. A. and Kunz, R. P. (1993). Global climate change and agricultural productivityin southern Africa. Global Environmental Change: 3(4): 330-349.

DFID Climate change impacts on agriculture in Africa and S Asia
69
Slingo, J.M., Challinor, A.J., Hoskins, B.J., Wheeler, T.R. (2005). Introduction: food crops in a changingclimate. Phil. Trans. R. Soc. B 360, 1983–1989.
Srivastava, A., Naresh Kumar, S. and Aggarwal, P. K. (2010). Assessment on vulnerability of sorghumto climate change in India. Agriculture, Ecosystems & Environment: 138(3-4): 160-169.
Suitana H., Ali N., Iqbai A. M., and Khan A. M., (2009). Climate change: impacts, adaptation andvulnerability. TIDEE (TERI Information Digest on Energy & Environment): 8(3): 419-429.
Sultana, H., Ali, N., Iqbal, M. M. and Khan, A. M. (2009).Vulnerability and adaptability of wheatproduction in different climatic zones of Pakistan under climate change scenarios. Climatic Change:94(1-2): 123-142.
Swain, D. K. and Yadav, A., (2009). Simulating the impact of climate change on rice yield using CERES-rice model. Journal of Environmental Informatics: 13(2): 104-110.
Tebaldi, C. and Lobell, D. B. (2008). Towards probabilistic projections of climate change impacts onglobal crop yields. Geophysical Research Letters: 35(8).
Thornton, P. K., Jones, P. G., Alagarswamy, G. and Andresen, J. (2009). Spatial variation of crop yieldresponse to climate change in East Africa. Global Environmental Change: 19(1): 54-65.
Tingem, M., Rivington, M. and Bellocchi, G., (2009). Adaptation assessments for crop production inresponse to climate change in Cameroon. Agronomy for Sustainable Development: 29(2): 247-256.
Tingem, M., Rivington, M., Bellocchi, G., Azam-Ali, S. and Colls, J. (2008). Effects of climate change oncrop production in Cameroon. Climate Research: 36(1): 65-77.
Walker, N. J. and Schulze, R. E. (2008). Climate change impacts on agro-ecosystem sustainabilityacross three climate regions in the maize belt of South Africa. Agriculture, Ecosystems andEnvironment: 124(1-2): 114-124.
World Bank (2009). South Asia: Shared Views on Development and Climate Change. Chapter 7.Agriculture and Rural Sector.
8 AcknowledgementThe authors acknowledge DFID for their funding support to undertake the systematic review, and inparticular to the following staff: Professor Tim Wheeler for providing technical scientific guidanceand support, and Max Gasteen and Nicola Crissell for their contractual and administrative support.
Thanks also to Heather Woodfield (Cranfield University Library services) for her advice and guidancein conducting the bibliographic searches and training in the use of the Refworks software.

DFID Climate change impacts on agriculture in Africa and S Asia
70
9 Appendices
9.1 Crop production and revenue statistics
Table 16 Summary of top 10 most important crops grown in Africa (East, West, Central, and South)based on value ($1000) and production (MT). Source derived from FAO STAT (2010).
Crop type Production ($1000) Production (MT) Production (%)
Cassava 7498974 114011873 27
Sugar cane 1148239 56411295 13
Yams 7171966 44229359 10
Maize 3760233 40817124 10
Plantains 4886560 24548008 6
Sorghum 2070936 19061034 5
Millet 2169395 14854303 4
Rice (paddy) 2915370 13947263 3
Vegetables (fresh) 2203201 11804598 3Other 20690706 81852365 19
Total 54515580 421537222 100
Table 17 Summary of top 10 most important crops grown in South Asia based on value ($1000) andproduction (MT). Source derived from FAO STAT (2010).
Crop type Production ($1000) Production (MT) Production (%)
Sugar cane 8162910 425196844 45
Rice (paddy) 41671090 206210377 22
Wheat 16754200 120846418 13
Potatoes 4926446 43230669 5
Vegetables(fresh) 6756402 36009709 4
Bananas 3285574 24500404 3
Onions, dry 2396308 16716723 2
Mangoes, guavas 3949902 16222031 2
Tomatoes 3378348 15759936 2Other 18109551 42947629 5
Total 109390731 947640740 100

DFID Climate change impacts on agriculture in Africa and S Asia
71
9.2 Countries by region
Table 18 Summary countries included in systematic aggregated by region (S Asia and Africa).
S Asia South Asia India Pakistan
Nepal Sri Lanka
South East Asia Bangladesh
Bhutan
Africa Central Africa Central African Rep
Congo
DR Congo
Equatorial Guinea
Gabon
East Africa Burundi
Kenya
Rwanda
Tanzania
Uganda
North Africa Algeria
Egypt
Libya
Morocco
Tunisia
Sahel Burkina Faso Mauritania
Chad Niger
Eritrea Senegal
Ethiopia Somalia
Mali Sudan
Southern Africa Angola Namibia
Botswana South Africa
Lesotho Swaziland
Madagascar Zambia
Malawi Zimbabwe
Mozambique
West Africa Benin Guinea-Bissau
Cameroon Liberia
Côte d'Ivoire Nigeria
Gambia Sierra Leone
Ghana Togo
Guinea