wettability of supercritical carbon dioxide/water/quartz...
TRANSCRIPT

Wettability of Supercritical Carbon Dioxide/Water/Quartz Systems:Simultaneous Measurement of Contact Angle and Interfacial Tensionat Reservoir ConditionsSoheil Saraji, Lamia Goual,* Mohammad Piri, and Henry Plancher
Department of Chemical and Petroleum Engineering, University of Wyoming, 1000 East University Avenue, Laramie, Wyoming82071-2000, United States
ABSTRACT: Injection of carbon dioxide in deep saline aquifers isconsidered as a method of carbon sequestration. The efficiency of thisprocess is dependent on the fluid−fluid and rock-fluid interactions insidethe porous media. For instance, the final storage capacity and totalamount of capillary-trapped CO2 inside an aquifer are affected by theinterfacial tension between the fluids and the contact angle between thefluids and the rock mineral surface. A thorough study of these parametersand their variations with temperature and pressure will provide a betterunderstanding of the carbon sequestration process and thus improvepredictions of the sequestration efficiency. In this study, the controversialconcept of wettability alteration of quartz surfaces in the presence ofsupercritical carbon dioxide (sc-CO2) was investigated. A novel apparatusfor measuring interfacial tension and contact angle at high temperaturesand pressures based on Axisymmetric Drop Shape Analysis with no-Apex(ADSA-NA) method was developed and validated with a simple system. Densities, interfacial tensions, and dynamic contactangles of CO2/water/quartz systems were determined for a wide range of pressures and temperatures relevant to geologicalsequestration of CO2 in the subcritical and supercritical states. Image analysis was performed with ADSA-NA method that allowsthe determination of both interfacial tensions and contact angles with high accuracy. The results show that supercritical CO2alters the wettability of quartz surface toward less water-wet conditions compared to subcritical CO2. Also we observed anincrease in the water advancing contact angles with increasing temperature indicating less water-wet quartz surfaces at highertemperatures.
1. INTRODUCTION
The safe trapping of carbon dioxide in deep saline aquifers isconsidered as a viable means for controlling carbon emission tothe atmosphere.1 The main trapping mechanisms of CO2include structural/stratigraphic trapping, residual capillarytrapping, solubility trapping, mineral trapping, and localcapillary trapping.2 Successful implementation of CO2 seques-tration projects via the structural trapping mechanism requiresminimal CO2 leakage through the cap rock. One possible causeof rapid leakage is capillary failure of the cap rock, which is to alarge extent controlled by the CO2/brine interfacial tension(IFT) and CO2/brine/cap rock mineral contact angle (CA).3
Rapid leakage occurs when the pressure build-up in thereservoir due to CO2 injection is more than the threshold value.If the wettability of the cap rock changes during CO2sequestration from strongly to weakly water-wet, the capillarythreshold pressure is reduced. This will affect the design andplanning of any CO2 injection and storage project as it sets alimit on both injection pressure and storage capacity.3 On theother hand, capillary trapping of carbon dioxide is desired forhigher storage efficiencies and reduced risk of leakage throughthe cap rock. Capillary trapping is governed by relativepermeability and capillary pressure of the rock, which in turn
depend on CO2/brine IFT and wettability (or contact angle) ofthe reservoir rock minerals. Thus, carefully measured IFT andCA data that are consistent with reservoir pressure, temper-ature, and fluid composition will reduce the uncertaintiesassociated with prediction of flow properties that directly affectthe estimation of storage capacity and the fate of the CO2plume.The wettability of minerals in the presence of water and
carbon dioxide has become a controversial issue in recent years.While some studies4−6 reported no effect of CO2 phase change(or pressure) on the wettability of minerals, others7−14 found agradual or sudden wettability change toward less water-wetconditions as pressure increased. Espinoza and Santamarina4
conducted sessile drop experiments in the pressure range 0−1500 psi at ambient temperature and found that contact anglesare independent of pressure. Bikkina5 used the same methodand did not observe any clear trends with pressure (200−3000psi) or temperature ranging from 25 to 50 °C. Dickson et al.,7
Yang et al.,8 Sutjiadi-Sia et al.,9 and Wang et al.10 reported an
Received: December 21, 2012Revised: April 29, 2013Published: April 30, 2013
Article
pubs.acs.org/Langmuir
© 2013 American Chemical Society 6856 dx.doi.org/10.1021/la3050863 | Langmuir 2013, 29, 6856−6866
increase in contact angles with increasing pressure. Plung andBruining11 and Plung et al.12 performed capillary pressuremeasurements on sand and coal samples. They noticed that thewettability of these samples was altered from water-wet tointermediate-wet in the presence of CO2 under supercriticalconditions. Recently, Jung and Wan13 observed about 18°increase in the static contact angles from subcritical tosupercritical pressures. The increase occurred only in a smallpressure range close to the phase change region of CO2.Contact angles were almost constant at lower and higherpressures. Chiquet et al.3 and Broseta et al.2 used a differentapproach and measured both advancing and receding contactangles in a quasi-static mode. In a first study, the authors founda gradual increase in the receding contact angle with pressure.3
In a subsequent study, they reported very small variations in thereceding angles while the water advancing angles showed a clearincrease trend with pressure.2 Kim et al.14 studied the dewettingof silica surfaces by use of a water-wet glass micromodel. Theyobserved thinning of the water film and growth of the waterdroplets during drainage of the initially water-saturated modelwith carbon dioxide. They also noticed an increase in theapparent contact angles up to 80°. These findings contradictthe study performed by Chalbaud et al.6
The discrepancies observed in the literature may stem fromdifferences in cleaning procedures, equilibration states of thephases, and measurement conditions and methods. Potentialsources of contamination at interfaces are impurity of fluids(water and carbon dioxide), transfer lines, connections, cells,and substrate surfaces. Impurities and dissolution effects frommetallic surfaces can also contribute to contamination of thesystem and affect contact angle values, thereby causingmisinterpretation of the data, as mentioned by Mahadevan.15
Moreover, there are various procedures used for cleaningsubstrates in the literature ranging from rinsing with weaksolvents5,13,14 to extensive washing with acid solutions.3
Another important factor is the pre-equilibration of partiallymiscible fluids prior to each measurement. There are differentcriteria and time periods for equilibration used in the literaturethat range from an hour to about a day.2,4 Also, observed trendsof contact angle versus pressure can be affected by the state ofthe CO2 phase. For instance, some studies investigated theeffect of pressure at ambient temperature,4,7 while othersperformed measurements at elevated pressures and temper-atures.2,3,5,8−10,13 Since the critical temperature of carbondioxide is about 31 °C, these two groups of studies investigatedtwo different systems at high pressures (i.e., liquid andsupercritical CO2). In addition to the state of CO2, the typeof angles to be measured is also important: staticangles4,5,7−9,13,14 or advancing and receding angles.2,3 Neumannet al.16 emphasized that static contact angles can have anyvalues between advancing and receding angles and therefore arenot a characteristic value for the fluid−solid surface.Furthermore, there are other factors that can affect contactangle measurements, such as temperature variations during themeasurements and subjectivity in data analysis.In this study, the controversial concept of wettability
alteration of quartz surfaces in the presence of supercriticalCO2 is systematically investigated at elevated temperatures andpressures. Wettability is assessed by measuring apparentadvancing and receding contact angles. The apparent contactangle is defined as the angle of the macroscopic meniscus whenextrapolated to zero thickness of the thin film.17,18 A newexperimental setup is developed, validated, and used to studythe variations of contact angles in CO2/water/quartz systems
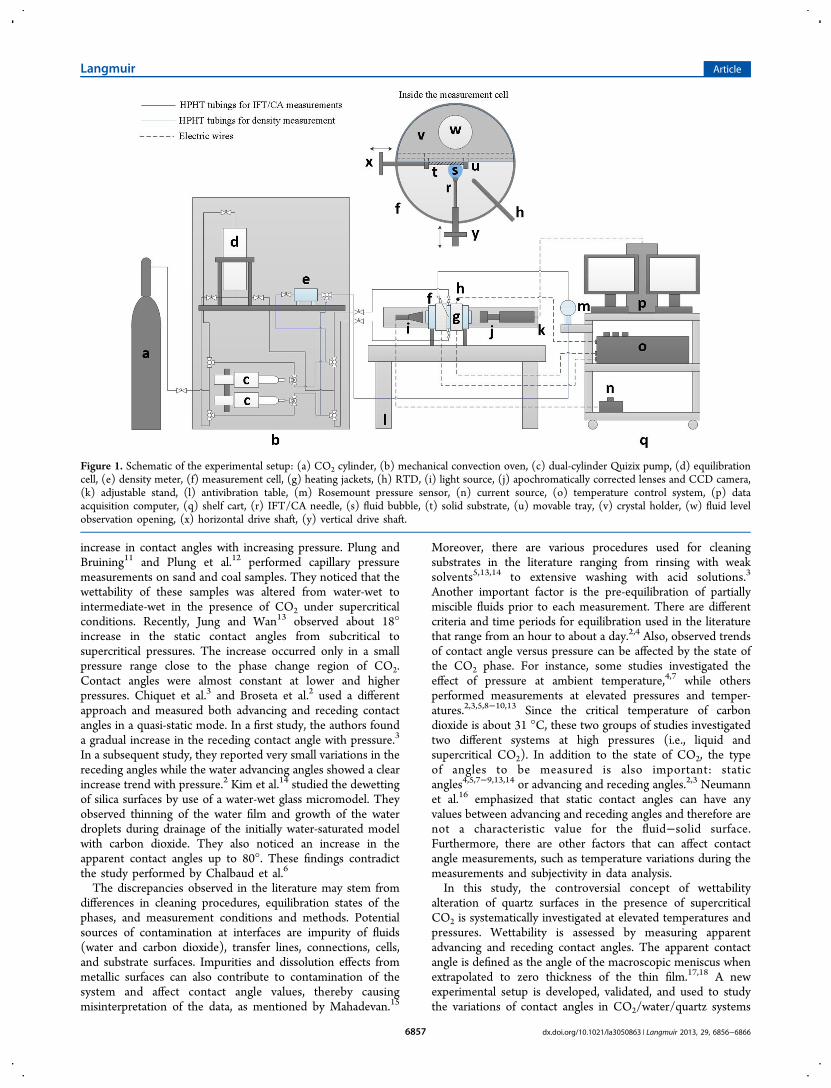
Figure 1. Schematic of the experimental setup: (a) CO2 cylinder, (b) mechanical convection oven, (c) dual-cylinder Quizix pump, (d) equilibrationcell, (e) density meter, (f) measurement cell, (g) heating jackets, (h) RTD, (i) light source, (j) apochromatically corrected lenses and CCD camera,(k) adjustable stand, (l) antivibration table, (m) Rosemount pressure sensor, (n) current source, (o) temperature control system, (p) dataacquisition computer, (q) shelf cart, (r) IFT/CA needle, (s) fluid bubble, (t) solid substrate, (u) movable tray, (v) crystal holder, (w) fluid levelobservation opening, (x) horizontal drive shaft, (y) vertical drive shaft.
Langmuir Article
dx.doi.org/10.1021/la3050863 | Langmuir 2013, 29, 6856−68666857

with changes in temperature and pressure relevant to geologicalsequestration of CO2 in the subcritical and supercritical states.A new analysis method, axisymmetric drop shape analysis withno apex (ADSA-NA), is used to simultaneously calculate IFTand CA.19 The program can accurately calculate IFT and CAfrom a single sessile drop or captive bubble image, making themeasurements fast and reliable.19,20 We first validated the setupwith a simple system (decane/air/Teflon). Once validated, theapparatus was used to systematically measure the IFT anddynamic CA of equilibrated fluids in CO2/water/quartzsystems under various stable pressure (±0.5 psi) andtemperature (±0.05 °C) conditions. To the best of ourknowledge, this is the first time that simultaneous measure-ments of interfacial tension and dynamic contact angle areperformed in CO2/water/mineral systems, and clear trends arereported between wettability, pressure and temperature.
2. MATERIALS AND METHODS2.1. Materials. Materials include distilled decane (HPLC-
grade, Sigma−Aldrich), isopropyl alcohol (HPLC-grade,Sigma−Aldrich), sulfuric acid (95−98%, ACS-grade, Sigma−Aldrich), Teflon AF 1600 solution (DuPont), silicon wafers(Silicon Sense, Inc.), SuperSmooth quartz slides (SPI Supplies)with surface roughness less than 0.5 nm, Nocromix (GodaxLaboratories, Inc.), nitrogen (instrumental-grade, Praxair, Inc.),and CO2 (instrumental-grade, Praxair, Inc.). The CO2 gascylinders were equipped with a Syphon tube for liquidwithdrawal. The distilled water was freshly obtained from anin-house all-glass water distiller.2.2. Experimental Setup. A state-of-the-art IFT/CA
measurement system was designed and constructed to performmeasurements under extreme conditions such as thoseencountered in geological sequestration of carbon dioxide indeep saline aquifers. The setup can handle high pressure (up to7500 psi), high temperature (up to 200 °C), and highlycorrosive fluids. All the wetted parts in the high-pressure/high-temperature (HPHT) setup are constructed from Hastelloy C-276, polyether ether ketone (PEEK), and Sapphire glass. A fewparts (valves and some fittings) are made from 316 stainlesssteel. The main components of the apparatus are the HPHTmeasurement cell, an imaging module, a fluid equilibrationmodule, a density measurement module, a temperature controlmodule, and a data acquisition and analysis module. Figure 1illustrates a schematic of the entire experimental setup.2.2.1. IFT/CA Measurement Cell. The cell is made of
Hastelloy and is considered as the core of the experimentalsetup. A schematic of the interior of the cell is also provided inFigure 1. The crystal holder located inside the measurementcell contains a movable tray that holds the crystal and anopening to observe the level of the fluids inside the cell. Twodrive shafts mounted on the cell facilitate the measurement ofCA and IFT. The shafts move the needle and crystal tray in thevertical and horizontal directions, respectively. Two high-pressure sapphire windows are located at two ends of themeasurement cell for observing drop/bubble images generatedduring the measurements.2.2.2. Imaging Module. This module has two components:
a light source and a microscope attached to a digital camera.The light source (Edmund Optics Inc.) consists of a blue light-emitting diode (LED), a telecentric backlight illuminator thatincreases the edge contrast and measurement accuracy bydecreasing diffuse reflections from the object under inspection,and a polarizing filter that directs blue light in the range 400−
700 nm wavelength into the cell. The microscope has a fullyapochromatically corrected lens (Leica Z16 APO) thatminimizes the chromatic aberration and color fringing andtherefore results in high-contrast edges and high-resolutionimages. The microscope is attached to a high-resolution charge-coupled device (CCD) digital color camera (Leica DFC295)with a c-mount interface. It offers a standard resolution of 2048× 1536 pixels (3 megapixels) and produces high-quality colorimages. These components are mounted to an adjustable standthat pivots to provide independent, adjustable vertical anglesfor two arms holding the microscope/camera and the lightsource. The measurement cell and the imaging module arefastened on an antivibration air table to minimize imagedistortion due to mechanical noises from the environment.
2.2.3. Fluid Equilibration Module. A mechanical convectionYamato oven was modified to accommodate a dual-cylinderpulse-free Quizix pump and a fluid equilibration cell. Thepump, made out of Hastelloy C-276, provides precise andstable flow rates and pressures. It is also used for transferringgas or liquid phase to other parts of the setup and to equilibratethe fluids in the equilibration cell (also made of Hastelloy C-276). The fluid equilibration was performed by retracting thelighter fluid from the top of the cell and injecting it into thebottom of the cell for a given period of time.
2.2.4. Density Measurement Module. An Anton Paar DMAHPM density meter is used to measure the equilibrium densityof phases at elevated pressures and temperatures. Themeasurement device is a U-shaped Hastelloy C-276 tube thatis excited to vibrate at its characteristic frequency, whichdepends on the density of the fluid. The density meter waslocated inside the oven and connected to a Rosemount pressuretransducer. The operating specifications for DMA HPM are−10 to +200 °C and 0−20 300 psi.
2.2.5. Temperature Control Module. This module consistsof a resistance temperature device (RTD), sealed in a Hastelloysheet (Conax Technologies), a heating jacket (Glas-col, LLC),and a temperature control system. The module uses propor-tional-integral-derivative (PID) control concept (Watlo ElectricManufacturing, Co.) to maintain an accurate and stabletemperature inside the measurement cell. A LabVIEW program,coupled with this control system, was specifically developed toread, plot, and adjust set points for the temperature, the threePID parameters, and to monitor the heat output needed formanual tuning. The controller was fine-tuned to stabilize theprocess temperature within ±0.1 °C. This fine-tuningprocedure allows the temperature inside the measurementcell to stay within ±0.05 °C of the set-point temperature duringthe measurements for as long as 10 h.
2.2.6. Data Acquisition and Analysis Module. This includesLeica LAS software, LabVIEW program, and IFT/CA analysisprogram. These programs were used to capture and analyzeimages and to record temperature and pressure. The IFT/CAanalysis program uses a well-established method, axisymmetricdrop shape analysis (ADSA), to calculate the IFT and CA ofdrops or bubbles.21 In this technique, the profile of a drop/bubble image is extracted by an edge detection method. Theprogram then fits a theoretical Laplacian curve to theexperimental profile extracted from the image, with theassumption of an axisymmetric drop/bubble shape. The valueof IFT is determined from the best match between these twoprofiles. A recent improvement in ADSA, axisymmetric dropshape analysis with no apex (ADSA-NA), allows IFT/CAcalculations without the drop apex information. This means
Langmuir Article
dx.doi.org/10.1021/la3050863 | Langmuir 2013, 29, 6856−68666858

that dynamic contact angles of a drop/bubble can be measuredwhile a protruding needle is attached to it. It has been shownthat contact angles can be measured with an accuracy of 0.2°with this method.19 This technique also allows accurate andsimultaneous measurement of IFT and CA of drops/bubbles.20
It first calculates IFT by the same procedure as ADSA, except inthis case the drop/bubble image profile does not have an apex.It then uses the final optimum theoretical profile to find thecontact angle at the solid surface level.2.3. Water Analysis. Carbon dioxide dissolution in water
produces carbonic acid, an aqueous solution that becomes morecorrosive at high pressures and temperatures.22 The potentialeffects of corrosion and dissolution of some metal ions ofvessels, valves, and connections in the experimental apparatusprompted an investigation into whether the test fluids becomecontaminated during the equilibration or measurement periods.Three water samples were analyzed by inductively coupledplasma (ICP) mass spectrometry (1 part per billion accuracy):(1) freshly distilled water from the all-glass water distiller, (2)certified HPLC-grade deionized water (VWR International),and (3) distilled water after being used to make contact anglemeasurements. The last sample was equilibrated with CO2 byrecirculation through the equilibration cell and associatedtransfer lines for about 1 week prior to transferring it to themeasurement cell for an additional 10 h of measurement. TheHastelloy C-276 recirculation system also contained somestainless steel valves and fittings. Figure 2 shows ICP results fordistilled water, HPLC-grade deionized water, CO2-equilibratedwater, and typical chemical compositions of Hastelloy C-276
and stainless steel.23 We find that the distilled water quality (interms of dissolved ion concentrations) is comparable to thecertified HPLC-grade deionized water purchased from VWRInternational (Figure 2a). Moreover, the concentrations of ionsin the equilibrated water (less than 1 ppm in total) are slightlyhigher than those in the distilled water (Figure 2b). This wasprobably caused by the dissolution of metallic components inthe system into the CO2-equilibrated water (Figure 2c).However, this insignificant amount of total ion concentrationis not expected to have a significant effect on IFT and CAvalues reported in this study.
2.4. Experimental Procedures. 2.4.1. Substrate Prepara-tion. Silicon wafers and smooth quartz slides were diced into19.3 mm × 15.7 mm rectangular pieces compatible with thecrystal holder. Each piece of silicon wafer was coated with alayer of Teflon by spin-coating of 3% Teflon solution at 1000rpm according to a procedure by Tavana et al.24 The quartzpieces were used as substrate in the CO2/water/quartzexperiments. All the substrates were handled from their edgeswith clean tweezers to avoid surface contamination. In order togenerate strongly water-wet quartz surfaces, the followingcleaning procedure was adopted: (1) the quartz substrates wererinsed with isopropyl alcohol, (2) they were immersed insulfuric acid solution containing 10% Nocromix and sonicatedfor 30 min, (3) the substrates were then soaked inside thissolution overnight, (4) they were washed thoroughly withwater and boiled in distilled water for about 2 h, and (5) thequartz pieces were subsequently rinsed and stored inside freshdistilled water. A few minutes before each test, the substrates
Figure 2. ICP analysis of water samples and typical elemental composition of Hastelloy C-27623 and stainless steel.23.
Langmuir Article
dx.doi.org/10.1021/la3050863 | Langmuir 2013, 29, 6856−68666859

were dried by absorbing their bulk water with a filter paper andthen blow-dried with ultrahigh-purity (UHP) nitrogen.2.4.2. Substrate Surface Detection. The contact angle is
defined as the angle between a tangent line on a drop/bubbleprofile and the horizontal plane at the substrate surface.Therefore, precise identification of the solid surface position ina sessile drop or captive bubble image is essential for contactangle measurements. The drop/bubble profiles near the solidsurface are sometimes fuzzy and obscure, especially for systemswith very large (>160°) or very small (<20°) angles.Uncertainties in the identification of the exact position of thedrop/bubble contact with the solid surface may causesignificant errors in measured CA. This is the case for stronglywater-wet surfaces such as quartz in CO2/water/quartz systemswith typical contact angles less than 30°. For example, for atypical CO2 bubble on quartz, displacing the solid surface lineby only 21 pixels (each pixel was about 2.2 × 10⁻⁴ cm) belowthe actual solid level, changed the contact angle from 9° to 20°.In order to facilitate detection of the substrate surface, the
camera was tilted 1−2° with respect to the horizontal line,downward for sessile drops and upward for captive bubbles.This procedure allowed the mirror image of the drop/bubble inthe substrate to be seen. A simple mathematical criterion wasused to determine the cutoff pixel (substrate surface) in all ofthe images. A few hundred points were considered on thebubble surface near the contact line (BS) together with theirmirror image (MI). The substrate surface was defined as theaverage midpoint between vertically aligned BS and MI points.This algorithm was run on the two sides of the bubble and thetwo cutoff values were used as input in the ADSA-NA programfor contact angle determination.2.4.3. Density Measurements. Density measurements of the
water-humidified CO2-rich and CO2-saturated aqueous phaseswere performed following the pre-equilibrium step describedearlier. At each experimental condition, multiple samples of thewater-saturated CO2 were obtained from the top of theequilibration cell and transferred to the density measurementunit at a constant pressure and temperature. To complete aseries of density measurements under the same experimentalconditions, several samples of distilled CO2-saturated waterwere also taken from the bottom of the cell and analyzed by thedensity meter.2.4.4. Decane/Air/Teflon System. The n-decane/air/Teflon
system was selected for contact angle validation purposes
because Teflon has a lower surface energy than quartz and it isless sensitive to contamination. Prior to measuring contactangles, a freshly prepared Teflon-coated solid substrate wasmounted on the crystal holder inside the measurement cell andthe camera angle was set to 2° above the solid surface. Theliquid was slowly injected through either a straight or pedestal-shaped needle at ambient condition until a symmetric droptouched the Teflon surface. At this point the flow rate wasfurther reduced to a low, fixed value. Multiple images of thedrop contacting the Teflon-coated surface were automaticallytaken every 20 s as the drop size increased (advancing) ordecreased (receding) by injection or retraction of n-decane.
2.4.5. CO2/Water/Quartz System. A leak test of the Quizixpump system, equilibration cell, measurement cell, and transferlines, at experimental temperature and pressure, was followedby an equilibration step in the equilibration cell for about 10−12 h to produce mutually saturated CO2 and aqueous phases.All the transfer lines outside the oven were wrapped withthermocouples, heating tape, and insulation to monitor andcontrol the temperature of the fluids inside the lines. Prior tomeasurements, the measurement cell was pressurized with dryCO2 and the temperature was adjusted to the desiredexperimental condition. Dry CO2 was then replaced withwater-saturated CO2 by recycling gases between the two cells(equilibration and measurement) by use of a Quizix pump. TheCO2-saturated water was then retracted from the bottom of theequilibration cell and injected into the measurement cell at aconstant pressure until the solid substrate (quartz) was fullyimmersed in water. The pressure inside the cell was keptconstant via the pump’s constant-pressure mode during fluidtransfer and measurement. The fluids and solid remained insidethe measurement cell for about 2 h before IFT and CAmeasurements were taken.There are two general configurations for conducting IFT/CA
measurements: either the solid substrate is immersed in CO2and a drop of water is placed on top of it (sessile drop method),or the substrate is immersed in the aqueous phase while abubble of CO2 is positioned beneath it (captive bubblemethod). Both methods were evaluated in this study. In thesessile drop mode, a condensed phase accumulated graduallyon the sapphire windows, which resulted in fuzzy drop imagesand hence caused a systematic error in the measured contactangles. This effect became more significant at higher pressuresand temperatures (supercritical region of CO2). Due to the heat
Figure 3. Representative images of supercritical CO2 bubbles in distilled water at 45 °C and 1700 psi: (a) water-receding angle; (b) water-advancingangle.
Langmuir Article
dx.doi.org/10.1021/la3050863 | Langmuir 2013, 29, 6856−68666860

lost to the outside environment, there was a small temperaturegradient from the center of the cell toward the sapphirewindows. This gradient caused supersaturation of carbondioxide phase close to the observation windows and led towater condensation on the windows. The captive bubblemethod does not exhibit the condensation problem and is infact more representative of the process that is encounteredduring the geological sequestration of carbon dioxide in salineaquifers; that is, the mineral is initially immersed in the aqueousphase before coming in contact with the CO2 phase. Thus, thecaptive bubble configuration was selected for our experiments.The camera was tilted 1−2° with respect to the horizontal
quartz substrate and the magnification was set at 2×. Apedestal-shaped needle with 1.37 mm outer diameter (Figure3) was used to form a CO2 bubble beneath the quartz substrate,while the needle tip was located 3−4 mm from the quartzsurface. With this configuration, it was possible to conduct 3−4measurements on different parts of the same quartz surface bymoving the substrate tray on the crystal holder horizontally(Figure 1). Each substrate was used only once to avoid anycomplications due to possible reaction of quartz with fluids.Images of the CO2 bubble were taken repeatedly while growingthe bubble (water-receding contact angle) or shrinking it(water-advancing contact angle) at intervals of 5−20 s. Whenthe CO2 bubble is growing and its contact area on the mineralis increasing, water recedes from the quartz surface. Therefore,the angle is called CO2-advancing angle when measuredthrough the carbon dioxide phase or water-receding anglewhen measured through the water phase. When water replacesCO2 on the solid surface (that is, the CO2 bubble is shrinkingand receding), the measured angle through saturated CO2phase is referred to as CO2-receding angle and thecorresponding angle in the aqueous phase is called water-advancing angle (see Figure 3). The ADSA-NA software wasused to calculate both IFT and CA from the same images ofcaptive bubbles.19,20 The primary input parameters required forthe calculations were the density difference between the phases,acceleration of gravity, scale of the images, and location of thesolid surface.
3. RESULTS
3.1. Validation Experiments with Decane/Air/TeflonSystem. Three sets of experiments were conducted in thisstudy to validate our experimental setup and procedures and tocheck the reproducibility of CA measurements. Table 1 lists theselected parameters and results for each test. The first series,V1−3, investigated the effect of drop advancing rate on theadvancing contact angle. Three different flow rates wereselected in a way that the advancing rate of motion of thethree-phase contact line in all the tests was smaller than theproposed critical value of 5 mm/min, above which dynamiccontact angles are affected by viscous forces.16 Table 1 indicates
good agreement between the measured contact angles and theaverage value reported in the literature, 59.43° ± 0.02°.19,20
The data suggest that small changes in flow rate do not affectthe contact angle values. The second series, V4−6, evaluatedthe effect of decreasing needle size and image resolution on thecontact angle results. The flow rate was kept constant to checkthe reproducibility of the data. Three pairs of advancing/receding contact angles were measured from this series. Figure4a depicts the advancing/receding contact angles and contactradius of a decane drop on the solid substrate versus time fortest V5. The results confirm the reproducibility of CAmeasurements. In the third series, V7, the straight flat-endedneedle (Figure 4a) used in the first two series was replaced witha pedestal-shaped needle (Figure 4b). The latter needle makesit easier to generate well-formed (symmetric) drops, which
Table 1. Specification and Results of Validation Tests
test magnification flow rate (cm3/min) needle o.d. (mm) advancing CA (deg) receding CA (deg) IFT (mN/m)
V1 1.6× 0.001 1.194 59.55 ± 0.21 NA NAV2 1.6× 0.0001 1.194 59.48 ± 0.11 NA NAV3 1.6× 0.0005 1.194 59.66 ± 0.07 NA NAV4 1.25× 0.0005 0.838 59.51 ± 0.33 52.86 ± 0.26 NAV5 1.25× 0.0005 0.838 59.36 ± 0.31 52.86 ± 0.40 NAV6 1.25× 0.0005 0.838 59.45 ± 0.37 53.28 ± 0.29 NAV7 1.25× 0.0005 3.220 59.34 ± 0.09 53.29 ± 0.24 23.96 ± 0.28
Figure 4. Dynamic contact angle and radius in decane/air/Teflonsystem with (a) straight needle and (b) pedestal-shaped needle.
Langmuir Article
dx.doi.org/10.1021/la3050863 | Langmuir 2013, 29, 6856−68666861

improves the accuracy of IFT data during the simultaneousmeasurement of CA and IFT.20 The measured angles from thistest are shown in Figure 4b. Comparison of the results betweenthe first two series and the last one demonstrates that thepedestal-shaped needle not only reduced the standard deviationfor CA measurement but also resulted in an IFT that iscomparable to the literature value (23.70 mN/m).19
3.2. Experiments with CO2/Water/Quartz System.3.2.1. Density. The density difference between the twoequilibrated phases (water-humidified CO2 and CO2-saturateddistilled water) is one of the required input parameters in theADSA-NA method for calculation of IFT and CA. Since thefinal IFT value is very sensitive to this parameter, the densitiesof both saturated phases were measured at the same pressureand temperature conditions as the IFT/CA experiments. Thedensity meter was initially calibrated by use of high-puritycarbon dioxide and distilled water in the range 100−1900 psiand 35−65 °C. A minimum of 70 calibration points weremeasured and recorded for each fluid to maximize the accuracyof the density values. The total deviation in density measure-ment was less than 0.0005 g/cm3.The densities of equilibrated water and carbon dioxide were
measured at 12 different test conditions. Results from multipleconsecutive measurements showed that the density valuesbecame stable after a short period of time and final values werecomparable to the expected equilibrium values. The densitydata measured in this study are listed in Table 2, and acomparison between these data and those available in theliterature is presented in Figure 5.25,26
3.2.2. Interfacial Tension. The IFT measurements in thisstudy cover pressures ranging from 500 to 1700 psi andtemperatures ranging from 35 to 60 °C, including thesubcritical and supercritical CO2 phases. A minimum of threemeasurements were performed under each experimentalcondition. The results are listed in Table 2. There are twogroups of IFT values reported for each temperature andpressure condition in this table. The first group, called IFTind,was measured independently by use of a regular rising bubbleand analyzed by ADSA method21 and are provided here forcomparison purposes only. The second group, called IFTdep,was calculated simultaneously during the contact anglemeasurement by the ADSA-NA method. The IFTdep resultsat various temperatures and pressures are plotted in Figure 6.This figure shows that the measured interfacial tensions arecomparable to the literature values27 (shown in the samefigure) and follow the same trend, that is, sharp decrease with
pressure increase in the subcritical region and then stabilizationof IFTs in the supercritical region. Additionally, IFTdep iscomparable to IFTind within 1−2 mN/m (see Table 2).However, our IFTdep data are valid only during water-recedingangle measurements. Figures 7b and 8b show a clear decreasein IFTdep during water-advancing angle measurement that ismore pronounced at HPHT conditions. This behavior did notoccur during the validation experiment (V7) for decane drops
Table 2. Density, Interfacial Tension, and Water-Advancing and -Receding Contact Angles of CO2/Water/Quartz Systems
pressure(psi)
temp(°C)
ρCO2
(kg/m3)ρH2O
(kg/m3)Δρ
(kg/m3)IFTind (ADSA)
(mN/m)IFTdep (ADSA-NA)
(mN/m)θA
(deg)θR
(deg)Δθ(deg)
1700 60 412.9 997.2 584.3 31.16 ± 0.45 33.28 ± 0.24 30.38 ± 0.37 13.23 ± 0.85 17.141300 60 233.4 995.4 762.0 31.98 ± 0.06 33.73 ± 1.04 34.03 ± 1.49 11.24 ± 1.04 22.79900 60 130.1 992.3 862.2 42.31 ± 1.99 42.96 ± 0.57 22.97 ± 1.06 8.22 ± 0.91 14.76500 60 62.5 988.6 926.1 50.78 ± 1.00 52.47 ± 0.42 20.59 ± 0.53 9.08 ± 1.47 11.511700 45 645.4 1004.3 359.0 NA 31.35 ± 0.49 24.63 ± 1.14 9.43 ± 0.73 15.201300 45 332.3 1002.8 670.5 NA 34.59 ± 0.17 25.22 ± 2.17 10.14 ± 0.40 15.08900 45 147.9 999.9 852.0 NA 41.09 ± 0.27 12.61 ± 1.37 8.84 ± 0.86 3.77500 45 66.2 995.4 929.2 NA 51.67 ± 0.16 16.12 ± 0.46 9.11 ± 0.61 7.011700 35 762.2 1011.5 249.3 32.29 ± 0.39 32.68 ± 0.54 19.47 ± 2.17 8.58 ± 0.97 10.901300 35 661.3 1010.4 349.2 32.84 ± 1.00 31.16 ± 0.24 18.13 ± 0.91 7.93 ± 1.28 10.20900 35 170.1 1007.9 837.8 38.26 ± 0.56 39.40 ± 1.45 11.91 ± 0.62 9.05 ± 0.84 2.86500 35 71.5 1003.3 931.7 51.09 ± 0.52 50.62 ± 0.27 12.11 ± 1.09 8.22 ± 0.65 3.89
Figure 5. Comparison between density values measured in this studywith values reported in the literature: (a) water-humidified CO2 phasedensity,25 (b) CO2-saturated water phase density.26.
Langmuir Article
dx.doi.org/10.1021/la3050863 | Langmuir 2013, 29, 6856−68666862

on Teflon surface. Possible explanations to this behavior areprovided in the Discussion section.3.2.3. Contact Angle. It was shown previously that a
pedestal-shaped needle facilitates interfacial tension calculationwhile measuring contact angle. This type of needle alsogenerates stable bubbles for measuring both advancing andreceding contact angles. Therefore, a pedestal-shaped needlewith 1.37 mm outer diameter was used for all the measure-ments in this section. Figure 7 shows a series of contact angle
images spanning over 60−4040 s of a CO2 bubble at thegaseous state (500 psi and 35 °C). The computed contactangles in Figure 7a reveal water-receding and -advancing anglesof 8° and 12°, respectively. Also in Figure 8a, which presentsthe same measurement for a supercritical CO2 bubble over100−2050 s at 1700 psi and 60 °C, the receding and advancingangles are 13° and 30°, respectively. The results for othertemperatures and pressures are summarized in Table 2. Thestandard deviation for these measurements was typically 1°.All the contact angle data at various temperatures and
pressures are plotted in Figure 9. The critical pressure of CO2 isabout 1070 psi, shown as vertical lines in this figure. Therefore,these isotherms undergo phase change from the subcritical fluid(gas) to the supercritical fluid. The contact angles are almostconstant in the subcritical region for all of the isotherms,suggesting that small pressure changes in this region do nothave any significant effect on the wettability of quartz surface.However, there is a jump in the contact angle values across theCO2 phase change line, which is more pronounced in theadvancing than receding angles. Figure 9b shows that only theisotherm at 60 °C follows this behavior, and any changes in theangles on the other two isotherms are within the experimentalerror range. Similar to the subcritical region, the supercriticalregion does not show any significant change in the contactangle with pressure increase. The temperature had the sameeffect on the contact angles of CO2 bubbles on quartz surface.Both advancing and receding contact angles increased withincreasing temperature except for the receding angles at the
Figure 6. Comparison of IFT results with literature values.27.
Figure 7. (a) Contact angle and radius and (b) IFT results for CO2bubble on quartz in water at 500 psi and 35 °C.
Figure 8. (a) Contact angle and radius and (b) IFT results for CO2bubble on quartz in water at 1700 psi and 60 °C.
Langmuir Article
dx.doi.org/10.1021/la3050863 | Langmuir 2013, 29, 6856−68666863

subcritical region, where changes in the contact angles arewithin experimental error. One reason for this behavior may bethe inability of the axisymmetric drop shape analysis techniqueto measure extremely small angles (<10°), as stated byNeumann et al.16 The last column in Table 2 lists the contactangle hysteresis (that is, differences between advancing andreceding angles). This quantity follows the same behavior as theadvancing angles since the receding angles were not changingsignificantly. For instance, the contact angle hysteresis wasabout 20° at the highest pressure and temperature (1700 psiand 60 °C) compared to only 2−3° at 500 psi and 35 °C.
4. DISCUSSION4.1. Interfacial Tension. Several plausible explanations can
be provided to elucidate the decrease in IFTdep during water-advancing angle measurements (as seen in Figures 7b and 8b).The first one is the possible reaction between CO2 and silanolgroups on the quartz surface that leave some reaction productson the surface. When the bubble is retracting, these productsmay detach from the solid and adsorb on the bubble and thusalter the interfacial tension. However, we performed scanningelectron microscopy (SEM) tests on a few quartz samples thatwere in contact with CO2-saturated water and water-saturatedCO2 at pressures and temperatures used in this study. Therewas no visible physical heterogeneity on the surface at the scaleof 10 nm (the resolution of SEM instrument) that does notsupport any change in solid surface due to reaction between
CO2 molecules and quartz surface. In addition, chemicalreaction between silanol groups and CO2 molecules is not well-supported in the literature. Another explanation for theobserved IFT decrease might be due to the rate of three-phase contact line movement during CO2 phase retraction.Neumann et al.16 pointed out that dynamic effects possiblydeform the shape of the bubble so that the underlying Laplaceequation is no longer valid. In this case, ADSA-NA responds byfinding an IFT value that satisfies the error function regardlessof the validity of the Laplace equation. Although the rates ofbubble contact line motion were less than 0.1 mm/min in thisstudy, the rate of water-advancing was slightly higher than thatof water-receding. For example, the rate of the test shown inFigure 8 was 0.04 mm/min during the advancing angle and0.06 mm/min during the receding angle measurement. Thismay explain why we see dynamic effects only in the water-advancing zone. Moreover this effect is more pronounced inFigure 8b than in Figure 7b, possibly because higher densityfluids (supercritical CO2) have much more momentum(dynamic effects) than lower density fluids (gaseous CO2). Itshould be noted that although the software does not giveaccurate IFT values in the water-advancing zone, these valueswould not affect the advancing contact angles. As explainedearlier, ADSA-NA utilizes the final optimum theoretical profile,regardless of the actual IFT value, to find the contact angle atthe solid surface level.
4.2. Contact Angle. The contact angle data measured inthis study can be used to interpret the wettability of the quartzsurface in contact with carbon dioxide. The advancing contactangle typically increases by 7−10° from the subcritical tosupercritical CO2 region. There is also a slight increase in thereceding angle at 60 °C, which is in accord with reports byChiquet et al.3 and Broseta et al.2 Surprisingly, this change isnot gradual but rather steep around the phase change region.Jung and Wan13 also observed a sudden increase in theequilibrium contact angles at the phase change region. Thissuggests that, in the presence of supercritical carbon dioxide,wettability of the quartz surface is altered toward less water-wetconditions. The advancing and receding contact angles did notchange significantly in the supercritical region ranging between1300 and 1700 psi. However, more studies at higher pressuresare needed to verify if this trend will remain unchanged.It is generally believed that once the temperature is above the
critical point of CO2 (∼31 °C), the temperature does not haveany prominent effect on the wettability of minerals. However,this study shows that increasing temperature from 35 to 60 °Cleads to an increase of water-advancing and -receding contactangles by 10° and 4°, respectively. These results indicate lesswater-wet quartz surfaces at higher temperatures in bothsupercritical and subcritical regions. This trend, to the best ofour knowledge, has not been previously reported in theliterature.Several explanations have been proposed for the observed
wettability change of quartz or glass surfaces in contact withsupercritical CO2.
3,7,28 Dissolution of carbon dioxide in watercan reduce the pH values from 7 to 3.3 The surface charge ofsilica particles is sensitive to the water solution pH. It isnegative at pH = 7 and reduced to almost zero at pH = 3.29
Therefore, the electrostatic repulsions due to electric doublelayer effects that are responsible for the stability of water filmswill reduce.30,31 The effect of pH on the thickness of water filmsconfined between CO2 and rock mineral was studied byTokunaga29 through a theoretical calculation of DLVO theory.
Figure 9. Effect of pressure on (a) water-advancing and (b) water-receding contact angles.
Langmuir Article
dx.doi.org/10.1021/la3050863 | Langmuir 2013, 29, 6856−68666864

Chiquet et al.3 suggested that this effect causes alteration ofsurface wettability and hence an increase in contact angle. Inaddition to the pH effect, there may be other interactionsbetween CO2 and quartz that promote changes in surfacewettability. For example, capping of the silanol groups onquartz surface by CO2 molecules through physisorption wasproposed by Dickson et al.7 or hydrogen bonding ofsupercritical CO2 molecules with the silanol groups wassuggested by Vishnyakov et al.28 These proposed reactionscan deter the water-wetness of quartz surfaces by reducing theinteractions between water molecules and SiO groups on thequartz.4.3. Possible Implications for CO2 Sequestration in
Deep Saline Aquifers. This study shows that quartz surfacesmay become slightly less water-wet with increase in pressureand temperature. Although more data are needed to confirmthis trend, the results of this work could have an importantimpact on the CO2 storage capacity and multiphase fluid flowin reservoir rocks. Chiquet el al.3 extensively discussed theeffect of this wettability change on the capillary breakthroughpressure of cap rocks. Less water-wet cap rocks may have lowercritical capillary pressures and may be more susceptible to CO2
leakage. In addition, the amount of capillary-trapped CO2 phaseis sensitive to the wettability of reservoir rocks. Less water-wetconditions result in less capillary trapping (lower residual CO2
saturation) due to imbibition (e.g., chase brine injection). Thishas also been observed in laboratory measurements of CO2
trapping by water imbibition in Berea and Nugget sandstonecore samples.32 In these experiments, for a given initial brinesaturation in the same sample, capillary-trapped supercriticalCO2 saturation was lower than that of gaseous CO2. It shouldbe noted that this comparison is based on the volume ofresidual CO2 remaining trapped in the porous medium. Sincethe density of CO2 increases considerably in the supercriticalstate compared to the gaseous state, the total residual mass ofcarbon dioxide inside the rock may be higher at higherpressures.
5. CONCLUSIONS
A novel apparatus for measuring interfacial tension and contactangle at high temperatures and pressures based on axisym-metric drop shape analysis with no-apex (ADSA-NA) methodwas developed and validated with a simple system. Densities,IFTs, and advancing and receding CAs of CO2/water/quartzsystems were determined for a wide range of pressures andtemperatures. The density and IFT data were successfullycompared with values available in the literature. However, weobserved new trends in contact angle variations with changes inpressure and temperature. The CA data show that the quartzsurface becomes less water-wet in the presence of supercriticalCO2. This wettability change occurs mostly in the phasetransition zone and then remains unchanged. Also, the increasein water contact angles with increasing temperature indicatesthat quartz surfaces are less water-wet in the presence of CO2 athigher temperatures. These observations may suggest thatdeeper saline aquifers with similar brine compositions will havelower cap rock threshold pressure. Furthermore, lower volumesof supercritical CO2 may be trapped by capillary forces due to,for instance, chase brine injection at higher values of pressureand temperature.
■ AUTHOR INFORMATIONCorresponding Author*E-mail [email protected] authors declare no competing financial interest.
■ ACKNOWLEDGMENTSThis work was supported by DOE Financial AssistanceAgreement DE-FE0004832. We also acknowledge the financialsupport of the School of Energy Resources at the University ofWyoming.
■ REFERENCES(1) Holt, T.; Jensen, J. I.; Lindeberg, E. Underground storage of CO2in aquifers and oil reservoirs. Energy Convers. Manage. 1995, 36 (6−9),535−538.(2) Broseta, D.; Tonnet, N.; Shah, V. Are rocks still water-wet in thepresence of dense CO2 or H2S? Geofluids 2012, 12 (4), 280−294.(3) Chiquet, P.; Broseta, D.; Thibeau, S. Wettability alteration ofcaprock minerals by carbon dioxide. Geofluids 2007, 7 (2), 112−122.(4) Espinoza, D.; Nicolas, N.; Santamarina, J. C. Water−CO2−mineral systems: interfacial tension, contact angle, and diffusion:implications to CO2 geological storage. Water Resour. Res. 2010, 46(7), No. W07537.(5) Bikkina, P. K. Contact angle measurements of CO2−water−quartz/calcite systems in the perspective of carbon sequestration. Int. J.Greenhouse Gas Control 2011, 5 (5), 1259−1271.(6) Chalbaud, C.; Robin, M.; Lombard, J. M.; Martin, F.; Egermann,P.; Bertin, H. Interfacial Tension Measurements and WettabilityEvaluation for Geological CO2 Storage. Adv. Water Resour. 2009, 32(1), 98−109.(7) Dickson, J. L.; Gupta, G.; Horozov, T. S.; Binks, B. P.; Johnston,K. P. Wetting phenomena at the CO2/water/glass interface. Langmuir2006, 22 (5), 2161−2170.(8) Yang, D. Y.; Gu, Y. A.; Tontiwachwuthikul, P. Wettabilitydetermination of the crude oil-reservoir brine-reservoir rock systemwith dissolution of CO2 at high pressures and elevated temperatures.Energy Fuels 2008, 22 (1), 504−509.(9) Sutjiadi-Sia, Y.; Jaeger, P.; Eggers, R. Interfacial phenomena ofaqueous systems in dense carbon dioxide. J. Supercrit. Fluids 2008, 46(3), 272−279.(10) Wang, S.; Edwards, I. M.; Clarens, A. F. Wettability phenomenaat the CO2−brine−mineral interface: Implications for geologic carbonsequestration. Environ Sci. Technol. 2013, 47 (1), 234−241.(11) Plug, W.-J.; Bruining, J. Capillary pressure for the sand−CO2−water system under various pressure conditions. Application to CO2sequestration. Adv. Water Resour. 2007, 30 (11), 2339−2353.(12) Plug, W.-J.; Mazumder, S.; Bruining, J. Capillary pressure andwettability behavior of CO2 sequestration in coal at elevated pressures.SPE J. 2008, 13 (4), 455−464.(13) Jung, J-W; Wan, J. Supercritical CO2 and ionic strength effectson wettability of silica surfaces: Equilibrium contact angle measure-ments. Energy Fuels 2012, 26 (9), 6053−6059.(14) Kim, Y.; Wang, J.; Kneafsey, T. J.; Tokunaga, T. K. Dewetting ofsilica surfaces upon reactions with supercritical CO2 and brine: Pore-scale studies in micromodel. Environ. Sci. Technol. 2012, 46 (7), 4228−4235.(15) Mahadevan, J. Comments on the paper titled ‘Contact anglemeasurements of CO2−water−quartz/calcite systems in the perspec-tive of carbon sequestration’: A case of contamination? Int. J.Greenhouse Gas Control 2012, 7, 261−262.(16) Neumann, A. W., David, R., Zuo, Y., Eds. Applied SurfaceThermodynamics, 2nd ed.; CRC Press: Boca Raton, FL, 2011.(17) Mohanty, K. K. Fluids in Porous Media: Two-Phase Distributionand Flow. Ph.D. Dissertation, University of Minnesota, 1981.(18) Hirasaki, G. Interfacial Phenomena in Oil Recovery; Morrow, N.,Ed.; Marcel Dekker Inc.: New York, 1990; Chapters 2 and 3.
Langmuir Article
dx.doi.org/10.1021/la3050863 | Langmuir 2013, 29, 6856−68666865

(19) Kalantarian, A.; David, R.; Newman, A. W. Methodology forhigh accuracy contact angle measurement. Langmuir 2009, 25 (24),14146−14154.(20) Kalantarian, A.; David, R.; Chen, J.; Neumann, A. W.Simultaneous measurement of contact angle and surface tensionusing axisymmetric drop-shape analysis-no apex (ADSA-NA).Langmuir 2011, 27 (7), 3485−3495.(21) Cheng, P.; Li, D.; Boruvka, L.; Rotenberg, Y.; Neumann, A. W.Automation of axisymmetric drop shape analysis for measurements ofinterfacial tensions and contact angles. Colloids Surf. 1990, 43 (2−4),151−167.(22) Choi, Y. S.; Srdjan, N. Determining the corrosive potential ofCO2 transport pipeline in high pCO2−water environments. Int. J.Greenhouse Gas Control 2011, 5 (4), 788−797.(23) Davis, J. R. ASM Specialty Handbook: Nickel, Cobalt, and TheirAlloys, 2nd ed.; ASM International: Materials Park, OH, 2007.(24) Tavana, H.; Petong, N.; Henning, A.; Grundke, K.; Neumann,A. W. Contact angles and coating film thickness. J. Adhes. 2005, 81 (1),29−39.(25) Span, R.; Wagner, W. A new equation of state for carbon dioxidecovering the fluid region from the triple-point temperature to 1100 Kat pressures up to 800 MPa. J. Phys. Chem. Ref. Data 1996, 25 (6),1509−1596.(26) Hebach, A.; Oberhof, A.; Dahmen, N. Density of water + carbondioxide at elevated pressures: Measurements and correlation. J. Chem.Eng. Data 2004, 49 (4), 950−953.(27) Hebach, A.; Oberhof, A.; Dahmen, N.; Kogel, A.; Ederer, H.;Dinjus, E. Interfacial tension at elevated pressures: Measurements andcorrelations in the water + carbon dioxide system. J. Chem. Eng. Data2002, 47 (6), 1540−1546.(28) Vishnyakov, A.; Shen, Y. Y.; Tomassone, M. S. Interactions ofsilica nanoparticles in supercritical carbon dioxide. J. Chem. Phys. 2008,129 (17), No. 174704.(29) Tokunaga, T. K. DLVO-based estimates of adsorbed water filmthicknesses in geologic CO2 reservoirs. Langmuir 2012, 28 (21),8001−8009.(30) Churaev, N. V. Surface forces in wetting films. Adv. ColloidInterface Sci. 2003, 103 (3), 197−218.(31) Boinovich, L.; Emelyanenko, A. Wetting and surface forces. Adv.Colloid Interface Sci. 2011, 165 (2), 60−69.(32) Akbarabadi, M.; Piri, M. Relative permeability hysteresis andcapillary trapping characteristics of supercritical CO2/brine systems:An experimental study at reservoir conditions. Adv. Water Resour.2013, 52, 190−206.
Langmuir Article
dx.doi.org/10.1021/la3050863 | Langmuir 2013, 29, 6856−68666866