wetland determination data form - in.gov · indicators for problematic soils 1 yes no are normal...
TRANSCRIPT

Page 2 of 2
Project/Site: W-488a 1u
VEGETATION (Species identified in all uppercase are non-native species.) Tree Stratum (Plot size: 10 meter radius)
% Cover Dominant Ind.Status Dominance Test Worksheet1. -- -- --2. -- -- -- (A)3. -- -- --4. -- -- -- (B)5. -- -- --6. -- -- -- (A/B)7. -- -- --8. -- -- -- Prevalence Index Worksheet9. -- -- --10. -- -- -- OBL spp. 0 x 1 = 0
0 FACW spp. 15 x 2 = 30
FAC spp. 25 x 3 = 75
FACU spp. 60 x 4 = 240
1. -- -- -- UPL spp. 0 x 5 = 0
2. -- -- --3. -- -- -- Total 100 (A) 345 (B)4. -- -- --5. -- -- -- Prevalence Index = B/A = 3.450
6. -- -- --7. -- -- --8. -- -- -- Hydrophytic Vegetation Indicators:9. -- -- -- Yes No Rapid Test for Hydrophytic Vegetation10. -- -- -- Yes No Dominance Test is > 50%
0 Yes No Prevalence Index is ≤ 3.0 *Yes No Morphological Adaptations (Explain) *Yes No Problem Hydrophytic Vegetation (Explain) *
1. 40 Y FACU2. 25 Y FAC3. 10 N FACU4. 10 N FACU5. 10 N FACW6 5 N FACW7. -- -- --8. -- -- --9. -- -- -- Sapling/Shrub -
10. -- -- --11. -- -- --12. -- -- --13. -- -- --14. -- -- --15. -- -- --
100
1. -- -- --2. -- -- --3. -- -- -- Hydrophytic Vegetation Present Yes No5. -- -- --4. -- -- --
0
Additional Remarks:--
* Indicators of hydric soil and wetland hydrology must be present, unless disturbed or problematic.
Woody Vine Stratum (Plot size: 10 meter radius)
Total Cover =
----
--
Pastured
--
Woody plants 3 in. (7.6cm) or more in diameter at breast height (DBH), regardless of height.
Woody plants less than 3 in. DBH and greater than 3.28 ft. tall.
Total Cover =
Midwest Region
WETLAND DETERMINATION DATA FORM
Carex grisea
---- 1
2
Species Name
Total Number of Dominant Species Across All Strata:
Number of Dominant Species that are OBL, FACW, or FAC:
--
--
Polygonum pensylvanicum
Total Cover =
--
--
----
Total Cover =
TARAXACUM OFFICINALE DACTYLIS GLOMERATA
--
Sapling/Shrub Stratum (Plot size: 5 meter radius)
--
GLECHOMA HEDERACEA
--
50.0%
--
Percent of Dominant Species That Are OBL, FACW, or FAC:
----
--
Poa pratensis
Tree -
Wetland ID:
Definitions of Vegetation Strata:
--
Herb -
Herb Stratum (Plot size: 2 meter radius)
--
All herbaceous (non-woody) plants, regardless of size, and woody plants less than 3 28 ft tall
Multiply by:
Remarks:
Sample PointIndiana Line 6B
----
--
--
-- Total % Cover of:
------
--
------
Woody Vines - All woody vines greater than 3.28 ft. in height.
--

Page 1 of 2
Project/Site: Stantec Project #: 193701313 Date: Applicant: County: Investigator #1: Investigator #2: State: Soil Unit: Wetland ID: Landform: Sample Point: Slope (%): 2-4 Latitude: -- Longitude: Datum: -- Community ID: Are climatic/hydrologic conditions on the site typical for this time of year? (If no, explain in remarks) Section: 18 Are Vegetation , Soil , or Hydrology significantly disturbed? Township: 36 N Are Vegetation , Soil , or Hydrology naturally problematic? Range: 5 Dir: WSUMMARY OF FINDINGS Hydrophytic Vegetation Present? Yes No Hydric Soils Present? Yes No Wetland Hydrology Present? Yes No Is This Sampling Point Within A Wetland? Yes No
HYDROLOGY
Wetland Hydrology Indicators (Check here if indicators are not present ):Primary: Secondary:
A1 - Surface Water B9 - Water-Stained Leaves B6 - Surface Soil CracksA2 - High Water Table B13 - Aquatic Fauna B10 - Drainage PatternsA3 - Saturation B14 - True Aquatic Plants C2 - Dry-Season Water TableB1 - Water Marks C1 - Hydrogen Sulfide Odor C8 - Crayfish BurrowsB2 - Sediment Deposits C3 - Oxidized Rhizospheres on Living Roots C9 - Saturation Visible on Aerial ImageryB3 - Drift Deposits C4 - Presence of Reduced Iron D1 - Stunted or Stressed PlantsB4 - Algal Mat or Crust C6 - Recent Iron Reduction in Tilled Soils D2 - Geomorphic PositionB5 - Iron Deposits C7 - Thin Muck Surface D5 - FAC-Neutral TestB7 - Inundation Visible on Aerial Imagery D9 - Gauge or Well DataB8 - Sparsely Vegetated Concave Surface Other (Explain)
Field Observations: Surface Water Present? Yes No Depth: N/A (in.) Water Table Present? Yes No Depth: N/A (in.) Saturation Present? Yes No Depth: N/A (in.)
SOILS Map Unit Name: Houghton muck, drained Series Drainage Class: very poorly Taxonomy (Subgroup): Typic Haplosaprists Field Observations Confirm Mapped Type? Yes No
Top BottomDepth Depth Horizon % % Type Location
0 9 1 10YR 2/1 -- -- -- -- -- --9 16 2 10YR 2/1 90 7.5YR 4/4 10 C M-- -- -- -- -- -- -- -- -- -- ---- -- -- -- -- -- -- -- -- -- ---- -- -- -- -- -- -- -- -- -- ---- -- -- -- -- -- -- -- -- -- ---- -- -- -- -- -- -- -- -- -- ---- -- -- -- -- -- -- -- -- -- --
NRCS Hydric Soil Field Indicators (check here if indicators are not present ):A1- Histosol S4 - Sandy Gleyed Matrix A16 - Coast Prairie Redox A2 - Histic Epipedon S5 - Sandy Redox F12 - Iron-Manganese Masses A3 - Black Histic S6 - Stripped Matrix Other (Explain in Remarks)A4 - Hydrogen Sulfide F1 - Loamy Muck MineralA5 - Stratified Layers F2 - Loamy Gleyed MatrixA10 - 2 cm Muck F3 - Depleted MatrixA11 - Depleted Below Dark Surface F6 - Redox Dark SurfaceA12 - Thick Dark Surface F7 - Depleted Dark SurfaceS1 - Sandy Muck Mineral F8 - Redox DepressionsS3 - 5 cm Mucky Peat or Peat 1 Indicators of hydrophytic vegetation and wetland hydrology must be present, unless disturbed or problematic.
H. StoffsPorterIndianaW-488a1w
N/A
Pasture has affected the plant species composition and the circumstances. Area has seasonal hydrology.
Hillslope Local Relief: ----
--
Color (Moist)Mottles
PFO
------
Remarks: While no primary hydrology indicators were observed, Geomorphic Position and the FAC-Neutral Test were observed as secondary indicators. Wetland soils and vegetation support a wetland determination.
--
Muck--
No
sapric muck Remarks:
Texture(e.g. clay, sand, loam)
Yes
Matrix
--Houghton muck, drained
Indiana Line 6B
NWI/WWI Classification:
Describe Recorded Data (stream gauge, monitoring well, aerial photos, previous inspections), if available:
MuckColor (Moist)
Restrictive Layer (If Observed)
Remarks:
Type: N/A Depth: N/A Hydric Soil Present?
Profile Description (Describe to the depth needed to document the indicator or confirm the absence of indicators.) (Type: C=Concentration, D=Depletion, RM=Reduced Matrix, CS=Covered/Coated Sand Grains; Locaiton: PL=Pore Lining, M=Matrix)
EnbridgeE. Parker
WETLAND DETERMINATION DATA FORMMidwest Region
Indicators for Problematic Soils 1
Yes NoAre normal circumstances present?
Yes No
Wetland Hydrology Present? Yes No
11/11/11

Page 2 of 2
Project/Site: W-488a 1w
VEGETATION (Species identified in all uppercase are non-native species.) Tree Stratum (Plot size: 10 meter radius)
% Cover Dominant Ind.Status Dominance Test Worksheet1. 60 Y FACW2. 20 Y FACW (A)3. -- -- --4. -- -- -- (B)5. -- -- --6. -- -- -- (A/B)7. -- -- --8. -- -- -- Prevalence Index Worksheet9. -- -- --10. -- -- -- OBL spp. 0 x 1 = 0
80 FACW spp. 145 x 2 = 290
FAC spp. 0 x 3 = 0
FACU spp. 70 x 4 = 280
1. 15 Y FACW UPL spp. 0 x 5 = 0
2. 5 Y FACU3. 5 Y FACU Total 215 (A) 570 (B)4. -- -- --5. -- -- -- Prevalence Index = B/A = 2.651
6. -- -- --7. -- -- --8. -- -- -- Hydrophytic Vegetation Indicators:9. -- -- -- Yes No Rapid Test for Hydrophytic Vegetation10. -- -- -- Yes No Dominance Test is > 50%
25 Yes No Prevalence Index is ≤ 3.0 *Yes No Morphological Adaptations (Explain) *Yes No Problem Hydrophytic Vegetation (Explain) *
1. 50 Y FACU2. 15 Y FACW3. 15 Y FACW4. 5 N FACW5. 10 N FACU6 15 Y FACW7. -- -- --8. -- -- --9. -- -- -- Sapling/Shrub -
10. -- -- --11. -- -- --12. -- -- --13. -- -- --14. -- -- --15. -- -- --
110
1. -- -- --2. -- -- --3. -- -- -- Hydrophytic Vegetation Present Yes No5. -- -- --4. -- -- --
0
Additional Remarks:
Remarks:
Sample PointIndiana Line 6B
----
--
--
-- Total % Cover of:
------
--
------
Woody Vines - All woody vines greater than 3.28 ft. in height.
--
----
--
Polygonum pensylvanicum
Tree -
Wetland ID:
Definitions of Vegetation Strata:
--
Herb -
Herb Stratum (Plot size: 2 meter radius)
--
All herbaceous (non-woody) plants, regardless of size, and woody plants less than 3 28 ft tall
Multiply by:
66.7%
--
Percent of Dominant Species That Are OBL, FACW, or FAC:
--
--
Impatiens capensis
Total Cover =
Acer saccharinum
ROSA MULTIFLORA
----
Total Cover =
PHALARIS ARUNDINACEACarex grisea
LONICERA X BELLA
Sapling/Shrub Stratum (Plot size: 5 meter radius)
--
GLECHOMA HEDERACEA
--
Acer saccharinum Ulmus americana 6
9
Species Name
Total Number of Dominant Species Across All Strata:
Number of Dominant Species that are OBL, FACW, or FAC:
--
* Indicators of hydric soil and wetland hydrology must be present, unless disturbed or problematic.
Woody Vine Stratum (Plot size: 10 meter radius)
Total Cover =
----
--
Pasture
--
Woody plants 3 in. (7.6cm) or more in diameter at breast height (DBH), regardless of height.
Woody plants less than 3 in. DBH and greater than 3.28 ft. tall.
Total Cover =
Midwest Region
WETLAND DETERMINATION DATA FORM
FESTUCA ARUNDINACEA

Page 1 of 2
Project/Site: Stantec Project #: 193701313 Date: Applicant: County: Investigator #1: Investigator #2: State: Soil Unit: Wetland ID: Landform: Sample Point: Slope (%): 4-5 Latitude: -- Longitude: Datum: -- Community ID: Are climatic/hydrologic conditions on the site typical for this time of year? (If no, explain in remarks) Section: 18 Are Vegetation , Soil , or Hydrology significantly disturbed? Township: 36 N Are Vegetation , Soil , or Hydrology naturally problematic? Range: 5 Dir: WSUMMARY OF FINDINGS Hydrophytic Vegetation Present? Yes No Hydric Soils Present? Yes No Wetland Hydrology Present? Yes No Is This Sampling Point Within A Wetland? Yes No
HYDROLOGY
Wetland Hydrology Indicators (Check here if indicators are not present ):Primary: Secondary:
A1 - Surface Water B9 - Water-Stained Leaves B6 - Surface Soil CracksA2 - High Water Table B13 - Aquatic Fauna B10 - Drainage PatternsA3 - Saturation B14 - True Aquatic Plants C2 - Dry-Season Water TableB1 - Water Marks C1 - Hydrogen Sulfide Odor C8 - Crayfish BurrowsB2 - Sediment Deposits C3 - Oxidized Rhizospheres on Living Roots C9 - Saturation Visible on Aerial ImageryB3 - Drift Deposits C4 - Presence of Reduced Iron D1 - Stunted or Stressed PlantsB4 - Algal Mat or Crust C6 - Recent Iron Reduction in Tilled Soils D2 - Geomorphic PositionB5 - Iron Deposits C7 - Thin Muck Surface D5 - FAC-Neutral TestB7 - Inundation Visible on Aerial Imagery D9 - Gauge or Well DataB8 - Sparsely Vegetated Concave Surface Other (Explain)
Field Observations: Surface Water Present? Yes No Depth: N/A (in.) Water Table Present? Yes No Depth: N/A (in.) Saturation Present? Yes No Depth: N/A (in.)
SOILS Map Unit Name: Whitaker loam Series Drainage Class: somewhat poorly Taxonomy (Subgroup): Aeric Endoaqualfs Field Observations Confirm Mapped Type? Yes No
Top BottomDepth Depth Horizon % % Type Location
0 27 1 10YR 3/1 -- -- -- -- -- --27 29 2 10YR 4/2 -- -- -- -- -- ---- -- -- -- -- -- -- -- -- -- ---- -- -- -- -- -- -- -- -- -- ---- -- -- -- -- -- -- -- -- -- ---- -- -- -- -- -- -- -- -- -- ---- -- -- -- -- -- -- -- -- -- ---- -- -- -- -- -- -- -- -- -- --
NRCS Hydric Soil Field Indicators (check here if indicators are not present ):A1- Histosol S4 - Sandy Gleyed Matrix A16 - Coast Prairie Redox A2 - Histic Epipedon S5 - Sandy Redox F12 - Iron-Manganese Masses A3 - Black Histic S6 - Stripped Matrix Other (Explain in Remarks)A4 - Hydrogen Sulfide F1 - Loamy Muck MineralA5 - Stratified Layers F2 - Loamy Gleyed MatrixA10 - 2 cm Muck F3 - Depleted MatrixA11 - Depleted Below Dark Surface F6 - Redox Dark SurfaceA12 - Thick Dark Surface F7 - Depleted Dark SurfaceS1 - Sandy Muck Mineral F8 - Redox DepressionsS3 - 5 cm Mucky Peat or Peat 1 Indicators of hydrophytic vegetation and wetland hydrology must be present, unless disturbed or problematic.
H. StoffsPorterIndianaW-488a2u
N/A
There have been recent heavy rains which are atypical for this time of year.
Hillslope Local Relief: ----
--
Color (Moist)Mottles
Upland
------
Remarks: None obeserved
--
Silty Clay--
No
High organic content but non-organic. Remarks:
Texture(e.g. clay, sand, loam)
Yes
Matrix
--Whitaker loam
Indiana Line 6B
NWI/WWI Classification:
Describe Recorded Data (stream gauge, monitoring well, aerial photos, previous inspections), if available:
Silt loamColor (Moist)
Restrictive Layer (If Observed)
Remarks:
Type: N/A Depth: N/A Hydric Soil Present?
Profile Description (Describe to the depth needed to document the indicator or confirm the absence of indicators.) (Type: C=Concentration, D=Depletion, RM=Reduced Matrix, CS=Covered/Coated Sand Grains; Locaiton: PL=Pore Lining, M=Matrix)
EnbridgeE. Parker
WETLAND DETERMINATION DATA FORMMidwest Region
Indicators for Problematic Soils 1
Yes NoAre normal circumstances present?
Yes No
Wetland Hydrology Present? Yes No
11/11/11

Page 2 of 2
Project/Site: W-488a 2u
VEGETATION (Species identified in all uppercase are non-native species.) Tree Stratum (Plot size: 10 meter radius)
% Cover Dominant Ind.Status Dominance Test Worksheet1. 15 Y FAC2. 20 Y FACU (A)3. 15 Y FACW4. -- -- -- (B)5. -- -- --6. -- -- -- (A/B)7. -- -- --8. -- -- -- Prevalence Index Worksheet9. -- -- --10. -- -- -- OBL spp. 0 x 1 = 0
50 FACW spp. 15 x 2 = 30
FAC spp. 15 x 3 = 45
FACU spp. 90 x 4 = 360
1. 5 Y FACU UPL spp. 65 x 5 = 325
2. -- -- --3. -- -- -- Total 185 (A) 760 (B)4. -- -- --5. -- -- -- Prevalence Index = B/A = 4.108
6. -- -- --7. -- -- --8. -- -- -- Hydrophytic Vegetation Indicators:9. -- -- -- Yes No Rapid Test for Hydrophytic Vegetation10. -- -- -- Yes No Dominance Test is > 50%
5 Yes No Prevalence Index is ≤ 3.0 *Yes No Morphological Adaptations (Explain) *Yes No Problem Hydrophytic Vegetation (Explain) *
1. 40 Y FACU2. 25 N FACU3. 50 Y UPL4. 15 N UPL5. -- --6 -- -- --7. -- -- --8. -- -- --9. -- -- -- Sapling/Shrub -
10. -- -- --11. -- -- --12. -- -- --13. -- -- --14. -- -- --15. -- -- --
130
1. -- -- --2. -- -- --3. -- -- -- Hydrophytic Vegetation Present Yes No5. -- -- --4. -- -- --
0
Additional Remarks:
Remarks:
Sample PointIndiana Line 6B
----
--
--
-- Total % Cover of:
------
--
------
Woody Vines - All woody vines greater than 3.28 ft. in height.
--
----
--
CIRSIUM ARVENSE
Tree -
Wetland ID:
Definitions of Vegetation Strata:
--
Herb -
Herb Stratum (Plot size: 2 meter radius)
--
All herbaceous (non-woody) plants, regardless of size, and woody plants less than 3 28 ft tall
Multiply by:
33.3%
--
Percent of Dominant Species That Are OBL, FACW, or FAC:
--
--
--
Total Cover =
Lonicera x bella
--
--Ulmus americana
Total Cover =
BROMUS INERMIS ARCTIUM MINUS
--
Sapling/Shrub Stratum (Plot size: 5 meter radius)
--
DACTYLIS GLOMERATA
--
Quercus macrocarpaPrunus serotina 2
6
Species Name
Total Number of Dominant Species Across All Strata:
Number of Dominant Species that are OBL, FACW, or FAC:
--
* Indicators of hydric soil and wetland hydrology must be present, unless disturbed or problematic.
Woody Vine Stratum (Plot size: 10 meter radius)
Total Cover =
----
--
--
--
Woody plants 3 in. (7.6cm) or more in diameter at breast height (DBH), regardless of height.
Woody plants less than 3 in. DBH and greater than 3.28 ft. tall.
Total Cover =
Midwest Region
WETLAND DETERMINATION DATA FORM
--

Page 1 of 2
Project/Site: Stantec Project #: 193701660 Date: Applicant: County: Investigator #1: Investigator #2: State: Soil Unit: Wetland ID: Landform: Sample Point: Slope (%): 0 Latitude: -- Longitude: Datum: -- Community ID: Are climatic/hydrologic conditions on the site typical for this time of year? (If no, explain in remarks) Section: 18 Are Vegetation , Soil , or Hydrology significantly disturbed? Township: 36 N Are Vegetation , Soil , or Hydrology naturally problematic? Range: 5 Dir: WSUMMARY OF FINDINGS Hydrophytic Vegetation Present? Yes No Hydric Soils Present? Yes No Wetland Hydrology Present? Yes No Is This Sampling Point Within A Wetland? Yes No
HYDROLOGY
Wetland Hydrology Indicators (Check here if indicators are not present ):Primary: Secondary:
A1 - Surface Water B9 - Water-Stained Leaves B6 - Surface Soil CracksA2 - High Water Table B13 - Aquatic Fauna B10 - Drainage PatternsA3 - Saturation B14 - True Aquatic Plants C2 - Dry-Season Water TableB1 - Water Marks C1 - Hydrogen Sulfide Odor C8 - Crayfish BurrowsB2 - Sediment Deposits C3 - Oxidized Rhizospheres on Living Roots C9 - Saturation Visible on Aerial ImageryB3 - Drift Deposits C4 - Presence of Reduced Iron D1 - Stunted or Stressed PlantsB4 - Algal Mat or Crust C6 - Recent Iron Reduction in Tilled Soils D2 - Geomorphic PositionB5 - Iron Deposits C7 - Thin Muck Surface D5 - FAC-Neutral TestB7 - Inundation Visible on Aerial Imagery D9 - Gauge or Well DataB8 - Sparsely Vegetated Concave Surface Other (Explain)
Field Observations: Surface Water Present? Yes No Depth: n/a (in.) Water Table Present? Yes No Depth: >18 (in.) Saturation Present? Yes No Depth: >18 (in.)
SOILS Map Unit Name: Riddles silt loam, 2 to 6 percent slopes Series Drainage Class: well Taxonomy (Subgroup): Typic Hapludalfs Field Observations Confirm Mapped Type? Yes No
Top BottomDepth Depth Horizon % % Type Location
0 5 1 10YR 3/3 100 -- -- -- -- --5 18 2 10YR 4/4 100 -- -- -- -- ---- -- -- -- -- -- -- -- -- -- ---- -- -- -- -- -- -- -- -- -- ---- -- -- -- -- -- -- -- -- -- ---- -- -- -- -- -- -- -- -- -- ---- -- -- -- -- -- -- -- -- -- ---- -- -- -- -- -- -- -- -- -- --
NRCS Hydric Soil Field Indicators (check here if indicators are not present ):A1- Histosol S4 - Sandy Gleyed Matrix A16 - Coast Prairie Redox A2 - Histic Epipedon S5 - Sandy Redox F12 - Iron-Manganese Masses A3 - Black Histic S6 - Stripped Matrix Other (Explain in Remarks)A4 - Hydrogen Sulfide F1 - Loamy Muck MineralA5 - Stratified Layers F2 - Loamy Gleyed MatrixA10 - 2 cm Muck F3 - Depleted MatrixA11 - Depleted Below Dark Surface F6 - Redox Dark SurfaceA12 - Thick Dark Surface F7 - Depleted Dark SurfaceS1 - Sandy Muck Mineral F8 - Redox DepressionsS3 - 5 cm Mucky Peat or Peat 1 Indicators of hydrophytic vegetation and wetland hydrology must be present, unless disturbed or problematic.
WETLAND DETERMINATION DATA FORMMidwest Region
Indicators for Problematic Soils 1
Yes NoAre normal circumstances present?
Yes No
Wetland Hydrology Present? Yes No
04/25/12
--Riddles silt loam, 2 to 6 percent slopes
Line 6B Phase 2 Replacement Project
NWI/WWI Classification:
Describe Recorded Data (stream gauge, monitoring well, aerial photos, previous inspections), if available:
sandy loamColor (Moist)
Restrictive Layer (If Observed)
Remarks:
Type: N/A Depth: N/A Hydric Soil Present?
Profile Description (Describe to the depth needed to document the indicator or confirm the absence of indicators.) (Type: C=Concentration, D=Depletion, RM=Reduced Matrix, CS=Covered/Coated Sand Grains; Locaiton: PL=Pore Lining, M=Matrix)
EnbridgeD. Tersteeg
----
Remarks: --
--
sandy clay loam--
No
-- Remarks:
Texture(e.g. clay, sand, loam)
Yes
Matrix
n/a
--
terrace Local Relief: none --
--
Color (Moist)Mottles
upland
--
A. BraschPorterIndianaW-488b1u

Page 2 of 2
Project/Site: W-488b 1u
VEGETATION (Species identified in all uppercase are non-native species.) Tree Stratum (Plot size: 10 meter radius)
% Cover Dominant Ind.Status Dominance Test Worksheet1. 60 Y FACW2. 10 N FACW (A)3. -- -- --4. -- -- -- (B)5. -- -- --6. -- -- -- (A/B)7. -- -- --8. -- -- -- Prevalence Index Worksheet9. -- -- --10. -- -- -- OBL spp. 0 x 1 = 0
70 FACW spp. 85 x 2 = 170
FAC spp. 20 x 3 = 60
FACU spp. 110 x 4 = 440
1. 30 Y FACU UPL spp. 0 x 5 = 0
2. 10 Y FACU3. -- -- -- Total 215 (A) 670 (B)4. -- -- --5. -- -- -- Prevalence Index = B/A = 3.116
6. -- -- --7. -- -- --8. -- -- -- Hydrophytic Vegetation Indicators:9. -- -- -- Yes No Rapid Test for Hydrophytic Vegetation10. -- -- -- Yes No Dominance Test is > 50%
40 Yes No Prevalence Index is ≤ 3.0 *Yes No Morphological Adaptations (Explain) *Yes No Problem Hydrophytic Vegetation (Explain) *
1. 30 Y FACU2. 5 N FACW3. 10 N FACW4. 30 Y FACU5. 20 N FAC6 10 N FACU7. -- -- --8. -- -- --9. -- -- -- Sapling/Shrub -
10. -- -- --11. -- -- --12. -- -- --13. -- -- --14. -- -- --15. -- -- --
105
1. -- -- --2. -- -- --3. -- -- -- Hydrophytic Vegetation Present Yes No5. -- -- --4. -- -- --
0
Additional Remarks:--
* Indicators of hydric soil and wetland hydrology must be present, unless disturbed or problematic.
Woody Vine Stratum (Plot size: 10 meter radius)
Total Cover =
----
--
--
--
Woody plants 3 in. (7.6cm) or more in diameter at breast height (DBH), regardless of height.
Woody plants less than 3 in. DBH and greater than 3.28 ft. tall.
Total Cover =
Midwest Region
WETLAND DETERMINATION DATA FORM
Viola sororia
Acer negundo Ulmus americana 1
5
Species Name
Total Number of Dominant Species Across All Strata:
Number of Dominant Species that are OBL, FACW, or FAC:
--
--
TARAXACUM OFFICINALE
Total Cover =
LONICERA TATARICA
--
----
Total Cover =
Thalictrum dasycarpumGalium aparine
ROSA MULTIFLORA
Sapling/Shrub Stratum (Plot size: 5 meter radius)
--
Solidago canadensis
--
20.0%
--
Percent of Dominant Species That Are OBL, FACW, or FAC:
----
--
Impatiens capensis
Tree -
Wetland ID:
Definitions of Vegetation Strata:
--
Herb -
Herb Stratum (Plot size: 2 meter radius)
--
All herbaceous (non-woody) plants, regardless of size, and woody plants less than 3 28 ft tall
Multiply by:
Remarks:
Sample PointLine 6B Phase 2 Replacement Project
----
--
--
-- Total % Cover of:
------
--
------
Woody Vines - All woody vines greater than 3.28 ft. in height.
--

Page 1 of 2
Project/Site: Stantec Project #: 193701660 Date: Applicant: County: Investigator #1: Investigator #2: State: Soil Unit: Wetland ID: Landform: Sample Point: Slope (%): 0 Latitude: -- Longitude: Datum: -- Community ID: Are climatic/hydrologic conditions on the site typical for this time of year? (If no, explain in remarks) Section: 18 Are Vegetation , Soil , or Hydrology significantly disturbed? Township: 36 N Are Vegetation , Soil , or Hydrology naturally problematic? Range: 5 Dir: WSUMMARY OF FINDINGS Hydrophytic Vegetation Present? Yes No Hydric Soils Present? Yes No Wetland Hydrology Present? Yes No Is This Sampling Point Within A Wetland? Yes No
HYDROLOGY
Wetland Hydrology Indicators (Check here if indicators are not present ):Primary: Secondary:
A1 - Surface Water B9 - Water-Stained Leaves B6 - Surface Soil CracksA2 - High Water Table B13 - Aquatic Fauna B10 - Drainage PatternsA3 - Saturation B14 - True Aquatic Plants C2 - Dry-Season Water TableB1 - Water Marks C1 - Hydrogen Sulfide Odor C8 - Crayfish BurrowsB2 - Sediment Deposits C3 - Oxidized Rhizospheres on Living Roots C9 - Saturation Visible on Aerial ImageryB3 - Drift Deposits C4 - Presence of Reduced Iron D1 - Stunted or Stressed PlantsB4 - Algal Mat or Crust C6 - Recent Iron Reduction in Tilled Soils D2 - Geomorphic PositionB5 - Iron Deposits C7 - Thin Muck Surface D5 - FAC-Neutral TestB7 - Inundation Visible on Aerial Imagery D9 - Gauge or Well DataB8 - Sparsely Vegetated Concave Surface Other (Explain)
Field Observations: Surface Water Present? Yes No Depth: n/a (in.) Water Table Present? Yes No Depth: 6 (in.) Saturation Present? Yes No Depth: 0 (in.)
SOILS Map Unit Name: Riddles silt loam, 2 to 6 percent slopes Series Drainage Class: well Taxonomy (Subgroup): Typic Hapludalfs Field Observations Confirm Mapped Type? Yes No
Top BottomDepth Depth Horizon % % Type Location
0 4 1 10YR 3/1 90 10YR 4/6 10 C M / PL4 18 2 10YR 4/2 80 10YR 4/6 20 C M-- -- -- -- -- -- -- -- -- -- ---- -- -- -- -- -- -- -- -- -- ---- -- -- -- -- -- -- -- -- -- ---- -- -- -- -- -- -- -- -- -- ---- -- -- -- -- -- -- -- -- -- ---- -- -- -- -- -- -- -- -- -- --
NRCS Hydric Soil Field Indicators (check here if indicators are not present ):A1- Histosol S4 - Sandy Gleyed Matrix A16 - Coast Prairie Redox A2 - Histic Epipedon S5 - Sandy Redox F12 - Iron-Manganese Masses A3 - Black Histic S6 - Stripped Matrix Other (Explain in Remarks)A4 - Hydrogen Sulfide F1 - Loamy Muck MineralA5 - Stratified Layers F2 - Loamy Gleyed MatrixA10 - 2 cm Muck F3 - Depleted MatrixA11 - Depleted Below Dark Surface F6 - Redox Dark SurfaceA12 - Thick Dark Surface F7 - Depleted Dark SurfaceS1 - Sandy Muck Mineral F8 - Redox DepressionsS3 - 5 cm Mucky Peat or Peat 1 Indicators of hydrophytic vegetation and wetland hydrology must be present, unless disturbed or problematic.
WETLAND DETERMINATION DATA FORMMidwest Region
Indicators for Problematic Soils 1
Yes NoAre normal circumstances present?
Yes No
Wetland Hydrology Present? Yes No
04/25/12
--Riddles silt loam, 2 to 6 percent slopes
Line 6B Phase 2 Replacement Project
NWI/WWI Classification:
Describe Recorded Data (stream gauge, monitoring well, aerial photos, previous inspections), if available:
silty clay loamColor (Moist)
Restrictive Layer (If Observed)
Remarks:
Type: N/A Depth: N/A Hydric Soil Present?
Profile Description (Describe to the depth needed to document the indicator or confirm the absence of indicators.) (Type: C=Concentration, D=Depletion, RM=Reduced Matrix, CS=Covered/Coated Sand Grains; Locaiton: PL=Pore Lining, M=Matrix)
EnbridgeD. Tersteeg
----
Remarks: --
--
clay loam--
No
-- Remarks:
Texture(e.g. clay, sand, loam)
Yes
Matrix
n/a
Forested wetland Type 7, green ash and American elm. Herbaceous dominated by jewel weed and skunk cabbage.
depression Local Relief: concave --
--
Color (Moist)Mottles
FO1
--
A. BraschPorterIndianaW-488b1w

Page 2 of 2
Project/Site: W-488b 1w
VEGETATION (Species identified in all uppercase are non-native species.) Tree Stratum (Plot size: 10 meter radius)
% Cover Dominant Ind.Status Dominance Test Worksheet1. 10 Y FACW2. 20 Y FACW (A)3. -- -- --4. -- -- -- (B)5. -- -- --6. -- -- -- (A/B)7. -- -- --8. -- -- -- Prevalence Index Worksheet9. -- -- --10. -- -- -- OBL spp. 50 x 1 = 50
30 FACW spp. 80 x 2 = 160
FAC spp. 0 x 3 = 0
FACU spp. 5 x 4 = 20
1. 5 Y FACW UPL spp. 5 x 5 = 25
2. 5 Y FACW3. -- -- -- Total 140 (A) 255 (B)4. -- -- --5. -- -- -- Prevalence Index = B/A = 1.821
6. -- -- --7. -- -- --8. -- -- -- Hydrophytic Vegetation Indicators:9. -- -- -- Yes No Rapid Test for Hydrophytic Vegetation10. -- -- -- Yes No Dominance Test is > 50%
10 Yes No Prevalence Index is ≤ 3.0 *Yes No Morphological Adaptations (Explain) *Yes No Problem Hydrophytic Vegetation (Explain) *
1. 40 Y OBL2. 40 Y FACW3. 5 N NI4. 5 N FACU5. 10 N OBL6 -- -- --7. -- -- --8. -- -- --9. -- -- -- Sapling/Shrub -
10. -- -- --11. -- -- --12. -- -- --13. -- -- --14. -- -- --15. -- -- --
100
1. -- -- --2. -- -- --3. -- -- -- Hydrophytic Vegetation Present Yes No5. -- -- --4. -- -- --
0
Additional Remarks:--
* Indicators of hydric soil and wetland hydrology must be present, unless disturbed or problematic.
Woody Vine Stratum (Plot size: 10 meter radius)
Total Cover =
----
--
--
--
Woody plants 3 in. (7.6cm) or more in diameter at breast height (DBH), regardless of height.
Woody plants less than 3 in. DBH and greater than 3.28 ft. tall.
Total Cover =
Midwest Region
WETLAND DETERMINATION DATA FORM
Caltha palustris
Ulmus americana Fraxinus pennsylvanica 6
6
Species Name
Total Number of Dominant Species Across All Strata:
Number of Dominant Species that are OBL, FACW, or FAC:
--
--
--
Total Cover =
Sambucus canadensis
--
----
Total Cover =
Carex sp.Cardamine concatenata
Lindera benzoin
Sapling/Shrub Stratum (Plot size: 5 meter radius)
--
Symplocarpus foetidus
--
100.0%
--
Percent of Dominant Species That Are OBL, FACW, or FAC:
----
--
Impatiens capensis
Tree -
Wetland ID:
Definitions of Vegetation Strata:
--
Herb -
Y
--
All herbaceous (non-woody) plants, regardless of size, and woody plants less than 3 28 ft tall
Multiply by:
Remarks:
Sample PointLine 6B Phase 2 Replacement Project
----
--
--
-- Total % Cover of:
------
--
------
Woody Vines - All woody vines greater than 3.28 ft. in height.
--

Page 1 of 2
Project/Site: Stantec Project #: 193701660 Date: Applicant: County: Investigator #1: Investigator #2: State: Soil Unit: Wetland ID: Landform: Sample Point: Slope (%): -- Latitude: -- Longitude: Datum: -- Community ID: Are climatic/hydrologic conditions on the site typical for this time of year? (If no, explain in remarks) Section: 19 Are Vegetation , Soil , or Hydrology significantly disturbed? Township: 36 N Are Vegetation , Soil , or Hydrology naturally problematic? Range: 5 Dir: WSUMMARY OF FINDINGS Hydrophytic Vegetation Present? Yes No Hydric Soils Present? Yes No Wetland Hydrology Present? Yes No Is This Sampling Point Within A Wetland? Yes No
HYDROLOGY
Wetland Hydrology Indicators (Check here if indicators are not present ):Primary: Secondary:
A1 - Surface Water B9 - Water-Stained Leaves B6 - Surface Soil CracksA2 - High Water Table B13 - Aquatic Fauna B10 - Drainage PatternsA3 - Saturation B14 - True Aquatic Plants C2 - Dry-Season Water TableB1 - Water Marks C1 - Hydrogen Sulfide Odor C8 - Crayfish BurrowsB2 - Sediment Deposits C3 - Oxidized Rhizospheres on Living Roots C9 - Saturation Visible on Aerial ImageryB3 - Drift Deposits C4 - Presence of Reduced Iron D1 - Stunted or Stressed PlantsB4 - Algal Mat or Crust C6 - Recent Iron Reduction in Tilled Soils D2 - Geomorphic PositionB5 - Iron Deposits C7 - Thin Muck Surface D5 - FAC-Neutral TestB7 - Inundation Visible on Aerial Imagery D9 - Gauge or Well DataB8 - Sparsely Vegetated Concave Surface Other (Explain)
Field Observations: Surface Water Present? Yes No Depth: n/a (in.) Water Table Present? Yes No Depth: >18 (in.) Saturation Present? Yes No Depth: >18 (in.)
SOILS Map Unit Name: Morley silt loam Series Drainage Class: moderately well Taxonomy (Subgroup): Oxyaquic Hapludalfs Field Observations Confirm Mapped Type? Yes No
Top BottomDepth Depth Horizon % % Type Location
0 6 1 10YR 3/3 100 -- -- -- -- --6 18 2 10YR 4/6 100 -- -- -- -- ---- -- -- -- -- -- -- -- -- -- ---- -- -- -- -- -- -- -- -- -- ---- -- -- -- -- -- -- -- -- -- ---- -- -- -- -- -- -- -- -- -- ---- -- -- -- -- -- -- -- -- -- ---- -- -- -- -- -- -- -- -- -- --
NRCS Hydric Soil Field Indicators (check here if indicators are not present ):A1- Histosol S4 - Sandy Gleyed Matrix A16 - Coast Prairie Redox A2 - Histic Epipedon S5 - Sandy Redox F12 - Iron-Manganese Masses A3 - Black Histic S6 - Stripped Matrix Other (Explain in Remarks)A4 - Hydrogen Sulfide F1 - Loamy Muck MineralA5 - Stratified Layers F2 - Loamy Gleyed MatrixA10 - 2 cm Muck F3 - Depleted MatrixA11 - Depleted Below Dark Surface F6 - Redox Dark SurfaceA12 - Thick Dark Surface F7 - Depleted Dark SurfaceS1 - Sandy Muck Mineral F8 - Redox DepressionsS3 - 5 cm Mucky Peat or Peat 1 Indicators of hydrophytic vegetation and wetland hydrology must be present, unless disturbed or problematic.
J. DelmedicoPorterIndianaW-488x1u
n/a
--
-- Local Relief: -- --
--
Color (Moist)Mottles
upland
------
Remarks: --
--
loamy sand--
No
-- Remarks:
Texture(e.g. clay, sand, loam)
Yes
Matrix
--Morley silt loam
Line 6B Phase 2 Replacement Project
NWI/WWI Classification:
Describe Recorded Data (stream gauge, monitoring well, aerial photos, previous inspections), if available:
sandy loamColor (Moist)
Restrictive Layer (If Observed)
Remarks:
Type: N/A Depth: N/A Hydric Soil Present?
Profile Description (Describe to the depth needed to document the indicator or confirm the absence of indicators.) (Type: C=Concentration, D=Depletion, RM=Reduced Matrix, CS=Covered/Coated Sand Grains; Locaiton: PL=Pore Lining, M=Matrix)
EnbridgeD. Tersteeg
WETLAND DETERMINATION DATA FORMMidwest Region
Indicators for Problematic Soils 1
Yes NoAre normal circumstances present?
Yes No
Wetland Hydrology Present? Yes No
04/22/12

Page 2 of 2
Project/Site: W-488x 1u
VEGETATION (Species identified in all uppercase are non-native species.) Tree Stratum (Plot size: 10 meter radius)
% Cover Dominant Ind.Status Dominance Test Worksheet1. 20 Y FACU2. -- -- -- (A)3. -- -- --4. -- -- -- (B)5. -- -- --6. -- -- -- (A/B)7. -- -- --8. -- -- -- Prevalence Index Worksheet9. -- -- --10. -- -- -- OBL spp. 0 x 1 = 0
20 FACW spp. 0 x 2 = 0
FAC spp. 0 x 3 = 0
FACU spp. 165 x 4 = 660
1. 60 Y FACU UPL spp. 20 x 5 = 100
2. -- -- --3. -- -- -- Total 185 (A) 760 (B)4. -- -- --5. -- -- -- Prevalence Index = B/A = 4.108
6. -- -- --7. -- -- --8. -- -- -- Hydrophytic Vegetation Indicators:9. -- -- -- Yes No Rapid Test for Hydrophytic Vegetation10. -- -- -- Yes No Dominance Test is > 50%
60 Yes No Prevalence Index is ≤ 3.0 *Yes No Morphological Adaptations (Explain) *Yes No Problem Hydrophytic Vegetation (Explain) *
1. 15 N FACU2. 10 N FACU3. 60 Y FACU4. 20 Y UPL5. -- -- --6 -- -- --7. -- -- --8. -- -- --9. -- -- -- Sapling/Shrub -
10. -- -- --11. -- -- --12. -- -- --13. -- -- --14. -- -- --15. -- -- --
105
1. -- -- --2. -- -- --3. -- -- -- Hydrophytic Vegetation Present Yes No5. -- -- --4. -- -- --
0
Additional Remarks:
Remarks:
Sample PointLine 6B Phase 2 Replacement Project
----
--
--
-- Total % Cover of:
------
--
------
Woody Vines - All woody vines greater than 3.28 ft. in height.
--
----
--
CIRSIUM ARVENSE
Tree -
Wetland ID:
Definitions of Vegetation Strata:
--
Herb -
Herb Stratum (Plot size: 2 meter radius)
--
All herbaceous (non-woody) plants, regardless of size, and woody plants less than 3 28 ft tall
Multiply by:
0.0%
--
Percent of Dominant Species That Are OBL, FACW, or FAC:
--
--
--
Total Cover =
LONICERA TATARICA
--
----
Total Cover =
LONICERA TATARICA CONVOLVULUS ARVENSIS
--
Sapling/Shrub Stratum (Plot size: 5 meter radius)
--
Podophyllum peltatum
--
ROBINIA PSEUDOACACIA -- 0
4
Species Name
Total Number of Dominant Species Across All Strata:
Number of Dominant Species that are OBL, FACW, or FAC:
--
* Indicators of hydric soil and wetland hydrology must be present, unless disturbed or problematic.
Woody Vine Stratum (Plot size: 10 meter radius)
Total Cover =
----
--
--
--
Woody plants 3 in. (7.6cm) or more in diameter at breast height (DBH), regardless of height.
Woody plants less than 3 in. DBH and greater than 3.28 ft. tall.
Total Cover =
Midwest Region
WETLAND DETERMINATION DATA FORM
--

Page 1 of 2
Project/Site: Stantec Project #: 193701660 Date: Applicant: County: Investigator #1: Investigator #2: State: Soil Unit: Wetland ID: Landform: Sample Point: Slope (%): 0 Latitude: -- Longitude: Datum: -- Community ID: Are climatic/hydrologic conditions on the site typical for this time of year? (If no, explain in remarks) Section: 19 Are Vegetation , Soil , or Hydrology significantly disturbed? Township: 36 N Are Vegetation , Soil , or Hydrology naturally problematic? Range: 5 Dir: WSUMMARY OF FINDINGS Hydrophytic Vegetation Present? Yes No Hydric Soils Present? Yes No Wetland Hydrology Present? Yes No Is This Sampling Point Within A Wetland? Yes No
HYDROLOGY
Wetland Hydrology Indicators (Check here if indicators are not present ):Primary: Secondary:
A1 - Surface Water B9 - Water-Stained Leaves B6 - Surface Soil CracksA2 - High Water Table B13 - Aquatic Fauna B10 - Drainage PatternsA3 - Saturation B14 - True Aquatic Plants C2 - Dry-Season Water TableB1 - Water Marks C1 - Hydrogen Sulfide Odor C8 - Crayfish BurrowsB2 - Sediment Deposits C3 - Oxidized Rhizospheres on Living Roots C9 - Saturation Visible on Aerial ImageryB3 - Drift Deposits C4 - Presence of Reduced Iron D1 - Stunted or Stressed PlantsB4 - Algal Mat or Crust C6 - Recent Iron Reduction in Tilled Soils D2 - Geomorphic PositionB5 - Iron Deposits C7 - Thin Muck Surface D5 - FAC-Neutral TestB7 - Inundation Visible on Aerial Imagery D9 - Gauge or Well DataB8 - Sparsely Vegetated Concave Surface Other (Explain)
Field Observations: Surface Water Present? Yes No Depth: n/a (in.) Water Table Present? Yes No Depth: >18 (in.) Saturation Present? Yes No Depth: 12 (in.)
SOILS Map Unit Name: Morley silt loam Series Drainage Class: moderately well Taxonomy (Subgroup): Oxyaquic Hapludalfs Field Observations Confirm Mapped Type? Yes No
Top BottomDepth Depth Horizon % % Type Location
0 10 1 10YR 3/2 80 10YR 4/6 20 C M10 18 2 10YR 4/2 70 10YR 4/6 30 C M-- -- -- -- -- -- -- -- -- -- ---- -- -- -- -- -- -- -- -- -- ---- -- -- -- -- -- -- -- -- -- ---- -- -- -- -- -- -- -- -- -- ---- -- -- -- -- -- -- -- -- -- ---- -- -- -- -- -- -- -- -- -- --
NRCS Hydric Soil Field Indicators (check here if indicators are not present ):A1- Histosol S4 - Sandy Gleyed Matrix A16 - Coast Prairie Redox A2 - Histic Epipedon S5 - Sandy Redox F12 - Iron-Manganese Masses A3 - Black Histic S6 - Stripped Matrix Other (Explain in Remarks)A4 - Hydrogen Sulfide F1 - Loamy Muck MineralA5 - Stratified Layers F2 - Loamy Gleyed MatrixA10 - 2 cm Muck F3 - Depleted MatrixA11 - Depleted Below Dark Surface F6 - Redox Dark SurfaceA12 - Thick Dark Surface F7 - Depleted Dark SurfaceS1 - Sandy Muck Mineral F8 - Redox DepressionsS3 - 5 cm Mucky Peat or Peat 1 Indicators of hydrophytic vegetation and wetland hydrology must be present, unless disturbed or problematic.
J. DelmedicoPorterIndianaW-488x1w
n/a
Phragmites wetland, shallow marsh with phragmites fringe, cattail.
depression Local Relief: concave --
--
Color (Moist)Mottles
EM1
------
Remarks: --
--
clay loam--
No
-- Remarks:
Texture(e.g. clay, sand, loam)
Yes
Matrix
--Morley silt loam
Line 6B Phase 2 Replacement Project
NWI/WWI Classification:
Describe Recorded Data (stream gauge, monitoring well, aerial photos, previous inspections), if available:
sandy clay loamColor (Moist)
Restrictive Layer (If Observed)
Remarks:
Type: N/A Depth: N/A Hydric Soil Present?
Profile Description (Describe to the depth needed to document the indicator or confirm the absence of indicators.) (Type: C=Concentration, D=Depletion, RM=Reduced Matrix, CS=Covered/Coated Sand Grains; Locaiton: PL=Pore Lining, M=Matrix)
EnbridgeD. Tersteeg
WETLAND DETERMINATION DATA FORMMidwest Region
Indicators for Problematic Soils 1
Yes NoAre normal circumstances present?
Yes No
Wetland Hydrology Present? Yes No
04/22/12

Page 2 of 2
Project/Site: W-488x 1w
VEGETATION (Species identified in all uppercase are non-native species.) Tree Stratum (Plot size: 10 meter radius)
% Cover Dominant Ind.Status Dominance Test Worksheet1. -- -- --2. -- -- -- (A)3. -- -- --4. -- -- -- (B)5. -- -- --6. -- -- -- (A/B)7. -- -- --8. -- -- -- Prevalence Index Worksheet9. -- -- --10. -- -- -- OBL spp. 0 x 1 = 0
0 FACW spp. 100 x 2 = 200
FAC spp. 0 x 3 = 0
FACU spp. 0 x 4 = 0
1. -- -- -- UPL spp. 0 x 5 = 0
2. -- -- --3. -- -- -- Total 100 (A) 200 (B)4. -- -- --5. -- -- -- Prevalence Index = B/A = 2.000
6. -- -- --7. -- -- --8. -- -- -- Hydrophytic Vegetation Indicators:9. -- -- -- Yes No Rapid Test for Hydrophytic Vegetation10. -- -- -- Yes No Dominance Test is > 50%
0 Yes No Prevalence Index is ≤ 3.0 *Yes No Morphological Adaptations (Explain) *Yes No Problem Hydrophytic Vegetation (Explain) *
1. 100 Y FACW2. -- -- --3. -- -- --4. -- -- --5. -- -- --6 -- -- --7. -- -- --8. -- -- --9. -- -- -- Sapling/Shrub -
10. -- -- --11. -- -- --12. -- -- --13. -- -- --14. -- -- --15. -- -- --
100
1. -- -- --2. -- -- --3. -- -- -- Hydrophytic Vegetation Present Yes No5. -- -- --4. -- -- --
0
Additional Remarks:
Remarks:
Sample PointLine 6B Phase 2 Replacement Project
----
--
--
-- Total % Cover of:
------
--
------
Woody Vines - All woody vines greater than 3.28 ft. in height.
--
----
--
--
Tree -
Wetland ID:
Definitions of Vegetation Strata:
--
Herb -
Herb Stratum (Plot size: 2 meter radius)
--
All herbaceous (non-woody) plants, regardless of size, and woody plants less than 3 28 ft tall
Multiply by:
100.0%
--
Percent of Dominant Species That Are OBL, FACW, or FAC:
--
--
--
Total Cover =
--
--
----
Total Cover =
----
--
Sapling/Shrub Stratum (Plot size: 5 meter radius)
--
Phragmites australis
--
---- 1
1
Species Name
Total Number of Dominant Species Across All Strata:
Number of Dominant Species that are OBL, FACW, or FAC:
--
* Indicators of hydric soil and wetland hydrology must be present, unless disturbed or problematic.
Woody Vine Stratum (Plot size: 10 meter radius)
Total Cover =
----
--
Dominated by invasive common reed.
--
Woody plants 3 in. (7.6cm) or more in diameter at breast height (DBH), regardless of height.
Woody plants less than 3 in. DBH and greater than 3.28 ft. tall.
Total Cover =
Midwest Region
WETLAND DETERMINATION DATA FORM
--

Page 1 of 2
Project/Site: Stantec Project #: 193701660 Date: Applicant: County: Investigator #1: Investigator #2: State: Soil Unit: Wetland ID: Landform: Sample Point: Slope (%): 2 Latitude: -- Longitude: Datum: -- Community ID: Are climatic/hydrologic conditions on the site typical for this time of year? (If no, explain in remarks) Section: 19 Are Vegetation , Soil , or Hydrology significantly disturbed? Township: 36 N Are Vegetation , Soil , or Hydrology naturally problematic? Range: 5 Dir: WSUMMARY OF FINDINGS Hydrophytic Vegetation Present? Yes No Hydric Soils Present? Yes No Wetland Hydrology Present? Yes No Is This Sampling Point Within A Wetland? Yes No
HYDROLOGY
Wetland Hydrology Indicators (Check here if indicators are not present ):Primary: Secondary:
A1 - Surface Water B9 - Water-Stained Leaves B6 - Surface Soil CracksA2 - High Water Table B13 - Aquatic Fauna B10 - Drainage PatternsA3 - Saturation B14 - True Aquatic Plants C2 - Dry-Season Water TableB1 - Water Marks C1 - Hydrogen Sulfide Odor C8 - Crayfish BurrowsB2 - Sediment Deposits C3 - Oxidized Rhizospheres on Living Roots C9 - Saturation Visible on Aerial ImageryB3 - Drift Deposits C4 - Presence of Reduced Iron D1 - Stunted or Stressed PlantsB4 - Algal Mat or Crust C6 - Recent Iron Reduction in Tilled Soils D2 - Geomorphic PositionB5 - Iron Deposits C7 - Thin Muck Surface D5 - FAC-Neutral TestB7 - Inundation Visible on Aerial Imagery D9 - Gauge or Well DataB8 - Sparsely Vegetated Concave Surface Other (Explain)
Field Observations: Surface Water Present? Yes No Depth: n/a (in.) Water Table Present? Yes No Depth: >18 (in.) Saturation Present? Yes No Depth: >18 (in.)
SOILS Map Unit Name: Morley silt loam Series Drainage Class: moderately well Taxonomy (Subgroup): Oxyaquic Hapludalfs Field Observations Confirm Mapped Type? Yes No
Top BottomDepth Depth Horizon % % Type Location
0 9 1 10YR 3/3 100 -- -- -- -- --9 18 2 10YR 4/3 90 10YR 4/6 10 C M-- -- -- -- -- -- -- -- -- -- ---- -- -- -- -- -- -- -- -- -- ---- -- -- -- -- -- -- -- -- -- ---- -- -- -- -- -- -- -- -- -- ---- -- -- -- -- -- -- -- -- -- ---- -- -- -- -- -- -- -- -- -- --
NRCS Hydric Soil Field Indicators (check here if indicators are not present ):A1- Histosol S4 - Sandy Gleyed Matrix A16 - Coast Prairie Redox A2 - Histic Epipedon S5 - Sandy Redox F12 - Iron-Manganese Masses A3 - Black Histic S6 - Stripped Matrix Other (Explain in Remarks)A4 - Hydrogen Sulfide F1 - Loamy Muck MineralA5 - Stratified Layers F2 - Loamy Gleyed MatrixA10 - 2 cm Muck F3 - Depleted MatrixA11 - Depleted Below Dark Surface F6 - Redox Dark SurfaceA12 - Thick Dark Surface F7 - Depleted Dark SurfaceS1 - Sandy Muck Mineral F8 - Redox DepressionsS3 - 5 cm Mucky Peat or Peat 1 Indicators of hydrophytic vegetation and wetland hydrology must be present, unless disturbed or problematic.
J. DelmedicoPorterIndianaW-488y1u
n/a
--
slope Local Relief: none --
--
Color (Moist)Mottles
upland
------
Remarks: --
--
clay loam--
No
-- Remarks:
Texture(e.g. clay, sand, loam)
Yes
Matrix
--Morley silt loam
Line 6B Phase 2 Replacement Project
NWI/WWI Classification:
Describe Recorded Data (stream gauge, monitoring well, aerial photos, previous inspections), if available:
clay loamColor (Moist)
Restrictive Layer (If Observed)
Remarks:
Type: N/A Depth: N/A Hydric Soil Present?
Profile Description (Describe to the depth needed to document the indicator or confirm the absence of indicators.) (Type: C=Concentration, D=Depletion, RM=Reduced Matrix, CS=Covered/Coated Sand Grains; Locaiton: PL=Pore Lining, M=Matrix)
EnbridgeD. Tersteeg
WETLAND DETERMINATION DATA FORMMidwest Region
Indicators for Problematic Soils 1
Yes NoAre normal circumstances present?
Yes No
Wetland Hydrology Present? Yes No
04/22/12

Page 2 of 2
Project/Site: W-488y 1u
VEGETATION (Species identified in all uppercase are non-native species.) Tree Stratum (Plot size: 10 meter radius)
% Cover Dominant Ind.Status Dominance Test Worksheet1. -- -- --2. -- -- -- (A)3. -- -- --4. -- -- -- (B)5. -- -- --6. -- -- -- (A/B)7. -- -- --8. -- -- -- Prevalence Index Worksheet9. -- -- --10. -- -- -- OBL spp. 0 x 1 = 0
0 FACW spp. 0 x 2 = 0
FAC spp. 40 x 3 = 120
FACU spp. 60 x 4 = 240
1. -- -- -- UPL spp. 0 x 5 = 0
2. -- -- --3. -- -- -- Total 100 (A) 360 (B)4. -- -- --5. -- -- -- Prevalence Index = B/A = 3.600
6. -- -- --7. -- -- --8. -- -- -- Hydrophytic Vegetation Indicators:9. -- -- -- Yes No Rapid Test for Hydrophytic Vegetation10. -- -- -- Yes No Dominance Test is > 50%
0 Yes No Prevalence Index is ≤ 3.0 *Yes No Morphological Adaptations (Explain) *Yes No Problem Hydrophytic Vegetation (Explain) *
1. 40 Y FACU2. 40 Y FAC3. 20 Y FACU4. -- -- --5. -- -- --6 -- -- --7. -- -- --8. -- -- --9. -- -- -- Sapling/Shrub -
10. -- -- --11. -- -- --12. -- -- --13. -- -- --14. -- -- --15. -- -- --
100
1. -- -- --2. -- -- --3. -- -- -- Hydrophytic Vegetation Present Yes No5. -- -- --4. -- -- --
0
Additional Remarks:
Remarks:
Sample PointLine 6B Phase 2 Replacement Project
----
--
--
-- Total % Cover of:
------
--
------
Woody Vines - All woody vines greater than 3.28 ft. in height.
--
----
--
POA PRATENSIS
Tree -
Wetland ID:
Definitions of Vegetation Strata:
--
Herb -
Herb Stratum (Plot size: 2 meter radius)
--
All herbaceous (non-woody) plants, regardless of size, and woody plants less than 3 28 ft tall
Multiply by:
33.3%
--
Percent of Dominant Species That Are OBL, FACW, or FAC:
--
--
--
Total Cover =
--
--
----
Total Cover =
TARAXACUM OFFICINALE --
--
Sapling/Shrub Stratum (Plot size: 5 meter radius)
--
TRIFOLIUM PRATENSE
--
---- 1
3
Species Name
Total Number of Dominant Species Across All Strata:
Number of Dominant Species that are OBL, FACW, or FAC:
--
* Indicators of hydric soil and wetland hydrology must be present, unless disturbed or problematic.
Woody Vine Stratum (Plot size: 10 meter radius)
Total Cover =
----
--
--
--
Woody plants 3 in. (7.6cm) or more in diameter at breast height (DBH), regardless of height.
Woody plants less than 3 in. DBH and greater than 3.28 ft. tall.
Total Cover =
Midwest Region
WETLAND DETERMINATION DATA FORM
--

Page 1 of 2
Project/Site: Stantec Project #: 193701660 Date: Applicant: County: Investigator #1: Investigator #2: State: Soil Unit: Wetland ID: Landform: Sample Point: Slope (%): 2 Latitude: -- Longitude: Datum: -- Community ID: Are climatic/hydrologic conditions on the site typical for this time of year? (If no, explain in remarks) Section: 19 Are Vegetation , Soil , or Hydrology significantly disturbed? Township: 36 N Are Vegetation , Soil , or Hydrology naturally problematic? Range: 5 Dir: WSUMMARY OF FINDINGS Hydrophytic Vegetation Present? Yes No Hydric Soils Present? Yes No Wetland Hydrology Present? Yes No Is This Sampling Point Within A Wetland? Yes No
HYDROLOGY
Wetland Hydrology Indicators (Check here if indicators are not present ):Primary: Secondary:
A1 - Surface Water B9 - Water-Stained Leaves B6 - Surface Soil CracksA2 - High Water Table B13 - Aquatic Fauna B10 - Drainage PatternsA3 - Saturation B14 - True Aquatic Plants C2 - Dry-Season Water TableB1 - Water Marks C1 - Hydrogen Sulfide Odor C8 - Crayfish BurrowsB2 - Sediment Deposits C3 - Oxidized Rhizospheres on Living Roots C9 - Saturation Visible on Aerial ImageryB3 - Drift Deposits C4 - Presence of Reduced Iron D1 - Stunted or Stressed PlantsB4 - Algal Mat or Crust C6 - Recent Iron Reduction in Tilled Soils D2 - Geomorphic PositionB5 - Iron Deposits C7 - Thin Muck Surface D5 - FAC-Neutral TestB7 - Inundation Visible on Aerial Imagery D9 - Gauge or Well DataB8 - Sparsely Vegetated Concave Surface Other (Explain)
Field Observations: Surface Water Present? Yes No Depth: 1 (in.) Water Table Present? Yes No Depth: >18 (in.) Saturation Present? Yes No Depth: 0 (in.)
SOILS Map Unit Name: Morley silt loam Series Drainage Class: moderately well Taxonomy (Subgroup): Oxyaquic Hapludalfs Field Observations Confirm Mapped Type? Yes No
Top BottomDepth Depth Horizon % % Type Location
0 10 1 N 5/0 90 10YR 4/6 10 C M10 18 2 10YR 4/2 80 7.5YR 4/6 20 C M-- -- -- -- -- -- -- -- -- -- ---- -- -- -- -- -- -- -- -- -- ---- -- -- -- -- -- -- -- -- -- ---- -- -- -- -- -- -- -- -- -- ---- -- -- -- -- -- -- -- -- -- ---- -- -- -- -- -- -- -- -- -- --
NRCS Hydric Soil Field Indicators (check here if indicators are not present ):A1- Histosol S4 - Sandy Gleyed Matrix A16 - Coast Prairie Redox A2 - Histic Epipedon S5 - Sandy Redox F12 - Iron-Manganese Masses A3 - Black Histic S6 - Stripped Matrix Other (Explain in Remarks)A4 - Hydrogen Sulfide F1 - Loamy Muck MineralA5 - Stratified Layers F2 - Loamy Gleyed MatrixA10 - 2 cm Muck F3 - Depleted MatrixA11 - Depleted Below Dark Surface F6 - Redox Dark SurfaceA12 - Thick Dark Surface F7 - Depleted Dark SurfaceS1 - Sandy Muck Mineral F8 - Redox DepressionsS3 - 5 cm Mucky Peat or Peat 1 Indicators of hydrophytic vegetation and wetland hydrology must be present, unless disturbed or problematic.
WETLAND DETERMINATION DATA FORMMidwest Region
Indicators for Problematic Soils 1
Yes NoAre normal circumstances present?
Yes No
Wetland Hydrology Present? Yes No
04/22/12
--Morley silt loam
Line 6B Phase 2 Replacement Project
NWI/WWI Classification:
Describe Recorded Data (stream gauge, monitoring well, aerial photos, previous inspections), if available:
clay loamColor (Moist)
Restrictive Layer (If Observed)
Remarks:
Type: N/A Depth: N/A Hydric Soil Present?
Profile Description (Describe to the depth needed to document the indicator or confirm the absence of indicators.) (Type: C=Concentration, D=Depletion, RM=Reduced Matrix, CS=Covered/Coated Sand Grains; Locaiton: PL=Pore Lining, M=Matrix)
EnbridgeD. Tersteeg
----
Remarks: --
--
clay loam--
No
-- Remarks:
Texture(e.g. clay, sand, loam)
Yes
Matrix
n/a
Hillside seep from pipe outlet, invasive phragmites and reed canary grass dominate.
slope Local Relief: concave --
--
Color (Moist)Mottles
EM1
--
J. DelmedicoPorterIndianaW-488y1w

Page 2 of 2
Project/Site: W-488y 1w
VEGETATION (Species identified in all uppercase are non-native species.) Tree Stratum (Plot size: 10 meter radius)
% Cover Dominant Ind.Status Dominance Test Worksheet1. -- -- --2. -- -- -- (A)3. -- -- --4. -- -- -- (B)5. -- -- --6. -- -- -- (A/B)7. -- -- --8. -- -- -- Prevalence Index Worksheet9. -- -- --10. -- -- -- OBL spp. 0 x 1 = 0
0 FACW spp. 100 x 2 = 200
FAC spp. 0 x 3 = 0
FACU spp. 0 x 4 = 0
1. -- -- -- UPL spp. 0 x 5 = 0
2. -- -- --3. -- -- -- Total 100 (A) 200 (B)4. -- -- --5. -- -- -- Prevalence Index = B/A = 2.000
6. -- -- --7. -- -- --8. -- -- -- Hydrophytic Vegetation Indicators:9. -- -- -- Yes No Rapid Test for Hydrophytic Vegetation10. -- -- -- Yes No Dominance Test is > 50%
0 Yes No Prevalence Index is ≤ 3.0 *Yes No Morphological Adaptations (Explain) *Yes No Problem Hydrophytic Vegetation (Explain) *
1. 40 Y FACW2. 60 Y FACW3. -- -- --4. -- -- --5. -- -- --6 -- -- --7. -- -- --8. -- -- --9. -- -- -- Sapling/Shrub -
10. -- -- --11. -- -- --12. -- -- --13. -- -- --14. -- -- --15. -- -- --
100
1. -- -- --2. -- -- --3. -- -- -- Hydrophytic Vegetation Present Yes No5. -- -- --4. -- -- --
0
Additional Remarks:--
* Indicators of hydric soil and wetland hydrology must be present, unless disturbed or problematic.
Woody Vine Stratum (Plot size: 10 meter radius)
Total Cover =
----
--
--
--
Woody plants 3 in. (7.6cm) or more in diameter at breast height (DBH), regardless of height.
Woody plants less than 3 in. DBH and greater than 3.28 ft. tall.
Total Cover =
Midwest Region
WETLAND DETERMINATION DATA FORM
--
---- 2
2
Species Name
Total Number of Dominant Species Across All Strata:
Number of Dominant Species that are OBL, FACW, or FAC:
--
--
--
Total Cover =
--
--
----
Total Cover =
----
--
Sapling/Shrub Stratum (Plot size: 5 meter radius)
--
Phragmites australis
--
100.0%
--
Percent of Dominant Species That Are OBL, FACW, or FAC:
----
--
PHALARIS ARUNDINACEA
Tree -
Wetland ID:
Definitions of Vegetation Strata:
--
Herb -
Herb Stratum (Plot size: 2 meter radius)
--
All herbaceous (non-woody) plants, regardless of size, and woody plants less than 3 28 ft tall
Multiply by:
Remarks:
Sample PointLine 6B Phase 2 Replacement Project
----
--
--
-- Total % Cover of:
------
--
------
Woody Vines - All woody vines greater than 3.28 ft. in height.
--

Page 1 of 2
Project/Site: Stantec Project #: 193701313 Date: Applicant: County: Investigator #1: Investigator #2: State: Soil Unit: Wetland ID: Landform: Sample Point: Slope (%): 2-4 Latitude: -- Longitude: Datum: -- Community ID: Are climatic/hydrologic conditions on the site typical for this time of year? (If no, explain in remarks) Section: 17 Are Vegetation , Soil , or Hydrology significantly disturbed? Township: 36 N Are Vegetation , Soil , or Hydrology naturally problematic? Range: 5 Dir: WSUMMARY OF FINDINGS Hydrophytic Vegetation Present? Yes No Hydric Soils Present? Yes No Wetland Hydrology Present? Yes No Is This Sampling Point Within A Wetland? Yes No
HYDROLOGY
Wetland Hydrology Indicators (Check here if indicators are not present):Primary: Secondary:
A1 - Surface Water B9 - Water-Stained Leaves B6 - Surface Soil CracksA2 - High Water Table B13 - Aquatic Fauna B10 - Drainage PatternsA3 - Saturation B15 - Marl Deposits B16 - Moss Trim LinesB1 - Water Marks C1 - Hydrogen Sulfide Odor C2 - Dry-Season Water TableB2 - Sediment Deposits C3 - Oxidized Rhizospheres on Living Roots C8 - Crayfish BurrowsB3 - Drift Deposits C4 - Presence of Reduced Iron C9 - Saturation Visible on Aerial ImageryB4 - Algal Mat or Crust C6 - Recent Iron Reduction in Tilled Soils D1 - Stunted or Stressed PlantsB5 - Iron Deposits C7 - Thin Muck Surface D2 - Geomorphic PositionB7 - Inundation Visible on Aerial Imagery Other (Explain) D3 - Shallow AquitardB8 - Sparsely Vegetated Concave Surface D4 - Microtopographic Relief
D5 - FAC-Neutral Test
Field Observations: Surface Water Present? Yes No Depth: N/A (in.) Water Table Present? Yes No Depth: N/A (in.) Saturation Present? Yes No Depth: N/A (in.)
SOILS Map Unit Name: Selfridge loamy fine sand Series Drainage Class: somewhat poorly drained Taxonomy (Subgroup): Aquic Arenic Hapludalfs Field Observations Confirm Mapped Type? Yes No
Top BottomDepth Depth Horizon % % Type Location
0 20 1 10YR 4/2 90 -- -- -- -- --0 20 1 10YR 5/3 10 -- -- -- -- ---- -- -- -- -- -- -- -- -- -- ---- -- -- -- -- -- -- -- -- -- ---- -- -- -- -- -- -- -- -- -- ---- -- -- -- -- -- -- -- -- -- ---- -- -- -- -- -- -- -- -- -- ---- -- -- -- -- -- -- -- -- -- --
NRCS Hydric Soil Field Indicators (check here if indicators are not present):A1- Histosol S8 - Polyvalue Below Surface A10 - 2 cm Muck (LRR K, L, MLRA149B)A2 - Histic Epipedon (LRR R, MLRA 149B) A16 - Coast Prairie Redox (LRR K, L, R)A3 - Black Histic S9 - Thin Dark Surface S3 - 5cm Mucky Peat of Peat (LRR K, L, R)A4 - Hydrogen Sulfide (LRR R, MLRA 149B) S7 - Dark Surface (LRR K, L)A5 - Stratified Layers F1 - Loamy Muck Mineral S8 - Polyvalue Below Surface (LRR K, L)A11 - Depleted Below Dark Surface (LRR K, L) S9 - Thin Dark Surface (LRR K, L)A12 - Thick Dark Surface F2 - Loamy Gleyed Matrix F12 - Iron-Manganese Masses (LRR K, L, R)S1 - Sandy Muck Mineral F3 - Depleted Matrix F19 - Piedmont Floodplain Soils (MLRA 149B)S4 - Sandy Gleyed Matrix F6 - Redox Dark Surface TA6 - Mesic Spodic (MLRA 144A, 145, 149B)S5 - Sandy Redox F7 - Depleted Dark Surface TF2 - Red Parent MaterialS6 - Stripped Matrix F8 - Redox Depressions TF12 - Very Shallow Dark SurfaceS7 - Dark Surface (LRR R, MLRA 149B) Other (Explain in Remarks)
Possible problematic soils, potential seasonal wetland. Conditions not normal due to recent heavy rain.
Hillslope/swale Local Relief: --
Mixed matrix, edge of farm field. Field has likely been plowed in the past.
--
--
Color (Moist)Mottles
YesHydric Soil Present?
Describe Recorded Data (stream gauge, monitoring well, aerial photos, previous inspections), if available: Remarks:
Silty Clay--
W-489a
Enbridge
--
--
Remarks:
Remarks:
--Selfridge loamy fine sand
Indiana Line 6B
Type: N/A Depth: N/A
NWI/WWI Classification:
Profile Description (Describe to the depth needed to document the indicator or confirm the absence of indicators.) (Type: C=Concentration, D=Depletion, RM=Reduced Matrix, CS=Covered/Coated Sand Grains; Locaiton: PL=Pore Lining, M=Matrix)
Matrix
Silty Clay
------
E. Parker H. Stoffs Indiana
Are normal circumstances present? Yes No
Wetland Hydrology Present? Yes No
No
Color (Moist)
N/A
1 Indicators of hydrophytic vegetation and wetland hydrology must be present, unless disturbed or problematic.
1uUpland
Porter11/11/11
Texture(e.g. clay, sand, loam)
WETLAND DETERMINATION DATA FORMNorthcentral and Northeast Region
Indicators for Problematic Soils 1
Restrictive Layer (If Observed)
Yes No

Page 2 of 2
Project/Site: W-489a 1u
VEGETATION (Species identified in all uppercase are non-native species.) Tree Stratum (Plot size: 10 meter radius)
% Cover Dominant Ind.Status Dominance Test Worksheet1. 60 Y FACW2. 15 N FACU (A)3. 10 N FACU4. 5 N FACW (B)5. -- -- --6. -- -- -- (A/B)7. -- -- --8. -- -- -- Prevalence Index Worksheet9. -- -- --10. -- -- -- OBL spp. 0 x 1 = 0
90 FACW spp. 107 x 2 = 214
FAC spp. 0 x 3 = 0
FACU spp. 155 x 4 = 620
1. 25 Y FACW UPL spp. 25 x 5 = 125
2. 10 Y FACU3. 10 Y UPL Total 287 (A) 959 (B)4. 10 Y FACU5. 5 N FACW Prevalence Index = B/A = 3.341
6. -- -- --7. -- -- --8. -- -- -- Hydrophytic Vegetation Indicators:9. -- -- -- Yes No Rapid Test for Hydrophytic Vegetation10. -- -- -- Yes No Dominance Test is > 50%
60 Yes No Prevalence Index is ≤ 3.0 *Yes No Morphological Adaptations (Explain) *Yes No Problem Hydrophytic Vegetation (Explain) *
1. 25 Y FACU2. 25 Y FACU3. 15 Y UPL4. 15 Y FACU5. 15 Y FACU6 10 N FACU7. 10 N FACU8. 10 N FACU9. 5 N -- Sapling/Shrub -
10. 2 N FACW11. -- -- --12. -- -- --13. -- -- --14. -- -- --15. -- -- --
132
1. 10 Y FACW2. -- -- --3. -- -- -- Hydrophytic Vegetation Present Yes No5. -- -- --4. -- -- --
10
Additional Remarks:
Remarks:
Sample PointIndiana Line 6B
----
--
--
-- Total % Cover of:
------
--
------
--
TRIFOLIUM REPENS
ROSA MULTIFLORA
Herb -
Woody Vines - All woody vines greater than 3.28 ft. in height.
All herbaceous (non-woody) plants, regardless of size, and woody plants less than 3 28 ft tall
Aster pilosus Tree -
Wetland ID:
Definitions of Vegetation Strata:
27.3%
--
Multiply by:
----
Herb Stratum (Plot size: 2 meter radius)
Vitis riparia --
DACTYLIS GLOMERATA
Acer negundo
SETARIA FABERI
Total Cover =
Fraxinus pennsylvanica
ELAEAGNUS UMBELLATA
Acer negundo Tilia americana
Total Cover =
DAUCUS CAROTA TARAXACUM OFFICINALE
Solidago canadensis
ROSA MULTIFLORA
11
Sapling/Shrub Stratum (Plot size: 5 meter radius)
--
LONICERA X BELLA
Fraxinus pennsylvanica Acer saccharum
Species Name
Total Number of Dominant Species Across All Strata:
Percent of Dominant Species That Are OBL, FACW, or FAC:
Number of Dominant Species that are OBL, FACW, or FAC: 3
--
* Indicators of hydric soil and wetland hydrology must be present, unless disturbed or problematic.
Woody Vine Stratum (Plot size: 10 meter radius)
Total Cover =
Ulmus americana --
SETARIA sp.
Edge of farm field. Includes adjacent upland woods.
--
Woody plants 3 in. (7.6cm) or more in diameter at breast height (DBH), regardless of height.
Woody plants less than 3 in. DBH and greater than 3.28 ft. tall.
Total Cover =
Northcentral and Northeast Region
WETLAND DETERMINATION DATA FORM

Page 1 of 2
Project/Site: Stantec Project #: 193701313 Date: Applicant: County: Investigator #1: Investigator #2: State: Soil Unit: Wetland ID: Landform: Sample Point: Slope (%): 0-2 Latitude: -- Longitude: Datum: -- Community ID: Are climatic/hydrologic conditions on the site typical for this time of year? (If no, explain in remarks) Section: 17 Are Vegetation , Soil , or Hydrology significantly disturbed? Township: 36 N Are Vegetation , Soil , or Hydrology naturally problematic? Range: 5 Dir: WSUMMARY OF FINDINGS Hydrophytic Vegetation Present? Yes No Hydric Soils Present? Yes No Wetland Hydrology Present? Yes No Is This Sampling Point Within A Wetland? Yes No
HYDROLOGY
Wetland Hydrology Indicators (Check here if indicators are not present):Primary: Secondary:
A1 - Surface Water B9 - Water-Stained Leaves B6 - Surface Soil CracksA2 - High Water Table B13 - Aquatic Fauna B10 - Drainage PatternsA3 - Saturation B15 - Marl Deposits B16 - Moss Trim LinesB1 - Water Marks C1 - Hydrogen Sulfide Odor C2 - Dry-Season Water TableB2 - Sediment Deposits C3 - Oxidized Rhizospheres on Living Roots C8 - Crayfish BurrowsB3 - Drift Deposits C4 - Presence of Reduced Iron C9 - Saturation Visible on Aerial ImageryB4 - Algal Mat or Crust C6 - Recent Iron Reduction in Tilled Soils D1 - Stunted or Stressed PlantsB5 - Iron Deposits C7 - Thin Muck Surface D2 - Geomorphic PositionB7 - Inundation Visible on Aerial Imagery Other (Explain) D3 - Shallow AquitardB8 - Sparsely Vegetated Concave Surface D4 - Microtopographic Relief
D5 - FAC-Neutral Test
Field Observations: Surface Water Present? Yes No Depth: 1 (in.) Water Table Present? Yes No Depth: 4 (in.) Saturation Present? Yes No Depth: 0 (in.)
SOILS Map Unit Name: Washtenaw silt loam Series Drainage Class: poorly Taxonomy (Subgroup): Aeric Fluvaquents Field Observations Confirm Mapped Type? Yes No
Top BottomDepth Depth Horizon % % Type Location
0 6 1 10YR 4/2 100 -- -- -- -- --6 16 2 10YR 4/2 90 10YR 4/6 10 C M-- -- -- -- -- -- -- -- -- -- ---- -- -- -- -- -- -- -- -- -- ---- -- -- -- -- -- -- -- -- -- ---- -- -- -- -- -- -- -- -- -- ---- -- -- -- -- -- -- -- -- -- ---- -- -- -- -- -- -- -- -- -- --
NRCS Hydric Soil Field Indicators (check here if indicators are not present):A1- Histosol S8 - Polyvalue Below Surface A10 - 2 cm Muck (LRR K, L, MLRA149B)A2 - Histic Epipedon (LRR R, MLRA 149B) A16 - Coast Prairie Redox (LRR K, L, R)A3 - Black Histic S9 - Thin Dark Surface S3 - 5cm Mucky Peat of Peat (LRR K, L, R)A4 - Hydrogen Sulfide (LRR R, MLRA 149B) S7 - Dark Surface (LRR K, L)A5 - Stratified Layers F1 - Loamy Muck Mineral S8 - Polyvalue Below Surface (LRR K, L)A11 - Depleted Below Dark Surface (LRR K, L) S9 - Thin Dark Surface (LRR K, L)A12 - Thick Dark Surface F2 - Loamy Gleyed Matrix F12 - Iron-Manganese Masses (LRR K, L, R)S1 - Sandy Muck Mineral F3 - Depleted Matrix F19 - Piedmont Floodplain Soils (MLRA 149B)S4 - Sandy Gleyed Matrix F6 - Redox Dark Surface TA6 - Mesic Spodic (MLRA 144A, 145, 149B)S5 - Sandy Redox F7 - Depleted Dark Surface TF2 - Red Parent MaterialS6 - Stripped Matrix F8 - Redox Depressions TF12 - Very Shallow Dark SurfaceS7 - Dark Surface (LRR R, MLRA 149B) Other (Explain in Remarks)
1wPEM
Porter11/11/11
Texture(e.g. clay, sand, loam)
WETLAND DETERMINATION DATA FORMNorthcentral and Northeast Region
Indicators for Problematic Soils 1
Restrictive Layer (If Observed)
Yes No
No
No
Color (Moist)
N/A
1 Indicators of hydrophytic vegetation and wetland hydrology must be present, unless disturbed or problematic.
PSS1/EMCWashtenaw silt loam
Indiana Line 6B
Type: N/A Depth: N/A
NWI/WWI Classification:
Profile Description (Describe to the depth needed to document the indicator or confirm the absence of indicators.) (Type: C=Concentration, D=Depletion, RM=Reduced Matrix, CS=Covered/Coated Sand Grains; Locaiton: PL=Pore Lining, M=Matrix)
Matrix
Silty Clay
------
E. Parker H. Stoffs Indiana
Are normal circumstances present? Yes No
Wetland Hydrology Present? Yes
W-489a
Enbridge
--
--
Remarks:
Remarks:
Conditions not normal due to recent heavy rain
Hillslope/swale Local Relief: --
--
--
--
Color (Moist)Mottles
YesHydric Soil Present?
Describe Recorded Data (stream gauge, monitoring well, aerial photos, previous inspections), if available: Remarks:
Silty Clay--

Page 2 of 2
Project/Site: W-489a 1w
VEGETATION (Species identified in all uppercase are non-native species.) Tree Stratum (Plot size: 10 meter radius)
% Cover Dominant Ind.Status Dominance Test Worksheet1. -- -- --2. -- -- -- (A)3. -- -- --4. -- -- -- (B)5. -- -- --6. -- -- -- (A/B)7. -- -- --8. -- -- -- Prevalence Index Worksheet9. -- -- --10. -- -- -- OBL spp. 5 x 1 = 5
0 FACW spp. 110 x 2 = 220
FAC spp. 15 x 3 = 45
FACU spp. 0 x 4 = 0
1. -- -- -- UPL spp. 0 x 5 = 0
2. -- -- --3. -- -- -- Total 130 (A) 270 (B)4. -- -- --5. -- -- -- Prevalence Index = B/A = 2.077
6. -- -- --7. -- -- --8. -- -- -- Hydrophytic Vegetation Indicators:9. -- -- -- Yes No Rapid Test for Hydrophytic Vegetation10. -- -- -- Yes No Dominance Test is > 50%
0 Yes No Prevalence Index is ≤ 3.0 *Yes No Morphological Adaptations (Explain) *Yes No Problem Hydrophytic Vegetation (Explain) *
1. 95 Y FACW2. 10 N FAC3. 5 N FACW4. 5 N FACW5. 5 N OBL6 5 N FACW7. 5 N FAC8. -- -- --9. -- -- -- Sapling/Shrub -
10. -- -- --11. -- -- --12. -- -- --13. -- -- --14. -- -- --15. -- -- --
130
1. -- -- --2. -- -- --3. -- -- -- Hydrophytic Vegetation Present Yes No5. -- -- --4. -- -- --
0
Additional Remarks:--
* Indicators of hydric soil and wetland hydrology must be present, unless disturbed or problematic.
Woody Vine Stratum (Plot size: 10 meter radius)
Total Cover =
----
--
Reed canary grass swale
--
Woody plants 3 in. (7.6cm) or more in diameter at breast height (DBH), regardless of height.
Woody plants less than 3 in. DBH and greater than 3.28 ft. tall.
Total Cover =
Northcentral and Northeast Region
WETLAND DETERMINATION DATA FORM
Total Number of Dominant Species Across All Strata:
Percent of Dominant Species That Are OBL, FACW, or FAC:
Number of Dominant Species that are OBL, FACW, or FAC: 1
--
----
Species Name
----
Xanthium strumarium
--
Polygonum pensylvanicum
Total Cover =
--
--
----
Total Cover =
Cyperus esculentusPanicum dichotomiflorum
PHALARIS ARUNDINACEA
--
1
Sapling/Shrub Stratum (Plot size: 5 meter radius)
--
Tree -
Wetland ID:
Definitions of Vegetation Strata:
100.0%
--
Multiply by:
----
Herb Stratum (Plot size: 2 meter radius)
Remarks:
Sample PointIndiana Line 6B
----
--
--
-- Total % Cover of:
------
--
------
--
Apocynum sibiricum
--
Herb -
Woody Vines - All woody vines greater than 3.28 ft. in height.
All herbaceous (non-woody) plants, regardless of size, and woody plants less than 3 28 ft tall
Carex stricta
Page 1 of 2
Project/Site: Stantec Project #: 193701313 Date: Applicant: County: Investigator #1: Investigator #2: State: Soil Unit: Wetland ID: Landform: Sample Point: Slope (%): 2-4 Latitude: -- Longitude: Datum: -- Community ID: Are climatic/hydrologic conditions on the site typical for this time of year? (If no, explain in remarks) Section: 17 Are Vegetation , Soil , or Hydrology significantly disturbed? Township: 36 N Are Vegetation , Soil , or Hydrology naturally problematic? Range: 5 Dir: WSUMMARY OF FINDINGS Hydrophytic Vegetation Present? Yes No Hydric Soils Present? Yes No Wetland Hydrology Present? Yes No Is This Sampling Point Within A Wetland? Yes No
HYDROLOGY
Wetland Hydrology Indicators (Check here if indicators are not present):Primary: Secondary:
A1 - Surface Water B9 - Water-Stained Leaves B6 - Surface Soil CracksA2 - High Water Table B13 - Aquatic Fauna B10 - Drainage PatternsA3 - Saturation B15 - Marl Deposits B16 - Moss Trim LinesB1 - Water Marks C1 - Hydrogen Sulfide Odor C2 - Dry-Season Water TableB2 - Sediment Deposits C3 - Oxidized Rhizospheres on Living Roots C8 - Crayfish BurrowsB3 - Drift Deposits C4 - Presence of Reduced Iron C9 - Saturation Visible on Aerial ImageryB4 - Algal Mat or Crust C6 - Recent Iron Reduction in Tilled Soils D1 - Stunted or Stressed PlantsB5 - Iron Deposits C7 - Thin Muck Surface D2 - Geomorphic PositionB7 - Inundation Visible on Aerial Imagery Other (Explain) D3 - Shallow AquitardB8 - Sparsely Vegetated Concave Surface D4 - Microtopographic Relief
D5 - FAC-Neutral Test
Field Observations: Surface Water Present? Yes No Depth: N/A (in.) Water Table Present? Yes No Depth: N/A (in.) Saturation Present? Yes No Depth: N/A (in.)
SOILS Map Unit Name: Riddles loam Series Drainage Class: well drained Taxonomy (Subgroup): Typic Hapludalfs Field Observations Confirm Mapped Type? Yes No
Top BottomDepth Depth Horizon % % Type Location
0 9 1 10YR 4/3 100 -- -- -- -- --9 19 2 10YR 4/2 95 10YR 4/6 5 C M-- -- -- -- -- -- -- -- -- -- ---- -- -- -- -- -- -- -- -- -- ---- -- -- -- -- -- -- -- -- -- ---- -- -- -- -- -- -- -- -- -- ---- -- -- -- -- -- -- -- -- -- ---- -- -- -- -- -- -- -- -- -- --
NRCS Hydric Soil Field Indicators (check here if indicators are not present):A1- Histosol S8 - Polyvalue Below Surface A10 - 2 cm Muck (LRR K, L, MLRA149B)A2 - Histic Epipedon (LRR R, MLRA 149B) A16 - Coast Prairie Redox (LRR K, L, R)A3 - Black Histic S9 - Thin Dark Surface S3 - 5cm Mucky Peat of Peat (LRR K, L, R)A4 - Hydrogen Sulfide (LRR R, MLRA 149B) S7 - Dark Surface (LRR K, L)A5 - Stratified Layers F1 - Loamy Muck Mineral S8 - Polyvalue Below Surface (LRR K, L)A11 - Depleted Below Dark Surface (LRR K, L) S9 - Thin Dark Surface (LRR K, L)A12 - Thick Dark Surface F2 - Loamy Gleyed Matrix F12 - Iron-Manganese Masses (LRR K, L, R)S1 - Sandy Muck Mineral F3 - Depleted Matrix F19 - Piedmont Floodplain Soils (MLRA 149B)S4 - Sandy Gleyed Matrix F6 - Redox Dark Surface TA6 - Mesic Spodic (MLRA 144A, 145, 149B)S5 - Sandy Redox F7 - Depleted Dark Surface TF2 - Red Parent MaterialS6 - Stripped Matrix F8 - Redox Depressions TF12 - Very Shallow Dark SurfaceS7 - Dark Surface (LRR R, MLRA 149B) Other (Explain in Remarks)
2uUpland
Porter11/11/11
Texture(e.g. clay, sand, loam)
WETLAND DETERMINATION DATA FORMNorthcentral and Northeast Region
Indicators for Problematic Soils 1
Restrictive Layer (If Observed)
Yes No
No
No
Color (Moist)
N/A
1 Indicators of hydrophytic vegetation and wetland hydrology must be present, unless disturbed or problematic.
--Riddles loam
Indiana Line 6B
Type: N/A Depth: N/A
NWI/WWI Classification:
Profile Description (Describe to the depth needed to document the indicator or confirm the absence of indicators.) (Type: C=Concentration, D=Depletion, RM=Reduced Matrix, CS=Covered/Coated Sand Grains; Locaiton: PL=Pore Lining, M=Matrix)
Matrix
Sandy Loam
------
E. Parker H. Stoffs Indiana
Are normal circumstances present? Yes No
Wetland Hydrology Present? Yes
W-489a
Enbridge
Soils moist but not saturated down to 19 in.
--
Remarks:
Remarks:
Soils are sandy and therefore naturally problematic. Potential seasonal wetland. Conditions not normal due to recent heavy rain. Sample point taken at edge of field.
Hillslope/swale Local Relief: --
Soil profile does not meet S5 - Sandy Redox because depleted matrix and redox features start below 6 in. In addition, the 3 chroma in the first hoirzon indicates the soil is well oxidized and likely non-hydric.
--
--
Color (Moist)Mottles
YesHydric Soil Present?
Describe Recorded Data (stream gauge, monitoring well, aerial photos, previous inspections), if available: Remarks:
Sandy Loam--

Page 2 of 2
Project/Site: W-489a 2u
VEGETATION (Species identified in all uppercase are non-native species.) Tree Stratum (Plot size: 10 meter radius)
% Cover Dominant Ind.Status Dominance Test Worksheet1. 50 Y FACW2. 10 N FAC (A)3. -- -- --4. -- -- -- (B)5. -- -- --6. -- -- -- (A/B)7. -- -- --8. -- -- -- Prevalence Index Worksheet9. -- -- --10. -- -- -- OBL spp. 0 x 1 = 0
60 FACW spp. 80 x 2 = 160
FAC spp. 10 x 3 = 30
FACU spp. 105 x 4 = 420
1. 20 Y FACU UPL spp. 20 x 5 = 100
2. 5 N FACW3. 5 N FACU Total 215 (A) 710 (B)4. -- -- --5. -- -- -- Prevalence Index = B/A = 3.302
6. -- -- --7. -- -- --8. -- -- -- Hydrophytic Vegetation Indicators:9. -- -- -- Yes No Rapid Test for Hydrophytic Vegetation10. -- -- -- Yes No Dominance Test is > 50%
30 Yes No Prevalence Index is ≤ 3.0 *Yes No Morphological Adaptations (Explain) *Yes No Problem Hydrophytic Vegetation (Explain) *
1. 30 Y FACU2. 20 Y UPL3. 20 Y FACU4. 15 N FACU5. 10 N FACW6 10 N FACU7. 5 N FACU8. -- -- --9. -- -- -- Sapling/Shrub -
10. -- -- --11. -- -- --12. -- -- --13. -- -- --14. -- -- --15. -- -- --
110
1. 15 Y FACW2. -- -- --3. -- -- -- Hydrophytic Vegetation Present Yes No5. -- -- --4. -- -- --
15
Additional Remarks:--
* Indicators of hydric soil and wetland hydrology must be present, unless disturbed or problematic.
Woody Vine Stratum (Plot size: 10 meter radius)
Total Cover =
----
--
Edge of farm field. Includes part of upland woodland.
--
Woody plants 3 in. (7.6cm) or more in diameter at breast height (DBH), regardless of height.
Woody plants less than 3 in. DBH and greater than 3.28 ft. tall.
Total Cover =
Northcentral and Northeast Region
WETLAND DETERMINATION DATA FORM
Total Number of Dominant Species Across All Strata:
Percent of Dominant Species That Are OBL, FACW, or FAC:
Number of Dominant Species that are OBL, FACW, or FAC: 2
--
Acer negundo Populus deltoides
Species Name
Vitis riparia --
TRIFOLIUM REPENS
--
SETARIA FABERI
Total Cover =
ROSA MULTIFLORA
LONICERA X BELLA
----
Total Cover =
TARAXACUM OFFICINALE CIRSIUM ARVENSE
DACTYLIS GLOMERATA
Acer negundo
6
Sapling/Shrub Stratum (Plot size: 5 meter radius)
--
Tree -
Wetland ID:
Definitions of Vegetation Strata:
33.3%
--
Multiply by:
----
Herb Stratum (Plot size: 2 meter radius)
Remarks:
Sample PointIndiana Line 6B
----
--
--
-- Total % Cover of:
------
--
------
--
ARCTIUM MINUS
--
Herb -
Woody Vines - All woody vines greater than 3.28 ft. in height.
All herbaceous (non-woody) plants, regardless of size, and woody plants less than 3 28 ft tall
AGROSTIS GIGANTEA

Page 1 of 2
Project/Site: Stantec Project #: 193701313 Date: Applicant: County: Investigator #1: Investigator #2: State: Soil Unit: Wetland ID: Landform: Sample Point: Slope (%): -- Latitude: -- Longitude: Datum: -- Community ID: Are climatic/hydrologic conditions on the site typical for this time of year? (If no, explain in remarks) Section: 17 Are Vegetation , Soil , or Hydrology significantly disturbed? Township: 36 N Are Vegetation , Soil , or Hydrology naturally problematic? Range: 5 Dir: WSUMMARY OF FINDINGS Hydrophytic Vegetation Present? Yes No Hydric Soils Present? Yes No Wetland Hydrology Present? Yes No Is This Sampling Point Within A Wetland? Yes No
HYDROLOGY
Wetland Hydrology Indicators (Check here if indicators are not present):Primary: Secondary:
A1 - Surface Water B9 - Water-Stained Leaves B6 - Surface Soil CracksA2 - High Water Table B13 - Aquatic Fauna B10 - Drainage PatternsA3 - Saturation B15 - Marl Deposits B16 - Moss Trim LinesB1 - Water Marks C1 - Hydrogen Sulfide Odor C2 - Dry-Season Water TableB2 - Sediment Deposits C3 - Oxidized Rhizospheres on Living Roots C8 - Crayfish BurrowsB3 - Drift Deposits C4 - Presence of Reduced Iron C9 - Saturation Visible on Aerial ImageryB4 - Algal Mat or Crust C6 - Recent Iron Reduction in Tilled Soils D1 - Stunted or Stressed PlantsB5 - Iron Deposits C7 - Thin Muck Surface D2 - Geomorphic PositionB7 - Inundation Visible on Aerial Imagery Other (Explain) D3 - Shallow AquitardB8 - Sparsely Vegetated Concave Surface D4 - Microtopographic Relief
D5 - FAC-Neutral Test
Field Observations: Surface Water Present? Yes No Depth: N/A (in.) Water Table Present? Yes No Depth: N/A (in.) Saturation Present? Yes No Depth: N/A (in.)
SOILS Map Unit Name: Martinsville loam Series Drainage Class: well drained Taxonomy (Subgroup): Typic Hapludalfs Field Observations Confirm Mapped Type? Yes No
Top BottomDepth Depth Horizon % % Type Location
0 17 1 10YR 3/2 100 -- -- -- -- --17 20 2 10YR 4/1 95 10YR 3/4 5 C M-- -- -- -- -- -- -- -- -- -- ---- -- -- -- -- -- -- -- -- -- ---- -- -- -- -- -- -- -- -- -- ---- -- -- -- -- -- -- -- -- -- ---- -- -- -- -- -- -- -- -- -- ---- -- -- -- -- -- -- -- -- -- --
NRCS Hydric Soil Field Indicators (check here if indicators are not present):A1- Histosol S8 - Polyvalue Below Surface A10 - 2 cm Muck (LRR K, L, MLRA149B)A2 - Histic Epipedon (LRR R, MLRA 149B) A16 - Coast Prairie Redox (LRR K, L, R)A3 - Black Histic S9 - Thin Dark Surface S3 - 5cm Mucky Peat of Peat (LRR K, L, R)A4 - Hydrogen Sulfide (LRR R, MLRA 149B) S7 - Dark Surface (LRR K, L)A5 - Stratified Layers F1 - Loamy Muck Mineral S8 - Polyvalue Below Surface (LRR K, L)A11 - Depleted Below Dark Surface (LRR K, L) S9 - Thin Dark Surface (LRR K, L)A12 - Thick Dark Surface F2 - Loamy Gleyed Matrix F12 - Iron-Manganese Masses (LRR K, L, R)S1 - Sandy Muck Mineral F3 - Depleted Matrix F19 - Piedmont Floodplain Soils (MLRA 149B)S4 - Sandy Gleyed Matrix F6 - Redox Dark Surface TA6 - Mesic Spodic (MLRA 144A, 145, 149B)S5 - Sandy Redox F7 - Depleted Dark Surface TF2 - Red Parent MaterialS6 - Stripped Matrix F8 - Redox Depressions TF12 - Very Shallow Dark SurfaceS7 - Dark Surface (LRR R, MLRA 149B) Other (Explain in Remarks)
--
-- Local Relief: --
--
--
--
Color (Moist)Mottles
YesHydric Soil Present?
Describe Recorded Data (stream gauge, monitoring well, aerial photos, previous inspections), if available: Remarks:
Silty Clay--
W-489a
Enbridge
--
--
Remarks:
Remarks:
--Martinsville loam
Indiana Line 6B
Type: N/A Depth: N/A
NWI/WWI Classification:
Profile Description (Describe to the depth needed to document the indicator or confirm the absence of indicators.) (Type: C=Concentration, D=Depletion, RM=Reduced Matrix, CS=Covered/Coated Sand Grains; Locaiton: PL=Pore Lining, M=Matrix)
Matrix
Silty Clay Loam
------
E. Parker H. Stoffs Indiana
Are normal circumstances present? Yes No
Wetland Hydrology Present? Yes No
No
Color (Moist)
N/A
1 Indicators of hydrophytic vegetation and wetland hydrology must be present, unless disturbed or problematic.
3uUpland
Porter11/11/11
Texture(e.g. clay, sand, loam)
WETLAND DETERMINATION DATA FORMNorthcentral and Northeast Region
Indicators for Problematic Soils 1
Restrictive Layer (If Observed)
Yes No

Page 2 of 2
Project/Site: W-489a 3u
VEGETATION (Species identified in all uppercase are non-native species.) Tree Stratum (Plot size: 10 meter radius)
% Cover Dominant Ind.Status Dominance Test Worksheet1. -- -- --2. -- -- -- (A)3. -- -- --4. -- -- -- (B)5. -- -- --6. -- -- -- (A/B)7. -- -- --8. -- -- -- Prevalence Index Worksheet9. -- -- --10. -- -- -- OBL spp. 0 x 1 = 0
0 FACW spp. 2 x 2 = 4
FAC spp. 0 x 3 = 0
FACU spp. 3 x 4 = 12
1. -- -- -- UPL spp. 0 x 5 = 0
2. -- -- --3. -- -- -- Total 5 (A) 16 (B)4. -- -- --5. -- -- -- Prevalence Index = B/A = 3.200
6. -- -- --7. -- -- --8. -- -- -- Hydrophytic Vegetation Indicators:9. -- -- -- Yes No Rapid Test for Hydrophytic Vegetation10. -- -- -- Yes No Dominance Test is > 50%
0 Yes No Prevalence Index is ≤ 3.0 *Yes No Morphological Adaptations (Explain) *Yes No Problem Hydrophytic Vegetation (Explain) *
1. 1 Y FACU2. 1 Y FACU3. 2 Y FACW4. 1 Y FACU5. -- -- --6 -- -- --7. -- -- --8. -- -- --9. -- -- -- Sapling/Shrub -
10. -- -- --11. -- -- --12. -- -- --13. -- -- --14. -- -- --15. -- -- --
5
1. -- -- --2. -- -- --3. -- -- -- Hydrophytic Vegetation Present Yes No5. -- -- --4. -- -- --
0
Additional Remarks:
Remarks:
Sample PointIndiana Line 6B
----
--
--
-- Total % Cover of:
------
--
------
--
Setaria faberi
--
Herb -
Woody Vines - All woody vines greater than 3.28 ft. in height.
All herbaceous (non-woody) plants, regardless of size, and woody plants less than 3 28 ft tall
--Tree -
Wetland ID:
Definitions of Vegetation Strata:
25.0%
--
Multiply by:
----
Herb Stratum (Plot size: 2 meter radius)
----
--
--
--
Total Cover =
--
--
----
Total Cover =
PHALARIS ARUNDINACEAGLECHOMA HEDERACEA
TARAXACUM OFFICINALE
--
4
Sapling/Shrub Stratum (Plot size: 5 meter radius)
--
--
----
Species Name
Total Number of Dominant Species Across All Strata:
Percent of Dominant Species That Are OBL, FACW, or FAC:
Number of Dominant Species that are OBL, FACW, or FAC: 1
--
* Indicators of hydric soil and wetland hydrology must be present, unless disturbed or problematic.
Woody Vine Stratum (Plot size: 10 meter radius)
Total Cover =
----
--
Edge of farm field.
--
Woody plants 3 in. (7.6cm) or more in diameter at breast height (DBH), regardless of height.
Woody plants less than 3 in. DBH and greater than 3.28 ft. tall.
Total Cover =
Northcentral and Northeast Region
WETLAND DETERMINATION DATA FORM

Page 1 of 2
Project/Site: Stantec Project #: 193701313 Date: Applicant: County: Investigator #1: Investigator #2: State: Soil Unit: Wetland ID: Landform: Sample Point: Slope (%): 3 Latitude: -- Longitude: Datum: -- Community ID: Are climatic/hydrologic conditions on the site typical for this time of year? (If no, explain in remarks) Section: 17 Are Vegetation , Soil , or Hydrology significantly disturbed? Township: 36 N Are Vegetation , Soil , or Hydrology naturally problematic? Range: 5 Dir: wSUMMARY OF FINDINGS Hydrophytic Vegetation Present? Yes No Hydric Soils Present? Yes No Wetland Hydrology Present? Yes No Is This Sampling Point Within A Wetland? Yes No
HYDROLOGY
Wetland Hydrology Indicators (Check here if indicators are not present):Primary: Secondary:
A1 - Surface Water B9 - Water-Stained Leaves B6 - Surface Soil CracksA2 - High Water Table B13 - Aquatic Fauna B10 - Drainage PatternsA3 - Saturation B15 - Marl Deposits B16 - Moss Trim LinesB1 - Water Marks C1 - Hydrogen Sulfide Odor C2 - Dry-Season Water TableB2 - Sediment Deposits C3 - Oxidized Rhizospheres on Living Roots C8 - Crayfish BurrowsB3 - Drift Deposits C4 - Presence of Reduced Iron C9 - Saturation Visible on Aerial ImageryB4 - Algal Mat or Crust C6 - Recent Iron Reduction in Tilled Soils D1 - Stunted or Stressed PlantsB5 - Iron Deposits C7 - Thin Muck Surface D2 - Geomorphic PositionB7 - Inundation Visible on Aerial Imagery Other (Explain) D3 - Shallow AquitardB8 - Sparsely Vegetated Concave Surface D4 - Microtopographic Relief
D5 - FAC-Neutral Test
Field Observations: Surface Water Present? Yes No Depth: N/A (in.) Water Table Present? Yes No Depth: N/A (in.) Saturation Present? Yes No Depth: 12 (in.)
SOILS Map Unit Name: Fluvaquents Series Drainage Class: poorly to somewhat poorly Taxonomy (Subgroup): NA Field Observations Confirm Mapped Type? Yes No
Top BottomDepth Depth Horizon % % Type Location
0 12 1 10YR 4/2 -- -- -- -- -- --10 22 2 10YR 4/2 80 10YR 4/6 20 C M-- -- -- -- -- -- -- -- -- -- ---- -- -- -- -- -- -- -- -- -- ---- -- -- -- -- -- -- -- -- -- ---- -- -- -- -- -- -- -- -- -- ---- -- -- -- -- -- -- -- -- -- ---- -- -- -- -- -- -- -- -- -- --
NRCS Hydric Soil Field Indicators (check here if indicators are not present):A1- Histosol S8 - Polyvalue Below Surface A10 - 2 cm Muck (LRR K, L, MLRA149B)A2 - Histic Epipedon (LRR R, MLRA 149B) A16 - Coast Prairie Redox (LRR K, L, R)A3 - Black Histic S9 - Thin Dark Surface S3 - 5cm Mucky Peat of Peat (LRR K, L, R)A4 - Hydrogen Sulfide (LRR R, MLRA 149B) S7 - Dark Surface (LRR K, L)A5 - Stratified Layers F1 - Loamy Muck Mineral S8 - Polyvalue Below Surface (LRR K, L)A11 - Depleted Below Dark Surface (LRR K, L) S9 - Thin Dark Surface (LRR K, L)A12 - Thick Dark Surface F2 - Loamy Gleyed Matrix F12 - Iron-Manganese Masses (LRR K, L, R)S1 - Sandy Muck Mineral F3 - Depleted Matrix F19 - Piedmont Floodplain Soils (MLRA 149B)S4 - Sandy Gleyed Matrix F6 - Redox Dark Surface TA6 - Mesic Spodic (MLRA 144A, 145, 149B)S5 - Sandy Redox F7 - Depleted Dark Surface TF2 - Red Parent MaterialS6 - Stripped Matrix F8 - Redox Depressions TF12 - Very Shallow Dark SurfaceS7 - Dark Surface (LRR R, MLRA 149B) Other (Explain in Remarks)
Plowed ag field.
-- Local Relief: --
While soils are hydric, the absence of wetland hydrology and vegetation supports an upland determination. No crop stress was observed.
--
--
Color (Moist)Mottles
YesHydric Soil Present?
Describe Recorded Data (stream gauge, monitoring well, aerial photos, previous inspections), if available: Remarks:
Silty Clay Loam--
W-489b
Enbridge
--
--
Remarks:
Remarks:
--Fluvaquents
Indiana Line 6B
Type: N/A Depth: N/A
NWI/WWI Classification:
Profile Description (Describe to the depth needed to document the indicator or confirm the absence of indicators.) (Type: C=Concentration, D=Depletion, RM=Reduced Matrix, CS=Covered/Coated Sand Grains; Locaiton: PL=Pore Lining, M=Matrix)
Matrix
Silt Loam
------
E. Parker H. Stoffs Indiana
Are normal circumstances present? Yes No
Wetland Hydrology Present? Yes No
No
Color (Moist)
N/A
1 Indicators of hydrophytic vegetation and wetland hydrology must be present, unless disturbed or problematic.
1uUpland
Porter11/11/11
Texture(e.g. clay, sand, loam)
WETLAND DETERMINATION DATA FORMNorthcentral and Northeast Region
Indicators for Problematic Soils 1
Restrictive Layer (If Observed)
Yes No
Page 2 of 2
Project/Site: W-489b 1u
VEGETATION (Species identified in all uppercase are non-native species.) Tree Stratum (Plot size: 10 meter radius)
% Cover Dominant Ind.Status Dominance Test Worksheet1. -- -- --2. -- -- -- (A)3. -- -- --4. -- -- -- (B)5. -- -- --6. -- -- -- (A/B)7. -- -- --8. -- -- -- Prevalence Index Worksheet9. -- -- --10. -- -- -- OBL spp. 0 x 1 = 0
0 FACW spp. 0 x 2 = 0
FAC spp. 1 x 3 = 3
FACU spp. 1 x 4 = 4
1. -- -- -- UPL spp. 100 x 5 = 500
2. -- -- --3. -- -- -- Total 102 (A) 507 (B)4. -- -- --5. -- -- -- Prevalence Index = B/A = 4.971
6. -- -- --7. -- -- --8. -- -- -- Hydrophytic Vegetation Indicators:9. -- -- -- Yes No Rapid Test for Hydrophytic Vegetation10. -- -- -- Yes No Dominance Test is > 50%
0 Yes No Prevalence Index is ≤ 3.0 *Yes No Morphological Adaptations (Explain) *Yes No Problem Hydrophytic Vegetation (Explain) *
1. 100 Y UPL2. 1 N FAC3. 1 N FACU4. -- -- --5. -- -- --6 -- -- --7. -- -- --8. -- -- --9. -- -- -- Sapling/Shrub -
10. -- -- --11. -- -- --12. -- -- --13. -- -- --14. -- -- --15. -- -- --
102
1. -- -- --2. -- -- --3. -- -- -- Hydrophytic Vegetation Present Yes No5. -- -- --4. -- -- --
0
Additional Remarks:
Remarks:
Sample PointIndiana Line 6B
----
--
--
-- Total % Cover of:
------
--
------
--
Equisetum arvense
--
Herb -
Woody Vines - All woody vines greater than 3.28 ft. in height.
All herbaceous (non-woody) plants, regardless of size, and woody plants less than 3 28 ft tall
--Tree -
Wetland ID:
Definitions of Vegetation Strata:
0.0%
--
Multiply by:
----
Herb Stratum (Plot size: 2 meter radius)
----
--
--
--
Total Cover =
--
--
----
Total Cover =
TARAXACUM OFFICINALE --
GLYCINE MAX
--
1
Sapling/Shrub Stratum (Plot size: 5 meter radius)
--
--
----
Species Name
Total Number of Dominant Species Across All Strata:
Percent of Dominant Species That Are OBL, FACW, or FAC:
Number of Dominant Species that are OBL, FACW, or FAC: 0
--
* Indicators of hydric soil and wetland hydrology must be present, unless disturbed or problematic.
Woody Vine Stratum (Plot size: 10 meter radius)
Total Cover =
----
--
--
--
Woody plants 3 in. (7.6cm) or more in diameter at breast height (DBH), regardless of height.
Woody plants less than 3 in. DBH and greater than 3.28 ft. tall.
Total Cover =
Northcentral and Northeast Region
WETLAND DETERMINATION DATA FORM
Page 1 of 2
Project/Site: Stantec Project #: 193701313 Date: Applicant: County: Investigator #1: Investigator #2: State: Soil Unit: Wetland ID: Landform: Sample Point: Slope (%): -- Latitude: -- Longitude: Datum: -- Community ID: Are climatic/hydrologic conditions on the site typical for this time of year? (If no, explain in remarks) Section: 17 Are Vegetation , Soil , or Hydrology significantly disturbed? Township: 36 N Are Vegetation , Soil , or Hydrology naturally problematic? Range: 5 Dir: wSUMMARY OF FINDINGS Hydrophytic Vegetation Present? Yes No Hydric Soils Present? Yes No Wetland Hydrology Present? Yes No Is This Sampling Point Within A Wetland? Yes No
HYDROLOGY
Wetland Hydrology Indicators (Check here if indicators are not present):Primary: Secondary:
A1 - Surface Water B9 - Water-Stained Leaves B6 - Surface Soil CracksA2 - High Water Table B13 - Aquatic Fauna B10 - Drainage PatternsA3 - Saturation B15 - Marl Deposits B16 - Moss Trim LinesB1 - Water Marks C1 - Hydrogen Sulfide Odor C2 - Dry-Season Water TableB2 - Sediment Deposits C3 - Oxidized Rhizospheres on Living Roots C8 - Crayfish BurrowsB3 - Drift Deposits C4 - Presence of Reduced Iron C9 - Saturation Visible on Aerial ImageryB4 - Algal Mat or Crust C6 - Recent Iron Reduction in Tilled Soils D1 - Stunted or Stressed PlantsB5 - Iron Deposits C7 - Thin Muck Surface D2 - Geomorphic PositionB7 - Inundation Visible on Aerial Imagery Other (Explain) D3 - Shallow AquitardB8 - Sparsely Vegetated Concave Surface D4 - Microtopographic Relief
D5 - FAC-Neutral Test
Field Observations: Surface Water Present? Yes No Depth: N/A (in.) Water Table Present? Yes No Depth: N/A (in.) Saturation Present? Yes No Depth: N/A (in.)
SOILS Map Unit Name: Fluvaquents Series Drainage Class: poorly to somewhat poorly Taxonomy (Subgroup): NA Field Observations Confirm Mapped Type? Yes No
Top BottomDepth Depth Horizon % % Type Location
0 6 1 10YR 3/2 -- -- -- -- -- --6 20 2 10YR 4/2 95 10YR 3/4 5 C M-- -- -- -- -- -- -- -- -- -- ---- -- -- -- -- -- -- -- -- -- ---- -- -- -- -- -- -- -- -- -- ---- -- -- -- -- -- -- -- -- -- ---- -- -- -- -- -- -- -- -- -- ---- -- -- -- -- -- -- -- -- -- --
NRCS Hydric Soil Field Indicators (check here if indicators are not present):A1- Histosol S8 - Polyvalue Below Surface A10 - 2 cm Muck (LRR K, L, MLRA149B)A2 - Histic Epipedon (LRR R, MLRA 149B) A16 - Coast Prairie Redox (LRR K, L, R)A3 - Black Histic S9 - Thin Dark Surface S3 - 5cm Mucky Peat of Peat (LRR K, L, R)A4 - Hydrogen Sulfide (LRR R, MLRA 149B) S7 - Dark Surface (LRR K, L)A5 - Stratified Layers F1 - Loamy Muck Mineral S8 - Polyvalue Below Surface (LRR K, L)A11 - Depleted Below Dark Surface (LRR K, L) S9 - Thin Dark Surface (LRR K, L)A12 - Thick Dark Surface F2 - Loamy Gleyed Matrix F12 - Iron-Manganese Masses (LRR K, L, R)S1 - Sandy Muck Mineral F3 - Depleted Matrix F19 - Piedmont Floodplain Soils (MLRA 149B)S4 - Sandy Gleyed Matrix F6 - Redox Dark Surface TA6 - Mesic Spodic (MLRA 144A, 145, 149B)S5 - Sandy Redox F7 - Depleted Dark Surface TF2 - Red Parent MaterialS6 - Stripped Matrix F8 - Redox Depressions TF12 - Very Shallow Dark SurfaceS7 - Dark Surface (LRR R, MLRA 149B) Other (Explain in Remarks)
1wPEM
Porter11/11/11
Texture(e.g. clay, sand, loam)
WETLAND DETERMINATION DATA FORMNorthcentral and Northeast Region
Indicators for Problematic Soils 1
Restrictive Layer (If Observed)
Yes No
No
No
Color (Moist)
N/A
1 Indicators of hydrophytic vegetation and wetland hydrology must be present, unless disturbed or problematic.
--Fluvaquents
Indiana Line 6B
Type: N/A Depth: N/A
NWI/WWI Classification:
Profile Description (Describe to the depth needed to document the indicator or confirm the absence of indicators.) (Type: C=Concentration, D=Depletion, RM=Reduced Matrix, CS=Covered/Coated Sand Grains; Locaiton: PL=Pore Lining, M=Matrix)
Matrix
Silty Clay Loam
------
E. Parker H. Stoffs Indiana
Are normal circumstances present? Yes No
Wetland Hydrology Present? Yes
W-489b
Enbridge
Area appears to have seasonal hydrology, with only the FAC-Neutral Test observed as a hydrology indicator. However, the presence of wetland soils and vegetation supports a wetland determination.
--
Remarks:
Remarks:
Area has seasonal hydrology.
-- Local Relief: --
--
--
--
Color (Moist)Mottles
YesHydric Soil Present?
Describe Recorded Data (stream gauge, monitoring well, aerial photos, previous inspections), if available: Remarks:
Silty Clay Loam--

Page 2 of 2
Project/Site: W-489b 1w
VEGETATION (Species identified in all uppercase are non-native species.) Tree Stratum (Plot size: 10 meter radius)
% Cover Dominant Ind.Status Dominance Test Worksheet1. -- -- --2. -- -- -- (A)3. -- -- --4. -- -- -- (B)5. -- -- --6. -- -- -- (A/B)7. -- -- --8. -- -- -- Prevalence Index Worksheet9. -- -- --10. -- -- -- OBL spp. 0 x 1 = 0
0 FACW spp. 75 x 2 = 150
FAC spp. 10 x 3 = 30
FACU spp. 30 x 4 = 120
1. 5 Y FACW UPL spp. 10 x 5 = 50
2. 5 Y FAC3. -- -- -- Total 125 (A) 350 (B)4. -- -- --5. -- -- -- Prevalence Index = B/A = 2.800
6. -- -- --7. -- -- --8. -- -- -- Hydrophytic Vegetation Indicators:9. -- -- -- Yes No Rapid Test for Hydrophytic Vegetation10. -- -- -- Yes No Dominance Test is > 50%
10 Yes No Prevalence Index is ≤ 3.0 *Yes No Morphological Adaptations (Explain) *Yes No Problem Hydrophytic Vegetation (Explain) *
1. 30 Y FACU2. 30 Y FACW3. 30 Y FACW4. 10 N FACW5. 10 N UPL6 5 N FAC7. -- -- --8. -- -- --9. -- -- -- Sapling/Shrub -
10. -- -- --11. -- -- --12. -- -- --13. -- -- --14. -- -- --15. -- -- --
115
1. -- -- --2. -- -- --3. -- -- -- Hydrophytic Vegetation Present Yes No5. -- -- --4. -- -- --
0
Additional Remarks:--
* Indicators of hydric soil and wetland hydrology must be present, unless disturbed or problematic.
Woody Vine Stratum (Plot size: 10 meter radius)
Total Cover =
----
--
--
--
Woody plants 3 in. (7.6cm) or more in diameter at breast height (DBH), regardless of height.
Woody plants less than 3 in. DBH and greater than 3.28 ft. tall.
Total Cover =
Northcentral and Northeast Region
WETLAND DETERMINATION DATA FORM
Total Number of Dominant Species Across All Strata:
Percent of Dominant Species That Are OBL, FACW, or FAC:
Number of Dominant Species that are OBL, FACW, or FAC: 4
--
----
Species Name
----
--
--
Geum aleppicum
Total Cover =
Salix discolor
--
----
Total Cover =
PHALARIS ARUNDINACEAAster lanceolatus
Solidago canadensis
Populus deltoides
5
Sapling/Shrub Stratum (Plot size: 5 meter radius)
--
Tree -
Wetland ID:
Definitions of Vegetation Strata:
80.0%
--
Multiply by:
----
Herb Stratum (Plot size: 2 meter radius)
Remarks:
Sample PointIndiana Line 6B
----
--
--
-- Total % Cover of:
------
--
------
--
Solidago gigantea
--
Herb -
Woody Vines - All woody vines greater than 3.28 ft. in height.
All herbaceous (non-woody) plants, regardless of size, and woody plants less than 3 28 ft tall
DAUCUS CAROTA

Page 1 of 2
Project/Site: Stantec Project #: 193701313 Date: Applicant: County: Investigator #1: Investigator #2: State: Soil Unit: Wetland ID: Landform: Sample Point: Slope (%): 4 Latitude: -- Longitude: Datum: -- Community ID: Are climatic/hydrologic conditions on the site typical for this time of year? (If no, explain in remarks) Section: 17 Are Vegetation , Soil , or Hydrology significantly disturbed? Township: 36 N Are Vegetation , Soil , or Hydrology naturally problematic? Range: 5 Dir: wSUMMARY OF FINDINGS Hydrophytic Vegetation Present? Yes No Hydric Soils Present? Yes No Wetland Hydrology Present? Yes No Is This Sampling Point Within A Wetland? Yes No
HYDROLOGY
Wetland Hydrology Indicators (Check here if indicators are not present):Primary: Secondary:
A1 - Surface Water B9 - Water-Stained Leaves B6 - Surface Soil CracksA2 - High Water Table B13 - Aquatic Fauna B10 - Drainage PatternsA3 - Saturation B15 - Marl Deposits B16 - Moss Trim LinesB1 - Water Marks C1 - Hydrogen Sulfide Odor C2 - Dry-Season Water TableB2 - Sediment Deposits C3 - Oxidized Rhizospheres on Living Roots C8 - Crayfish BurrowsB3 - Drift Deposits C4 - Presence of Reduced Iron C9 - Saturation Visible on Aerial ImageryB4 - Algal Mat or Crust C6 - Recent Iron Reduction in Tilled Soils D1 - Stunted or Stressed PlantsB5 - Iron Deposits C7 - Thin Muck Surface D2 - Geomorphic PositionB7 - Inundation Visible on Aerial Imagery Other (Explain) D3 - Shallow AquitardB8 - Sparsely Vegetated Concave Surface D4 - Microtopographic Relief
D5 - FAC-Neutral Test
Field Observations: Surface Water Present? Yes No Depth: N/A (in.) Water Table Present? Yes No Depth: N/A (in.) Saturation Present? Yes No Depth: N/A (in.)
SOILS Map Unit Name: Martinsville loam Series Drainage Class: well drained Taxonomy (Subgroup): Typic Hapludalfs Field Observations Confirm Mapped Type? Yes No
Top BottomDepth Depth Horizon % % Type Location
0 15 1 10YR 3/2 -- -- -- -- -- --15 20 2 10YR 4/2 60 10YR 4/6 10 C M15 20 2 10YR 6/2 30 -- -- -- -- ---- -- -- -- -- -- -- -- -- -- ---- -- -- -- -- -- -- -- -- -- ---- -- -- -- -- -- -- -- -- -- ---- -- -- -- -- -- -- -- -- -- ---- -- -- -- -- -- -- -- -- -- --
NRCS Hydric Soil Field Indicators (check here if indicators are not present):A1- Histosol S8 - Polyvalue Below Surface A10 - 2 cm Muck (LRR K, L, MLRA149B)A2 - Histic Epipedon (LRR R, MLRA 149B) A16 - Coast Prairie Redox (LRR K, L, R)A3 - Black Histic S9 - Thin Dark Surface S3 - 5cm Mucky Peat of Peat (LRR K, L, R)A4 - Hydrogen Sulfide (LRR R, MLRA 149B) S7 - Dark Surface (LRR K, L)A5 - Stratified Layers F1 - Loamy Muck Mineral S8 - Polyvalue Below Surface (LRR K, L)A11 - Depleted Below Dark Surface (LRR K, L) S9 - Thin Dark Surface (LRR K, L)A12 - Thick Dark Surface F2 - Loamy Gleyed Matrix F12 - Iron-Manganese Masses (LRR K, L, R)S1 - Sandy Muck Mineral F3 - Depleted Matrix F19 - Piedmont Floodplain Soils (MLRA 149B)S4 - Sandy Gleyed Matrix F6 - Redox Dark Surface TA6 - Mesic Spodic (MLRA 144A, 145, 149B)S5 - Sandy Redox F7 - Depleted Dark Surface TF2 - Red Parent MaterialS6 - Stripped Matrix F8 - Redox Depressions TF12 - Very Shallow Dark SurfaceS7 - Dark Surface (LRR R, MLRA 149B) Other (Explain in Remarks)
Plowed ag field.
-- Local Relief: --
--
--
--
Color (Moist)Mottles
YesHydric Soil Present?
Describe Recorded Data (stream gauge, monitoring well, aerial photos, previous inspections), if available: Remarks:
Sandy LoamSandy Loam
W-489b
Enbridge
--
--
Remarks:
Remarks:
--Martinsville loam
Indiana Line 6B
Type: N/A Depth: N/A
NWI/WWI Classification:
Profile Description (Describe to the depth needed to document the indicator or confirm the absence of indicators.) (Type: C=Concentration, D=Depletion, RM=Reduced Matrix, CS=Covered/Coated Sand Grains; Locaiton: PL=Pore Lining, M=Matrix)
Matrix
Silt Loam
------
E. Parker H. Stoffs Indiana
Are normal circumstances present? Yes No
Wetland Hydrology Present? Yes No
No
Color (Moist)
N/A
1 Indicators of hydrophytic vegetation and wetland hydrology must be present, unless disturbed or problematic.
2uUpland
Porter11/11/11
Texture(e.g. clay, sand, loam)
WETLAND DETERMINATION DATA FORMNorthcentral and Northeast Region
Indicators for Problematic Soils 1
Restrictive Layer (If Observed)
Yes No

Page 2 of 2
Project/Site: W-489b 2u
VEGETATION (Species identified in all uppercase are non-native species.) Tree Stratum (Plot size: 10 meter radius)
% Cover Dominant Ind.Status Dominance Test Worksheet1. -- -- --2. -- -- -- (A)3. -- -- --4. -- -- -- (B)5. -- -- --6. -- -- -- (A/B)7. -- -- --8. -- -- -- Prevalence Index Worksheet9. -- -- --10. -- -- -- OBL spp. 0 x 1 = 0
0 FACW spp. 0 x 2 = 0
FAC spp. 1 x 3 = 3
FACU spp. 0 x 4 = 0
1. -- -- -- UPL spp. 100 x 5 = 500
2. -- -- --3. -- -- -- Total 101 (A) 503 (B)4. -- -- --5. -- -- -- Prevalence Index = B/A = 4.980
6. -- -- --7. -- -- --8. -- -- -- Hydrophytic Vegetation Indicators:9. -- -- -- Yes No Rapid Test for Hydrophytic Vegetation10. -- -- -- Yes No Dominance Test is > 50%
0 Yes No Prevalence Index is ≤ 3.0 *Yes No Morphological Adaptations (Explain) *Yes No Problem Hydrophytic Vegetation (Explain) *
1. 100 Y UPL2. 1 N FAC3. -- -- --4. -- -- --5. -- -- --6 -- -- --7. -- -- --8. -- -- --9. -- -- -- Sapling/Shrub -
10. -- -- --11. -- -- --12. -- -- --13. -- -- --14. -- -- --15. -- -- --
101
1. -- -- --2. -- -- --3. -- -- -- Hydrophytic Vegetation Present Yes No5. -- -- --4. -- -- --
0
Additional Remarks:
Remarks:
Sample PointIndiana Line 6B
----
--
--
-- Total % Cover of:
------
--
------
--
Equisetum arvense
--
Herb -
Woody Vines - All woody vines greater than 3.28 ft. in height.
All herbaceous (non-woody) plants, regardless of size, and woody plants less than 3 28 ft tall
--Tree -
Wetland ID:
Definitions of Vegetation Strata:
0.0%
--
Multiply by:
----
Herb Stratum (Plot size: 2 meter radius)
----
--
--
--
Total Cover =
--
--
----
Total Cover =
----
GLYCINE MAX
--
1
Sapling/Shrub Stratum (Plot size: 5 meter radius)
--
--
----
Species Name
Total Number of Dominant Species Across All Strata:
Percent of Dominant Species That Are OBL, FACW, or FAC:
Number of Dominant Species that are OBL, FACW, or FAC: 0
--
* Indicators of hydric soil and wetland hydrology must be present, unless disturbed or problematic.
Woody Vine Stratum (Plot size: 10 meter radius)
Total Cover =
----
--
--
--
Woody plants 3 in. (7.6cm) or more in diameter at breast height (DBH), regardless of height.
Woody plants less than 3 in. DBH and greater than 3.28 ft. tall.
Total Cover =
Northcentral and Northeast Region
WETLAND DETERMINATION DATA FORM

Page 1 of 2
Project/Site: Stantec Project #: 193701313 Date: Applicant: County: Investigator #1: Investigator #2: State: Soil Unit: Wetland ID: Landform: Sample Point: Slope (%): -- Latitude: -- Longitude: Datum: -- Community ID: Are climatic/hydrologic conditions on the site typical for this time of year? (If no, explain in remarks) Section: 17 Are Vegetation , Soil , or Hydrology significantly disturbed? Township: 36 N Are Vegetation , Soil , or Hydrology naturally problematic? Range: 5 Dir: WSUMMARY OF FINDINGS Hydrophytic Vegetation Present? Yes No Hydric Soils Present? Yes No Wetland Hydrology Present? Yes No Is This Sampling Point Within A Wetland? Yes No
HYDROLOGY
Wetland Hydrology Indicators (Check here if indicators are not present):Primary: Secondary:
A1 - Surface Water B9 - Water-Stained Leaves B6 - Surface Soil CracksA2 - High Water Table B13 - Aquatic Fauna B10 - Drainage PatternsA3 - Saturation B15 - Marl Deposits B16 - Moss Trim LinesB1 - Water Marks C1 - Hydrogen Sulfide Odor C2 - Dry-Season Water TableB2 - Sediment Deposits C3 - Oxidized Rhizospheres on Living Roots C8 - Crayfish BurrowsB3 - Drift Deposits C4 - Presence of Reduced Iron C9 - Saturation Visible on Aerial ImageryB4 - Algal Mat or Crust C6 - Recent Iron Reduction in Tilled Soils D1 - Stunted or Stressed PlantsB5 - Iron Deposits C7 - Thin Muck Surface D2 - Geomorphic PositionB7 - Inundation Visible on Aerial Imagery Other (Explain) D3 - Shallow AquitardB8 - Sparsely Vegetated Concave Surface D4 - Microtopographic Relief
D5 - FAC-Neutral Test
Field Observations: Surface Water Present? Yes No Depth: N/A (in.) Water Table Present? Yes No Depth: N/A (in.) Saturation Present? Yes No Depth: 15 (in.)
SOILS Map Unit Name: Martinsville loam Series Drainage Class: well drained Taxonomy (Subgroup): Typic Hapludalfs Field Observations Confirm Mapped Type? Yes No
Top BottomDepth Depth Horizon % % Type Location
0 3 1 10YR 3/2 -- -- -- -- -- --3 7 2 10YR 4/2 90 7.5YR 3/4 10 C M7 18 3 7.5YR 4/2 85 7.5YR 3/4 15 C M-- -- -- -- -- -- -- -- -- -- ---- -- -- -- -- -- -- -- -- -- ---- -- -- -- -- -- -- -- -- -- ---- -- -- -- -- -- -- -- -- -- ---- -- -- -- -- -- -- -- -- -- --
NRCS Hydric Soil Field Indicators (check here if indicators are not present):A1- Histosol S8 - Polyvalue Below Surface A10 - 2 cm Muck (LRR K, L, MLRA149B)A2 - Histic Epipedon (LRR R, MLRA 149B) A16 - Coast Prairie Redox (LRR K, L, R)A3 - Black Histic S9 - Thin Dark Surface S3 - 5cm Mucky Peat of Peat (LRR K, L, R)A4 - Hydrogen Sulfide (LRR R, MLRA 149B) S7 - Dark Surface (LRR K, L)A5 - Stratified Layers F1 - Loamy Muck Mineral S8 - Polyvalue Below Surface (LRR K, L)A11 - Depleted Below Dark Surface (LRR K, L) S9 - Thin Dark Surface (LRR K, L)A12 - Thick Dark Surface F2 - Loamy Gleyed Matrix F12 - Iron-Manganese Masses (LRR K, L, R)S1 - Sandy Muck Mineral F3 - Depleted Matrix F19 - Piedmont Floodplain Soils (MLRA 149B)S4 - Sandy Gleyed Matrix F6 - Redox Dark Surface TA6 - Mesic Spodic (MLRA 144A, 145, 149B)S5 - Sandy Redox F7 - Depleted Dark Surface TF2 - Red Parent MaterialS6 - Stripped Matrix F8 - Redox Depressions TF12 - Very Shallow Dark SurfaceS7 - Dark Surface (LRR R, MLRA 149B) Other (Explain in Remarks)
1uUpland
Porter11/11/11
Texture(e.g. clay, sand, loam)
WETLAND DETERMINATION DATA FORMNorthcentral and Northeast Region
Indicators for Problematic Soils 1
Restrictive Layer (If Observed)
Yes No
No
No
Color (Moist)
N/A
1 Indicators of hydrophytic vegetation and wetland hydrology must be present, unless disturbed or problematic.
--Martinsville loam
Indiana Line 6B
Type: N/A Depth: N/A
NWI/WWI Classification:
Profile Description (Describe to the depth needed to document the indicator or confirm the absence of indicators.) (Type: C=Concentration, D=Depletion, RM=Reduced Matrix, CS=Covered/Coated Sand Grains; Locaiton: PL=Pore Lining, M=Matrix)
Matrix
Sandy Loam
------
E. Parker H. Stoffs Indiana
Are normal circumstances present? Yes No
Wetland Hydrology Present? Yes
W-489c
Enbridge
--
--
Remarks:
Remarks:
Area clear cut for transmission line corridor. Soils are sandy and therefore naturally problematic.
-- Local Relief: --
While soils are hydric, the absence of wetland hydrology and vegetation supports an upland determination.
--
--
Color (Moist)Mottles
YesHydric Soil Present?
Describe Recorded Data (stream gauge, monitoring well, aerial photos, previous inspections), if available: Remarks:
Sandy LoamSandy Loam
Page 2 of 2
Project/Site: W-489c 1u
VEGETATION (Species identified in all uppercase are non-native species.) Tree Stratum (Plot size: 10 meter radius)
% Cover Dominant Ind.Status Dominance Test Worksheet1. -- -- --2. -- -- -- (A)3. -- -- --4. -- -- -- (B)5. -- -- --6. -- -- -- (A/B)7. -- -- --8. -- -- -- Prevalence Index Worksheet9. -- -- --10. -- -- -- OBL spp. 0 x 1 = 0
0 FACW spp. 2 x 2 = 4
FAC spp. 0 x 3 = 0
FACU spp. 1 x 4 = 4
1. 2 N FACW UPL spp. 7 x 5 = 35
2. 80 Y --3. -- -- -- Total 10 (A) 43 (B)4. -- -- --5. -- -- -- Prevalence Index = B/A = 4.300
6. -- -- --7. -- -- --8. -- -- -- Hydrophytic Vegetation Indicators:9. -- -- -- Yes No Rapid Test for Hydrophytic Vegetation10. -- -- -- Yes No Dominance Test is > 50%
82 Yes No Prevalence Index is ≤ 3.0 *Yes No Morphological Adaptations (Explain) *Yes No Problem Hydrophytic Vegetation (Explain) *
1. 5 Y NI2. 2 Y UPL3. 1 N FACU4. -- -- --5. -- -- --6 -- -- --7. -- -- --8. -- -- --9. -- -- -- Sapling/Shrub -
10. -- -- --11. -- -- --12. -- -- --13. -- -- --14. -- -- --15. -- -- --
8
1. -- -- --2. -- -- --3. -- -- -- Hydrophytic Vegetation Present Yes No5. -- -- --4. -- -- --
0
Additional Remarks:--
* Indicators of hydric soil and wetland hydrology must be present, unless disturbed or problematic.
Woody Vine Stratum (Plot size: 10 meter radius)
Total Cover =
----
--
Veg. significantly disturbed due to clearing for transmission line. Area was recently cut, and unidentifiable shrubs comprised approx. 80% of the ground cover.
--
Woody plants 3 in. (7.6cm) or more in diameter at breast height (DBH), regardless of height.
Woody plants less than 3 in. DBH and greater than 3.28 ft. tall.
Total Cover =
Northcentral and Northeast Region
WETLAND DETERMINATION DATA FORM
Total Number of Dominant Species Across All Strata:
Percent of Dominant Species That Are OBL, FACW, or FAC:
Number of Dominant Species that are OBL, FACW, or FAC: 0
--
----
Species Name
----
--
--
--
Total Cover =
Rubus idaeus var. strigosus
--
----
Total Cover =
Potentilla simplex--
Carex sp.
Unidentifiable shrubs
3
Sapling/Shrub Stratum (Plot size: 5 meter radius)
--
Tree -
Wetland ID:
Definitions of Vegetation Strata:
0.0%
--
Multiply by:
----
Herb Stratum (Plot size: 2 meter radius)
Remarks:
Sample PointIndiana Line 6B
----
--
--
-- Total % Cover of:
------
--
------
--
LINARIA VULGARIS
--
Herb -
Woody Vines - All woody vines greater than 3.28 ft. in height.
All herbaceous (non-woody) plants, regardless of size, and woody plants less than 3 28 ft tall
--

Page 1 of 2
Project/Site: Stantec Project #: 193701313 Date: Applicant: County: Investigator #1: Investigator #2: State: Soil Unit: Wetland ID: Landform: Sample Point: Slope (%): -- Latitude: -- Longitude: Datum: -- Community ID: Are climatic/hydrologic conditions on the site typical for this time of year? (If no, explain in remarks) Section: 17 Are Vegetation , Soil , or Hydrology significantly disturbed? Township: 36 N Are Vegetation , Soil , or Hydrology naturally problematic? Range: 5 Dir: WSUMMARY OF FINDINGS Hydrophytic Vegetation Present? Yes No Hydric Soils Present? Yes No Wetland Hydrology Present? Yes No Is This Sampling Point Within A Wetland? Yes No
HYDROLOGY
Wetland Hydrology Indicators (Check here if indicators are not present):Primary: Secondary:
A1 - Surface Water B9 - Water-Stained Leaves B6 - Surface Soil CracksA2 - High Water Table B13 - Aquatic Fauna B10 - Drainage PatternsA3 - Saturation B15 - Marl Deposits B16 - Moss Trim LinesB1 - Water Marks C1 - Hydrogen Sulfide Odor C2 - Dry-Season Water TableB2 - Sediment Deposits C3 - Oxidized Rhizospheres on Living Roots C8 - Crayfish BurrowsB3 - Drift Deposits C4 - Presence of Reduced Iron C9 - Saturation Visible on Aerial ImageryB4 - Algal Mat or Crust C6 - Recent Iron Reduction in Tilled Soils D1 - Stunted or Stressed PlantsB5 - Iron Deposits C7 - Thin Muck Surface D2 - Geomorphic PositionB7 - Inundation Visible on Aerial Imagery Other (Explain) D3 - Shallow AquitardB8 - Sparsely Vegetated Concave Surface D4 - Microtopographic Relief
D5 - FAC-Neutral Test
Field Observations: Surface Water Present? Yes No Depth: N/A (in.) Water Table Present? Yes No Depth: 11 (in.) Saturation Present? Yes No Depth: 0 (in.)
SOILS Map Unit Name: Riddles loam Series Drainage Class: well Taxonomy (Subgroup): Typic Hapludalfs Field Observations Confirm Mapped Type? Yes No
Top BottomDepth Depth Horizon % % Type Location
0 7 1 10YR 3/2 95 10YR 3/4 5 C M7 18 2 2.5Y 5/2 80 10YR 4/6 20 C M-- -- -- -- -- -- -- -- -- -- ---- -- -- -- -- -- -- -- -- -- ---- -- -- -- -- -- -- -- -- -- ---- -- -- -- -- -- -- -- -- -- ---- -- -- -- -- -- -- -- -- -- ---- -- -- -- -- -- -- -- -- -- --
NRCS Hydric Soil Field Indicators (check here if indicators are not present):A1- Histosol S8 - Polyvalue Below Surface A10 - 2 cm Muck (LRR K, L, MLRA149B)A2 - Histic Epipedon (LRR R, MLRA 149B) A16 - Coast Prairie Redox (LRR K, L, R)A3 - Black Histic S9 - Thin Dark Surface S3 - 5cm Mucky Peat of Peat (LRR K, L, R)A4 - Hydrogen Sulfide (LRR R, MLRA 149B) S7 - Dark Surface (LRR K, L)A5 - Stratified Layers F1 - Loamy Muck Mineral S8 - Polyvalue Below Surface (LRR K, L)A11 - Depleted Below Dark Surface (LRR K, L) S9 - Thin Dark Surface (LRR K, L)A12 - Thick Dark Surface F2 - Loamy Gleyed Matrix F12 - Iron-Manganese Masses (LRR K, L, R)S1 - Sandy Muck Mineral F3 - Depleted Matrix F19 - Piedmont Floodplain Soils (MLRA 149B)S4 - Sandy Gleyed Matrix F6 - Redox Dark Surface TA6 - Mesic Spodic (MLRA 144A, 145, 149B)S5 - Sandy Redox F7 - Depleted Dark Surface TF2 - Red Parent MaterialS6 - Stripped Matrix F8 - Redox Depressions TF12 - Very Shallow Dark SurfaceS7 - Dark Surface (LRR R, MLRA 149B) Other (Explain in Remarks)
1wPEM
Porter11/11/11
Texture(e.g. clay, sand, loam)
WETLAND DETERMINATION DATA FORMNorthcentral and Northeast Region
Indicators for Problematic Soils 1
Restrictive Layer (If Observed)
Yes No
No
No
Color (Moist)
N/A
1 Indicators of hydrophytic vegetation and wetland hydrology must be present, unless disturbed or problematic.
PEMF, PFO1ARiddles loam
Indiana Line 6B
Type: N/A Depth: N/A
NWI/WWI Classification:
Profile Description (Describe to the depth needed to document the indicator or confirm the absence of indicators.) (Type: C=Concentration, D=Depletion, RM=Reduced Matrix, CS=Covered/Coated Sand Grains; Locaiton: PL=Pore Lining, M=Matrix)
Matrix
Sandy Loam
------
E. Parker H. Stoffs Indiana
Are normal circumstances present? Yes No
Wetland Hydrology Present? Yes
W-489c
Enbridge
Identifiable vegetation met FAC-Neutral; however, ground cover included stumps of cut shrubs that were unidentifiable.
--
Remarks:
Remarks:
Area clear cut for transmission line corridor. Soils are sandy and therefore naturally problematic.
-- Local Relief: --
--
--
--
Color (Moist)Mottles
YesHydric Soil Present?
Describe Recorded Data (stream gauge, monitoring well, aerial photos, previous inspections), if available: Remarks:
Loamy Sand--

Page 2 of 2
Project/Site: W-489c 1w
VEGETATION (Species identified in all uppercase are non-native species.) Tree Stratum (Plot size: 10 meter radius)
% Cover Dominant Ind.Status Dominance Test Worksheet1. -- -- --2. -- -- -- (A)3. -- -- --4. -- -- -- (B)5. -- -- --6. -- -- -- (A/B)7. -- -- --8. -- -- -- Prevalence Index Worksheet9. -- -- --10. -- -- -- OBL spp. 90 x 1 = 90
0 FACW spp. 0 x 2 = 0
FAC spp. 0 x 3 = 0
FACU spp. 0 x 4 = 0
1. -- -- -- UPL spp. 10 x 5 = 50
2. -- -- --3. -- -- -- Total 100 (A) 140 (B)4. -- -- --5. -- -- -- Prevalence Index = B/A = 1.400
6. -- -- --7. -- -- --8. -- -- -- Hydrophytic Vegetation Indicators:9. -- -- -- Yes No Rapid Test for Hydrophytic Vegetation10. -- -- -- Yes No Dominance Test is > 50%
0 Yes No Prevalence Index is ≤ 3.0 *Yes No Morphological Adaptations (Explain) *Yes No Problem Hydrophytic Vegetation (Explain) *
1. 80 Y OBL2. 10 N OBL3. 10 N NI4. -- -- --5. -- -- --6 -- -- --7. -- -- --8. -- -- --9. -- -- -- Sapling/Shrub -
10. -- -- --11. -- -- --12. -- -- --13. -- -- --14. -- -- --15. -- -- --
100
1. -- -- --2. -- -- --3. -- -- -- Hydrophytic Vegetation Present Yes No5. -- -- --4. -- -- --
0
Additional Remarks:--
* Indicators of hydric soil and wetland hydrology must be present, unless disturbed or problematic.
Woody Vine Stratum (Plot size: 10 meter radius)
Total Cover =
----
--
Veg. significantly disturbed due to clearing for transmission line. Only cut stumps of shrub layer were visible.
--
Woody plants 3 in. (7.6cm) or more in diameter at breast height (DBH), regardless of height.
Woody plants less than 3 in. DBH and greater than 3.28 ft. tall.
Total Cover =
Northcentral and Northeast Region
WETLAND DETERMINATION DATA FORM
Total Number of Dominant Species Across All Strata:
Percent of Dominant Species That Are OBL, FACW, or FAC:
Number of Dominant Species that are OBL, FACW, or FAC: 1
--
----
Species Name
----
--
--
--
Total Cover =
--
--
----
Total Cover =
Carex sp.--
Juncus effusus
--
1
Sapling/Shrub Stratum (Plot size: 5 meter radius)
--
Tree -
Wetland ID:
Definitions of Vegetation Strata:
100.0%
--
Multiply by:
----
Herb Stratum (Plot size: 2 meter radius)
Remarks:
Sample PointIndiana Line 6B
----
--
--
-- Total % Cover of:
------
--
------
--
Scirpus atrovirens
--
Herb -
Woody Vines - All woody vines greater than 3.28 ft. in height.
All herbaceous (non-woody) plants, regardless of size, and woody plants less than 3 28 ft tall
--

Page 1 of 2
Project/Site: Stantec Project #: 193701313 Date: Applicant: County: Investigator #1: Investigator #2: State: Soil Unit: Wetland ID: Landform: Sample Point: Slope (%): -- Latitude: -- Longitude: Datum: -- Community ID: Are climatic/hydrologic conditions on the site typical for this time of year? (If no, explain in remarks) Section: 17 Are Vegetation , Soil , or Hydrology significantly disturbed? Township: 36 N Are Vegetation , Soil , or Hydrology naturally problematic? Range: 5 Dir: WSUMMARY OF FINDINGS Hydrophytic Vegetation Present? Yes No Hydric Soils Present? Yes No Wetland Hydrology Present? Yes No Is This Sampling Point Within A Wetland? Yes No
HYDROLOGY
Wetland Hydrology Indicators (Check here if indicators are not present):Primary: Secondary:
A1 - Surface Water B9 - Water-Stained Leaves B6 - Surface Soil CracksA2 - High Water Table B13 - Aquatic Fauna B10 - Drainage PatternsA3 - Saturation B15 - Marl Deposits B16 - Moss Trim LinesB1 - Water Marks C1 - Hydrogen Sulfide Odor C2 - Dry-Season Water TableB2 - Sediment Deposits C3 - Oxidized Rhizospheres on Living Roots C8 - Crayfish BurrowsB3 - Drift Deposits C4 - Presence of Reduced Iron C9 - Saturation Visible on Aerial ImageryB4 - Algal Mat or Crust C6 - Recent Iron Reduction in Tilled Soils D1 - Stunted or Stressed PlantsB5 - Iron Deposits C7 - Thin Muck Surface D2 - Geomorphic PositionB7 - Inundation Visible on Aerial Imagery Other (Explain) D3 - Shallow AquitardB8 - Sparsely Vegetated Concave Surface D4 - Microtopographic Relief
D5 - FAC-Neutral Test
Field Observations: Surface Water Present? Yes No Depth: N/A (in.) Water Table Present? Yes No Depth: N/A (in.) Saturation Present? Yes No Depth: N/A (in.)
SOILS Map Unit Name: Riddles loam Series Drainage Class: well drained Taxonomy (Subgroup): Typic Hapludalfs Field Observations Confirm Mapped Type? Yes No
Top BottomDepth Depth Horizon % % Type Location
0 7 1 10YR 3/2 -- -- -- -- -- --7 17 2 10YR 4/2 -- -- -- -- -- --17 20 3 10YR 5/4 -- 10YR 4/6 5 C M-- -- -- -- -- -- -- -- -- -- ---- -- -- -- -- -- -- -- -- -- ---- -- -- -- -- -- -- -- -- -- ---- -- -- -- -- -- -- -- -- -- ---- -- -- -- -- -- -- -- -- -- --
NRCS Hydric Soil Field Indicators (check here if indicators are not present):A1- Histosol S8 - Polyvalue Below Surface A10 - 2 cm Muck (LRR K, L, MLRA149B)A2 - Histic Epipedon (LRR R, MLRA 149B) A16 - Coast Prairie Redox (LRR K, L, R)A3 - Black Histic S9 - Thin Dark Surface S3 - 5cm Mucky Peat of Peat (LRR K, L, R)A4 - Hydrogen Sulfide (LRR R, MLRA 149B) S7 - Dark Surface (LRR K, L)A5 - Stratified Layers F1 - Loamy Muck Mineral S8 - Polyvalue Below Surface (LRR K, L)A11 - Depleted Below Dark Surface (LRR K, L) S9 - Thin Dark Surface (LRR K, L)A12 - Thick Dark Surface F2 - Loamy Gleyed Matrix F12 - Iron-Manganese Masses (LRR K, L, R)S1 - Sandy Muck Mineral F3 - Depleted Matrix F19 - Piedmont Floodplain Soils (MLRA 149B)S4 - Sandy Gleyed Matrix F6 - Redox Dark Surface TA6 - Mesic Spodic (MLRA 144A, 145, 149B)S5 - Sandy Redox F7 - Depleted Dark Surface TF2 - Red Parent MaterialS6 - Stripped Matrix F8 - Redox Depressions TF12 - Very Shallow Dark SurfaceS7 - Dark Surface (LRR R, MLRA 149B) Other (Explain in Remarks)
Area clear cut for transmission line corridor.
-- Local Relief: --
--
--
--
Color (Moist)Mottles
YesHydric Soil Present?
Describe Recorded Data (stream gauge, monitoring well, aerial photos, previous inspections), if available: Remarks:
Sandy Clay LoamSandy Clay Loam
W-489c
Enbridge
No primary wetland hydrology indicators were observed; only the FAC-Neutral test was met.
--
Remarks:
Remarks:
--Riddles loam
Indiana Line 6B
Type: N/A Depth: N/A
NWI/WWI Classification:
Profile Description (Describe to the depth needed to document the indicator or confirm the absence of indicators.) (Type: C=Concentration, D=Depletion, RM=Reduced Matrix, CS=Covered/Coated Sand Grains; Locaiton: PL=Pore Lining, M=Matrix)
Matrix
Sandy Clay Loam
------
E. Parker H. Stoffs Indiana
Are normal circumstances present? Yes No
Wetland Hydrology Present? Yes No
No
Color (Moist)
N/A
1 Indicators of hydrophytic vegetation and wetland hydrology must be present, unless disturbed or problematic.
2uUpland
Porter11/11/11
Texture(e.g. clay, sand, loam)
WETLAND DETERMINATION DATA FORMNorthcentral and Northeast Region
Indicators for Problematic Soils 1
Restrictive Layer (If Observed)
Yes No

Page 2 of 2
Project/Site: W-489c 2u
VEGETATION (Species identified in all uppercase are non-native species.) Tree Stratum (Plot size: 10 meter radius)
% Cover Dominant Ind.Status Dominance Test Worksheet1. -- -- --2. -- -- -- (A)3. -- -- --4. -- -- -- (B)5. -- -- --6. -- -- -- (A/B)7. -- -- --8. -- -- -- Prevalence Index Worksheet9. -- -- --10. -- -- -- OBL spp. 0 x 1 = 0
0 FACW spp. 40 x 2 = 80
FAC spp. 0 x 3 = 0
FACU spp. 90 x 4 = 360
1. 30 Y FACW UPL spp. 5 x 5 = 25
2. 10 Y FACW3. -- -- -- Total 135 (A) 465 (B)4. -- -- --5. -- -- -- Prevalence Index = B/A = 3.444
6. -- -- --7. -- -- --8. -- -- -- Hydrophytic Vegetation Indicators:9. -- -- -- Yes No Rapid Test for Hydrophytic Vegetation10. -- -- -- Yes No Dominance Test is > 50%
40 Yes No Prevalence Index is ≤ 3.0 *Yes No Morphological Adaptations (Explain) *Yes No Problem Hydrophytic Vegetation (Explain) *
1. 10 N FACU2. 80 Y FACU3. 10 N --4. 5 N UPL5. -- -- --6 -- -- --7. -- -- --8. -- -- --9. -- -- -- Sapling/Shrub -
10. -- -- --11. -- -- --12. -- -- --13. -- -- --14. -- -- --15. -- -- --
105
1. -- -- --2. -- -- --3. -- -- -- Hydrophytic Vegetation Present Yes No5. -- -- --4. -- -- --
0
Additional Remarks:
Remarks:
Sample PointIndiana Line 6B
----
--
--
-- Total % Cover of:
------
--
------
--
Poa compressa
--
Herb -
Woody Vines - All woody vines greater than 3.28 ft. in height.
All herbaceous (non-woody) plants, regardless of size, and woody plants less than 3 28 ft tall
--Tree -
Wetland ID:
Definitions of Vegetation Strata:
66.7%
--
Multiply by:
----
Herb Stratum (Plot size: 2 meter radius)
----
--
--
--
Total Cover =
Populus balsamifera
--
----
Total Cover =
Pacera sp.LINARIA VULGARIS
Solidago canadensis
Rubus idaeus var. strigosus
3
Sapling/Shrub Stratum (Plot size: 5 meter radius)
--
--
----
Species Name
Total Number of Dominant Species Across All Strata:
Percent of Dominant Species That Are OBL, FACW, or FAC:
Number of Dominant Species that are OBL, FACW, or FAC: 2
The absence of hydric soils and primary wetland hydrology indicators supports an upland determination.
* Indicators of hydric soil and wetland hydrology must be present, unless disturbed or problematic.
Woody Vine Stratum (Plot size: 10 meter radius)
Total Cover =
----
--
While the >50% dominance criteria was met, the Prevalence Index was greater than 3 and the area did not meet the Rapid Test for Hydrophytic vegetation. Poa compressa , a FACU species, dominated the understory.
--
Woody plants 3 in. (7.6cm) or more in diameter at breast height (DBH), regardless of height.
Woody plants less than 3 in. DBH and greater than 3.28 ft. tall.
Total Cover =
Northcentral and Northeast Region
WETLAND DETERMINATION DATA FORM
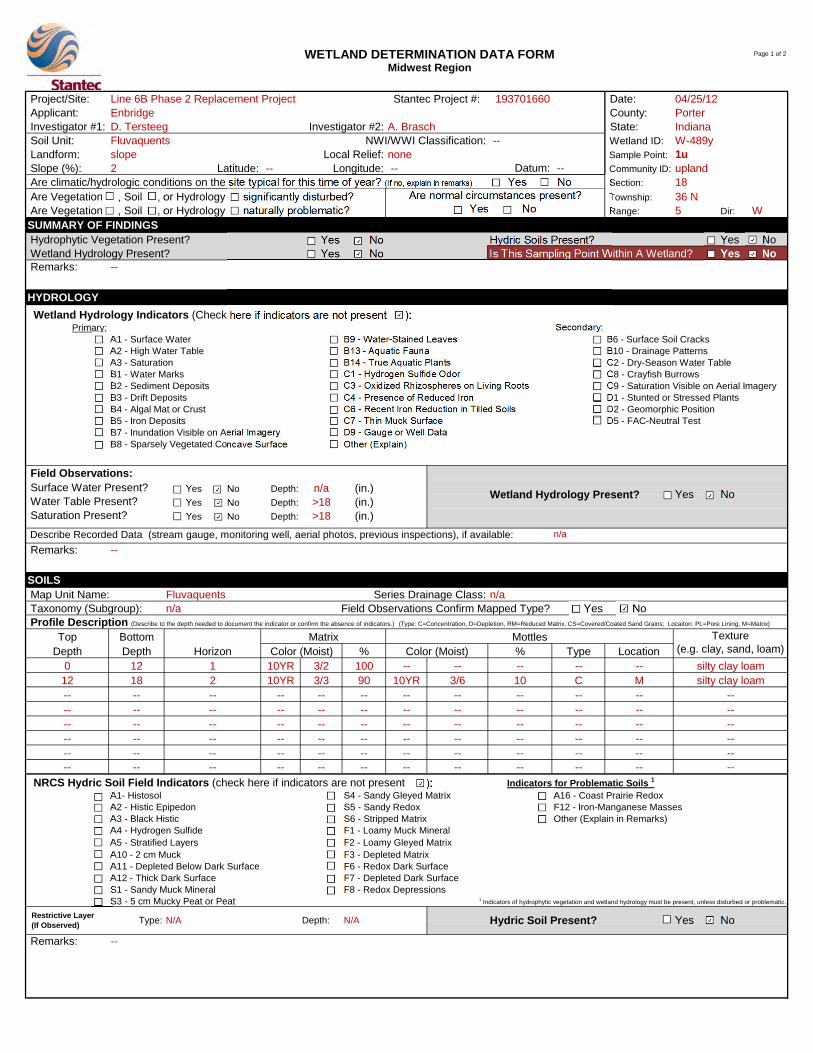
Page 1 of 2
Project/Site: Stantec Project #: 193701660 Date: Applicant: County: Investigator #1: Investigator #2: State: Soil Unit: Wetland ID: Landform: Sample Point: Slope (%): 2 Latitude: -- Longitude: Datum: -- Community ID: Are climatic/hydrologic conditions on the site typical for this time of year? (If no, explain in remarks) Section: 18 Are Vegetation , Soil , or Hydrology significantly disturbed? Township: 36 N Are Vegetation , Soil , or Hydrology naturally problematic? Range: 5 Dir: WSUMMARY OF FINDINGS Hydrophytic Vegetation Present? Yes No Hydric Soils Present? Yes No Wetland Hydrology Present? Yes No Is This Sampling Point Within A Wetland? Yes No
HYDROLOGY
Wetland Hydrology Indicators (Check here if indicators are not present ):Primary: Secondary:
A1 - Surface Water B9 - Water-Stained Leaves B6 - Surface Soil CracksA2 - High Water Table B13 - Aquatic Fauna B10 - Drainage PatternsA3 - Saturation B14 - True Aquatic Plants C2 - Dry-Season Water TableB1 - Water Marks C1 - Hydrogen Sulfide Odor C8 - Crayfish BurrowsB2 - Sediment Deposits C3 - Oxidized Rhizospheres on Living Roots C9 - Saturation Visible on Aerial ImageryB3 - Drift Deposits C4 - Presence of Reduced Iron D1 - Stunted or Stressed PlantsB4 - Algal Mat or Crust C6 - Recent Iron Reduction in Tilled Soils D2 - Geomorphic PositionB5 - Iron Deposits C7 - Thin Muck Surface D5 - FAC-Neutral TestB7 - Inundation Visible on Aerial Imagery D9 - Gauge or Well DataB8 - Sparsely Vegetated Concave Surface Other (Explain)
Field Observations: Surface Water Present? Yes No Depth: n/a (in.) Water Table Present? Yes No Depth: >18 (in.) Saturation Present? Yes No Depth: >18 (in.)
SOILS Map Unit Name: Fluvaquents Series Drainage Class: n/a Taxonomy (Subgroup): n/a Field Observations Confirm Mapped Type? Yes No
Top BottomDepth Depth Horizon % % Type Location
0 12 1 10YR 3/2 100 -- -- -- -- --12 18 2 10YR 3/3 90 10YR 3/6 10 C M-- -- -- -- -- -- -- -- -- -- ---- -- -- -- -- -- -- -- -- -- ---- -- -- -- -- -- -- -- -- -- ---- -- -- -- -- -- -- -- -- -- ---- -- -- -- -- -- -- -- -- -- ---- -- -- -- -- -- -- -- -- -- --
NRCS Hydric Soil Field Indicators (check here if indicators are not present ):A1- Histosol S4 - Sandy Gleyed Matrix A16 - Coast Prairie Redox A2 - Histic Epipedon S5 - Sandy Redox F12 - Iron-Manganese Masses A3 - Black Histic S6 - Stripped Matrix Other (Explain in Remarks)A4 - Hydrogen Sulfide F1 - Loamy Muck MineralA5 - Stratified Layers F2 - Loamy Gleyed MatrixA10 - 2 cm Muck F3 - Depleted MatrixA11 - Depleted Below Dark Surface F6 - Redox Dark SurfaceA12 - Thick Dark Surface F7 - Depleted Dark SurfaceS1 - Sandy Muck Mineral F8 - Redox DepressionsS3 - 5 cm Mucky Peat or Peat 1 Indicators of hydrophytic vegetation and wetland hydrology must be present, unless disturbed or problematic.
WETLAND DETERMINATION DATA FORMMidwest Region
Indicators for Problematic Soils 1
Yes NoAre normal circumstances present?
Yes No
Wetland Hydrology Present? Yes No
04/25/12
--Fluvaquents
Line 6B Phase 2 Replacement Project
NWI/WWI Classification:
Describe Recorded Data (stream gauge, monitoring well, aerial photos, previous inspections), if available:
silty clay loamColor (Moist)
Restrictive Layer (If Observed)
Remarks:
Type: N/A Depth: N/A Hydric Soil Present?
Profile Description (Describe to the depth needed to document the indicator or confirm the absence of indicators.) (Type: C=Concentration, D=Depletion, RM=Reduced Matrix, CS=Covered/Coated Sand Grains; Locaiton: PL=Pore Lining, M=Matrix)
EnbridgeD. Tersteeg
----
Remarks: --
--
silty clay loam--
No
-- Remarks:
Texture(e.g. clay, sand, loam)
Yes
Matrix
n/a
--
slope Local Relief: none --
--
Color (Moist)Mottles
upland
--
A. BraschPorterIndianaW-489y1u

Page 2 of 2
Project/Site: W-489y 1u
VEGETATION (Species identified in all uppercase are non-native species.) Tree Stratum (Plot size: 10 meter radius)
% Cover Dominant Ind.Status Dominance Test Worksheet1. 40 Y FAC2. 10 N FACW (A)3. -- -- --4. -- -- -- (B)5. -- -- --6. -- -- -- (A/B)7. -- -- --8. -- -- -- Prevalence Index Worksheet9. -- -- --10. -- -- -- OBL spp. 20 x 1 = 20
50 FACW spp. 10 x 2 = 20
FAC spp. 100 x 3 = 300
FACU spp. 60 x 4 = 240
1. 40 Y FACU UPL spp. 20 x 5 = 100
2. 20 Y FACU3. -- -- -- Total 210 (A) 680 (B)4. -- -- --5. -- -- -- Prevalence Index = B/A = 3.238
6. -- -- --7. -- -- --8. -- -- -- Hydrophytic Vegetation Indicators:9. -- -- -- Yes No Rapid Test for Hydrophytic Vegetation10. -- -- -- Yes No Dominance Test is > 50%
60 Yes No Prevalence Index is ≤ 3.0 *Yes No Morphological Adaptations (Explain) *Yes No Problem Hydrophytic Vegetation (Explain) *
1. 60 Y FAC2. 20 Y UPL3. 20 Y OBL4. -- -- --5. -- -- --6 -- -- --7. -- -- --8. -- -- --9. -- -- -- Sapling/Shrub -
10. -- -- --11. -- -- --12. -- -- --13. -- -- --14. -- -- --15. -- -- --
100
1. -- -- --2. -- -- --3. -- -- -- Hydrophytic Vegetation Present Yes No5. -- -- --4. -- -- --
0
Additional Remarks:--
* Indicators of hydric soil and wetland hydrology must be present, unless disturbed or problematic.
Woody Vine Stratum (Plot size: 10 meter radius)
Total Cover =
----
--
--
--
Woody plants 3 in. (7.6cm) or more in diameter at breast height (DBH), regardless of height.
Woody plants less than 3 in. DBH and greater than 3.28 ft. tall.
Total Cover =
Midwest Region
WETLAND DETERMINATION DATA FORM
--
Populus deltoidesUlmus americana 3
6
Species Name
Total Number of Dominant Species Across All Strata:
Number of Dominant Species that are OBL, FACW, or FAC:
--
--
--
Total Cover =
LONICERA TATARICA
--
----
Total Cover =
Bidens comosus --
ROSA MULTIFLORA
Sapling/Shrub Stratum (Plot size: 5 meter radius)
--
Parthenocissus quinquefolia
--
50.0%
--
Percent of Dominant Species That Are OBL, FACW, or FAC:
----
--
ARCTIUM MINUS
Tree -
Wetland ID:
Definitions of Vegetation Strata:
--
Herb -
Herb Stratum (Plot size: 2 meter radius)
--
All herbaceous (non-woody) plants, regardless of size, and woody plants less than 3 28 ft tall
Multiply by:
Remarks:
Sample PointLine 6B Phase 2 Replacement Project
----
--
--
-- Total % Cover of:
------
--
------
Woody Vines - All woody vines greater than 3.28 ft. in height.
--

Page 1 of 2
Project/Site: Stantec Project #: 193701660 Date: Applicant: County: Investigator #1: Investigator #2: State: Soil Unit: Wetland ID: Landform: Sample Point: Slope (%): 0 Latitude: -- Longitude: Datum: -- Community ID: Are climatic/hydrologic conditions on the site typical for this time of year? (If no, explain in remarks) Section: 18 Are Vegetation , Soil , or Hydrology significantly disturbed? Township: 36 N Are Vegetation , Soil , or Hydrology naturally problematic? Range: 5 Dir: WSUMMARY OF FINDINGS Hydrophytic Vegetation Present? Yes No Hydric Soils Present? Yes No Wetland Hydrology Present? Yes No Is This Sampling Point Within A Wetland? Yes No
HYDROLOGY
Wetland Hydrology Indicators (Check here if indicators are not present ):Primary: Secondary:
A1 - Surface Water B9 - Water-Stained Leaves B6 - Surface Soil CracksA2 - High Water Table B13 - Aquatic Fauna B10 - Drainage PatternsA3 - Saturation B14 - True Aquatic Plants C2 - Dry-Season Water TableB1 - Water Marks C1 - Hydrogen Sulfide Odor C8 - Crayfish BurrowsB2 - Sediment Deposits C3 - Oxidized Rhizospheres on Living Roots C9 - Saturation Visible on Aerial ImageryB3 - Drift Deposits C4 - Presence of Reduced Iron D1 - Stunted or Stressed PlantsB4 - Algal Mat or Crust C6 - Recent Iron Reduction in Tilled Soils D2 - Geomorphic PositionB5 - Iron Deposits C7 - Thin Muck Surface D5 - FAC-Neutral TestB7 - Inundation Visible on Aerial Imagery D9 - Gauge or Well DataB8 - Sparsely Vegetated Concave Surface Other (Explain)
Field Observations: Surface Water Present? Yes No Depth: n/a (in.) Water Table Present? Yes No Depth: 4 (in.) Saturation Present? Yes No Depth: 0 (in.)
SOILS Map Unit Name: Fluvaquents Series Drainage Class: n/a Taxonomy (Subgroup): n/a Field Observations Confirm Mapped Type? Yes No
Top BottomDepth Depth Horizon % % Type Location
0 2 1 10YR 2/1 100 -- -- -- -- --2 10 2 10YR 3/1 90 10YR 3/6 10 C M10 18 3 10YR 4/2 70 10YR 4/6 30 C M-- -- -- -- -- -- -- -- -- -- ---- -- -- -- -- -- -- -- -- -- ---- -- -- -- -- -- -- -- -- -- ---- -- -- -- -- -- -- -- -- -- ---- -- -- -- -- -- -- -- -- -- --
NRCS Hydric Soil Field Indicators (check here if indicators are not present ):A1- Histosol S4 - Sandy Gleyed Matrix A16 - Coast Prairie Redox A2 - Histic Epipedon S5 - Sandy Redox F12 - Iron-Manganese Masses A3 - Black Histic S6 - Stripped Matrix Other (Explain in Remarks)A4 - Hydrogen Sulfide F1 - Loamy Muck MineralA5 - Stratified Layers F2 - Loamy Gleyed MatrixA10 - 2 cm Muck F3 - Depleted MatrixA11 - Depleted Below Dark Surface F6 - Redox Dark SurfaceA12 - Thick Dark Surface F7 - Depleted Dark SurfaceS1 - Sandy Muck Mineral F8 - Redox DepressionsS3 - 5 cm Mucky Peat or Peat 1 Indicators of hydrophytic vegetation and wetland hydrology must be present, unless disturbed or problematic.
WETLAND DETERMINATION DATA FORMMidwest Region
Indicators for Problematic Soils 1
Yes NoAre normal circumstances present?
Yes No
Wetland Hydrology Present? Yes No
04/25/12
--Fluvaquents
Line 6B Phase 2 Replacement Project
NWI/WWI Classification:
Describe Recorded Data (stream gauge, monitoring well, aerial photos, previous inspections), if available:
silt loam Color (Moist)
Restrictive Layer (If Observed)
Remarks:
Type: N/A Depth: N/A Hydric Soil Present?
Profile Description (Describe to the depth needed to document the indicator or confirm the absence of indicators.) (Type: C=Concentration, D=Depletion, RM=Reduced Matrix, CS=Covered/Coated Sand Grains; Locaiton: PL=Pore Lining, M=Matrix)
EnbridgeD. Tersteeg
----
Remarks: --
--
silty clay loamclay loam
No
-- Remarks:
Texture(e.g. clay, sand, loam)
Yes
Matrix
na
Type 1 forested seasonal depression dominated by green ash and American elm.
depression Local Relief: concave --
--
Color (Moist)Mottles
FO1
--
A. BraschPorterIndianaW-489y1w

Page 2 of 2
Project/Site: W-489y 1w
VEGETATION (Species identified in all uppercase are non-native species.) Tree Stratum (Plot size: 10 meter radius)
% Cover Dominant Ind.Status Dominance Test Worksheet1. 20 Y OBL2. 50 Y FACW (A)3. 30 Y FACW4. -- -- -- (B)5. -- -- --6. -- -- -- (A/B)7. -- -- --8. -- -- -- Prevalence Index Worksheet9. -- -- --10. -- -- -- OBL spp. 25 x 1 = 25
100 FACW spp. 115 x 2 = 230
FAC spp. 0 x 3 = 0
FACU spp. 0 x 4 = 0
1. 5 N OBL UPL spp. 0 x 5 = 0
2. 10 Y FACW3. 15 Y FACW Total 140 (A) 255 (B)4. 10 Y FACW5. -- -- -- Prevalence Index = B/A = 1.821
6. -- -- --7. -- -- --8. -- -- -- Hydrophytic Vegetation Indicators:9. -- -- -- Yes No Rapid Test for Hydrophytic Vegetation10. -- -- -- Yes No Dominance Test is > 50%
40 Yes No Prevalence Index is ≤ 3.0 *Yes No Morphological Adaptations (Explain) *Yes No Problem Hydrophytic Vegetation (Explain) *
1. -- -- --2. -- -- --3. -- -- --4. -- -- --5. -- -- --6 -- -- --7. -- -- --8. -- -- --9. -- -- -- Sapling/Shrub -
10. -- -- --11. -- -- --12. -- -- --13. -- -- --14. -- -- --15. -- -- --
0
1. -- -- --2. -- -- --3. -- -- -- Hydrophytic Vegetation Present Yes No5. -- -- --4. -- -- --
0
Additional Remarks:--
* Indicators of hydric soil and wetland hydrology must be present, unless disturbed or problematic.
Woody Vine Stratum (Plot size: 10 meter radius)
Total Cover =
----
--
No herbaceous cover; 100% leaf litter ground coverage.
--
Woody plants 3 in. (7.6cm) or more in diameter at breast height (DBH), regardless of height.
Woody plants less than 3 in. DBH and greater than 3.28 ft. tall.
Total Cover =
Midwest Region
WETLAND DETERMINATION DATA FORM
--
Salix nigra Fraxinus pennsylvanica 6
6
Species Name
Total Number of Dominant Species Across All Strata:
Number of Dominant Species that are OBL, FACW, or FAC:
--
--
--
Total Cover =
Cephalanthus occidentalis
Fraxinus pennsylvanica
--Ulmus americana
Total Cover =
----
Ulmus americana
Sapling/Shrub Stratum (Plot size: 5 meter radius)
--
--
--
100.0%
--
Percent of Dominant Species That Are OBL, FACW, or FAC:
----
--
--
Tree -
Wetland ID:
Definitions of Vegetation Strata:
--
Herb -
Herb Stratum (Plot size: 2 meter radius)
Lindera benzoin
All herbaceous (non-woody) plants, regardless of size, and woody plants less than 3 28 ft tall
Multiply by:
Remarks:
Sample PointLine 6B Phase 2 Replacement Project
----
--
--
-- Total % Cover of:
------
--
------
Woody Vines - All woody vines greater than 3.28 ft. in height.
--

Page 1 of 2
Project/Site: Stantec Project #: 193701660 Date: Applicant: County: Investigator #1: Investigator #2: State: Soil Unit: Wetland ID: Landform: Sample Point: Slope (%): 1 Latitude: -- Longitude: Datum: -- Community ID: Are climatic/hydrologic conditions on the site typical for this time of year? (If no, explain in remarks) Section: 18 Are Vegetation , Soil , or Hydrology significantly disturbed? Township: 36 N Are Vegetation , Soil , or Hydrology naturally problematic? Range: 5 Dir: WSUMMARY OF FINDINGS Hydrophytic Vegetation Present? Yes No Hydric Soils Present? Yes No Wetland Hydrology Present? Yes No Is This Sampling Point Within A Wetland? Yes No
HYDROLOGY
Wetland Hydrology Indicators (Check here if indicators are not present ):Primary: Secondary:
A1 - Surface Water B9 - Water-Stained Leaves B6 - Surface Soil CracksA2 - High Water Table B13 - Aquatic Fauna B10 - Drainage PatternsA3 - Saturation B15 - Marl Deposits B16 - Moss Trim LinesB1 - Water Marks C1 - Hydrogen Sulfide Odor C2 - Dry-Season Water TableB2 - Sediment Deposits C3 - Oxidized Rhizospheres on Living Roots C8 - Crayfish BurrowsB3 - Drift Deposits C4 - Presence of Reduced Iron C9 - Saturation Visible on Aerial ImageryB4 - Algal Mat or Crust C6 - Recent Iron Reduction in Tilled Soils D1 - Stunted or Stressed PlantsB5 - Iron Deposits C7 - Thin Muck Surface D2 - Geomorphic PositionB7 - Inundation Visible on Aerial Imagery Other (Explain) D3 - Shallow AquitardB8 - Sparsely Vegetated Concave Surface D4 - Microtopographic Relief
D5 - FAC-Neutral Test
Field Observations: Surface Water Present? Yes No Depth: n/a (in.) Water Table Present? Yes No Depth: >18 (in.) Saturation Present? Yes No Depth: >18 (in.)
SOILS Map Unit Name: Selfridge loamy fine sand Series Drainage Class: somewhat poorly Taxonomy (Subgroup): Aquic Arenic Hapludalfs Field Observations Confirm Mapped Type? Yes No
Top BottomDepth Depth Horizon % % Type Location
0 15 1 10YR 2/2 100 -- -- -- -- --15 18 2 10YR 3/2 90 10YR 3/6 10 C M-- -- -- -- -- -- -- -- -- -- ---- -- -- -- -- -- -- -- -- -- ---- -- -- -- -- -- -- -- -- -- ---- -- -- -- -- -- -- -- -- -- ---- -- -- -- -- -- -- -- -- -- ---- -- -- -- -- -- -- -- -- -- --
NRCS Hydric Soil Field Indicators (check here if indicators are not present ):A1- Histosol S8 - Polyvalue Below Surface A10 - 2 cm Muck (LRR K, L, MLRA149B)A2 - Histic Epipedon (LRR R, MLRA 149B) A16 - Coast Prairie Redox (LRR K, L, R)A3 - Black Histic S9 - Thin Dark Surface S3 - 5cm Mucky Peat of Peat (LRR K, L, R)A4 - Hydrogen Sulfide (LRR R, MLRA 149B) S7 - Dark Surface (LRR K, L)A5 - Stratified Layers F1 - Loamy Muck Mineral S8 - Polyvalue Below Surface (LRR K, L)A11 - Depleted Below Dark Surface (LRR K, L) S9 - Thin Dark Surface (LRR K, L)A12 - Thick Dark Surface F2 - Loamy Gleyed Matrix F12 - Iron-Manganese Masses (LRR K, L, R)S1 - Sandy Muck Mineral F3 - Depleted Matrix F19 - Piedmont Floodplain Soils (MLRA 149B)S4 - Sandy Gleyed Matrix F6 - Redox Dark Surface TA6 - Mesic Spodic (MLRA 144A, 145, 149B)S5 - Sandy Redox F7 - Depleted Dark Surface TF2 - Red Parent MaterialS6 - Stripped Matrix F8 - Redox Depressions TF12 - Very Shallow Dark SurfaceS7 - Dark Surface (LRR R, MLRA 149B) Other (Explain in Remarks)
Seasonal forested wetland with shrub scrub, Type 1/6
slope Local Relief: none
--
--
--
Color (Moist)Mottles
YesHydric Soil Present?
Describe Recorded Data (stream gauge, monitoring well, aerial photos, previous inspections), if available: Remarks:
clay loam--
W-489z
Enbridge
--
--
Remarks:
Remarks:
--Selfridge loamy fine sand
Line 6B Phase 2 Replacement Project
Type: N/A Depth: N/A
NWI/WWI Classification:
Profile Description (Describe to the depth needed to document the indicator or confirm the absence of indicators.) (Type: C=Concentration, D=Depletion, RM=Reduced Matrix, CS=Covered/Coated Sand Grains; Locaiton: PL=Pore Lining, M=Matrix)
Matrix
silty clay loam
------
D. Tersteeg A. Brasch Indiana
Are normal circumstances present? Yes No
Wetland Hydrology Present? Yes No
No
Color (Moist)
N/A
1 Indicators of hydrophytic vegetation and wetland hydrology must be present, unless disturbed or problematic.
1uupland
Porter04/25/12
Texture(e.g. clay, sand, loam)
WETLAND DETERMINATION DATA FORMNorthcentral and Northeast Region
Indicators for Problematic Soils 1
Restrictive Layer (If Observed)
Yes No

Page 2 of 2
Project/Site: W-489z 1u
VEGETATION (Species identified in all uppercase are non-native species.) Tree Stratum (Plot size: 10 meter radius)
% Cover Dominant Ind.Status Dominance Test Worksheet1. 30 Y FAC2. 20 Y FACU (A)3. 10 N FACU4. -- -- -- (B)5. -- -- --6. -- -- -- (A/B)7. -- -- --8. -- -- -- Prevalence Index Worksheet9. -- -- --10. -- -- -- OBL spp. 0 x 1 = 0
60 FACW spp. 10 x 2 = 20
FAC spp. 30 x 3 = 90
FACU spp. 90 x 4 = 360
1. 50 Y FACU UPL spp. 5 x 5 = 25
2. 5 N FACW3. 5 N NI Total 135 (A) 495 (B)4. 5 N FACW5. -- -- -- Prevalence Index = B/A = 3.667
6. -- -- --7. -- -- --8. -- -- -- Hydrophytic Vegetation Indicators:9. -- -- -- Yes No Rapid Test for Hydrophytic Vegetation10. -- -- -- Yes No Dominance Test is > 50%
65 Yes No Prevalence Index is ≤ 3.0 *Yes No Morphological Adaptations (Explain) *Yes No Problem Hydrophytic Vegetation (Explain) *
1. 10 Y FACU2. -- -- --3. -- -- --4. -- -- --5. -- -- --6 -- -- --7. -- -- --8. -- -- --9. -- -- -- Sapling/Shrub -
10. -- -- --11. -- -- --12. -- -- --13. -- -- --14. -- -- --15. -- -- --
10
1. -- -- --2. -- -- --3. -- -- -- Hydrophytic Vegetation Present Yes No5. -- -- --4. -- -- --
0
Additional Remarks:
Remarks:
Sample PointLine 6B Phase 2 Replacement Project
----
--
--
-- Total % Cover of:
------
--
------
--
--
--
Herb -
Woody Vines - All woody vines greater than 3.28 ft. in height.
All herbaceous (non-woody) plants, regardless of size, and woody plants less than 3 28 ft tall
--Tree -
Wetland ID:
Definitions of Vegetation Strata:
25.0%
--
Multiply by:
----
Herb Stratum (Plot size: 2 meter radius)
----
--
--
--
Total Cover =
ROSA MULTIFLORA
Ribes oxyacanthoides
--Tilia americana
Total Cover =
----
Solidago canadensis
Fraxinus pennsylvanica
4
Sapling/Shrub Stratum (Plot size: 5 meter radius)
--
Vitis riparia
Populus deltoidesPrunus serotina
Species Name
Total Number of Dominant Species Across All Strata:
Percent of Dominant Species That Are OBL, FACW, or FAC:
Number of Dominant Species that are OBL, FACW, or FAC: 1
--
* Indicators of hydric soil and wetland hydrology must be present, unless disturbed or problematic.
Woody Vine Stratum (Plot size: 10 meter radius)
Total Cover =
----
--
--
--
Woody plants 3 in. (7.6cm) or more in diameter at breast height (DBH), regardless of height.
Woody plants less than 3 in. DBH and greater than 3.28 ft. tall.
Total Cover =
Northcentral and Northeast Region
WETLAND DETERMINATION DATA FORM
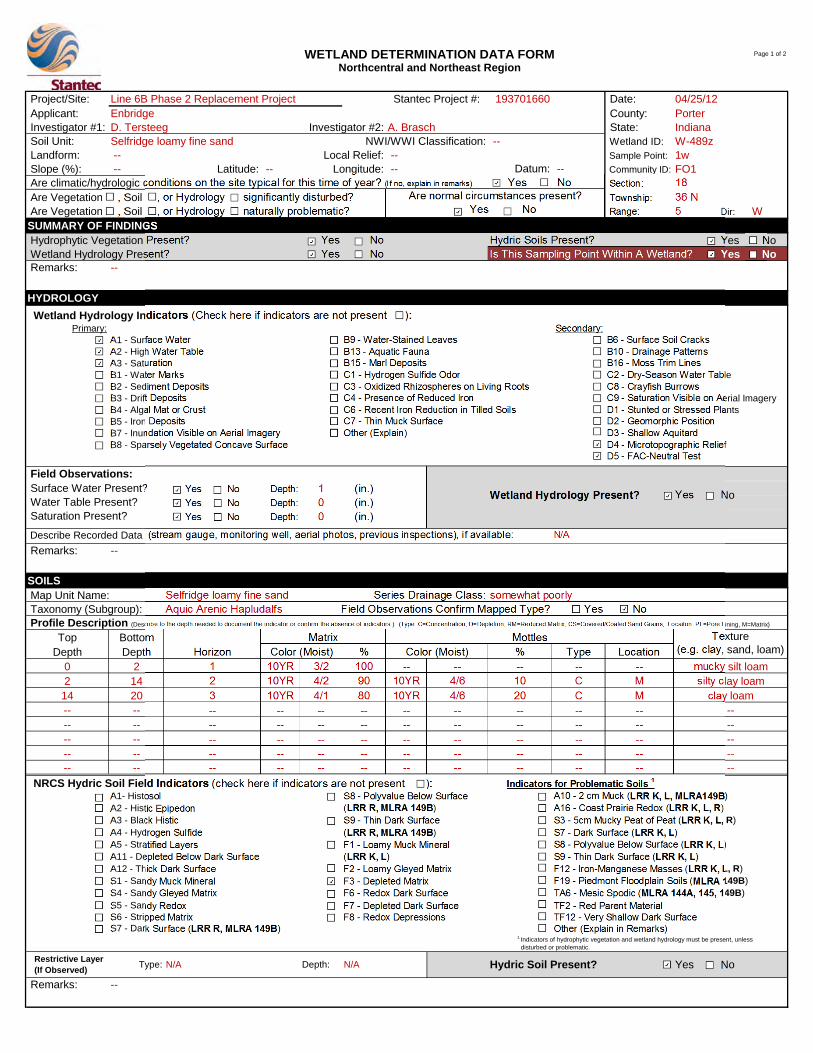
Page 1 of 2
Project/Site: Stantec Project #: 193701660 Date: Applicant: County: Investigator #1: Investigator #2: State: Soil Unit: Wetland ID: Landform: Sample Point: Slope (%): -- Latitude: -- Longitude: Datum: -- Community ID: Are climatic/hydrologic conditions on the site typical for this time of year? (If no, explain in remarks) Section: 18 Are Vegetation , Soil , or Hydrology significantly disturbed? Township: 36 N Are Vegetation , Soil , or Hydrology naturally problematic? Range: 5 Dir: WSUMMARY OF FINDINGS Hydrophytic Vegetation Present? Yes No Hydric Soils Present? Yes No Wetland Hydrology Present? Yes No Is This Sampling Point Within A Wetland? Yes No
HYDROLOGY
Wetland Hydrology Indicators (Check here if indicators are not present ):Primary: Secondary:
A1 - Surface Water B9 - Water-Stained Leaves B6 - Surface Soil CracksA2 - High Water Table B13 - Aquatic Fauna B10 - Drainage PatternsA3 - Saturation B15 - Marl Deposits B16 - Moss Trim LinesB1 - Water Marks C1 - Hydrogen Sulfide Odor C2 - Dry-Season Water TableB2 - Sediment Deposits C3 - Oxidized Rhizospheres on Living Roots C8 - Crayfish BurrowsB3 - Drift Deposits C4 - Presence of Reduced Iron C9 - Saturation Visible on Aerial ImageryB4 - Algal Mat or Crust C6 - Recent Iron Reduction in Tilled Soils D1 - Stunted or Stressed PlantsB5 - Iron Deposits C7 - Thin Muck Surface D2 - Geomorphic PositionB7 - Inundation Visible on Aerial Imagery Other (Explain) D3 - Shallow AquitardB8 - Sparsely Vegetated Concave Surface D4 - Microtopographic Relief
D5 - FAC-Neutral Test
Field Observations: Surface Water Present? Yes No Depth: 1 (in.) Water Table Present? Yes No Depth: 0 (in.) Saturation Present? Yes No Depth: 0 (in.)
SOILS Map Unit Name: Selfridge loamy fine sand Series Drainage Class: somewhat poorly Taxonomy (Subgroup): Aquic Arenic Hapludalfs Field Observations Confirm Mapped Type? Yes No
Top BottomDepth Depth Horizon % % Type Location
0 2 1 10YR 3/2 100 -- -- -- -- --2 14 2 10YR 4/2 90 10YR 4/6 10 C M14 20 3 10YR 4/1 80 10YR 4/6 20 C M-- -- -- -- -- -- -- -- -- -- ---- -- -- -- -- -- -- -- -- -- ---- -- -- -- -- -- -- -- -- -- ---- -- -- -- -- -- -- -- -- -- ---- -- -- -- -- -- -- -- -- -- --
NRCS Hydric Soil Field Indicators (check here if indicators are not present ):A1- Histosol S8 - Polyvalue Below Surface A10 - 2 cm Muck (LRR K, L, MLRA149B)A2 - Histic Epipedon (LRR R, MLRA 149B) A16 - Coast Prairie Redox (LRR K, L, R)A3 - Black Histic S9 - Thin Dark Surface S3 - 5cm Mucky Peat of Peat (LRR K, L, R)A4 - Hydrogen Sulfide (LRR R, MLRA 149B) S7 - Dark Surface (LRR K, L)A5 - Stratified Layers F1 - Loamy Muck Mineral S8 - Polyvalue Below Surface (LRR K, L)A11 - Depleted Below Dark Surface (LRR K, L) S9 - Thin Dark Surface (LRR K, L)A12 - Thick Dark Surface F2 - Loamy Gleyed Matrix F12 - Iron-Manganese Masses (LRR K, L, R)S1 - Sandy Muck Mineral F3 - Depleted Matrix F19 - Piedmont Floodplain Soils (MLRA 149B)S4 - Sandy Gleyed Matrix F6 - Redox Dark Surface TA6 - Mesic Spodic (MLRA 144A, 145, 149B)S5 - Sandy Redox F7 - Depleted Dark Surface TF2 - Red Parent MaterialS6 - Stripped Matrix F8 - Redox Depressions TF12 - Very Shallow Dark SurfaceS7 - Dark Surface (LRR R, MLRA 149B) Other (Explain in Remarks)
--
-- Local Relief: --
--
--
--
Color (Moist)Mottles
YesHydric Soil Present?
Describe Recorded Data (stream gauge, monitoring well, aerial photos, previous inspections), if available: Remarks:
silty clay loamclay loam
W-489z
Enbridge
--
--
Remarks:
Remarks:
--Selfridge loamy fine sand
Line 6B Phase 2 Replacement Project
Type: N/A Depth: N/A
NWI/WWI Classification:
Profile Description (Describe to the depth needed to document the indicator or confirm the absence of indicators.) (Type: C=Concentration, D=Depletion, RM=Reduced Matrix, CS=Covered/Coated Sand Grains; Locaiton: PL=Pore Lining, M=Matrix)
Matrix
mucky silt loam
------
D. Tersteeg A. Brasch Indiana
Are normal circumstances present? Yes No
Wetland Hydrology Present? Yes No
No
Color (Moist)
N/A
1 Indicators of hydrophytic vegetation and wetland hydrology must be present, unless disturbed or problematic.
1wFO1
Porter04/25/12
Texture(e.g. clay, sand, loam)
WETLAND DETERMINATION DATA FORMNorthcentral and Northeast Region
Indicators for Problematic Soils 1
Restrictive Layer (If Observed)
Yes No

Page 2 of 2
Project/Site: W-489z 1w
VEGETATION (Species identified in all uppercase are non-native species.) Tree Stratum (Plot size: 10 meter radius)
% Cover Dominant Ind.Status Dominance Test Worksheet1. 10 Y FACW2. 20 Y FAC (A)3. -- -- --4. -- -- -- (B)5. -- -- --6. -- -- -- (A/B)7. -- -- --8. -- -- -- Prevalence Index Worksheet9. -- -- --10. -- -- -- OBL spp. 80 x 1 = 80
30 FACW spp. 30 x 2 = 60
FAC spp. 40 x 3 = 120
FACU spp. 15 x 4 = 60
1. 40 Y OBL UPL spp. 0 x 5 = 0
2. 5 N FACU3. 20 Y FACW Total 165 (A) 320 (B)4. 10 N FACU5. -- -- -- Prevalence Index = B/A = 1.939
6. -- -- --7. -- -- --8. -- -- -- Hydrophytic Vegetation Indicators:9. -- -- -- Yes No Rapid Test for Hydrophytic Vegetation10. -- -- -- Yes No Dominance Test is > 50%
75 Yes No Prevalence Index is ≤ 3.0 *Yes No Morphological Adaptations (Explain) *Yes No Problem Hydrophytic Vegetation (Explain) *
1. 40 Y OBL2. 20 Y FAC3. -- -- --4. -- -- --5. -- -- --6 -- -- --7. -- -- --8. -- -- --9. -- -- -- Sapling/Shrub -
10. -- -- --11. -- -- --12. -- -- --13. -- -- --14. -- -- --15. -- -- --
60
1. -- -- --2. -- -- --3. -- -- -- Hydrophytic Vegetation Present Yes No5. -- -- --4. -- -- --
0
Additional Remarks:
Remarks:
Sample PointLine 6B Phase 2 Replacement Project
----
--
--
-- Total % Cover of:
------
--
------
--
Ranunculus hispidus
--
Herb -
Woody Vines - All woody vines greater than 3.28 ft. in height.
All herbaceous (non-woody) plants, regardless of size, and woody plants less than 3 28 ft tall
--Tree -
Wetland ID:
Definitions of Vegetation Strata:
100.0%
--
Multiply by:
----
Herb Stratum (Plot size: 2 meter radius)
----
--
--
--
Total Cover =
Cephalanthus occidentalis
Fraxinus pennsylvanica
----
Total Cover =
----
Carex lacustris
ROSA MULTIFLORA
6
Sapling/Shrub Stratum (Plot size: 5 meter radius)
--
Tilia americana
Ulmus americana Populus deltoides
Species Name
Total Number of Dominant Species Across All Strata:
Percent of Dominant Species That Are OBL, FACW, or FAC:
Number of Dominant Species that are OBL, FACW, or FAC: 6
--
* Indicators of hydric soil and wetland hydrology must be present, unless disturbed or problematic.
Woody Vine Stratum (Plot size: 10 meter radius)
Total Cover =
----
--
--
--
Woody plants 3 in. (7.6cm) or more in diameter at breast height (DBH), regardless of height.
Woody plants less than 3 in. DBH and greater than 3.28 ft. tall.
Total Cover =
Northcentral and Northeast Region
WETLAND DETERMINATION DATA FORM

Page 1 of 2
Project/Site: Stantec Project #: 193701660 Date: Applicant: County: Investigator #1: Investigator #2: State: Soil Unit: Wetland ID: Landform: Sample Point: Slope (%): 2 Latitude: -- Longitude: Datum: -- Community ID: Are climatic/hydrologic conditions on the site typical for this time of year? (If no, explain in remarks) Section: 16 Are Vegetation , Soil , or Hydrology significantly disturbed? Township: 36 N Are Vegetation , Soil , or Hydrology naturally problematic? Range: 5 Dir: WSUMMARY OF FINDINGS Hydrophytic Vegetation Present? Yes No Hydric Soils Present? Yes No Wetland Hydrology Present? Yes No Is This Sampling Point Within A Wetland? Yes No
HYDROLOGY
Wetland Hydrology Indicators (Check here if indicators are not present):Primary: Secondary:
A1 - Surface Water B9 - Water-Stained Leaves B6 - Surface Soil CracksA2 - High Water Table B13 - Aquatic Fauna B10 - Drainage PatternsA3 - Saturation B14 - True Aquatic Plants C2 - Dry-Season Water TableB1 - Water Marks C1 - Hydrogen Sulfide Odor C8 - Crayfish BurrowsB2 - Sediment Deposits C3 - Oxidized Rhizospheres on Living Roots C9 - Saturation Visible on Aerial ImageryB3 - Drift Deposits C4 - Presence of Reduced Iron D1 - Stunted or Stressed PlantsB4 - Algal Mat or Crust C6 - Recent Iron Reduction in Tilled Soils D2 - Geomorphic PositionB5 - Iron Deposits C7 - Thin Muck Surface D5 - FAC-Neutral TestB7 - Inundation Visible on Aerial Imagery D9 - Gauge or Well DataB8 - Sparsely Vegetated Concave Surface Other (Explain)
Field Observations: Surface Water Present? Yes No Depth: na (in.) Water Table Present? Yes No Depth: na (in.) Saturation Present? Yes No Depth: na (in.)
SOILS Map Unit Name: Haskins loam Series Drainage Class: somewhat poorly Taxonomy (Subgroup): Aeric Epiaqualfs Field Observations Confirm Mapped Type? Yes No
Top BottomDepth Depth Horizon % % Type Location
0 14 1 10YR 2/2 100 -- -- -- -- --14 20 2 10YR 3/2 100 -- -- -- -- ---- -- -- -- -- -- -- -- -- -- ---- -- -- -- -- -- -- -- -- -- ---- -- -- -- -- -- -- -- -- -- ---- -- -- -- -- -- -- -- -- -- ---- -- -- -- -- -- -- -- -- -- ---- -- -- -- -- -- -- -- -- -- --
NRCS Hydric Soil Field Indicators (check here if indicators are not present):A1- Histosol S4 - Sandy Gleyed Matrix A16 - Coast Prairie Redox A2 - Histic Epipedon S5 - Sandy Redox F12 - Iron-Manganese Masses A3 - Black Histic S6 - Stripped Matrix Other (Explain in Remarks)A4 - Hydrogen Sulfide F1 - Loamy Muck MineralA5 - Stratified Layers F2 - Loamy Gleyed MatrixA10 - 2 cm Muck F3 - Depleted MatrixA11 - Depleted Below Dark Surface F6 - Redox Dark SurfaceA12 - Thick Dark Surface F7 - Depleted Dark SurfaceS1 - Sandy Muck Mineral F8 - Redox DepressionsS3 - 5 cm Mucky Peat or Peat 1 Indicators of hydrophytic vegetation and wetland hydrology must be present, unless disturbed or problematic.
WETLAND DETERMINATION DATA FORMMidwest Region
Indicators for Problematic Soils 1
Yes NoAre normal circumstances present?
Yes No
Wetland Hydrology Present? Yes No
04/25/12
--Haskins loam
Line 6B Phase 2 Replacement Project
NWI/WWI Classification:
Describe Recorded Data (stream gauge, monitoring well, aerial photos, previous inspections), if available:
silty loamColor (Moist)
Restrictive Layer (If Observed)
Remarks:
Type: N/A Depth: N/A Hydric Soil Present?
Profile Description (Describe to the depth needed to document the indicator or confirm the absence of indicators.) (Type: C=Concentration, D=Depletion, RM=Reduced Matrix, CS=Covered/Coated Sand Grains; Locaiton: PL=Pore Lining, M=Matrix)
EnbridgeD. Tersteeg
----
Remarks:
--
silty clay loam--
No
Remarks:
Texture(e.g. clay, sand, loam)
Yes
Matrix
na
slope Local Relief: convex --
--
Color (Moist)Mottles
upland
--
A. BraschPorterIndianaw-490a1u

Page 2 of 2
Project/Site: w-490a 1u
VEGETATION (Species identified in all uppercase are non-native species.) Tree Stratum (Plot size: 10 meter radius)
% Cover Dominant Ind.Status Dominance Test Worksheet1. 10 Y FAC2. 20 Y FACU (A)3. 10 Y FACU4. -- -- -- (B)5. -- -- --6. -- -- -- (A/B)7. -- -- --8. -- -- -- Prevalence Index Worksheet9. -- -- --10. -- -- -- OBL spp. 0 x 1 = 0
40 FACW spp. 5 x 2 = 10
FAC spp. 15 x 3 = 45
FACU spp. 160 x 4 = 640
1. 30 Y FACU UPL spp. 0 x 5 = 0
2. 10 Y FACU3. -- -- -- Total 180 (A) 695 (B)4. -- -- --5. -- -- -- Prevalence Index = B/A = 3.861
6. -- -- --7. -- -- --8. -- -- -- Hydrophytic Vegetation Indicators:9. -- -- -- Yes No Rapid Test for Hydrophytic Vegetation10. -- -- -- Yes No Dominance Test is > 50%
40 Yes No Prevalence Index is ≤ 3.0 *Yes No Morphological Adaptations (Explain) *Yes No Problem Hydrophytic Vegetation (Explain) *
1. 90 Y FACU2. 5 N FACW3. 5 N FAC4. -- -- --5. -- -- --6 -- -- --7. -- -- --8. -- -- --9. -- -- -- Sapling/Shrub -
10. -- -- --11. -- -- --12. -- -- --13. -- -- --14. -- -- --15. -- -- --
100
1. -- -- --2. -- -- --3. -- -- -- Hydrophytic Vegetation Present Yes No5. -- -- --4. -- -- --
0
Additional Remarks:
* Indicators of hydric soil and wetland hydrology must be present, unless disturbed or problematic.
Woody Vine Stratum (Plot size: 10 meter radius)
Total Cover =
----
--
--
Woody plants 3 in. (7.6cm) or more in diameter at breast height (DBH), regardless of height.
Woody plants less than 3 in. DBH and greater than 3.28 ft. tall.
Total Cover =
Midwest Region
WETLAND DETERMINATION DATA FORM
--
Populus tremuloides Fraxinus americana 1
6
Species Name
Total Number of Dominant Species Across All Strata:
Number of Dominant Species that are OBL, FACW, or FAC:
--
--
--
Total Cover =
Acer saccharum
--
--Acer saccharum
Total Cover =
Parthenocissus quinquefolia --
LONICERA TATARICA
Sapling/Shrub Stratum (Plot size: 5 meter radius)
--
Podophyllum peltatum
--
16.7%
--
Percent of Dominant Species That Are OBL, FACW, or FAC:
----
--
Hydrophyllum virginianum
Tree -
Wetland ID:
Definitions of Vegetation Strata:
--
Herb -
Herb Stratum (Plot size: 2 meter radius)
--
All herbaceous (non-woody) plants, regardless of size, and woody plants less than 3 28 ft tall
Multiply by:
Remarks:
Sample PointLine 6B Phase 2 Replacement Project
----
--
--
-- Total % Cover of:
------
--
------
Woody Vines - All woody vines greater than 3.28 ft. in height.
--

Page 1 of 2
Project/Site: Stantec Project #: 193701660 Date: Applicant: County: Investigator #1: Investigator #2: State: Soil Unit: Wetland ID: Landform: Sample Point: Slope (%): 0 Latitude: -- Longitude: Datum: -- Community ID: Are climatic/hydrologic conditions on the site typical for this time of year? (If no, explain in remarks) Section: 16 Are Vegetation , Soil , or Hydrology significantly disturbed? Township: 36 N Are Vegetation , Soil , or Hydrology naturally problematic? Range: 5 Dir: WSUMMARY OF FINDINGS Hydrophytic Vegetation Present? Yes No Hydric Soils Present? Yes No Wetland Hydrology Present? Yes No Is This Sampling Point Within A Wetland? Yes No
HYDROLOGY
Wetland Hydrology Indicators (Check here if indicators are not present):Primary: Secondary:
A1 - Surface Water B9 - Water-Stained Leaves B6 - Surface Soil CracksA2 - High Water Table B13 - Aquatic Fauna B10 - Drainage PatternsA3 - Saturation B14 - True Aquatic Plants C2 - Dry-Season Water TableB1 - Water Marks C1 - Hydrogen Sulfide Odor C8 - Crayfish BurrowsB2 - Sediment Deposits C3 - Oxidized Rhizospheres on Living Roots C9 - Saturation Visible on Aerial ImageryB3 - Drift Deposits C4 - Presence of Reduced Iron D1 - Stunted or Stressed PlantsB4 - Algal Mat or Crust C6 - Recent Iron Reduction in Tilled Soils D2 - Geomorphic PositionB5 - Iron Deposits C7 - Thin Muck Surface D5 - FAC-Neutral TestB7 - Inundation Visible on Aerial Imagery D9 - Gauge or Well DataB8 - Sparsely Vegetated Concave Surface Other (Explain)
Field Observations: Surface Water Present? Yes No Depth: na (in.) Water Table Present? Yes No Depth: 1 (in.) Saturation Present? Yes No Depth: 0 (in.)
SOILS Map Unit Name: Pewamo silty clay loam Series Drainage Class: very poorly Taxonomy (Subgroup): Typic Argiaquolls Field Observations Confirm Mapped Type? Yes No
Top BottomDepth Depth Horizon % % Type Location
0 2 1 gley1 2.5/N 100 -- -- -- -- --2 10 2 gley2 4/N 100 -- -- -- -- --10 18 3 gley3 5/N 100 -- -- -- -- ---- -- -- -- -- -- -- -- -- -- ---- -- -- -- -- -- -- -- -- -- ---- -- -- -- -- -- -- -- -- -- ---- -- -- -- -- -- -- -- -- -- ---- -- -- -- -- -- -- -- -- -- --
NRCS Hydric Soil Field Indicators (check here if indicators are not present):A1- Histosol S4 - Sandy Gleyed Matrix A16 - Coast Prairie Redox A2 - Histic Epipedon S5 - Sandy Redox F12 - Iron-Manganese Masses A3 - Black Histic S6 - Stripped Matrix Other (Explain in Remarks)A4 - Hydrogen Sulfide F1 - Loamy Muck MineralA5 - Stratified Layers F2 - Loamy Gleyed MatrixA10 - 2 cm Muck F3 - Depleted MatrixA11 - Depleted Below Dark Surface F6 - Redox Dark SurfaceA12 - Thick Dark Surface F7 - Depleted Dark SurfaceS1 - Sandy Muck Mineral F8 - Redox DepressionsS3 - 5 cm Mucky Peat or Peat 1 Indicators of hydrophytic vegetation and wetland hydrology must be present, unless disturbed or problematic.
WETLAND DETERMINATION DATA FORMMidwest Region
Indicators for Problematic Soils 1
Yes NoAre normal circumstances present?
Yes No
Wetland Hydrology Present? Yes No
04/25/12
--Pewamo silty clay loam
Line 6B Phase 2 Replacement Project
NWI/WWI Classification:
Describe Recorded Data (stream gauge, monitoring well, aerial photos, previous inspections), if available:
mucky silty loamColor (Moist)
Restrictive Layer (If Observed)
Remarks:
Type: N/A Depth: N/A Hydric Soil Present?
Profile Description (Describe to the depth needed to document the indicator or confirm the absence of indicators.) (Type: C=Concentration, D=Depletion, RM=Reduced Matrix, CS=Covered/Coated Sand Grains; Locaiton: PL=Pore Lining, M=Matrix)
EnbridgeD. Tersteeg
----
Remarks:
--
silty clay loamclay loam
No
Remarks:
Texture(e.g. clay, sand, loam)
Yes
Matrix
na
Type 3, shallow marsh dominated by catttail, phragmites, reed canary grass. Small open water pool in center. Few pockets of sandbar willow.
depression Local Relief: concave --
--
Color (Moist)Mottles
EM1
--
A. BraschPorterIndianaw-490a1w

Page 2 of 2
Project/Site: w-490a 1w
VEGETATION (Species identified in all uppercase are non-native species.) Tree Stratum (Plot size: 10 meter radius)
% Cover Dominant Ind.Status Dominance Test Worksheet1. 10 Y OBL2. 5 Y FACW (A)3. -- -- --4. -- -- -- (B)5. -- -- --6. -- -- -- (A/B)7. -- -- --8. -- -- -- Prevalence Index Worksheet9. -- -- --10. -- -- -- OBL spp. 30 x 1 = 30
15 FACW spp. 85 x 2 = 170
FAC spp. 10 x 3 = 30
FACU spp. 5 x 4 = 20
1. 10 Y FAC UPL spp. 0 x 5 = 0
2. 5 Y FACU3. -- -- -- Total 130 (A) 250 (B)4. -- -- --5. -- -- -- Prevalence Index = B/A = 1.923
6. -- -- --7. -- -- --8. -- -- -- Hydrophytic Vegetation Indicators:9. -- -- -- Yes No Rapid Test for Hydrophytic Vegetation10. -- -- -- Yes No Dominance Test is > 50%
15 Yes No Prevalence Index is ≤ 3.0 *Yes No Morphological Adaptations (Explain) *Yes No Problem Hydrophytic Vegetation (Explain) *
1. 30 Y FACW2. 40 Y FACW3. 10 N FACW4. 20 Y OBL5. -- -- --6 -- -- --7. -- -- --8. -- -- --9. -- -- -- Sapling/Shrub -
10. -- -- --11. -- -- --12. -- -- --13. -- -- --14. -- -- --15. -- -- --
100
1. -- -- --2. -- -- --3. -- -- -- Hydrophytic Vegetation Present Yes No5. -- -- --4. -- -- --
0
Additional Remarks:
* Indicators of hydric soil and wetland hydrology must be present, unless disturbed or problematic.
Woody Vine Stratum (Plot size: 10 meter radius)
Total Cover =
----
--
--
Woody plants 3 in. (7.6cm) or more in diameter at breast height (DBH), regardless of height.
Woody plants less than 3 in. DBH and greater than 3.28 ft. tall.
Total Cover =
Midwest Region
WETLAND DETERMINATION DATA FORM
--
Salix nigra Fraxinus pennsylvanica 6
7
Species Name
Total Number of Dominant Species Across All Strata:
Number of Dominant Species that are OBL, FACW, or FAC:
--
--
--
Total Cover =
Ulmus rubra
--
----
Total Cover =
Impatiens capensis Iris versicolor
ROSA MULTIFLORA
Sapling/Shrub Stratum (Plot size: 5 meter radius)
--
PHALARIS ARUNDINACEA
--
85.7%
--
Percent of Dominant Species That Are OBL, FACW, or FAC:
----
--
Phragmites australis
Tree -
Wetland ID:
Definitions of Vegetation Strata:
--
Herb -
Herb Stratum (Plot size: 2 meter radius)
--
All herbaceous (non-woody) plants, regardless of size, and woody plants less than 3 28 ft tall
Multiply by:
Remarks:
Sample PointLine 6B Phase 2 Replacement Project
----
--
--
-- Total % Cover of:
------
--
------
Woody Vines - All woody vines greater than 3.28 ft. in height.
--

Page 1 of 2
Project/Site: Stantec Project #: 193701660 Date: Applicant: County: Investigator #1: Investigator #2: State: Soil Unit: Wetland ID: Landform: Sample Point: Slope (%): 2 Latitude: -- Longitude: Datum: -- Community ID: Are climatic/hydrologic conditions on the site typical for this time of year? (If no, explain in remarks) Section: 9 Are Vegetation , Soil , or Hydrology significantly disturbed? Township: 36 N Are Vegetation , Soil , or Hydrology naturally problematic? Range: 5 Dir: WSUMMARY OF FINDINGS Hydrophytic Vegetation Present? Yes No Hydric Soils Present? Yes No Wetland Hydrology Present? Yes No Is This Sampling Point Within A Wetland? Yes No
HYDROLOGY
Wetland Hydrology Indicators (Check here if indicators are not present):Primary: Secondary:
A1 - Surface Water B9 - Water-Stained Leaves B6 - Surface Soil CracksA2 - High Water Table B13 - Aquatic Fauna B10 - Drainage PatternsA3 - Saturation B14 - True Aquatic Plants C2 - Dry-Season Water TableB1 - Water Marks C1 - Hydrogen Sulfide Odor C8 - Crayfish BurrowsB2 - Sediment Deposits C3 - Oxidized Rhizospheres on Living Roots C9 - Saturation Visible on Aerial ImageryB3 - Drift Deposits C4 - Presence of Reduced Iron D1 - Stunted or Stressed PlantsB4 - Algal Mat or Crust C6 - Recent Iron Reduction in Tilled Soils D2 - Geomorphic PositionB5 - Iron Deposits C7 - Thin Muck Surface D5 - FAC-Neutral TestB7 - Inundation Visible on Aerial Imagery D9 - Gauge or Well DataB8 - Sparsely Vegetated Concave Surface Other (Explain)
Field Observations: Surface Water Present? Yes No Depth: na (in.) Water Table Present? Yes No Depth: na (in.) Saturation Present? Yes No Depth: na (in.)
SOILS Map Unit Name: Washtenaw silt loam Series Drainage Class: very poorly Taxonomy (Subgroup): Aeric Fluvaquents Field Observations Confirm Mapped Type? Yes No
Top BottomDepth Depth Horizon % % Type Location
0 4 1 10YR 2/2 100 -- -- -- -- --4 18 2 10YR 3/3 100 -- -- -- -- ---- -- -- -- -- -- -- -- -- -- ---- -- -- -- -- -- -- -- -- -- ---- -- -- -- -- -- -- -- -- -- ---- -- -- -- -- -- -- -- -- -- ---- -- -- -- -- -- -- -- -- -- ---- -- -- -- -- -- -- -- -- -- --
NRCS Hydric Soil Field Indicators (check here if indicators are not present ):A1- Histosol S4 - Sandy Gleyed Matrix A16 - Coast Prairie Redox A2 - Histic Epipedon S5 - Sandy Redox F12 - Iron-Manganese Masses A3 - Black Histic S6 - Stripped Matrix Other (Explain in Remarks)A4 - Hydrogen Sulfide F1 - Loamy Muck MineralA5 - Stratified Layers F2 - Loamy Gleyed MatrixA10 - 2 cm Muck F3 - Depleted MatrixA11 - Depleted Below Dark Surface F6 - Redox Dark SurfaceA12 - Thick Dark Surface F7 - Depleted Dark SurfaceS1 - Sandy Muck Mineral F8 - Redox DepressionsS3 - 5 cm Mucky Peat or Peat 1 Indicators of hydrophytic vegetation and wetland hydrology must be present, unless disturbed or problematic.
WETLAND DETERMINATION DATA FORMMidwest Region
Indicators for Problematic Soils 1
Yes NoAre normal circumstances present?
Yes No
Wetland Hydrology Present? Yes No
04/25/12
--Washtenaw silt loam
Line 6B Phase 2 Replacement Project
NWI/WWI Classification:
Describe Recorded Data (stream gauge, monitoring well, aerial photos, previous inspections), if available:
sandy clay loamColor (Moist)
Restrictive Layer (If Observed)
Remarks:
Type: N/A Depth: N/A Hydric Soil Present?
Profile Description (Describe to the depth needed to document the indicator or confirm the absence of indicators.) (Type: C=Concentration, D=Depletion, RM=Reduced Matrix, CS=Covered/Coated Sand Grains; Locaiton: PL=Pore Lining, M=Matrix)
EnbridgeD. Tersteeg
----
Remarks:
--
sandy clay loam--
No
Remarks:
Texture(e.g. clay, sand, loam)
Yes
Matrix
na
shoulder, road Local Relief: none --
--
Color (Moist)Mottles
upland
--
A. BraschPorterIndianaw-491a1u

Page 2 of 2
Project/Site: w-491a 1u
VEGETATION (Species identified in all uppercase are non-native species.) Tree Stratum (Plot size: 10 meter radius)
% Cover Dominant Ind.Status Dominance Test Worksheet1. -- -- --2. -- -- -- (A)3. -- -- --4. -- -- -- (B)5. -- -- --6. -- -- -- (A/B)7. -- -- --8. -- -- -- Prevalence Index Worksheet9. -- -- --10. -- -- -- OBL spp. 0 x 1 = 0
0 FACW spp. 0 x 2 = 0
FAC spp. 90 x 3 = 270
FACU spp. 10 x 4 = 40
1. -- -- -- UPL spp. 0 x 5 = 0
2. -- -- --3. -- -- -- Total 100 (A) 310 (B)4. -- -- --5. -- -- -- Prevalence Index = B/A = 3.100
6. -- -- --7. -- -- --8. -- -- -- Hydrophytic Vegetation Indicators:9. -- -- -- Yes No Rapid Test for Hydrophytic Vegetation10. -- -- -- Yes No Dominance Test is > 50%
0 Yes No Prevalence Index is ≤ 3.0 *Yes No Morphological Adaptations (Explain) *Yes No Problem Hydrophytic Vegetation (Explain) *
1. 90 Y FAC2. 10 N FACU3. -- -- --4. -- -- --5. -- -- --6 -- -- --7. -- -- --8. -- -- --9. -- -- -- Sapling/Shrub -
10. -- -- --11. -- -- --12. -- -- --13. -- -- --14. -- -- --15. -- -- --
100
1. -- -- --2. -- -- --3. -- -- -- Hydrophytic Vegetation Present Yes No5. -- -- --4. -- -- --
0
Additional Remarks:
* Indicators of hydric soil and wetland hydrology must be present, unless disturbed or problematic.
Woody Vine Stratum (Plot size: 10 meter radius)
Total Cover =
----
--
--
Woody plants 3 in. (7.6cm) or more in diameter at breast height (DBH), regardless of height.
Woody plants less than 3 in. DBH and greater than 3.28 ft. tall.
Total Cover =
Midwest Region
WETLAND DETERMINATION DATA FORM
--
---- 1
1
Species Name
Total Number of Dominant Species Across All Strata:
Number of Dominant Species that are OBL, FACW, or FAC:
--
--
--
Total Cover =
--
--
----
Total Cover =
----
--
Sapling/Shrub Stratum (Plot size: 5 meter radius)
--
POA PRATENSIS
--
100.0%
--
Percent of Dominant Species That Are OBL, FACW, or FAC:
----
--
TARAXACUM OFFICINALE
Tree -
Wetland ID:
Definitions of Vegetation Strata:
--
Herb -
Herb Stratum (Plot size: 2 meter radius)
--
All herbaceous (non-woody) plants, regardless of size, and woody plants less than 3 28 ft tall
Multiply by:
Remarks:
Sample PointLine 6B Phase 2 Replacement Project
----
--
--
-- Total % Cover of:
------
--
------
Woody Vines - All woody vines greater than 3.28 ft. in height.
--
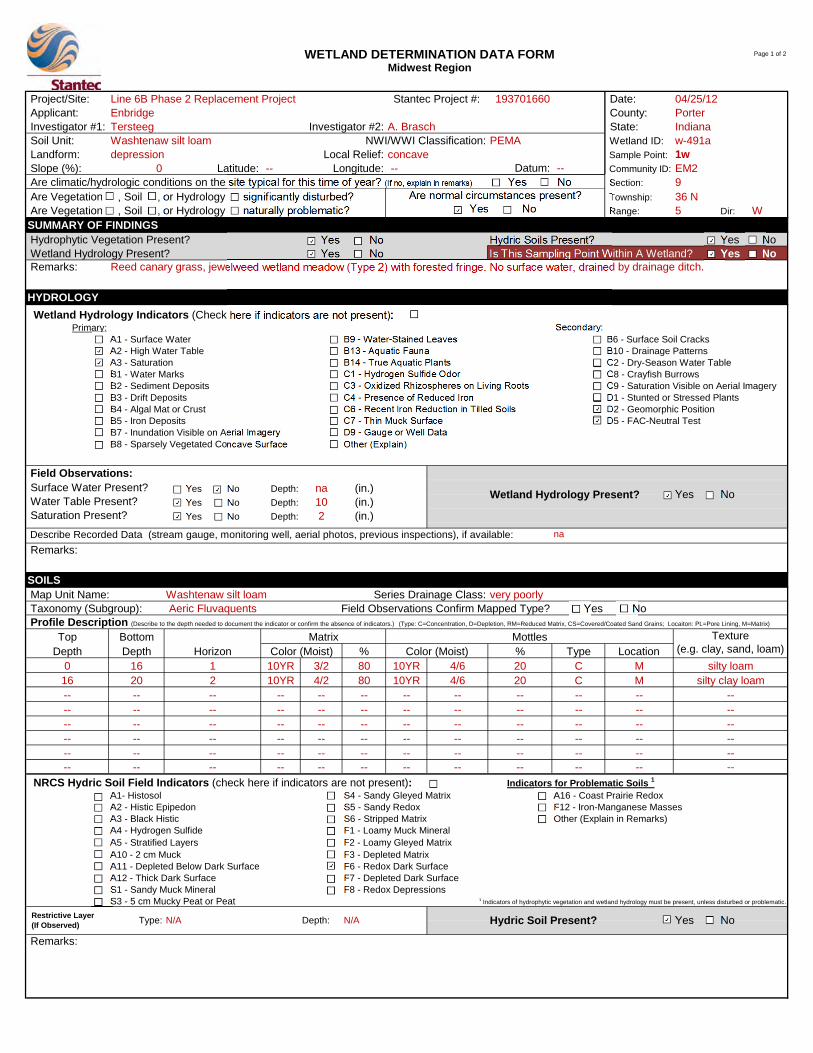
Page 1 of 2
Project/Site: Stantec Project #: 193701660 Date: Applicant: County: Investigator #1: Investigator #2: State: Soil Unit: Wetland ID: Landform: Sample Point: Slope (%): 0 Latitude: -- Longitude: Datum: -- Community ID: Are climatic/hydrologic conditions on the site typical for this time of year? (If no, explain in remarks) Section: 9 Are Vegetation , Soil , or Hydrology significantly disturbed? Township: 36 N Are Vegetation , Soil , or Hydrology naturally problematic? Range: 5 Dir: WSUMMARY OF FINDINGS Hydrophytic Vegetation Present? Yes No Hydric Soils Present? Yes No Wetland Hydrology Present? Yes No Is This Sampling Point Within A Wetland? Yes No
HYDROLOGY
Wetland Hydrology Indicators (Check here if indicators are not present):Primary: Secondary:
A1 - Surface Water B9 - Water-Stained Leaves B6 - Surface Soil CracksA2 - High Water Table B13 - Aquatic Fauna B10 - Drainage PatternsA3 - Saturation B14 - True Aquatic Plants C2 - Dry-Season Water TableB1 - Water Marks C1 - Hydrogen Sulfide Odor C8 - Crayfish BurrowsB2 - Sediment Deposits C3 - Oxidized Rhizospheres on Living Roots C9 - Saturation Visible on Aerial ImageryB3 - Drift Deposits C4 - Presence of Reduced Iron D1 - Stunted or Stressed PlantsB4 - Algal Mat or Crust C6 - Recent Iron Reduction in Tilled Soils D2 - Geomorphic PositionB5 - Iron Deposits C7 - Thin Muck Surface D5 - FAC-Neutral TestB7 - Inundation Visible on Aerial Imagery D9 - Gauge or Well DataB8 - Sparsely Vegetated Concave Surface Other (Explain)
Field Observations: Surface Water Present? Yes No Depth: na (in.) Water Table Present? Yes No Depth: 10 (in.) Saturation Present? Yes No Depth: 2 (in.)
SOILS Map Unit Name: Washtenaw silt loam Series Drainage Class: very poorly Taxonomy (Subgroup): Aeric Fluvaquents Field Observations Confirm Mapped Type? Yes No
Top BottomDepth Depth Horizon % % Type Location
0 16 1 10YR 3/2 80 10YR 4/6 20 C M16 20 2 10YR 4/2 80 10YR 4/6 20 C M-- -- -- -- -- -- -- -- -- -- ---- -- -- -- -- -- -- -- -- -- ---- -- -- -- -- -- -- -- -- -- ---- -- -- -- -- -- -- -- -- -- ---- -- -- -- -- -- -- -- -- -- ---- -- -- -- -- -- -- -- -- -- --
NRCS Hydric Soil Field Indicators (check here if indicators are not present):A1- Histosol S4 - Sandy Gleyed Matrix A16 - Coast Prairie Redox A2 - Histic Epipedon S5 - Sandy Redox F12 - Iron-Manganese Masses A3 - Black Histic S6 - Stripped Matrix Other (Explain in Remarks)A4 - Hydrogen Sulfide F1 - Loamy Muck MineralA5 - Stratified Layers F2 - Loamy Gleyed MatrixA10 - 2 cm Muck F3 - Depleted MatrixA11 - Depleted Below Dark Surface F6 - Redox Dark SurfaceA12 - Thick Dark Surface F7 - Depleted Dark SurfaceS1 - Sandy Muck Mineral F8 - Redox DepressionsS3 - 5 cm Mucky Peat or Peat 1 Indicators of hydrophytic vegetation and wetland hydrology must be present, unless disturbed or problematic.
A. BraschPorterIndianaw-491a1w
na
Reed canary grass, jewelweed wetland meadow (Type 2) with forested fringe. No surface water, drained by drainage ditch.
depression Local Relief: concave --
--
Color (Moist)Mottles
EM2
------
Remarks:
--
silty clay loam--
No
Remarks:
Texture(e.g. clay, sand, loam)
Yes
Matrix
PEMAWashtenaw silt loam
Line 6B Phase 2 Replacement Project
NWI/WWI Classification:
Describe Recorded Data (stream gauge, monitoring well, aerial photos, previous inspections), if available:
silty loamColor (Moist)
Restrictive Layer (If Observed)
Remarks:
Type: N/A Depth: N/A Hydric Soil Present?
Profile Description (Describe to the depth needed to document the indicator or confirm the absence of indicators.) (Type: C=Concentration, D=Depletion, RM=Reduced Matrix, CS=Covered/Coated Sand Grains; Locaiton: PL=Pore Lining, M=Matrix)
EnbridgeTersteeg
WETLAND DETERMINATION DATA FORMMidwest Region
Indicators for Problematic Soils 1
Yes NoAre normal circumstances present?
Yes No
Wetland Hydrology Present? Yes No
04/25/12

Page 2 of 2
Project/Site: w-491a 1w
VEGETATION (Species identified in all uppercase are non-native species.) Tree Stratum (Plot size: 10 meter radius)
% Cover Dominant Ind.Status Dominance Test Worksheet1. 10 Y FACW2. -- -- -- (A)3. -- -- --4. -- -- -- (B)5. -- -- --6. -- -- -- (A/B)7. -- -- --8. -- -- -- Prevalence Index Worksheet9. -- -- --10. -- -- -- OBL spp. 0 x 1 = 0
10 FACW spp. 125 x 2 = 250
FAC spp. 5 x 3 = 15
FACU spp. 20 x 4 = 80
1. 10 Y FACW UPL spp. 0 x 5 = 0
2. 5 Y FACW3. 5 Y FAC Total 150 (A) 345 (B)4. -- -- --5. -- -- -- Prevalence Index = B/A = 2.300
6. -- -- --7. -- -- --8. -- -- -- Hydrophytic Vegetation Indicators:9. -- -- -- Yes No Rapid Test for Hydrophytic Vegetation10. -- -- -- Yes No Dominance Test is > 50%
20 Yes No Prevalence Index is ≤ 3.0 *Yes No Morphological Adaptations (Explain) *Yes No Problem Hydrophytic Vegetation (Explain) *
1. 60 Y FACW2. 40 Y FACW3. 20 Y FACU4. -- -- --5. -- -- --6 -- -- --7. -- -- --8. -- -- --9. -- -- -- Sapling/Shrub -
10. -- -- --11. -- -- --12. -- -- --13. -- -- --14. -- -- --15. -- -- --
120
1. -- -- --2. -- -- --3. -- -- -- Hydrophytic Vegetation Present Yes No5. -- -- --4. -- -- --
0
Additional Remarks:
Remarks:
Sample PointLine 6B Phase 2 Replacement Project
----
--
--
-- Total % Cover of:
------
--
------
Woody Vines - All woody vines greater than 3.28 ft. in height.
--
----
--
PHALARIS ARUNDINACEA
Tree -
Wetland ID:
Definitions of Vegetation Strata:
--
Herb -
Herb Stratum (Plot size: 2 meter radius)
--
All herbaceous (non-woody) plants, regardless of size, and woody plants less than 3 28 ft tall
Multiply by:
85.7%
--
Percent of Dominant Species That Are OBL, FACW, or FAC:
--
--
--
Total Cover =
Lindera benzoin
Ribes cynosbati
----
Total Cover =
Galium aparine--
Sambucus canadensis
Sapling/Shrub Stratum (Plot size: 5 meter radius)
--
Impatiens capensis
--
Acer negundo -- 6
7
Species Name
Total Number of Dominant Species Across All Strata:
Number of Dominant Species that are OBL, FACW, or FAC:
* Indicators of hydric soil and wetland hydrology must be present, unless disturbed or problematic.
Woody Vine Stratum (Plot size: 10 meter radius)
Total Cover =
----
--
--
Woody plants 3 in. (7.6cm) or more in diameter at breast height (DBH), regardless of height.
Woody plants less than 3 in. DBH and greater than 3.28 ft. tall.
Total Cover =
Midwest Region
WETLAND DETERMINATION DATA FORM
--

Page 1 of 2
Project/Site: Stantec Project #: 193701660 Date: Applicant: County: Investigator #1: Investigator #2: State: Soil Unit: Riddles Loam Wetland ID: Landform: Sample Point: Slope (%): 2 Latitude: -- Longitude: Datum: -- Community ID: Are climatic/hydrologic conditions on the site typical for this time of year? (If no, explain in remarks) Section: 10 Are Vegetation , Soil , or Hydrology significantly disturbed? Township: 36 N Are Vegetation , Soil , or Hydrology naturally problematic? Range: 5 Dir: WSUMMARY OF FINDINGS Hydrophytic Vegetation Present? Yes No Hydric Soils Present? Yes No Wetland Hydrology Present? Yes No Is This Sampling Point Within A Wetland? Yes No
HYDROLOGY
Wetland Hydrology Indicators (Check here if indicators are not present):Primary: Secondary:
A1 - Surface Water B9 - Water-Stained Leaves B6 - Surface Soil CracksA2 - High Water Table B13 - Aquatic Fauna B10 - Drainage PatternsA3 - Saturation B14 - True Aquatic Plants C2 - Dry-Season Water TableB1 - Water Marks C1 - Hydrogen Sulfide Odor C8 - Crayfish BurrowsB2 - Sediment Deposits C3 - Oxidized Rhizospheres on Living Roots C9 - Saturation Visible on Aerial ImageryB3 - Drift Deposits C4 - Presence of Reduced Iron D1 - Stunted or Stressed PlantsB4 - Algal Mat or Crust C6 - Recent Iron Reduction in Tilled Soils D2 - Geomorphic PositionB5 - Iron Deposits C7 - Thin Muck Surface D5 - FAC-Neutral TestB7 - Inundation Visible on Aerial Imagery D9 - Gauge or Well DataB8 - Sparsely Vegetated Concave Surface Other (Explain)
Field Observations: Surface Water Present? Yes No Depth: na (in.) Water Table Present? Yes No Depth: na (in.) Saturation Present? Yes No Depth: na (in.)
SOILS Map Unit Name: Riddles Loam Series Drainage Class: well Taxonomy (Subgroup): Typic Hapludalfs Field Observations Confirm Mapped Type? Yes No
Top BottomDepth Depth Horizon % % Type Location
0 6 1 10YR 3/3 100 -- -- -- -- --6 18 2 10YR 4/4 100 -- -- -- -- ---- -- -- -- -- -- -- -- -- -- ---- -- -- -- -- -- -- -- -- -- ---- -- -- -- -- -- -- -- -- -- ---- -- -- -- -- -- -- -- -- -- ---- -- -- -- -- -- -- -- -- -- ---- -- -- -- -- -- -- -- -- -- --
NRCS Hydric Soil Field Indicators (check here if indicators are not present):A1- Histosol S4 - Sandy Gleyed Matrix A16 - Coast Prairie Redox A2 - Histic Epipedon S5 - Sandy Redox F12 - Iron-Manganese Masses A3 - Black Histic S6 - Stripped Matrix Other (Explain in Remarks)A4 - Hydrogen Sulfide F1 - Loamy Muck MineralA5 - Stratified Layers F2 - Loamy Gleyed MatrixA10 - 2 cm Muck F3 - Depleted MatrixA11 - Depleted Below Dark Surface F6 - Redox Dark SurfaceA12 - Thick Dark Surface F7 - Depleted Dark SurfaceS1 - Sandy Muck Mineral F8 - Redox DepressionsS3 - 5 cm Mucky Peat or Peat 1 Indicators of hydrophytic vegetation and wetland hydrology must be present, unless disturbed or problematic.
WETLAND DETERMINATION DATA FORMMidwest Region
Indicators for Problematic Soils 1
Yes NoAre normal circumstances present?
Yes No
Wetland Hydrology Present? Yes No
04/25/12
--
Line 6B Phase 2 Replacement Project
NWI/WWI Classification:
Describe Recorded Data (stream gauge, monitoring well, aerial photos, previous inspections), if available:
sandy loamColor (Moist)
Restrictive Layer (If Observed)
Remarks:
Type: N/A Depth: N/A Hydric Soil Present?
Profile Description (Describe to the depth needed to document the indicator or confirm the absence of indicators.) (Type: C=Concentration, D=Depletion, RM=Reduced Matrix, CS=Covered/Coated Sand Grains; Locaiton: PL=Pore Lining, M=Matrix)
EnbridgeD. Tersteeg
----
Remarks:
--
sandy clay loam--
No
Remarks:
Texture(e.g. clay, sand, loam)
Yes
Matrix
na
slope Local Relief: none --
--
Color (Moist)Mottles
upland
--
A. BraschPorterIndianaw-491b1u

Page 2 of 2
Project/Site: w-491b 1u
VEGETATION (Species identified in all uppercase are non-native species.) Tree Stratum (Plot size: 10 meter radius)
% Cover Dominant Ind.Status Dominance Test Worksheet1. -- -- --2. -- -- -- (A)3. -- -- --4. -- -- -- (B)5. -- -- --6. -- -- -- (A/B)7. -- -- --8. -- -- -- Prevalence Index Worksheet9. -- -- --10. -- -- -- OBL spp. 0 x 1 = 0
0 FACW spp. 25 x 2 = 50
FAC spp. 0 x 3 = 0
FACU spp. 90 x 4 = 360
1. -- -- -- UPL spp. 0 x 5 = 0
2. -- -- --3. -- -- -- Total 115 (A) 410 (B)4. -- -- --5. -- -- -- Prevalence Index = B/A = 3.565
6. -- -- --7. -- -- --8. -- -- -- Hydrophytic Vegetation Indicators:9. -- -- -- Yes No Rapid Test for Hydrophytic Vegetation10. -- -- -- Yes No Dominance Test is > 50%
0 Yes No Prevalence Index is ≤ 3.0 *Yes No Morphological Adaptations (Explain) *Yes No Problem Hydrophytic Vegetation (Explain) *
1. 70 Y FACU2. 20 Y FACU3. 5 N FACW4. 20 Y FACW5. -- -- --6 -- -- --7. -- -- --8. -- -- --9. -- -- -- Sapling/Shrub -
10. -- -- --11. -- -- --12. -- -- --13. -- -- --14. -- -- --15. -- -- --
115
1. -- -- --2. -- -- --3. -- -- -- Hydrophytic Vegetation Present Yes No5. -- -- --4. -- -- --
0
Additional Remarks:
* Indicators of hydric soil and wetland hydrology must be present, unless disturbed or problematic.
Woody Vine Stratum (Plot size: 10 meter radius)
Total Cover =
----
--
--
Woody plants 3 in. (7.6cm) or more in diameter at breast height (DBH), regardless of height.
Woody plants less than 3 in. DBH and greater than 3.28 ft. tall.
Total Cover =
Midwest Region
WETLAND DETERMINATION DATA FORM
--
---- 1
3
Species Name
Total Number of Dominant Species Across All Strata:
Number of Dominant Species that are OBL, FACW, or FAC:
--
--
--
Total Cover =
--
--
----
Total Cover =
Mentha arvensisHeracleum lanatum
--
Sapling/Shrub Stratum (Plot size: 5 meter radius)
--
DACTYLIS GLOMERATA
--
33.3%
--
Percent of Dominant Species That Are OBL, FACW, or FAC:
----
--
TARAXACUM OFFICINALE
Tree -
Wetland ID:
Definitions of Vegetation Strata:
--
Herb -
Herb Stratum (Plot size: 2 meter radius)
--
All herbaceous (non-woody) plants, regardless of size, and woody plants less than 3 28 ft tall
Multiply by:
Remarks:
Sample PointLine 6B Phase 2 Replacement Project
----
--
--
-- Total % Cover of:
------
--
------
Woody Vines - All woody vines greater than 3.28 ft. in height.
--

Page 1 of 2
Project/Site: Stantec Project #: 193701660 Date: Applicant: County: Investigator #1: Investigator #2: State: Soil Unit: Wetland ID: Landform: Sample Point: Slope (%): -- Latitude: -- Longitude: Datum: -- Community ID: Are climatic/hydrologic conditions on the site typical for this time of year? (If no, explain in remarks) Section: 10 Are Vegetation , Soil , or Hydrology significantly disturbed? Township: 36 N Are Vegetation , Soil , or Hydrology naturally problematic? Range: 5 Dir: WSUMMARY OF FINDINGS Hydrophytic Vegetation Present? Yes No Hydric Soils Present? Yes No Wetland Hydrology Present? Yes No Is This Sampling Point Within A Wetland? Yes No
HYDROLOGY
Wetland Hydrology Indicators (Check here if indicators are not present):Primary: Secondary:
A1 - Surface Water B9 - Water-Stained Leaves B6 - Surface Soil CracksA2 - High Water Table B13 - Aquatic Fauna B10 - Drainage PatternsA3 - Saturation B14 - True Aquatic Plants C2 - Dry-Season Water TableB1 - Water Marks C1 - Hydrogen Sulfide Odor C8 - Crayfish BurrowsB2 - Sediment Deposits C3 - Oxidized Rhizospheres on Living Roots C9 - Saturation Visible on Aerial ImageryB3 - Drift Deposits C4 - Presence of Reduced Iron D1 - Stunted or Stressed PlantsB4 - Algal Mat or Crust C6 - Recent Iron Reduction in Tilled Soils D2 - Geomorphic PositionB5 - Iron Deposits C7 - Thin Muck Surface D5 - FAC-Neutral TestB7 - Inundation Visible on Aerial Imagery D9 - Gauge or Well DataB8 - Sparsely Vegetated Concave Surface Other (Explain)
Field Observations: Surface Water Present? Yes No Depth: n/a (in.) Water Table Present? Yes No Depth: 12 (in.) Saturation Present? Yes No Depth: 2 (in.)
SOILS Map Unit Name: Washtenaw silt loam Series Drainage Class: poorly Taxonomy (Subgroup): Aeric Fluvaquents Field Observations Confirm Mapped Type? Yes No
Top BottomDepth Depth Horizon % % Type Location
0 2 1 10YR 3/1 90 10YR 3/6 10 C M / PL2 14 2 10YR 4/2 80 10YR 4/6 20 C M / PL14 18 3 10YR 4/2 70 10YR 4/6 30 C M-- -- -- -- -- -- -- -- -- -- ---- -- -- -- -- -- -- -- -- -- ---- -- -- -- -- -- -- -- -- -- ---- -- -- -- -- -- -- -- -- -- ---- -- -- -- -- -- -- -- -- -- --
NRCS Hydric Soil Field Indicators (check here if indicators are not present):A1- Histosol S4 - Sandy Gleyed Matrix A16 - Coast Prairie Redox A2 - Histic Epipedon S5 - Sandy Redox F12 - Iron-Manganese Masses A3 - Black Histic S6 - Stripped Matrix Other (Explain in Remarks)A4 - Hydrogen Sulfide F1 - Loamy Muck MineralA5 - Stratified Layers F2 - Loamy Gleyed MatrixA10 - 2 cm Muck F3 - Depleted MatrixA11 - Depleted Below Dark Surface F6 - Redox Dark SurfaceA12 - Thick Dark Surface F7 - Depleted Dark SurfaceS1 - Sandy Muck Mineral F8 - Redox DepressionsS3 - 5 cm Mucky Peat or Peat 1 Indicators of hydrophytic vegetation and wetland hydrology must be present, unless disturbed or problematic.
WETLAND DETERMINATION DATA FORMMidwest Region
Indicators for Problematic Soils 1
Yes NoAre normal circumstances present?
Yes No
Wetland Hydrology Present? Yes No
04/25/12
--Washtenaw silt loam
Line 6B Phase 2 Replacement Project
NWI/WWI Classification:
Describe Recorded Data (stream gauge, monitoring well, aerial photos, previous inspections), if available:
silt loamColor (Moist)
Restrictive Layer (If Observed)
Remarks:
Type: N/A Depth: N/A Hydric Soil Present?
Profile Description (Describe to the depth needed to document the indicator or confirm the absence of indicators.) (Type: C=Concentration, D=Depletion, RM=Reduced Matrix, CS=Covered/Coated Sand Grains; Locaiton: PL=Pore Lining, M=Matrix)
EnbridgeD. Tersteeg
----
Remarks: --
--
silt loamsilty clay loam
No
-- Remarks:
Texture(e.g. clay, sand, loam)
Yes
Matrix
n/a
Type 3 shallow marsh dominated by invasive common reed and reed canary grass, and cattail. Line of sandbar & black willow shrubs along road edge.
depression Local Relief: concave --
--
Color (Moist)Mottles
EM1
--
A. BraschPorterIndianaW-491b1w

Page 2 of 2
Project/Site: W-491b 1w
VEGETATION (Species identified in all uppercase are non-native species.) Tree Stratum (Plot size: 10 meter radius)
% Cover Dominant Ind.Status Dominance Test Worksheet1. -- -- --2. -- -- -- (A)3. -- -- --4. -- -- -- (B)5. -- -- --6. -- -- -- (A/B)7. -- -- --8. -- -- -- Prevalence Index Worksheet9. -- -- --10. -- -- -- OBL spp. 75 x 1 = 75
0 FACW spp. 30 x 2 = 60
FAC spp. 0 x 3 = 0
FACU spp. 0 x 4 = 0
1. -- -- -- UPL spp. 0 x 5 = 0
2. -- -- --3. -- -- -- Total 105 (A) 135 (B)4. -- -- --5. -- -- -- Prevalence Index = B/A = 1.286
6. -- -- --7. -- -- --8. -- -- -- Hydrophytic Vegetation Indicators:9. -- -- -- Yes No Rapid Test for Hydrophytic Vegetation10. -- -- -- Yes No Dominance Test is > 50%
0 Yes No Prevalence Index is ≤ 3.0 *Yes No Morphological Adaptations (Explain) *Yes No Problem Hydrophytic Vegetation (Explain) *
1. 70 Y OBL2. 20 N FACW3. 10 N FACW4. 5 N OBL5. -- -- --6 -- -- --7. -- -- --8. -- -- --9. -- -- -- Sapling/Shrub -
10. -- -- --11. -- -- --12. -- -- --13. -- -- --14. -- -- --15. -- -- --
105
1. -- -- --2. -- -- --3. -- -- -- Hydrophytic Vegetation Present Yes No5. -- -- --4. -- -- --
0
Additional Remarks:--
* Indicators of hydric soil and wetland hydrology must be present, unless disturbed or problematic.
Woody Vine Stratum (Plot size: 10 meter radius)
Total Cover =
----
--
--
--
Woody plants 3 in. (7.6cm) or more in diameter at breast height (DBH), regardless of height.
Woody plants less than 3 in. DBH and greater than 3.28 ft. tall.
Total Cover =
Midwest Region
WETLAND DETERMINATION DATA FORM
--
---- 1
1
Species Name
Total Number of Dominant Species Across All Strata:
Number of Dominant Species that are OBL, FACW, or FAC:
--
--
--
Total Cover =
--
--
----
Total Cover =
PHALARIS ARUNDINACEAAlisma subcordatum
--
Sapling/Shrub Stratum (Plot size: 5 meter radius)
--
TYPHA ANGUSTIFOLIA
--
100.0%
--
Percent of Dominant Species That Are OBL, FACW, or FAC:
----
--
Phragmites australis
Tree -
Wetland ID:
Definitions of Vegetation Strata:
--
Herb -
Herb Stratum (Plot size: 2 meter radius)
--
All herbaceous (non-woody) plants, regardless of size, and woody plants less than 3 28 ft tall
Multiply by:
Remarks:
Sample PointLine 6B Phase 2 Replacement Project
----
--
--
-- Total % Cover of:
------
--
------
Woody Vines - All woody vines greater than 3.28 ft. in height.
--
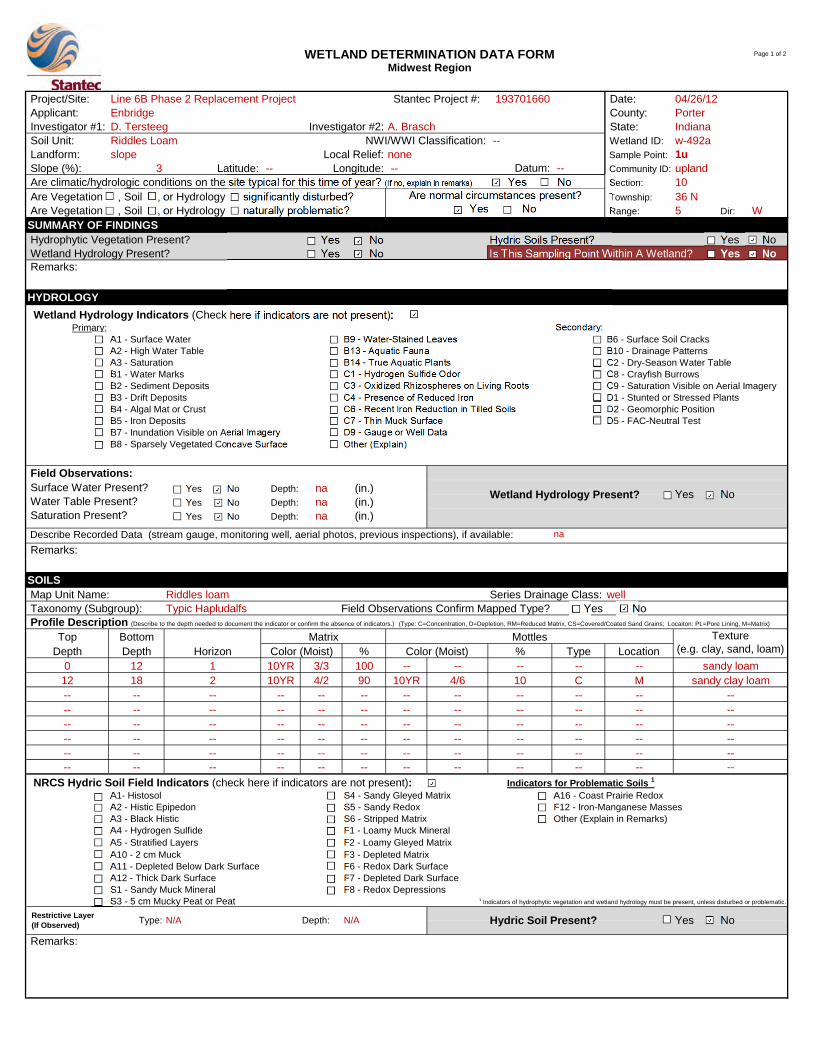
Page 1 of 2
Project/Site: Stantec Project #: 193701660 Date: Applicant: County: Investigator #1: Investigator #2: State: Soil Unit: Wetland ID: Landform: Sample Point: Slope (%): 3 Latitude: -- Longitude: Datum: -- Community ID: Are climatic/hydrologic conditions on the site typical for this time of year? (If no, explain in remarks) Section: 10 Are Vegetation , Soil , or Hydrology significantly disturbed? Township: 36 N Are Vegetation , Soil , or Hydrology naturally problematic? Range: 5 Dir: WSUMMARY OF FINDINGS Hydrophytic Vegetation Present? Yes No Hydric Soils Present? Yes No Wetland Hydrology Present? Yes No Is This Sampling Point Within A Wetland? Yes No
HYDROLOGY
Wetland Hydrology Indicators (Check here if indicators are not present):Primary: Secondary:
A1 - Surface Water B9 - Water-Stained Leaves B6 - Surface Soil CracksA2 - High Water Table B13 - Aquatic Fauna B10 - Drainage PatternsA3 - Saturation B14 - True Aquatic Plants C2 - Dry-Season Water TableB1 - Water Marks C1 - Hydrogen Sulfide Odor C8 - Crayfish BurrowsB2 - Sediment Deposits C3 - Oxidized Rhizospheres on Living Roots C9 - Saturation Visible on Aerial ImageryB3 - Drift Deposits C4 - Presence of Reduced Iron D1 - Stunted or Stressed PlantsB4 - Algal Mat or Crust C6 - Recent Iron Reduction in Tilled Soils D2 - Geomorphic PositionB5 - Iron Deposits C7 - Thin Muck Surface D5 - FAC-Neutral TestB7 - Inundation Visible on Aerial Imagery D9 - Gauge or Well DataB8 - Sparsely Vegetated Concave Surface Other (Explain)
Field Observations: Surface Water Present? Yes No Depth: na (in.) Water Table Present? Yes No Depth: na (in.) Saturation Present? Yes No Depth: na (in.)
SOILS Map Unit Name: Riddles loam Series Drainage Class: well Taxonomy (Subgroup): Typic Hapludalfs Field Observations Confirm Mapped Type? Yes No
Top BottomDepth Depth Horizon % % Type Location
0 12 1 10YR 3/3 100 -- -- -- -- --12 18 2 10YR 4/2 90 10YR 4/6 10 C M-- -- -- -- -- -- -- -- -- -- ---- -- -- -- -- -- -- -- -- -- ---- -- -- -- -- -- -- -- -- -- ---- -- -- -- -- -- -- -- -- -- ---- -- -- -- -- -- -- -- -- -- ---- -- -- -- -- -- -- -- -- -- --
NRCS Hydric Soil Field Indicators (check here if indicators are not present): A1- Histosol S4 - Sandy Gleyed Matrix A16 - Coast Prairie Redox A2 - Histic Epipedon S5 - Sandy Redox F12 - Iron-Manganese Masses A3 - Black Histic S6 - Stripped Matrix Other (Explain in Remarks)A4 - Hydrogen Sulfide F1 - Loamy Muck MineralA5 - Stratified Layers F2 - Loamy Gleyed MatrixA10 - 2 cm Muck F3 - Depleted MatrixA11 - Depleted Below Dark Surface F6 - Redox Dark SurfaceA12 - Thick Dark Surface F7 - Depleted Dark SurfaceS1 - Sandy Muck Mineral F8 - Redox DepressionsS3 - 5 cm Mucky Peat or Peat 1 Indicators of hydrophytic vegetation and wetland hydrology must be present, unless disturbed or problematic.
A. BraschPorterIndianaw-492a1u
na
slope Local Relief: none --
--
Color (Moist)Mottles
upland
------
Remarks:
--
sandy clay loam--
No
Remarks:
Texture(e.g. clay, sand, loam)
Yes
Matrix
--Riddles Loam
Line 6B Phase 2 Replacement Project
NWI/WWI Classification:
Describe Recorded Data (stream gauge, monitoring well, aerial photos, previous inspections), if available:
sandy loamColor (Moist)
Restrictive Layer (If Observed)
Remarks:
Type: N/A Depth: N/A Hydric Soil Present?
Profile Description (Describe to the depth needed to document the indicator or confirm the absence of indicators.) (Type: C=Concentration, D=Depletion, RM=Reduced Matrix, CS=Covered/Coated Sand Grains; Locaiton: PL=Pore Lining, M=Matrix)
EnbridgeD. Tersteeg
WETLAND DETERMINATION DATA FORMMidwest Region
Indicators for Problematic Soils 1
Yes NoAre normal circumstances present?
Yes No
Wetland Hydrology Present? Yes No
04/26/12

Page 2 of 2
Project/Site: w-492a 1u
VEGETATION (Species identified in all uppercase are non-native species.) Tree Stratum (Plot size: 10 meter radius)
% Cover N Ind.Status Dominance Test Worksheet1. 70 Y FACU2. 10 N FACU (A)3. 10 N FACW4. -- -- -- (B)5. -- -- --6. -- -- -- (A/B)7. -- -- --8. -- -- -- Prevalence Index Worksheet9. -- -- --10. -- -- -- OBL spp. 0 x 1 = 0
90 FACW spp. 15 x 2 = 30
FAC spp. 10 x 3 = 30
FACU spp. 135 x 4 = 540
1. 10 Y FACU UPL spp. 0 x 5 = 0
2. -- -- --3. -- -- -- Total 160 (A) 600 (B)4. -- -- --5. -- -- -- Prevalence Index = B/A = 3.750
6. -- -- --7. -- -- --8. -- -- -- Hydrophytic Vegetation Indicators:9. -- -- -- Yes No Rapid Test for Hydrophytic Vegetation10. -- -- -- Yes No Dominance Test is > 50%
10 Yes No Prevalence Index is ≤ 3.0 *Yes No Morphological Adaptations (Explain) *Yes No Problem Hydrophytic Vegetation (Explain) *
1. 5 N FACW2. 5 N FACU3. 10 Y FACU4. 20 Y FACU5. 5 N FAC6 10 Y FACU7. 5 N FAC8. -- -- --9. -- -- -- Sapling/Shrub -
10. -- -- --11. -- -- --12. -- -- --13. -- -- --14. -- -- --15. -- -- --
60
1. -- -- --2. -- -- --3. -- -- -- Hydrophytic Vegetation Present Yes No5. -- -- --4. -- -- --
0
Additional Remarks:
Remarks:
Sample PointLine 6B Phase 2 Replacement Project
----
--
--
-- Total % Cover of:
------
--
------
Woody Vines - All woody vines greater than 3.28 ft. in height.
--
----
--
Cardamine concatenata
Tree -
Wetland ID:
Definitions of Vegetation Strata:
--
Herb -
Herb Stratum (Plot size: 2 meter radius)
--
All herbaceous (non-woody) plants, regardless of size, and woody plants less than 3 28 ft tall
Multiply by:
0.0%
--
Percent of Dominant Species That Are OBL, FACW, or FAC:
Toxicodendron radicans subsp. negund
--
TARAXACUM OFFICINALE
Total Cover =
ROSA MULTIFLORA
--
--Quercus bicolor
Total Cover =
Solidago canadensis Acer saccharum
--
10
--
Cyperus esculentus
--
Acer saccharumQuercus velutina 0
5
Species Name
Total Number of Dominant Species Across All Strata:
Number of Dominant Species that are OBL, FACW, or FAC:
* Indicators of hydric soil and wetland hydrology must be present, unless disturbed or problematic.
Woody Vine Stratum (Plot size: 10 meter radius)
Total Cover =
----
--
--
Woody plants 3 in. (7.6cm) or more in diameter at breast height (DBH), regardless of height.
Woody plants less than 3 in. DBH and greater than 3.28 ft. tall.
Total Cover =
Midwest Region
WETLAND DETERMINATION DATA FORM
Viola sororia

Page 1 of 2
Project/Site: Stantec Project #: 193701660 Date: Applicant: County: Investigator #1: Investigator #2: State: Soil Unit: Wetland ID: Landform: Sample Point: Slope (%): 0 Latitude: -- Longitude: Datum: -- Community ID: Are climatic/hydrologic conditions on the site typical for this time of year? (If no, explain in remarks) Section: 10 Are Vegetation , Soil , or Hydrology significantly disturbed? Township: 36 N Are Vegetation , Soil , or Hydrology naturally problematic? Range: 5 Dir: WSUMMARY OF FINDINGS Hydrophytic Vegetation Present? Yes No Hydric Soils Present? Yes No Wetland Hydrology Present? Yes No Is This Sampling Point Within A Wetland? Yes No
HYDROLOGY
Wetland Hydrology Indicators (Check here if indicators are not present):Primary: Secondary:
A1 - Surface Water B9 - Water-Stained Leaves B6 - Surface Soil CracksA2 - High Water Table B13 - Aquatic Fauna B10 - Drainage PatternsA3 - Saturation B14 - True Aquatic Plants C2 - Dry-Season Water TableB1 - Water Marks C1 - Hydrogen Sulfide Odor C8 - Crayfish BurrowsB2 - Sediment Deposits C3 - Oxidized Rhizospheres on Living Roots C9 - Saturation Visible on Aerial ImageryB3 - Drift Deposits C4 - Presence of Reduced Iron D1 - Stunted or Stressed PlantsB4 - Algal Mat or Crust C6 - Recent Iron Reduction in Tilled Soils D2 - Geomorphic PositionB5 - Iron Deposits C7 - Thin Muck Surface D5 - FAC-Neutral TestB7 - Inundation Visible on Aerial Imagery D9 - Gauge or Well DataB8 - Sparsely Vegetated Concave Surface Other (Explain)
Field Observations: Surface Water Present? Yes No Depth: 1 (in.) Water Table Present? Yes No Depth: 0 (in.) Saturation Present? Yes No Depth: 0 (in.)
SOILS Map Unit Name: Riddles loam Series Drainage Class: well Taxonomy (Subgroup): Typic Hapludalfs Field Observations Confirm Mapped Type? Yes No
Top BottomDepth Depth Horizon % % Type Location
0 10 1 gley1 2.5/N 100 -- -- -- -- --10 18 2 gley1 4/N 100 -- -- -- -- ---- -- -- -- -- -- -- -- -- -- ---- -- -- -- -- -- -- -- -- -- ---- -- -- -- -- -- -- -- -- -- ---- -- -- -- -- -- -- -- -- -- ---- -- -- -- -- -- -- -- -- -- ---- -- -- -- -- -- -- -- -- -- --
NRCS Hydric Soil Field Indicators (check here if indicators are not present):A1- Histosol S4 - Sandy Gleyed Matrix A16 - Coast Prairie Redox A2 - Histic Epipedon S5 - Sandy Redox F12 - Iron-Manganese Masses A3 - Black Histic S6 - Stripped Matrix Other (Explain in Remarks)A4 - Hydrogen Sulfide F1 - Loamy Muck MineralA5 - Stratified Layers F2 - Loamy Gleyed MatrixA10 - 2 cm Muck F3 - Depleted MatrixA11 - Depleted Below Dark Surface F6 - Redox Dark SurfaceA12 - Thick Dark Surface F7 - Depleted Dark SurfaceS1 - Sandy Muck Mineral F8 - Redox DepressionsS3 - 5 cm Mucky Peat or Peat 1 Indicators of hydrophytic vegetation and wetland hydrology must be present, unless disturbed or problematic.
A. BraschPorterIndianaw-492a1w
na
Type 3/7, shallow marsh dominated by lake sedge, cattail, phragmites, skunk cabbage. Pockets of spicebush, buttonbush, and forested fringe of green ash, black willow.
depression Local Relief: concave --
--
Color (Moist)Mottles
EM1
------
Remarks:
--
silty loam--
No
Remarks:
Texture(e.g. clay, sand, loam)
Yes
Matrix
PEMARiddles loam
Line 6B Phase 2 Replacement Project
NWI/WWI Classification:
Describe Recorded Data (stream gauge, monitoring well, aerial photos, previous inspections), if available:
mucky silty loamColor (Moist)
Restrictive Layer (If Observed)
Remarks:
Type: N/A Depth: N/A Hydric Soil Present?
Profile Description (Describe to the depth needed to document the indicator or confirm the absence of indicators.) (Type: C=Concentration, D=Depletion, RM=Reduced Matrix, CS=Covered/Coated Sand Grains; Locaiton: PL=Pore Lining, M=Matrix)
EnbridgeD. Tersteeg
WETLAND DETERMINATION DATA FORMMidwest Region
Indicators for Problematic Soils 1
Yes NoAre normal circumstances present?
Yes No
Wetland Hydrology Present? Yes No
04/26/12

Page 2 of 2
Project/Site: w-492a 1w
VEGETATION (Species identified in all uppercase are non-native species.) Tree Stratum (Plot size: 10 meter radius)
% Cover Dominant Ind.Status Dominance Test Worksheet1. 20 Y FACU2. -- -- -- (A)3. -- -- --4. -- -- -- (B)5. -- -- --6. -- -- -- (A/B)7. -- -- --8. -- -- -- Prevalence Index Worksheet9. -- -- --10. -- -- -- OBL spp. 45 x 1 = 45
20 FACW spp. 85 x 2 = 170
FAC spp. 0 x 3 = 0
FACU spp. 20 x 4 = 80
1. 20 Y FACW UPL spp. 0 x 5 = 0
2. 5 Y OBL3. -- -- -- Total 150 (A) 295 (B)4. -- -- --5. -- -- -- Prevalence Index = B/A = 1.967
6. -- -- --7. -- -- --8. -- -- -- Hydrophytic Vegetation Indicators:9. -- -- -- Yes No Rapid Test for Hydrophytic Vegetation10. -- -- -- Yes No Dominance Test is > 50%
25 Yes No Prevalence Index is ≤ 3.0 *Yes No Morphological Adaptations (Explain) *Yes No Problem Hydrophytic Vegetation (Explain) *
1. 60 Y FACW2. 40 Y OBL3. 5 N FACW4. -- -- --5. -- -- --6 -- -- --7. -- -- --8. -- -- --9. -- -- -- Sapling/Shrub -
10. -- -- --11. -- -- --12. -- -- --13. -- -- --14. -- -- --15. -- -- --
105
1. -- -- --2. -- -- --3. -- -- -- Hydrophytic Vegetation Present Yes No5. -- -- --4. -- -- --
0
Additional Remarks:
Remarks:
Sample PointLine 6B Phase 2 Replacement Project
----
--
--
-- Total % Cover of:
------
--
------
Woody Vines - All woody vines greater than 3.28 ft. in height.
--
----
--
Symplocarpus foetidus
Tree -
Wetland ID:
Definitions of Vegetation Strata:
--
Herb -
Herb Stratum (Plot size: 2 meter radius)
--
All herbaceous (non-woody) plants, regardless of size, and woody plants less than 3 28 ft tall
Multiply by:
80.0%
--
Percent of Dominant Species That Are OBL, FACW, or FAC:
--
--
--
Total Cover =
Lindera benzoin
--
----
Total Cover =
Carex tribuloides--
Cephalanthus occidentalis
Sapling/Shrub Stratum (Plot size: 5 meter radius)
--
Impatiens capensis
--
Acer saccharum-- 4
5
Species Name
Total Number of Dominant Species Across All Strata:
Number of Dominant Species that are OBL, FACW, or FAC:
* Indicators of hydric soil and wetland hydrology must be present, unless disturbed or problematic.
Woody Vine Stratum (Plot size: 10 meter radius)
Total Cover =
----
--
--
Woody plants 3 in. (7.6cm) or more in diameter at breast height (DBH), regardless of height.
Woody plants less than 3 in. DBH and greater than 3.28 ft. tall.
Total Cover =
Midwest Region
WETLAND DETERMINATION DATA FORM
--

Page 1 of 2
Project/Site: Stantec Project #: 193701660 Date: Applicant: County: Investigator #1: Investigator #2: State: Soil Unit: Wetland ID: Landform: Sample Point: Slope (%): 2 Latitude: -- Longitude: Datum: -- Community ID: Are climatic/hydrologic conditions on the site typical for this time of year? (If no, explain in remarks) Section: 10 Are Vegetation , Soil , or Hydrology significantly disturbed? Township: 36 N Are Vegetation , Soil , or Hydrology naturally problematic? Range: 5 Dir: WSUMMARY OF FINDINGS Hydrophytic Vegetation Present? Yes No Hydric Soils Present? Yes No Wetland Hydrology Present? Yes No Is This Sampling Point Within A Wetland? Yes No
HYDROLOGY
Wetland Hydrology Indicators (Check here if indicators are not present):Primary: Secondary:
A1 - Surface Water B9 - Water-Stained Leaves B6 - Surface Soil CracksA2 - High Water Table B13 - Aquatic Fauna B10 - Drainage PatternsA3 - Saturation B14 - True Aquatic Plants C2 - Dry-Season Water TableB1 - Water Marks C1 - Hydrogen Sulfide Odor C8 - Crayfish BurrowsB2 - Sediment Deposits C3 - Oxidized Rhizospheres on Living Roots C9 - Saturation Visible on Aerial ImageryB3 - Drift Deposits C4 - Presence of Reduced Iron D1 - Stunted or Stressed PlantsB4 - Algal Mat or Crust C6 - Recent Iron Reduction in Tilled Soils D2 - Geomorphic PositionB5 - Iron Deposits C7 - Thin Muck Surface D5 - FAC-Neutral TestB7 - Inundation Visible on Aerial Imagery D9 - Gauge or Well DataB8 - Sparsely Vegetated Concave Surface Other (Explain)
Field Observations: Surface Water Present? Yes No Depth: na (in.) Water Table Present? Yes No Depth: na (in.) Saturation Present? Yes No Depth: na (in.)
SOILS Map Unit Name: Warners silt loam Series Drainage Class: very poorly Taxonomy (Subgroup): Fluvaquentic Endoaquolls Field Observations Confirm Mapped Type? Yes No
Top BottomDepth Depth Horizon % % Type Location
0 14 1 10YR 2/2 100 -- -- -- -- --14 18 2 10YR 3/2 90 10YR 3/6 10 C M-- -- -- -- -- -- -- -- -- -- ---- -- -- -- -- -- -- -- -- -- ---- -- -- -- -- -- -- -- -- -- ---- -- -- -- -- -- -- -- -- -- ---- -- -- -- -- -- -- -- -- -- ---- -- -- -- -- -- -- -- -- -- --
NRCS Hydric Soil Field Indicators (check here if indicators are not present):A1- Histosol S4 - Sandy Gleyed Matrix A16 - Coast Prairie Redox A2 - Histic Epipedon S5 - Sandy Redox F12 - Iron-Manganese Masses A3 - Black Histic S6 - Stripped Matrix Other (Explain in Remarks)A4 - Hydrogen Sulfide F1 - Loamy Muck MineralA5 - Stratified Layers F2 - Loamy Gleyed MatrixA10 - 2 cm Muck F3 - Depleted MatrixA11 - Depleted Below Dark Surface F6 - Redox Dark SurfaceA12 - Thick Dark Surface F7 - Depleted Dark SurfaceS1 - Sandy Muck Mineral F8 - Redox DepressionsS3 - 5 cm Mucky Peat or Peat 1 Indicators of hydrophytic vegetation and wetland hydrology must be present, unless disturbed or problematic.
A. BraschPorterIndianaw-492a2u
na
slope Local Relief: none --
--
Color (Moist)Mottles
upland
------
Remarks:
--
clay loam--
No
Remarks:
Texture(e.g. clay, sand, loam)
Yes
Matrix
--Warners silt loam
Line 6B Phase 2 Replacement Project
NWI/WWI Classification:
Describe Recorded Data (stream gauge, monitoring well, aerial photos, previous inspections), if available:
silt clay loamColor (Moist)
Restrictive Layer (If Observed)
Remarks:
Type: N/A Depth: N/A Hydric Soil Present?
Profile Description (Describe to the depth needed to document the indicator or confirm the absence of indicators.) (Type: C=Concentration, D=Depletion, RM=Reduced Matrix, CS=Covered/Coated Sand Grains; Locaiton: PL=Pore Lining, M=Matrix)
EnbridgeD. Tersteeg
WETLAND DETERMINATION DATA FORMMidwest Region
Indicators for Problematic Soils 1
Yes NoAre normal circumstances present?
Yes No
Wetland Hydrology Present? Yes No
04/26/12

Page 2 of 2
Project/Site: w-492a 2u
VEGETATION (Species identified in all uppercase are non-native species.) Tree Stratum (Plot size: 10 meter radius)
% Cover Dominant Ind.Status Dominance Test Worksheet1. 30 Y FACW2. 10 Y FACU (A)3. 5 N FACU4. -- -- -- (B)5. -- -- --6. -- -- -- (A/B)7. -- -- --8. -- -- -- Prevalence Index Worksheet9. -- -- --10. -- -- -- OBL spp. 0 x 1 = 0
45 FACW spp. 40 x 2 = 80
FAC spp. 15 x 3 = 45
FACU spp. 45 x 4 = 180
1. -- -- -- UPL spp. 0 x 5 = 0
2. -- -- --3. -- -- -- Total 100 (A) 305 (B)4. -- -- --5. -- -- -- Prevalence Index = B/A = 3.050
6. -- -- --7. -- -- --8. -- -- -- Hydrophytic Vegetation Indicators:9. -- -- -- Yes No Rapid Test for Hydrophytic Vegetation10. -- -- -- Yes No Dominance Test is > 50%
0 Yes No Prevalence Index is ≤ 3.0 *Yes No Morphological Adaptations (Explain) *Yes No Problem Hydrophytic Vegetation (Explain) *
1. 20 Y FACU2. 10 Y FACU3. 10 Y FACW4. 15 Y FAC5. -- -- --6 -- -- --7. -- -- --8. -- -- --9. -- -- -- Sapling/Shrub -
10. -- -- --11. -- -- --12. -- -- --13. -- -- --14. -- -- --15. -- -- --
55
1. -- -- --2. -- -- --3. -- -- -- Hydrophytic Vegetation Present Yes No5. -- -- --4. -- -- --
0
Additional Remarks:
Remarks:
Sample PointLine 6B Phase 2 Replacement Project
----
--
--
-- Total % Cover of:
------
--
------
Woody Vines - All woody vines greater than 3.28 ft. in height.
--
----
--
Smilacina racemosa
Tree -
Wetland ID:
Definitions of Vegetation Strata:
--
Herb -
Herb Stratum (Plot size: 2 meter radius)
--
All herbaceous (non-woody) plants, regardless of size, and woody plants less than 3 28 ft tall
Multiply by:
50.0%
--
Percent of Dominant Species That Are OBL, FACW, or FAC:
--
--
--
Total Cover =
--
--
--Prunus serotina
Total Cover =
Cyperus esculentusViola sororia
--
Sapling/Shrub Stratum (Plot size: 5 meter radius)
--
Allium canadense
--
Ulmus americana Quercus velutina 3
6
Species Name
Total Number of Dominant Species Across All Strata:
Number of Dominant Species that are OBL, FACW, or FAC:
* Indicators of hydric soil and wetland hydrology must be present, unless disturbed or problematic.
Woody Vine Stratum (Plot size: 10 meter radius)
Total Cover =
----
--
--
Woody plants 3 in. (7.6cm) or more in diameter at breast height (DBH), regardless of height.
Woody plants less than 3 in. DBH and greater than 3.28 ft. tall.
Total Cover =
Midwest Region
WETLAND DETERMINATION DATA FORM
--

Page 1 of 2
Project/Site: Stantec Project #: 193701660 Date: Applicant: County: Investigator #1: Investigator #2: State: Soil Unit: Wetland ID: Landform: Sample Point: Slope (%): 2 Latitude: -- Longitude: Datum: -- Community ID: Are climatic/hydrologic conditions on the site typical for this time of year? (If no, explain in remarks) Section: 10 Are Vegetation , Soil , or Hydrology significantly disturbed? Township: 36 N Are Vegetation , Soil , or Hydrology naturally problematic? Range: 5 Dir: WSUMMARY OF FINDINGS Hydrophytic Vegetation Present? Yes No Hydric Soils Present? Yes No Wetland Hydrology Present? Yes No Is This Sampling Point Within A Wetland? Yes No
HYDROLOGY
Wetland Hydrology Indicators (Check here if indicators are not present):Primary: Secondary:
A1 - Surface Water B9 - Water-Stained Leaves B6 - Surface Soil CracksA2 - High Water Table B13 - Aquatic Fauna B10 - Drainage PatternsA3 - Saturation B14 - True Aquatic Plants C2 - Dry-Season Water TableB1 - Water Marks C1 - Hydrogen Sulfide Odor C8 - Crayfish BurrowsB2 - Sediment Deposits C3 - Oxidized Rhizospheres on Living Roots C9 - Saturation Visible on Aerial ImageryB3 - Drift Deposits C4 - Presence of Reduced Iron D1 - Stunted or Stressed PlantsB4 - Algal Mat or Crust C6 - Recent Iron Reduction in Tilled Soils D2 - Geomorphic PositionB5 - Iron Deposits C7 - Thin Muck Surface D5 - FAC-Neutral TestB7 - Inundation Visible on Aerial Imagery D9 - Gauge or Well DataB8 - Sparsely Vegetated Concave Surface Other (Explain)
Field Observations: Surface Water Present? Yes No Depth: na (in.) Water Table Present? Yes No Depth: na (in.) Saturation Present? Yes No Depth: na (in.)
SOILS Map Unit Name: Houghton muck Series Drainage Class: very poorly Taxonomy (Subgroup): Typic Medisaprists Field Observations Confirm Mapped Type? Yes No
Top BottomDepth Depth Horizon % % Type Location
0 10 1 10YR 2/2 100 -- -- -- -- --10 18 2 10YR 5/4 100 -- -- -- -- ---- -- -- -- -- -- -- -- -- -- ---- -- -- -- -- -- -- -- -- -- ---- -- -- -- -- -- -- -- -- -- ---- -- -- -- -- -- -- -- -- -- ---- -- -- -- -- -- -- -- -- -- ---- -- -- -- -- -- -- -- -- -- --
NRCS Hydric Soil Field Indicators (check here if indicators are not present):A1- Histosol S4 - Sandy Gleyed Matrix A16 - Coast Prairie Redox A2 - Histic Epipedon S5 - Sandy Redox F12 - Iron-Manganese Masses A3 - Black Histic S6 - Stripped Matrix Other (Explain in Remarks)A4 - Hydrogen Sulfide F1 - Loamy Muck MineralA5 - Stratified Layers F2 - Loamy Gleyed MatrixA10 - 2 cm Muck F3 - Depleted MatrixA11 - Depleted Below Dark Surface F6 - Redox Dark SurfaceA12 - Thick Dark Surface F7 - Depleted Dark SurfaceS1 - Sandy Muck Mineral F8 - Redox DepressionsS3 - 5 cm Mucky Peat or Peat 1 Indicators of hydrophytic vegetation and wetland hydrology must be present, unless disturbed or problematic.
A. BraschPorterIndianaw-492b1u
na
slope Local Relief: none --
--
Color (Moist)Mottles
upland
------
Remarks:
--
loamy sand--
No
Remarks:
Texture(e.g. clay, sand, loam)
Yes
Matrix
--Houghton muck
Line 6B Phase 2 Replacement Project
NWI/WWI Classification:
Describe Recorded Data (stream gauge, monitoring well, aerial photos, previous inspections), if available:
sandy loamColor (Moist)
Restrictive Layer (If Observed)
Remarks:
Type: N/A Depth: N/A Hydric Soil Present?
Profile Description (Describe to the depth needed to document the indicator or confirm the absence of indicators.) (Type: C=Concentration, D=Depletion, RM=Reduced Matrix, CS=Covered/Coated Sand Grains; Locaiton: PL=Pore Lining, M=Matrix)
EnbridgeD. Tersteeg
WETLAND DETERMINATION DATA FORMMidwest Region
Indicators for Problematic Soils 1
Yes NoAre normal circumstances present?
Yes No
Wetland Hydrology Present? Yes No
04/26/12

Page 2 of 2
Project/Site: w-492b 1u
VEGETATION (Species identified in all uppercase are non-native species.) Tree Stratum (Plot size: 10 meter radius)
% Cover Dominant Ind.Status Dominance Test Worksheet1. 70 Y FACU2. 20 Y FACU (A)3. 10 N FACW4. -- -- -- (B)5. -- -- --6. -- -- -- (A/B)7. -- -- --8. -- -- -- Prevalence Index Worksheet9. -- -- --10. -- -- -- OBL spp. 0 x 1 = 0
100 FACW spp. 40 x 2 = 80
FAC spp. 0 x 3 = 0
FACU spp. 165 x 4 = 660
1. -- -- -- UPL spp. 0 x 5 = 0
2. -- -- --3. -- -- -- Total 205 (A) 740 (B)4. -- -- --5. -- -- -- Prevalence Index = B/A = 3.610
6. -- -- --7. -- -- --8. -- -- -- Hydrophytic Vegetation Indicators:9. -- -- -- Yes No Rapid Test for Hydrophytic Vegetation10. -- -- -- Yes No Dominance Test is > 50%
0 Yes No Prevalence Index is ≤ 3.0 *Yes No Morphological Adaptations (Explain) *Yes No Problem Hydrophytic Vegetation (Explain) *
1. 5 N FACU2. 60 Y FACU3. 30 Y FACW4. 5 N FACU5. 5 N FACU6 -- -- --7. -- -- --8. -- -- --9. -- -- -- Sapling/Shrub -
10. -- -- --11. -- -- --12. -- -- --13. -- -- --14. -- -- --15. -- -- --
105
1. -- -- --2. -- -- --3. -- -- -- Hydrophytic Vegetation Present Yes No5. -- -- --4. -- -- --
0
Additional Remarks:
Remarks:
Sample PointLine 6B Phase 2 Replacement Project
----
--
--
-- Total % Cover of:
------
--
------
Woody Vines - All woody vines greater than 3.28 ft. in height.
--
----
--
Trillium recurvatum
Tree -
Wetland ID:
Definitions of Vegetation Strata:
--
Herb -
Herb Stratum (Plot size: 2 meter radius)
--
All herbaceous (non-woody) plants, regardless of size, and woody plants less than 3 28 ft tall
Multiply by:
25.0%
--
Percent of Dominant Species That Are OBL, FACW, or FAC:
--
--
--
Total Cover =
--
--
--Acer saccharinum
Total Cover =
Thalictrum dasycarpum Smilacina racemosa
--
Sapling/Shrub Stratum (Plot size: 5 meter radius)
--
Sanguinaria canadensis
--
Acer saccharumQuercus alba 1
4
Species Name
Total Number of Dominant Species Across All Strata:
Number of Dominant Species that are OBL, FACW, or FAC:
* Indicators of hydric soil and wetland hydrology must be present, unless disturbed or problematic.
Woody Vine Stratum (Plot size: 10 meter radius)
Total Cover =
----
--
--
Woody plants 3 in. (7.6cm) or more in diameter at breast height (DBH), regardless of height.
Woody plants less than 3 in. DBH and greater than 3.28 ft. tall.
Total Cover =
Midwest Region
WETLAND DETERMINATION DATA FORM
Pteridium aquilinum

Page 1 of 2
Project/Site: Stantec Project #: 193701660 Date: Applicant: County: Investigator #1: Investigator #2: State: Soil Unit: Wetland ID: Landform: Sample Point: Slope (%): 0 Latitude: -- Longitude: Datum: -- Community ID: Are climatic/hydrologic conditions on the site typical for this time of year? (If no, explain in remarks) Section: 10 Are Vegetation , Soil , or Hydrology significantly disturbed? Township: 36 N Are Vegetation , Soil , or Hydrology naturally problematic? Range: 5 Dir: WSUMMARY OF FINDINGS Hydrophytic Vegetation Present? Yes No Hydric Soils Present? Yes No Wetland Hydrology Present? Yes No Is This Sampling Point Within A Wetland? Yes No
HYDROLOGY
Wetland Hydrology Indicators (Check here if indicators are not present):Primary: Secondary:
A1 - Surface Water B9 - Water-Stained Leaves B6 - Surface Soil CracksA2 - High Water Table B13 - Aquatic Fauna B10 - Drainage PatternsA3 - Saturation B14 - True Aquatic Plants C2 - Dry-Season Water TableB1 - Water Marks C1 - Hydrogen Sulfide Odor C8 - Crayfish BurrowsB2 - Sediment Deposits C3 - Oxidized Rhizospheres on Living Roots C9 - Saturation Visible on Aerial ImageryB3 - Drift Deposits C4 - Presence of Reduced Iron D1 - Stunted or Stressed PlantsB4 - Algal Mat or Crust C6 - Recent Iron Reduction in Tilled Soils D2 - Geomorphic PositionB5 - Iron Deposits C7 - Thin Muck Surface D5 - FAC-Neutral TestB7 - Inundation Visible on Aerial Imagery D9 - Gauge or Well DataB8 - Sparsely Vegetated Concave Surface Other (Explain)
Field Observations: Surface Water Present? Yes No Depth: na (in.) Water Table Present? Yes No Depth: 10 (in.) Saturation Present? Yes No Depth: 2 (in.)
SOILS Map Unit Name: Houghton muck Series Drainage Class: very poorly Taxonomy (Subgroup): Typic Medisaprists Field Observations Confirm Mapped Type? Yes No
Top BottomDepth Depth Horizon % % Type Location
0 4 1 10YR 3/1 100 -- -- -- -- --4 12 2 10YR 4/2 90 10YR 4/6 10 C M12 18 3 10YR 4/1 80 10YR 4/6 20 C M-- -- -- -- -- -- -- -- -- -- ---- -- -- -- -- -- -- -- -- -- ---- -- -- -- -- -- -- -- -- -- ---- -- -- -- -- -- -- -- -- -- ---- -- -- -- -- -- -- -- -- -- --
NRCS Hydric Soil Field Indicators (check here if indicators are not present):A1- Histosol S4 - Sandy Gleyed Matrix A16 - Coast Prairie Redox A2 - Histic Epipedon S5 - Sandy Redox F12 - Iron-Manganese Masses A3 - Black Histic S6 - Stripped Matrix Other (Explain in Remarks)A4 - Hydrogen Sulfide F1 - Loamy Muck MineralA5 - Stratified Layers F2 - Loamy Gleyed MatrixA10 - 2 cm Muck F3 - Depleted MatrixA11 - Depleted Below Dark Surface F6 - Redox Dark SurfaceA12 - Thick Dark Surface F7 - Depleted Dark SurfaceS1 - Sandy Muck Mineral F8 - Redox DepressionsS3 - 5 cm Mucky Peat or Peat 1 Indicators of hydrophytic vegetation and wetland hydrology must be present, unless disturbed or problematic.
WETLAND DETERMINATION DATA FORMMidwest Region
Indicators for Problematic Soils 1
Yes NoAre normal circumstances present?
Yes No
Wetland Hydrology Present? Yes No
04/26/12
PUBGHoughton muck
Line 6B Phase 2 Replacement Project
NWI/WWI Classification:
Describe Recorded Data (stream gauge, monitoring well, aerial photos, previous inspections), if available:
silty clay loamColor (Moist)
Restrictive Layer (If Observed)
Remarks:
Type: N/A Depth: N/A Hydric Soil Present?
Profile Description (Describe to the depth needed to document the indicator or confirm the absence of indicators.) (Type: C=Concentration, D=Depletion, RM=Reduced Matrix, CS=Covered/Coated Sand Grains; Locaiton: PL=Pore Lining, M=Matrix)
EnbridgeD. Tersteeg
----
Remarks:
--
silty clay loamclay loam
No
Remarks:
Texture(e.g. clay, sand, loam)
Yes
Matrix
na
Type 2/6 wet meadow, reed canary grass, carex, surrounded by shrub scurb fringe of buttonbush and black willow.
depression Local Relief: concave --
--
Color (Moist)Mottles
FO1
--
A. BraschPorterIndianaw-492b1w

Page 2 of 2
Project/Site: w-492b 1w
VEGETATION (Species identified in all uppercase are non-native species.) Tree Stratum (Plot size: 10 meter radius)
% Cover Dominant Ind.Status Dominance Test Worksheet1. 20 Y OBL2. 70 Y FAC (A)3. -- -- --4. -- -- -- (B)5. -- -- --6. -- -- -- (A/B)7. -- -- --8. -- -- -- Prevalence Index Worksheet9. -- -- --10. -- -- -- OBL spp. 100 x 1 = 100
90 FACW spp. 40 x 2 = 80
FAC spp. 70 x 3 = 210
FACU spp. 0 x 4 = 0
1. 60 Y OBL UPL spp. 0 x 5 = 0
2. 10 -- FACW3. -- -- -- Total 210 (A) 390 (B)4. -- -- --5. -- -- -- Prevalence Index = B/A = 1.857
6. -- -- --7. -- -- --8. -- -- -- Hydrophytic Vegetation Indicators:9. -- -- -- Yes No Rapid Test for Hydrophytic Vegetation10. -- -- -- Yes No Dominance Test is > 50%
70 Yes No Prevalence Index is ≤ 3.0 *Yes No Morphological Adaptations (Explain) *Yes No Problem Hydrophytic Vegetation (Explain) *
1. 30 Y FACW2. 20 Y OBL3. -- -- --4. -- -- --5. -- -- --6 -- -- --7. -- -- --8. -- -- --9. -- -- -- Sapling/Shrub -
10. -- -- --11. -- -- --12. -- -- --13. -- -- --14. -- -- --15. -- -- --
50
1. -- -- --2. -- -- --3. -- -- -- Hydrophytic Vegetation Present Yes No5. -- -- --4. -- -- --
0
Additional Remarks:
* Indicators of hydric soil and wetland hydrology must be present, unless disturbed or problematic.
Woody Vine Stratum (Plot size: 10 meter radius)
Total Cover =
----
--
--
Woody plants 3 in. (7.6cm) or more in diameter at breast height (DBH), regardless of height.
Woody plants less than 3 in. DBH and greater than 3.28 ft. tall.
Total Cover =
Midwest Region
WETLAND DETERMINATION DATA FORM
--
Salix nigra Populus deltoides 5
5
Species Name
Total Number of Dominant Species Across All Strata:
Number of Dominant Species that are OBL, FACW, or FAC:
--
--
--
Total Cover =
Cephalanthus occidentalis
--
----
Total Cover =
----
Lindera benzoin
Sapling/Shrub Stratum (Plot size: 5 meter radius)
--
Solidago gigantea
--
100.0%
--
Percent of Dominant Species That Are OBL, FACW, or FAC:
----
--
Carex stricta
Tree -
Wetland ID:
Definitions of Vegetation Strata:
--
Herb -
Herb Stratum (Plot size: 2 meter radius)
--
All herbaceous (non-woody) plants, regardless of size, and woody plants less than 3 28 ft tall
Multiply by:
Remarks:
Sample PointLine 6B Phase 2 Replacement Project
----
--
--
-- Total % Cover of:
------
--
------
Woody Vines - All woody vines greater than 3.28 ft. in height.
--

Page 1 of 2
Project/Site: Stantec Project #: 193701660 Date: Applicant: County: Investigator #1: Investigator #2: State: Soil Unit: Wetland ID: Landform: Sample Point: Slope (%): 2 Latitude: -- Longitude: Datum: -- Community ID: Are climatic/hydrologic conditions on the site typical for this time of year? (If no, explain in remarks) Section: 11 Are Vegetation , Soil , or Hydrology significantly disturbed? Township: 36 N Are Vegetation , Soil , or Hydrology naturally problematic? Range: 5 Dir: WSUMMARY OF FINDINGS Hydrophytic Vegetation Present? Yes No Hydric Soils Present? Yes No Wetland Hydrology Present? Yes No Is This Sampling Point Within A Wetland? Yes No
HYDROLOGY
Wetland Hydrology Indicators (Check here if indicators are not present):Primary: Secondary:
A1 - Surface Water B9 - Water-Stained Leaves B6 - Surface Soil CracksA2 - High Water Table B13 - Aquatic Fauna B10 - Drainage PatternsA3 - Saturation B14 - True Aquatic Plants C2 - Dry-Season Water TableB1 - Water Marks C1 - Hydrogen Sulfide Odor C8 - Crayfish BurrowsB2 - Sediment Deposits C3 - Oxidized Rhizospheres on Living Roots C9 - Saturation Visible on Aerial ImageryB3 - Drift Deposits C4 - Presence of Reduced Iron D1 - Stunted or Stressed PlantsB4 - Algal Mat or Crust C6 - Recent Iron Reduction in Tilled Soils D2 - Geomorphic PositionB5 - Iron Deposits C7 - Thin Muck Surface D5 - FAC-Neutral TestB7 - Inundation Visible on Aerial Imagery D9 - Gauge or Well DataB8 - Sparsely Vegetated Concave Surface Other (Explain)
Field Observations: Surface Water Present? Yes No Depth: na (in.) Water Table Present? Yes No Depth: na (in.) Saturation Present? Yes No Depth: na (in.)
SOILS Map Unit Name: Tracy sandy loam Series Drainage Class: well Taxonomy (Subgroup): Ultic Hapludalfs Field Observations Confirm Mapped Type? Yes No
Top BottomDepth Depth Horizon % % Type Location
0 10 1 10YR 3/3 100 -- -- -- -- --10 18 2 10YR 4/4 100 -- -- -- -- ---- -- -- -- -- -- -- -- -- -- ---- -- -- -- -- -- -- -- -- -- ---- -- -- -- -- -- -- -- -- -- ---- -- -- -- -- -- -- -- -- -- ---- -- -- -- -- -- -- -- -- -- ---- -- -- -- -- -- -- -- -- -- --
NRCS Hydric Soil Field Indicators (check here if indicators are not present):A1- Histosol S4 - Sandy Gleyed Matrix A16 - Coast Prairie Redox A2 - Histic Epipedon S5 - Sandy Redox F12 - Iron-Manganese Masses A3 - Black Histic S6 - Stripped Matrix Other (Explain in Remarks)A4 - Hydrogen Sulfide F1 - Loamy Muck MineralA5 - Stratified Layers F2 - Loamy Gleyed MatrixA10 - 2 cm Muck F3 - Depleted MatrixA11 - Depleted Below Dark Surface F6 - Redox Dark SurfaceA12 - Thick Dark Surface F7 - Depleted Dark SurfaceS1 - Sandy Muck Mineral F8 - Redox DepressionsS3 - 5 cm Mucky Peat or Peat 1 Indicators of hydrophytic vegetation and wetland hydrology must be present, unless disturbed or problematic.
WETLAND DETERMINATION DATA FORMMidwest Region
Indicators for Problematic Soils 1
Yes NoAre normal circumstances present?
Yes No
Wetland Hydrology Present? Yes No
04/26/12
--Tracy sandy loam
Line 6B Phase 2 Replacement Project
NWI/WWI Classification:
Describe Recorded Data (stream gauge, monitoring well, aerial photos, previous inspections), if available:
sandy loamColor (Moist)
Restrictive Layer (If Observed)
Remarks:
Type: N/A Depth: N/A Hydric Soil Present?
Profile Description (Describe to the depth needed to document the indicator or confirm the absence of indicators.) (Type: C=Concentration, D=Depletion, RM=Reduced Matrix, CS=Covered/Coated Sand Grains; Locaiton: PL=Pore Lining, M=Matrix)
EnbridgeD. Tersteeg
----
Remarks:
--
loamy sand--
No
Remarks:
Texture(e.g. clay, sand, loam)
Yes
Matrix
na
Upland cultivated agriculture, just planted.
slope Local Relief: convex --
--
Color (Moist)Mottles
upland
--
A. BraschPorterIndianaw-492c1u

Page 2 of 2
Project/Site: w-492c 1u
VEGETATION (Species identified in all uppercase are non-native species.) Tree Stratum (Plot size: 10 meter radius)
% Cover Dominant Ind.Status Dominance Test Worksheet1. -- -- --2. -- -- -- (A)3. -- -- --4. -- -- -- (B)5. -- -- --6. -- -- -- (A/B)7. -- -- --8. -- -- -- Prevalence Index Worksheet9. -- -- --10. -- -- -- OBL spp. 0 x 1 = 0
0 FACW spp. 0 x 2 = 0
FAC spp. 0 x 3 = 0
FACU spp. 0 x 4 = 0
1. -- -- -- UPL spp. 0 x 5 = 0
2. -- -- --3. -- -- -- Total 0 (A) 0 (B)4. -- -- --5. -- -- -- Prevalence Index = B/A = NA
6. -- -- --7. -- -- --8. -- -- -- Hydrophytic Vegetation Indicators:9. -- -- -- Yes No Rapid Test for Hydrophytic Vegetation10. -- -- -- Yes No Dominance Test is > 50%
0 Yes No Prevalence Index is ≤ 3.0 *Yes No Morphological Adaptations (Explain) *Yes No Problem Hydrophytic Vegetation (Explain) *
1. -- -- --2. -- -- --3. -- -- --4. -- -- --5. -- -- --6 -- -- --7. -- -- --8. -- -- --9. -- -- -- Sapling/Shrub -
10. -- -- --11. -- -- --12. -- -- --13. -- -- --14. -- -- --15. -- -- --
0
1. -- -- --2. -- -- --3. -- -- -- Hydrophytic Vegetation Present Yes No5. -- -- --4. -- -- --
0
Additional Remarks:
* Indicators of hydric soil and wetland hydrology must be present, unless disturbed or problematic.
Woody Vine Stratum (Plot size: 10 meter radius)
Total Cover =
----
--
No vegetation, just planted agricultural field.
--
Woody plants 3 in. (7.6cm) or more in diameter at breast height (DBH), regardless of height.
Woody plants less than 3 in. DBH and greater than 3.28 ft. tall.
Total Cover =
Midwest Region
WETLAND DETERMINATION DATA FORM
--
---- 0
0
Species Name
Total Number of Dominant Species Across All Strata:
Number of Dominant Species that are OBL, FACW, or FAC:
--
--
--
Total Cover =
--
--
----
Total Cover =
----
--
Sapling/Shrub Stratum (Plot size: 5 meter radius)
--
--
--
NA
--
Percent of Dominant Species That Are OBL, FACW, or FAC:
----
--
--
Tree -
Wetland ID:
Definitions of Vegetation Strata:
--
Herb -
Herb Stratum (Plot size: 2 meter radius)
--
All herbaceous (non-woody) plants, regardless of size, and woody plants less than 3 28 ft tall
Multiply by:
Remarks:
Sample PointLine 6B Phase 2 Replacement Project
----
--
--
-- Total % Cover of:
------
--
------
Woody Vines - All woody vines greater than 3.28 ft. in height.
--

Page 1 of 2
Project/Site: Stantec Project #: 193701660 Date: Applicant: County: Investigator #1: Investigator #2: State: Soil Unit: Wetland ID: Landform: Sample Point: Slope (%): 0 Latitude: -- Longitude: Datum: -- Community ID: Are climatic/hydrologic conditions on the site typical for this time of year? (If no, explain in remarks) Section: 11 Are Vegetation , Soil , or Hydrology significantly disturbed? Township: 36 N Are Vegetation , Soil , or Hydrology naturally problematic? Range: 5 Dir: WSUMMARY OF FINDINGS Hydrophytic Vegetation Present? Yes No Hydric Soils Present? Yes No Wetland Hydrology Present? Yes No Is This Sampling Point Within A Wetland? Yes No
HYDROLOGY
Wetland Hydrology Indicators (Check here if indicators are not present):Primary: Secondary:
A1 - Surface Water B9 - Water-Stained Leaves B6 - Surface Soil CracksA2 - High Water Table B13 - Aquatic Fauna B10 - Drainage PatternsA3 - Saturation B14 - True Aquatic Plants C2 - Dry-Season Water TableB1 - Water Marks C1 - Hydrogen Sulfide Odor C8 - Crayfish BurrowsB2 - Sediment Deposits C3 - Oxidized Rhizospheres on Living Roots C9 - Saturation Visible on Aerial ImageryB3 - Drift Deposits C4 - Presence of Reduced Iron D1 - Stunted or Stressed PlantsB4 - Algal Mat or Crust C6 - Recent Iron Reduction in Tilled Soils D2 - Geomorphic PositionB5 - Iron Deposits C7 - Thin Muck Surface D5 - FAC-Neutral TestB7 - Inundation Visible on Aerial Imagery D9 - Gauge or Well DataB8 - Sparsely Vegetated Concave Surface Other (Explain)
Field Observations: Surface Water Present? Yes No Depth: na (in.) Water Table Present? Yes No Depth: 16 (in.) Saturation Present? Yes No Depth: 10 (in.)
SOILS Map Unit Name: Tracy sandy loam Series Drainage Class: well Taxonomy (Subgroup): Ultic Hapludalfs Field Observations Confirm Mapped Type? Yes No
Top BottomDepth Depth Horizon % % Type Location
0 6 1 10YR 3/2 80 10YR 4/6 20 C M6 18 2 10YR 4/2 70 10YR 3/6 30 C M-- -- -- -- -- -- -- -- -- -- ---- -- -- -- -- -- -- -- -- -- ---- -- -- -- -- -- -- -- -- -- ---- -- -- -- -- -- -- -- -- -- ---- -- -- -- -- -- -- -- -- -- ---- -- -- -- -- -- -- -- -- -- --
NRCS Hydric Soil Field Indicators (check here if indicators are not present):A1- Histosol S4 - Sandy Gleyed Matrix A16 - Coast Prairie Redox A2 - Histic Epipedon S5 - Sandy Redox F12 - Iron-Manganese Masses A3 - Black Histic S6 - Stripped Matrix Other (Explain in Remarks)A4 - Hydrogen Sulfide F1 - Loamy Muck MineralA5 - Stratified Layers F2 - Loamy Gleyed MatrixA10 - 2 cm Muck F3 - Depleted MatrixA11 - Depleted Below Dark Surface F6 - Redox Dark SurfaceA12 - Thick Dark Surface F7 - Depleted Dark SurfaceS1 - Sandy Muck Mineral F8 - Redox DepressionsS3 - 5 cm Mucky Peat or Peat 1 Indicators of hydrophytic vegetation and wetland hydrology must be present, unless disturbed or problematic.
WETLAND DETERMINATION DATA FORMMidwest Region
Indicators for Problematic Soils 1
Yes NoAre normal circumstances present?
Yes No
Wetland Hydrology Present? Yes No
04/26/12
PEMATracy sandy loam
Line 6B Phase 2 Replacement Project
NWI/WWI Classification:
Describe Recorded Data (stream gauge, monitoring well, aerial photos, previous inspections), if available:
silty clay loamColor (Moist)
Restrictive Layer (If Observed)
Remarks:
Type: N/A Depth: N/A Hydric Soil Present?
Profile Description (Describe to the depth needed to document the indicator or confirm the absence of indicators.) (Type: C=Concentration, D=Depletion, RM=Reduced Matrix, CS=Covered/Coated Sand Grains; Locaiton: PL=Pore Lining, M=Matrix)
EnbridgeD. Tersteeg
----
Remarks:
--
fine sandy clay loam--
No
Remarks:
Texture(e.g. clay, sand, loam)
Yes
Matrix
na
Type 2 reed canary grass dominated wet meadow with black willow finge, farmed agricultural surrounding wetland.
depression Local Relief: concave --
--
Color (Moist)Mottles
EM1
--
A. BraschPorterIndianaw-492c1w

Page 2 of 2
Project/Site: w-492c 1w
VEGETATION (Species identified in all uppercase are non-native species.) Tree Stratum (Plot size: 10 meter radius)
% Cover Dominant Ind.Status Dominance Test Worksheet1. 20 Y OBL2. -- -- -- (A)3. -- -- --4. -- -- -- (B)5. -- -- --6. -- -- -- (A/B)7. -- -- --8. -- -- -- Prevalence Index Worksheet9. -- -- --10. -- -- -- OBL spp. 20 x 1 = 20
20 FACW spp. 20 x 2 = 40
FAC spp. 80 x 3 = 240
FACU spp. 5 x 4 = 20
1. 5 Y FACU UPL spp. 0 x 5 = 0
2. -- -- --3. -- -- -- Total 125 (A) 320 (B)4. -- -- --5. -- -- -- Prevalence Index = B/A = 2.560
6. -- -- --7. -- -- --8. -- -- -- Hydrophytic Vegetation Indicators:9. -- -- -- Yes No Rapid Test for Hydrophytic Vegetation10. -- -- -- Yes No Dominance Test is > 50%
5 Yes No Prevalence Index is ≤ 3.0 *Yes No Morphological Adaptations (Explain) *Yes No Problem Hydrophytic Vegetation (Explain) *
1. 20 Y FACW2. 80 Y FAC3. -- -- --4. -- -- --5. -- -- --6 -- -- --7. -- -- --8. -- -- --9. -- -- -- Sapling/Shrub -
10. -- -- --11. -- -- --12. -- -- --13. -- -- --14. -- -- --15. -- -- --
100
1. -- -- --2. -- -- --3. -- -- -- Hydrophytic Vegetation Present Yes No5. -- -- --4. -- -- --
0
Additional Remarks:
* Indicators of hydric soil and wetland hydrology must be present, unless disturbed or problematic.
Woody Vine Stratum (Plot size: 10 meter radius)
Total Cover =
----
--
--
Woody plants 3 in. (7.6cm) or more in diameter at breast height (DBH), regardless of height.
Woody plants less than 3 in. DBH and greater than 3.28 ft. tall.
Total Cover =
Midwest Region
WETLAND DETERMINATION DATA FORM
--
Salix nigra -- 3
4
Species Name
Total Number of Dominant Species Across All Strata:
Number of Dominant Species that are OBL, FACW, or FAC:
--
--
--
Total Cover =
ROSA MULTIFLORA
--
----
Total Cover =
----
--
Sapling/Shrub Stratum (Plot size: 5 meter radius)
--
Impatiens capensis
--
75.0%
--
Percent of Dominant Species That Are OBL, FACW, or FAC:
----
--
Equisetum arvense
Tree -
Wetland ID:
Definitions of Vegetation Strata:
--
Herb -
Herb Stratum (Plot size: 2 meter radius)
--
All herbaceous (non-woody) plants, regardless of size, and woody plants less than 3 28 ft tall
Multiply by:
Remarks:
Sample PointLine 6B Phase 2 Replacement Project
----
--
--
-- Total % Cover of:
------
--
------
Woody Vines - All woody vines greater than 3.28 ft. in height.
--

Page 1 of 2
Project/Site: Stantec Project #: 193701660 Date: Applicant: County: Investigator #1: Investigator #2: State: Soil Unit: Wetland ID: Landform: Sample Point: Slope (%): 2 Latitude: -- Longitude: Datum: -- Community ID: Are climatic/hydrologic conditions on the site typical for this time of year? (If no, explain in remarks) Section: 11 Are Vegetation , Soil , or Hydrology significantly disturbed? Township: 36 N Are Vegetation , Soil , or Hydrology naturally problematic? Range: 5 Dir: WSUMMARY OF FINDINGS Hydrophytic Vegetation Present? Yes No Hydric Soils Present? Yes No Wetland Hydrology Present? Yes No Is This Sampling Point Within A Wetland? Yes No
HYDROLOGY
Wetland Hydrology Indicators (Check here if indicators are not present):Primary: Secondary:
A1 - Surface Water B9 - Water-Stained Leaves B6 - Surface Soil CracksA2 - High Water Table B13 - Aquatic Fauna B10 - Drainage PatternsA3 - Saturation B14 - True Aquatic Plants C2 - Dry-Season Water TableB1 - Water Marks C1 - Hydrogen Sulfide Odor C8 - Crayfish BurrowsB2 - Sediment Deposits C3 - Oxidized Rhizospheres on Living Roots C9 - Saturation Visible on Aerial ImageryB3 - Drift Deposits C4 - Presence of Reduced Iron D1 - Stunted or Stressed PlantsB4 - Algal Mat or Crust C6 - Recent Iron Reduction in Tilled Soils D2 - Geomorphic PositionB5 - Iron Deposits C7 - Thin Muck Surface D5 - FAC-Neutral TestB7 - Inundation Visible on Aerial Imagery D9 - Gauge or Well DataB8 - Sparsely Vegetated Concave Surface Other (Explain)
Field Observations: Surface Water Present? Yes No Depth: na (in.) Water Table Present? Yes No Depth: na (in.) Saturation Present? Yes No Depth: na (in.)
SOILS Map Unit Name: Riddles silt loam Series Drainage Class: well Taxonomy (Subgroup): Typic Hapludalfs Field Observations Confirm Mapped Type? Yes No
Top BottomDepth Depth Horizon % % Type Location
0 14 1 10YR 2/2 100 -- -- -- -- --14 18 2 10YR 6/3 90 10YR 5/6 10 C M-- -- -- -- -- -- -- -- -- -- ---- -- -- -- -- -- -- -- -- -- ---- -- -- -- -- -- -- -- -- -- ---- -- -- -- -- -- -- -- -- -- ---- -- -- -- -- -- -- -- -- -- ---- -- -- -- -- -- -- -- -- -- --
NRCS Hydric Soil Field Indicators (check here if indicators are not present):A1- Histosol S4 - Sandy Gleyed Matrix A16 - Coast Prairie Redox A2 - Histic Epipedon S5 - Sandy Redox F12 - Iron-Manganese Masses A3 - Black Histic S6 - Stripped Matrix Other (Explain in Remarks)A4 - Hydrogen Sulfide F1 - Loamy Muck MineralA5 - Stratified Layers F2 - Loamy Gleyed MatrixA10 - 2 cm Muck F3 - Depleted MatrixA11 - Depleted Below Dark Surface F6 - Redox Dark SurfaceA12 - Thick Dark Surface F7 - Depleted Dark SurfaceS1 - Sandy Muck Mineral F8 - Redox DepressionsS3 - 5 cm Mucky Peat or Peat 1 Indicators of hydrophytic vegetation and wetland hydrology must be present, unless disturbed or problematic.
WETLAND DETERMINATION DATA FORMMidwest Region
Indicators for Problematic Soils 1
Yes NoAre normal circumstances present?
Yes No
Wetland Hydrology Present? Yes No
04/26/12
--Riddles silt loam
Line 6B Phase 2 Replacement Project
NWI/WWI Classification:
Describe Recorded Data (stream gauge, monitoring well, aerial photos, previous inspections), if available:
sandy loamColor (Moist)
Restrictive Layer (If Observed)
Remarks:
Type: N/A Depth: N/A Hydric Soil Present?
Profile Description (Describe to the depth needed to document the indicator or confirm the absence of indicators.) (Type: C=Concentration, D=Depletion, RM=Reduced Matrix, CS=Covered/Coated Sand Grains; Locaiton: PL=Pore Lining, M=Matrix)
EnbridgeD. Tersteeg
----
Remarks:
--
loamy sand--
No
Remarks:
Texture(e.g. clay, sand, loam)
Yes
Matrix
na
slope Local Relief: concave --
--
Color (Moist)Mottles
upland
--
A. BraschPorterIndianaw-492d1u

Page 2 of 2
Project/Site: w-492d 1u
VEGETATION (Species identified in all uppercase are non-native species.) Tree Stratum (Plot size: 10 meter radius)
% Cover Dominant Ind.Status Dominance Test Worksheet1. 40 Y FACU2. 40 Y FACU (A)3. 20 Y FACU4. -- -- -- (B)5. -- -- --6. -- -- -- (A/B)7. -- -- --8. -- -- -- Prevalence Index Worksheet9. -- -- --10. -- -- -- OBL spp. 0 x 1 = 0
100 FACW spp. 0 x 2 = 0
FAC spp. 20 x 3 = 60
FACU spp. 240 x 4 = 960
1. 10 N FACU UPL spp. 0 x 5 = 0
2. 60 Y FACU3. -- -- -- Total 260 (A) 1020 (B)4. -- -- --5. -- -- -- Prevalence Index = B/A = 3.923
6. -- -- --7. -- -- --8. -- -- -- Hydrophytic Vegetation Indicators:9. -- -- -- Yes No Rapid Test for Hydrophytic Vegetation10. -- -- -- Yes No Dominance Test is > 50%
70 Yes No Prevalence Index is ≤ 3.0 *Yes No Morphological Adaptations (Explain) *Yes No Problem Hydrophytic Vegetation (Explain) *
1. 60 Y FACU2. 10 N FACU3. 20 Y FAC4. -- -- --5. -- -- --6 -- -- --7. -- -- --8. -- -- --9. -- -- -- Sapling/Shrub -
10. -- -- --11. -- -- --12. -- -- --13. -- -- --14. -- -- --15. -- -- --
90
1. -- -- --2. -- -- --3. -- -- -- Hydrophytic Vegetation Present Yes No5. -- -- --4. -- -- --
0
Additional Remarks:
* Indicators of hydric soil and wetland hydrology must be present, unless disturbed or problematic.
Woody Vine Stratum (Plot size: 10 meter radius)
Total Cover =
----
--
--
Woody plants 3 in. (7.6cm) or more in diameter at breast height (DBH), regardless of height.
Woody plants less than 3 in. DBH and greater than 3.28 ft. tall.
Total Cover =
Midwest Region
WETLAND DETERMINATION DATA FORM
--
Acer saccharumTilia americana 1
6
Species Name
Total Number of Dominant Species Across All Strata:
Number of Dominant Species that are OBL, FACW, or FAC:
--
--
--
Total Cover =
ROSA MULTIFLORA
--
--Fraxinus americana
Total Cover =
Viola sororia --
Acer saccharum
Sapling/Shrub Stratum (Plot size: 5 meter radius)
--
Podophyllum peltatum
--
16.7%
--
Percent of Dominant Species That Are OBL, FACW, or FAC:
----
--
Geranium maculatum
Tree -
Wetland ID:
Definitions of Vegetation Strata:
--
Herb -
Herb Stratum (Plot size: 2 meter radius)
--
All herbaceous (non-woody) plants, regardless of size, and woody plants less than 3 28 ft tall
Multiply by:
Remarks:
Sample PointLine 6B Phase 2 Replacement Project
----
--
--
-- Total % Cover of:
------
--
------
Woody Vines - All woody vines greater than 3.28 ft. in height.
--

Page 1 of 2
Project/Site: Stantec Project #: 193701660 Date: Applicant: County: Investigator #1: Investigator #2: State: Soil Unit: Wetland ID: Landform: Sample Point: Slope (%): 0 Latitude: -- Longitude: Datum: -- Community ID: Are climatic/hydrologic conditions on the site typical for this time of year? (If no, explain in remarks) Section: 11 Are Vegetation , Soil , or Hydrology significantly disturbed? Township: 36 N Are Vegetation , Soil , or Hydrology naturally problematic? Range: 5 Dir: WSUMMARY OF FINDINGS Hydrophytic Vegetation Present? Yes No Hydric Soils Present? Yes No Wetland Hydrology Present? Yes No Is This Sampling Point Within A Wetland? Yes No
HYDROLOGY
Wetland Hydrology Indicators (Check here if indicators are not present):Primary: Secondary:
A1 - Surface Water B9 - Water-Stained Leaves B6 - Surface Soil CracksA2 - High Water Table B13 - Aquatic Fauna B10 - Drainage PatternsA3 - Saturation B14 - True Aquatic Plants C2 - Dry-Season Water TableB1 - Water Marks C1 - Hydrogen Sulfide Odor C8 - Crayfish BurrowsB2 - Sediment Deposits C3 - Oxidized Rhizospheres on Living Roots C9 - Saturation Visible on Aerial ImageryB3 - Drift Deposits C4 - Presence of Reduced Iron D1 - Stunted or Stressed PlantsB4 - Algal Mat or Crust C6 - Recent Iron Reduction in Tilled Soils D2 - Geomorphic PositionB5 - Iron Deposits C7 - Thin Muck Surface D5 - FAC-Neutral TestB7 - Inundation Visible on Aerial Imagery D9 - Gauge or Well DataB8 - Sparsely Vegetated Concave Surface Other (Explain)
Field Observations: Surface Water Present? Yes No Depth: 1 (in.) Water Table Present? Yes No Depth: 0 (in.) Saturation Present? Yes No Depth: 0 (in.)
SOILS Map Unit Name: Fluvaquents Series Drainage Class: poorly Taxonomy (Subgroup): N/A Field Observations Confirm Mapped Type? Yes No
Top BottomDepth Depth Horizon % % Type Location
0 5 1 10YR 2/1 100 -- -- -- -- --5 12 2 10YR 3/1 90 10YR 3/6 10 C M12 18 3 10YR 4/2 90 10YR 4/6 10 C M-- -- -- -- -- -- -- -- -- -- ---- -- -- -- -- -- -- -- -- -- ---- -- -- -- -- -- -- -- -- -- ---- -- -- -- -- -- -- -- -- -- ---- -- -- -- -- -- -- -- -- -- --
NRCS Hydric Soil Field Indicators (check here if indicators are not present):A1- Histosol S4 - Sandy Gleyed Matrix A16 - Coast Prairie Redox A2 - Histic Epipedon S5 - Sandy Redox F12 - Iron-Manganese Masses A3 - Black Histic S6 - Stripped Matrix Other (Explain in Remarks)A4 - Hydrogen Sulfide F1 - Loamy Muck MineralA5 - Stratified Layers F2 - Loamy Gleyed MatrixA10 - 2 cm Muck F3 - Depleted MatrixA11 - Depleted Below Dark Surface F6 - Redox Dark SurfaceA12 - Thick Dark Surface F7 - Depleted Dark SurfaceS1 - Sandy Muck Mineral F8 - Redox DepressionsS3 - 5 cm Mucky Peat or Peat 1 Indicators of hydrophytic vegetation and wetland hydrology must be present, unless disturbed or problematic.
A. BraschPorterIndianaw-492d1w
na
Type 7, forested wetland. Green ash, slippery elm, American elm, black willow, with open water pool and spicebush fringe.
depression Local Relief: concave --
--
Color (Moist)Mottles
FO1
------
Remarks: Buttressed roots
--
silty clay loamclay loam
No
Remarks:
Texture(e.g. clay, sand, loam)
Yes
Matrix
--Fluvaquents
Line 6B Phase 2 Replacement Project
NWI/WWI Classification:
Describe Recorded Data (stream gauge, monitoring well, aerial photos, previous inspections), if available:
mucky silt loamColor (Moist)
Restrictive Layer (If Observed)
Remarks:
Type: N/A Depth: N/A Hydric Soil Present?
Profile Description (Describe to the depth needed to document the indicator or confirm the absence of indicators.) (Type: C=Concentration, D=Depletion, RM=Reduced Matrix, CS=Covered/Coated Sand Grains; Locaiton: PL=Pore Lining, M=Matrix)
EnbridgeD. Tersteeg
WETLAND DETERMINATION DATA FORMMidwest Region
Indicators for Problematic Soils 1
Yes NoAre normal circumstances present?
Yes No
Wetland Hydrology Present? Yes No
04/26/12

Page 2 of 2
Project/Site: w-492d 1w
VEGETATION (Species identified in all uppercase are non-native species.) Tree Stratum (Plot size: 10 meter radius)
% Cover Dominant Ind.Status Dominance Test Worksheet1. 20 Y FACW2. 40 Y FACW (A)3. 20 Y FAC4. -- -- -- (B)5. -- -- --6. -- -- -- (A/B)7. -- -- --8. -- -- -- Prevalence Index Worksheet9. -- -- --10. -- -- -- OBL spp. 0 x 1 = 0
80 FACW spp. 185 x 2 = 370
FAC spp. 20 x 3 = 60
FACU spp. 10 x 4 = 40
1. 30 Y FACW UPL spp. 0 x 5 = 0
2. 10 N FACU3. 20 Y FACW Total 215 (A) 470 (B)4. 10 N FACW5. -- -- -- Prevalence Index = B/A = 2.186
6. -- -- --7. -- -- --8. -- -- -- Hydrophytic Vegetation Indicators:9. -- -- -- Yes No Rapid Test for Hydrophytic Vegetation10. -- -- -- Yes No Dominance Test is > 50%
70 Yes No Prevalence Index is ≤ 3.0 *Yes No Morphological Adaptations (Explain) *Yes No Problem Hydrophytic Vegetation (Explain) *
1. 40 Y FACW2. 20 Y FACW3. 5 N FACW4. -- -- --5. -- -- --6 -- -- --7. -- -- --8. -- -- --9. -- -- -- Sapling/Shrub -
10. -- -- --11. -- -- --12. -- -- --13. -- -- --14. -- -- --15. -- -- --
65
1. -- -- --2. -- -- --3. -- -- -- Hydrophytic Vegetation Present Yes No5. -- -- --4. -- -- --
0
Additional Remarks:
Remarks:
Sample PointLine 6B Phase 2 Replacement Project
----
--
--
-- Total % Cover of:
------
--
------
Woody Vines - All woody vines greater than 3.28 ft. in height.
--
----
--
Impatiens capensis
Tree -
Wetland ID:
Definitions of Vegetation Strata:
--
Herb -
Herb Stratum (Plot size: 2 meter radius)
Ulmus americana
All herbaceous (non-woody) plants, regardless of size, and woody plants less than 3 28 ft tall
Multiply by:
100.0%
--
Percent of Dominant Species That Are OBL, FACW, or FAC:
--
--
--
Total Cover =
Lindera benzoin
Fraxinus pennsylvanica
--Ulmus rubra
Total Cover =
Carex tribuloides--
Tilia americana
Sapling/Shrub Stratum (Plot size: 5 meter radius)
--
Solidago gigantea
--
Fraxinus pennsylvanica Ulmus americana 7
7
Species Name
Total Number of Dominant Species Across All Strata:
Number of Dominant Species that are OBL, FACW, or FAC:
* Indicators of hydric soil and wetland hydrology must be present, unless disturbed or problematic.
Woody Vine Stratum (Plot size: 10 meter radius)
Total Cover =
----
--
--
Woody plants 3 in. (7.6cm) or more in diameter at breast height (DBH), regardless of height.
Woody plants less than 3 in. DBH and greater than 3.28 ft. tall.
Total Cover =
Midwest Region
WETLAND DETERMINATION DATA FORM
--

Page 1 of 2
Project/Site: Stantec Project #: 193701660 Date: Applicant: County: Investigator #1: Investigator #2: State: Soil Unit: Wetland ID: Landform: Sample Point: Slope (%): -- Latitude: -- Longitude: Datum: -- Community ID: Are climatic/hydrologic conditions on the site typical for this time of year? (If no, explain in remarks) Section: 11 Are Vegetation , Soil , or Hydrology significantly disturbed? Township: 36 N Are Vegetation , Soil , or Hydrology naturally problematic? Range: 5 Dir: WSUMMARY OF FINDINGS Hydrophytic Vegetation Present? Yes No Hydric Soils Present? Yes No Wetland Hydrology Present? Yes No Is This Sampling Point Within A Wetland? Yes No
HYDROLOGY
Wetland Hydrology Indicators (Check here if indicators are not present):Primary: Secondary:
A1 - Surface Water B9 - Water-Stained Leaves B6 - Surface Soil CracksA2 - High Water Table B13 - Aquatic Fauna B10 - Drainage PatternsA3 - Saturation B14 - True Aquatic Plants C2 - Dry-Season Water TableB1 - Water Marks C1 - Hydrogen Sulfide Odor C8 - Crayfish BurrowsB2 - Sediment Deposits C3 - Oxidized Rhizospheres on Living Roots C9 - Saturation Visible on Aerial ImageryB3 - Drift Deposits C4 - Presence of Reduced Iron D1 - Stunted or Stressed PlantsB4 - Algal Mat or Crust C6 - Recent Iron Reduction in Tilled Soils D2 - Geomorphic PositionB5 - Iron Deposits C7 - Thin Muck Surface D5 - FAC-Neutral TestB7 - Inundation Visible on Aerial Imagery D9 - Gauge or Well DataB8 - Sparsely Vegetated Concave Surface Other (Explain)
Field Observations: Surface Water Present? Yes No Depth: na (in.) Water Table Present? Yes No Depth: na (in.) Saturation Present? Yes No Depth: na (in.)
SOILS Map Unit Name: Riddles silt loam Series Drainage Class: well Taxonomy (Subgroup): Typic Hapludalfs Field Observations Confirm Mapped Type? Yes No
Top BottomDepth Depth Horizon % % Type Location
0 14 1 10YR 2/2 100 -- -- -- -- --14 18 2 10YR 4/4 100 -- -- -- -- ---- -- -- -- -- -- -- -- -- -- ---- -- -- -- -- -- -- -- -- -- ---- -- -- -- -- -- -- -- -- -- ---- -- -- -- -- -- -- -- -- -- ---- -- -- -- -- -- -- -- -- -- ---- -- -- -- -- -- -- -- -- -- --
NRCS Hydric Soil Field Indicators (check here if indicators are not present):A1- Histosol S4 - Sandy Gleyed Matrix A16 - Coast Prairie Redox A2 - Histic Epipedon S5 - Sandy Redox F12 - Iron-Manganese Masses A3 - Black Histic S6 - Stripped Matrix Other (Explain in Remarks)A4 - Hydrogen Sulfide F1 - Loamy Muck MineralA5 - Stratified Layers F2 - Loamy Gleyed MatrixA10 - 2 cm Muck F3 - Depleted MatrixA11 - Depleted Below Dark Surface F6 - Redox Dark SurfaceA12 - Thick Dark Surface F7 - Depleted Dark SurfaceS1 - Sandy Muck Mineral F8 - Redox DepressionsS3 - 5 cm Mucky Peat or Peat 1 Indicators of hydrophytic vegetation and wetland hydrology must be present, unless disturbed or problematic.
WETLAND DETERMINATION DATA FORMMidwest Region
Indicators for Problematic Soils 1
Yes NoAre normal circumstances present?
Yes No
Wetland Hydrology Present? Yes No
04/26/12
--Riddles silt loam
Line 6B Phase 2 Replacement Project
NWI/WWI Classification:
Describe Recorded Data (stream gauge, monitoring well, aerial photos, previous inspections), if available:
sandy loamColor (Moist)
Restrictive Layer (If Observed)
Remarks:
Type: N/A Depth: N/A Hydric Soil Present?
Profile Description (Describe to the depth needed to document the indicator or confirm the absence of indicators.) (Type: C=Concentration, D=Depletion, RM=Reduced Matrix, CS=Covered/Coated Sand Grains; Locaiton: PL=Pore Lining, M=Matrix)
EnbridgeD. Tersteeg
----
Remarks:
--
loamy fine sand--
No
Remarks:
Texture(e.g. clay, sand, loam)
Yes
Matrix
na
terrace Local Relief: none --
--
Color (Moist)Mottles
upland
--
A. BraschPorterIndianaw-492e1u

Page 2 of 2
Project/Site: w-492e 1u
VEGETATION (Species identified in all uppercase are non-native species.) Tree Stratum (Plot size: 10 meter radius)
% Cover Dominant Ind.Status Dominance Test Worksheet1. 80 Y FACU2. 10 N FACW (A)3. -- -- --4. -- -- -- (B)5. -- -- --6. -- -- -- (A/B)7. -- -- --8. -- -- -- Prevalence Index Worksheet9. -- -- --10. -- -- -- OBL spp. 0 x 1 = 0
90 FACW spp. 30 x 2 = 60
FAC spp. 0 x 3 = 0
FACU spp. 240 x 4 = 960
1. 60 Y FACU UPL spp. 0 x 5 = 0
2. 20 Y FACW3. -- -- -- Total 270 (A) 1020 (B)4. -- -- --5. -- -- -- Prevalence Index = B/A = 3.778
6. -- -- --7. -- -- --8. -- -- -- Hydrophytic Vegetation Indicators:9. -- -- -- Yes No Rapid Test for Hydrophytic Vegetation10. -- -- -- Yes No Dominance Test is > 50%
80 Yes No Prevalence Index is ≤ 3.0 *Yes No Morphological Adaptations (Explain) *Yes No Problem Hydrophytic Vegetation (Explain) *
1. 70 Y FACU2. 30 Y FACU3. -- -- --4. -- -- --5. -- -- --6 -- -- --7. -- -- --8. -- -- --9. -- -- -- Sapling/Shrub -
10. -- -- --11. -- -- --12. -- -- --13. -- -- --14. -- -- --15. -- -- --
100
1. -- -- --2. -- -- --3. -- -- -- Hydrophytic Vegetation Present Yes No5. -- -- --4. -- -- --
0
Additional Remarks:
* Indicators of hydric soil and wetland hydrology must be present, unless disturbed or problematic.
Woody Vine Stratum (Plot size: 10 meter radius)
Total Cover =
----
--
--
Woody plants 3 in. (7.6cm) or more in diameter at breast height (DBH), regardless of height.
Woody plants less than 3 in. DBH and greater than 3.28 ft. tall.
Total Cover =
Midwest Region
WETLAND DETERMINATION DATA FORM
--
Acer saccharumFraxinus pennsylvanica 1
5
Species Name
Total Number of Dominant Species Across All Strata:
Number of Dominant Species that are OBL, FACW, or FAC:
--
--
--
Total Cover =
Acer saccharum
--
----
Total Cover =
----
Lindera benzoin
Sapling/Shrub Stratum (Plot size: 5 meter radius)
--
Podophyllum peltatum
--
20.0%
--
Percent of Dominant Species That Are OBL, FACW, or FAC:
----
--
Trillium recurvatum
Tree -
Wetland ID:
Definitions of Vegetation Strata:
--
Herb -
Herb Stratum (Plot size: 2 meter radius)
--
All herbaceous (non-woody) plants, regardless of size, and woody plants less than 3 28 ft tall
Multiply by:
Remarks:
Sample PointLine 6B Phase 2 Replacement Project
----
--
--
-- Total % Cover of:
------
--
------
Woody Vines - All woody vines greater than 3.28 ft. in height.
--
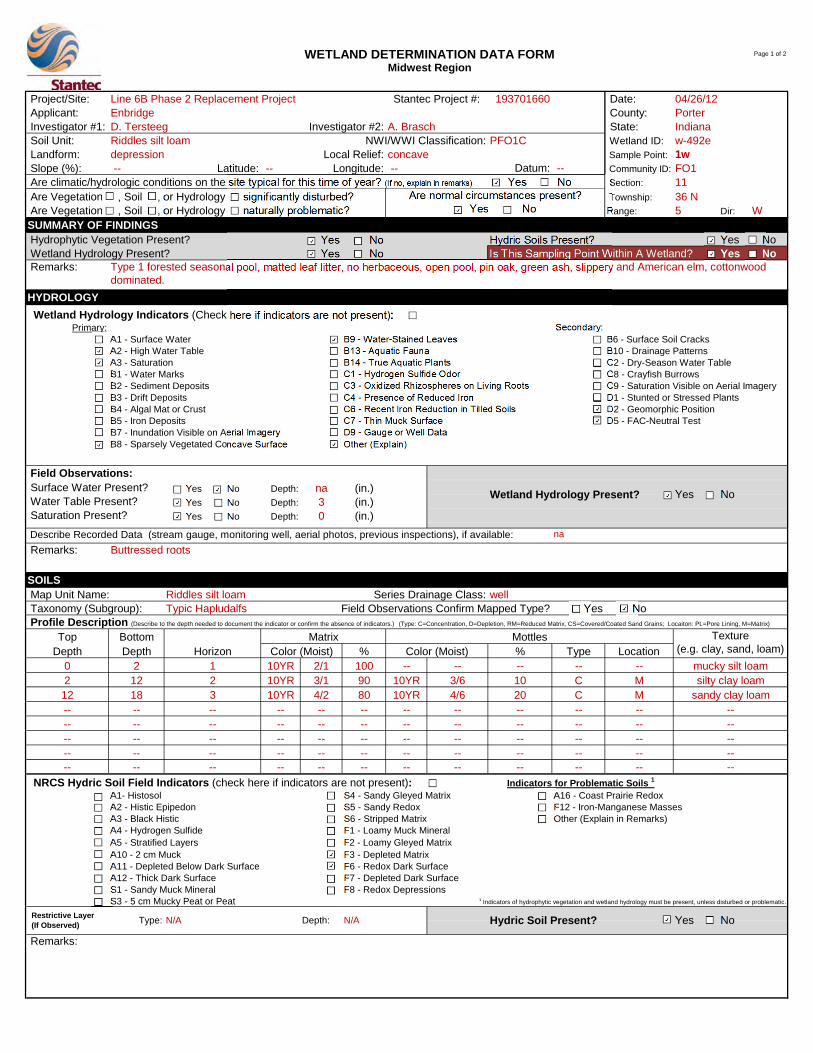
Page 1 of 2
Project/Site: Stantec Project #: 193701660 Date: Applicant: County: Investigator #1: Investigator #2: State: Soil Unit: Wetland ID: Landform: Sample Point: Slope (%): -- Latitude: -- Longitude: Datum: -- Community ID: Are climatic/hydrologic conditions on the site typical for this time of year? (If no, explain in remarks) Section: 11 Are Vegetation , Soil , or Hydrology significantly disturbed? Township: 36 N Are Vegetation , Soil , or Hydrology naturally problematic? Range: 5 Dir: WSUMMARY OF FINDINGS Hydrophytic Vegetation Present? Yes No Hydric Soils Present? Yes No Wetland Hydrology Present? Yes No Is This Sampling Point Within A Wetland? Yes No
HYDROLOGY
Wetland Hydrology Indicators (Check here if indicators are not present):Primary: Secondary:
A1 - Surface Water B9 - Water-Stained Leaves B6 - Surface Soil CracksA2 - High Water Table B13 - Aquatic Fauna B10 - Drainage PatternsA3 - Saturation B14 - True Aquatic Plants C2 - Dry-Season Water TableB1 - Water Marks C1 - Hydrogen Sulfide Odor C8 - Crayfish BurrowsB2 - Sediment Deposits C3 - Oxidized Rhizospheres on Living Roots C9 - Saturation Visible on Aerial ImageryB3 - Drift Deposits C4 - Presence of Reduced Iron D1 - Stunted or Stressed PlantsB4 - Algal Mat or Crust C6 - Recent Iron Reduction in Tilled Soils D2 - Geomorphic PositionB5 - Iron Deposits C7 - Thin Muck Surface D5 - FAC-Neutral TestB7 - Inundation Visible on Aerial Imagery D9 - Gauge or Well DataB8 - Sparsely Vegetated Concave Surface Other (Explain)
Field Observations: Surface Water Present? Yes No Depth: na (in.) Water Table Present? Yes No Depth: 3 (in.) Saturation Present? Yes No Depth: 0 (in.)
SOILS Map Unit Name: Riddles silt loam Series Drainage Class: well Taxonomy (Subgroup): Typic Hapludalfs Field Observations Confirm Mapped Type? Yes No
Top BottomDepth Depth Horizon % % Type Location
0 2 1 10YR 2/1 100 -- -- -- -- --2 12 2 10YR 3/1 90 10YR 3/6 10 C M12 18 3 10YR 4/2 80 10YR 4/6 20 C M-- -- -- -- -- -- -- -- -- -- ---- -- -- -- -- -- -- -- -- -- ---- -- -- -- -- -- -- -- -- -- ---- -- -- -- -- -- -- -- -- -- ---- -- -- -- -- -- -- -- -- -- --
NRCS Hydric Soil Field Indicators (check here if indicators are not present):A1- Histosol S4 - Sandy Gleyed Matrix A16 - Coast Prairie Redox A2 - Histic Epipedon S5 - Sandy Redox F12 - Iron-Manganese Masses A3 - Black Histic S6 - Stripped Matrix Other (Explain in Remarks)A4 - Hydrogen Sulfide F1 - Loamy Muck MineralA5 - Stratified Layers F2 - Loamy Gleyed MatrixA10 - 2 cm Muck F3 - Depleted MatrixA11 - Depleted Below Dark Surface F6 - Redox Dark SurfaceA12 - Thick Dark Surface F7 - Depleted Dark SurfaceS1 - Sandy Muck Mineral F8 - Redox DepressionsS3 - 5 cm Mucky Peat or Peat 1 Indicators of hydrophytic vegetation and wetland hydrology must be present, unless disturbed or problematic.
WETLAND DETERMINATION DATA FORMMidwest Region
Indicators for Problematic Soils 1
Yes NoAre normal circumstances present?
Yes No
Wetland Hydrology Present? Yes No
04/26/12
PFO1CRiddles silt loam
Line 6B Phase 2 Replacement Project
NWI/WWI Classification:
Describe Recorded Data (stream gauge, monitoring well, aerial photos, previous inspections), if available:
mucky silt loamColor (Moist)
Restrictive Layer (If Observed)
Remarks:
Type: N/A Depth: N/A Hydric Soil Present?
Profile Description (Describe to the depth needed to document the indicator or confirm the absence of indicators.) (Type: C=Concentration, D=Depletion, RM=Reduced Matrix, CS=Covered/Coated Sand Grains; Locaiton: PL=Pore Lining, M=Matrix)
EnbridgeD. Tersteeg
----
Remarks: Buttressed roots
--
silty clay loamsandy clay loam
No
Remarks:
Texture(e.g. clay, sand, loam)
Yes
Matrix
na
Type 1 forested seasonal pool, matted leaf litter, no herbaceous, open pool, pin oak, green ash, slippery and American elm, cottonwood dominated.
depression Local Relief: concave --
--
Color (Moist)Mottles
FO1
--
A. BraschPorterIndianaw-492e1w

Page 2 of 2
Project/Site: w-492e 1w
VEGETATION (Species identified in all uppercase are non-native species.) Tree Stratum (Plot size: 10 meter radius)
% Cover Dominant Ind.Status Dominance Test Worksheet1. 30 Y FACW2. 10 Y FACW (A)3. 10 Y FACU4. 5 N FACW (B)5. -- -- --6. -- -- -- (A/B)7. -- -- --8. -- -- -- Prevalence Index Worksheet9. -- -- --10. -- -- -- OBL spp. 0 x 1 = 0
55 FACW spp. 60 x 2 = 120
FAC spp. 0 x 3 = 0
FACU spp. 10 x 4 = 40
1. 10 Y FACW UPL spp. 0 x 5 = 0
2. 5 Y FACW3. -- -- -- Total 70 (A) 160 (B)4. -- -- --5. -- -- -- Prevalence Index = B/A = 2.286
6. -- -- --7. -- -- --8. -- -- -- Hydrophytic Vegetation Indicators:9. -- -- -- Yes No Rapid Test for Hydrophytic Vegetation10. -- -- -- Yes No Dominance Test is > 50%
15 Yes No Prevalence Index is ≤ 3.0 *Yes No Morphological Adaptations (Explain) *Yes No Problem Hydrophytic Vegetation (Explain) *
1. -- -- --2. -- -- --3. -- -- --4. -- -- --5. -- -- --6 -- -- --7. -- -- --8. -- -- --9. -- -- -- Sapling/Shrub -
10. -- -- --11. -- -- --12. -- -- --13. -- -- --14. -- -- --15. -- -- --
0
1. -- -- --2. -- -- --3. -- -- -- Hydrophytic Vegetation Present Yes No5. -- -- --4. -- -- --
0
Additional Remarks:
* Indicators of hydric soil and wetland hydrology must be present, unless disturbed or problematic.
Woody Vine Stratum (Plot size: 10 meter radius)
Total Cover =
----
--
--
Woody plants 3 in. (7.6cm) or more in diameter at breast height (DBH), regardless of height.
Woody plants less than 3 in. DBH and greater than 3.28 ft. tall.
Total Cover =
Midwest Region
WETLAND DETERMINATION DATA FORM
--
Fraxinus pennsylvanica Acer saccharinum 4
5
Species Name
Total Number of Dominant Species Across All Strata:
Number of Dominant Species that are OBL, FACW, or FAC:
--
--
--
Total Cover =
Lindera benzoin
--
Ulmus americana Acer saccharum
Total Cover =
----
Ulmus americana
Sapling/Shrub Stratum (Plot size: 5 meter radius)
--
--
--
80.0%
--
Percent of Dominant Species That Are OBL, FACW, or FAC:
----
--
--
Tree -
Wetland ID:
Definitions of Vegetation Strata:
--
Herb -
Herb Stratum (Plot size: 2 meter radius)
--
All herbaceous (non-woody) plants, regardless of size, and woody plants less than 3 28 ft tall
Multiply by:
Remarks:
Sample PointLine 6B Phase 2 Replacement Project
----
--
--
-- Total % Cover of:
------
--
------
Woody Vines - All woody vines greater than 3.28 ft. in height.
--
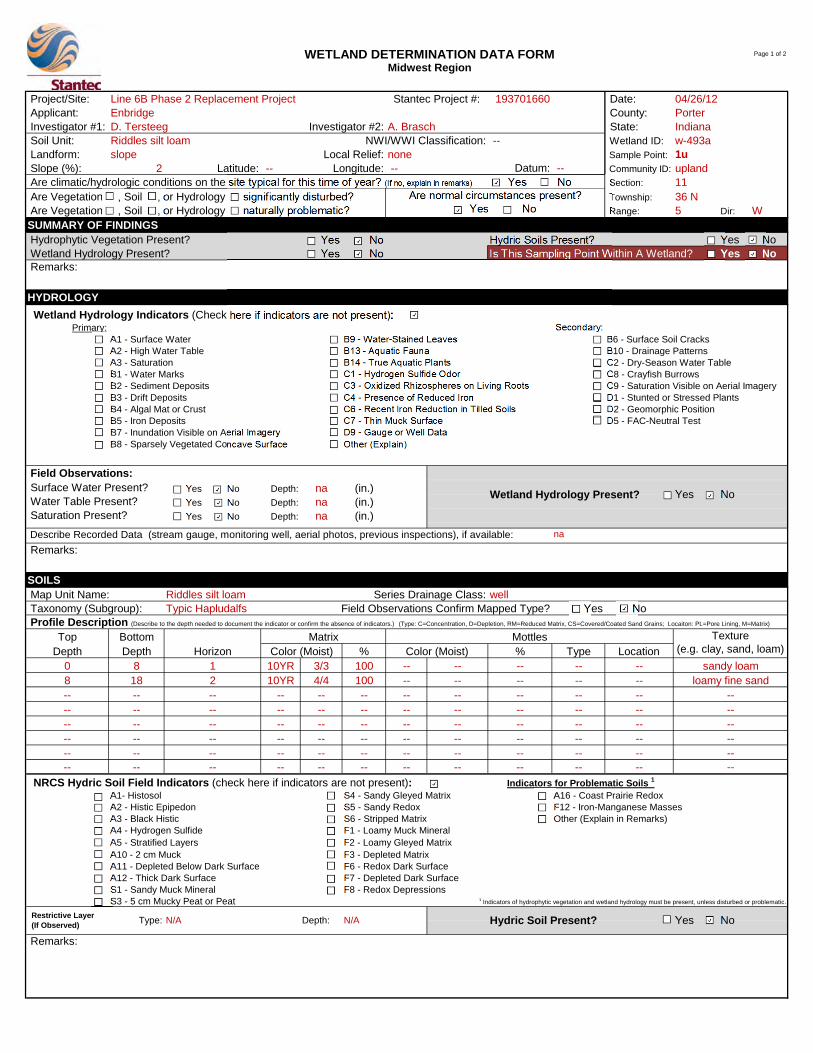
Page 1 of 2
Project/Site: Stantec Project #: 193701660 Date: Applicant: County: Investigator #1: Investigator #2: State: Soil Unit: Wetland ID: Landform: Sample Point: Slope (%): 2 Latitude: -- Longitude: Datum: -- Community ID: Are climatic/hydrologic conditions on the site typical for this time of year? (If no, explain in remarks) Section: 11 Are Vegetation , Soil , or Hydrology significantly disturbed? Township: 36 N Are Vegetation , Soil , or Hydrology naturally problematic? Range: 5 Dir: WSUMMARY OF FINDINGS Hydrophytic Vegetation Present? Yes No Hydric Soils Present? Yes No Wetland Hydrology Present? Yes No Is This Sampling Point Within A Wetland? Yes No
HYDROLOGY
Wetland Hydrology Indicators (Check here if indicators are not present):Primary: Secondary:
A1 - Surface Water B9 - Water-Stained Leaves B6 - Surface Soil CracksA2 - High Water Table B13 - Aquatic Fauna B10 - Drainage PatternsA3 - Saturation B14 - True Aquatic Plants C2 - Dry-Season Water TableB1 - Water Marks C1 - Hydrogen Sulfide Odor C8 - Crayfish BurrowsB2 - Sediment Deposits C3 - Oxidized Rhizospheres on Living Roots C9 - Saturation Visible on Aerial ImageryB3 - Drift Deposits C4 - Presence of Reduced Iron D1 - Stunted or Stressed PlantsB4 - Algal Mat or Crust C6 - Recent Iron Reduction in Tilled Soils D2 - Geomorphic PositionB5 - Iron Deposits C7 - Thin Muck Surface D5 - FAC-Neutral TestB7 - Inundation Visible on Aerial Imagery D9 - Gauge or Well DataB8 - Sparsely Vegetated Concave Surface Other (Explain)
Field Observations: Surface Water Present? Yes No Depth: na (in.) Water Table Present? Yes No Depth: na (in.) Saturation Present? Yes No Depth: na (in.)
SOILS Map Unit Name: Riddles silt loam Series Drainage Class: well Taxonomy (Subgroup): Typic Hapludalfs Field Observations Confirm Mapped Type? Yes No
Top BottomDepth Depth Horizon % % Type Location
0 8 1 10YR 3/3 100 -- -- -- -- --8 18 2 10YR 4/4 100 -- -- -- -- ---- -- -- -- -- -- -- -- -- -- ---- -- -- -- -- -- -- -- -- -- ---- -- -- -- -- -- -- -- -- -- ---- -- -- -- -- -- -- -- -- -- ---- -- -- -- -- -- -- -- -- -- ---- -- -- -- -- -- -- -- -- -- --
NRCS Hydric Soil Field Indicators (check here if indicators are not present):A1- Histosol S4 - Sandy Gleyed Matrix A16 - Coast Prairie Redox A2 - Histic Epipedon S5 - Sandy Redox F12 - Iron-Manganese Masses A3 - Black Histic S6 - Stripped Matrix Other (Explain in Remarks)A4 - Hydrogen Sulfide F1 - Loamy Muck MineralA5 - Stratified Layers F2 - Loamy Gleyed MatrixA10 - 2 cm Muck F3 - Depleted MatrixA11 - Depleted Below Dark Surface F6 - Redox Dark SurfaceA12 - Thick Dark Surface F7 - Depleted Dark SurfaceS1 - Sandy Muck Mineral F8 - Redox DepressionsS3 - 5 cm Mucky Peat or Peat 1 Indicators of hydrophytic vegetation and wetland hydrology must be present, unless disturbed or problematic.
WETLAND DETERMINATION DATA FORMMidwest Region
Indicators for Problematic Soils 1
Yes NoAre normal circumstances present?
Yes No
Wetland Hydrology Present? Yes No
04/26/12
--Riddles silt loam
Line 6B Phase 2 Replacement Project
NWI/WWI Classification:
Describe Recorded Data (stream gauge, monitoring well, aerial photos, previous inspections), if available:
sandy loamColor (Moist)
Restrictive Layer (If Observed)
Remarks:
Type: N/A Depth: N/A Hydric Soil Present?
Profile Description (Describe to the depth needed to document the indicator or confirm the absence of indicators.) (Type: C=Concentration, D=Depletion, RM=Reduced Matrix, CS=Covered/Coated Sand Grains; Locaiton: PL=Pore Lining, M=Matrix)
EnbridgeD. Tersteeg
----
Remarks:
--
loamy fine sand--
No
Remarks:
Texture(e.g. clay, sand, loam)
Yes
Matrix
na
slope Local Relief: none --
--
Color (Moist)Mottles
upland
--
A. BraschPorterIndianaw-493a1u

Page 2 of 2
Project/Site: w-493a 1u
VEGETATION (Species identified in all uppercase are non-native species.) Tree Stratum (Plot size: 10 meter radius)
% Cover Dominant Ind.Status Dominance Test Worksheet1. 20 Y FACU2. 10 Y FACW (A)3. 10 Y FACU4. -- -- -- (B)5. -- -- --6. -- -- -- (A/B)7. -- -- --8. -- -- -- Prevalence Index Worksheet9. -- -- --10. -- -- -- OBL spp. 0 x 1 = 0
40 FACW spp. 30 x 2 = 60
FAC spp. 0 x 3 = 0
FACU spp. 100 x 4 = 400
1. 20 Y FACW UPL spp. 0 x 5 = 0
2. 10 Y FACU3. 10 Y FACU Total 130 (A) 460 (B)4. -- -- --5. -- -- -- Prevalence Index = B/A = 3.538
6. -- -- --7. -- -- --8. -- -- -- Hydrophytic Vegetation Indicators:9. -- -- -- Yes No Rapid Test for Hydrophytic Vegetation10. -- -- -- Yes No Dominance Test is > 50%
40 Yes No Prevalence Index is ≤ 3.0 *Yes No Morphological Adaptations (Explain) *Yes No Problem Hydrophytic Vegetation (Explain) *
1. 50 Y FACU2. -- -- --3. -- -- --4. -- -- --5. -- -- --6 -- -- --7. -- -- --8. -- -- --9. -- -- -- Sapling/Shrub -
10. -- -- --11. -- -- --12. -- -- --13. -- -- --14. -- -- --15. -- -- --
50
1. -- -- --2. -- -- --3. -- -- -- Hydrophytic Vegetation Present Yes No5. -- -- --4. -- -- --
0
Additional Remarks:
* Indicators of hydric soil and wetland hydrology must be present, unless disturbed or problematic.
Woody Vine Stratum (Plot size: 10 meter radius)
Total Cover =
----
--
--
Woody plants 3 in. (7.6cm) or more in diameter at breast height (DBH), regardless of height.
Woody plants less than 3 in. DBH and greater than 3.28 ft. tall.
Total Cover =
Midwest Region
WETLAND DETERMINATION DATA FORM
--
Quercus rubra Acer saccharinum 2
7
Species Name
Total Number of Dominant Species Across All Strata:
Number of Dominant Species that are OBL, FACW, or FAC:
--
--
--
Total Cover =
Lindear benzoin
Liriodendron tulipifera
--Liriodendron tulipifera
Total Cover =
----
Prunus serotina
Sapling/Shrub Stratum (Plot size: 5 meter radius)
--
Podophyllum peltatum
--
28.6%
--
Percent of Dominant Species That Are OBL, FACW, or FAC:
----
--
--
Tree -
Wetland ID:
Definitions of Vegetation Strata:
--
Herb -
Herb Stratum (Plot size: 2 meter radius)
--
All herbaceous (non-woody) plants, regardless of size, and woody plants less than 3 28 ft tall
Multiply by:
Remarks:
Sample PointLine 6B Phase 2 Replacement Project
----
--
--
-- Total % Cover of:
------
--
------
Woody Vines - All woody vines greater than 3.28 ft. in height.
--

Page 1 of 2
Project/Site: Stantec Project #: 193701660 Date: Applicant: County: Investigator #1: Investigator #2: State: Soil Unit: Wetland ID: Landform: Sample Point: Slope (%): 0 Latitude: -- Longitude: Datum: -- Community ID: Are climatic/hydrologic conditions on the site typical for this time of year? (If no, explain in remarks) Section: 11 Are Vegetation , Soil , or Hydrology significantly disturbed? Township: 36 N Are Vegetation , Soil , or Hydrology naturally problematic? Range: 5 Dir: WSUMMARY OF FINDINGS Hydrophytic Vegetation Present? Yes No Hydric Soils Present? Yes No Wetland Hydrology Present? Yes No Is This Sampling Point Within A Wetland? Yes No
HYDROLOGY
Wetland Hydrology Indicators (Check here if indicators are not present):Primary: Secondary:
A1 - Surface Water B9 - Water-Stained Leaves B6 - Surface Soil CracksA2 - High Water Table B13 - Aquatic Fauna B10 - Drainage PatternsA3 - Saturation B14 - True Aquatic Plants C2 - Dry-Season Water TableB1 - Water Marks C1 - Hydrogen Sulfide Odor C8 - Crayfish BurrowsB2 - Sediment Deposits C3 - Oxidized Rhizospheres on Living Roots C9 - Saturation Visible on Aerial ImageryB3 - Drift Deposits C4 - Presence of Reduced Iron D1 - Stunted or Stressed PlantsB4 - Algal Mat or Crust C6 - Recent Iron Reduction in Tilled Soils D2 - Geomorphic PositionB5 - Iron Deposits C7 - Thin Muck Surface D5 - FAC-Neutral TestB7 - Inundation Visible on Aerial Imagery D9 - Gauge or Well DataB8 - Sparsely Vegetated Concave Surface Other (Explain)
Field Observations: Surface Water Present? Yes No Depth: 1 (in.) Water Table Present? Yes No Depth: 0 (in.) Saturation Present? Yes No Depth: 0 (in.)
SOILS Map Unit Name: Riddles silt loam Series Drainage Class: well Taxonomy (Subgroup): Typic Hapludalfs Field Observations Confirm Mapped Type? Yes No
Top BottomDepth Depth Horizon % % Type Location
0 3 1 10YR 2/1 100 -- -- -- -- --3 10 2 10YR 3/2 90 10YR 3/6 10 C M10 18 3 10YR 4/2 80 10YR 4/6 20 C M-- -- -- -- -- -- -- -- -- -- ---- -- -- -- -- -- -- -- -- -- ---- -- -- -- -- -- -- -- -- -- ---- -- -- -- -- -- -- -- -- -- ---- -- -- -- -- -- -- -- -- -- --
NRCS Hydric Soil Field Indicators (check here if indicators are not present):A1- Histosol S4 - Sandy Gleyed Matrix A16 - Coast Prairie Redox A2 - Histic Epipedon S5 - Sandy Redox F12 - Iron-Manganese Masses A3 - Black Histic S6 - Stripped Matrix Other (Explain in Remarks)A4 - Hydrogen Sulfide F1 - Loamy Muck MineralA5 - Stratified Layers F2 - Loamy Gleyed MatrixA10 - 2 cm Muck F3 - Depleted MatrixA11 - Depleted Below Dark Surface F6 - Redox Dark SurfaceA12 - Thick Dark Surface F7 - Depleted Dark SurfaceS1 - Sandy Muck Mineral F8 - Redox DepressionsS3 - 5 cm Mucky Peat or Peat 1 Indicators of hydrophytic vegetation and wetland hydrology must be present, unless disturbed or problematic.
WETLAND DETERMINATION DATA FORMMidwest Region
Indicators for Problematic Soils 1
Yes NoAre normal circumstances present?
Yes No
Wetland Hydrology Present? Yes No
04/26/12
--Riddles silt loam
Line 6B Phase 2 Replacement Project
NWI/WWI Classification:
Describe Recorded Data (stream gauge, monitoring well, aerial photos, previous inspections), if available:
mucky silt loamColor (Moist)
Restrictive Layer (If Observed)
Remarks:
Type: N/A Depth: N/A Hydric Soil Present?
Profile Description (Describe to the depth needed to document the indicator or confirm the absence of indicators.) (Type: C=Concentration, D=Depletion, RM=Reduced Matrix, CS=Covered/Coated Sand Grains; Locaiton: PL=Pore Lining, M=Matrix)
EnbridgeD. Tersteeg
----
Remarks: buttressed roots
--
silty loamsilty clay loam
No
Remarks:
Texture(e.g. clay, sand, loam)
Yes
Matrix
na
Type 6/7 forested wetland with shrub scrub center. Silver maple dominated and spicebush / buttonbush dominated open water center.
depression Local Relief: concave --
--
Color (Moist)Mottles
FO1/SS1
--
A. BraschPorterIndianaw-493a1w

Page 2 of 2
Project/Site: w-493a 1w
VEGETATION (Species identified in all uppercase are non-native species.) Tree Stratum (Plot size: 10 meter radius)
% Cover Dominant Ind.Status Dominance Test Worksheet1. 60 Y FACW2. -- -- -- (A)3. -- -- --4. -- -- -- (B)5. -- -- --6. -- -- -- (A/B)7. -- -- --8. -- -- -- Prevalence Index Worksheet9. -- -- --10. -- -- -- OBL spp. 10 x 1 = 10
60 FACW spp. 110 x 2 = 220
FAC spp. 0 x 3 = 0
FACU spp. 5 x 4 = 20
1. 20 Y FACW UPL spp. 0 x 5 = 0
2. 10 Y FACW3. 5 N FACU Total 125 (A) 250 (B)4. -- -- --5. -- -- -- Prevalence Index = B/A = 2.000
6. -- -- --7. -- -- --8. -- -- -- Hydrophytic Vegetation Indicators:9. -- -- -- Yes No Rapid Test for Hydrophytic Vegetation10. -- -- -- Yes No Dominance Test is > 50%
35 Yes No Prevalence Index is ≤ 3.0 *Yes No Morphological Adaptations (Explain) *Yes No Problem Hydrophytic Vegetation (Explain) *
1. 10 Y OBL2. 20 Y FACW3. -- -- --4. -- -- --5. -- -- --6 -- -- --7. -- -- --8. -- -- --9. -- -- -- Sapling/Shrub -
10. -- -- --11. -- -- --12. -- -- --13. -- -- --14. -- -- --15. -- -- --
30
1. -- -- --2. -- -- --3. -- -- -- Hydrophytic Vegetation Present Yes No5. -- -- --4. -- -- --
0
Additional Remarks:
* Indicators of hydric soil and wetland hydrology must be present, unless disturbed or problematic.
Woody Vine Stratum (Plot size: 10 meter radius)
Total Cover =
----
--
--
Woody plants 3 in. (7.6cm) or more in diameter at breast height (DBH), regardless of height.
Woody plants less than 3 in. DBH and greater than 3.28 ft. tall.
Total Cover =
Midwest Region
WETLAND DETERMINATION DATA FORM
--
Acer saccharinum -- 5
5
Species Name
Total Number of Dominant Species Across All Strata:
Number of Dominant Species that are OBL, FACW, or FAC:
--
--
--
Total Cover =
Lindera benzoin
Prunus serotina
----
Total Cover =
----
Fraxinus pennsylvanica
Sapling/Shrub Stratum (Plot size: 5 meter radius)
--
Carex vulpinoidea
--
100.0%
--
Percent of Dominant Species That Are OBL, FACW, or FAC:
----
--
Impatiens capensis
Tree -
Wetland ID:
Definitions of Vegetation Strata:
--
Herb -
Herb Stratum (Plot size: 2 meter radius)
--
All herbaceous (non-woody) plants, regardless of size, and woody plants less than 3 28 ft tall
Multiply by:
Remarks:
Sample PointLine 6B Phase 2 Replacement Project
----
--
--
-- Total % Cover of:
------
--
------
Woody Vines - All woody vines greater than 3.28 ft. in height.
--

Page 1 of 2
Project/Site: Stantec Project #: 193701660 Date: Applicant: County: Investigator #1: Investigator #2: State: Soil Unit: Wetland ID: Landform: Sample Point: Slope (%): 2 Latitude: -- Longitude: Datum: -- Community ID: Are climatic/hydrologic conditions on the site typical for this time of year? (If no, explain in remarks) Section: 11 Are Vegetation , Soil , or Hydrology significantly disturbed? Township: 36 N Are Vegetation , Soil , or Hydrology naturally problematic? Range: 5 Dir: WSUMMARY OF FINDINGS Hydrophytic Vegetation Present? Yes No Hydric Soils Present? Yes No Wetland Hydrology Present? Yes No Is This Sampling Point Within A Wetland? Yes No
HYDROLOGY
Wetland Hydrology Indicators (Check here if indicators are not present):Primary: Secondary:
A1 - Surface Water B9 - Water-Stained Leaves B6 - Surface Soil CracksA2 - High Water Table B13 - Aquatic Fauna B10 - Drainage PatternsA3 - Saturation B14 - True Aquatic Plants C2 - Dry-Season Water TableB1 - Water Marks C1 - Hydrogen Sulfide Odor C8 - Crayfish BurrowsB2 - Sediment Deposits C3 - Oxidized Rhizospheres on Living Roots C9 - Saturation Visible on Aerial ImageryB3 - Drift Deposits C4 - Presence of Reduced Iron D1 - Stunted or Stressed PlantsB4 - Algal Mat or Crust C6 - Recent Iron Reduction in Tilled Soils D2 - Geomorphic PositionB5 - Iron Deposits C7 - Thin Muck Surface D5 - FAC-Neutral TestB7 - Inundation Visible on Aerial Imagery D9 - Gauge or Well DataB8 - Sparsely Vegetated Concave Surface Other (Explain)
Field Observations: Surface Water Present? Yes No Depth: na (in.) Water Table Present? Yes No Depth: na (in.) Saturation Present? Yes No Depth: na (in.)
SOILS Map Unit Name: Haskins loam Series Drainage Class: somewhat poorly Taxonomy (Subgroup): Aeric Epiaqualfs Field Observations Confirm Mapped Type? Yes No
Top BottomDepth Depth Horizon % % Type Location
0 12 1 10YR 3/3 100 -- -- -- -- --12 18 2 10YR 2/1 100 -- -- -- -- ---- -- -- -- -- -- -- -- -- -- ---- -- -- -- -- -- -- -- -- -- ---- -- -- -- -- -- -- -- -- -- ---- -- -- -- -- -- -- -- -- -- ---- -- -- -- -- -- -- -- -- -- ---- -- -- -- -- -- -- -- -- -- --
NRCS Hydric Soil Field Indicators (check here if indicators are not present):A1- Histosol S4 - Sandy Gleyed Matrix A16 - Coast Prairie Redox A2 - Histic Epipedon S5 - Sandy Redox F12 - Iron-Manganese Masses A3 - Black Histic S6 - Stripped Matrix Other (Explain in Remarks)A4 - Hydrogen Sulfide F1 - Loamy Muck MineralA5 - Stratified Layers F2 - Loamy Gleyed MatrixA10 - 2 cm Muck F3 - Depleted MatrixA11 - Depleted Below Dark Surface F6 - Redox Dark SurfaceA12 - Thick Dark Surface F7 - Depleted Dark SurfaceS1 - Sandy Muck Mineral F8 - Redox DepressionsS3 - 5 cm Mucky Peat or Peat 1 Indicators of hydrophytic vegetation and wetland hydrology must be present, unless disturbed or problematic.
WETLAND DETERMINATION DATA FORMMidwest Region
Indicators for Problematic Soils 1
Yes NoAre normal circumstances present?
Yes No
Wetland Hydrology Present? Yes No
04/26/12
--Haskins loam
Line 6B Phase 2 Replacement Project
NWI/WWI Classification:
Describe Recorded Data (stream gauge, monitoring well, aerial photos, previous inspections), if available:
clay loamColor (Moist)
Restrictive Layer (If Observed)
Remarks:
Type: N/A Depth: N/A Hydric Soil Present?
Profile Description (Describe to the depth needed to document the indicator or confirm the absence of indicators.) (Type: C=Concentration, D=Depletion, RM=Reduced Matrix, CS=Covered/Coated Sand Grains; Locaiton: PL=Pore Lining, M=Matrix)
EnbridgeD. Tersteeg
----
Remarks:
--
clay loam--
No
Buried A horizon Remarks:
Texture(e.g. clay, sand, loam)
Yes
Matrix
na
Cultivated agricultural field, no vegetation.
slope Local Relief: none --
--
Color (Moist)Mottles
upland
--
A. BraschPorterIndianaw-493c1u

Page 2 of 2
Project/Site: w-493c 1u
VEGETATION (Species identified in all uppercase are non-native species.) Tree Stratum (Plot size: 10 meter radius)
% Cover Dominant Ind.Status Dominance Test Worksheet1. -- -- --2. -- -- -- (A)3. -- -- --4. -- -- -- (B)5. -- -- --6. -- -- -- (A/B)7. -- -- --8. -- -- -- Prevalence Index Worksheet9. -- -- --10. -- -- -- OBL spp. 0 x 1 = 0
0 FACW spp. 0 x 2 = 0
FAC spp. 0 x 3 = 0
FACU spp. 0 x 4 = 0
1. -- -- -- UPL spp. 0 x 5 = 0
2. -- -- --3. -- -- -- Total 0 (A) 0 (B)4. -- -- --5. -- -- -- Prevalence Index = B/A = NA
6. -- -- --7. -- -- --8. -- -- -- Hydrophytic Vegetation Indicators:9. -- -- -- Yes No Rapid Test for Hydrophytic Vegetation10. -- -- -- Yes No Dominance Test is > 50%
0 Yes No Prevalence Index is ≤ 3.0 *Yes No Morphological Adaptations (Explain) *Yes No Problem Hydrophytic Vegetation (Explain) *
1. -- -- --2. -- -- --3. -- -- --4. -- -- --5. -- -- --6 -- -- --7. -- -- --8. -- -- --9. -- -- -- Sapling/Shrub -
10. -- -- --11. -- -- --12. -- -- --13. -- -- --14. -- -- --15. -- -- --
0
1. -- -- --2. -- -- --3. -- -- -- Hydrophytic Vegetation Present Yes No5. -- -- --4. -- -- --
0
Additional Remarks:
* Indicators of hydric soil and wetland hydrology must be present, unless disturbed or problematic.
Woody Vine Stratum (Plot size: 10 meter radius)
Total Cover =
----
--
No vegetation, agricultural field.
--
Woody plants 3 in. (7.6cm) or more in diameter at breast height (DBH), regardless of height.
Woody plants less than 3 in. DBH and greater than 3.28 ft. tall.
Total Cover =
Midwest Region
WETLAND DETERMINATION DATA FORM
--
---- 0
0
Species Name
Total Number of Dominant Species Across All Strata:
Number of Dominant Species that are OBL, FACW, or FAC:
--
--
--
Total Cover =
--
--
----
Total Cover =
----
--
Sapling/Shrub Stratum (Plot size: 5 meter radius)
--
--
--
NA
--
Percent of Dominant Species That Are OBL, FACW, or FAC:
----
--
--
Tree -
Wetland ID:
Definitions of Vegetation Strata:
--
Herb -
Herb Stratum (Plot size: 2 meter radius)
--
All herbaceous (non-woody) plants, regardless of size, and woody plants less than 3 28 ft tall
Multiply by:
Remarks:
Sample PointLine 6B Phase 2 Replacement Project
----
--
--
-- Total % Cover of:
------
--
------
Woody Vines - All woody vines greater than 3.28 ft. in height.
--