wetland conservation in sri lanka : proceedings of the national
TRANSCRIPT

i
Wetland Conservationin Sri Lanka
Proceedings of the National Symposiumon Wetland Conservation and Management
June 19th and 20th, 2003
IUCN - The World Conservation UnionSri Lanka Country Office
53, Horton Place, Colombo 7
This publication has been prepared by IUCN Sri Lankawith financial assistance from the Royal Netherlands Government
ii
Published by: IUCN, Sri Lanka
Copyright: © 2004, International Union for Conservation of Nature and NaturalResources
Reproduction of this publication for educational or other non-commercialpurposes is authorized without prior written permission from the copyrightholder provided the source is fully acknowledged.
Reproduction of this publication for resale or other commercial purposesis prohibited without prior written permission of the copyright holder.
Citation: IUCN Sri Lanka. 2004. Wetland Conservation in Sri Lanka. Proceedingsof the National Symposium on Wetland Conservation and Management:Sri Lanka; iii+75pp.
ISBN: 955-8177-33-4
Cover photographs: Clockwise from top left;1. Anawilundawa Wildlife Sanctuary - Roshan Rodrigo2. Black-tailed Godwit (Limosa limosa) - Sanjiv De Silva3. Gillnet fishing in Anawilundawa Wildlife Sanctuary - Roshan Rodrigo4. ‘Nil Manel’ (Nymphaea nouchali) - Daniel Chirpich
Produced by: IUCN Sri Lanka
Printed by: Karunaratne & Sons67, UDA Industrial EstateKatuwana RoadHomagama
Available from: IUCN Sri Lanka53, Horton Place. Colombo 7,Sri Lanka.
iii
Contents
Introduction 1
Wetland Conservation and Management in Sri Lanka : A Status Paper 2
J. C. J. Van Zon
Freshwater Wetlands in Sri Lanka : Their Conservation Significance and Current Status 19
C. N. B. Bambaradeniya
The Status of Reef Habitats in Sri Lanka and Management Issues 25
A. Rajasuriya, E. N. R. Perera
Current Status of Mangrove and Other Coastal Wetlands in Sri Lanka 32M. D. Amarasinghe
Application of Economic Tools for Policy Developments in Wetland Management (Abstract) 37
H. M. Gunathilake
Special Area Management (SAM) Process in the Management of Wetlands (Abstract) 39
H. J. M. Wickremeratne
The Significance of Biodiversity Assessments for Conservation and 41Management of Wetlands (Abstract)
C. N. B. Bambaradeniya
Socio-Economic and Policy Issues Influencing the Sustainability of Livelihoods in 44Rural Coastal Wetland Areas in Sri Lanka
S. Senaratna Sellamuttu, A. Clemett
Valuing Asia’s Wetlands 58
L. A. Emerton
Counting the Costs of Urban Wetland Reclamation : The Case of Muthurajawela (Abstract) 67
L. A. Emerton
Recommendations 74

1
PROCEEDINGS OF THE NATIONAL SYMPOSIUM ONWETLAND CONSERVATION AND MANAGEMENT
Introduction
Wetlands are among the most productive ecosystems in the world. They play an important role serving asflood retention areas; as filters for sediments, nutrients and pollutants released to the environment; asrefuges for many species of vertebrates and invertebrates; and as sources of raw material for variousindustries. In addition, wetlands have played an important role in the culture of many communities andcountries.
Wetlands are an integral part of Sri Lanka’s unique ecological and biological diversity, and are vitalhabitats for a large variety of fauna and flora. However, many wetland ecosystems in Sri Lanka are beingindiscriminately exploited at an alarming rate, for commercial, agricultural, residential and industrialpurposes, and for dumping garbage and waste. Although the proper management of these ecosystems isvital and urgent, it is a difficult task due largely to the lack of specific legislation and a single responsibleagency. ‘Caring for the Environment’ path to sustainable development - the National Environmental ActionPlan 2003-2007 developed recently has recognized these as severe constraints in wetland conservation andmanagement.
The first-ever national level dialogue on Wetland Conservation and Management in Sri Lanka wasorganized jointly by IUCN - The World Conservation Union and the Integrated Resource ManagementProject (IRMP) of the Central Environmenteal Authority. The symposium was held on the 19th and 20th ofJune 2003 at the Bandaranaike Memorial International Conference Hall (BMICH). The participantsincluded researchers and high-level decision-makers from state agencies and NGO’s, the donor communityand multilateral financial agencies.
The event provided an opportunity to share lessons learnt, over the past years, in wetland conservation andmanagement at the national level. It also brought together stakeholders working on wetland related issuesin the country in order to examine the current trends in wetland management and to devise more effectivemeasures for the future. As a result, greater attention has been directed, at the policy level, towards theconservation of wetlands. The National Wetlands Steering Committee was reviewed in 2003 by theMinistry of Environment and Natural Resources and a national policy on wetlands has since been draftedand approved to strengthen the institutional and legal framework for wetland conservation in the country.
Abstracts of some of the presentations made at the symposium, and the symposium’s recommendations forthe conservation and management of wetlands in Sri Lanka, are presented in this report. These are precededby several papers, which provide a concise, yet informative overview of the status of wetland ecosystemsand wetland habitats in Sri Lanka, and policy issues relating to their conservation and management. It ishoped that this report will be an informative, and practically applicable resource document for everyoneinterested in the conservation and management of Sri Lanka’s wetlands.
2
WETLAND CONSERVATION AND MANAGEMENT INSRI LANKA : A STATUS PAPER
Prepared for IUCN - The World Conservation Union by
J. C. J. Van Zon1
1. Introduction and Purpose
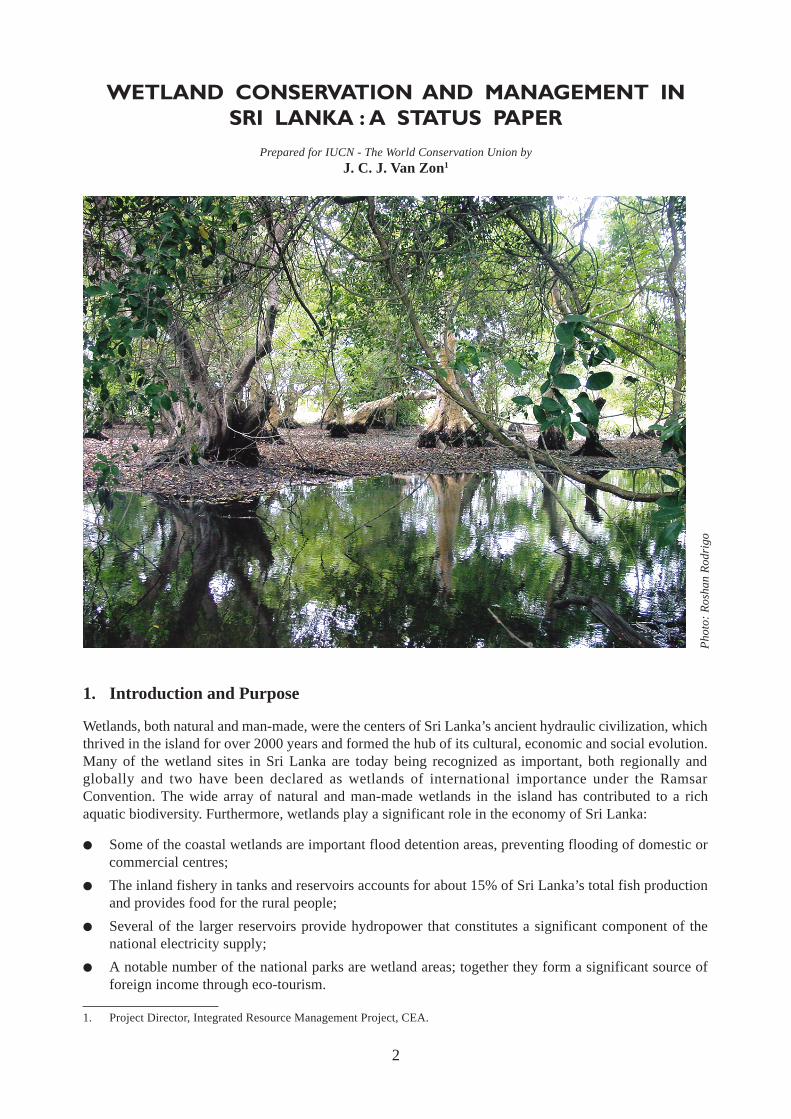
Wetlands, both natural and man-made, were the centers of Sri Lanka’s ancient hydraulic civilization, whichthrived in the island for over 2000 years and formed the hub of its cultural, economic and social evolution.Many of the wetland sites in Sri Lanka are today being recognized as important, both regionally andglobally and two have been declared as wetlands of international importance under the RamsarConvention. The wide array of natural and man-made wetlands in the island has contributed to a richaquatic biodiversity. Furthermore, wetlands play a significant role in the economy of Sri Lanka:
● Some of the coastal wetlands are important flood detention areas, preventing flooding of domestic orcommercial centres;
● The inland fishery in tanks and reservoirs accounts for about 15% of Sri Lanka’s total fish productionand provides food for the rural people;
● Several of the larger reservoirs provide hydropower that constitutes a significant component of thenational electricity supply;
● A notable number of the national parks are wetland areas; together they form a significant source offoreign income through eco-tourism.
Ph
oto
: R
osh
an
Ro
dri
go
1. Project Director, Integrated Resource Management Project, CEA.

3
At present, a majority of the wetlands in Sri Lanka are adversely affected by human activities, includingreclamation, waste disposal, pollution due to effluent discharge, clearing of natural vegetation in andaround wetlands and the spread of invasive exotic species. The threats faced by the wetlands has beenreviewed in various recent publications, such as “Wetlands are no wastelands” (CEA, 1995) and“Wetlands: Water, Life and Culture” (IUCN, 2002).
During the last 15 years, Sri Lankan authorities have increasingly recognized the importance of wetlandsand their management. The present paper has been prepared by IUCN at the request of the NationalWetlands Steering Committee, a Cabinet appointed body with a mandate to oversee and co-ordinate allwetland conservation and management efforts undertaken in the country. This paper summarizes theworldwide significance of wetlands, the Sri Lankan situation with respect to wetlands, steps taken forwetland conservation and management in the country and the difficulties experienced. It also describes thecurrent status of wetland conservation and management and identifies challenges for the future.
2. Worldwide Significance of Wetlands
Wetlands, as defined by the Ramsar Convention on Wetlands (Ramsar, 1971) include a wide range offreshwater, brackish and saline ecosystems, according to the following definition:
“Wetlands are areas of marsh, fen, peatland or water, whether natural or artificial, permanent ortemporary, with water that is static or flowing, fresh, brackish or salt, including areas of marine water,the depth of which at low tides does not exceed six meters”
Wetlands are amongst the most productive ecosystems in the world, which have for thousands of yearssupplied human communities with food, drinking water, building materials and countless other benefits.They also play a critical role in maintaining global biodiversity; partly through their rich productivity,which helps to support food chains, and partly through provision of habitats for specially adapted plant andanimal species. It is estimated that about 25% of species threatened with extinction are associated withfreshwater ecosystems.
Managing wetlands in a sustainable manner and avoiding the loss of wetland area, or - even moreimportantly - the loss of wetland functions, is increasingly being recognized worldwide as an essentialcomponent of strategies to tackle three of the major environmental challenges of the 21st century:
● The global freshwater crisis;
● Global climate change; and
● Loss of global biodiversity.
Under natural conditions, wetlands are an integral part of the hydrological cycle, in which they play crucialroles such as storage of water, the recharge of underground aquifers, and the trapping of sediments andnutrients. Human communities benefit from the storage capacity of wetlands, which can help slow downthe runoff of storm water and therefore avoid serious flooding that would otherwise cost lives and causedamage to properties and crops. To some extent, wetlands are also able to regulate the quality of drinkingwater by removing the sediments, excess nutrients and toxic substances which enter water courses as aresult of human activities (e.g. runoff with residues of fertilizers and pesticides, sewage, or industrialwaste).
In low-lying coastal regions and in the floodplains of major rivers, maintaining wetland areas can help tobuffer some of the adverse effects associated with global climate change, including sea level rise andincreased flooding. In other parts of the world (including Sri Lanka’s dry zone), it is predicted that climatechange will lead to accelerated desertification. In these regions, wetlands are already likely to be scarce,thereby making their relative value even more significant.

4
The sustainable management of wetlands presents special challenges that are very different to thoseencountered when dealing with other ecosystem types such as forests or grasslands. To begin with, water -the lifeblood of wetlands - is constantly moving, whether as surface or underground flow, or throughrainfall and evaporation. This means that wetlands cannot be managed effectively if they are treated inisolation from the surrounding areas. In recent years, more and more attention has been given to applyingthe principles of Integrated River Basin Management (IRBM). This approach takes a whole river systemand its catchments as a fundamental management and planning unit, thereby enabling decision-makers toassess the likely consequences either upstream or downstream of any proposed changes in land or wateruse. This can help to guide development so as to conserve water supplies and to reduce the risk of severeflooding, whilst protecting fisheries and important wildlife habitats.
3. The Convention on Wetlands
The Convention of Wetlands (Ramsar, Iran 1971) provides the global, intergovernmental framework forwetland conservation and management. By September 2001 there were 128 Contracting Parties (includingSri Lanka, since 22 June 1990) from all regions of the world. The Ramsar mission is “the conservation andwise use of wetlands by national action and international cooperation as a means to achieving sustainabledevelopment throughout the world”. Contracting Parties accept obligations to promote ‘wise use’ of allwetlands in their territory and to take special conservation measures for sites they designate for inclusionin the Ramsar List of Wetlands of International Importance (Ramsar sites). In Sri Lanka these include theBundala National Park and the Annaiwilundawa Tanks. To assist Contracting Parties with managementimplementation the Convention Bureau has published a series of Guidelines, e.g. dealing with:
● Implementation of the wise use concept;
● Management planning for Ramsar sites and other wetlands;
● Developing and implementing National Wetlands Policies (a key mechanism for delivering wise use);
● International cooperation under the Ramsar Convention;
● Reviewing laws and institutions to promote the conservation and wise use of wetlands;
● Integrating wetland conservation and wise use into river basin management;
● Wetland Risk Assessment Framework.
The Ramsar Convention cooperates closely with other international agreements, including the Conventionon Biological Diversity (CBD), the Bonn Convention on Migratory Species, the Africa Eurasia WaterbirdAgreement and the Framework Convention on Climate Change. In partnership with CBD, Ramsar hasrecently established the River Basin Initiative on integrating biological diversity with wetland and riverbasin management. In addition, the World Water Council, organizers of the 3rd World Water Forum, andUNESCO, convenor of the World Water Assessment Programme, are useful information focal points.International instruments are also an essential resource and enabling framework for wetland actions, forexample the World Bank Environmental Strategy and the Poverty Reduction Strategy Papers.
4. Asian Wetlands
In response to the Ramsar Convention and to the increased human pressure imposed on wetlandecosystems, considerable attention emerged in recent decades for promotion of wetland conservation inAsia in general, and in Sri Lanka in particular. A number of international organizations together carried outpreliminary investigations into the importance of Asian wetlands, including the Asian Wetland Bureau(now Wetlands International), the World Wide Fund for Nature (WWF), IUCN - The World ConservationUnion, the International Council for Bird Preservation (ICPB) and the International Waterfowl andWetlands Research Bureau. In 1989 these investigations resulted in two joint publications: “A StatusOverview of Asian Wetlands” and the “Directory of Asian Wetlands”. These publications listed Asian
5
wetlands of international importance using criteria set by Article 2 of the Ramsar Convention and adoptedby the Conference of Parties to the Convention in Regina, Canada, in June 1987. These criteria focus onthe significance of wetlands for bird migration and for conservation of biodiversity. The publications werelargely based on existing information, and included descriptions of the status of the concerned wetlandsand of threats to their sustainability.
The Directory listed 947 Asian wetlands of high international importance, covering some 73 millionhectares (excluding rice paddies). The total area of Asian wetlands was estimated at 120 million hectares.Some 80% of them occurred in just seven countries: Indonesia, China, India, Papua New Guinea,Bangladesh, Burma, and Vietnam. Only 22% of the identified wetlands received some sort of legalprotection, since they had the status of (or were part of) a National Park, Wildlife Sanctuary, or the like.Another 25% were partly protected. Wide variations existed in the protection status between the variouscountries, but a general conclusion from the Directory was that the great majority of natural wetlandecosystems in Asia were under some sort of threat. Although no comprehensive study was carried out sincethen, the general feeling among wetland scientists is that the situation has not improved. Threats haveincreased, either as a consequence of increased population pressure or because of economic developmentin coastal regions.
5. Wetlands in Sri Lanka
The Asian Wetland Directory described 41 wetland sites of international importance in Sri Lanka, covering274,000 ha in total. They could be divided into three broad categories:
● Inland freshwater wetlands (eg.rivers, streams, marshes, swamp forests, and “villus”);
● Salt water wetlands (eg.lagoons, estuaries, mangroves, sea grass beds and coral reefs);
● Man-made wetlands (eg. tanks, reservoirs, rice fields and salterns).
A short description of the major wetland types in Sri Lanka is given below.
5.1 Inland freshwater wetlands
Streams and rivers
Sri Lanka has an extensive network of rivers and streams that drains a total of 103 distinct natural riverbasins. In terms of length, these flowing water bodies cover more than 4,500 km. Mahaweli, Walawe andKelani rivers originate from the central highlands and flow through all three peneplains. The river basinsoriginating in the wet highlands are perennial while many of those in the dry zone are seasonal. The riverMahaweli accounts for the largest basin, covering 16% of the island and thereby has a high socio-economic and ecological value.
The “Villu” wetlands
Although there are no natural lakes in Sri Lanka, there are several flood-plain lakes, commonly referred toas “Villus”, which cover a total area of 12,500 ha. Many of the larger “Villus” are located in the Mahaweliflood-plain in the East. A typical example is the inter-connected Handapan and Pendiya Villus (796 ha),which are the largest of the entire Mahaweli Villu system. The Wilpattu National Park also contains severalVillu ecosystems.
Freshwater Marshes
These are shallow inland depressions located mainly in rural areas either connected to a river or receivingwater through surface run-off, river floodwater and ground water seepage. Partially decomposed organicmaterial in such marshes forms peat, characterized by water logged sticky soil. A typical example is theMuthurajawela Marsh, which is the largest peat bog in Sri Lanka.

6
Freshwater Swamp Forest
This is a late successional stage of freshwater marsh ecosystems, comprising of trees that are adapted togrow in shallow stagnant water. Swamp forests are seasonally inundated with river water. It is the mostrare wetland type in Sri Lanka and a good example is the Walauwa Watta Wathurana Swamp forest (12 ha)located in the Kalu river basin.
5.2 Salt water wetlands
Estuaries and Mangroves
These are inter-connected coastal wetland types. Estuaries are formed in places where rivers enter the sea.The daily tidal fluctuation and the intermediate salinity between salt and freshwater (commonly termed“brackish water”) are main characteristics of this ecosystem. There are about 45 estuaries in Sri Lanka.The mangroves comprise very diverse plant communities that are adapted to grow in unstable conditionsof estuarine habitat. The mangroves are a rapidly diminishing wetland type in Sri Lanka, consisting of lessthan 10,000 ha of discontinuously distributed patches along the coastline. Typical examples of estuarieswith mangrove wetlands in Sri Lanka include the Maduganga estuary and the Bentota estuary.
Lagoons
These are salt or brackish water coastal wetlands separated from the sea by a low sand bank with one ormore relatively narrow permanent or seasonal outlets to the sea. These can also harbour other coastalwetland types such as mangroves, mud flats and sea grass beds. Around 42 lagoons are found around thecoast in Sri Lanka. Examples include the Bundala Lagoon, Mundel Lake, and Kalametiya Lagoon.
Coral reefs and Sea grass beds
These are two important sub-tidal marine wetlands (below 6 m in depth) in Sri Lanka. Coral reefs consistof calcareous structures secreted by a group of marine invertebrates. Coral reefs are famous for theirspectacular beauty and are rich in biological diversity that could be compared to a tropical rainforest.Extensive coral reef habitats occur in the Gulf of Mannar, in the east coast from Trincomalee to Kalmunai,and in several areas of the south and south-western coast. (eg. Rumassala and Hikkaduwa)
Sea grass beds are composed of rooted, seed bearing marine plants. These occur in shallow, shelteredmarine waters, as well as in lagoons and estuaries. The most extensive sea grass beds occur in thenorthwest coastal waters of Sri Lanka (eg. Kalpitiya to Mannar)
5.3 Man-made Wetlands
Tanks and Reservoirs
Although there are no natural lakes in Sri Lanka, an array of ancient irrigation tanks have substituted forthe former wetland type. Numbering nearly 10,000, these man-made wetlands depict the rich culturalheritage of Sri Lanka. The major irrigation reservoirs (each more than 200 ha) cover an area of 7,820 ha,while the seasonal/minor irrigation tanks (each less than 200 ha) account for 52,250 ha. Typical ancientirrigation tanks include the Parakrama Samudraya and the Minneriya tank.
Rice Fields
Rice fields are characterized by the presence of a standing water body, which is temporary and seasonal.Hence, flooded rice fields can be considered as agronomically managed marshes. They are temporary andseasonal aquatic habitats, subject to varying levels of agronomic management. The total area under ricecultivation at present is about 780,000 ha (approximately 12% of the total land area), which is distributedover all the agro-ecological regions except for areas located at very high elevation. Approximately 75% ofrice lands in Sri Lanka are located in the inland valley systems of varying form and size while the rest arefound in alluvial plains and also on terraced uplands in the interior.

7
5.4 Threats to Wetlands in Sri Lanka
According to the Asian Wetland Directory (1989), some 30% of the identified sites were under some formof protection, whereas 28% were completely protected according to the sources quoted. A massive 68% ofthe internationally important sites in Sri Lanka were reported to be under moderate or high threat. It wasindicated that especially the coastal lagoons and the marshes of the wet zone were under high threat,combined with a low protection status. The Directory expressed great concern for these areas “in urgentneed for improvement in the level of protection and for the establishment of further reserves”. The coastallagoons, estuaries and mangrove swamps in the dry zone were also under high threat, but the level ofprotection was considered to be medium to high. Here the need for improvement of existing managementsystems was considered the main requirement. The Mahaweli Ganga Floodplain System was identified asa wetland site “under extreme threat of destruction” (of the same level as the Sundarbans in Bangladeshand the Mekong Delta in Vietnam), requiring urgent attention, if it was to be saved. The observeddevelopment and hydrological manipulation of the system would certainly result in major ecologicalchanges, with far-reaching effects throughout the wetland ecosystem.
The Directory (1989) listed the following Sri Lankan sites amongst the most seriously threatened wetlandsin Asia:
● Thondamannar Lagoon (*);
● Chundikkulam Lagoon;
● Chalai Lagoon (*);
● Periyakarachchi and Sinnakarachchi Lagoons (*);
● Mahaweli Ganga Floodplain System;
● Maha Lewaya and Karagan Lewaya;
● Lunama Kalapuwa and Kalametiya Kalapuwa (*);
● Bellanwilla-Attidiya Marshes.
(*) Highly degraded by 1989; does not merit any special conservation effort.
A number of the sites of international importance, as well as a number of other wetland sites, are situatedin the north and northeast area of Sri Lanka. As these were conflict areas up to 2002, their status has notbeen updated since 1989, and the available information is outdated.
5.5 Management responsibilities
A special problem in Sri Lanka was, and is, the fact that the responsibility for wetland management isdivided among numerous institutions. The mandates of the most important government agencies oftenoverlap and are sometimes at cross purposes as shown in an institutional analysis of wetland managementissues and legislation in 1992 (Wetland Conservation Project Technical Report 02). In all these institutionsthe level of knowledge and expertise is generally high, but unfortunately the cooperation between, orsometimes within, the various institutions is mostly limited or absent.
Another aspect that is increasingly being recognised as a crucial factor in wetland conservation is theimpact of development activities that are geographically remote from a wetland area. Perhaps the mostappropriate example, particularly in the case of Sri Lanka, are the changes to the flow of rivers andconnected natural waterways through construction of dams and diversion of waterways for irrigationpurposes, and their impact on the supply of water to wetlands situated downstream of such activities.Pollution from agricultural and industrial run-off and household waste is another significant example ofthis very real link, which also brings into play a further range of agencies such as those involved in river-basin management.
8
These fragmented jurisdictions, often reflecting different developmental objectives, have stifled theevolution of a multi-sectoral or multi-disciplinary institutional structure for co-ordinating the managementof wetlands as living systems. With such a structure individual agencies need not deploy their resources inisolation but could operate as an interdependent complex. The recognition of wetlands as a multi-functionalsystem that requires a co-ordinating mechanism for their management has thus emerged as a fundamentalprerequisite for effective long term management of wetlands.
6. Recent History of wetland work in Sri Lanka
6.1 Initiatives
It was in this framework of inadequate and ineffective institutional structures and mandates forconservation that various initiatives were taken during the past two decades or so. Some key examples areas follows:
● Muthurajawela Marsh / Negombo lagoon - an important wetland close to Colombo. In 1988, thePresident of Sri Lanka commissioned a Land Use Master Plan, based on ecological considerations,that would set the objectives and limits for the use of the area. The plan was prepared by the GreaterColombo Economic Commission (now BOI). This effort brought together all relevant agencies for thefirst time. The Plan was published in 1991, and approved by two successive Cabinets and implementedthereafter;
● Central Environmental Authority of Sri Lanka (CEA) formulated the Wetland Conservation Project(described below at section 6.2), in 1990. CEA, in collaboration with Department of WildlifeConservation (DWLC), recognized that none of the line agencies involved in resources managementhad a legal mandate to manage a wetland as an ecological entity since their mandates were limited tophysical boundaries or to a single biological resource. The mandate of CEA, on the contrary, includeddevelopment of management models at ecosystem level, as well as institutional coordination;
● Integrated Resources Management Project (IRMP), followed up on the efforts initiated by the WCP in1990 and continued implementation from 1996 –2003.
● Other state organizations including non-governmental organisations and universities undertook workin various aspects of wetland conservation and management but generally in an uncoordinated manner.
6.2 The Wetland Conservation Project
One of the recent key efforts in the conservation and management of wetlands was the WetlandConservation Project formulated by CEA and DWLC in 1990. The project’s focus was on addressing thepriorities indicated in the Directory of Asian Wetlands, namely:
● Ratification of the RAMSAR Convention;
● Updating of the national wetland inventory;
● Preparation of a wetland management strategy;
● Preparation of site-specific management plans for the most important wetland sites;
● Creation of improved linkages and mutual cooperation between agencies, and between agencies andNGOs;
● Creation of wetland conservation awareness and education; and
● Monitoring the effects of development projects on the wetlands

9
The project proceeded in three phases:
● Phase 1 (September 1991 - October 1992), focused on (a) establishment of wetland units within CEAand DWLC; (b) development of conservation methodologies; (c) analysis of the institutional and legalsituation in resources management; (d) development of a wetland valuation system; (e) preparation ofinventory guidelines and using them in three site surveys; (f) preparation of detailed managementplans for the same three sites; and (g) creation of public awareness on wetlands and their values.
● Phase 2 (November 1992 - February 1995), mainly concentrated on (a) preparation of over 20additional site surveys and management plans, and on (b) guidance of the implementation of the firstthree management plans prepared during Phase 1; (c) institutional development (coordination,training, cooperation with NGOs); (d) public awareness at the level of policy makers, and (e)preparation of a national wetland conservation strategy.
● Phase 3 (March 1995 - December 1997) assisted in (a) execution of management plans; (b)development and execution of the use of the visitor centre concept for both creation of publicawareness and raising funds for conservation activities; and (c) increasing the role of wetlandcommunities in wetland management planning and implementation.
Main results of the WCP over 1991 to 1998, and of other wetland work during the same period are shownin section 7 below. More information is available in a large set of technical and general publications, listedin the WCP Final Report (January 1998) and available at the libraries of CEA, DWLC and IUCN.
7. Key achievements in Wetland Conservation in the period 1991 - 1998
7.1 Ratification of the RAMSAR Convention
As a consequence of discussions by CEA and DWLC, the Government of Sri Lanka became a signatory tothe Ramsar Convention on 22 June 1990. The Government thereby committed itself to preserve ecologicalvalues and functions in the country’s wetlands. DWLC was appointed the ‘national representative party’.The CEA assisted DWLC in the preparation of the first set of yearly reports, in visiting relevant regionalmeetings and in preparation of the request for establishment of the first Ramsar site, the Bundala NationalPark.
In close cooperation, DWLC, CEA, and the Forest Department (FD) acting positively on a suggestionmade by the Ramsar Bureau, established a yearly ‘National Wetlands Day’ in February. Thus, activitiessuch as special excursions, radio and TV interviews, school programmes, newspaper articles, countrywidedisplay of banners and competitions increased public awareness on wetland issues.
7.2 Creation of cooperation between agencies
From the outset, institutional cooperation was a key matter in improving wetland management in SriLanka. In 1992, an in-depth analysis was made of all institutional arrangements concerning managementof wetland resources, including the role of the various agencies; legislation and enforcement; and theeffectiveness of conservation activities (WCP Technical Report 02).
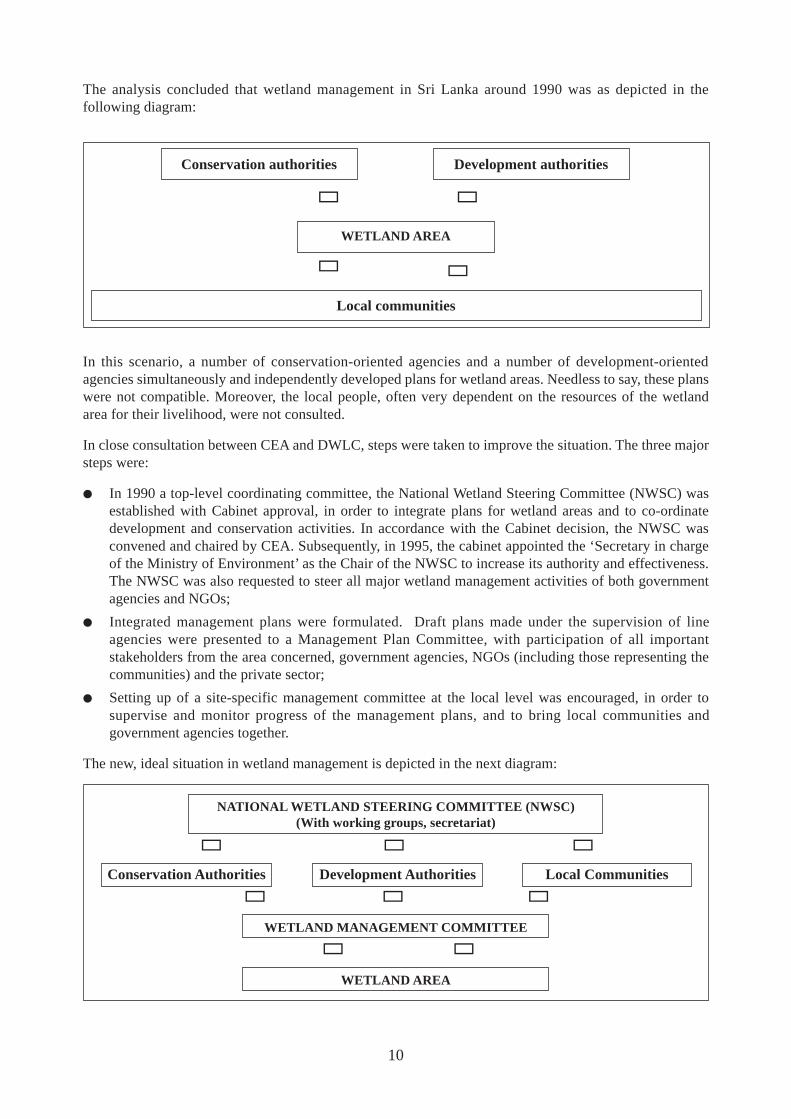
10
In this scenario, a number of conservation-oriented agencies and a number of development-orientedagencies simultaneously and independently developed plans for wetland areas. Needless to say, these planswere not compatible. Moreover, the local people, often very dependent on the resources of the wetlandarea for their livelihood, were not consulted.
In close consultation between CEA and DWLC, steps were taken to improve the situation. The three majorsteps were:
● In 1990 a top-level coordinating committee, the National Wetland Steering Committee (NWSC) wasestablished with Cabinet approval, in order to integrate plans for wetland areas and to co-ordinatedevelopment and conservation activities. In accordance with the Cabinet decision, the NWSC wasconvened and chaired by CEA. Subsequently, in 1995, the cabinet appointed the ‘Secretary in chargeof the Ministry of Environment’ as the Chair of the NWSC to increase its authority and effectiveness.The NWSC was also requested to steer all major wetland management activities of both governmentagencies and NGOs;
● Integrated management plans were formulated. Draft plans made under the supervision of lineagencies were presented to a Management Plan Committee, with participation of all importantstakeholders from the area concerned, government agencies, NGOs (including those representing thecommunities) and the private sector;
● Setting up of a site-specific management committee at the local level was encouraged, in order tosupervise and monitor progress of the management plans, and to bring local communities andgovernment agencies together.
The new, ideal situation in wetland management is depicted in the next diagram:
NATIONAL WETLAND STEERING COMMITTEE (NWSC)(With working groups, secretariat)
Conservation Authorities Development Authorities Local Communities
WETLAND MANAGEMENT COMMITTEE
WETLAND AREA
The analysis concluded that wetland management in Sri Lanka around 1990 was as depicted in thefollowing diagram:
→ → →
→→→
→ →
Conservation authorities Development authorities
WETLAND AREA
Local communities
→ →
→→
11
The National Wetland Steering Committee (NWSC)
The NWSC was an important instrument to ensure continuity in integrated wetland management. Duringthe formative years, the secretariat of the NWSC was run by the CEA. However, The NWSC did notalways function well. The main reasons were:
● Frequent changes in key staff of the constituent state agencies, requiring a substantial effort in briefingand continuation of activities. The NWSC had to be resuscitated some five times up to now, and notall officials involved gave it the same priority. This problem might not be valid anymore, as most ofthe resource management agencies are now under the Ministry of Environment and Natural Resources.The only important exception is the Coast Conservation Department (CCD)
● Often, the agencies were not represented at meetings by high-level staff, authorized to take decisions.This affected making and following-up of decisions.
When the NWSC was functioning well, the following Working Groups were active:
● Working Group on Monitoring and Evaluation of Projects, chaired by the Forest Department (FD). Infact, this was the heart of the NWSC: it kept track of all ongoing projects in the wetlands. Acomputerized database was developed and the agencies and NGOs concerned were provided with aformat for updating information. Problems regarding interagency cooperation were reported to theplenary meeting;
● Working Group on Public Awareness, chaired by the Ministry of Environment. This group workedtowards achieving cooperation and coordination between public awareness and education divisions ofthe various line agencies; this Group also coordinated national activities such as the World WetlandDay;
● Working Group on Legislation, chaired by an NGO (Environmental Foundation Ltd.), investigatedshortcomings in existing nature protection laws and ordinances with respect to wetlands, and toprepare a draft National Wetland Heritage Act;
● Working Group on Ramsar, chaired by DWLC, to assist responsible staff of DWLC in the preparationof the compulsory yearly report to the Ramsar executive office. The Group also prepared requests foradditional Ramsar sites;
● Working Group on Bellanwilla-Attidiya, chaired by IUCN was established to bring the initiatives inthat particular wetland in line and to supervise their implementation.
The work in wetlands carried out by other agencies was also reported to the NWSC, resulting in flows ofinformation. This included the work in Rekawa Lagoon, which lead to the development of the SpecialArea Management (SAM) concept, as well as work carried out under various regional developmentprogrammes.
7.3 Updating of the National Wetland Inventory
One of the first activities of the NWSC was updating the National Wetland Inventory. This was done byconducting national workshops and surveys. Through this process, another 45 wetland sites were added tothe 41 Sri Lanka sites listed in the Asian Wetlands Directory. Not all of the 96 identified sites were ofinternational importance for migratory birds, but most of them were considered to be of outstandingimportance for conservation of the rich endemic flora and fauna of Sri Lanka. The complete list alsoincluded sites representative of the various wetland types of the country: freshwater tanks (some of themwell over 10 centuries old), rivers and river floodplains, natural lakes, marshes, lagoons and estuaries, andshallow marine areas.
The NWSC also prioritised sites to be surveyed in detail based on agreed criteria.

12
In cooperation with all relevant line agencies, research institutes, and national NGOs, 26 wetland siteswere surveyed by WCP (Table 1). For each of the sites a ‘Wetland Site Report’ was prepared, containingmaps and information on natural resources, cultural interests, and human activities. Main threats to thefunctioning of the site were identified in quantitative and qualitative terms. Finally, the wetland was valuedaccording to a system, which excluded individual opinions of interest groups. Valuation was based on thevarious benefits and functions the wetland provided to the community as a whole. A set of interventions,designed to sustain the ecological and economic values of the area, was specified for each of the 26wetlands. The reports were printed and distributed widely, with NWSC approval.
Using GIS software, digital wetland maps were produced at CEA for most of the sites, allowing futuremonitoring of wetland functioning, as well as updating of data. A number of the digitised maps werepublished in a ‘Wetland Atlas’ in December 1999.
Table 1: Wetland Site Reports (WSR) and Conservation Management Plans (CMP)
Wetland area (alphabetical order) * Type of report Date of completion
Annaiwilundawa Tanks WSR/CMP July 1994Bellanwilla-Attidiya Marsh WSR/CMP October 1993Bundala Wetlands WSR/CMP November 1993Colombo Flood Detention Areas WSR/CMP January 1995Koggala Lake WSR/CMP March 1995Lunama and Kalametiya Kalapuwa’s WSR/CMP February 1995Minneriya Reservoir WSR/CMP September 1993Mundel Lake and Corridor Channel WSR/CMP November 1994Muthurajawela Marshes and Negombo Lagoon WSR/CMP October 1994Wirawila Sanctuary and Yoda Wewa WSR/CMP August 1994
Anuradhapura Tanks WSR June 1994Bentota Estuary WSR February 1994Chilaw Estuary WSR May 1994Handapan and Bendiya Villu’s WSR March 1995Horton Plains WSR July 1997Lake Gregory WSR February 1998Madu Ganga WSR February 1998Mi Oya River Basin WSR September 1994Nachchaduwa Tank WSR December 1994Palatupana Maha Lewaya WSR March 1994Puttalam Estuary WSR April 1994Senanayake Samudra Reservoir WSR December 1993Tabbowa Reservoir WSR December 1993Waturana Swamp Forest WSR February 1994Udawalawe Reservoir WSR March 1995
* All WSRs and CMPs, and Sinhala and Tamil translations of the executive summaries, are available at theCEA library .
Active lobbying for implementation of these plans among potential national and international financingagencies and NGOs was initiated through the NWSC. Moreover, training courses on plan implementationwere organized in all Districts for top-level government officers with the assistance of the Institute forParticipatory Institutional Development. As a result, most of the plans are now at some stage of execution.

13
7.4 Preparation of a wetland management strategy and policy
The pace of development of many countries in Asia is among the fastest in the world. Yet many of thesenations still depend heavily on their natural resources. Rapid development places an ever-increasing claimon scarce natural resources, resulting in environmental degradation. On the other hand scarce naturalresources and increasing pollution levels undermine the achievement of development targets. This viciouscircle must be broken if development is to become both economically and environmentally sustainable.The Government of Sri Lanka has enacted legislation to protect and manage the environment. Legislation,however, is not enough. Awareness is required amongst those who have to enforce the law, as well asamongst developers. At the moment, developers often prefer the path of non-compliance.
In wetlands the risks of development are especially large, since wetland ecosystems are very sensitive todisturbance. In order to provide planners and decision makers at local, regional and central level basicinformation on the functions of wetlands and the implications of careless exploitation and development, a‘wetland strategy’ was prepared under the aegis of the NWSC. This included a set of guidelines on thewise use of wetlands, and measures to safeguard wetland productivity and biodiversity.
The draft wetland strategy was discussed at length during a national workshop in 1994. The final andwidely accepted views were published in a “Manual and Strategy for Conservation and Development ofWetlands in Sri Lanka” (CEA/WCP, October 1994). The document discusses the likely impacts, on variouscategories of wetlands, that may result from irrigation and drainage schemes, aquaculture, fisheries,mangrove clearing, land-filling, sand mining, coral mining, salt production, siltation, livestock grazing andother forms of pollution. For most of these interventions a general strategy was recommended, as well asspecial measures pertaining to protected wetlands. During the national workshop it was agreed that thisstrategy would serve as a guideline for drafting a national wetland policy. The NWSC prepared a draftpolicy document in 1994 but this fell into abeyance.
In order to regain momentum, in 1997, national specialists prepared discussion papers based on the 1994strategy and the draft policy. These papers proposed revisions, where necessary, and also identifiedadditional policy components. These proposals were discussed in a two-day workshop, both in plenary andspecialist sessions, and a new draft policy was formulated based on the following agreed basic policyprinciples.
● the concept of sustainable development, which implies that the existing uses of wetlands and theirresources shall not prejudice the use and enjoyment of wetlands and their resources by futuregenerations;
● wetland ecosystems constitute a major habitat, which is one of the components of natural biodiversity
● the functions, attributes, and uses of wetland ecosystems contribute significantly to the well-being ofthe people of Sri Lanka;
● management of wetlands, and creation of wetlands where necessary, can [or should?] improve thefunctions, attributes, and uses of the wetland ecosystems;
● discussions regarding future management of specific wetland sites shall be made with dueconsideration for their ecological, economic and social values, and in keeping with the precautionaryprinciple
● a cooperative and participatory approach is required for wetland conservation and management,involving all levels of government, community, local resource users, and the private sector;
● adequate awareness programmes to promote and to instil positive attitudes and perceptions among allSri Lankans, including the school-going population, are an essential prerequisite;
● the structure and functioning of wetland ecosystems should be conserved and managed within acontext of integrated natural resources and land-use management regimes;
● restoration of man-made wetlands (tanks, wewa’s) shall constitute an essential approach to protectinglocal livelihoods dependent on their services and biological productivity;

14
● wise use of wetlands in Sri Lanka will accord with its obligations as a signatory to internationalconventions, including among others, Ramsar Convention, Convention on Biological Diversity,Global Programme of Action for the Protection of the Marine, Coastal, and Associated FreshwaterEnvironment from Land-based Impacts;
● promotion of research into wetland processes, dynamics and management, and the dissemination of thefindings in a usable form is important for the conservation and management of wetland ecosystems;
● nothing in this policy shall compromise human health and safety considerations or actions that theGovernment of Sri Lanka identifies as being of national interest.
The draft policy was submitted to the Ministry of Forestry and Environment, with the request to forward itto the Cabinet of Ministers after a process of public hearings.
7.5 Creation of wetland conservation awareness and education
During 1991-1998, NWSC or its participants carried out the following main awareness activities:
● A Visitor Centre (‘The Marsh’), the first one of its kind in the country, was established in theMuthurajawela area, north of Colombo. The Centre provided information on the natural and culturalresources of the area through a permanent exhibition and an open-air museum, and organized fieldwalks and boat tours through (parts of) the wetland. A shop offered products from the area, as well asspecific and general published information on wetlands and their flora and fauna. A small restaurantand a conference room (with wetland video displays) completed the set-up. The Centre received over20,000 paying visitors during its first two years, and substantial interest from the media. For childrenvarious nature games were available. All children received an information package free of charge. TheCentre had to close its doors to give way for the construction of a highway, but during its four years ofexistence it had shown that the establishment of such centres is justified.
● A small Visitor Centre was established in the Bellanwilla-Attidiya area, with a herbarium andinformation on fauna and flora. The Centre managed a bird watching tower in the wetland;
● A schoolbook (in Sinhala and Tamil) on wetland issues was prepared. The Ministry of Educationapproved the use of the booklet as a complementary reader in all 10,000 primary schools of the island.Distribution to these schools was organized;
● Participated in a variety of exhibitions, including Environlanka (1992) and Expo Lanka (1997).Exhibits were also made available for schools;
● Every February the World Wetland Day, called for by Ramsar, was used for a country-wideinformation campaign;
● A number of video films were produced and telecast. These included “Migratory Birds”, “TheMinneriya Wetland Nature Reserve”, “The Colombo Flood Detention Areas”, and “Muthurajawela”.Cooperated in producing a TV series on conflicts in wetlands, and in the professional shooting offilms by British and Dutch TV crews, e.g. for a series on ‘wetlands of the world’.
8. The period 1998 - 2003
After the initial phase of wetland work in Sri Lanka, ending in early 1998, planning of wetlandsmanagement proceeded increasingly through participatory cooperation between government agencies andlocal communities. Various implementation activities followed, such as those in Rekawa and Hikkaduwa.These programmes focused on the concept of wise use of wetlands, including issues such as fosteringcooperation between social groupings with different development expectations and facilitating a solutionto the development-versus-conservation conflict. Conservation zoning within a wetland area, was initiatedon a pilot basis in the Muthurajawela sanctuary by IUCN and DWLC.
15
The Integrated Resources Management Programme in Wetlands (IRMP) was implemented, from early1998 to mid-2003, as a continuation of co-operation between GOSL and the Government of theNetherlands. This project concentrated on the following three main issues:
8.1 Development of local-level management systems
IRMP worked towards alleviation of rural poverty in its project area (Muthurajawela Marshes andNegombo Lagoon) through optimising of resource exploitation. In order not to endanger the resourceavailability to future generations, one of the first activities was the preparation of a zoning system for thearea. Through field studies it was determined which marsh areas were of primary importance formaintaining biodiversity (IUCN 2002) and which lagoon areas for reproduction and as nursery habitats.
Improved resource exploitation was initiated through a series of pilot projects, after careful socio-economicsurveys and resource inventories. Each of the over 25 pilot projects aimed at increasing the livingcircumstances of a specific group of people. The projects were typically set up as cooperative effortsbetween groups of people and government agencies, NGOs/CBOs, or the private sector, thereby providingmutual trust and sustainability and broadening the approach of integrated resource use. Over 2,000 familiesout of a population of 3,000 families profited from the pilot projects at least for some time, and about halfof them will continue profiting in the future.
In the course of the process, local people organized themselves as companies or professional groups, whichincreased their clout in collaborative meetings with government agencies. Later on, the groups organizedthemselves into a Community Leaders’ Network. Recently this Network prepared a constitution andregistered as an NGO, representing the communities in resource management meetings chaired by theDistrict Secretary, Gampaha. The NGO is also a member of the Community Coordinating Committee underthe CRMP, thereby safeguarding continuation of their involvement in area management after IRMP isterminated.
8.2 River basin approach
CEA, through IRMP, took initiatives towards a river basin approach for the management of coastalwetlands, as strongly recommended by Ramsar. In all resource surveys it quickly became clear that majorimpacts on the functioning of the wetland came from outside the wetland area, mainly from pollution andsedimentation.
8.3 Institutional transition
From the outset IRMP sought ways to secure continuity of its resource management achievements in orderto achieve sustainability. Therefore all activities were reported to, and discussed in, the District ProjectsCoordinating Committee. Approval by this official committee provided IRMP intervention with legitimacy.Furthermore, all activities were carried out by CEA and DWLC staff, which ensured that the requisitetechnical knowledge and experience was available in the local institutions, even after the project. Althoughthis approach was developed specifically for the Gampaha area, the promising results achieved justifiedreplicating it elsewhere as well.
The intention of the Ministry of Environment and Natural Resources was to see that the benefits derivedfrom the project achievements were not limited to the project area, but to make them available to otherwetland areas in the country. For this reason, the Netherlands Government, decided to co-finance twoADB-projects in the wetland sector: the CRMP with CCD, and the Protected Area Management Projectwith DWLC (see section 8.4 hereunder).

16
8.4 Other recent developments
Important wetland activities recently started or planned are:
● In 2001 the Coast Conservation Department (CCD) started the Coastal Resources Management Project(CRMP), with funds from the Government of Sri Lanka, the Asian Development Bank (ADB), and theNetherlands Government. One component of this project is, Coastal Environmental ResourcesManagement (CERM) which is to assist CCD and local communities to plan and implement themanagement of nine selected “special areas” (coastal wetlands with high conservation value). Anothercomponent of CRMP is concerned with institutional development at the Ministry of Fisheries andOcean Resources to integrate fisheries management interests into overall wetland management.However, an immediate problem faced by CRMP/CCD in regard to these wetland managementcomponets, is the fact that, the resource management mandate of CCD is limited to a stretch of land,300 m from the high water line. Legislation has to be enacted to give CCD management authority inthe “special areas” (coastal wetlands), in their entirety.
● During 2001-2002 preparation of the East Coast Development Project started as an ADB-TA. Theproposed interventions include coastal development and conservation activities.
● The Protected Area Management Project, with funds from the Government of Sri Lanka, ADB, theGlobal Environmental Facility, and the Netherlands Government, commenced in 2003 focusing onimproved management of protected areas. Various mechanisms developed earlier will be applied,including community participation in management planning and execution and the use of visitorcentres as mechanisms for both public education and cost recovery.
● IUCN - Sri Lanka has carried out a number of wetland management planning activities, paving theway for wetland biodiversity assessment and zoning (Muthurajawela, Madu Ganga and Bundala).
● IWMI has undertaken substantial wetland management modelling work in the Bundala andUdawalawe areas.
9. Future risks in wetland management
Some 12 years of uninterrupted work, on wetland conservation and management in Sri Lanka, has pavedthe way to gain general acceptance of the wetland concept, and to undertake a large number of systematicand well-planned initiatives. However, there are still a number of issues that might impede the progresstowards full-fledged and sustainable wetland resources management, as envisaged by the RamsarConvention. The current issues of importance are:
● The National Wetland Steering Committee (NWSC), established by Cabinet to be the overall high-level policy-making and co-ordinating body, did not function on a continuous basis because of thefrequent changes to representative government positions and the inordinate delays in appointingreplacements. Without reviving the NWSC, wetland management will remain haphazard and wanting;
● The creation of a national wetland policy and relevant legislation was initiated but never finalized.The policy should take into consideration national, regional and local targets for wetland management,restoration and rehabilitation;
● Resource inventories and management planning was carried out in the southern two-thirds of thecountry only. At present, the Northern and Eastern provinces have become more accessible. A largenumber of significant wetlands are located in these two provinces, including some of international/national importance such as the Mahaweli Floodplain, a number of minor river basins, a series oflagoons (Batticaloa, Uppar, Ullackalie, Periya and Sinna Karachchi, Kokkilai, Nayaru, Chalai,Chundikulam, Jaffna, Thondamanar), inland tanks and lakes (Iranamadu, Vavuni, Giant’s, Nuwara,Padawiya, Wahalkada, Mora, Kantale) and the Wilpattu National Park;
● Water use planning in Sri Lanka still proceeds on a unilateral basis; the planned Water Secretariat,intended to be a coordinating mechanism, is yet to be fully functional. The need for integrated

17
planning, however, is high, especially for the Dry Zone. Planning of the use of limited naturalresources will have to be done in an integrated manner, and preferably on the basis of land useplanning at catchment and river basin level;
● Sri Lanka is a signatory to various international conventions related to protection of wetlands. In SriLanka the responsibilities for these conventions are vested under different ministries, resulting in lackof co-ordination;
● Management of wetland resources in Sri Lanka is not in the hands of one government agency. Thepresent division of management powers prevents effective management unless cooperation could beestablished among related agencies. Recognizing the shortcomings of the present system, the SpecialArea Management (SAM) concept was developed by CCD with the objective of stretchingmanagement powers to coastal wetlands taken as entities.
● Very often, Government initiates development projects that are in conflict with the Wetlands MasterPlan and Zoning.
● The country has numerous protected areas, far more than can be managed with the financial andpersonnel resources available. Priority setting and selection is urgently required for good management.
10. Recommendations
Problems in wetland conservation and management can be reduced substantially if the followingrecommendations are implemented with a sense of urgency:
10.1 The primary recommendation
Revival of the NWSC is of utmost importance in order to sustain the present momentum in wetland work.During the period that the NWSC functioned well it proved its right of existence, and many of the issues atrisk could be prevented if the NWSC is functional.
An important task of the NWSC is to establish a wetland management mechanism to resolve the conflictsbetween mandates of various agencies. It was evident from past experience that the NWSC workedeffectively only when it was supported by a secretariat. It would be a very positive development if IUCNcould assist the Ministry of Environment and Natural Resources to secure funding for the NWSCsecretariat. The secretariat will provide the necessary continuity and professionalism in wetlandmanagement.
10.2 Other main recommendations
● One of the first tasks the NWSC has to foster is the redrafting of a National Wetland Policy, and invitepublic comment on a wide scale. The previous drafts are available to the NWSC and these need to beupdated. The Ramsar Bureau should be requested to provide examples of wetland policies from othercountries;
● As soon as possible, wetland sites in the north and northeast of the island should be surveyed, so thatcritical management issues could be addressed before irreversible developments are initiated. Awetland conservation project for the northern and eastern provinces should be included in Sri Lanka’sshopping list for donor assistance;
● Exchange of information and cooperation between agencies and institutions active in elements ofwetland management and the enhancement of public access to information;
● Propose revisions to agency mandates to suit the actual needs, or develop a mechanism to overcomeconstraints in wetland management, resulting from conflicting mandates;

18
● Prepare an inventory of perverse incentives that favour wetland loss and degradation in specific sectors(e.g. subsidies for draining or freshening of coastal wetlands for agricultural production) and lobby fortheir removal;
● Establishment of financial incentives for wetland conservation management, on the lines initiated byIRMP;
● Promotion of codes of practice and certification schemes to help ensure that commercial sectors abideby best practice;
● Given the trend towards regionalization, the local government staff should be informed and educatedin matters of wetland management planning and implementation. Training should include land useplanning on the basis of ecological boundaries (such as river basin planning).
19
FRESHWATER WETLANDS IN SRI LANKA:THEIR CONSERVATION SIGNIFICANCE AND
CURRENT STATUS
C. N. B. Bambaradeniya,IUCN – The World Conservation Union
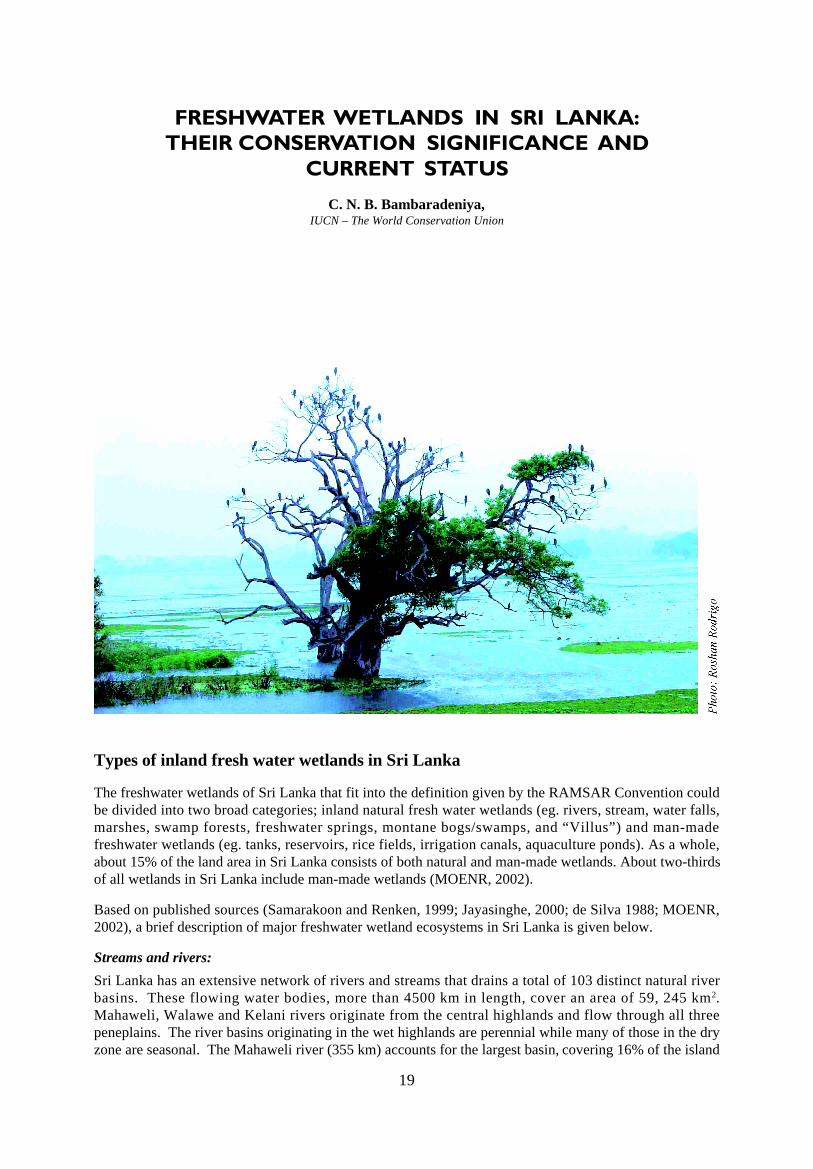
Types of inland fresh water wetlands in Sri Lanka
The freshwater wetlands of Sri Lanka that fit into the definition given by the RAMSAR Convention couldbe divided into two broad categories; inland natural fresh water wetlands (eg. rivers, stream, water falls,marshes, swamp forests, freshwater springs, montane bogs/swamps, and “Villus”) and man-madefreshwater wetlands (eg. tanks, reservoirs, rice fields, irrigation canals, aquaculture ponds). As a whole,about 15% of the land area in Sri Lanka consists of both natural and man-made wetlands. About two-thirdsof all wetlands in Sri Lanka include man-made wetlands (MOENR, 2002).
Based on published sources (Samarakoon and Renken, 1999; Jayasinghe, 2000; de Silva 1988; MOENR,2002), a brief description of major freshwater wetland ecosystems in Sri Lanka is given below.
Streams and rivers:
Sri Lanka has an extensive network of rivers and streams that drains a total of 103 distinct natural riverbasins. These flowing water bodies, more than 4500 km in length, cover an area of 59, 245 km2.Mahaweli, Walawe and Kelani rivers originate from the central highlands and flow through all threepeneplains. The river basins originating in the wet highlands are perennial while many of those in the dryzone are seasonal. The Mahaweli river (355 km) accounts for the largest basin, covering 16% of the island

20
and has a high socio- economic and ecological value. The streams and rivers that flow through the highand mid altitude areas of the island have several water fall habitats.
The “Villu” wetlands:
Although there are no natural lakes in Sri Lanka, there are several flood-plain lakes, commonly referred toas “Villus”, which cover a total area of 40,000 ha. Often they are cut-off former river bends. Many of thelarger “Villus” are located in the Mahaweli flood-plain in the East, and the Kala oya and Modargam Aruflood-plains. A typical example is the inter-connected Handapan and Pendiya Villus (796 ha), whichtogether is the largest of the entire Mahaweli Villu system.
Freshwater Marshes:
These are shallow inland depressions located mainly in rural areas either connected to a river or receivingwater through surface run-off river floodwater and ground water seepage. Partially decomposed organicmaterial in such marshes form peat, characterized by water logged sticky soil. A typical example is theMuthurajawela Marsh, which is the largest peat bog in Sri Lanka. The Wilpattu National Park also containsseveral Villu and freshwater marsh ecosystems.
Freshwater Swamp Forest:
This is a late successional stage of a freshwater marsh ecosystem, comprising of trees that are adapted togrow in shallow stagnant water. Swamp forests are seasonally inundated with river water. It is the mostrare wetland type in Sri Lanka and a good example is the Walauwa Watta Wathurana Swamp Forest (12 ha)located in the Kalu river basin.
Montane bogs/swamps/marshes:
These are located in wet patana grasslands in areas such as Horton Plains and the Handapanella Plains.The soil is boggy due to accumulation of organic matter.
Tanks and Reservoirs:
Although there are no natural lakes in Sri Lanka, an array of ancient irrigation tanks have substituted forthe former wetland type. Numbering nearly 12,000, these man-made wetlands depict the rich culturalheritage of Sri Lanka. The major irrigation reservoirs (each more than 200 ha) cover an area of 7,820 ha,while the seasonal/minor irrigation tanks (each less than 200 ha) account for 52,250 ha. These man-madetanks and reservoirs account for approximately 4.6% of the surface land area in Sri Lanka. Typical ancientirrigation tanks include the Parakrama Samudraya and the Minneriya tank.
Apart from the ancient irrigation tanks, several reservoirs have been built over the last four decades mainlyfor hydropower generation. These include reservoirs in the upper catchment areas including Castlereigh,Norton, Lakshapana, Norton and Mousakelle, while the river Mahaweli has been dammed to create a seriesof multi-purpose reservoirs, including Kotmale, Victoria, Randenigala and Rantambe.
Rice Fields:
Rice fields are characterized by the presence of a standing water body, which is temporary and seasonal.Hence, flooded rice fields can be considered agronomically managed marshes. They are temporary andseasonal aquatic habitats, subject to varying levels of agronomic management. The total area under ricecultivation at present is about 780,000 ha (approximately 12% of the total land area), which is distributedover all the agro-ecological regions except for areas located at very high elevation. Approximately 75% ofrice lands in Sri Lanka are located in the inland valley systems of varying form and size while the rest arefound in alluvial plains and also on terraced uplands in the interior.
Significance of the freshwater wetlands in Sri Lanka
All wetlands comprise a mixture of soils, water, plants and animals. The interactions between theseelements allow wetlands to perform several functions that are beneficial to mankind, while generating

21
abundant wildlife, fisheries and forest resources. The combination of these functions, together with therich biological diversity and cultural heritage of wetlands makes these ecosystems invaluable to people allover the world. The loss of wetlands results in the eradication of these benefits, leading to harmfulconsequences on human welfare and to the extinction of species that are ecologically dependant onwetlands. The importance of freshwater wetlands can be elaborated under three major categories; uses,functions and attributes.
Wetland Uses:
Uses are direct economic benefits gained by people through exploitation of wetland resources. Majorwetland uses are highlighted in Table 1.
Table 1: Major uses associated with freshwater wetlands in Sri Lanka
Uses/Products Examples from Sri Lanka Type of Wetland
Water supply and transportation Labugama, Kalatuwawa Rivers, Streams, Tanks,a) For domestic supply Minneriya tank, Mahaweli river Reservoirsb) For irrigation
Agricultural products for human Rice, Leafy vegetables Rice fields, Marshes, Tanksconsumption
Medicinal herbs “Lunuwarana” herb Marshes
Raw material for handicrafts “ Kaduru” wood for masks, Marshesand mats Pandanus leaves
Hydro-electricity Victoria, Randenigala and Waterfalls, ReservoirsRantambe reservoirs
Fish and crustaceans for Edible freshwater and brackish Rivers, Tanks, Reservoirsconsumption water fish and crustacean species
Fish and plants of ornamental Black Ruby Barb, Cherry Barb, Streams, Marshesvalue Cryptocoryne spp.,
Aponogeton spp.
Material for religious Nelum/Olu/Manel flowers Marshes, Pondsceremonies/offerings
Recreation/tourism Scenic value Tanks, Waterfalls
Wetland Functions:
This category is comprised of events where wetlands support and protect human activity and therebybestows indirect economic benefits. Major functions of inland wetlands are summarized in Table 2.
Table 2: Major functions of inland wetlands
Major Functions Type of wetland involved
Mitigation of floods Marshes, Tanks, Rice fields
Protection from storms/Prevention of coastal erosion Mangroves
Retention of sediments Marshes, rice fields
Purification of water/Removal of toxic compounds Marshes
Act as a Carbon Sink Marshes
Breeding habitats of edible fish Marshes, tanks
22
Wetland Attributes:
This category is comprised of features and characteristics of wetlands which are of invaluable importanceto the country but do not yield direct economic benefits. Two important attributes of freshwater wetlandsare the sustenance of a rich biological diversity and cultural heritage.
Biodiversity conservation
The biodiversity of freshwater wetlands in Sri Lanka is clearly depicted by the rich array of inland wetlandecosystem/habitat types and the high number of animal and plant species that they harbour. For instance,about 30% of the inland vertebrate species in Sri Lanka, are ecologically dependent on inland wetlands.These include 60 species of primary freshwater fishes, of which 25 are endemic. The inland wetlands arealso inhabited by several species of inland invertebrates, including more than 40 endemic species offreshwater crabs. About a third of the bird species in Sri Lanka are dependant on freshwater wetlands.Furthermore, the future survival of approximately 32% of the nationally threatened vertebrate faunalspecies in Sri Lanka is dependent on inland freshwater wetland ecosystems. The freshwater plants includefully aquatic species (eg floating species such as Nymphaea and submerged species such as Hydrilla ), andsemi-aquatic species (eg Aponogeton, Cryptocoryne). Most of the endemic aquatic plants have a restricteddistribution. Among the aquatic plants in Sri Lanka, 21 species (18 endemic) are nationally threatened(IUCN Sri Lanka, 2000).
The rivers and streams that originate in the tropical forests of the Wet Zone constitute the main habitats ofnative freshwater fish, including almost all of the endemic species. The Wet Zone swamp forests likeWaturana is the sole habitat of rare and unique plants such as Stemenoporus moonii and Mesua stylosa.The riverine floodplains and villus in the Dry Zone are important habitats of large grazing mammals likedeer, sambar and elephant, and the Mahaweli flood plains are believed to support the highest animalbiomass in Sri Lanka (MOENR, 2002).
Cultural heritage
In Sri Lanka, wetlands such as rivers and flood plains have been the cradle of historic civilizations. Theman-made wetlands in Sri Lanka, especially the ancient irrigation tanks and rice fields, clearly highlightthe rich cultural heritage associated with wetlands. It is generally believed that Indo-Aryan immigrantsstarted rice cultivation in Sri Lanka more than 2500 years ago. This was a period during which a settledcivilization developed in the dry zone and an elaborate irrigation system was established for ricecultivation. The earliest reference made to the establishment of these irrigation tanks in Sri Lanka was inabout 420 BC. Considering the size of these tanks and the network of neatly built sluices and canals, thetechnology utilized by our ancestral irrigation engineers is truly astonishing.
Threats to inland freshwater wetlands in Sri Lanka
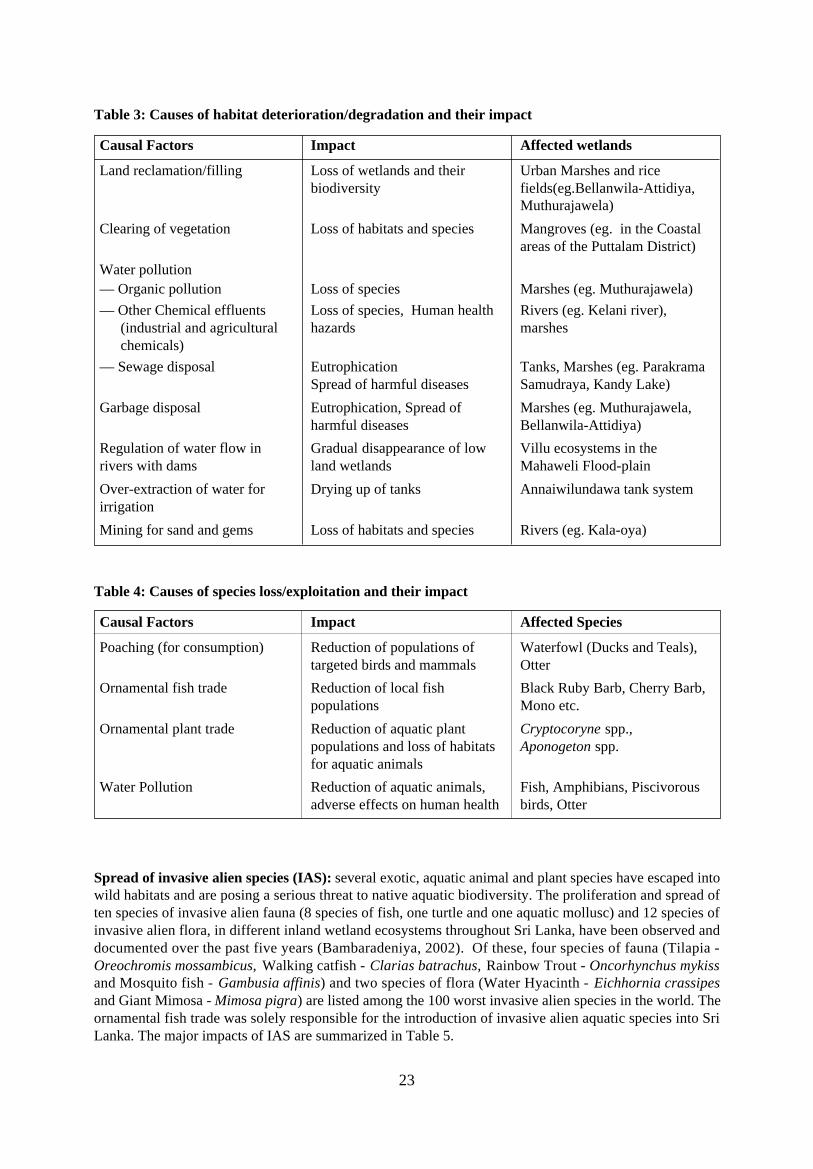
A majority of the freshwater wetlands in Sri Lanka are threatened by a number human activities and naturalevents. These threats are of four major categories: habitat deterioration/degradation, direct loss/exploitationof species, spread of invasive alien species, and natural phenomena.
Habitat deterioration/degradation: Several factors causing the deterioration and degradation of thequality of wetlands, are listed in Table 3.
Direct loss/exploitation of species:
Over-exploitation of wetland plants and animals has resulted in several species facing the risk of extinction.Several activities that are responsible for this are presented in Table 4.
23
Table 3: Causes of habitat deterioration/degradation and their impact
Causal Factors Impact Affected wetlands
Land reclamation/filling Loss of wetlands and their Urban Marshes and ricebiodiversity fields(eg.Bellanwila-Attidiya,
Muthurajawela)
Clearing of vegetation Loss of habitats and species Mangroves (eg. in the Coastalareas of the Puttalam District)
Water pollution— Organic pollution Loss of species Marshes (eg. Muthurajawela)
— Other Chemical effluents Loss of species, Human health Rivers (eg. Kelani river),(industrial and agricultural hazards marsheschemicals)
— Sewage disposal Eutrophication Tanks, Marshes (eg. ParakramaSpread of harmful diseases Samudraya, Kandy Lake)
Garbage disposal Eutrophication, Spread of Marshes (eg. Muthurajawela,harmful diseases Bellanwila-Attidiya)
Regulation of water flow in Gradual disappearance of low Villu ecosystems in therivers with dams land wetlands Mahaweli Flood-plain
Over-extraction of water for Drying up of tanks Annaiwilundawa tank systemirrigation
Mining for sand and gems Loss of habitats and species Rivers (eg. Kala-oya)
Spread of invasive alien species (IAS): several exotic, aquatic animal and plant species have escaped intowild habitats and are posing a serious threat to native aquatic biodiversity. The proliferation and spread often species of invasive alien fauna (8 species of fish, one turtle and one aquatic mollusc) and 12 species ofinvasive alien flora, in different inland wetland ecosystems throughout Sri Lanka, have been observed anddocumented over the past five years (Bambaradeniya, 2002). Of these, four species of fauna (Tilapia -Oreochromis mossambicus, Walking catfish - Clarias batrachus, Rainbow Trout - Oncorhynchus mykissand Mosquito fish - Gambusia affinis) and two species of flora (Water Hyacinth - Eichhornia crassipesand Giant Mimosa - Mimosa pigra) are listed among the 100 worst invasive alien species in the world. Theornamental fish trade was solely responsible for the introduction of invasive alien aquatic species into SriLanka. The major impacts of IAS are summarized in Table 5.
Table 4: Causes of species loss/exploitation and their impact
Causal Factors Impact Affected Species
Poaching (for consumption) Reduction of populations of Waterfowl (Ducks and Teals),targeted birds and mammals Otter
Ornamental fish trade Reduction of local fish Black Ruby Barb, Cherry Barb,populations Mono etc.
Ornamental plant trade Reduction of aquatic plant Cryptocoryne spp.,populations and loss of habitats Aponogeton spp.for aquatic animals
Water Pollution Reduction of aquatic animals, Fish, Amphibians, Piscivorousadverse effects on human health birds, Otter

24
Conservation of inland wetlands in Sri Lanka
Several inland freshwater wetlands have been declared as protected areas. These include marshes such asthe Muthurajawela Sanctuary and Bellanwila-Attidiya Sanctuary, irrigation tanks such as Annaiwilundawa,Minneriya and Giants tank, and the Flood-Plains National Park. Several other wetlands are located within
Table 5: Impact of invasive alien species in Sri Lanka
Type of Impact Example of Invasive species Affected native wetlandspecies/ecosystems
Direct exploitation or destruction Predatory species (Trout, Endemic freshwater fishof native species Clown-knife Fish, Walking
Catfish, Red-eared Slider Turtle)
Superior competitors for resources Tilapia, Water Hyacinth Native aquatic fish and plants
Deterioration of the quality of Salvinia, Water Hyacinth Tanks, Marsheswetlands
Agricultural pests/weeds Apple Snail, Water Hyacinth, Rice fields, Tanks, IrrigationSalvinia, Hydrilla canals
protected areas. The Annaiwilundawa ancient irrigation tank system was declared as Sri Lanka’s secondRamsar wetland site in 2001.
Amidst these conservation initiatives, the majority of the inland freshwater wetlands in Sri Lanka are underthreat, due to adverse anthropogenic activities. The current ongoing economic development activities exerta further pressure on existing wetlands, especially on marshes in low-lying urban/sub-urban areas.Therefore, the future sustenance of inland wetlands and their biological resources, within the context ofincreasing allocation of wetland and water resources for a growing human population, is a challenge thatneeds to be addressed wisely. Conservation biologists and environmentalists must work in closecollaboration with development planners and policy makers, to find viable solutions to the abovechallenges and ensure the future conservation of inland freshwater wetlands in Sri Lanka.
References
Bambaradeniya, C.N.B. (2000). Ecology and Biodiversity in an irrigated rice field ecosystem in Sri Lanka.Ph.D. Thesis, University of Peradeniya, Sri Lanka. 525 pp.
Bambaradeniya, C.N.B. (2002). The status and implications of invasive alien species in Sri Lanka. Zoos’Print Journal, 17 (11): 930-935 pp.
De Silva, S.S. (1988). Reservoirs of Sri Lanka and their fisheries. FAO Fish. Tech. Paper.
IUCN Sri Lanka (2000). The 1999 list of threatened fauna and flora of Sri Lanka. IUCN SriLanka,Colombo.114 pp.
Jayasinghe, J.M.P.K. (2000). Inland Aquatic Resources. In. Arudpragasam, K. (Ed.). Natural Resources ofSri Lanka. National Science Foundation, Colombo. 195-211 pp.
MOENR (2002). State of the Environment in Sri Lanka – A National Report prepared for the South AsianAssociation for Regional Cooperation. Ministry of Environment and Natural Resources, Battaramulla.
Samarakoon, J. I. And H. Renken (1999). Wetland Atlas of Sri Lanka. Central Environmental Authority/Arcadis Euroconsult.
25
THE STATUS OF REEF HABITATS IN SRI LANKA ANDMANAGEMENT ISSUES
A. RajasuriyaNational Aquatic Resources Research and Development Agency
E. N. R. PereraIUCN - The World Conservation Union
Ph
oto
: A
rja
n R
aja
suri
ya
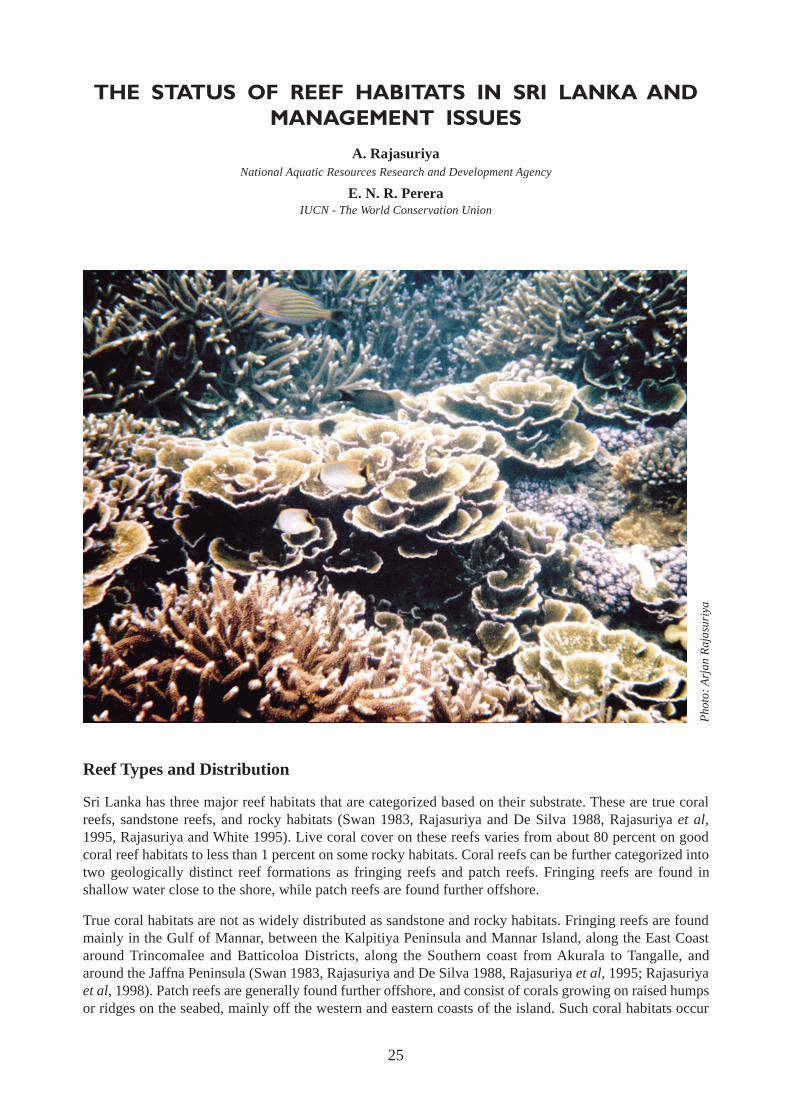
Reef Types and Distribution
Sri Lanka has three major reef habitats that are categorized based on their substrate. These are true coralreefs, sandstone reefs, and rocky habitats (Swan 1983, Rajasuriya and De Silva 1988, Rajasuriya et al,1995, Rajasuriya and White 1995). Live coral cover on these reefs varies from about 80 percent on goodcoral reef habitats to less than 1 percent on some rocky habitats. Coral reefs can be further categorized intotwo geologically distinct reef formations as fringing reefs and patch reefs. Fringing reefs are found inshallow water close to the shore, while patch reefs are found further offshore.
True coral habitats are not as widely distributed as sandstone and rocky habitats. Fringing reefs are foundmainly in the Gulf of Mannar, between the Kalpitiya Peninsula and Mannar Island, along the East Coastaround Trincomalee and Batticoloa Districts, along the Southern coast from Akurala to Tangalle, andaround the Jaffna Peninsula (Swan 1983, Rajasuriya and De Silva 1988, Rajasuriya et al, 1995; Rajasuriyaet al, 1998). Patch reefs are generally found further offshore, and consist of corals growing on raised humpsor ridges on the seabed, mainly off the western and eastern coasts of the island. Such coral habitats occur
26
about 15 to 20 km offshore and vary in extent from about a hectare to several hectares. They are generallywithin the depth range of 15 to 25 m. However, patch reefs are found somewhat closer to shore with coralpatches occurring in water as shallow as 1m in the Gulf of Mannar.
Combinations of sandstone and old limestone habitats are common, and can be found on the continentalshelf around the island. Swan (1983) states that these may indicate former sea level changes. Rockyshorelines and submarine structures based on the geological formations are found from Colombo toTrincomalee including the Southern and Eastern coastal areas of the island (Cooray, 1984).
The Ecological Significance and Economic Value of Sri Lanka’s Reefs
Biodiversity
Sri Lanka’s reefs support a high species diversity consisting of all major groups such as stony corals, softcorals, anemones, polychaetes, sponges, tunicates, fishes, spiny lobsters and other crustaceans, molluscs,echinoderms and marine algae. At present, a total of 183 species of stony corals belonging to 68 genera(Rajasuriya and De Silva, 1988; Rajasuriya, 1994), and a large number of reef and reef associated fishspecies including 36 species of Butterflyfish have been recorded from Sri Lankan reefs (Ohman et al, 19981995). More than 300 reef and reef associated fish species excluding cryptic species such as gobies andblennies have been identified from the Bar Reef Marine Sanctuary (Rajasuriya et al, 1995). Lieske &Myers (1994) suggests that the total number of reef and reef associated fish species in Sri Lankan watersmay be as high as 900. Five species of spiny lobsters also occur in Sri Lanka.
Fisheries
Reef and reef-associated fisheries are the main economic use of reefs in Sri Lanka. The fishery sectorcontributes about 2% to the GDP. Reef fish production fluctuates yearly, but yields an average annual catchof around 10,000 tons (NARA, 1998), which constitutes about 72% of total marine fish production. Thespiny lobster harvest in 1994 was 1,000 tons (NARA, 1998). Major activities in the coastal fishery sectorare demersal and semi-demersal fisheries, spiny lobster fishery and the marine ornamental fishery, almostall of which are dependent on reef habitats. Sea cucumber and sacred chanks are harvested in soft bottomareas between patch reefs. Ornamental fish, sea cucumber and chanks are harvested exclusively for export,while most of the spiny lobster catch is also exported.
About 250 species of fish, and about 50 species of invertebrates including molluscs, sea anemones andreef shrimps are exported as ornamental species. Almost all of the marine ornamental species are collectedfrom reef habitats and sandy areas adjacent to reefs. Wood (1985) estimated that about 80 percent of thetotal exports of ornamental species are marine fish and invertebrates.
Tourism
Sri Lanka’s coastal tourism depends largely on clean sandy beaches and the attraction of fringing coralreefs. Although underwater tourism is a relatively undeveloped activity in Sri Lanka, a number of newscuba diving centers have been established over the past decade, and the industry has shown potential forfurther growth. The major attractions are the shipwrecks and offshore reefs in the west and east coast.
Prevention of Coastal Erosion
Near-shore reefs act as natural barriers against ocean waves, especially during the monsoon season, andare therefore vital in preventing coastal erosion and protecting the shoreline in many areas of the country.
Threats to Reef Habitats in Sri Lanka
Reef habitats in Sri Lanka are being threatened by a number of natural and human induced factors that areleading to habitat degradation and a decrease of fauna and flora.

27
Major causes of reef degradation in Sri Lanka
Human induced
● Coral Mining from the sea
● Blast fishing
● Other destructive fishing techniques that cause damage to reef habitats
● Pollution from land based and aquatic sources
● Uncontrolled harvesting of reef resources
● Increase of sediment due to improper landuse
● Boat anchoring and operation of glass bottom boats
Natural
● Coral Bleaching
● Crown of thorns starfish
● Other invasive organisms such as tunicates, corallimorpharians and algae
● Sedimentation due to natural erosion
In 1998, an increase in seawater temperatures caused by the El Niño Southern Oscillation (ENSO) led tomassive coral bleaching and mortality of corals in the Indian Ocean. This event caused immense damageto shallow water coral habitats in Sri Lanka (Wilkinson 1998; Rajasuriya et al., 1999, Wilkinson et al.,1999), with many pristine reef systems being completely destroyed. Recent surveys indicate that therecovery of these damaged reef habitats is variable and will probably take many years to return to theirpre-bleaching status.
There are also other natural causes of damage such as infestations of the Crown of Thorns starfish(Acanthaster plancii), which feeds on live corals (De Bruin, 1972; Rajasuriya et al. 1995). Sedimentation,invasive organisms such as corallimorpharians, and certain species of algae also have negative impacts onreefs.
Destructive fishing techniques such as the use of explosives, bottom set nets to catch spiny lobsters andreef fish, damaging fish collection techniques used by the ornamental fish collectors, boat anchoring, andreef walking by visitors to coral reefs are some of the major causes of physical damage to the reef structure(De Silva, 1985; Rajasuriya, 1991; Rajasuriya et al 1995). The use of bottom-set nets in particular hasdevastated shallow coral reefs in the northwestern coastal waters, and the use of explosives is destroyingreefs and fish populations around the island. The use of destructive fishing methods is causing extensivehabitat degradation and severely reducing fish stocks, and a number of new destructive fishing practiceshave proliferated in recent times.
Traditionally, reef lagoons have been used as anchorages for fishing boats and other crafts. With the rapidincrease of fishing crafts in the last two decades much damage has resulted from boat anchoring andchronic oil pollution. (De Silva, 1985; Rajasuriya, 1991; Ohman et al, 1993; Rajasuriya et al, 1995).
Corals extracted from the sea for use in lime production for the construction industry has caused extensivedamage to reefs in the southwestern, southern and eastern coastal areas. (Swan, 1983; Premaratne, 1984;De Silva, 1985; Baldwin, 1991; Hale and Kumin, 1992; Ohman et al, 1995; Rajasuriya and White, 1995;CCD, 1997). Although being illegal, it has been a traditional economic activity for some coastal dwellersalong the southern and eastern coast. This is probably the single most destructive activity as entire reefsare mined for the production of lime.
28
Over harvesting of marine organisms has been a particular problem in the demersal fishery, spiny lobster andornamental fisheries, and more recently in the harvesting of sea cucumbers and chanks. Numbers of somecommercially exploited marine organisms have been declining rapidly in popular collection and fishery sites.
Management of Fisheries and Reef Habitats
Institutional and Legal Framework
There are a number of government departments involved in the conservation and management of marineresources. There are also a number of laws and associated regulations that govern resource exploitation,conservation, and protection of coral reef resources. However, management is often complicated due to thesectoral approach taken by different organizations and due to overlapping responsibilities (Table 1).
The key pieces of legislation for coral reef management and marine resource management are:
● Fisheries and Aquatic Resources Act, No. 2 of 1996
● Coast Conservation Act, No. 57 of 1981 and amendment Act, No. 32 of 1996
● Fauna and Flora Protection Ordinance of 1938 (Chapter 469) as amended by Acts Nos. 44 of 1964 and1 of 1970 and amendment by Act, No. 49 of 1993
● Marine Pollution Prevention Act, No. 59 of 1981
● National Environmental Act, No. 47 of 1980 as amended by Act, No. 56 of 1988
● National Aquatic Resources Research and Development Agency Act, No. 54 of 1981 as amendmentby Act, No.32 of 1996
The fisheries ordinance of 1940 and its amendment in 1952 required the licensing of fishing operations,crafts, gear and general management of fishing and fishery related activities. The use of destructive fishingmethods such as blast fishing was prohibited. The new Fisheries and Aquatic Resource Act No. 2 of 1996repealed all previous acts, ordinances and notifications, with the term conservation of resources being asignificant change from the previous ordinances, acts and regulations.
The amendments to the Fauna and Flora Protection Ordinance in 1993 included the addition of a numberof marine organisms including hard corals, soft corals, gorgonians, 7 species of fish, selected species ofreef shrimps, echinoderms, hermit crabs and molluscs into the list of protected species (Wood andRajasuriya, 1996). The Fisheries and Aquatic Resources Department has listed the 7 species of fishincluded in the Fauna and Flora Ordinance, 1 reef shrimp (Schedule 1) and 16 species (Schedule 2) of reeffish that can be exported with a permit (Wood and Rajasuriya, 1996). Further the regulations under thenew Fisheries and Aquatic Resource Act No. 2 of 1996 prohibits the use of destructive fishing techniquessuch as bottom set nets and moxy nets. It is also mandatory to obtain permits for any form of fishingincluding the use of crafts and gear.
Marine Protected Areas (MPA’s)
In 1979, the Hikkaduwa coral reef comprising an area of 110 acres was declared as a Marine Sanctuaryunder the Fauna and Flora Protection Ordinance (Chapter 469 as amended by Act No. 44 of 1964 and ActNo. 1 of 1970) of the Department of Wildlife Conservation. This has since been upgraded to a NationalPark with an extended area of 251 acres. In 1992, an area of 306.7 sq. km was declared as the Bar ReefMarine Sanctuary. More recently, the Pigeon Islands, inclusive of the surrounding coral reef have beendeclared as a National Park, and the Buona Vista coral reef in Galle has been declared as a MarineSanctuary. In addition, the Great and Little Basses reefs have been declared as Fishery Managed Areas.
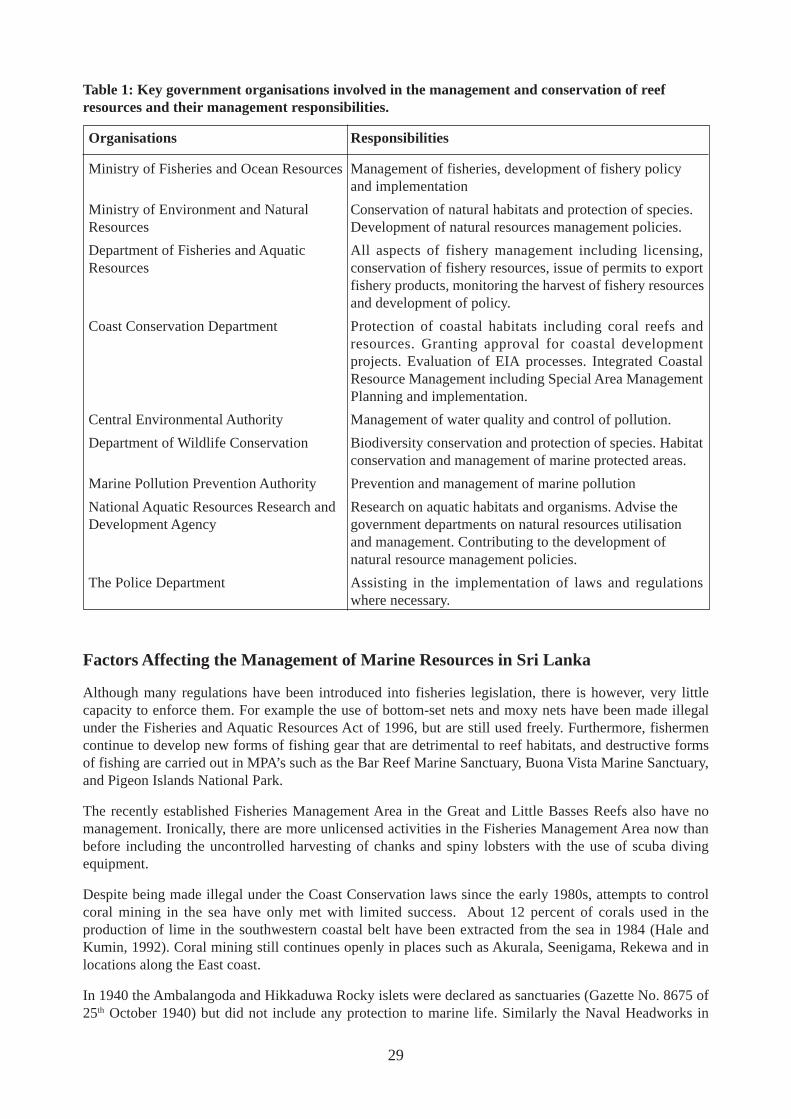
29
Factors Affecting the Management of Marine Resources in Sri Lanka
Although many regulations have been introduced into fisheries legislation, there is however, very littlecapacity to enforce them. For example the use of bottom-set nets and moxy nets have been made illegalunder the Fisheries and Aquatic Resources Act of 1996, but are still used freely. Furthermore, fishermencontinue to develop new forms of fishing gear that are detrimental to reef habitats, and destructive formsof fishing are carried out in MPA’s such as the Bar Reef Marine Sanctuary, Buona Vista Marine Sanctuary,and Pigeon Islands National Park.
The recently established Fisheries Management Area in the Great and Little Basses Reefs also have nomanagement. Ironically, there are more unlicensed activities in the Fisheries Management Area now thanbefore including the uncontrolled harvesting of chanks and spiny lobsters with the use of scuba divingequipment.
Despite being made illegal under the Coast Conservation laws since the early 1980s, attempts to controlcoral mining in the sea have only met with limited success. About 12 percent of corals used in theproduction of lime in the southwestern coastal belt have been extracted from the sea in 1984 (Hale andKumin, 1992). Coral mining still continues openly in places such as Akurala, Seenigama, Rekewa and inlocations along the East coast.
In 1940 the Ambalangoda and Hikkaduwa Rocky islets were declared as sanctuaries (Gazette No. 8675 of25th October 1940) but did not include any protection to marine life. Similarly the Naval Headworks in
Table 1: Key government organisations involved in the management and conservation of reefresources and their management responsibilities.
Organisations Responsibilities
Ministry of Fisheries and Ocean Resources Management of fisheries, development of fishery policyand implementation
Ministry of Environment and Natural Conservation of natural habitats and protection of species.Resources Development of natural resources management policies.
Department of Fisheries and Aquatic All aspects of fishery management including licensing,Resources conservation of fishery resources, issue of permits to export
fishery products, monitoring the harvest of fishery resourcesand development of policy.
Coast Conservation Department Protection of coastal habitats including coral reefs andresources. Granting approval for coastal developmentprojects. Evaluation of EIA processes. Integrated CoastalResource Management including Special Area ManagementPlanning and implementation.
Central Environmental Authority Management of water quality and control of pollution.
Department of Wildlife Conservation Biodiversity conservation and protection of species. Habitatconservation and management of marine protected areas.
Marine Pollution Prevention Authority Prevention and management of marine pollution
National Aquatic Resources Research and Research on aquatic habitats and organisms. Advise theDevelopment Agency government departments on natural resources utilisation
and management. Contributing to the development ofnatural resource management policies.
The Police Department Assisting in the implementation of laws and regulationswhere necessary.

30
Trincomalee, and the Great and Little Sober Islands within the Trincomalee harbour were declared asprotected areas in 1963. The Paraitivu Island west of the Jaffna Peninsula was also declared as a sanctuaryin 1973 (De Silva, 1985; Rajasuriya, 1995). However, no provisions were made for the long-termmanagement of these sanctuaries.
In 1973 regulations were drafted to declare the sea area between Mt. Lavinia and Galle Face on the westcoast as a lobster reserve. However, there is no evidence to indicate that this was gazetted. In 1980 Cabinetapproval was granted to the Ministry of Fisheries to declare the Hikkaduwa Harbour area, Polhena reefarea, Great and Little Basses reefs, and the Passikudah and Kalludah Bays as Marine Sanctuaries under theFisheries ordinance. However there is no indication that these areas have been gazetted under the FisheriesOrdinance as Marine Sanctuaries.
In 1982, an Inter-Ministerial Committee on Marine Parks and Sanctuaries formed by the National AquaticResources Research and Development Agency (NARA) identified more than 20 coral reef sites around theisland to be declared as MPA’s but very little action has been taken on these recommendations (De Silva,1985; Rajasuriya, 1995).
It is clear that management of marine resources is weak, and in many instances totally lacking in Sri Lanka.This is mainly due to the fact that there is no government organization with the capacity to effectivelymanage marine resources. The non-existence of an effective coastguard, and the lack of capacity to enforcelaws by both the Police and relevant Government Departments have contributed to the continueddegradation of marine ecosystems and abuse of resources. Political interference has also been an obstacleto resource management in many instances. Although the reefs have been severely damaged, resourceexploitation continues unabated and in many instances has increased. Unfortunately, the drives to increaserevenue, and socio-political considerations have taken precedence over proper resource management.
References
Baldwin, M.F. (ed.) 1991. Natural Resources of Sri Lanka, Conditions and Trends. Natural Resources,Energy and Science Authority of Sri Lanka and United States Agency for International Development(NARESA/USAID). 280 p.
Cooray, P.G. 1984. An Introduction to the Geology of Sri Lanka (Ceylon). National Museums of Sri Lanka.Colombo, 340 p.
De Bruin, G.H.P., 1972. The ‘Crown of Thorns’ starfish Acanthaster planci (L.) in Ceylon. Bull. Fish.Res. Stn. Sri Lanka (Ceylon), 23, pp. 37-41.
De Bruin, G.H.P., Russell, B.C and Bogush, A 1995. FAO species identification field guide for fisherypurposes. The marine fishery resources of Sri Lanka. Rome, FAO. 400 p. 32 colour plates.
De Silva, M.W.R.N. 1985. Status of the Coral Reefs of Sri Lanka. Proc. 5th Int. Coral Reef Congress,Tahiti, Vol.6, pp. 515-518.
Hale, L.Z and Kumin, E. 1992. Implementing a Coastal Resources Management Policy, The Case ofProhibiting Coral Mining in Sri Lanka. Coastal Resources Center, University of Rhode Island, 30 p.
Lieske, E & R Myers. 1994. Coral Reef Fishes. Indo-Pacific and Caribbean. HarperCollins. London.400pp.
National Aquatic Resources Research and Development Agency 1998. Sri Lanka Fisheries Year Book,1998. Colombo, 56 p.
Öhman, M.C., Rajasuriya, A., Lindén, O. (1993). Human Disturbances on Coral Reefs in Sri Lanka: ACase Study. Ambio, Vol. 22, No. 7, 474-480.

31
Ohman, M. C., Rajasuriya A., and Svensson, S. 1998. The use of Butterfly fishers (Chaetodontidae) as bio-indicators of habit structure and human disturbance. Ambio, Vol. 27 No. 8. pp. 708-716.
Premaratne, A. 1984. Socio-economic survey of those engaged in the coral mining industry (fromAmbalangoda to Dickwella). Coast Conservation Department, Report No. 3. 1984.
Rajasuriya, A and De Silva, M.W.R.N. 1988. Stony corals of the fringing reefs of the western, southwesternand southern coasts of Sri Lanka. Proc. 6th Int. Coral Reef Symposium, Australia, Vol. 3, pp. 287-296.
Rajasuriya, A. 1991. Location and Condition of Reefs along Sri Lanka’s Coast. pp. 203-210, Proc. Seminaron Causes of Coastal Erosion in Sri Lanka. 366p. Coast Conservation Department, Sri Lanka.
Rajasuriya, A. 1994. Three Genera and Twelve Species of Stony Corals New to Sri Lanka (Abstr.). Paperpresented at the Second Annual Scientific Sessions of the National Aquatic Resources Agency, Colombo,Sri Lanka.
Rajasuriya, A. 1995. The Present Status of Marine Protected Areas in Sri Lanka. Proc. Review of theProtected Area System of the Indomalayan Realm, Regional Workshop, Cisarua, Bogor, Indonesia, AsianBureau for Conservation.
Rajasuriya, A., De Silva, M.W.R.N and Öhman, M.C. 1995. Coral reefs of Sri Lanka; human disturbanceand management issues. Ambio, Vol. 24, No. 7-8, pp. 428-437.
Rajasuriya, A and White, A.T. 1995. Coral reefs of Sri Lanka: review of their extent, condition andmanagement status. Coastal Management, Vol. 23, pp. 77-90.
Rajasuriya, A., Öhman, M.C. and Svensson, S. 1998. Coral and Rock Reef Habitats in Southern Sri Lanka;Patterns in the Distribution of Coral Communities. Ambio, Vol. 27 No. 8, pp. 723-728.
Rajasuriya, A., Maniku, M.H., Subramanian, B.R. and Rubens, J. (1999). Coral Reef Ecosystems in SouthAsia. In Linden, O. and Sporrong, N. 1999. Coral Reef Degradation in the Indian Ocean, CORDIO &SAREC. pp.11-24.
Swan, B. 1983. An Introduction to the Coastal Geomorphology of Sri Lanka. National Museums of SriLanka, Colombo, 182 p.
Wilkinson, C (ed.) 1998. The Status of Coral Reefs of the World: 1998. Australian Institute of MarineScience and Global Coral Reef Monitoring Netwrok, Townsville, Australia. 184 p.
Wilkinson, C., Linden, O., Cesar, H., Hodgson, G., Rubens, J and Strong, A. E. 1999. Ecological andSocioeconomic Impacts of 1998 Coral Mortality in the Indian Ocean: An ENSO Impact and a Warning ofFuture Change ?. Ambio, Vol. 28 No. 2., pp. 188-196.
Wood, E.M. 1985. Exploitation of coral reef fishes for the aquarium trade. Report to the MarineConservation Society. 121 p.
Wood, E.M and Rajasuriya, A. 1996. Handbook of Protected Marine Species in Sri Lanka. MarineConservation Society and National Aquatic Resources Agency. 26 p.
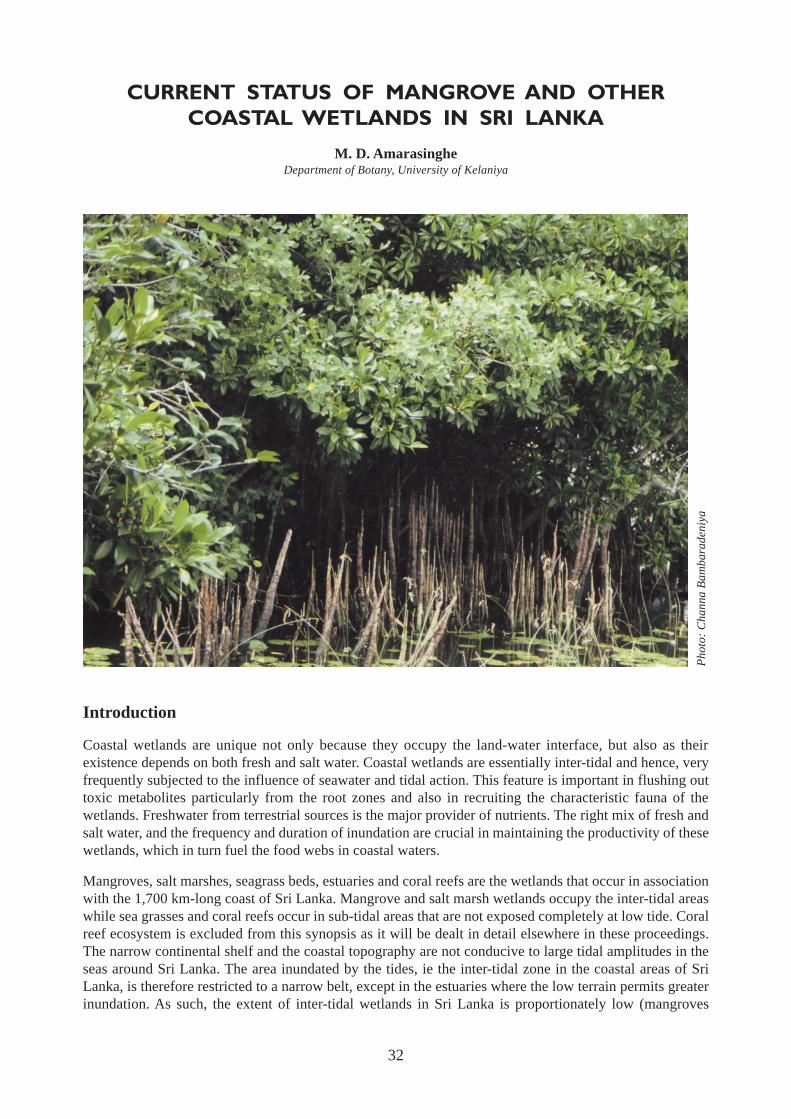
32
CURRENT STATUS OF MANGROVE AND OTHERCOASTAL WETLANDS IN SRI LANKA
M. D. AmarasingheDepartment of Botany, University of Kelaniya
Ph
oto
: C
ha
nn
a B
am
ba
rad
en
iya
Introduction
Coastal wetlands are unique not only because they occupy the land-water interface, but also as theirexistence depends on both fresh and salt water. Coastal wetlands are essentially inter-tidal and hence, veryfrequently subjected to the influence of seawater and tidal action. This feature is important in flushing outtoxic metabolites particularly from the root zones and also in recruiting the characteristic fauna of thewetlands. Freshwater from terrestrial sources is the major provider of nutrients. The right mix of fresh andsalt water, and the frequency and duration of inundation are crucial in maintaining the productivity of thesewetlands, which in turn fuel the food webs in coastal waters.
Mangroves, salt marshes, seagrass beds, estuaries and coral reefs are the wetlands that occur in associationwith the 1,700 km-long coast of Sri Lanka. Mangrove and salt marsh wetlands occupy the inter-tidal areaswhile sea grasses and coral reefs occur in sub-tidal areas that are not exposed completely at low tide. Coralreef ecosystem is excluded from this synopsis as it will be dealt in detail elsewhere in these proceedings.The narrow continental shelf and the coastal topography are not conducive to large tidal amplitudes in theseas around Sri Lanka. The area inundated by the tides, ie the inter-tidal zone in the coastal areas of SriLanka, is therefore restricted to a narrow belt, except in the estuaries where the low terrain permits greaterinundation. As such, the extent of inter-tidal wetlands in Sri Lanka is proportionately low (mangroves
33
cover only 0.01% of the total land area). Seagrasses mostly occur in the shallow lagoons (Amarasingheand Perera, 1984; Jayasuriya, 1991; Johnson and Johnston, 1995; Amarasinghe and Pahalawattarachchi,1996; Amarasinghe et al, 2004), and on reef flats or in other shallow areas in the continental shelf.Exposure to the energies of the high seas may prevent establishment of extensive seagrass meadows in thecontinental shelf. However, in the shallow and relatively sheltered areas, such as the Palk bay, there areextensive seagrass beds, which in bygone days were famous dugong habitats.
Mangrove ecosystems
Reliable estimates of the current total extent of mangrove areas (mangals) in Sri Lanka are not available.Remote sensing through aerial photography which provides acceptable data on mangrove extents, is almostlimited to the coastal area from Kala Oya estuary on the northwestern coast to Rekawa lagoon on thesoutheastern coast. No aerial investigations have been carried out in the northern and eastern coastal areasdue to the war situation, prevalent for the last two decades. The Coast Conservation Department’s 1985survey estimated the total mangrove extent of Sri Lanka at approximately 12,000 ha, as against an earlierapproximation of 10,000 ha (Aruchelvam, 1968). However, the current extent could be well below 12,000ha, as mangroves have been either totally lost or degraded due to shrimp farming, saltern construction,village and urban expansion that took place at a considerably high rate during the past two decades. AroundPuttalam lagoon alone, the mangrove areas have shown a 33% decline in extent within a period of 10years, plunging from 1,480 ha in 1981 to 988 ha in 1991, primarily due to unrestrained expansion of shrimpfarming in these coastal areas (Amarasinghe and Perera, 1995).
The mangrove area associated with Puttalam lagoon is the largest in Sri Lanka (CCD, 1986). Themangroves of the Kala oya estuary are of particular importance, as they constitute the most extensive andleast disturbed mangrove area, on the fairly well documented, western and southern coasts of Sri Lanka.Mangals (area covered by mangroves) on the banks of Lunu oya, the southernmost distributary of Kalaoya estuary, supports the structurally most diverse mangrove ecosystem so far recorded or observed in SriLanka (personal observations). Although this mangrove ecosystem is located at the southern boundary ofthe Wilpattu National Park, it does not fall under wildlife jurisdiction. Hence it is vulnerable todevelopment activities, particularly to shrimp farming.
Although records on the true mangrove species from Sri Lanka are inconsistent, a majority of theresearchers reported the occurrence of more than 25 species in various mangals along western and southerncoasts (Jayatissa et al, 2002). The most common species among them are Avicennia marina, Rhizophoramucronata, R. apiculata, Bruguiera gymnorrhiza, B.cylindrica, Excoecaria agallocha and Sonneratiacaseolaris. Ceriops tagal, Aegiceras ocrniculatum, Lumnitzera racemsa, and Heritiera littoralis show awide distribution, but are less common than the previously mentioned species. Occurrence of Nipafruticans, and Xylocarpus granatum is restricted to certain areas while Lumnitzera littorea andScyphiphora hyrophyllaceae are extremely rare. Although there are discrepancies in the categorization intotrue and associate mangrove species, more than 18 species of have been recorded as associate species inmangrove areas in Sri Lanka. (Amarasinghe and Perera, 1984, Amarasinghe and Balasubramaniam,1992,Jayatissa et al, 2002). Rhizophora apiculata and Bruguiera gymnorrhiza, are typically found in themangrove areas in the wet zone while R. mucronata and B. cylindrica are characteristic to the mangals ofdry coasts, except for Negombo lagoon where R. mucronata dominates the vegetation as they have beenplanted by the brush park fishermen for the purpose of obtaining twigs and branches for brush parkconstruction. Brush park is a traditional fishing method practiced in Negombo and Chilaw lagoons. A.marina shows a pan-climatic distribution and occurs even in highly saline salt marshes.
The above ground net primary productivity of riverine/estuarine mangroves is greater than that of themangroves located away from rivers. Mangrove areas of Kala Oya estuary are estimated to produce 12tons of organic matter (dry weight) per m2 per year, while the mangroves on the fringe of Puttalam lagoonproduce only 7 tons annually (Amarasinghe and Balasubramaniam, 1992). Primary productivity of themangroves in the wet zone is higher than that of the mangals in the dry/ arid coastal areas; for instance,

34
productivity in the Negombo lagoon is estimated at 16 t m-2 year-1(Amarasinghe, 2002). Primaryproductivity, once converted to particulate and dissolved organic matter through microbial action, becomesthe basic source of energy for the aquatic food webs in the coastal waters. Greater abundance of finfish andshellfish has been observed in localities where the detritus amounts are relatively high. Shrimps such asPenaeus semisulcatus and Metapenaeus elegans, in particular, have been observed in detritus-rich areas inNegombo lagoon (Pinto and Punchihewa, 1993). Mangrove detritus therefore has a direct bearing on thefishery production from lagoons on which over 40,000 fisher families are dependent for a living (Dayaratneet al, 1995).
Mangrove forest products are directly used in the form of firewood, light timber for temporary dwellings,brush parks, fish traps, fence posts and tanbark for tanning sails and nets, particularly beach seines.Removing mangrove bark, mainly from Rhizophora mucronata in the Dutch bay is one of the major causesfor the decline in mangroves in the area.
In Negombo lagoon, mangroves, mainly R. mucronata, and to a lesser extent Lumnitzera racemosa,Ceriops tagal and Bruguiera gymnorrhiza are cultivated in the mud flats by brush park fishermen for thepurpose of obtaining twigs and branches for brush park construction. Many other inhabitants alongsidethis lagoon plant R. mucronata near the shore, at the back of their homesteads, to check erosion fromlagoon water (Amarasinghe, 1988). Although, this community-initiated mangrove planting has helped tomaintain productivity of the lagoon, through production of detritus with high nitrogen (C/N ratio of 1:17)(Pahalawattaarachchi and Amarasinghe, 1997), the vegetation structure of these cultivated mangrove areasare simpler than the natural stands, thus reducing the types of habitats available for the aquatic organisms.
Salt marshes
Salt marshes are characteristic to arid coastal areas, particularly in the north-western and southeastern partsof the island, where soil salinities build up in the infrequently inundated inter tidal areas. Salt-tolerantherbaceous plants dominate these ecosystems. Five species, Arthrocnemum indicum, Salicornia brachiata,Sueda maritima, S. monoica and S. nudiflora have been recorded as typical salt marsh species and in somelocalities Avicennia marina occurs as a dwarf tree. These are the habitats for young stages of aquaticorganisms and they are enriched with algal mats (lab-lab) composed mainly of nitrogen-fixing cynobacteria.
Salt marshes, particularly those on the northwestern coast, where shrimp farming has become the mostlucrative economic activity since the early eighties, have undergone extensive loss and degradation; moreso than the mangroves. Mangroves, for their dominant tree flora, are widely recognized as productiveecosystems that support coastal fisheries, in terms of organic food (detritus) for the food webs, as refugeand nurseries for the juveniles and as habitats for most estuarine organisms. Mangroves therefore areprotected to a certain extent, as a result of protests by conservationists and the public. On the other handthe ecological role of salt marshes are not reckoned as important as that of the mangroves. Consequently,most of the salt marsh areas have been sacrificed for shrimp farming and salt production. During the decade1981 to 1992, nearly half (49%) the salt marshes around Puttalam lagoon have been converted.
Seagrasses
A total of eight species of seagrasses have been recorded from the coastal lagoons of Sri Lanka (Jayasuriya,1991; Johnson and Johnston, 1995; Amarasinghe and Pahalawattaarachchi, 1996; Amarasinghe et al,2003). Halophila ovalis, Halodule pinifolia, and H. uninervis are the most widely distributed species in thelagoons from Mundel lake to Rekawa lagoon on the northwestern and southwestern coasts, respectively.Larger species such as Enhalus acaroids (blades extend up to 1 m), Thlassia hemprichii and Syringodiumsp. occur in the northern part of Puttalam lagoon, Dutch bay, Portugal bay and Palk bay where the waterdepth is relatively high. Seagrass communities near the estuaries, where the salinity of water drops duringthe rainy season, Potamgeton sp. and Ruppia maritima dominate.
35
Seagrass communities are the habitats of a large number of aquatic fauna, particularly during their juvenilestages. Fishing methods such as cast and push nets, brush parks and fish traps are practiced in seagrassbeds in shallow coastal areas where fish are found in abundance. These methods of fishing damage anddestroy seagrass blades, but their rhizomes (underground stems) regenerate the following growing season.However, the greatest damage to seagrasses is caused by siltation, particularly around the Mi Oya estuary,which discharges in to Puttalam lagoon, and where a large number of shrimp farms operate. The dischargeof farm effluents containing large loads of organic matter has caused a visible decline of seagrass andseaweeds (particularly Gracilaria lichenoides) in the Puttalam lagoon. This in turn has affected the fish/shrimp catches of small-scale fishermen in the area who do not have craft or gear to fish in waters awayfrom their villages.
Estuaries
Estuaries are formed in places where rivers enter the sea. The daily tidal fluctuation and the intermediatesalinity between salt and freshwater (commonly termed “brackish water”) are the main characteristics ofthis ecosystem. There are about 45 estuaries in Sri Lanka. Typical examples of estuaries with mangrove inSri Lanka are Maduganga estuary, Bentota estuary and Kala-oya estuary.
Lagoons
These are salt or brackish water coastal wetlands, separated from the sea by a low sand bank, with one ormore relatively narrow permanent or seasonal outlets to the sea. These can also harbor other coastalwetland types such as mangroves, mud flats and sea grass beds. About 42 lagoons are found around thecoast of Sri Lanka. Examples are the Bundala Lagoon, Mundel Lake, and Kalametiya Lagoon.
Conclusion
Coastal wetlands provide resources for both subsistence and commercial economies. They are alsoconstantly subjected to the pressures of coastal resources development. A considerable extent of mangrovesand salt marshes, particularly on the northwestern coast has undergone total loss or degradation, especiallydue to unscrupulous expansion of shrimp farming. The least disturbed, extensive areas of mangroves andsalt marshes at Kala Oya estuary need to be protected for their high structural diversity and associatedproductivity. Community-based traditional resource management systems in operation at Negombo lagoonare effective. A co-management strategy, with the participation of both the state and the dependentcommunities who have a genuine interest, enthusiasm and courage to conserve these vulnerable coastalwetlands would be most appropriate.
References
Amarasinghe, M.D., 2002. Ecology and economics of mangrove ecosystems : Sri Lankan scenario. Apaper presented at the Regional Workshop on ‘Assessment of Mangrove Degradation and Resilience, inthe Indian Sub-continent’ .French Institute, Pondicherry, India.
Amarasinghe, M.D. and Pahalawattaarachchi, V., 1996. Mangrove, saltmarsh and seagrass communities ofthe northwestern coast of Sri Lanka. A paper presented at the Regional Workshop on Tropical CoastalManagement. NARA/SAREC/NARESA, Colombo
Amarasinghe M. and Perera, W.K.T, 1984. A preliminary survey of peripheral vegetation communities ofPuttalam lagoon and Dutch bay. Proc. 40th Annual Sessions of SLAAS
36
Amarasinghe, M.D. and Balasubramaniam, S. 1992. Structural properties of two types of mangrove standson the north-western coast of Sri Lanka. Hydrobiologia; 247, 17-27
Amarasinghe, M. and Balasubramaniam, S., 1992. Net primary productivity of two mangrove stands in alagoon on the north western coast of Sri Lanka.; Hydrobiologia; 247, 37-47
Amarasinghe, M.,1988. Socio-economic status of human communities of selected mangrove areas on thewest coast of Sri Lanka. UNESCO Occasional Paper 3; 3p.
Aruchelvam, K., 1968. Mangroves. The Ceylon Forester, 83 (4 & 5) : 92 pp.
CCD, 1986. Master plan on coastal erosion management. Coast Conservation Department and DanishHydraulic Institute, Colombo. Vol. 1: 142.
Dayaratne, P, Gunaratne, A.B.A.K. and Alwis, M.M., 1995. Fish resources and fisheries in a tropicallagoon system in Sri Lanka. Ambio, 24 (7-8): 423-437
Jayasuriya, P.M.A., 1991. The seagrass composition, abundance and distribution of seagrass communitiesin Puttalam lagoon. Vidyodaya Journal of Science, 3920; 93-102
Jayatissa, L.P., Dahdouh-Guebas, F. and Koedam, N., 2002. A review of the floral composition anddistribution of mangroves of Sri Lanka. Botanical Journal of the Linnean Society, 138:29-43.
Johnsn, p. and Johnston, R., 1995. Productivity and nutrient dynamics of tropical seagrass communities ofPuttalam lagoon,. Sri Lanka. Ambio,24 (7-8):411-417
Pahalawattaarachchi, V. and Amarasinghe, M.D. 1997. Leaf litter decomposition and changes in leaf C:Nratios in the mangals of Negombo lagoon. Sri Lanka J. Aquat.Sci, 2: 29-41
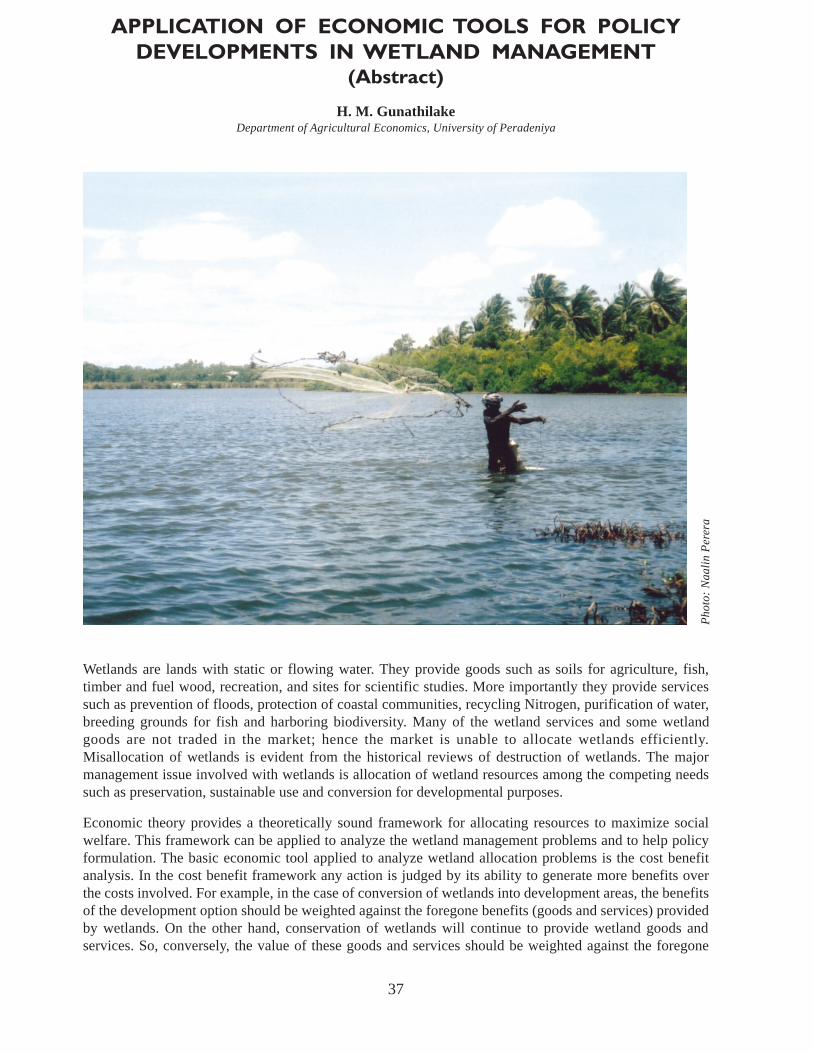
37
APPLICATION OF ECONOMIC TOOLS FOR POLICYDEVELOPMENTS IN WETLAND MANAGEMENT
(Abstract)
H. M. GunathilakeDepartment of Agricultural Economics, University of Peradeniya
Wetlands are lands with static or flowing water. They provide goods such as soils for agriculture, fish,timber and fuel wood, recreation, and sites for scientific studies. More importantly they provide servicessuch as prevention of floods, protection of coastal communities, recycling Nitrogen, purification of water,breeding grounds for fish and harboring biodiversity. Many of the wetland services and some wetlandgoods are not traded in the market; hence the market is unable to allocate wetlands efficiently.Misallocation of wetlands is evident from the historical reviews of destruction of wetlands. The majormanagement issue involved with wetlands is allocation of wetland resources among the competing needssuch as preservation, sustainable use and conversion for developmental purposes.
Economic theory provides a theoretically sound framework for allocating resources to maximize socialwelfare. This framework can be applied to analyze the wetland management problems and to help policyformulation. The basic economic tool applied to analyze wetland allocation problems is the cost benefitanalysis. In the cost benefit framework any action is judged by its ability to generate more benefits overthe costs involved. For example, in the case of conversion of wetlands into development areas, the benefitsof the development option should be weighted against the foregone benefits (goods and services) providedby wetlands. On the other hand, conservation of wetlands will continue to provide wetland goods andservices. So, conversely, the value of these goods and services should be weighted against the foregone
Ph
oto
: N
aa
lin P
ere
ra
38
benefits of development. When development options provide greater benefits, the conversion of a certainamount of wetlands is inevitable.
Since there are many market failures involved, available market prices for wetland goods are inefficient.Moreover, the wetland services are not traded in the market, and hence there is no market price. In thiscontext, non-market valuation techniques play an important role in estimating the economic value ofwetlands. The total economic value framework provides important guidelines in conducting valuation ofwetlands. Depending on the situation and type of wetland goods and services, various valuation methodssuch as opportunity cost approach, productivity change methods, travel cost method, hedonic pricingmethod, contingent valuation method, and choice experiments methods can be used to value differentaspects of wetlands.
The cost benefit analysis approach is a very useful tool in organizing the available information in asystematic manner. When applied with objectivity and the necessary skills, it provides helpful guidelinesfor decision-making. However, cost benefit analysis should be viewed as an aid in decision making ratherthan a rigid rule of decision making.
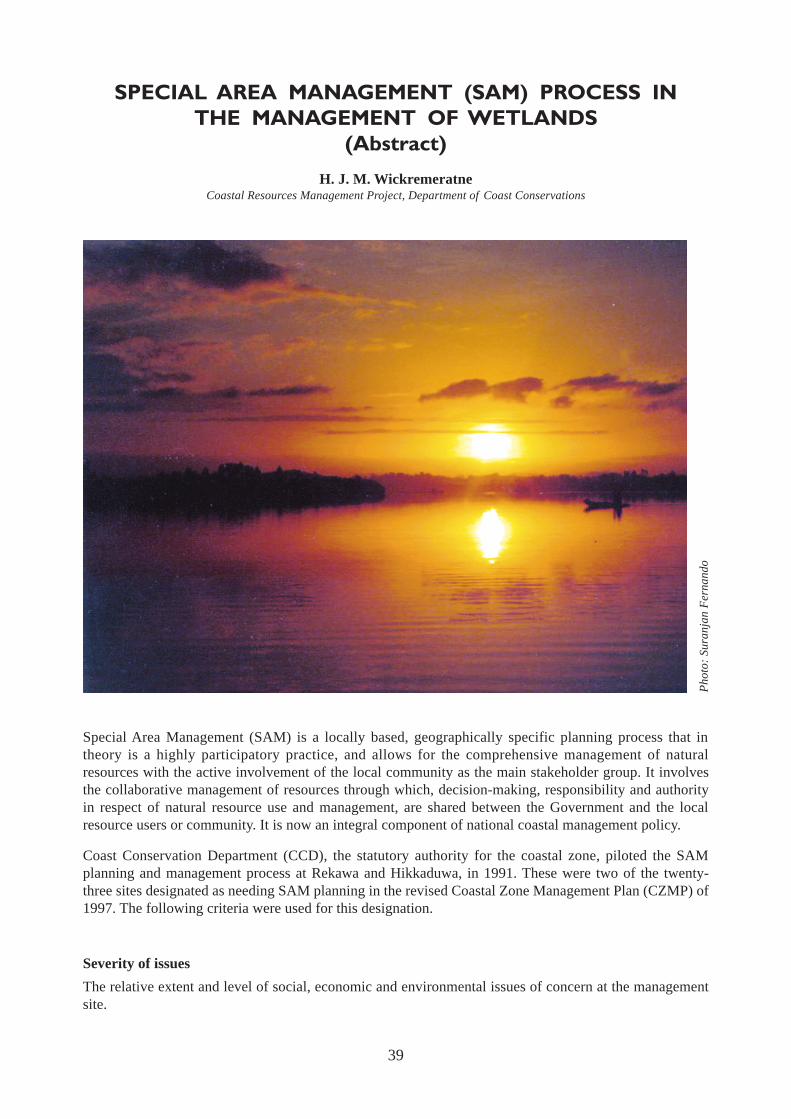
39
SPECIAL AREA MANAGEMENT (SAM) PROCESS INTHE MANAGEMENT OF WETLANDS
(Abstract)
H. J. M. WickremeratneCoastal Resources Management Project, Department of Coast Conservations
Special Area Management (SAM) is a locally based, geographically specific planning process that intheory is a highly participatory practice, and allows for the comprehensive management of naturalresources with the active involvement of the local community as the main stakeholder group. It involvesthe collaborative management of resources through which, decision-making, responsibility and authorityin respect of natural resource use and management, are shared between the Government and the localresource users or community. It is now an integral component of national coastal management policy.
Coast Conservation Department (CCD), the statutory authority for the coastal zone, piloted the SAMplanning and management process at Rekawa and Hikkaduwa, in 1991. These were two of the twenty-three sites designated as needing SAM planning in the revised Coastal Zone Management Plan (CZMP) of1997. The following criteria were used for this designation.
Severity of issues
The relative extent and level of social, economic and environmental issues of concern at the managementsite.
Ph
oto
: S
ura
nja
n F
ern
an
do
40
Biodiversity
The relative richness and abundance of coastal ecosystems and their function as a habitat for organisms
Viability
The feasibility of management, assessed on the basis of size, location and legal and institutional factors,which may help or hinder the management process.
Economic Significance
The existing or potential value of economic development at the management site.
CZMP selected 23 sites, ranked in order of priority, for SAM planning. The two pilot sites selected wereamong the top eight. CZMP also undertook the designing of single-issue collaborative plans for sites thatwere geographically smaller, less complex and characterized by fewer user conflicts. These sites were tobe designated as “areas of particular concern” (APC).
The SAM Plan for the Rekawa Lagoon was published in 1995 and the plan for the Hikkaduwa MarineSanctuary in 1996. In the ensuing period SAM Planning effort was continued with the preparation of plansfor the Chilaw Lagoon, Arugam Bay and Unawatuna. Similar plans were prepared for the HambantotaSand Dunes and Mawella Lagoon, Kudawella coastal area under the Hambantota Integrated Coastal ZoneManagement Project (HICZMP).
In a major parallel effort, Coastal Resource Based Management was initiated in 1989 for theMuthurajawela Marsh and the Negombo Estuarine Coastal Wetland system by the Board of Investmentwith Dutch Government finance and technical assistance on a directive of the Executive President of SriLanka. This approach was based upon the Special Area Management Guidelines formulated through aworldwide institutional survey relating to coastal management. The planning was concluded in 1991,whereupon the plan received Cabinet Approval.
The CCD, based on the experience gained, perceives SAM Planning as effective for managingdevelopment in complex settings. Currently, under the Netherlands Government Financed CoastalEnvironment and Resource Management (CERM) Component of the Asian Development Bank fundedCoastal Resources Management Project (CRMP), SAM Plans are being prepared for five new sites (BarReef, Kalametiya, Maduganga, Lunawa, Unawatuna-Koggala) and the work of Mawella, Negombo-Muthurajawela and Hikkaduwa are being continued.
The Revised Coastal Zone Management Plan, which is being finalised at present, designates 27 sites forSpecial Area Management and 23 sites as areas of special concern. It also stipulates that SAM/APC Plansonce prepared shall be submitted for approval by the Cabinet of Ministers. The Coast Conservation Act isalso being amended to include, the entirety of the area designated in the SAM/APC Plan, within the definedcoastal zone to confer legal status to the site, and facilitate the specification of regulations for itsmanagement.

41
THE SIGNIFICANCE OF BIODIVERSITY ASSESSMENTSFOR CONSERVATION AND MANAGEMENT
OF WETLANDS(Abstract)
C. N. B. BambaradeniyaIUCN - The World Conservation Union
Introduction on biodiversity assessments
Biodiversity assessments are comprised of either or both of two elements: inventorying (measuring) andmonitoring. There is an important difference between measuring biodiversity and monitoring changes inbiodiversity. Measuring/inventorying biodiversity provides a snapshot of biodiversity (eg. number of plantand animal species) in a particular location, at the time of the measurement. It is useful for spatialcomparisons of biodiversity. In contrast, monitoring involves measuring trends and changes over time, todetermine the impact of anthropogenic or natural factors on biodiversity. Monitoring could also determinewhether management interventions are achieving the desired conservation goals and provide a basis forcorrective action. An inventory provides the necessary baseline data for monitoring the effects ofanthropogenic disturbance or natural phenomena such as climate change on the biota.
International agreements that highlight biodiversity inventorying and monitoring
Recent International Agreements and Strategies have recognized the need for inventories and monitoringof biological diversity. The Convention on Biological Diversity (CBD) requires signatory parties to
Ph
oto
: S
an
jiv D
e S
ilva
42
identify components of biodiversity, of importance for conservation and sustainable use, and then monitorthe identified components through sampling and other techniques. The Convention on Wetlands (RamsarConvention) has paid considerable attention to the importance of wetland inventorying, assessment andmonitoring as tools for the conservation and wise use of wetlands, and a separate resolution for wetlandinventorying was also approved at the last meeting of the contracting parties held in Spain, 2002. Similarly,the Agenda 21 and the Global Biodiversity Strategy has also identified the significance of inventoryingand monitoring, for the conservation of biodiversity.
General methodology for a biodiversity survey
Applications of biodiversity assessments for conservation and management of wetlands
Biodiversity inventories and monitoring have a variety of applications pertaining to conservation andmanagement of wetlands, which could be highlighted as follows:
● Provide information for determining and conserving biological diversity associated withwetlands.Assess the status/ecosystem health of wetlands.Facilitate the identification of wetland hotspots for conservation of biodiversity in a country/region.
● Provide information necessary for the sustainable management of natural resources in wetlandsPlanning of sustainable fisheries.Zoning to Facilitate Economic Evaluations.
● Determine changes and threats to wetlands, including anthropogenic and natural threats (e.g.climate change impacts)Wetland risk assessment (using appropriate indicators for early warning).Facilitate Environmental Impact Assessment.
● Planning and implementation of wetland restoration activities.Plan and implement recovery programmes for endangered species.Management of invasive alien species.Community Based participatory monitoring
● Facilitate the formulation and implementation of wetland conservation legislation and policiesbased on scientific information.
● Integrating wetland conservation into river basin managementDetermine minimum flows that are required to sustain ecological processes. Plan out trans-boundarystrategies for conservation of wetlands.
● Determine the aesthetic benefits of wetland biodiversity that would enable to enhance the qualityof human lifePromotion of nature-based tourism.
● Contribute towards education and awareness on wetland conservationPlan out research.Raise public awareness.
● Gathering of published informationPrevious work on the particular location/surrounding areasField guides on fauna and floraLand use/vegetation maps
43
● Design field-sampling techniques for fauna and floraDetermine the plant and animal taxa to be surveyed, and design specific methodologies for each group.Determine sampling duration/frequencyFormation of a team of field biologists
● Reconnaissance surveyFamiliarization with the study areaIdentification of major habitats, based on vegetation and soil typesIdentification of representation sampling sites for temporal assessmentVerification of pre-planned sampling techniques
● Systematic, regular field sampling
● Preparation of maps
● Documentation of threats using suitable indicators

44
SOCIO-ECONOMIC AND POLICY ISSUES INFLUENCINGTHE SUSTAINABILITY OF LIVELIHOODS IN RURAL
COASTAL WETLAND AREAS IN SRI LANKA
Sonali Senaratna SellamuttuImperial College, London
Alexandra Clemett Stockholm Environment Institute, York
Ph
oto
: P
rasa
nn
a W
ee
rakk
od
y
Two complementary projects were conducted in the Rekawa, Kalametiya and Malala coastal wetland areason the southern coast of Sri Lanka with the aim of impacting positively on the livelihoods of coastalcommunities by contributing to the understanding of coastal policy processes such as Special AreaManagement (SAM), as well as testing different methodological approaches in measuring livelihoodsustainability at the household-level. A number of Participatory Rural Appraisal (PRA) techniques wereadopted in the research, which allowed evaluation of socio-economic and policy issues at the intra-household, household and community scale and linked these to national policies.
The research found a 48 % change in livelihoods over the past 10 years primarily due to natural resourcedegradation. Principally, the number of lagoon fishermen has declined because irrigation developmentshave affected lagoons, and many state that they face more economic and environmental hardships todaythan 10 years ago. The effects of irrigation water on lagoon ecosystems and the people who depend onthem, are an example of the coastal policy’s difficulty in dealing with factors outside the coastal zone.SAM attempts to address this by including all relevant government agencies but integration needs to bestrengthened and extended beyond SAM sites.
The SAM process in Rekawa was received relatively well by the community with 52 % of thoseinterviewed having a positive impression, but failure to introduce effective alternative income generatingactivities, particularly to displaced coral miners, has led to some resentment. In Kalametiya, the nascent

45
character of SAM activities meant that fewer than 10 % of those interviewed were aware of SAM. Evenfewer were aware of the Coast Conservation Department (CCD) in Malala, indicating its limited activitiesoutside SAM sites.
SAM has many positive attributes but lessons need to be learned from the original sites. Primarily,approaches need to be more clearly defined, including strategies to engage livelihood groups to manageresources, and to provide alternative livelihoods. SAM should be integrated into a wider strategy foraddressing coastal livelihoods and resource degradation on a national scale.
Introduction
This paper presents the findings of two linked projects conducted in Hambantota District, on the southerncoastline of Sri Lanka. Although the aims of the projects differed, both projects used a livelihoodsapproach and were intended to contribute to a greater understanding of the livelihoods of rural coastalcommunities and coastal policy impacts.
The Imperial College, London, PhD research aims to analyse the socio-economic and policy factorsinfluencing the sustainability of natural resource-based livelihoods in rural coastal households, utilisingthree methodological approaches: livelihood security; food security; and personal security. The researchhas two broad objectives: first, to investigate the merits and limitations of the three approaches atmeasuring livelihood sustainability at the household level; and second, to assess how participation incertain coastal zone management policy processes has affected rural coastal livelihoods. The main policycomponent considered in this research is “Special Area Management” (SAM), an approach involvingcommunities co-managing coastal resources in partnership with the government, to address poverty andunsustainable resource use practices.
The Stockholm Environment Institute (SEI) research forms part of a Department for InternationalDevelopment (DFID) funded project, “Improving Policy-Livelihood Relationships in South Asia”, whichhas as its goal, development and promotion of practical policy options to support livelihoods and reducethe vulnerability of poor rural people. The research in Sri Lanka, conducted in collaboration with theDepartment of Sociology, Ruhuna University, aimed to identify the impact of the Coastal ZoneManagement Plan (CZMP) on coastal communities, to map policy activities to livelihood impacts and tounderstand how communities are able to engage with the policy process. To do this a livelihoods approachwas adopted to analyse:
● The outputs of policy - for example the formation of user groups
● The outcomes of policy - for example increasing participation in local collective decision-making
● The impacts of policy on households’ livelihoods - for example enhanced flows of coastal productsand increased income
How can we assess the ‘sustainability of livelihoods’?
The concept of livelihoods, which is utilised in both projects, has gained wide acceptance as a valuablemeans of understanding the factors that influence people’s lives and well-being, particularly those of thepoor in the developing world, and has been adopted by numerous development agencies including UNDPand DFID (Carney, 1998; Davies, 1996; Rennie and Singh, 1996; in Soussan, Blaikie, Springate-Baginskiand Chadwick, 2001). There are many definitions of livelihoods, but the definition presented by Carney(1998) based on the work of Robert Chambers and Gordon Conway (1992), is most often cited. Accordingto Carney (1998): “A livelihood is considered to be sustainable when it can cope with and recover fromstresses and shocks and maintain or enhance its capabilities and assets both now and in the future, whilenot undermining the natural resource base”.
46
Central to the livelihoods approach is that households have complex livelihood strategies based onactivities that provide income, in cash, goods and services. The basis for these strategies is the five capitalassets that are accessible to a household.
These are:
● Human capital, including skills and education
● Natural capital, such as water, fuel wood and fish
● Financial capital, including cash and credit
● Physical capital, such as roads and boats
● Social capital, their friendships, and social and political relationships
No single category of assets is sufficient to yield all the many and varied livelihood outcomes that peopleseek, such as reduced vulnerability, more income, increased well-being, improved food security andsustainable use of natural resources. This is particularly true for poor communities whose access to anygiven category of assets tends to be very limited (DFID, 2001).
One aspect of a household’s livelihood system is food security, which has been defined as “The state ofaffairs where all people at all times have physical and economic access to adequate, safe and nutritiousfood for all household members, without undue risk of losing such access” (FAO, 1996). Food security canbe measured using indicators such as food coping strategies: ‘short term temporary responses to decliningfood entitlements’. Empirical studies have shown that households when facing a crisis do not respondarbitrarily to variability in food supply, but use a succession of coping strategies to remain food secure andto maintain their livelihood systems (Davies, 1993; Malleret-King, 2000). Likewise during periods ofsurplus, households adopt various accumulation and investment strategies. Under the food securityapproach adopted by the Imperial College study, four sets of strategies were investigated to determine howa household reacts to short-term versus long-term and crisis versus non-crisis situations. These were:
● Short-term coping strategies
● Long-term coping or adaptive strategies - permanent changes in the combination of ways in whichfood is acquired irrespective of the year in question
● Short-term accumulation strategies - responses to short-term periods of surplus
● Long-term accumulation strategies - responses to long-term periods of surplus
The food security indicators provide information on the vulnerability of the households in the differentcommunities studied, highlighting differences across and within these communities. Linked withlivelihoods analysis, a food security approach can be used to determine whether the causes of foodinsecurity are linked to other aspects of livelihoods, for example the main income generating activity of ahousehold or policy intervention.
Within the context of a sustainable livelihoods approach, well being, otherwise known as personal security,is one aspect that has not received much attention in the past, although it may play an important role ininfluencing a community’s decisions and subsequent actions. In the Imperial College study, ‘personal well-being and security’ are defined by subjective feelings such as depression, hope and happiness thatfundamentally determine people’s satisfaction with life and their level of security. This could include arange of factors such as those related to achieving livelihood security and food security, amongst others. Amatrix of human needs developed by Max-Neef (1991) is being adapted and will attempt to assess thesense of well-being and personal security felt by the communities in the study sites. Indicators of personalsecurity are undoubtedly community-specific and probably gender-specific, and the study investigatesthese differences and why individuals in the study site perceive their own well-being in a certain manner.The personal security aspect of the study aims to score each individual in the selected sample as to howthey perceive themselves, in terms of, for example, their happiness, aspirations, fears and contentment andthen relate these perceptions to factors such as their wealth, livelihood activity, and the participation incollaborative management processes such as SAM.
47
Research Methodology
The research was conducted in three coastal wetland lagoon systems, selected because of the interest instudying the impact of the SAM process on the sustainability of livelihoods in coastal areas, and for theirsimilar natural resource problems. The sites selected were Rekawa, an established SAM site andKalametiya, where SAM activities were initiated in 2002. The SEI project also selected a non-SAM site,Malala, to provide a with-without comparison of the impacts of the CZMP, particularly in relation to SAM.
In each of the three sites, three villages were selected for the research, on the basis of proximity to thelagoon and coast, and the range of livelihood activities undertaken there. These activities included anumber of natural resource uses such as lagoon and sea fishing, paddy farming, buffalo farming, homesteadgardening, coral mining, coconut cultivation, shell mining, turtle egg-collecting and the use of mangroveproducts.
In each village a preliminary household list was compiled, including primary livelihood activity, and arandom stratified sample of 35 households was selected based on primary livelihood activity and wealthrank. Wealth rankings were undertaken with at least three groups in each village (male, female and amixed group). The participants were asked to place only those households that they knew into pilesaccording to their perceptions of wealth. They were then asked to define each wealth category.
Other research techniques used in the projects to understand livelihood dynamics, natural resource usepatterns and policy impacts include: village mapping, household questionnaire surveys with 315households, semi-structured interviews, focus group discussions and 5 intra-household interviews in eachvillage. The Imperial College study conducted additional household surveys on food security, personalsecurity and natural resource uses. Interviews were also held with government officials, from the local tothe national level, to understand the policy process from inception, through interpretation and on toimplementation, and the institutional and policy mechanisms operating in the sites.
The survey includes questions about both past and current livelihoods, to facilitate assessment of thefactors affecting sustainability of livelihoods, to identify coastal zone management issues in relation tolivelihoods and to determine what, if any, coastal zone management activities are taking place and howthey impact on livelihoods. Questionnaires were addressed to male and female respondents separately sothat gender perspectives could be assessed.
These methodologies allow evaluation of socio-economic and policy issues that span from the intra-household, to the community level and beyond.
The findings are therefore presented in this expanding framework with results from:
● The intra- and inter-household level, where personal security and food security variations wereobserved and proved valuable tools in highlighting the differences within and between households andsites
● The community level where environmental and policy factors impact on household livelihoodstrategies and where components of SAM are valuable in addressing natural resource managementproblems
● Factors beyond the community level but where impacts are felt at the community and household level,and where comprehensive resource management policies that include cooperation betweengovernment departments, are required.
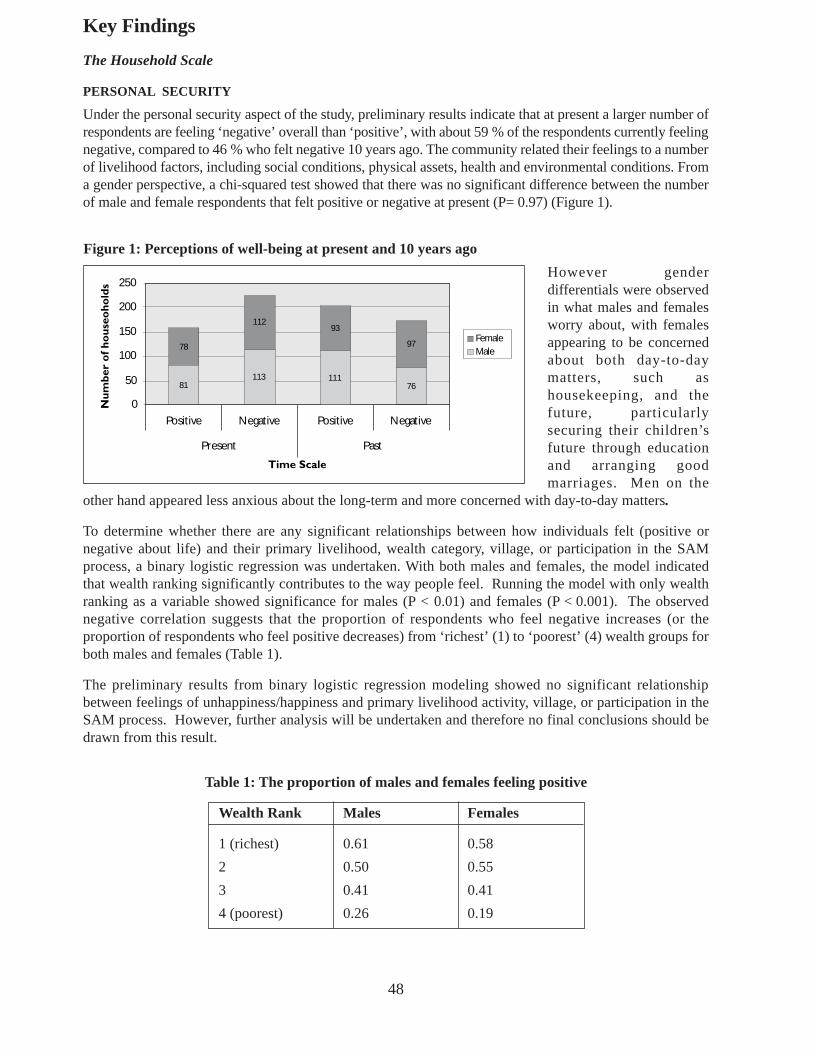
48
Key Findings
The Household Scale
PERSONAL SECURITY
Under the personal security aspect of the study, preliminary results indicate that at present a larger number ofrespondents are feeling ‘negative’ overall than ‘positive’, with about 59 % of the respondents currently feelingnegative, compared to 46 % who felt negative 10 years ago. The community related their feelings to a numberof livelihood factors, including social conditions, physical assets, health and environmental conditions. Froma gender perspective, a chi-squared test showed that there was no significant difference between the numberof male and female respondents that felt positive or negative at present (P= 0.97) (Figure 1).
However genderdifferentials were observedin what males and femalesworry about, with femalesappearing to be concernedabout both day-to-daymatters, such ashousekeeping, and thefuture, particularlysecuring their children’sfuture through educationand arranging goodmarriages. Men on the
other hand appeared less anxious about the long-term and more concerned with day-to-day matters.
To determine whether there are any significant relationships between how individuals felt (positive ornegative about life) and their primary livelihood, wealth category, village, or participation in the SAMprocess, a binary logistic regression was undertaken. With both males and females, the model indicatedthat wealth ranking significantly contributes to the way people feel. Running the model with only wealthranking as a variable showed significance for males (P < 0.01) and females (P < 0.001). The observednegative correlation suggests that the proportion of respondents who feel negative increases (or theproportion of respondents who feel positive decreases) from ‘richest’ (1) to ‘poorest’ (4) wealth groups forboth males and females (Table 1).
The preliminary results from binary logistic regression modeling showed no significant relationshipbetween feelings of unhappiness/happiness and primary livelihood activity, village, or participation in theSAM process. However, further analysis will be undertaken and therefore no final conclusions should bedrawn from this result.
Table 1: The proportion of males and females feeling positive
Wealth Rank Males Females
1 (richest) 0.61 0.58
2 0.50 0.55
3 0.41 0.41
4 (poorest) 0.26 0.19
113 11176
78
112
97
0
50
100
150
200
250
Positive Negative Positive Negative
Present Past
Time Scale
Num
ber
of h
ous
eoho
lds
FemaleMale
81
93
Figure 1: Perceptions of well-being at present and 10 years ago
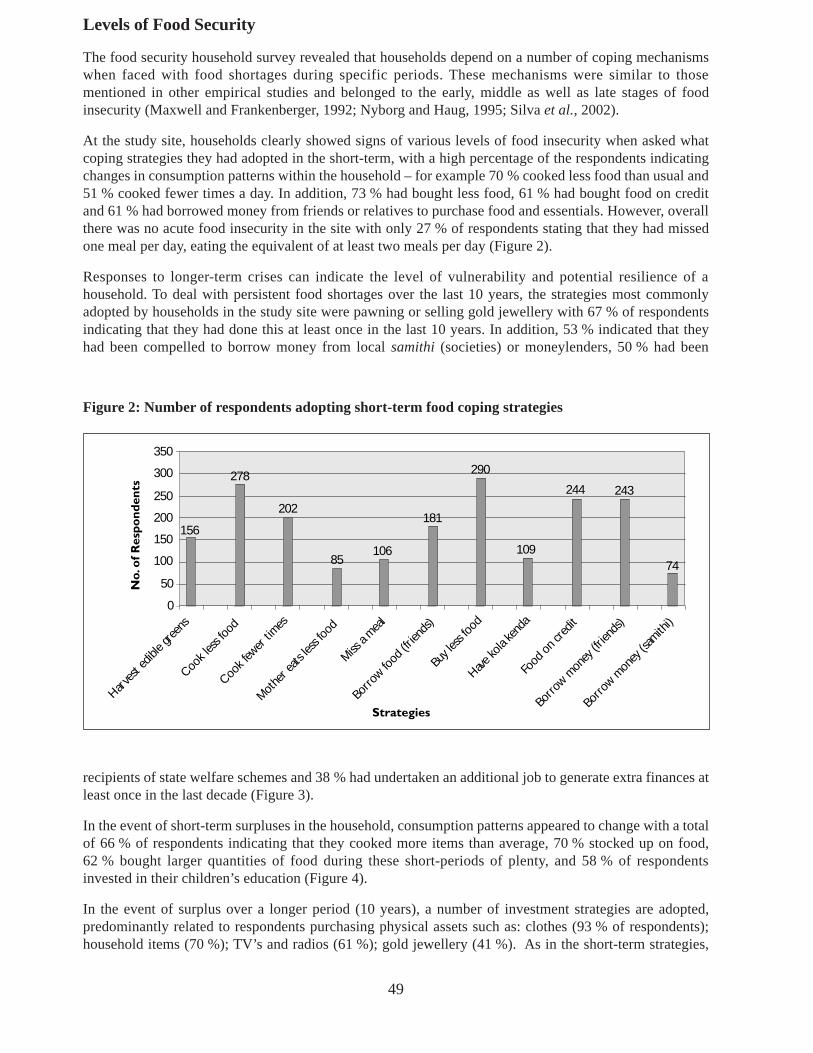
49
Levels of Food Security
The food security household survey revealed that households depend on a number of coping mechanismswhen faced with food shortages during specific periods. These mechanisms were similar to thosementioned in other empirical studies and belonged to the early, middle as well as late stages of foodinsecurity (Maxwell and Frankenberger, 1992; Nyborg and Haug, 1995; Silva et al., 2002).
At the study site, households clearly showed signs of various levels of food insecurity when asked whatcoping strategies they had adopted in the short-term, with a high percentage of the respondents indicatingchanges in consumption patterns within the household – for example 70 % cooked less food than usual and51 % cooked fewer times a day. In addition, 73 % had bought less food, 61 % had bought food on creditand 61 % had borrowed money from friends or relatives to purchase food and essentials. However, overallthere was no acute food insecurity in the site with only 27 % of respondents stating that they had missedone meal per day, eating the equivalent of at least two meals per day (Figure 2).
Responses to longer-term crises can indicate the level of vulnerability and potential resilience of ahousehold. To deal with persistent food shortages over the last 10 years, the strategies most commonlyadopted by households in the study site were pawning or selling gold jewellery with 67 % of respondentsindicating that they had done this at least once in the last 10 years. In addition, 53 % indicated that theyhad been compelled to borrow money from local samithi (societies) or moneylenders, 50 % had been
recipients of state welfare schemes and 38 % had undertaken an additional job to generate extra finances atleast once in the last decade (Figure 3).
In the event of short-term surpluses in the household, consumption patterns appeared to change with a totalof 66 % of respondents indicating that they cooked more items than average, 70 % stocked up on food,62 % bought larger quantities of food during these short-periods of plenty, and 58 % of respondentsinvested in their children’s education (Figure 4).
In the event of surplus over a longer period (10 years), a number of investment strategies are adopted,predominantly related to respondents purchasing physical assets such as: clothes (93 % of respondents);household items (70 %); TV’s and radios (61 %); gold jewellery (41 %). As in the short-term strategies,
156
278
202
85106
181
290
109
244 243
74
0
50
100
150
200
250
300
350
Harve
st ed
ible g
reen
s
Cook l
ess f
ood
Cook f
ewer
times
Mothe
r eats
less
food
Miss a
meal
Borro
w food
(frie
nds)
Buy l
ess f
ood
Have ko
la ke
nda
Food
on c
redit
Borro
w mon
ey (f
riend
s)
Borro
w mon
ey (s
amith
i)
Strategies
No.
of R
espo
nden
ts
Figure 2: Number of respondents adopting short-term food coping strategies
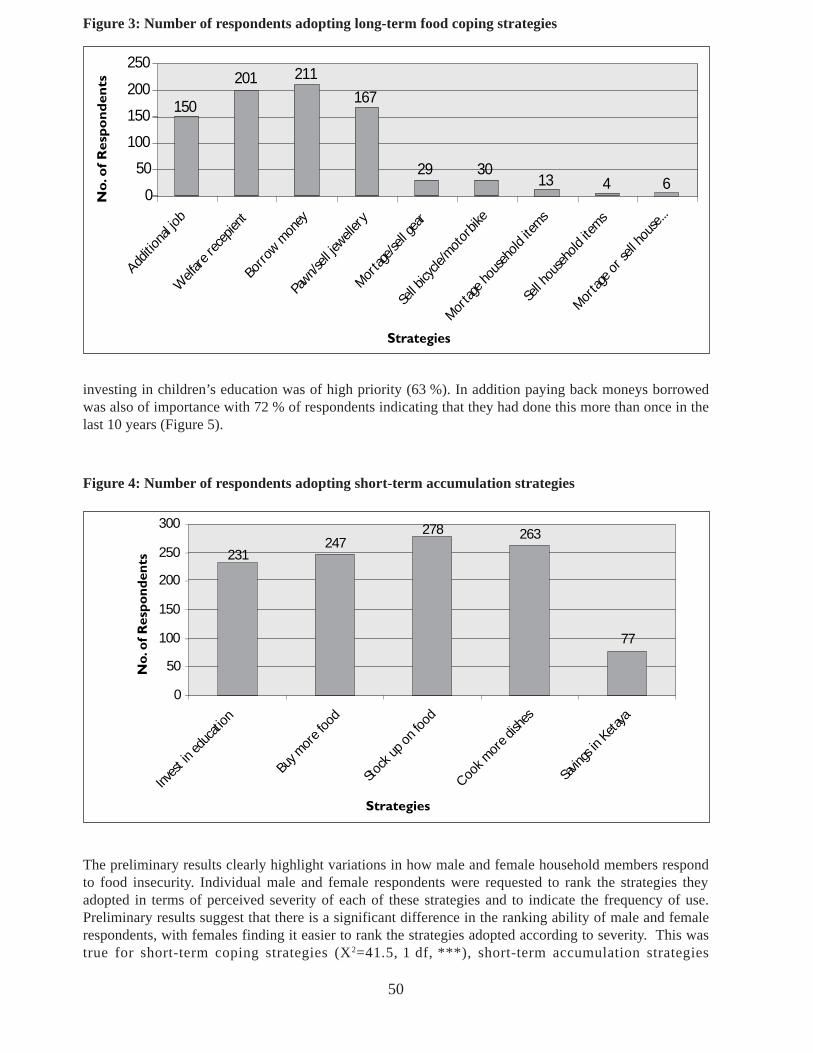
50
investing in children’s education was of high priority (63 %). In addition paying back moneys borrowedwas also of importance with 72 % of respondents indicating that they had done this more than once in thelast 10 years (Figure 5).
Figure 4: Number of respondents adopting short-term accumulation strategies
231247
278 263
77
0
50
100
150
200
250
300
Inves
t in e
duca
tion
Buy m
ore f
ood
Stock
up o
n foo
d
Cook m
ore d
ishes
Savin
gs in
Ketaya
Strategies
No.
of R
espo
nden
ts
150
201 211
167
29 3013 4 6
0
50
100
150
200
250
Additio
nal jo
b
Welf
are r
ecep
ient
Borro
w mon
ey
Pawn/s
ell je
weller
y
Mortag
e/sell
gear
Sell b
icycle
/mot
orbik
e
Mortag
e hou
seho
ld ite
ms
Sell h
ouse
hold
items
Mortag
e or s
ell ho
use..
.
Strategies
No
. of
Res
po
nd
ents
Figure 3: Number of respondents adopting long-term food coping strategies
The preliminary results clearly highlight variations in how male and female household members respondto food insecurity. Individual male and female respondents were requested to rank the strategies theyadopted in terms of perceived severity of each of these strategies and to indicate the frequency of use.Preliminary results suggest that there is a significant difference in the ranking ability of male and femalerespondents, with females finding it easier to rank the strategies adopted according to severity. This wastrue for short-term coping strategies (X2=41.5, 1 df, ***), short-term accumulation strategies

51
(X2=7.1, 1 df, **) and long-term accumulation strategies (X2=24.9, 1 df, ***). This may be becausefemales, rather than males carry out these strategies. With long term coping strategies however there wasno significant difference (P=0.09), which may be a result of males being more familiar with this particularset of strategies and therefore having a better understanding of how they perceive their severity.
Household and Community Scale
Within a household’s livelihood strategy the most widely recognised component is income generatingactivities, which provide considerable information in terms of the natural resources used by a householdand the effects that changes to these resources have on the household’s livelihood strategy. In ruralcommunities each household generally undertakes a number of activities, which they may categorise intoprimary and secondary income generating activities. The former usually contributes most to thehousehold’s income but the latter may take on a more significant role in times of stress.
In all three study areas livelihoods are predominantly based around fisheries and agriculture but householdinterviews revealed a 48 % change in primary livelihood activities, in these areas, over the past 10 years(Figure 6).
The percentage of households changing their primary livelihood activities in each area ranged fromapproximately 35 % to 65 %, with the largest change in the Malala area (Figure 7).
Some of these changes in livelihood activities were for personal reasons such as ill health and retirement.However, almost half of the households did so because of changes to the condition of natural resources,through natural processes or human intervention.
The main changes that have taken place are a move away from: lagoon fishing, due to low shrimp and fishcatches; and agriculture, due the drought conditions in the area at the time of the research. Instead they aretaking to sea fishing, agricultural labour and service outside the area.
The fishermen interviewed in Kalametiya stated that in the past about 80 % of the village were involved inlagoon fishing but this has declined to about 20 %, because of the increased competition resulting from thescare resources. They stated that the problems were mainly caused by changes to natural rainfall patternsand development of irrigation infrastructure, leading to lack of water and siltation, which reduce the sizeand depth of the lagoon; encroachment by plants; and agro-chemical pollution.
286251
371
162212
6590
279
92 118165 150
242
160
50100150200250300350400
Return
borro
wed m
oney
Inves
t in e
duca
tion
Buy c
lothe
s
Depos
it mon
ey (b
ank)
Refurb
ish ho
use
Buy a
boat
Savin
gs in
Ketaya
Buy h
ouse
hold
items
Buy p
lot o
f land
Buy f
ishing
gear
buy g
old je
weller
y
Buy b
ike/m
otor
bike
Buy h
ouse
hold
items
Loan
mon
ey
Strategies
No.
of R
espo
nden
ts
Figure 5: Number of respondents that adopted long-term accumulation strategies

52
In the past they suffered fromexcess water reaching thelagoon as it drained frompaddy lands, which reducedthe salinity of the lagoon andimpacted on fish and shrimppopulations. In all three areasconstructions at the lagoonmouth have also been aproblem, influencing theexchange between the sea andlagoon, affecting salinity andproductivity, and in particularaffecting shrimp catches.
The second major livelihood constraint cited in all three areas was “lack of water”, with 57 % ofhouseholds suffering from insufficient water not only for the lagoons but also for agriculture and domesticuses, from both open water bodies and water supply schemes (Figure 8).
It appears from discussions with the community that irrigation interventions and unpredictable rainfallpatterns, usually resulting in insufficient rain, have been the cause of much of this, affecting wateravailability for at least the past five years. This has meant that 32 % of those interviewed have been unableto cultivate their land and have been forced to work as daily paid casual labour in other areas or turn to seafishing.
However, there is considerable competition from lagoon fishermen for both activities and although farmersare usually preferred for agricultural labour, lagoon fishermen are generally selected for sea fishing. As aconsequence of the high demand for work and the declining productivity of the land, lagoons and coastalwaters, an increasing number of people are leaving the area to work in towns and abroad.
Figure 6: Number of households per village with changes to livelihood activities, over the past 10 years
Figure 7: Percentage change in livelihood activities by area
0
20
40
60
80
100
Rekawa Kalametiya Malala
Area
Perc
enta
ge
05
10152025303540
Village
Num
ber
of H
ous
eho
lds
Total sample
Livelihoodchange
Oru
wella
Bora
luwag
oda
Kepuh
enwala
Gurup
okun
aW
ewea
goda
Tuduw
aKiri
patti
yaPa
lle M
alala
Uda M
alala
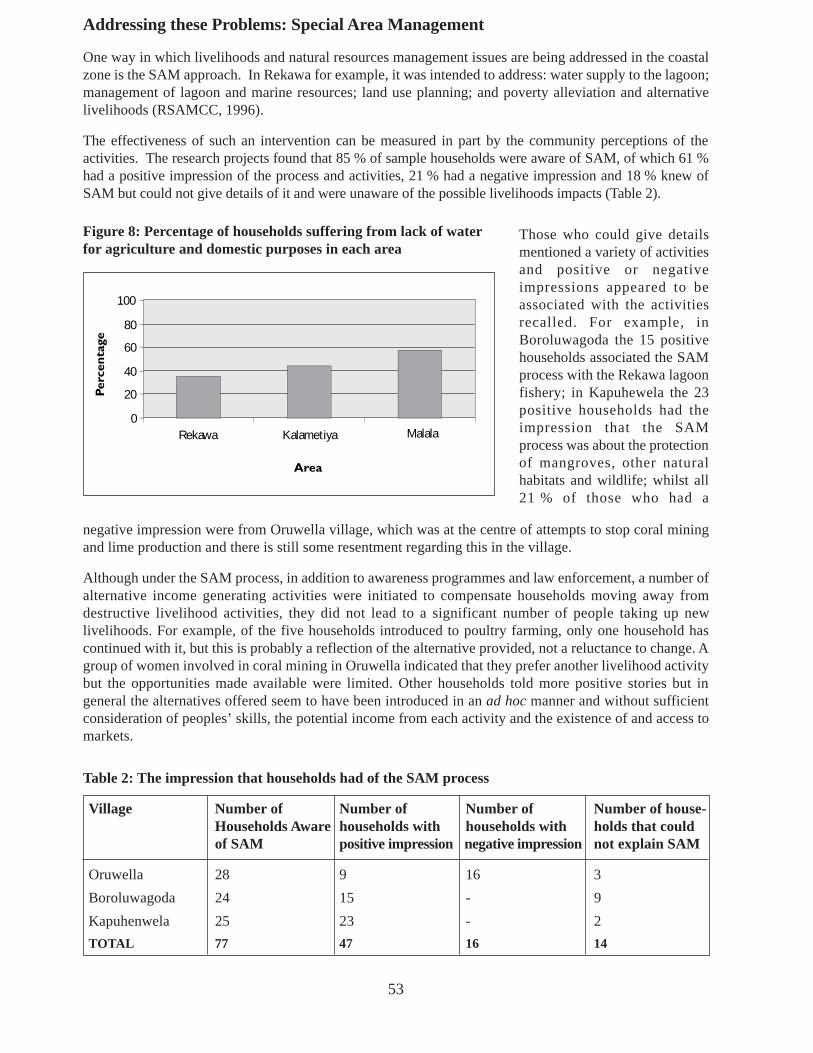
53
Addressing these Problems: Special Area Management
One way in which livelihoods and natural resources management issues are being addressed in the coastalzone is the SAM approach. In Rekawa for example, it was intended to address: water supply to the lagoon;management of lagoon and marine resources; land use planning; and poverty alleviation and alternativelivelihoods (RSAMCC, 1996).
The effectiveness of such an intervention can be measured in part by the community perceptions of theactivities. The research projects found that 85 % of sample households were aware of SAM, of which 61 %had a positive impression of the process and activities, 21 % had a negative impression and 18 % knew ofSAM but could not give details of it and were unaware of the possible livelihoods impacts (Table 2).
Table 2: The impression that households had of the SAM process
Village Number of Number of Number of Number of house-Households Aware households with households with holds that couldof SAM positive impression negative impressionnot explain SAM
Oruwella 28 9 16 3
Boroluwagoda 24 15 - 9
Kapuhenwela 25 23 - 2
TOTAL 77 47 16 14
0
20
40
60
80
100
Rekawa Kalametiya Malala
Area
Perc
enta
ge
Figure 8: Percentage of households suffering from lack of waterfor agriculture and domestic purposes in each area
Those who could give detailsmentioned a variety of activitiesand positive or negativeimpressions appeared to beassociated with the activitiesrecalled. For example, inBoroluwagoda the 15 positivehouseholds associated the SAMprocess with the Rekawa lagoonfishery; in Kapuhewela the 23positive households had theimpression that the SAMprocess was about the protectionof mangroves, other naturalhabitats and wildlife; whilst all21 % of those who had a
negative impression were from Oruwella village, which was at the centre of attempts to stop coral miningand lime production and there is still some resentment regarding this in the village.
Although under the SAM process, in addition to awareness programmes and law enforcement, a number ofalternative income generating activities were initiated to compensate households moving away fromdestructive livelihood activities, they did not lead to a significant number of people taking up newlivelihoods. For example, of the five households introduced to poultry farming, only one household hascontinued with it, but this is probably a reflection of the alternative provided, not a reluctance to change. Agroup of women involved in coral mining in Oruwella indicated that they prefer another livelihood activitybut the opportunities made available were limited. Other households told more positive stories but ingeneral the alternatives offered seem to have been introduced in an ad hoc manner and without sufficientconsideration of peoples’ skills, the potential income from each activity and the existence of and access tomarkets.

54
The decline in lagoon fishing was addressed very differently under the SAM process, with efforts torehabilitate the lagoon, and address over-fishing and destructive fishing practices through establishment ofthe Rekawa Lagoon Fisheries Cooperative Society (RLFCS) in 1995. Unfortunately by the late 1990s thesociety was no longer operating, for a number of reasons, which according to some society members,included mismanaging funds accrued from membership fees. This and other issues resulted in the membersloosing faith in the society (Joseph and Kumara, 2001; Senaratna and Milner-Gulland, 2002).
In early 2000 the fisheries society was revived with the support of a GTZ funded community fisheriesproject and the Rekawa Development Foundation, a community based organization formed under the SAMprocess. The fisheries society was renamed the Rekawa Lagoon Fisheries Management Committee(RLFMC) and a new fisheries management plan was written with the full collaboration of the members(Joseph and Seneviratne, 2000; Joseph and Kumara, 2001). Consequently there appears to be a fair degreeof positive thinking among the committee members that this may result in a more dynamic organizationthat plays an important role in lagoon resource management and sustainable livelihoods.
The RLFMC offers several generic lessons about community mobilisation for resource management thatare applicable to other resource user groups within the SAM process. For instance:
● For societies to function effectively, they should be a naturally forming group based around existingassemblages, such as livelihood groups or social groups. In many cases it is beneficial to supporttraditional groups but in cases where there are existing problems it may be necessary to form a newgroup.
● It is important to establish mechanisms to enable resource user societies to be self-sufficient. Externaltechnical and financial assistance may be necessary during the initial phases but societies should betaught how to remain self-sufficient after donor funding ceases.
● Financial transparency should be promoted as a management norm to minimize the possibility ofcorruption or mismanagement, as this could ultimately cause the resource user societies to collapse.
● Where conflicts over resource use arise, conflict resolution techniques should be employed andmembers of societies trained in conflict resolution and mitigation.
Other SAM Sites
The successes and limitations of the SAM process and activities in Rekawa can provide a sound basis fordetermining the methodology to be applied in Kalametiya and other new SAM sites, where similarproblems exist. However, there is a danger that without a full evaluation of the impacts of activities inRekawa lessons may not be learnt and implemented.
The research was unable to determine whether this was the case, largely because SAM activities were onlyinitiated in Kalametiya in mid-2002, around the time that this research was taking place. At that timefewer than 10 % of the households interviewed were aware of the SAM process but follow up work thisyear suggests greater awareness, and a second phase of research beginning now under the Imperial Collegeproject should provide better data on this.
Discussions with those involved in the SAM process suggest that community mobilisation and awarenessraising has been taking place this year and the community have mentioned that training, for example inmotor mechanics, have been started.
External Influences
The community management strategy employed by SAM is critical to ensuring sustainable natural resourcemanagement and livelihoods, and the potential for success has been demonstrated in various naturalresource management sectors. However, the example of coastal zone management is complicated by the
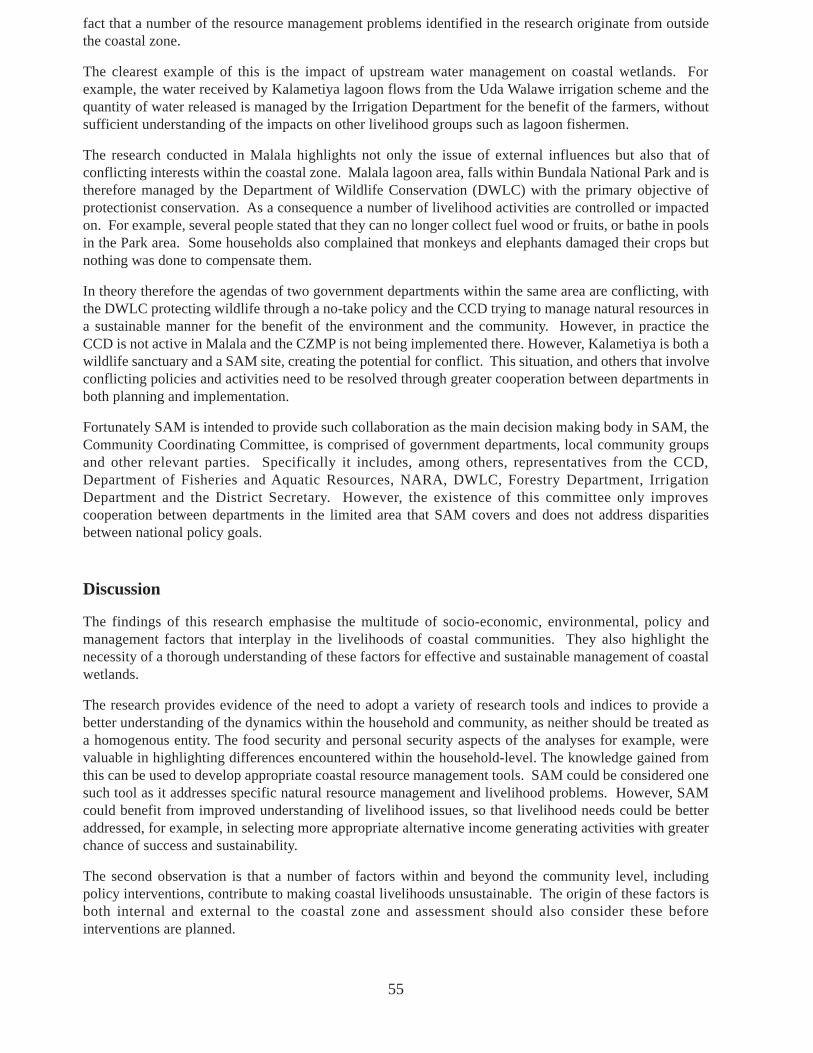
55
fact that a number of the resource management problems identified in the research originate from outsidethe coastal zone.
The clearest example of this is the impact of upstream water management on coastal wetlands. Forexample, the water received by Kalametiya lagoon flows from the Uda Walawe irrigation scheme and thequantity of water released is managed by the Irrigation Department for the benefit of the farmers, withoutsufficient understanding of the impacts on other livelihood groups such as lagoon fishermen.
The research conducted in Malala highlights not only the issue of external influences but also that ofconflicting interests within the coastal zone. Malala lagoon area, falls within Bundala National Park and istherefore managed by the Department of Wildlife Conservation (DWLC) with the primary objective ofprotectionist conservation. As a consequence a number of livelihood activities are controlled or impactedon. For example, several people stated that they can no longer collect fuel wood or fruits, or bathe in poolsin the Park area. Some households also complained that monkeys and elephants damaged their crops butnothing was done to compensate them.
In theory therefore the agendas of two government departments within the same area are conflicting, withthe DWLC protecting wildlife through a no-take policy and the CCD trying to manage natural resources ina sustainable manner for the benefit of the environment and the community. However, in practice theCCD is not active in Malala and the CZMP is not being implemented there. However, Kalametiya is both awildlife sanctuary and a SAM site, creating the potential for conflict. This situation, and others that involveconflicting policies and activities need to be resolved through greater cooperation between departments inboth planning and implementation.
Fortunately SAM is intended to provide such collaboration as the main decision making body in SAM, theCommunity Coordinating Committee, is comprised of government departments, local community groupsand other relevant parties. Specifically it includes, among others, representatives from the CCD,Department of Fisheries and Aquatic Resources, NARA, DWLC, Forestry Department, IrrigationDepartment and the District Secretary. However, the existence of this committee only improvescooperation between departments in the limited area that SAM covers and does not address disparitiesbetween national policy goals.
Discussion
The findings of this research emphasise the multitude of socio-economic, environmental, policy andmanagement factors that interplay in the livelihoods of coastal communities. They also highlight thenecessity of a thorough understanding of these factors for effective and sustainable management of coastalwetlands.
The research provides evidence of the need to adopt a variety of research tools and indices to provide abetter understanding of the dynamics within the household and community, as neither should be treated asa homogenous entity. The food security and personal security aspects of the analyses for example, werevaluable in highlighting differences encountered within the household-level. The knowledge gained fromthis can be used to develop appropriate coastal resource management tools. SAM could be considered onesuch tool as it addresses specific natural resource management and livelihood problems. However, SAMcould benefit from improved understanding of livelihood issues, so that livelihood needs could be betteraddressed, for example, in selecting more appropriate alternative income generating activities with greaterchance of success and sustainability.
The second observation is that a number of factors within and beyond the community level, includingpolicy interventions, contribute to making coastal livelihoods unsustainable. The origin of these factors isboth internal and external to the coastal zone and assessment should also consider these beforeinterventions are planned.

56
To address the external influences, for example, the impacts of irrigation water on lagoon fisheries, thepowers of the CCD could be extended beyond the 300 m coastal zone, but it is likely to be more effectiveand less costly to strengthen collaboration between various government departments in both policydevelopment and implementation. This would address conflicting interests both inside and outside thecoastal zone and effectively increase the area in which the CCD could implement the CZMP without anysignificant increase in manpower. This is particularly important given the limited financial and humanresources of CCD and the need for external funding for future SAM Plans.
Existing SAM Plans have had mixed success, with certain community members citing positive examplesof implementation activities and others disengaging with the process due to their dissatisfaction. However,no final evaluation or continuous monitoring is taking place in the SAM sites and the research suggeststhat this is critical to ensure the appropriateness and effectiveness of future SAM planning andimplementation. Furthermore, the results suggest that the appropriateness of policies and implementationactivities are best measured by the perceptions of the community. Consequently both independent andparticipatory monitoring and evaluation of management interventions are critical.
In conclusion, for coastal resource management policies and project interventions to be successful, theymust be targeted to address the needs of individuals and resource user groups within the communities anddeveloped around a thorough understanding of all facets of their livelihoods. This understanding can onlybe attained from targeted, participatory research that utilizes a suite of appropriate tools. The knowledgegained from this should be used to develop appropriate policies and interventions in a collaborative effortbetween relevant government departments and community members.
References
Carney, D. (ed.) (1998) Sustainable Rural Livelihoods. Department for International Development,London, UK
Chambers, R. and G. Conway (1992) Sustainable Rural Livelihoods: Practical Concepts for the 21st
Century, IDS Discussion Paper 276, Institute of Development Studies, University of Sussex, UK
Davies, S. (1993) Are coping strategies a cop out? IDS Bulletin 24(4): pp. 60-72.
Department for International Development (2001). Sustainable Livelihoods Guidance Sheets, DFID, UK.
FAO (1996) The Rome Declaration on World Food Security and the World Food Summit Plan of Action.FAO, Rome, Italy.
Joseph, L. and L. Kumara (2001) Report on Rekawa Lagoon. FCDRMP, GTZ, Sri Lanka.
Joseph, L. and S. Seneviratne (January 2000) Report on the awareness workshop held on the managementof the Rekawa Lagoon Fisheries. NARA Regional Research Centre, Rekawa, Sri Lanka.
Malleret-King, D. (2000) A food security approach to Marine Protected Area impacts on surroundingfishing communities: the case of Kisite Marine National Park in Kenya - PhD in Biological Sciences,Marine Resource Management, University of Warwick, Coventry, UK.
Max-Neef, M. (1991) Human-Scale Development – Conception, Application and Further Reflection. ApexPress, London, UK.
Maxwell, S. and T.R. Frankenberger (eds.) (1992) Household Food Security: Concepts, indicators,Measurements: A technical Review. UNICEF/IFAD, Rome, Italy.
Nyborg, I. and R. Haug (1995) Measuring household food security: A participatory process approach.Forum for Development Studies No. 1 pp. 29 – 59.

57
Rekawa Special Area Management Co-ordinating Committee (1996) Special Area Management Plan forRekawa Lagoon, Sri Lanka. Coastal Resources Management Project, Coast Conservation Department,National Aquatic Resources Agency, Colombo, Sri Lanka.
Rennie, J.K. and N. Singh (1996) Participatory Research for Sustainable Livelihoods, InternationalInstitute for Sustainable Development, Winnipeg, USA.
Senaratna, S. and E. J. Milner-Gulland (2002) Community Management of the Rekawa Lagoon Resources.IUCN. http://www.iucn.org/themes/sustainableuse/index.html
Silva, K. T., Weeratunga, N. and C. Ibarguen (July 2002). Sri Lanka Report on Community Food Profiling.Centre for Poverty Analysis (CEPA), for the UN World Food Programme, Colombo, Sri Lanka.
Soussan, J., Blaikie, P., Springate-Baginski, O. and M. Chadwick (2001) Understanding LivelihoodProcesses and Dynamics, Improving Policy-Livelihoods Relationships in South Asia, Working Paper 7,University of Leeds, Leeds, UK.
Acknowledgements
The UK Department for International Development (DFID) supports policies, programmes and projects topromote international development. DFID has provided funds for the study conducted by the StockholmEnvironment Institute, York, with the Department of Sociology, University of Ruhuna, Sri Lanka, as partof this objective but the views and opinions expressed here are not necessarily those of DFID.
Sonali Senaratna Sellamuttu is undertaking the Imperial College London PhD research project. Herresearch is supported by a British Chevening Scholarship, an International Water Management Institute(IWMI) PhD Fellowship, a Ford Foundation/IUCN Post-Fellowship grant and a University CollegeLondon Central Research Fund grant.

58
VALUING ASIA’S WETLANDS1
L. A. EmertonEcosystems and Livelihoods Group 2, IUCN Asia
Ph
oto
: S
tua
rt C
ha
pe
Wetland under-valuation: identifying the problem
In Asia, as in most parts of the world, wetland ecosystems yield a wide range of goods and services, manyof which have a high economic value. Yet, paradoxically, decision-makers have long perceived them to beof little value - seeing few economic benefits associated with wetland conservation, and few economiccosts attached to their degradation and loss. Given this tendency to under-valuation, it is hardly surprisingthat wetlands are being rapidly modified, converted, over-exploited and degraded in the interests of othermore ‘productive’ land and resource management options which appear to yield much higher and moreimmediate profits. All over the region, dam construction, irrigation schemes, housing developments andindustrial activities have had devastating impacts on wetland integrity and status, and economic policieshave often hastened these processes of wetland degradation and loss. At the same time conservation effortshave traditionally paid little attention to economic valuation - as a result it has often been hard to justify orsustain wetlands in economic terms, or for them to compete with other, often destructive, investments andland uses.
1. Modified from ‘Valuing Wetlands In Decision-Making: where are we now?’, Integrating Wetland Economic Values intoRiver Basin Management: Wetland Valuation Issues Paper #1, Water and Nature Initiative and Ecosystems and LivelihoodsGroup IUCN Asia, Colombo. 7 pp.

59
In fact, the problem is not that wetlands have no economic value, but rather that this value is poorlyunderstood, rarely articulated, and as a result is frequently omitted from decision-making. Althoughconventional analysis decrees that the ‘best’ or most efficient allocation of resources is one that maximiseseconomic returns, calculations of the returns to different land, resource and investment options have forthe most part failed to deal adequately with the value of wetland benefits. Investment appraisals of damsdo not usually consider the economic costs attached to modifying downstream river flows and hydrology,and the economic impacts of loss of wetland resources is, generally, not factored into calculations of thepotential profitability of land reclamation or conversion schemes. Cost-benefit analyses of infrastructureprojects have rarely incorporated estimates of environmental benefits and costs. The tendency has been tomake decisions based on partial information and have thus favoured short-term (and often unsustainable)development imperatives, or led to conservation regimes that generate few financial or economic benefits.In the absence of information about the value of wetland benefits, substantial misallocation of resourceshas occurred and gone unrecognised (James 1991), and immense economic costs have often been incurred.
Economic valuation can provide a powerful tool for placing wetlands on the agenda of conservation anddevelopment decision-makers. Its basic aim is to determine people’s preferences: how much they arewilling to pay for wetland goods and services, and how much better or worse off they would be as a resultof changes in their supply. By expressing these preferences, valuation aims to make wetland goods andservices directly comparable with other sectors of the economy when investments are appraised, activitiesare planned, policies are formulated, or land and resource use decisions are made. When properlymeasured, the total economic value of wetland ecological functions, services and resources frequentlyexceeds the economic gains from activities, which are based on ecosystem conversion or degradation(Barbier 1994). Although a better understanding of the economic value of wetlands does not necessarilyfavour their conservation and sustainable use, it at least permits them to be considered as economicallyproductive systems, alongside other possible uses of land, resources and funds.
Total economic value: a framework for defining wetland economic benefits
One reason for the persistent under-valuation of wetlands is that, traditionally, concepts of economic valuehave been based on a very narrow definition of benefits. Economists have seen the value of naturalecosystems only in terms of the raw materials and physical products that they generate for humanproduction and consumption, especially focusing on commercial activities and profits. These direct useshowever represent only a small proportion of the total value of wetlands, which generate economic benefitsfar in excess of just physical or marketed products.
The concept of total economic value has now become one of the most widely used frameworks foridentifying and categorising ecosystem benefits (Barbier et al 1997). Instead of focusing only on directcommercial values, it also encompasses the subsistence and non-market values, ecological functions andnon-use benefits associated with wetlands. As well as presenting a more complete picture of the economicimportance of wetlands, it clearly demonstrates the high and wide-ranging economic costs associated withtheir degradation, which extends beyond the loss of direct use values.
Looking at the total economic value of a wetland essentially involves considering its full range ofcharacteristics as an integrated system - its resource stocks or assets, flows of environmental services, andthe attributes of the ecosystem as a whole (Barber 1994). Broadly defined, the total economic value ofwetlands includes (Figure 1):
● Direct values: wetland raw materials and physical products which are used directly for production,consumption and sale such as those providing energy, shelter, foods, agricultural production, watersupply, transport and recreational facilities.
● Indirect values: the ecological functions which maintain and protect natural and human systems throughservices such as maintenance of water quality and flow, flood control and storm protection, nutrientretention and micro-climate stabilisation, and the production and consumption activities they support.
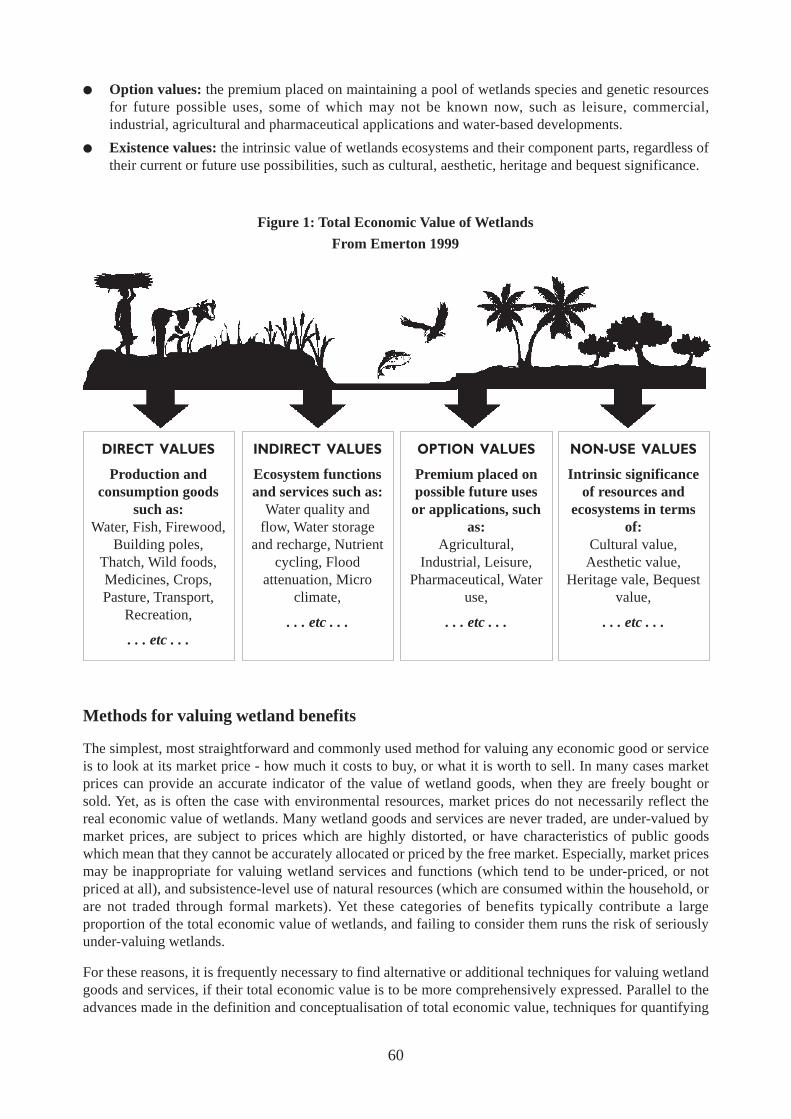
60
● Option values: the premium placed on maintaining a pool of wetlands species and genetic resourcesfor future possible uses, some of which may not be known now, such as leisure, commercial,industrial, agricultural and pharmaceutical applications and water-based developments.
● Existence values: the intrinsic value of wetlands ecosystems and their component parts, regardless oftheir current or future use possibilities, such as cultural, aesthetic, heritage and bequest significance.
Methods for valuing wetland benefits
The simplest, most straightforward and commonly used method for valuing any economic good or serviceis to look at its market price - how much it costs to buy, or what it is worth to sell. In many cases marketprices can provide an accurate indicator of the value of wetland goods, when they are freely bought orsold. Yet, as is often the case with environmental resources, market prices do not necessarily reflect thereal economic value of wetlands. Many wetland goods and services are never traded, are under-valued bymarket prices, are subject to prices which are highly distorted, or have characteristics of public goodswhich mean that they cannot be accurately allocated or priced by the free market. Especially, market pricesmay be inappropriate for valuing wetland services and functions (which tend to be under-priced, or notpriced at all), and subsistence-level use of natural resources (which are consumed within the household, orare not traded through formal markets). Yet these categories of benefits typically contribute a largeproportion of the total economic value of wetlands, and failing to consider them runs the risk of seriouslyunder-valuing wetlands.
For these reasons, it is frequently necessary to find alternative or additional techniques for valuing wetlandgoods and services, if their total economic value is to be more comprehensively expressed. Parallel to theadvances made in the definition and conceptualisation of total economic value, techniques for quantifying
Figure 1: Total Economic Value of Wetlands
From Emerton 1999
DIRECT VALUES
Production andconsumption goods
such as:Water, Fish, Firewood,
Building poles,Thatch, Wild foods,Medicines, Crops,Pasture, Transport,
Recreation,
. . . etc . . .
INDIRECT VALUES
Ecosystem functionsand services such as:
Water quality andflow, Water storage
and recharge, Nutrientcycling, Flood
attenuation, Microclimate,
. . . etc . . .
OPTION VALUES
Premium placed onpossible future usesor applications, such
as:Agricultural,
Industrial, Leisure,Pharmaceutical, Water
use,
. . . etc . . .
NON-USE VALUES
Intrinsic significanceof resources and
ecosystems in termsof:
Cultural value,Aesthetic value,
Heritage vale, Bequestvalue,
. . . etc . . .

61
environmental [benefits]values and expressing them in monetary terms have also moved forward over thelast decade (Gren and Söderqvist 1994). Today a wide range of methods which move beyond the use ofdirect market prices is available, and used, for valuing wetland benefits. These include approaches whichelicit people’s preferences directly (such as through contingent valuation methods) as well as those, whichuse indirect methods to impute people’s preferences through their purchase of related goods and services(for example through production functions, dose-response relationships, travel costs, replacement costs, ormitigative or avertive expenditures). These methods, and their application to wetland ecosystems, aresummarised in Box 1 below and are described in detail elsewhere (see for example Barbier 1994, Barbieret al 1997, Gren and Söderqvist 1994, James 1991).
Box 1: Commonly-used valuation tools, and examples of their application to wetland goods andservices
● Replacement costs: Even where wetland goods and services have no market themselves, they oftenhave alternatives or substitutes that can be bought and sold. These replacement costs can be used as aproxy for wetland resource and ecosystem values, although they usually represent only partialestimates, or under-estimates.
In order to value non-marketed use of papyrus products by local households in Bushenyi District,Uganda, the price of substitute products was used. Annual household consumption of papyrusproducts was expressed in terms of equivalent market substitutes, including clay tiles instead ofthatch, rubber floor coverings instead of mats, plastic bowls instead of baskets, and purchasedfirewood instead of papyrus fuel (Nsingwire 1995). Replacement costs were also used to value thebenefit of Korea’s coastal wetlands in treating wastewaters and pollutants. Here, the costs of buildingand operating a waste treatment facility were used as a proxy for the replacement cost of wetlandservices (Lee 1998).
● Effects on production: Other economic processes often rely on wetland resources as inputs, or onthe essential life support provided by wetland services. Where they have a market, it is possible tolook at the contribution of wetland goods and services to the output or income of these widerproduction and consumption opportunities in order to assess their value.
The benefit of the Hadejia-Nguru wetlands for groundwater recharge was valued by a productionfunction approach. Wetland value was assessed by modelling the demand for water for householdconsumption and dry season irrigated agricultural production, and relating welfare changes tochanges in ground water levels (Acharya 1998). The economic value of mangroves in Pagbilao,Philippines, was assessed by looking at their contribution to fisheries production. Sustainableharvests were calculated, and the impacts of mangrove nutrient production on productivity wereisolated in order to determine the role of mangrove management in fisheries production (Janssenand Padilla1996).
● Damage costs avoided: The reduction or loss of wetland goods and services frequently incurs costsin terms of damage to, or reduction of, other economic activities. These damage costs avoided can betaken to represent the economic losses averted by conserving wetlands.
Wetlands around the Tana River and Delta, Kenya, provide important flood attenuation services fornearby infrastructure and surrounding human settlements. These services were partially valued bymodelling the impact of wetland loss on the frequency and severity of flooding, and assessing thecosts of damage avoided to roads, buildings and other infrastructure (Acropolis Kenya 1994).
● Mitigative or avertive expenditures: It is almost always necessary to take action to mitigate oravert the negative effects of the loss of wetland goods and services, so as to avoid economic damage.These mitigative or avertive costs can be used as indicators of the value of conserving wetlands interms of expenditures avoided.

62
Coastal marshes and mangroves play an important role in shoreline stabilisation, erosion control,and flood and storm protection on Mahé Island in the Seychelles. The value associated with thesefunctions was calculated by applying a preventive expenditure approach. In the absence of wetlandsservices it would be necessary to construct groynes and flood barriers to offset or mitigate coastalerosion and damage to infrastructure, the cost of which was used as a proxy for the value of coastalmarsh and mangrove services (CNPS 1997).
● Hedonic pricing: Hedonic methods look at the differentials in property prices and wages betweenlocations, and isolate the proportion of this difference that can be ascribed to the existence or qualityof wetland goods and services.
The amenity and landscape benefits of Bhoj wetland in the city of Bhopal, India were valued usinghedonic pricing methods. This compared house prices in different parts of the city, and isolated thepremium on property prices for houses that were in close proximity to the Upper and Lower Lakes(Verma 2001).
● Travel costs: wetlands typically hold a high value as a recreational resource or destination. Althoughin many cases no charge is made to view or enjoy natural ecosystems and species, people still spendtime and money to reach wetlands. This spending — such as on transport, food, equipment,accommodation, time, etc. — can be calculated, and a demand function constructed relating visitationrates to expenditures made. These travel costs reflect the value that people place on leisure,recreational or tourism aspects of wetlands.
The travel cost method was applied to value the recreational value of wildlife viewing in Lake NakuruNational Park, Kenya. This was done by administering a questionnaire to visitors, which collecteddata on origin, distance travelled, income and expenses. Demand curves were constructed usingregression analysis to describe the relationship between travel costs and number of visits, andindividual and aggregate willingness to pay for wetland recreational services were estimated(Navrud and Mungatana 1994).
● Contingent valuation: Even where wetland goods and services have no market price, and no closereplacements or substitutes, they frequently have a high value to people. Contingent valuationtechniques infer the value that people place on wetland goods and services by asking them theirwillingness to pay for them (or willingness to accept compensation for their loss) under thehypothetical scenario that they would be available for purchase.
Contingent valuation methods were used to assess the value of maintaining the Chao Phraya Riverin Thailand as a clean and well-functioning environment. A survey was carried out to gauge Bangkokresidents’ willingness to pay for a clean environment through eliciting bids for various measures toimprove river water quality and minimise pollution loads entering the river (Tapvong and Kruavan1999).
Expressing wetland values for decision-making
Calculating the economic value of wetlands is not an end in itself. Rather, it is a means of providinginformation, which can be used to make better and more informed choices about how resources aremanaged, used and allocated. Economic arguments and indicators exert a powerful influence over thesechoices, and decision-makers need to be able balance the relative gains from different activities andinvestments, including those that are concerned with conservation as well as those that lead to wetlandmodification, degradation or conversion. Valuation enables wetlands to be factored into economicdecisions.
Decision-makers are primarily concerned with choosing between different uses of land, funds and otherresources - for example whether to manage a wetland under strict protection or to allow for some form ofsustainable use, whether or not to build a dam, irrigation scheme or housing estate, which infrastructure
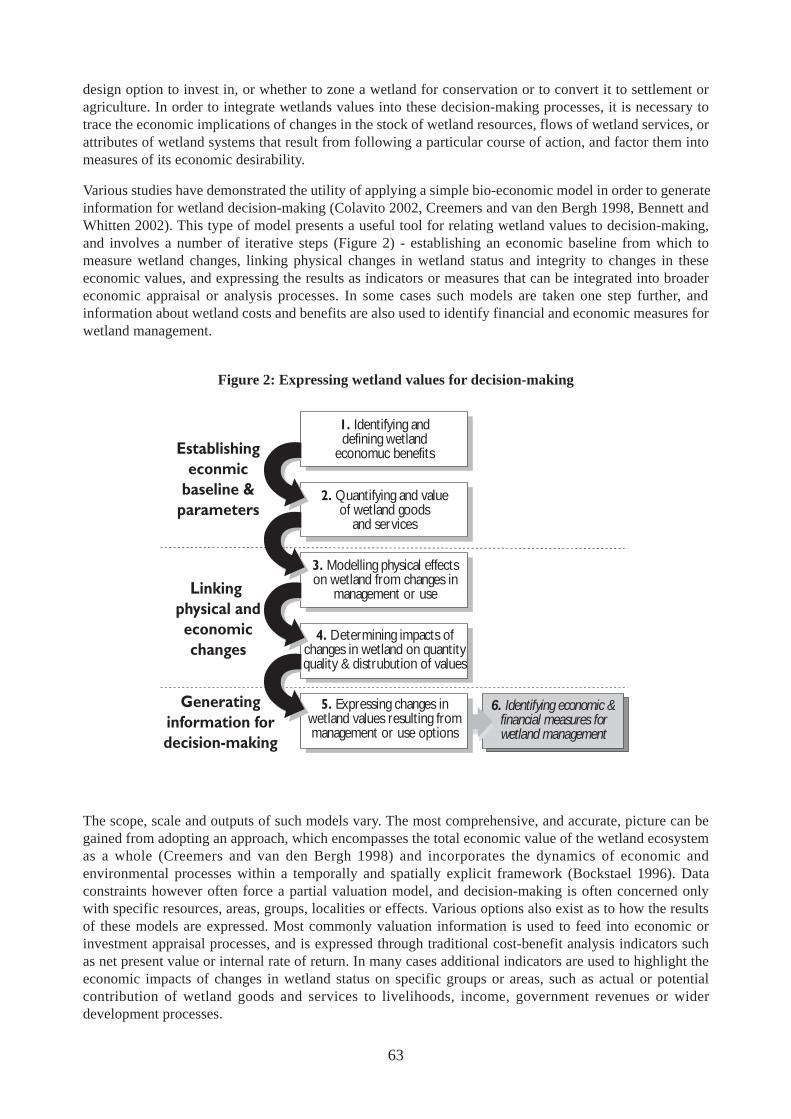
63
design option to invest in, or whether to zone a wetland for conservation or to convert it to settlement oragriculture. In order to integrate wetlands values into these decision-making processes, it is necessary totrace the economic implications of changes in the stock of wetland resources, flows of wetland services, orattributes of wetland systems that result from following a particular course of action, and factor them intomeasures of its economic desirability.
Various studies have demonstrated the utility of applying a simple bio-economic model in order to generateinformation for wetland decision-making (Colavito 2002, Creemers and van den Bergh 1998, Bennett andWhitten 2002). This type of model presents a useful tool for relating wetland values to decision-making,and involves a number of iterative steps (Figure 2) - establishing an economic baseline from which tomeasure wetland changes, linking physical changes in wetland status and integrity to changes in theseeconomic values, and expressing the results as indicators or measures that can be integrated into broadereconomic appraisal or analysis processes. In some cases such models are taken one step further, andinformation about wetland costs and benefits are also used to identify financial and economic measures forwetland management.
The scope, scale and outputs of such models vary. The most comprehensive, and accurate, picture can begained from adopting an approach, which encompasses the total economic value of the wetland ecosystemas a whole (Creemers and van den Bergh 1998) and incorporates the dynamics of economic andenvironmental processes within a temporally and spatially explicit framework (Bockstael 1996). Dataconstraints however often force a partial valuation model, and decision-making is often concerned onlywith specific resources, areas, groups, localities or effects. Various options also exist as to how the resultsof these models are expressed. Most commonly valuation information is used to feed into economic orinvestment appraisal processes, and is expressed through traditional cost-benefit analysis indicators suchas net present value or internal rate of return. In many cases additional indicators are used to highlight theeconomic impacts of changes in wetland status on specific groups or areas, such as actual or potentialcontribution of wetland goods and services to livelihoods, income, government revenues or widerdevelopment processes.
Figure 2: Expressing wetland values for decision-making
1. Identifying anddefining wetland
economuc benefits
3. Modelling physical effectson wetland from changes in
management or use
4. Determining impacts of changes in wetland on quantityquality & distrubution of values
6. Identifying economic & financial measures for wetland management
2. Quantifying and valueof wetland goods
and services
Establishing econmic
baseline & parameters
Linking physical andeconomicchanges
Generating information for decision-making
5. Expressing changes in wetland values resulting from management or use options

64
Wetland valuation in Asia: where are we now?
This paper has described how wetland under-valuation has led to land and resource use decisions beingmade on the basis of incomplete or inaccurate information, often resulting in decisions which are neithereconomically nor ecologically optimal. It also outlines the advances made over recent years in findingways of defining, measuring and expressing environmental values. Wetland valuation no longer requireslengthy, cumbersome, and costly data collection and analysis, but has become relatively simple, low-costand easy-to-implement. Rather than resulting in complex and often purely academic findings, valuationtechniques are also increasingly being used to generate practical management and policy information.
These new adaptations of economic concepts, methods and models have enabled wetland values to bemuch more easily and accurately expressed, and have yielded important information and insights. Althoughwetland ecosystems remain poorly represented in environmental valuation studies, and still there has beenconsiderably more work carried out in temperate, rather than tropical wetlands (Barbier 1994, Gren andSöderqvist 1994), this situation is beginning to change. A growing body of information is becomingavailable on the economic value of Asia’s tropical wetland ecosystems. This addresses many differentcountries, wetland types and categories of benefits, and develops and applies a wide variety of valuationmethodologies (Table 2). In many cases these studies represent the first attempt to quantify the economicimportance of wetlands in a country, for a particular ecosystem type, or in relation to a specific set ofbenefits or beneficiaries.
Using wetland valuation to influence development and conservation decisionsTable 2: Summary of wetland valuation studies in Asia
$/ha/year Values
Bangladesh: Hail Haor 649 Crops, fisheries, plants, flood control, Colavito 2002recreation, transportation, water quality andsupplies, existence values
Cambodia: Koh Kong 2.232 Carbon sequestrationStorm protection Bann 1997Province mangroves
Cambodia: Ream 59 Crops, fishing, plant use, hunting Emerton et alNational Park 2002
India: Bhoj urban 1,206 Water quality and supplies, resource use, Vermawetland amenity and recreational values, crop cultivation 2001
Indonesia: mangroves 86 Forest products and fisheries Burbridge andMaragos 1985
Japan: Kushiro National 1,400 Recreational and amenity values KuriyamaPark 1998
Korea coastal wetlands 22,000 Fishery production and habitat, waste treatment, Lee 1998aesthetic functions
Malaysia mangroves 35 Forest products Hamilton et al1989
Philippines: Pagbilao 211 Forestry and fisheries Janssen andmangroves Padilla 1996
Sri Lanka: Muthurajawela2,600 Water supplies, wastewater treatment, flood Emerton andurban marsh attenuation, support to downstream fisheries Kekulandala
2002
Thailand mangroves 165 Coastline protection Chr is tensen1982
Thailand: Surat Thani 77 Coastline protection Sathirathaimangroves 1998
65
This paper begins by posing under-valuation as a major hindrance to wetland conservation. It argued thateconomic valuation could provide a powerful tool for placing wetlands on the agenda of conservation anddevelopment decision-makers. By expressing people’s preferences in monetary terms, valuation aims tomake wetland goods and services directly comparable with other sectors of the economy when investmentsare appraised, activities are planned, policies are formulated, or land and resource use decisions are made.Although a better understanding of the economic value of wetlands does not necessarily favour theirconservation and sustainable use, and valuation cannot by itself overcome the omission of wetlandconcerns from decision-making, it at least permits them to be considered as economically productivesystems, alongside other possible uses of land, resources and funds. Economic arguments and data have apowerful influence on decision-making, and as long as wetland values are omitted, decisions will tendboth to de-emphasise their benefits and to marginalise the natural ecosystems which provide them.
Yet, to a large extent, valuation of wetlands in Asia is yet to reach its full potential. Freshwater ecosystemsremain poorly represented in environmental valuation studies, and still there has been considerably morework carried out in temperate, rather than tropical, wetlands (Gren and Söderqvist 1994). Despite theimportant steps forward that have been made in calculating and expressing the value of wetland goods andservices, a major challenge remains - to ensure that the results of these studies, and the figures theygenerate, are actually fed into decision-making processes and used to influence conservation anddevelopment agendas. When properly measured, the total economic value of wetland ecological functions,services and resources frequently exceeds the economic gains from activities, which are based onecosystem conversion or degradation (Barbier 1994). Yet decision-makers remain, for the most part,unaware of these values - at immense cost to Asia’s freshwater ecosystems, and to the economic activitiesand users that depend on them.
References
Acharya, G., 1998, ‘Valuing the hidden hydrological services of wetland ecosystems’, paper presented at 4th
Workshop of the Global Economics Network, Wetlands: Landscape and Institutional Perspectives Stockholm
Bann, C. 1997. An Economic Analysis of Alternative Mangrove Management Strategies in Koh KongProvince, Cambodia. Research Report, Environment and Economy Programme for South East Asia,International Development Research Centre, Ottawa.
Barbier, E., 1994, ‘Valuing environmental functions: tropical wetlands’, Land Economics 70(2): 155-73
Barbier, E., Acreman, M., and D. Knowler, 1997, Economic Valuation of Wetlands: A Guide for PolicyMakers and Planners, Ramsar Convention Bureau, Gland
Barndregt, A., van der Straaten, J., Ierland, E. and T. Söderqvist, 1998, ‘Wetland management andinstitutions: an ecological-economic approach’, paper presented at 4th Workshop of the Global EconomicsNetwork, Wetlands: Landscape and Institutional Perspectives Stockholm
Bennett, J. and S. Whitten, 2002, The Private and Social Values of Wetlands: An Overview, Land & WaterAustralia, Canberra
Bockstael, N, 1996, ‘Modellinbg economics and ecology: the importance of a spatial perspective’,American Journal of Agricultural Economics 78: 1168-80
Burbridge, P. and Maragos, J., 1993, ‘Coastal resource management and environmental assessment needsfor aquatic resources development in Indonesia’, Report No. 33, International Institute for Environmentand Development, Washington DC
Colavito, L., 2002, ‘Wetland economic valuation using a bioeconomic model: the case of Hail haor,Bangladesh’, paper presented at Workshop on Conservation and Sustainable Use of Wetlands: Learningfrom the World, IUCN - The World Conservation Union, Kathmandu

66
Creemers, G. and van den Bergh, J., 1998, ‘The use of a hydrological economic model to estrinate indirectuse values of wetlands: a case study in South Africa’, paper presented at 4th Workshop of the GlobalEconomics Network, Wetlands: Landscape and Institutional Perspectives, Stockholm
Emerton, 1994, An Economic Valuation of the Costs and Benefits in the Lower Tana Catchment Resultingfrom Dam Construction, Report prepared by Acropolis Kenya Ltd for Nippon Koei, Nairobi
Emerton, 1997, Seychelles Biodiversity: Economic Assessment, Conservation and National Parks Section,Division of Environment, Ministry of Foreign Affairs, Planning and Environment, Mahé
Emerton, L. 1999, Economic Tools for Valuing Wetlands in Eastern Africa, IUCN — The WorldConservation Union, Eastern Africa Regional Office, Nairobi
Emerton, L., and B. Kekulandala, 2002. Assessment of the Economic Value of Muthurajawela Wetland.IUCN — The World Conservation Union, Sri Lanka Country Office and Regional EnvironmentalEconomics Programme Asia, Colombo.
Emerton, L., Seilava, R. and H. Pearith, 2002, Bokor, Kirirom, Kep and Ream National Parks, Cambodia:Case Studies of Economic and Development Linkages, Field Study Report, Review of Protected Areas andtheir Role in the Socio-Economic Development of the Four Countries of the Lower Mekong Region,International Centre for Environmental Management, Brisbane and IUCN - The World Conservation UnionRegional Environmental Economics Programme, Karachi
Gren, I., and T. Söderqvist, 1994, Economic Valuation of Wetlands: A Survey, Beijer Discussion PaperSeries No. 54, Beijer International Institute of Ecological Economics, Royal Swedish Academy ofSciences, Stockholm
Hamilton, L., Dixon, J., and G. Miller, 1989, ‘Mangrove forests: an undervalued resource in the land andthe sea’, in Borgese, E., Ginsburg, N. and J. Morgan (ed) Ocean Yearbook 8, University of Chicago Press,Chicago and London
James, R., 1991, Wetland Valuation: Guidelines and Techniques, PHPA/AWB Sumatra Weltand ProjectReport No 31, Asian Wetland Bureau-Indonesia, Bogor
Janssen, R. and Padilla, J., 1996, Valuation and Evaluation of Management Alternatives for the PagbilaoMangrove Forest, Working Paper No 9, Collaborative Research in the Economics of Environment andDevelopment, International Institute for Environment and Development, London
Kuriyama, K., 1998, Measuring the Value of the Ecosystem in the Kushiro Wetland: An Empirical Study ofChoice Experiments, Forest Economics and Policy Working Paper No. 9802, Department of ForestScience, Faculty of Agriculture, Hokkaido University, Sapporo
Lee, H-D., 1998, ‘Use and value of coastal wetlands in Korea’, Intercoast Network Newsletter 32: pp. 7-8
Navrud, S. and E. Mungatana, 1994, ‘Environmental valuation in developing countries: the recreationvalue of wildlife viewing’, Ecological Economics 11: 135-151
Tapvong, C. and J. Kruavan, 1999, Water Quality Improvements: A Contingent Valuation Study of the ChaoPhraya River, Research Report, Environment and Economy Programme for South East Asia, InternationalDevelopment Research Centre, Ottawa.
Verma, M., 2001, Economic Valuation of Bhoj Wetland for Sustainable Use, Report prepared for India:Environmental Management Capacity Building Technical Assistance Project, Indian Institute of ForestManagement, Bhopal
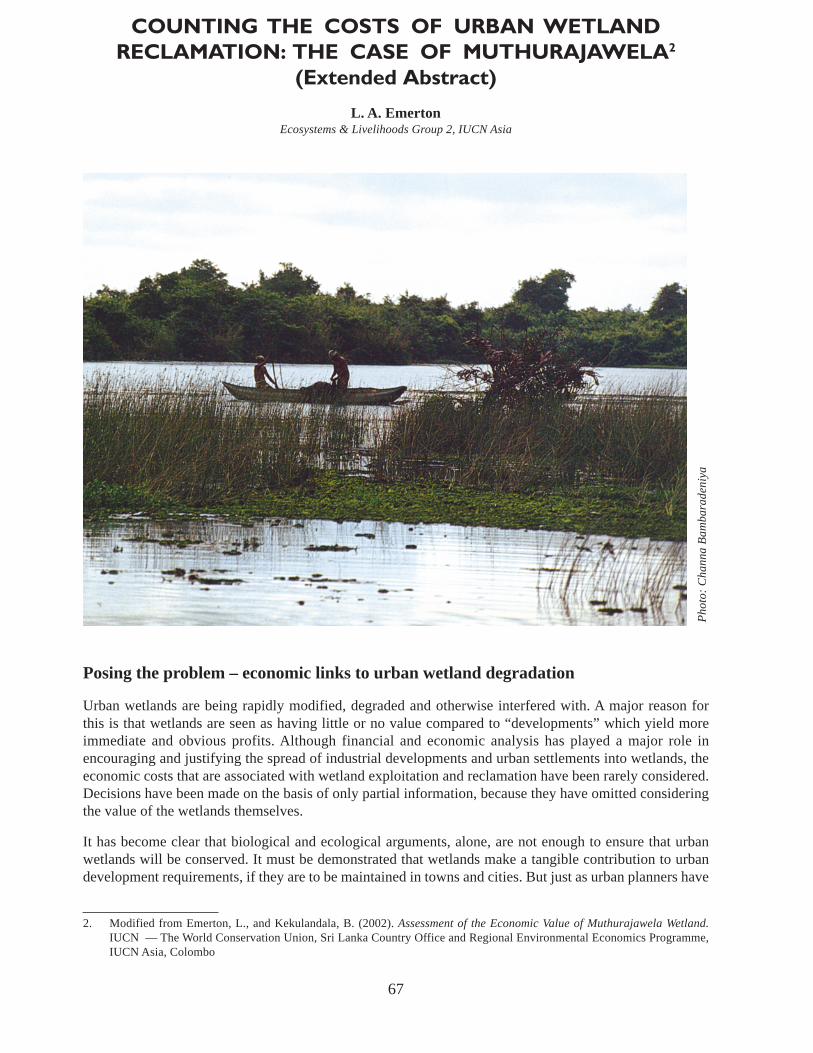
67
COUNTING THE COSTS OF URBAN WETLANDRECLAMATION: THE CASE OF MUTHURAJAWELA2
(Extended Abstract)
L. A. EmertonEcosystems & Livelihoods Group 2, IUCN Asia
Ph
oto
: C
ha
nn
a B
am
ba
rad
en
iya
Posing the problem – economic links to urban wetland degradation
Urban wetlands are being rapidly modified, degraded and otherwise interfered with. A major reason forthis is that wetlands are seen as having little or no value compared to “developments” which yield moreimmediate and obvious profits. Although financial and economic analysis has played a major role inencouraging and justifying the spread of industrial developments and urban settlements into wetlands, theeconomic costs that are associated with wetland exploitation and reclamation have been rarely considered.Decisions have been made on the basis of only partial information, because they have omitted consideringthe value of the wetlands themselves.
It has become clear that biological and ecological arguments, alone, are not enough to ensure that urbanwetlands will be conserved. It must be demonstrated that wetlands make a tangible contribution to urbandevelopment requirements, if they are to be maintained in towns and cities. But just as urban planners have
2. Modified from Emerton, L., and Kekulandala, B. (2002). Assessment of the Economic Value of Muthurajawela Wetland.IUCN — The World Conservation Union, Sri Lanka Country Office and Regional Environmental Economics Programme,IUCN Asia, Colombo

68
traditionally seen little need to take environmental values into account in making land use decisions, soenvironmental managers have rarely presented a convincing economic justification for wetlandconservation in an urban setting.
Despite their low perceived value, urban wetlands however often contain important biodiversity, generateessential ecosystem services, and provide some of the few remaining green spaces left for city dwellers toenjoy. All of these attributes generate a wide range of economic benefits. These types of values have aparticular importance in countries where levels of urban poverty are high and public sector budgets arelow. Wetlands often help to fill the gap between the level of basic services and amenities that governmentsare able to provide, and that which rapidly increasing urban populations demand.
The case study described in this paper demonstrates how economic arguments can provide a strong - andmuch needed - justification for urban wetland conservation. It illustrates that wetland status is not just abiological or ecological concern, but is also an economic and development issue. It is clear that for citiessuch as Colombo, the question is not whether processes of industrialisation and urbanisation should takeplace - of course they should, because they form a key part of most developing countries’ future economicgrowth, and generate obvious social and economic benefits. Rather, it is becoming increasingly obviousthat it is necessary to question the ways in which these developments are conceptualised, planned andimplemented. When urban developments encroach on wetland ecosystems, they almost always give rise toimmense social and economic costs. Not only do these costs typically accrue to the poorest and mostvulnerable sectors of the population, but they can also undermine the very aims of urban developmentitself - better provision of services, acceptable standards of living, and income and employment generation.
Maintaining wetlands in Sri Lanka’s coastal cities
The southwest coastline of Sri Lanka represents one of the most densely populated, intensely urbanisedand heavily industrialised parts of the country. There is extreme pressure on the natural environment, andwetland ecosystems in particular are under severe threat. Land use planning processes have paid little heedto the need to maintain green spaces for Sri Lanka’s city-dwelling populations, and have almost alwaysresulted in development decisions which have taken place at the cost of the few remaining urban and peri-urban conservation zones.
This case study describes an attempt to assess the economic value of Muthurajawela Wetland Sanctuary,situated just to the north of the capital city, Colombo. Both wetland ecosystems and urban parks are poorlyrepresented in Sri Lanka’s national protected area network, and Muthurajawela fulfils an almost uniquerole because it combines both these attributes. Although during the mid-1990s a land use master plan wasdeveloped for the area, and a wetland management plan was established for Muthurajawela, there is seriousconcern about the future of this protected area. Within the context of a renewed effort to conserve the areamore effectively, including a proposed extension to the Wetland Sanctuary, the valuation exercise aimed todevelop and apply integrated biodiversity-economic assessment methods that could be used to identifycritical threats, major benefits, and key actions required to support the management of Muthurajawela as aconservation zone.
Muthurajawela Wetland Sanctuary
Muthurajawela Marsh is the largest saline coastal peat bog in Sri Lanka, and covers an area of some 3,068hectares (Figure 3). It is runs alongside the Indian Ocean and is located between 10 to 30 km north ofColombo, in Gampaha District. Together with the contiguous Negombo Lagoon (3,164 hectares),Muthurajawela forms an integrated coastal wetland system of high biodiversity and ecologicalsignificance. It is listed as one of 12 priority wetlands in Sri Lanka, and in 1996, 1,777 hectares of thenorthern section of Muthurajawela was declared a Wetland Sanctuary. The Sanctuary contains a highdiversity of both flora and fauna, including several endemic and nationally threatened species, and also
69
provides an important area for migratory birds. Because of the presence of these natural habitats andspecies, Muthurajwela is a popular recreational destination, primarily attracting educational or school tripsand day visitors from nearby Colombo.
Muthurajawela Sanctuary represents a “conservation island” in the midst of intense urban and industrialdevelopment. It remains one of the few wetlands in the Colombo area that has not been reclaimed foragriculture or filled in for development. More than 300,000 people live in the Muthurajawela-Negomboarea and just under 5,000 people live in and around the marsh itself. of this 5,000, half are squatters andabout three quarters live on unauthorised landholdings. About 80% of the industries in the country areconcentrated in Colombo and Gampaha Districts (UNEP 2001). Areas to the north, south and east of themarsh contain a large number of industries and commercial enterprises. In 1991, there were almost 150industrial units in and around Muthurajawela marsh and Negombo Lagoon, including vehicle and electricalgoods repair shops and garment makers (GCEC 1991). Today this number has undoubtedly increased, asmuch of the southern part of Muthurajawela has since been turned into an industrial area.
As well as harbouring important biodiversity the Wetland Sanctuary provides a range of ecological andhydrological services. Muthurajawela receives and retains high loads of domestic and industrial wastes,and sediment and silt loads, from both surrounding and upstream areas. Wetland plants facilitate sedimentdeposition, before water enters Negombo Lagoon. They also act as a filter for through-flowing waters, andassist in the removal of nutrients and toxic substances. During the rainy season large volumes of waterenter the wetland system, from rainfall, through run-off from surrounding higher grounds and viafloodwaters from the Dandugam Oya, Kalu Oya and Kelani Ganga which feed the marsh. Muthurajawelabuffers these floodwaters and discharges them slowly into the Negombo Lagoon. The maximum waterstorage capacity of the marsh has been estimated at 11 million cubic metres, with a maximum discharge of12.5 cubic metres per second and a retention period of more than 10 days (Mahanama 2000). Bymaintaining surface, near surface and possibly groundwater levels, the marsh also plays a major importantrole in local freshwater supplies. These functions are particularly important for local households, many ofwhom lack a piped water supply and rely on shallow-dug wells.
Figure 3: Location of Muthurajawela
Water quality and fisheries production indownstream Negombo Lagoon are heavilydependent on these wetland services.Muthurajawela acts as a source offreshwater to the tidal delta, and is criticalin moderating salinity and pollution levels.Its sheltered waters, flooded vegetation andmangrove areas all constitute importantbreeding grounds and nurseries forfreshwater and marine species of fish andcrustaceans. Downstream of the marsh,Negombo Lagoon has a high productivityfor fisheries estimated at 150 kg/hectare/year (GCEC 1991), involving more than3,000 families from 26 villages (CEA 1994,GCEC 1991, Hettiarachchi &Samarawickrama 2000).
The impacts of land use zoningaround the wetland
The location of Muthurajawela WetlandSanctuary in a rapidly developing urban
70
area makes it an extremely vulnerable ecosystem. Large parts of the freshwater marsh system have beenaltered, and a variety of canals, drains, bunds, sluices and culverts present evidence of various attempts tomanage water flow, combat flooding and prevent salt-water intrusion. There is a long history to thesehuman modifications. As early as the 15th century a canal was constructed (now referred to as the Dutchcanal, running along the eastern side of the marsh from the Kelani Ganga into Negombo Lagoon), andextended along with other works under Dutch occupation in the 18th century. In the 19th century the Britishconstructed the Hamilton canal, running along the western side of the marsh, parallel to the sea. Sincethen, a network of dikes and waterways has been built which link and extend the Dutch and Hamiltoncanals.
After Independence, in 1947, successive national governments have made plans to further developMuthurajawela for agriculture and settlement. In 1965, a scheme was identified to completely fill andpolderise the marsh in order to provide land for the relocation of slum residents from Colombo. Althoughthis plan was never implemented, it resulted in encroachment into the marsh. Since the 1970s housingdevelopment has increased still further, and a number of permanent settlements have been establishedaround the fringes of the Wetland Sanctuary. Most of today’s population, originally migrated into the areaafter the mid-1970s, attracted by the relatively low price of land and the lack of enforcement againstmoving into state-owned areas.
Today, the marsh is subject to intense pressure from surrounding industries and settlements. Low-costhousing borders, and in some case encroaches upon, the wetland. The large Ekala-Ja Ela Industrial zonelies to its east and a new industrial area has been developed at the southern end of the wetland.Bandaranaike International Airport and Negombo town (with an estimated population of 150,000 people)are both located to the north of Muthurajawela,. The Colombo-Katunayake Expressway, linking Colombowith the industrial areas and airport, is in the process of being built and cuts across the borders of theWetland Sanctuary.
There have been considerable changes to the biodiversity, ecology and hydrology of the marsh area as aresult of these activities. Large amounts of wastes now enter the marsh from adjacent households, fishingboats, tourist facilities, agriculture and industries (CEA & Arcadis 2000). Currently at least two thirds ofthe households living around the marsh have no proper latrine facilities, and discharge untreated sewageinto the wetland (Mahanama 1998). Of the 150 or so industries in Ja-Ela and Ekala, 64 generate effluent,17 have high domestic loading of over 10 m3/day by water consumption, and only 13 have any kind oftreatment facility (Ministry of Policy, Planning and Implementation 1993). In total, it is estimated that themarsh and lagoon area receive raw or partially-treated sewage from a population equivalent to 200,000people (CEA undated). Land filling and reclamation in the marsh area for industry, infrastructure andsettlement has also increased local erosion and siltation (van Agthoven and Gijsbers 1992). By 1999,annual sediment loads entering the marsh were estimated at 147,000 tonnes a year from the DandugamOya and Ja-Ela, and 62,000 tonnes a year from the Hamilton Canal (Kragtwijk and van Nood 1999).
As Muthurajawela has been degraded and reclaimed, hydrological linkages to appropriate discharge pointshave been cut off, meaning that excess water and peak flows cannot move easily into Negombo Lagoon.Over recent years the intensity and frequency of flooding has increased dramatically in low-lying fringesof the marsh (CEA 1994). In severe rain, the Hamilton Canal and other watercourses overflow, andinundate surrounding areas. Today, floods occur in adjacent settlements at least twice a year during the wetseasons (van Agthoven and Gijsbers 1992), and during every rainfall period more than 1,000 householdsin the marsh area are affected by flooding (GCEC 1991). This important breeding habitat for freshwater,brackish water and marine fish species has been reduced and water quality has fallen, with especially highlevels of BOD and COD around industrial and residential areas indicating organic loading and pollution(IUCN 2001).
As a result of growing concern about these sources of ecosystem degradation and biodiversity loss, thegovernment decided in 1989 to freeze all public and private sector development proposals until anenvironmentally sound Master Plan was developed for the Muthurajawela Marsh. The Greater ColomboEconomic Commission (now the Board of Investment) was instructed to prepare this plan. The publication
71
of the Master Plan for Muthurajawela Marsh and Negombo Lagoon in 1991 (GCEC 1991) led to a land usestrategy being proposed for the future, based on dividing the Muthurajawela-Negombo area into variousdevelopment and conservation zones (Mahanama 2000):
The Master Plan was accepted by the government in 1992, and implementation commenced, including thedevelopment of a special management plan for the conservation zone (CEA 1994). The Department ofWildlife Conservation was charged with managing the conservation zone, the Department of Fisheries wasmade responsible for the fishery in Negombo Lagoon, and the Forest Department was mandated with themanagement of mangrove areas. A detailed plan for the conservation zone was prepared, and in 1996 anarea of 1,777 hectares in the northern part of the marsh was declared a Wetland Sanctuary under the Faunaand Flora Protection Ordinance.
Valuing the benefits of Muthurajawela Marsh
Despite the existence of a management plan for Muthurajawela conservation zone, there remains seriousconcerns about the future of the Wetland Sanctuary. Encroachment and degradation continues, andinfrastructural developments and industrial expansion are still occurring close to - and sometimes within -the marsh area. A clear need has been identified to strengthen existing conservation activities in theWetland Sanctuary.
A first step in these renewed efforts was to provide the basic biophysical and socio-economic informationrequired to update wetland management activities. The first detailed biodiversity assessment ever made ofMuthurajawela Wetland was carried out between November 1999 and April 2000 (IUCN 2001). It resultedin the identification of critical species, habitats, threats and proposed management actions.
The valuation exercise aimed to compile a set of complementary data, which could provide backup to, andadditional justification for, the recommendations arising from the biodiversity assessment. Just as thebiodiversity assessment had used Muthurajawela Wetland Sanctuary, as a demonstration site, to developand apply a set of general criteria for the identification of critical habitats in wetland ecosystems, so theeconomic study aimed to develop, apply and document methods for the integration of economic concernsinto biodiversity assessment procedures. These methodologies would then be more generally replicablewithin the context of wetland conservation in Sri Lanka. Economic assessment procedures were designedso that each stage corresponded to an equivalent step in the biodiversity assessment process applied inMuthurajawela, and analysis and conclusions pointed to economic measures that could provide directsupport to the management recommendations provided in the biodiversity assessment.
Using economic tools in the Wetland Sanctuary’s management plan
The principal recommendation yielded by the earlier biodiversity assessment was that MuthurajawelaWetland Sanctuary should be accorded Ramsar site status, and that the northern part of the marsh shouldbe added to the existing protected area in order to assure adequate protection of critical species andhabitats. The economic study provided a credible economic rationale for these actions, showing thatcontinued conservation of the Wetland Sanctuary would yield considerable benefits.
Direct use values that depend on the Muthurajawela Marsh, including sustainable local resource use andrecreation, are worth more than half a million dollars a year (Figure 4). The provision of localisedecosystem services such as flood attenuation, industrial and domestic waste water purification and year-round surface and sub-surface water supplies have an annual value in excess of $7 million a year. Thewetland’s support to downstream fish productivity in Negombo Lagoon contributes a value of almost$225,000. Together these translate into economic benefits of just over $2,600/hectare/year for the whole ofMuthurajawela Marsh, or non- consumptive use benefits of $4.4 million for the Wetland Sanctuary (1777ha). More than 30,000 people, most of them poor slum dwellers and fishing households, gain from theseeconomic goods and services.

72
The biodiversity assessment specified five management actions that were required as a matter of urgencyto address the current threats to the wetland. Dissemination of the findings of the valuation study met thefirst two aims: raising awareness on wetland values, and documenting the socio-economic status ofMuthurajawela. The valuation study also specified a series of economic tools and measures that could lendsupport to the three other management actions specified - promoting sustainable revenue and income-generating activities, encouraging ecosystem restoration activities and initiating prompt and punitive actionagainst practices that degrade the wetland.
Figure 4: Economic value of Muthurajawela
Economic Benefit Value ($/year) Value ($/ha/year)
Flood attenuation 5,394,556 1,758
Industrial waste water treatment 1,803,444 588
Agricultural production 336,556 110
Support to downstream fisheries 222,222 72
Firewood 88,444 29
Fishing 69,556 23
Leisure, recreation and recreation 58,667 19
Domestic sewage treatment 48,000 16
Freshwater supplies 42,000 14
TOTAL 8,072,111 2,631
The valuation study’s findings underlined not only the high economic benefits that could accrue fromwetland restoration, but also indicated that any reduction in extractive wetland activities would constitutereal economic losses to local households. A package of economic incentive measures, including value-added and income generating activities, was identified as essential to providing the necessary support tolocal landholders undertaking wetland restoration. Ways of capturing and retaining wetland benefits asrevenues for the Department of Wildlife Conservation, the agency mandated to manage the WetlandSanctuary, were also highlighted by the valuation study as central to the management of the extendedconservation area. Information on the high economic benefits yielded by Muthurajawela Marshadditionally provided a reference point for ensuring that penalties for wetland degradation are realistic,and reflect the real costs of damage caused. The study recommended that penalties for wetland damagethrough infrastructural and industrial expansion should be set at levels that are considerably higher than iscurrently the case, and are closer to the real costs incurred, either to act as an additional disincentive againstwetland degradation or else to make available sufficient funds to remedy or mitigate their effects.
References
CEA & Arcadis. (2000). Analysis of Ornamental Fish Project. Integrated Resources ManagementProgramme in Sri Lanka Technical Report 09, Central Environmental Authority and Arcadis-Euroconsult,Colombo.
CEA. (1994). Conservation Management Plan: Muthurajawela Marsh and Negombo Lagoon. WetlandConservation Project, Central Environmental Authority and Euroconsult, Colombo.
GCEC. (1991). Masterplan of Muthurajawela and Negombo Lagoon. Greater Colombo EconomicCommission and Euroconsult, Colombo.
73
Hettiarachi, S. and Samarawickrama, S. (2000). ‘Engineering interventions for wetland management: thecase of Negombo Lagoon and Muthurajawela Marsh’. in Farmer, N., ed. Workshop on EffectiveManagement for Biodiversity Conservation in Sri Lankan Wetlands: Muthurajawela Marsh, NegomboLagoon and Chilaw Lagoon. Report 55, Centre for the Economics and Management of Aquatic Resources,University of Portsmouth.
IUCN. (2001). A Report on the Status of Biodiversity and Critical Habitats in the Muthurajawela WetlandSanctuary. IUCN — The World Conservation Union, Sri Lanka Country Office, Colombo.
Kragtwijk, and M. van Nood. (1999). Muthurajawela Marshes and Negombo Lagoon: Stewardship ofEconomy and Ecology. Integrated Resources Management Programme in Wetlands, Central EnvironmentalAuthority and Euroconsult, Colombo.
Mahanama, M. (2000). ‘Planning and management aspects in Muthurajawela and Negombo Lagoon’. inFarmer, N., ed. Workshop on Effective Management for Biodiversity Conservation in Sri Lankan Wetlands:Muthurajawela Marsh, Negombo Lagoon and Chilaw Lagoon. Report 55, Centre for the Economics andManagement of Aquatic Resources, University of Portsmouth.
Mahanama, P. (1998). Socio-Economic Baseline Survey in Muthurajawela. Integrated ResourcesManagement Programme in Sri Lanka Technical Report 01, Central Environmental Authority and Arcadis-Euroconsult, Colombo.
Ministry of Policy, Planning and Implementation. (1993). Feasibility Study for the Establishment of a JointWastewater Treatment Plant for Industrial Estate Industries in Ekala and Ja-Ela. Soil and Report preparedfor Government of Sri Lanka Ministry of Policy, Planning and Implementation and World BankMetropolitan Environment Improvement Programme by Soil and Water Ltd in association with EnviroplanLtd, Colombo.
van Agthoven, A. and P. Gijsbers. (1992). Damdugam Oya, Ja-Ela and Negombo Lagoon: Floods andSedimentation in the Delta. Faculty of Engineering, Delft University of Technology and MuthurajwelaUnited People’s Organisation, Colombo.

74
RECOMMENDATIONS ARISING FROM THE NATIONAL SYMPOSIUM ONWETLAND CONSERVATION AND MANAGEMENT
19TH AND 20TH JUNE 2003
The following recommendations were made at the National Wetlands Symposium for the effectivemanagement of wetlands in Sri Lanka.
● The National Wetlands Steering Committee (NWSC) should be revived immediately and arrangementsshould be made for its organizational positioning in an existing state agency. It is proposed that thenew NWSC should be positioned within the Central Environmental Authority (CEA). The Secretary,Ministry of Environment and Natural Resources will function as the Chairman while the ChairmanCEA shall act as the convenor.
● To facilitate the smooth operation of the NWSC and to ensure its success as the co-ordinating body forthe conservation and management of wetlands, the following recommendations were made:
o Clearly identify the responsibilities of the committee and all its participatory agencies, and havean institutional mechanism (through cabinet approval) to mandate such responsibilities
o Determine the level of representation of various agencies within the NWSC
o Establish Working Groups with specified tasks that report directly to the NWSC
o Create a process to ensure maximum participation and co-operation of all agencies
● As its initial tasks, it is recommended that the National Wetland Steering Committee
o Prepare a National Wetland Policy, Strategy and an Action Plan, incorporating where appropriate,Integrated Coastal Zone Management approaches, including aspects of financing to ensuresustainability
o Review existing legislation, and where necessary, formulate new legislation for wetlandconservation and management
o Initiate immediate action to declare the buffer zone of Muthurajawela as a wetland sanctuary area
o Periodically review the RAMSAR strategic plan at the national level to assess present status andset new national targets
o Facilitate the co-ordination of agencies involved in wetland use, and establish a wetlandmanagement mechanism that overcomes the conflicts between mandates of various agencies,including review of agency mandates based on the actual needs
o Review the Inventory of Wetlands in the country and their classification (and zoning) to reflectpresent trends and changes
o Provide leadership for the re-inventory of wetland sites in the North and East, and co-ordinate aprocess of land use and management planning (including zoning) for the important wetlands inthe North and the East
o Prepare a strategy to assist the focal agencies to fulfil related MEA obligations
● The NWSC should co-ordinate the following activities with regard to Information Management andEducation.
o There is a significant body of information on wetlands generated by various organizations,scattered in different places. These need to be centralized and shared so that it may be used inplanning and also made available to the public
o There is still a lack of exchange of information and cooperation between agencies and institutionsactive in different elements of wetland management. The NWSC needs to formulate a plan to create

75
more positive interactions and greater co-ordination between all agencies and institutes concernedin wetland conservation and management and also enhance levels of public access to information
o Conduct programs to inform and educate local government staff in matters of wetlandconservation and management
o Critically review the strategy adopted for education and awareness programs on wetlandconservation during the last decade, in order to introduce more effective and appropriate programs
o Process the available information into concise policy briefs that will be more useful for policymakers
o Provide improved education and training facilities to communities dependent on the diminishingnatural resources of wetlands to enable the next generation to develop alternative income sourcesand occupations
● Research and Training
o Encourage and ensure the use of socio-economic and economic tools as practical applications inevaluating ecosystems
o Continue the present training programs on practical application of economic evaluation,especially to those involved in EIAs.
o Conduct more comprehensive research on lesser-known faunal groups such as small vertebratesand invertebrates in wetlands to obtain more accurate and reliable information on biodiversity.Implement measures to overcome the lack of qualified professional staff such as taxonomists
● Communities and NGOs
o Mobilize communities for stronger community organization, and ensure transparency in theirgovernance in order to empower them to represent the communities effectively
o Create a process to overcome tenure and resource access issues faced by communities in wetlandareas
o Coordinate the work of NGOs in wetlands in order to avoid potential conflicts, by organizing anetwork of CBOs and NGOs established under an appropriate umbrella organization
o Ensure parallel NGO intermediation and direct community mobilization
o Establishing M & E systems including participatory M & E in the communities
o Re-activate the District Environment Law Enforcement Committee (DELEC). The DELECs aremore responsive to communities at the local level
● Review and remove perverse incentives that favour wetland loss and degradation in specific sectors,and provide incentives for wetland conservation and management.
● Promotion of codes of practice and certification schemes to help ensure that commercial sectors abideby best practice.