wetland assessment: proposed transnet security wall ... kim brent 221_27515/appendix … · wetland...
TRANSCRIPT

Wetland Assessment:
Proposed Transnet Security Wall Construction
Prepared for:
Transnet Freight Rail
Prepared by:
Coastal & Environmental Services
PORT ELIZABETH
13 Stanley Street
Richmond Hill
6001
www.cesnet.co.za
October 2014

TABLE OF CONTENTS
Glossary .................................................................................................................................................. 4 1 Introduction .......................................................................................................................................... 6
1.1 Terms of Reference .......................................................................................................................... 6 1.2 DETAILS OF THE SPECIALIST ....................................................................................................... 6
Expertise of the specialist .................................................................................................................... 7 1.3 Description of the proposed development ........................................................................................ 7 1.4 Wetland classification systems ......................................................................................................... 9 1.5 Wetland definition ............................................................................................................................. 9 1.6 National Wetland Classification System method ............................................................................ 11 1.7 Wetland importance and function ................................................................................................... 13 1.8 Relevant wetland legislation and policy .......................................................................................... 14 1.9 Provincial legislation and policy ...................................................................................................... 15
2 Study approach ................................................................................................................................. 16 2.1 Wetland condition ........................................................................................................................... 16
3 Description of the potentially affected environment .......................................................................... 17 4. Present Ecological State and conservation importance ................................................................... 22
5. Permit requirements ............................................................................................................................. 23 6. Conclusion and Recommendations ..................................................................................................... 23 7. References ........................................................................................................................................... 25
LIST OF TABLES
Table 1: Comparison of ecosystems considered to be ‘wetlands’ as defined by the proposed NWCS,
the National Water Act (Act No. 36 of 1998), and ecosystems included in DWAF’s (2005) delineation
manual. ..................................................................................................................................................... 10
Table 2: Description of A – F ecological categories ................................................................................. 16
Table 3: Summary of the overall health of the wetland based on impact score and change score. ....... 22
LIST OF FIGURES
Figure 1: Locality map showing the proposed security wall (red). ............................................................. 8 Figure 2: Basic structure of the National Wetland Classification System, showing how ‘primary
discriminators’ are applied up to Level 4 to classify Hydrogeomorphic (HGM) Units, with ‘secondary
discriminators’ applied at Level 5 to classify the tidal/hydrological regime, and ‘descriptors’ applied at
Level 6 to categorise the characteristics of wetlands classified up to Level 5 (From SANBI, 2009). ..... 12 Figure 3: Illustration of the conceptual relationship of HGM Units (at Level 4) with higher and lower
levels (relative sizes of the boxes show the increasing spatial resolution and level of detail from the
higher to the lower levels) for Inland Systems (from SANBI, 2009). ....................................................... 13 Figure 4: Project locality map indicating the M20A quaternary catchment boundary (below pink line)
(Source Google Earth & DWA) ................................................................................................................ 18 Figure 5: The study area in relation to the various wetlands as indicated in the NFEPA database (Nel et
al., 2011). .................................................................................................................................................. 19 Figure 6: The delineated wetland and riverine areas together the respective ecological and WULA
buffers ....................................................................................................................................................... 21
LIST OF PLATES
Plate 1: A typical small depression located in the southern portion of the alignment, which is ephemeral
.................................................................................................................................................................. 20 Plate 2: Reedbed found at the western side at the corner of Grahamstown Rd and John Tallant Rd ... 20

ACRONYMS
CARA Conservation of Agricultural Resources Act
DWS Department of Water and Sanitation
EIS Ecological Importance and Sensitivity
GIS Geographic Information System
HGM Hydrogeomorphic Approach
NSBA National Spatial Biodiversity Assessment
NWA National Water Act (Act 36of 1998)
NWCS National Wetland Classification System
PES Present Ecological State
SABIF South African Biodiversity Information Facility, a SANBI database
that contains both faunal and floral species records
SANBI South African National Biodiversity Institute
WUL Water Use License
WULA Water Use License Application

Glossary
Aerobic: having molecular oxygen (O2) present.
Anaerobic: not having molecular oxygen (O2) present.
Anthropogenic: of human creation
Delineation (of a wetland): to determine the boundary of a wetland based on soil, vegetation, and/or
hydrological indicators (see definition of a wetland).
Ecological Reserve determination study: The study undertaken to determine Ecological Reserve
requirements.
EcoStatus is the overall PES or current state of the resource. It represents the totality of the features and
characteristics of a river and its riparian areas or wetland that bear upon its ability to support an appropriate
natural flora and fauna and its capacity to provide a variety of goods and services. The EcoStatus value is an
integrated ecological state made up of a combination of various PES findings from component EcoStatus
assessments (such as for invertebrates, fish, riparian vegetation, geomorphology, hydrology and water
quality).
Floodplain: Wetland inundated when a river overtops its banks during flood events resulting in the wetland
soils being saturated for extended periods of time.
Groundwater: subsurface water in the zone in which permeable rocks, and often the overlying soil, are
saturated under pressure equal to or greater than atmospheric.
Hydrophyte: any plant that grows in water or on a substratum that is at least periodically deficient in oxygen
as a result of soil saturation or flooding; plants typically found in wet habitats.
Hydrology: the study of water, particularly the factors affecting its movement on land.
Infilling or Fill: dumping of soil or solid waste onto the wetland surface. Infilling generally has a very high
and permanent impact on wetland functioning and is similar to drainage in that the upper soil layers are
rendered less wet, usually so much so that the area no longer functions as a wetland.
Present Ecological State is a term for the current ecological condition of the resource. This is assessed
relative to the deviation from the Reference State. Reference State/Condition is the natural or pre-impacted
condition of the system. The reference state is not a static condition, but refers to the natural dynamics
(range and rates of change or flux) prior to development. The PES is determined per component - for rivers
and wetlands this would be for the drivers: flow, water quality and geomorphology; and the biotic response
indicators: fish, macroinvertebrates, riparian vegetation and diatoms. PES categories for every component
would be integrated into an overall PES for the river reach or wetland being investigated. This integrated
PES is called the EcoStatus of the reach or wetland.
Reserve: The quantity and quality of water needed to sustain basic human needs and ecosystems (e.g.
estuaries, rivers, lakes, groundwater and wetlands) to ensure ecologically sustainable development and
utilisation of a water resource. The Ecological Reserve pertains specifically to aquatic ecosystems.
Reserve requirements: The quality, quantity and reliability of water needed to satisfy the requirements of
basic human needs and the Ecological Reserve (inclusive of instream requirements).
Seasonally wet soil: soil which is flooded or waterlogged to the soil surface for extended periods (>1
month) during the wet season, but is predominantly dry during the dry season.
Sedges: Grass-like plants belonging to the family Cyperaceae, sometimes referred to as nutgrasses.
Papyrus is a member of this family.
Soil saturation: the soil is considered saturated if the water table or capillary fringe reaches the soil surface
(Soil Survey Staff, 1992).
Temporarily wet soil: The soil close to the soil surface (i.e. within 50 cm) is wet for periods > 2 weeks
during the wet season in most years. However, it is seldom flooded or saturated at the surface for longer
than a month.
Wetland: land which is transitional between terrestrial and aquatic systems where the water table is usually
at or near the surface, or the land is periodically covered with shallow water, and which under normal

circumstances supports or would support vegetation typically adapted to life in saturated soil (Water Act 36
of 1998); land where an excess of water is the dominant factor determining the nature of the soil
development and the types of plants and animals living at the soil surface (Cowardin et al., 1979).
Wetland catchment: the area up-slope of the wetland from which water flows into the wetland and including
the wetland itself.
Wetland delineation: the determination and marking of the boundary of a wetland on a map

1 INTRODUCTION
EOH Coastal and Environmental Services (CES) was appointed to conduct an assessment of the
potential impacts on wetlands and waterbodies, posed by the proposed construction of a security
wall around the existing Transnet Freight Rail property along the R102 and New Brighton (Figure
1) within the Nelson Mandela Bay Municipality (NMBM) in the Eastern Cape. CES conducted a
Present Ecological State (PES) assessment of the aquatic systems within a 500m radius of the
site.
The following documents (amongst others) would be needed for the WULA by the Department of
Water and Sanitation (DWS):
Riparian and wetland areas delineation supplied together with a desktop analysis and
potential sensitivity identification due to the close proximity of the development to the rivers
and wetlands
This report, detailing the current ecological condition of each wetland and riparian system
Section 21 (c) and (i) use, i.e. river or wetland crossings, which includes any drainage lines
by any infrastructure.
1.1 Terms of Reference
The following scope of work was used as the basis of this study in order to fulfil the above
requirements:
A desktop aquatic biodiversity assessment of the study area. This will cover the wall alignment footprint in relation to the wetlands functioning within the region.
A map demarcating the relevant local drainage area of the respective wetland/s, i.e. the wetland, its respective catchment and other wetland areas within a 500m radius of the study area. This will demonstrate, from a holistic point of view the connectivity between the site and the surrounding regions, i.e. the zone of influence.
Maps depicting demarcated wetland areas delineated to a scale of 1:10 000, following the methodology described by the DWAF (2005), together with a classification of delineated wetland areas, according to the methods contained in the Level 1 WET-Health methodology and the latest National Wetland Classification System (2010).
The determination of the ecological state of any wetland areas, estimating their biodiversity, conservation and ecosystem function importance with regard ecosystem services and linkages to other systems. Note that this determination will not include avifaunal, herpetological or invertebrate studies; however possible habitat for species of special concern would be commented on.
Provide mitigations regarding project related impacts, including engineering services that could negatively affect demarcated wetland areas.
1.2 DETAILS OF THE SPECIALIST
EOH Coastal and Environmental Services (CES)
Physical Address: 13 Stanley Street, Port Elizabeth 6001
Postal Address: 13 Stanley Street, Port Elizabeth 6001
Telephone: +27 41 585 1715
Fax: 086 546 5466
Website: www.cesnet.co.za
Email: [email protected]

Expertise of the specialist
Jesse Jegels
Jesse is a natural scientist with 6 years of research experience in an academic environment, and 9
years in a consultancy environment, Jesse specialises in aquatic and terrestrial ecology and
Integrated Environmental Management. This experience is diverse and varied, including aspects of
aquatic and coastal environmental services, waste management, road and service infrastructure
construction and environmental auditing. He has experience as a consultant in undertaking project-
based environmental studies such as Environmental Impact Assessments, Strategic Environmental
Assessments, specialist studies and Environmental Management Programmes. Jesse is currently
employed in the Port Elizabeth office of CES.
1.3 Description of the proposed development
The need for the security wall came about when the Qaqawuli informal settlement began encroaching on TFR’s property which not only resulted in financial losses due to theft and vandalism, but also poses a safety threat to dwellers of the informal settlement due to the proximity of the site to railway lines. On occasion, trains may be staged at the yard and during this time the nearby settlement dwellers and by-passers steal goods from these parked trains resulting in financial losses to Transnet. The construction of this wall will to protect and prevent further theft of their customer’s good. Wherever there are informal settlements situated adjacent to railway lines, the areas are considered as hot spots or High Desire Lines. The reason is that people always desire access to the rail reserve, whether it is to take shortcuts to areas or services they want to access, the availability of water, the opportunity for criminal activities or merely because there are areas of open land where they can establish informal housing or trading structures. Due to the high desire for access to or cross the rail reserve, most types of security walls are not suitable, For example, pre-fabricated walls, steel palisade fences or even concrete palisades are either vandalised (broken through) or removed (stolen). Furthermore, if there is already an existing settlement, it is usually difficult to access these areas from the settlement side of the wall and the only type of wall suitable is where all the construction can be done from the rail reserve side. In this instance the Hollow Core concrete wall is suitable as it can be poured and cured at the factory and installed on site vs the steel core concrete wall which must be gunited from both sides. The Hollow Core wall is generally resistant to normal vandalism and can last up to approximately 5 years before any major maintenance is required. The scope of the engineering works includes the construction of a hollow core concrete security wall.. This type of wall is a thick, pre-fabricated reinforced concrete wall. Panel thickness varies from 120-150mm thick depending on the client requirement and wall height can vary from 2.4 – 3m, again depending on client requirement. It is poured and cured at the factory, transported to site and set in upright supports and poured concrete foundations. The panels are placed by crane and cannot be removed by hand due to size and weight.

Figure 1: Locality map showing the proposed security wall (red).

1.4 Wetland classification systems
The South African National Biodiversity Institute (SANBI) in collaboration with a number of
specialists and stakeholders developed the newly revised and now accepted National Wetland
Classification Systems (NWCS 2010). This system comprises a hierarchical classification process
of defining a wetland based on the principles of the hydrogeomorphic (HGM) approach at higher
levels, with including structural features at the finer or lower levels of classification (SANBI 2009).
Wetlands develop in a response to elevated water tables, linked either to rivers, groundwater flows
or seepage from aquifers (Parsons, 2004). These water levels or flows then interact with localised
geology and soil forms, which then determines the form and function of the respective wetlands.
Water is thus the common driving force, in the formation of wetlands (DWAF, 2005). It is significant
that the HGM approach has now been included in wetland classification as the HGM approach has
been adopted throughout the water resources management realm with regards to the
determination of the Present Ecological State (PES) and Ecological Importance and Sensitivity
(EIS) and WET-Health assessments for aquatic environments. All of these systems are then easily
integrated using the HGM approach in line with the Eco-classification process of river and wetland
reserve determinations used by the Department of Water Services. The Ecological Reserve of a
wetland or river is used by DWS to assess the water resource allocations when assessing water
use license applications (WULA).
1.5 Wetland definition
Although the National Wetland Classification System (SANBI, 2009) is used to classify wetland
types it is still necessary to understand the definition of a wetland. Terminology currently strives to
characterise a wetland not only on its structure (visible form), but also to relate this to the function
and value of any given wetland.
The Ramsar Convention definition of a wetland is widely accepted as “areas of marsh, fen,
peatland or water, whether natural or artificial, permanent or temporary, with water that is
static or flowing, fresh, brackish or salt, including areas of marine water the depth of which
at low tide does not exceed six metres” (Davis 1994). South Africa is a signatory to the Ramsar
Convention and therefore its extremely broad definition of wetlands has been adopted for the
proposed NWCS, with a few modifications.
Whereas the Ramsar Convention included marine water to a depth of six metres, the definition
used for the NWCS extends to a depth of ten metres at low tide, as this is recognised as the
seaward boundary of the shallow photic zone (Lombard et al., 2005). An additional minor
adaptation of the definition is the removal of the term ‘fen’ as fens are considered a type of
peatland. The adapted definition for the NWCS is, therefore, as follows (SANBI, 2009):
WETLAND: an area of marsh, peatland or water, whether natural or artificial, permanent or
temporary, with water that is static or flowing, fresh, brackish or salt, including areas of marine
water the depth of which at low tide does not exceed ten metres.
This definition encompasses all ecosystems characterised by the permanent or periodic presence
of water other than marine waters deeper than ten metres. The only legislated definition of

wetlands in South Africa, however, is contained within the National Water Act (Act No. 36 of 1998)
(NWA), where wetlands are defined as “land which is transitional between terrestrial and aquatic
systems, where the water table is usually at, or near the surface, or the land is periodically covered
with shallow water and which land in normal circumstances supports, or would support, vegetation
adapted to life in saturated soil.” This definition is consistent with more precise working definitions
of wetlands and therefore includes only a subset of ecosystems encapsulated in the Ramsar
definition. It should be noted that the NWA definition is not concerned with marine systems and
clearly distinguishes wetlands from estuaries, classifying the later as a water course (SANBI,
2009). Table 1 provides a comparison of the various wetlands included within the main sources of
wetland definitions used in South Africa.
Table 1: Comparison of ecosystems considered to be ‘wetlands’ as defined by the proposed NWCS,
the National Water Act (Act No. 36 of 1998), and ecosystems included in DWAF’s (2005) delineation
manual.
Ecosystem NWCS
“wetland”
National Water Act
wetland
DWAF (2005)
delineation manual
Marine YES NO NO
Estuarine YES NO NO
Waterbodies deeper than 2 m (i.e.
limnetic habitats often describes as
lakes or dams)
YES NO NO
Rivers, channels and canals YES NO1 NO
Inland aquatic ecosystems that are
not river channels and are less than
2 m deep
YES YES YES
Riparian2 areas that are
permanently / periodically inundated
or saturated with water within 50 cm
of the surface
YES YES YES3
Riparian 2 areas that are not
permanently / periodically inundated
or saturated with water within 50 cm
of the surface
NO NO YES3
Although a subset of Ramsar-defined wetlands was used as a starting point for the compilation of
the first version of the National Wetland Inventory (i.e. “wetlands”, as defined by the National Water
Act, together with open waterbodies), it is understood that subsequent versions of the Inventory
include the full suite of Ramsar-defined wetlands in order to ensure that South Africa meets its
wetland inventory obligations as a signatory to the Convention (SANBI, 2009).
Wetlands must therefore have one or more of the following attributes to meet the above definition
(DWAF, 2005):
A high water table that results in the saturation at or near the surface, leading to anaerobic conditions developing in the top 50 cm of the soil.
Wetland or hydromorphic soils that display characteristics resulting from prolonged saturation, i.e. mottling or grey soils
The presence of, at least occasionally, hydrophilic plants, i.e. hydrophytes (water loving plants).

It should be noted that riparian systems that are not permanently or periodically inundated are not considered true wetlands, i.e. those associated with the drainage lines.
1.6 National Wetland Classification System method
During this study due to the nature of the wetlands and watercourses observed, it was decided that
the newly accepted National Wetlands Classification System (NWCS) be adopted. This
classification approach has integrated aspects of the HGM approach used in the WET-Health
system as well as the widely accepted eco-classification approach used for rivers.
The NWCS (SANBI, 2009) as stated previously, uses hydrological and geomorphological traits to
distinguish the primary wetland units, i.e. direct factors that influence wetland function. Other
wetland assessment techniques, such as the DWAF (2005) delineation method, only infer wetland
function based on abiotic and biotic descriptors (size, soils & vegetation) stemming from the
Cowardin approach (SANBI, 2009).
The classification system used in this study is thus based on SANBI (2009) and is summarised
below:
The NWCS has a six tiered hierarchical structure, with four spatially nested primary levels of
classification (Figure 2). The hierarchical system firstly distinguishes between Marine, Estuarine
and Inland ecosystems (Level 1) based on the degree of connectivity the particular system has
with the open ocean (greater than 10 m in depth). Level 2 then categorises the regional wetland
setting using a combination of biophysical attributes at the landscape level, which operate at a
broad bioregional scale.
This is opposed to specific attributes such as soils and vegetation. Level 2 has adopted the
following systems:
Inshore bioregions (marine)
Biogeographic zones (estuaries)
Ecoregions (Inland)
Level 3 of the NWCS assess the topographical position of inland wetlands as this factor broadly
defines certain hydrological characteristics of the inland systems. Four landscape units based on
topographical position are used in distinguishing between Inland systems at this level. No
subsystems are recognised for Marine systems, but estuaries are grouped according to their
periodicity of connection with the marine environment, as this would affect the biotic characteristics
of the estuary.
Level 4 classifies the hydrogeomorphic (HGM) units discussed earlier. The HGM units are defined
as follows:
(i) Landform – shape and localised setting of wetland
(ii) Hydrological characteristics – nature of water movement into, through and out of the
wetland
(iii) Hydrodynamics – the direction and strength of flow through the wetland
These factors characterise the geomorphological processes within the wetland, such as erosion
and deposition, as well as the biogeochemical processes.

Level 5 of the assessment pertains to the classification of the tidal regime within the marine and
estuarine environments, while the hydrological and inundation depth classes are determined for
the inland wetlands. Classes are based on frequency and depth of inundation, which are used to
determine the functional unit of the wetlands and are considered secondary discriminators within
the NWCS.
Level 6 uses six descriptors to characterise the wetland types on the basis of biophysical features.
As with Level 5, these are non-hierarchal in relation to each other and are applied in any order,
dependent on the availability of information. The descriptors include:
(i) Geology;
(ii) Natural vs. Artificial;
(iii) Vegetation cover type;
(iv) Substratum;
(v) Salinity; and
(vi) Acidity or Alkalinity.
It should be noted that where sub-categories exist within the above descriptors, hierarchical
systems are employed, and these are thus nested in relation to each other.
The HGM unit (Level 4) is the focal point of the NWCS, with the upper levels (Figure 3– Inland
systems only) providing means to classify the broad bio-geographical context for grouping
functional wetland units at the HGM level, while the lower levels provide more descriptive detail on
the particular wetland type characteristics of a particular HGM unit. Therefore Level 1 – 5 deals
with functional aspects, while Level 6 classifies wetlands on structural aspects.
Figure 2: Basic structure of the National Wetland Classification System, showing how ‘primary
discriminators’ are applied up to Level 4 to classify Hydrogeomorphic (HGM) Units, with ‘secondary
discriminators’ applied at Level 5 to classify the tidal/hydrological regime, and ‘descriptors’ applied
at Level 6 to categorise the characteristics of wetlands classified up to Level 5 (From SANBI, 2009).

Figure 3: Illustration of the conceptual relationship of HGM Units (at Level 4) with higher and lower
levels (relative sizes of the boxes show the increasing spatial resolution and level of detail from the
higher to the lower levels) for Inland Systems (from SANBI, 2009).
1.7 Wetland importance and function
South Africa is a Contracting Party to the Ramsar Convention on Wetlands, signed in Ramsar,
Iran, in 1971, and has thus committed itself to this intergovernmental treaty, which provides the
framework for the national protection of wetlands and the resources they could provide. Wetland
conservation is now driven by the South African National Biodiversity Institute, a requirement under
the National Environmental Management: Biodiversity Act (No 10 of 2004).
The Zwartkops Conservancy is currently working towards having the wetlands in the project area
declared a Ramsar site and it will therefore be important to ensure that the proposed development
does not threaten this Ramsar application. The proposed Ramsar area is the wetlands from the
mouth of the Swartkops up to Perseverance, but excluding any residential areas.
Wetlands are among the most valuable and productive ecosystems on earth, providing important
opportunities for sustainable development (Davies and Day, 1998). However wetlands in South
Africa are still rapidly being lost or degraded through direct human induced pressures (Nel et al.,
2004).
The most common attributes or goods and services provided by wetlands include:
Improve water quality;
Impede flow and reduce the occurrence of floods;
Reeds and sedges used in construction and traditional crafts;
Bulbs and tubers, a source of food and natural medicine;

Store water and maintain base flow of rivers;
Trap sediments; and
Reduce the number of water borne diseases.
In terms of this study, the wetlands provide ecological (environmental) value to the area acting as
refugia for various wetland associated plants, butterflies birds and amphibians.
In the past, wetland conservation has focused on biodiversity as a means of substantiating the
protection of wetland habitat. However not all wetlands provide such motivation for their protection,
thus wetland managers and conservationists began assessing the importance of wetland function
within an ecosystem.
Conservation importance of the individual wetlands was based on the following criteria:
Habitat uniqueness
Species of conservation concern
Habitat fragmentation with regard ecological corridors
Ecosystem service (social and ecological)
The presence of any or a combination of the above criteria would result in a HIGH conservation
rating if the wetland was found in a near natural state (high PES). Should any of the habitats be
found modified the conservation importance would rate as MEDIUM, unless a Species of
conservation concern was observed (HIGH). Any system that was highly modified (low PES) or
had none of the above criteria, received a LOW conservation importance rating. Wetlands with
HIGH and MEDIUM ratings should thus be excluded from development with incorporation into a
suitable open space system, with the maximum possible buffer being applied. Wetlands which
receive a LOW conservation importance rating could be included into stormwater management
features, but should not be developed so as to retain the function of any ecological corridors.
1.8 Relevant wetland legislation and policy
Locally the South African Constitution, seven (7) Acts and two (2) international treaties allow for the
protection of wetlands and rivers within South Africa. These systems are protected from
destruction or pollution by the following:
Section 24 of The Constitution of the Republic of South Africa;
Agenda 21 – Action plan for sustainable development of the Department of Environmental
Affairs and Tourism (DEAT) 1998;
The Ramsar Convention, 1971 including the Wetland Conservation Programme (DEAT)
and the National Wetland Rehabilitation Initiative (DEAT, 2000);
National Environmental Management Act (NEMA), 1998 (Act No. 107 of 1998) inclusive of
all amendments, as well as the NEM: Biodiversity Act;
National Water Act, 1998 (Act No. 36 of 1998);
Conservation of Agricultural Resources Act, 1983 (Act No. 43 of 1983); and
Minerals and Petroleum Resources Development Act, 2002 (Act No. 28 of 2002).
Nature and Environmental Conservation Ordinance (No. 19 of 1974)
National Forest Act (No. 84 of 1998)
National Heritage Resources Act (No. 25 of 1999)

Apart from NEMA, the Conservation of Agricultural Resources Act (CARA), 1983 (Act No. 43 of
1983) will also apply to this project. The CARA has categorised a large number of invasive plants
together with associated obligations of the land owner.
1.9 Provincial legislation and policy
Currently there are no accepted wetland buffers distances provided by the provincial authorities.
Until such a system is developed, it is recommended that a 50m buffer be set for all wetlands. The
size of the machinery and space required for the construction of the wall should eliminate the
chance of the activities occurring within the buffer zone except where the wall would inevitably
cross through a wetland.
Other policies that are relevant include:
Provincial Nature Conservation Ordinance (PNCO) – Protected Flora.
NMBM Conservation Action Plan (NCAP)
National Freshwater Ecosystems Priority Areas – (Nel et al., 2011). This mapping product
highlights potential rivers and wetlands that should be earmarked for conservation on a
national basis.

2 STUDY APPROACH
This study will follow the approaches of several national guidelines with regards to wetland
assessment. These have been modified by the author, to provide a relevant mechanism of
assessing the present state of the local wetland systems and a clear and objective means assess
the potential impacts on the system as a consequence of the proposed development.
Current water resource classification systems make use of the Hydrogeomorphic (HGM) approach,
and for this reason, the National Wetland Classification System approach will be used in this study.
It is also important to understand wetland definition, means of assessing wetland conservation and
importance as well as understanding the pertinent legislation with regards to protecting wetlands.
These aspects will be discussed in greater depth in this section of report, as they form the basis of
the study approach to assessing wetland impacts.
2.1 Wetland condition
To assess the Present Ecological State (PES) or condition of the observed wetlands, WET-Health
– wetland management series (WRC 2009), as WET-Health (Level 1) was employed. The output
scores from the WET-Health model are presented in the standard DWAF A-F ecological categories
(Table 2), and provide a score of the PES of the habitat integrity of the wetland system being
examined. WET-Health examines deviation from the natural reference condition for three
components of health; hydrology, geomorphology and vegetation. These components are
assessed separately in separate modules to produce three scores which indicate how much the
wetland deviates largely from the natural reference condition.
Table 2: Description of A – F ecological categories
Description Combined impact
score PES Category
Unmodified, natural. 0-0.9 A
Largely natural with few modifications. A slight change in ecosystem processes is discernable and a small loss of natural habitats and biota may have taken place.
1-1.9 B
Moderately modified. A moderate change in ecosystem processes and loss of natural habitats has taken place but the natural habitat remains predominantly intact
2-3.9 C
Largely modified. A large change in ecosystem processes and loss of natural habitat and biota has occurred.
4-5.9 D
The change in ecosystem processes and loss of natural habitat and biota is great but some remaining natural habitat features are still recognizable.
6-7.9 E
Modifications have reached a critical level and the ecosystem processes have been modified completely with an almost complete loss of natural habitat and biota.
8 - 10 F
A Level 1 WET-Health assessment entails a desktop evaluation, with limited field verification. This
approach was selected as the conditions of the wetlands are heavily degraded and the level of
assessment required is of low resolution i.e. in order to obtain an overview of the state of health of
the wetlands in a particular catchment. A site visit was conducted to verify conditions on the
ground.

3 DESCRIPTION OF THE POTENTIALLY AFFECTED ENVIRONMENT
The study site is located approximately 7 km north of the Port Elizabeth CBD. The proposed wall
falls within Quaternary catchment (M20A) Papenkuils/Bakens (Figure 4). Most of the wetlands
occurs within Quaternary catchment M10 with slight overlap into the M20A catchment. Figure 5
indicates the potential wetland and aquatic systems expected to occur within the region based on
several databases such as the National Freshwater Ecosystems Priority Area (NFEPA) database
and National Wetland Inventory (Nel et al., 2011). The NFEPA database indicated that the northern
tip of the study area would be covered by the Swartkops Estuary, i.e. the area contained below the
5m contour, however as is shown in Figure 5, most of these areas are now developed (housing
and infrastructure). A large portion of the remaining supratidal areas have either dried out or have
become freshwater dominated wetland areas. Therefore based on site observations, the remaining
natural systems were delineated and are presented in Figure 6.

Figure 4: Project locality map indicating the M20A quaternary catchment boundary (below pink line)
(Source Google Earth & DWA)
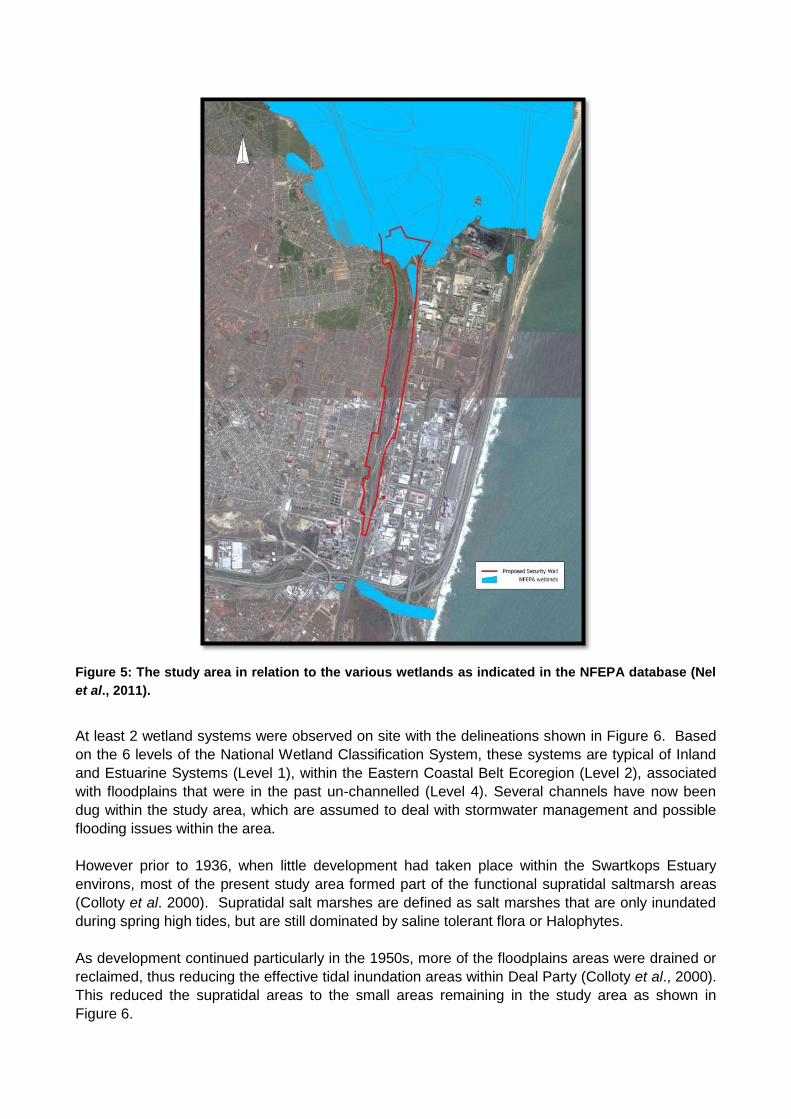
Figure 5: The study area in relation to the various wetlands as indicated in the NFEPA database (Nel
et al., 2011).
At least 2 wetland systems were observed on site with the delineations shown in Figure 6. Based
on the 6 levels of the National Wetland Classification System, these systems are typical of Inland
and Estuarine Systems (Level 1), within the Eastern Coastal Belt Ecoregion (Level 2), associated
with floodplains that were in the past un-channelled (Level 4). Several channels have now been
dug within the study area, which are assumed to deal with stormwater management and possible
flooding issues within the area.
However prior to 1936, when little development had taken place within the Swartkops Estuary
environs, most of the present study area formed part of the functional supratidal saltmarsh areas
(Colloty et al. 2000). Supratidal salt marshes are defined as salt marshes that are only inundated
during spring high tides, but are still dominated by saline tolerant flora or Halophytes.
As development continued particularly in the 1950s, more of the floodplains areas were drained or
reclaimed, thus reducing the effective tidal inundation areas within Deal Party (Colloty et al., 2000).
This reduced the supratidal areas to the small areas remaining in the study area as shown in
Figure 6.

With the increase in development, came an increase in stormwater management, which then
increased amount of freshwater run-off. This has resulted in the high number of freshwater
dominated ponds and reedbeds seen within the study area, but in essence would have only been
limited to areas were the Chatty River for example would have created freshwater reedbeds in the
past (Colloty et al., 2000). Thus the study area systems would thus be considered modified or
artificial systems, created and maintained by un-natural run-off created by the stormwater
management features emanating from the Deal Party area, the storm water controls ponds at
Algorax and the Fishwater Flats WWTW.
Plate 1: A typical small depression located in the southern portion of the alignment, which is
ephemeral
Plate 2: Reedbed found at the western side at the corner of Grahamstown Rd and John Tallant Rd

Figure 6: The delineated wetland and riverine areas together the respective ecological and WULA
buffers

Plant species associated with all wetland types found in the study area included the following
facultative types, i.e. plants that occur in wetlands 60-99% of the time, some of these included the
following:
Ficinia lateralis
Juncus kraussii
Phragmites australis
Cyperus obtusiflorus var. obtusiflorus
Centella asiatica
Typha capensis
Salicornia meyeriana
4. Present Ecological State and conservation importance
In this study several other sources of information were also considered, which included the
National Freshwater Ecosystems Priority Areas project completed by the CSIR (CSIR, 2011),
regional and national biodiversity assessments, and the latest being the National Biodiversity
Assessment released by SANBI (Driver et al., 2012).
Table 3: Summary of the overall health of the wetland based on impact score and change score.
HGM Unit
Ha Extent
(%)
Hydrology Geomorphology Vegetation
Impact Score
Change Score
Impact Score
Change Score
Impact Score
Change Score
1 16 100 7.5 0 3.5 -1 7.1 -1
Area weighted impact scores* 7.5 0.0 3.5 -1.0 7.1 -1.0
PES Category (See Table 5.29)
E → C ↓ E ↓
More recently, the Department of Water Affairs, as part of a Water Research Commission project
has initiated the revision of the 1999 Present Ecological State (PES) assessment of all rivers and
riparian associated “wetlands” on a national basis. Their assessment has indicated that the
freshwater systems found in the study area all have a PES of D (Largely modified). The current
study however suggests that the systems would probably have a PES closer to E, i.e. the change
in ecosystem processes and loss of natural habitat and biota is great but some remaining natural
habitat features are still recognizable. This is due to current estimates that between 20 – 50 % of
the natural catchment remains within the Subquaternary catchments associated within the study
area. The area and the associated wetlands are also highly disturbed and in some cases modified.
It is predicted that the building of the wall would not have a significant impact on the health of the
wetlands as most of the structure would either occur on existing hard stands or within wetlands that
are highly degraded already. These wetlands have very limited chance of being rehabilitated.
Based on evidence in this study it is evident that the EIS of the rivers and in particular the wetland
areas within the study area is low. The estuarine portion of the study area was rated in a study
conducted by the CSIR, and they found that the Swartkops Estuary, had a PES of D, while the high

national importance of the systems (conservation value) elevated the EIS to High (Turpie et al,
2012).
A number of Category 1 & 2 plants were also found at all of the sites investigated, thus the
contractors must take extreme care to ensure the further spread of these plants doesn’t occur. This
should be done through proper stockpile management (topsoil) and suitable rehabilitation of
disturbed areas after construction.
Alien plant species observed included:
Acacia saligna
Acacia longifolia
Opuntia spp.
5. PERMIT REQUIREMENTS
The following documents (amongst others) will be needed for a Water Use License Application due to the project being within 500m of a wetland area, as required by the Department of Water and Sanitation (DWS):
Wetland areas delineation supplied together with a desktop analysis and potential sensitivity identification;
Application forms for Section 21 (c) and (i);
Supporting documentation in terms of the activity and applicant.
The following activities associated with the development require a water use license, as stipulated by the legislation shown below:
NWA (Act 36 of 1998) Section 21 (c) impeding or diverting the flow of water in a water course (i) altering the beds, banks, course or characteristics of a water course
6. CONCLUSION AND RECOMMENDATIONS
Various water bodies dominated the regional and study area landscape. All of the observed
aquatic features showed a high degree of impact due to the present road infrastructure and land
reclamation that has taken place over a period of more than 60 years. Thus the Present Ecological
State of the systems was considered to be E. The Ecological Importance and Sensitivity for most
of these systems were also rated LOW due to the existing impacts within or adjacent to the
freshwater wetland areas. Opposing any impacts that would affect the functioning of the saltmarsh
is of critical importance due to importance of the Swartkops Estuary (EIS = High). It is important to
note that all the wetland types found within the study area form an important network of corridors
and are extremely valuable for bird species within the study area.
The construction area to the north occurs within 500m of wetland boundaries and would thus
require WULA. Most of this section is within the 50m wetland buffers, and would occur within the
modified wetlands themselves. It should be noted that most of the wall to the north falls within
wetland areas that are highly modified or degraded and would have an additional impact on the
functioning of the habitat. The significance of this impact however would be rated as low.
Further recommendations and monitoring guidelines include:

Vegetation clearing should occur in parallel with the construction progress to minimise erosion
and/or run-off. Large tracts of bare soil will either cause dust pollution or quickly erode and then
cause sedimentation in the lower portions of the catchment.
Only indigenous plant species must be used should re-vegetation take place.
All construction materials including fuels and oil should be stored in demarcated areas that are
contained within berms / bunds to avoid spread of any contamination into wetlands. Washing
and cleaning of equipment should also be done within berms or bunds and on hard surfaces, in
order to trap any cement and contaminants and prevent excessive soil erosion. These
structures must be removed and the sites must be re-vegetated after construction has been
completed.
Mechanical plant and tankers/bowsers must not be refuelled or serviced within or directly
adjacent to any or wetland area. It is therefore suggested that all construction camps, lay down
areas, batching plants or areas and any storage areas should be more than 50m / floodline
from any demarcated wetland area (i.e. outside of the 50m buffer)
No faunal species may unnecessarily be handled, killed, hunted or harassed during the
construction period.
Erosion control measures must be put in place prior to any construction activities that would
result in soil being exposed.
Site engineers should always inspect the erosion control measures and water diversion
measures and confirm their appropriateness and integrity.
Weather forecasts from the South African Weather Bureau of up to three days in advance must
be monitored on a daily basis to avoid exposing soil, works or materials during a storm event
Appropriate action must be taken in advance to protect works should a storm event be
forecasted;
Any damage and loss of soil resulting from a storm is to be remedied immediately.
The construction camp and necessary ablution facilities meant for construction workers must
be located outside the 50m wetland buffer zone.
Vehicle and machinery movement should be restricted to necessary areas only and avoid the
50m buffer zone.
All stockpiled material must be located outside the 50m wetland buffer zone.

7. REFERENCES
Agenda 21 – Action plan for sustainable development of the Department of Environmental Affairs
and Tourism (DEAT) 1998.
Agricultural Resources Act, 1983 (Act No. 43 of 1983).
Colloty, BM, JB Adams and GC Bate. (2000). The botanical importance rating of the Swartkops
estuary over time. Water SA Vol. 26: 171-180.
Davies, B. and Day J., (1998). Vanishing Waters. University of Cape Town Press.
Davis, T.J. (Editor). 1994. The Ramsar Convention Manual: A guide for the Convention on
Wetlands of International Importance especially as waterfowl habitat. Ramsar Convention Bureau,
Gland, Switzerland. 207 p
Department of Water Affairs and Forestry - DWAF (2005). A practical field procedure for
identification and delineation of wetland and riparian areas Edition 1. Department of Water Affairs
and Forestry , Pretoria.
Department of Water Affairs and Forestry - DWAF (2007). Manual for the assessment of a Wetland
Index of Habitat Integrity for South African floodplain and channelled valley bottom wetland types
by M. Rountree (ed); C.P. Todd, C. J. Kleynhans, A. L. Batchelor, M. D. Louw, D. Kotze, D.
Walters, S. Schroeder, P. Illgner, M. Uys. and G.C. Marneweck. Report no. N/0000/00/WEI/0407.
Resource Quality Services, Department of Water Affairs and Forestry, Pretoria, South Africa.
Driver A., Sink, K.J., Nel, J.N., Holness, S., Van Niekerk, L., Daniels, F., Jonas, Z., Majiedt, P.A.,
Harris, L. & Maze, K. 2012. National Biodiversity Assessment 2011: An assessment of South
Africa’s biodiversity and ecosystems. Synthesis Report. South African National Biodiversity
Institute and Department of Environmental Affairs, Pretoria.
Ewart-Smith J.L., Ollis D.J., Day J.A. and Malan H.L. (2006). National Wetland Inventory:
Development of a Wetland Classification System for South Africa. WRC Report No. KV 174/06.
Water Research Commission, Pretoria.
Kleynhans C.J., Thirion C. and Moolman J. (2005). A Level 1 Ecoregion Classification System for
South Africa, Lesotho and Swaziland. Report No. N/0000/00/REQ0104. Resource Quality
Services, Department of Water Affairs and Forestry, Pretoria.
Kotze D.C., Marneweck G.C., Batchelor A.L., Lindley D.S. and Collins N. (2008). WET-
EcoServices A technique for rapidly assessing ecosystem services supplied by wetlands. WRC
Report No: TT 339/08.
Lombard AT, Strauss T, Harris J, Sink K, Attwood C and Hutchings L (2005). South African
National Spatial Biodiversity Assessment 2004. Technical Report, Volume 4: Marine Component.
South African National Biodiversity Institute, Pretoria.
Minerals and Petroleum Resources Development Act, 2002 (Act No. 28 of 2002), as amended.
National Environmental Management Act, 1998 (Act No. 107 of 1998), as amended.
National Water Act, 1998 (Act No. 36 of 1998), as amended
National Wetland Classification System (2009) Fresh Water Consulting Group
Nel, J., Maree, G., Roux, D., Moolman, J., Kleynhans, N., Silberbauer, M. and Driver, A. 2004.
South African National Spatial Biodiversity Assessment 2004: Technical Report. Volume 2: River

Component. CSIR Report Number ENV-S-I-2004-063. Council for Scientific and Industrial
Research, Stellenbosch.
Nel, J.L., Murray, K.M., Maherry, A.M., Petersen, C.P., Roux, D.J., Driver, A., Hill, L., Van
Deventer, H., Funke, N., Swartz, E.R., Smith-Adao, L.B., Mbona, N., Downsborough, L. and
Nienaber, S. (2011). Technical Report for the National Freshwater Ecosystem Priority Areas
project. WRC Report No. K5/1801.
Parsons R. (2004). Surface Water – Groundwater Interaction in a Southern African Context. WRC
Report TT 218/03, Pretoria.
Ramsar Convention, (1971) including the Wetland Conservation Programme (DEAT) and the
National Wetland Rehabilitation Initiative (DEAT, 2000).
SANBI (2009). Further Development of a Proposed National Wetland Classification System for
South Africa. Primary Project Report. Prepared by the Freshwater Consulting Group (FCG) for the
South African National Biodiversity Institute (SANBI).