wet technik pbl report - aalto global impact
TRANSCRIPT

WET TECHNIK PBL REPORT 24.10.2019
─
Wet Technik College of Engineering, Design, Art and Technology
Makerere University
Kampala, Uganda

1
Appreciation
We would like to start by thanking the Almighty God for availing us with this opportunity to
participate in the Problem Based Learning Project.
In the same way we would like to appreciate the Finnish government through the ministry of
foreign affairs for supporting the Problem Based Learning Project together with Makerere
University.
Special thanks to the PBL program coordinator Matleena Muhonen and the entire Aalto staff
that participated in the program directly with Makerere University especially during the field
trip.
The mentors from the Problem Based Learning Dr. Kalibbala Herbert, Dr. Kulabako Robinah,
Mr. Philip Nsereko and Prof Philip together with project manager Dr. Venny Nakazibwe, we
are more than grateful for the knowledge and support you passed onto us during this period.
It was such a pleasure working with a highly professional team.
We would also like to appreciate Makerere University through the College of Engineering
Design Art and Technology for offering us support in form of working space for laboratory
analysis and a site to set up the pilot plant.
Lastly, I would like to appreciate fellow student participants from Makerere University in the
Problem Based Learning project the entire Wet Technik team and the Vepox filter team. The
Aalto student team for making the time we shared together during the field trip worthy by
sharing knowledge and working together in building the projects we have now.
The Africa Hall kitchen staff for the hospitality and support offered to us during the
construction of our pilot plant.

2
Abbreviations.
CEDAT- College of Engineering, Design, Art and Technology.
PBL- Problem Based Learning.
SGT- Sustainable Global Technologies
MUK- Makerere University Kampala.
CW- Constructed Wetland.
ABR- Anaerobic Baffled Reactor.
BOD- Biochemical Oxygen Demand.
COD- Chemical Oxygen Demand.

3
Contents
0
Appreciation ............................................................................................................................................................................. 1
Abbreviations. .......................................................................................................................................................................... 2
Project brief............................................................................................................................................................................... 5
Project objectives.................................................................................................................................................................... 6
OUR TEAM ................................................................................................................................................................................. 7
STAKEHOLDERS. ...................................................................................................................................................................... 9
PROJECT TIMELINE ............................................................................................................................................................... 10
Preliminary Research and works done. ........................................................................................................................ 11
State of the Art analysis ................................................................................................................................................. 11
Greywater Treatment: ................................................................................................................................................ 11
Legislation Standards ................................................................................................................................................. 12
Primary System: Anaerobic Baffled Reactor. .......................................................................................................... 14
Literature Review ......................................................................................................................................................... 14
Design of Anaerobic Baffled Reactor ................................................................................................................... 16
Operation and maintenance of the plant ........................................................................................................... 19
Secondary System: Constructed Wetland............................................................................................................... 20
Literature Review ......................................................................................................................................................... 20
On site works done ......................................................................................................................................................... 26
Study Area/Location ................................................................................................................................................... 26
Flow and Flow Variations .......................................................................................................................................... 27
Wastewater Quality Characterization: ................................................................................................................. 29
Why an ABR was needed? ........................................................................................................................................ 30
Design Procedure for Constructed Wetland ..................................................................................................... 35
Operation and Maintenance ................................................................................................................................... 39
FIELD VISIT .............................................................................................................................................................................. 40
Team Communication ......................................................................................................................................................... 41
Internship activities .............................................................................................................................................................. 42

4
Setting Out ..................................................................................................................................................................... 42
Excavation works ......................................................................................................................................................... 43
Casting of concrete Blinding ................................................................................................................................... 44
Brick work of compartment walls .......................................................................................................................... 46
Plastering and Finishes .............................................................................................................................................. 49
Casting of the Anaerobic Baffled Reactor Slab ................................................................................................ 51
Filling of substrate ....................................................................................................................................................... 54
Substrate configuration ............................................................................................................................................ 55
RESULTS AND ACHIEVEMENTS. ...................................................................................................................................... 57
Prizes: .................................................................................................................................................................................... 57
Established Networks and Partnerships: ............................................................................................................. 58
Conclusion ............................................................................................................................................................................... 58
References ............................................................................................................................................................................... 59
Annex ........................................................................................................................................................................................ 60

5
Project brief.
Makerere University, together with the University of Dar-es-Salaam, University of Nairobi and
Aalto University in Finland, teamed up on a project on “Strengthening Problem- Based
Education in East African Universities 2017-2020”.
Problem-Based Education/ Problem-Based Learning (PBL) is a particularly powerful
multidisciplinary approach to seeking and applying in-depth knowledge on particular
phenomena prevailing in the society.
Makerere University Problem Based Learning project is run at College of Engineering Design
Art and Technology and students in their Third Year of study in the various programs offered
in the School of Engineering (S0E) and School of the Built Environment, Fourth year in
Architecture; and Second Year in the Margaret Trowell School of Industrial & Fine Art
participate in this project.
One team of students (4-6 members), with representation from all the three schools of CEDAT,
is selected. The selected team is paired up with a team of students from Aalto University, to
work on the identified project challenge. Students participating in the project are expected
to gain hands-on experience in conceptualizing and prototyping environmentally, socially
and economically sustainable solutions to community challenges. In addition, students will
gain the knowledge tools of design thinking, project management skills, and join a regional
and global network of PBL practitioners.
The project is funded by the HEI ICI Program by the Ministry for Foreign Affairs of Finland
and facilitated by Aalto Global Impact, a home to Aalto University’s societal impact initiatives.
The team participating in PBL is assisted to identify a mentor and team of experts from the
three schools of CEDAT. The team works together with a complementary team of Aalto
University students, from the fields of Engineering, Design, and Business. The student teams
then work on prototyping their solution in the real world and test it.
Wet Technik is a team of students working under the Problem Based Learning (PBL) program
at the College of Engineering, Design, and Technology at Makerere University. Wet Technik
is looking at recycling wastewater through the use of constructed wetlands using novel
materials such as plastic bottle caps and pumice.
6
Wet Technik is exploring the potential of grey-water recycling through the use of novel
materials including pumice a locally sourced rock and plastic. The group is using constructed
wetlands with improved aesthetics to harness the potential of greywater. The aim is to achieve
water that can be reused in non-potable activities.
Wet Technik is constructing a pilot plant to study and treat the kitchen wastewater (greywater)
from the Africa Hall kitchen and explore its potential for reuse in non-potable activities like
irrigation.
Project objectives.
The project had a number of objectives and some of these include;
o To construct a pilot greywater treatment plant at Africa Hall.
o To adopt the PBL approach to solving problems in the peri urban communities.
o To develop networks with stakeholders both in the private and government sector.
Specific objectives.
o To carry out research on wastewater treatment systems and thereafter produce a full
design.
o To engage stakeholders through workshops and site visits.
o To attend the 2-week field visit with Aalto University students and engage in all related
activities.
o To carry out tests and further research on the pilot constructed wetland.

7
OUR TEAM
MUSINGUZI MARK MUSIIMENTA
BSC. MECHANICAL ENGINEERING.
YEAR IV.
SSEKIMPI DENNIS
BSC. CIVIL ENGINEERING
YEAR IV
KWIZERA PIKE
BSC. MECHANICAL ENGINEERING
YEAR IV.
BUZABO MELLISSA
BACHELORS OF INDUSTRIAL AND FINE ART.
YEAR III.

8
MWEBESA NINA SHATSI
BSC. QUANTITY SURVEYING
YEAR IV
MUSUMBA EMMANUEL
BSC. MECHANICAL ENGINEERING
YEAR IV.

9
STAKEHOLDERS.
- Provision of working space and laboratory for
research
- Provision of access to site for construction of pilot
plant.
-Mentorship and knowledge on circular design
principles.
-Knowledge on business model generation
-Mentorship on design tailored for innovations to
have a better climatic impact.
-Access to funding and mentors from UC Berkeley to
develop startups solving critical issues.
-Access to mentors, business development advice and
funding for early stage startups.
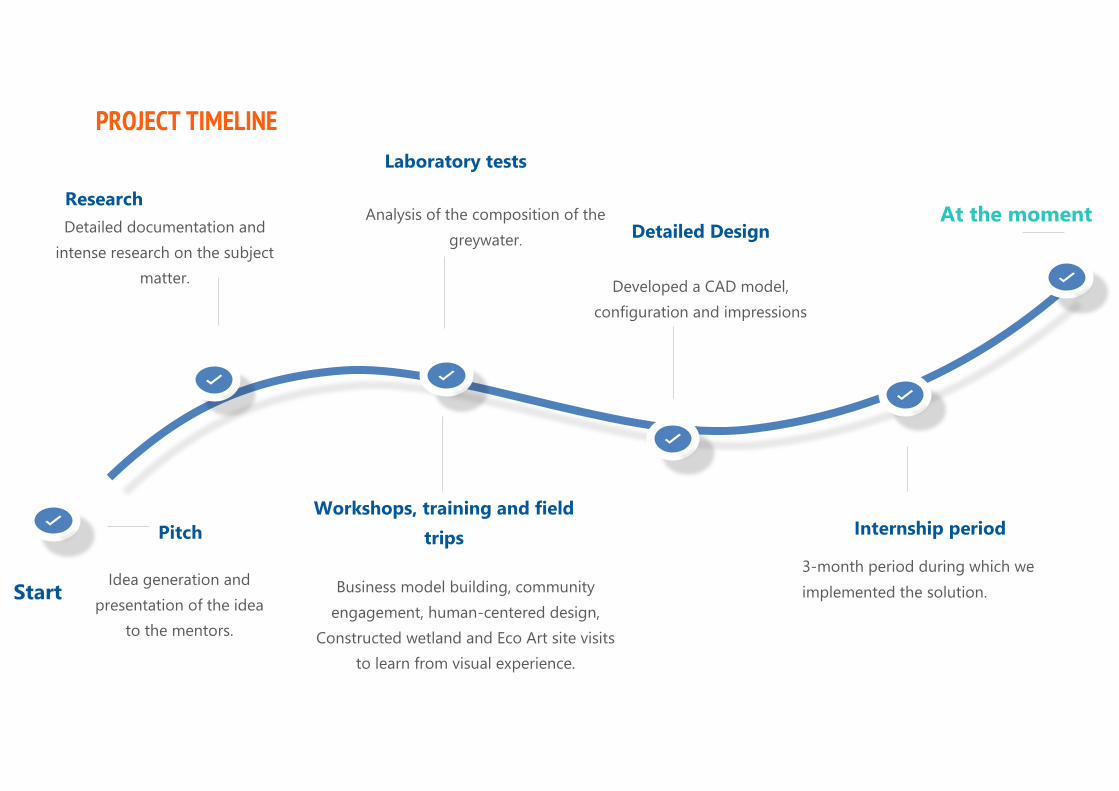
PROJECT TIMELINE
Detailed documentation and
intense research on the subject
matter.
Business model building, community
engagement, human-centered design,
Constructed wetland and Eco Art site visits
to learn from visual experience.
Workshops, training and field
trips
Analysis of the composition of the
greywater.
Laboratory tests
Start
At the moment
Idea generation and
presentation of the idea
to the mentors.
Pitch
3-month period during which we
implemented the solution.
Internship period
Research
Developed a CAD model,
configuration and impressions
Detailed Design

11
Preliminary Research and works done.
State of the Art analysis
Greywater is all wastewater that is discharged from a house, excluding blackwater
(toilet water). This includes water from showers, bathtubs, sinks, kitchen, dishwashers,
laundry tubs, and washing machines (fbr, 2005).
Greywater reuse is one of the ways to efficiently utilize water. There is need to identify
cheap and easy to maintain systems that can make greywater available for reuse in
the various settings i.e. household and institutions.
National Environmental Engineering Research Institute (NEERI) Nagpur and UNICEF
Bhopal, Madhya Pradesh have developed, implemented and evaluated greywater
reuse systems for small buildings (schools) in rural areas. During 2005 and 2006, NEERI
AND UNICEF collaborated to investigate the possibility of recycling greywater
(bathroom water) in residential tribal schools in rural Western Madhya Pradesh.
The drive for this technology was a result of decreasing availability of water, lowering
of groundwater table and an increase in fluoride concentration in groundwater. It was
discovered that a recycling system for about 400 students generating 4500l/day of
greywater costs about $1100 and the cost could be recovered in two years (Institute,
2007)
The reuse of greywater serves two fundamental purposes namely; reduction in the
water requirements and reduction in sewage generation.
Greywater Treatment:
The treatment of greywater to avail it for reuse is considered basing on the reuse
purpose, cost requirements and available area. The processes considered for
treatment include anaerobic and aerobic processes.

12
General terms used to describe different degrees of treatment, in order of increasing
treatment level, are preliminary, primary, secondary, and tertiary systems.
Preliminary treatment: The first phase of treatment in a series of treatment steps and
typically it’s intended to reduce the core solids content in wastewater before other
treatment phases. It is basically made up of screens and grit removal mechanisms. This
stage removes the materials that can cause operational problems.
Primary system: The major objective of this system is the removal of settleable
organic and inorganic solids. The dissolved constituents in the wastewater are not
affected in this stage of treatment. The
The primary treatment system is in itself a unit process with both physical and chemical
processes taking place resulting not only in a reduction in solids (physical) but also
other parameters like the Biochemical Oxygen Demand (BOD). The primary treatment
system mainly consists of sedimentation tanks of different shapes i.e. round and
rectangular.
Secondary system: This is majorly intended to achieve further treatment of the
effluent from the primary system. Residual organics and suspended solids are the
major pollutants removed in this stage. The biodegradable organic matter is also
removed through various processes both aerobic and anaerobic.
Legislation Standards
Wastewater generation and discharge into the environment are governed by the National
Environment Management Authority through the NEMA effluent discharge standards. The
standards clearly stipulate based on various parameters the safe levels for the discharge
of wastewater into the environment. Below is a summary of some of the parameters
extracted from The National Environment Standards for Discharge of Effluent into Water
or on Land.

13
Table 1: Selected Permissible NEMA Effluent Discharge Standards
Parameter Standard
Biochemical Oxygen Demand 50mg/l
Chemical Oxygen Demand 100mg/l
pH 6-8
Turbidity 300NTU
Total Suspended Solids 100mg/l
Total Phosphorous 10mg/l
Source: The National Environment (Standards for Discharge of Effluent into Water or on
Land) Regulations, S.I. No 5/1999
Based on the reuse purpose of the water effluent from a treatment plant can be compared
to various standards. These include the potable water standards and water reuse
standards.
Water to be used for potable purposes is governed by the Uganda Standard Potable water
specification (US EAS 12). A summary of selected parameters form Uganda potable water
standards is shown below:
Table 2: Potable Water standards
Parameter Standard Treated Potable
water
pH 6.5-8.5
Conductivity 1500(μS/cm)
Turbidity 5 NTU
Total Suspended Solids Not detectable
Total Dissolved Solids 700mg/l
Total Phosphorous 10mg/l
Total Nitrogen(Nitrate) 45mg/l
Source: Uganda Standard Potable water — Specification US EAS 12 UNBS
2014

14
The other reuse purposes like agriculture and other non-potable purposes are stipulated
in various reuse standards especially those developed by international agencies. These
include:
Table 3: International Reuse Standards
Organization Guideline
World Health Organization (WHO) Guidelines for the safe use of wastewater,
excreta, and greywater (2006)
United Nations Environment Program
(UNEP)
Guidelines for municipal wastewater reuse
in the Mediterranean region (2005)
United Nations Water Decade Program
on Capacity Development (UNW-DPC)
Proceedings of the UN-Water project “Safe
use of wastewater in agriculture” (2013)
International Organization for
Standardization (ISO)
ISO/TC282 Water reuse
Food and Agriculture Organization (FAO) Water quality for agriculture (1994)
Primary System: Anaerobic Baffled Reactor.
The primary system is primarily concerned with suspended solids removal and along with
this there is a change in the chemical parameters like the Biochemical Oxygen Demand
(BOD). For the grey water management plant and Anaerobic Baffled Reactor was chosen
as the primary treatment system.
Literature Review
Anaerobic Baffled Reactors (ABRs) are concrete, masonry or prefabricated fiberglass tanks
consisting of several compartments in series (Tayler, 2018). They use anaerobic digestion
in addition to settling of the particulate matter to remove organic material from the
wastewater. They take advantage of the intimate contact between the wastewater and the
active biomass that leads to bioremediation and the eventual further improvement in
effluent quality is provided by relatively high retention times ranging from 24 hours to 72
hours.

15
Treatment performances of ABRs ranged from 37-80% COD reduction while BOD
reduction lies between 60-90% reductions. (Pillay, 2004). The basic mechanical design of
the ABR is very simple, and in situ installations need not have any parts outside the
rectangular body. (Pillay, 2004).
Figure 1: Schematic of an Anaerobic Baffled Reactor
Source: (Tayler, 2018)
Key components:
Settler compartment:
This settler compartment separates large solids before progressing to the up-flow
compartments. It reduces the rate of solids accumulation in the up-flow compartments
and attenuates the peak flows so reduces the hydraulic load fluctuations on subsequent
up-flow compartments. (Tayler, 2018)
Up flow compartment:
These compartments ranging from 2-8, are those in which the major treatment on the
wastewater takes place.
Anaerobic filter:
As wastewater flows through the filter, particles are trapped and organic matter is
degraded by the active biomass that is attached to the surface of the filter material. It is
operated in up-flow mode because there is less risk that the fixed biomass will be washed
out and solids are easily deposited at the bottom resulting in an effluent with less
suspended solids.

16
Principle of operation
Pipes or baffles direct the wastewater from one compartment to another. The wastewater
passes through a layer of settled sludge and provides intensive contact between organic
pollutants and active biomass. Anaerobic digestion that takes place in an ABR consists of
different groups of organisms. The four main steps that usually determine the organisms’
reaction in an anaerobic process are: hydrolysis, acidogenesis, acetogenesis, and
methanogenesis. (Tayler, 2018)
Although the anaerobic process is efficient in the removal of organic material and
suspended solids from low strength wastewater, the process has no effect on nitrogen
and phosphorus concentrations. In addition, pathogenic organisms within the wastewater
are only partially removed. Post-treatment is therefore needed in removing residual COD
and total suspended solids (TSS) as well as reducing concentrations of nutrients and
pathogens.
After an anaerobic pretreatment, most often an aerobic post treatment is needed to meet
effluent standards. This is where a tertiary treatment system that can efficiently polish the
water such as a constructed wetland can be used.
Design of Anaerobic Baffled Reactor
Design parameters for the ABR system.
Up-flow velocity: This is the velocity of a fluid in a specified direction across a given cross
sectional area. This is the area comprised of the base and the width of the ABR.
Hydraulic retention time: This is the resident time of wastewater in the entire system.
Compartment dimensions i.e. Length and depth of compartments: these are the
dimensions of the up-flow compartments.
Design procedure for an ABR system:
The design for our ABR is broken down into the following major steps;
o Settler compartment sizing; Dimension the tank and design based on the
recommended retention time.
o ABR up-flow compartment sizing; Dimension based on the required up-flow
velocity

17
These steps are later broken down into the following;
Determine the loading on the plant i.e. Key parameters to be considered include
BOD, COD and TSS.
Determine the peak flow rate.
𝑞 = 𝑄
𝑡
where; q- Peak flow rate
Q- Total flow rate
Determine the ABR compartment width.
𝑤 =𝑞
𝐿 𝑣
where; L- Baffled reactor compartment length.
𝑣- Peak up-flow velocity.
Determine the retention time.
𝜃 = 24 𝑁𝑐𝑁𝑠𝑉
𝑄
where; Ns- Number of treatment streams
Nc- Number of up-flow compartments in series

18
Table 4: ABR dimension and parameter computation
Parameter Symbol Standards Value Unit
Peak daily flow rate Qp - 1.056 m3/d
Time of flow Tp - 12 h/d
Mean COD Influent Concentration COD - 1980 mg/l
Mean TSS Influent Concentration TSS - 956 mg/l
Depth of ABR reactor Zc 1.8-2.5 1.5 m
Hydraulic retention time q 48-72 48 h
Maximum up-flow velocity n 1 0.25 m/h
Number of compartments N(c) 4-8 3
Organic loading rate l 6 kg/m3d
UP-FLOW COMPARTMENTS
Design parameters
Peak flow 0.2 m3/d
ABR Compartment Width W 1.3 m
Length of compartment L
0.8 m
Number of treatment streams Ns 0.4
Volume of single compartment V(p)
3.4 m3
Retention time q
36.0 h
Organic Loading Rate l 1.3
SETTLER TANK
Units
Recommended Detention Time 28.7 hrs
Corrected Detention Time (Sludge Zone) 43.0 h
Depth 1.5 m
Width 1.3 m
Length 2.7 m
Length to width ratio 2.1
19
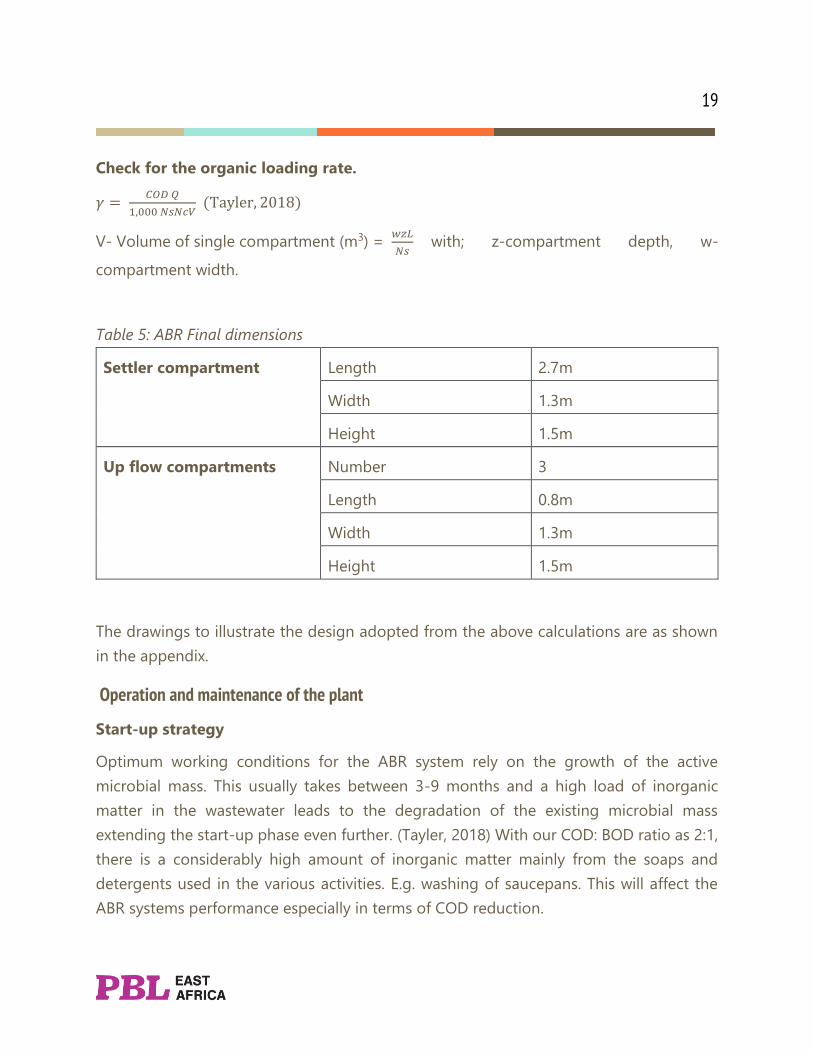
Check for the organic loading rate.
𝛾 = 𝐶𝑂𝐷 𝑄
1,000 𝑁𝑠𝑁𝑐𝑉 (Tayler, 2018)
V- Volume of single compartment (m3) = 𝑤𝑧𝐿
𝑁𝑠 with; z-compartment depth, w-
compartment width.
Table 5: ABR Final dimensions
Settler compartment Length 2.7m
Width 1.3m
Height 1.5m
Up flow compartments Number 3
Length 0.8m
Width 1.3m
Height 1.5m
The drawings to illustrate the design adopted from the above calculations are as shown
in the appendix.
Operation and maintenance of the plant
Start-up strategy
Optimum working conditions for the ABR system rely on the growth of the active
microbial mass. This usually takes between 3-9 months and a high load of inorganic
matter in the wastewater leads to the degradation of the existing microbial mass
extending the start-up phase even further. (Tayler, 2018) With our COD: BOD ratio as 2:1,
there is a considerably high amount of inorganic matter mainly from the soaps and
detergents used in the various activities. E.g. washing of saucepans. This will affect the
ABR systems performance especially in terms of COD reduction.
20
Recommended start up methods for the ABR system after construction dictate the need
to start with comparatively high detention times of about 80 hours and reduce over a 30-
day period towards the normal operating conditions of about 48 hours detention time.
(Stuckey, 2010)
The maximum initial organic loading is 2kg-COD m3/d, and this cannot be exceeded
during the start-up phase.
Vents will have to be constructed to safely release the methane produced during the
anaerobic process in the compartments.
Maintenance:
Access points in the form of manhole covers will have to be created at the top of the
compartments to aid in maintenance works mainly desludging and carry out sampling.
Secondary System: Constructed Wetland
Literature Review
The secondary treatment system consists of a constructed wetland which is a shallow
basin filled with some sort of filter material (substrate), usually sand or gravel, and planted
with vegetation tolerant of saturated conditions. (HABITAT, 2008)
The term constructed wetlands generally denotes all wastewater treatment facilities in
which natural plants have a specific role. The name "constructed wetland for wastewater
treatment" is in fact translation of the German term Pflanzenkläranlage, as these plants
were initially conceived in Germany. In English speaking countries the term "constructed
wetlands" (or treatment wetlands) is most often used.
Constructed wetlands are most often used as the second wastewater purification stage,
i.e. in most cases, before actually reaching the constructed wetland body, the wastewater
is subjected to preliminary and/or primary treatment. Various biological and physical
processes such as adsorption, filtration, precipitation, nitrification, decomposition, etc.
take place during operation of the constructed wetland. Many types of constructed
wetlands can be used for treatment of various types of wastewater. They can thus be used
for many purposes including:
21
o Treatment or purification of municipal wastewater
o Treatment or purification of wastewater generated by individual households
o Subsequent (tertiary) treatment of waste water purified at conventional water
treatment plants
o Treatment of some technological wastewater including seepage water from waste
disposal sites
o Wastewater from oil refineries, or wastewater generated during agricultural
production.
o Evacuation and mineralization of sludge separated from the waste water
purification process
o Treatment and temporary retention of rain water.
Configuration of the wetland:
Constructed wetlands have various design configurations and they are as follows;
o Life form of the dominating macrophytes (free-floating, emergent, submerged),
o Flow pattern in the wetland systems (free water surface flow; subsurface flow:
horizontal and vertical),
o Type of configurations of the wetland cells (hybrid systems, one-stage, multi-
stage systems),
o Type of wastewater to be treated,
o Treatment level of wastewater (primary, secondary or tertiary),
o Type of pre-treatment,
o Influent and effluent structures,
o Type of substrate (gravel, soil, sand, etc.), and
o Type of loading (continuous or intermittent loading). (HABITAT, 2008)
Nevertheless, the flow pattern has been generally accepted as the basic criterion.
According to this criterion, constructed wetlands are classified into two basic types:
o Free water surface (FWS) constructed wetlands.
o Subsurface flow (SF) constructed wetlands.
Subsurface flow treatment wetlands are subdivided into Horizontal Flow (HF) and Vertical
Flow (VF) wetlands depending on the direction of water flow.

22
Classification according to direction of flow:
Horizontal Flow (HF):
It is called HF wetland because the wastewater is fed in at the inlet and flow slowly through
the porous substrate under the surface of the bed in a more or less horizontal path until
it reaches the outlet zone. Due to the limited oxygen transfer inside the wetland, the
removal of nutrients (especially nitrogen) is limited, however, HF wetlands remove the
nitrates in the wastewater. (HABITAT, 2008)
Figure 2: Illustration of a horizontal flow constructed wetland
(Source UN HABITAT)
Vertical Flow:
VF constructed wetland comprises a flat bed of sand/gravel topped with sand/gravel and
vegetation. Wastewater is fed from the top and then gradually percolates down through
the bed and is collected by a drainage network at the base. (HABITAT, 2008)

23
Figure 3: Illustration of a vertical flow constructed wetland
(Source UN HABTAT)
Components of Treatment Wetlands
Plant Vegetation:
Different plants are planted in the different sections of the wetland. Presence of
macrophytes is one of the important features of a subsurface constructed wetlands. The
plants transport oxygen to the root zone to allow the roots to survive in anaerobic
conditions. The roots maintain the hydraulic conductivity of the substrate (sand, gravel,
pumice, HDPE).
Role of plants in the treatment process:
The macrophytes have several properties in relation to the treatment process as well as
aesthetic qualities that make them an essential component of the design. The plants used
in subsurface flow constructed wetlands specifically designed for grey wastewater
treatment should:
o Be able to tolerate high organic and nutrient loadings.
o Have rich below ground organs (roots and rhizomes) in order to provide
substrate for attached bacteria and oxygenation.
o Be tolerant of saturated conditions.

24
Role of Plant tissue in water:
o Filtering effect
o Reduced risk of re-suspension
o Increased rate of sedimentation
o Uptake of nutrients
o Increased aerobic degradation
o Surface for periphyton attachment

25
The most recommended plants to be used in subsurface flow constructed wetlands are
emerged plants like cattail and common reed as well as robust plants like umbrella sedge,
cyperus haspens, and broad leaved cattail. Some species of grass which are native to the
tropical grasslands like elephant grass are also used. Decorative plants can also be used
like bamboo plants, Heliconia, Canna lily, Calla lily, rhoeo strike me pink and papyrus
sedges.
Figure 4: Other plants and characteristics
Pollutant and Pathogen Removal Processes in Treatment Wetlands:
Treatment wetlands are complex wastewater treatment systems possessing a diverse set
of pollutant and pathogen removal pathways. Unlike other conventional wastewater
treatment systems in which removal processes are optimized by a series of separate unit
operations designed for a specific purpose, multiple removal pathways simultaneously
take place in one or two reactors (Dotro, et al., 2017).
The major pollutants in wastewater include organic matter both particulate and soluble,
which is measured by both Chemical Oxygen Demand and Biochemical Oxygen Demand.
Nitrogen, phosphorous and pathogens are other forms of pollutants in the wastewater.
The pollutant removal pathways include the following;
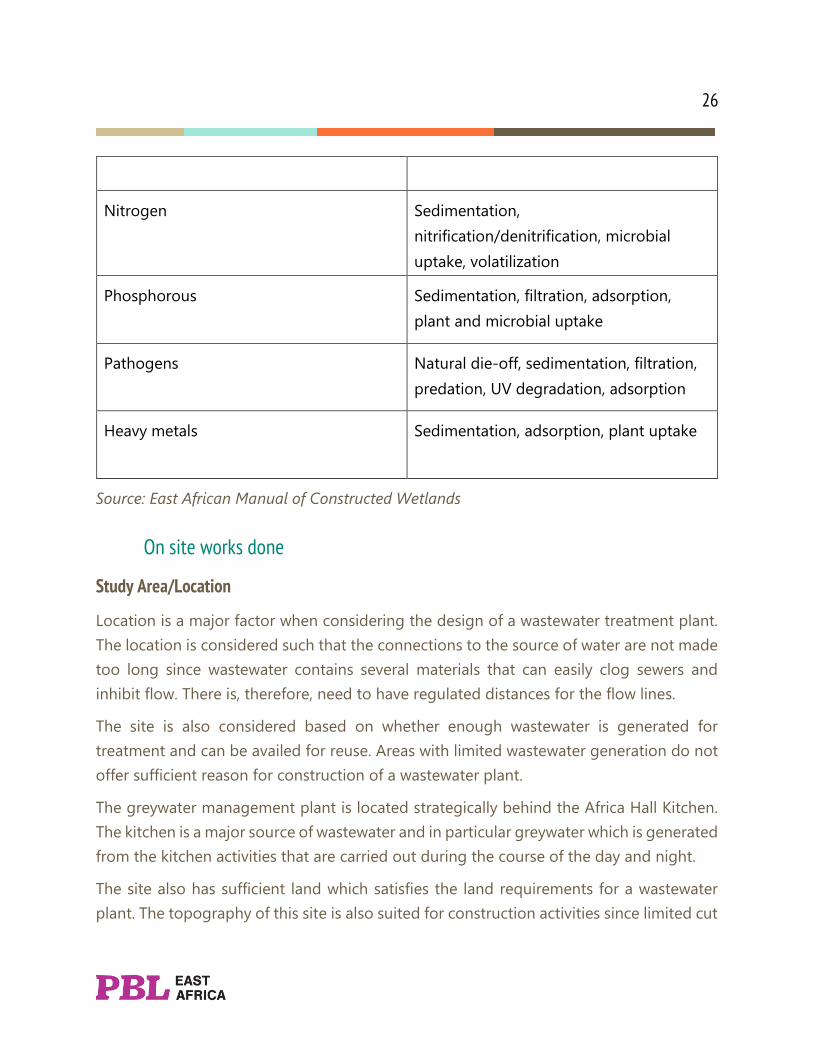
Table 6: Pollutant removal mechanisms
Pollutant Removal Processes
Organic material (measured as BOD)
Biological degradation, sedimentation,
microbial uptake
Organic contaminants (e.g., pesticides)
Adsorption, volatilization, photolysis, and
biotic/abiotic degradation
Suspended solids Sedimentation, filtration
26
Nitrogen
Sedimentation,
nitrification/denitrification, microbial
uptake, volatilization
Phosphorous
Sedimentation, filtration, adsorption,
plant and microbial uptake
Pathogens
Natural die-off, sedimentation, filtration,
predation, UV degradation, adsorption
Heavy metals
Sedimentation, adsorption, plant uptake
Source: East African Manual of Constructed Wetlands
On site works done
Study Area/Location
Location is a major factor when considering the design of a wastewater treatment plant.
The location is considered such that the connections to the source of water are not made
too long since wastewater contains several materials that can easily clog sewers and
inhibit flow. There is, therefore, need to have regulated distances for the flow lines.
The site is also considered based on whether enough wastewater is generated for
treatment and can be availed for reuse. Areas with limited wastewater generation do not
offer sufficient reason for construction of a wastewater plant.
The greywater management plant is located strategically behind the Africa Hall Kitchen.
The kitchen is a major source of wastewater and in particular greywater which is generated
from the kitchen activities that are carried out during the course of the day and night.
The site also has sufficient land which satisfies the land requirements for a wastewater
plant. The topography of this site is also suited for construction activities since limited cut
27
and fill activities were required for the construction process. The topography map is
attached in the appendix.
Flow and Flow Variations
Determination of greywater generation and the flow rate is the first requirement in the
design of greywater collection, treatment, and reuse system. Reliable data on existing and
projected flow rate must be available for the cost-effective greywater treatment system
design.
There are various methods which can be used in the determination of the flow values and
these include;
Direct Methods:
These involve actual measurement of the wastewater generated at the site and involve
the use of the bucket method and water meter method.
The bucket method involves use of a container of known volume to estimate flows for a
designated period at an outlet point of a greywater generation area.
The water meter method involves the use of a meter connected to the pipe where
wastewater flows that measures wastewater generated for a period of time.
Indirect Methods:
These involve the use of empirical relations to generate the flow values of wastewater.
The methods include use of water consumption values and the type of uses.
Water Consumption method: From the available water consumption data at a site, the
grey wastewater is assumed to be 50-60% of the total water consumption.
Type of uses method: From literature and previous studies per capita greywater
generation for a given activity is identified and used to estimate the greywater generated
from the site.
Selection of Method:
The bucket method was used to estimate wastewater flow values. This was chosen since
the outlet point of the site was easily accessible and measurements could be carried out
here. The method also allows easy observation of flow variation during different time
28
intervals of the day which is an important consideration in design of a greywater
management system.
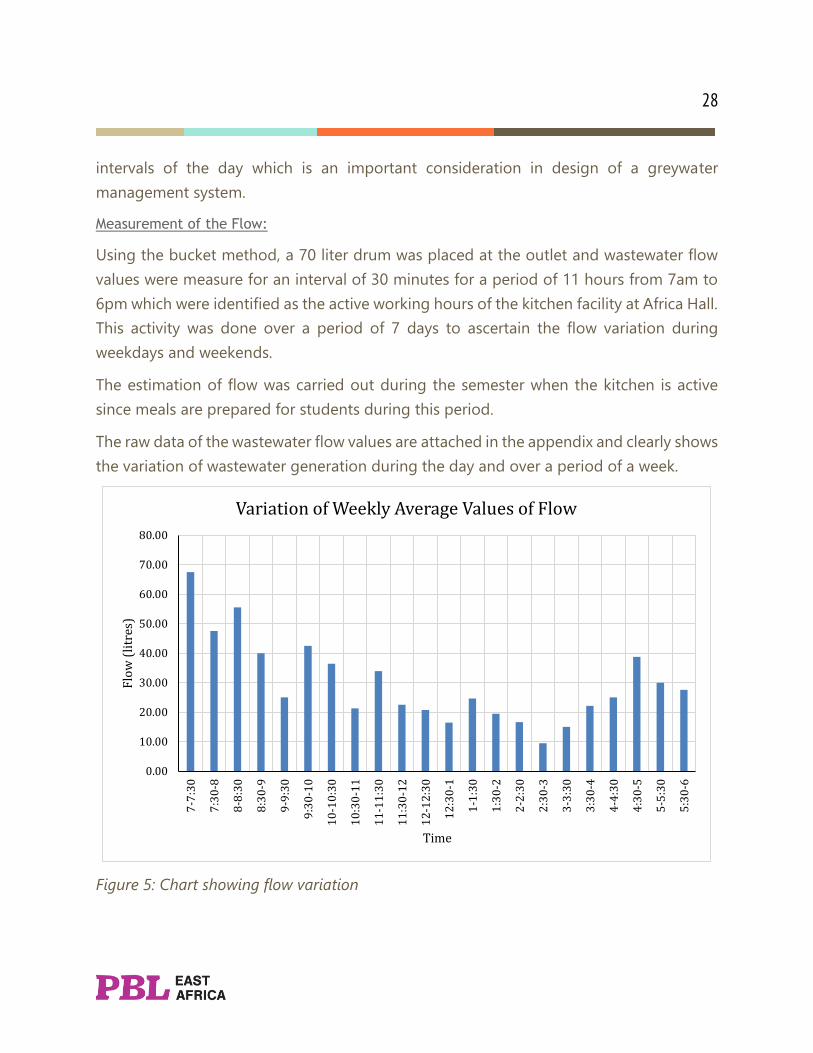
Measurement of the Flow:
Using the bucket method, a 70 liter drum was placed at the outlet and wastewater flow
values were measure for an interval of 30 minutes for a period of 11 hours from 7am to
6pm which were identified as the active working hours of the kitchen facility at Africa Hall.
This activity was done over a period of 7 days to ascertain the flow variation during
weekdays and weekends.
The estimation of flow was carried out during the semester when the kitchen is active
since meals are prepared for students during this period.
The raw data of the wastewater flow values are attached in the appendix and clearly shows
the variation of wastewater generation during the day and over a period of a week.
Figure 5: Chart showing flow variation
0.00
10.00
20.00
30.00
40.00
50.00
60.00
70.00
80.00
7-7
:30
7:3
0-8
8-8
:30
8:3
0-9
9-9
:30
9:3
0-1
0
10
-10
:30
10
:30
-11
11
-11
:30
11
:30
-12
12
-12
:30
12
:30
-1
1-1
:30
1:3
0-2
2-2
:30
2:3
0-3
3-3
:30
3:3
0-4
4-4
:30
4:3
0-5
5-5
:30
5:3
0-6
Flo
w (
litr
es)
Time
Variation of Weekly Average Values of Flow

29
Computation of Flow rate at kitchen:
From the appended values of flow, the maximum value recorded within the 30 minute
intervals was 140 litres. The maximum daily average recorded for the 30 minute intervals
was 44 litres.
Considering a day of 12 active hours within which the kitchen users generate wastewater
fron the various activities carried out. Using the average value recorded within the 30
minute intervals of 44 litres in every 30 minutes.
This results into 88 litres generated per hour of the day form the kitchen- (44*60
minutes)/30minutes = 88 litres
For the active day of work at the kitchen; 12 hours*88litres/hour = 1056 liters/day of 12
hours.
This is equivalent to 1.056m3/day of wastewater generated from the kitchen.
Therefore, discharge Q =1.056m3/day.
Wastewater Quality Characterization:
Greywater characterization is a requirement for the proper design of a wastewater
treatment system. The chemical and microbial quality of greywater depends on the source
of the greywater.
A typical qualitative composition of greywater is shown below indicating the various
sources of grey wastewater;
Table 7: Qualitative Greywater composition
Wate
r
So
urc
e
Bact
eri
a
Ch
lori
ne
Fo
am
Fo
od
Part
icle
s
Nit
rate
Oil a
nd
Gre
ase
Org
an
ic
matt
er
So
ap
s
Su
spen
de
d S
olid
s
Tu
rbid
ity
Cloth
washing
* * * * * *
Bathing * * * * *
Kitchen * * * * * * *

30
Source: (Institute, 2007)
The characterization of the wastewater from Africa Hall kitchen was done in consideration
of the following parameters and the following results obtained;
Table 8: Greywater Characterization for kitchen effluent
Parameter Unit Result
Biochemical Oxygen
Demand
mg/l 881
Chemical Oxygen Demand mg/l 1980
pH - 6.76
Conductivity μS/cm 1167
Turbidity FAU 485
Total Suspended Solids mg/l 956
Total Dissolved Solids mg/l 1834
Total Phosphorous mg/l 8.664
Total Nitrogen (Nitrate) mg/l 25.5
Why an ABR was needed?
The wastewater characteristics we obtained from Africa Hall Cafeteria wastewater showed
need for a pretreatment system that could be able to significantly reduce the BOD
concentration, and not a simple pre-treatment system.
It is at this point that with advice from our mentors, we came to a consensus that an
Anaerobic Baffled Reactor was the right system that could achieve this.
This led to an increase in the costs as a new unplanned system was introduced.
Selection of Parameters:
31
The parameters that were selected for evaluation were based on the reuse purpose, others
as fundamental parameters for characterizing wastewater. The parameters were also
selected to evaluate and choose the most appropriate pre-treatment system.
-pH: This is the measure of how acidic or basic (alkaline) the water and is important
since it affects the survival of certain organisms which are vital for the treatment
process of wastewater.
-Biochemical Oxygen Demand: This is the measure of the presence of organics in
wastewater. It is an important parameter in determining whether the wastewater is
safe for discharge in the environment.
-Total Nitrate and Phosphorous: The two parameters indicate the nutrient levels in the
wastewater which depend on the source of greywater.
Design Approaches of Constructed wetlands:
The constructed wetland size can be estimated basing on different approaches which
include;
-Rule of thumb
-Regression Equations
-Plug flow k-C*
-Loading charts
-P-k-C*
The above methods are all applicable to horizontal flow sub-surface wetlands and take
into consideration various aspects which include hydraulic loading rate, non-ideal flow,
background concentration and pollutant weathering.
32
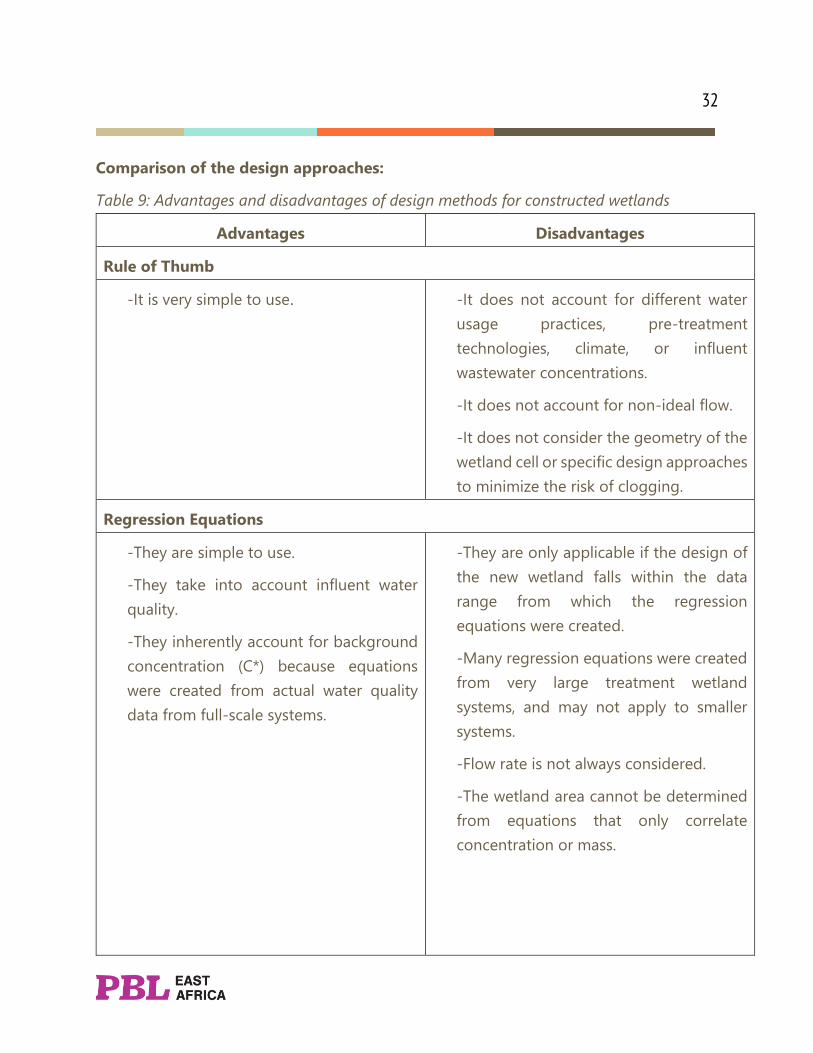
Comparison of the design approaches:
Table 9: Advantages and disadvantages of design methods for constructed wetlands
Advantages Disadvantages
Rule of Thumb
-It is very simple to use. -It does not account for different water
usage practices, pre-treatment
technologies, climate, or influent
wastewater concentrations.
-It does not account for non-ideal flow.
-It does not consider the geometry of the
wetland cell or specific design approaches
to minimize the risk of clogging.
Regression Equations
-They are simple to use.
-They take into account influent water
quality.
-They inherently account for background
concentration (C*) because equations
were created from actual water quality
data from full-scale systems.
-They are only applicable if the design of
the new wetland falls within the data
range from which the regression
equations were created.
-Many regression equations were created
from very large treatment wetland
systems, and may not apply to smaller
systems.
-Flow rate is not always considered.
-The wetland area cannot be determined
from equations that only correlate
concentration or mass.
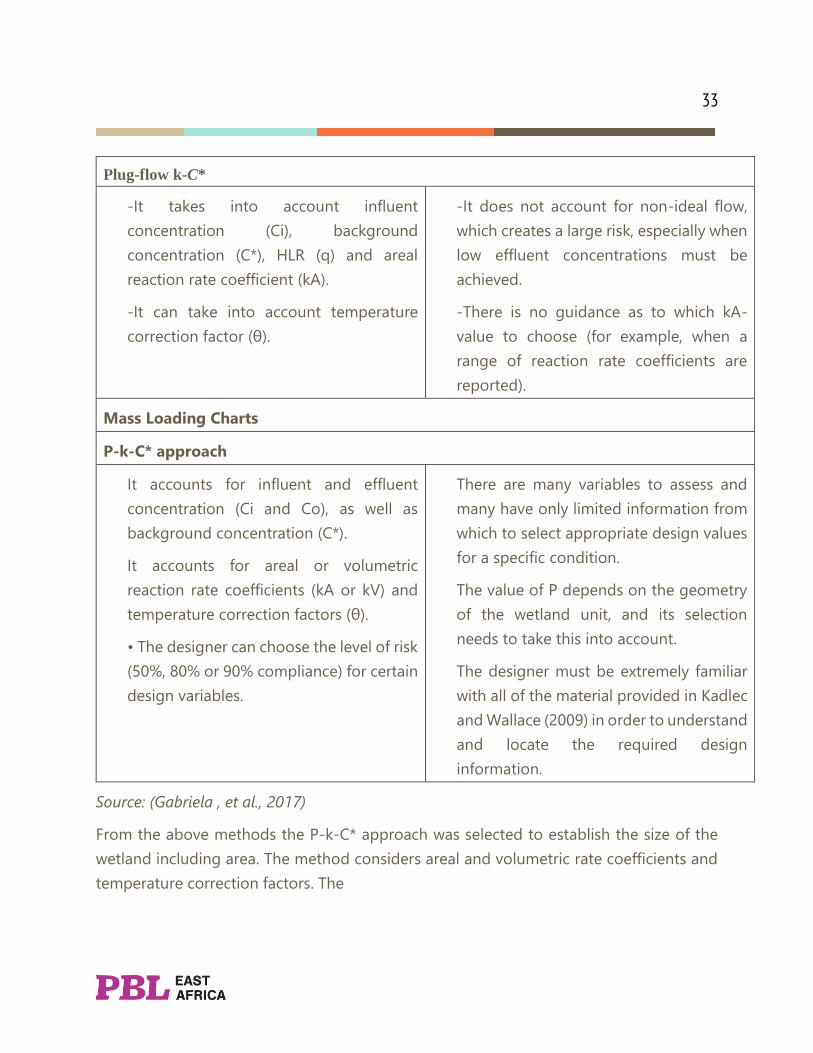
33
Plug-flow k-C*
-It takes into account influent
concentration (Ci), background
concentration (C*), HLR (q) and areal
reaction rate coefficient (kA).
-It can take into account temperature
correction factor (θ).
-It does not account for non-ideal flow,
which creates a large risk, especially when
low effluent concentrations must be
achieved.
-There is no guidance as to which kA-
value to choose (for example, when a
range of reaction rate coefficients are
reported).
Mass Loading Charts
P-k-C* approach
It accounts for influent and effluent
concentration (Ci and Co), as well as
background concentration (C*).
It accounts for areal or volumetric
reaction rate coefficients (kA or kV) and
temperature correction factors (θ).
• The designer can choose the level of risk
(50%, 80% or 90% compliance) for certain
design variables.
There are many variables to assess and
many have only limited information from
which to select appropriate design values
for a specific condition.
The value of P depends on the geometry
of the wetland unit, and its selection
needs to take this into account.
The designer must be extremely familiar
with all of the material provided in Kadlec
and Wallace (2009) in order to understand
and locate the required design
information.
Source: (Gabriela , et al., 2017)
From the above methods the P-k-C* approach was selected to establish the size of the
wetland including area. The method considers areal and volumetric rate coefficients and
temperature correction factors. The
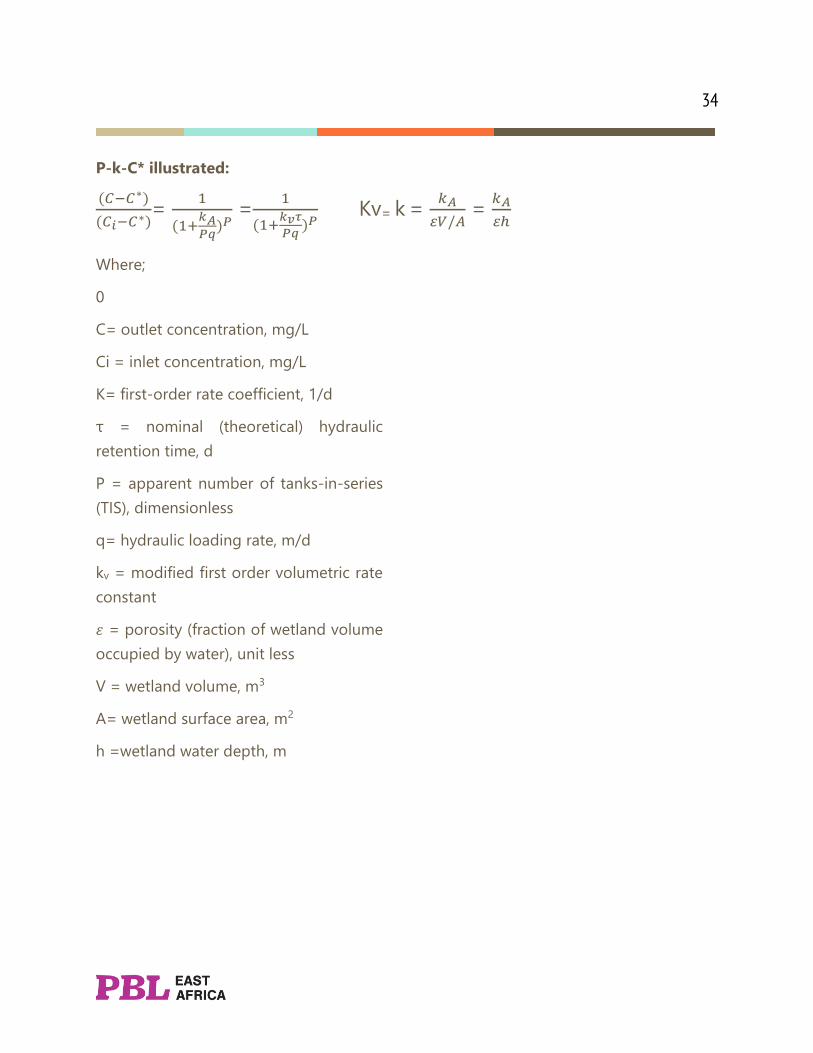
34
P-k-C* illustrated:
(𝐶−𝐶∗)
(𝐶𝑖−𝐶∗)=
1
(1+𝑘𝐴𝑃𝑞
)𝑃 =
1
(1+𝑘𝑣𝜏
𝑃𝑞)𝑃
Kv= k = 𝑘𝐴
𝜀𝑉/𝐴 =
𝑘𝐴
𝜀ℎ
Where;
0
C= outlet concentration, mg/L
Ci = inlet concentration, mg/L
K= first-order rate coefficient, 1/d
τ = nominal (theoretical) hydraulic
retention time, d
P = apparent number of tanks-in-series
(TIS), dimensionless
q= hydraulic loading rate, m/d
kv = modified first order volumetric rate
constant
𝜀 = porosity (fraction of wetland volume
occupied by water), unit less
V = wetland volume, m3
A= wetland surface area, m2
h =wetland water depth, m
35
Design Consideration:
-Influent and outlet concentrations: The target influent and effluent concentrations of
the wastewater are considered and can be expresses using the various parameters
BOD, TSS, COD TN and TP.
-Flow rates (Q): This is the value of the wastewater considered for the design of the
wetland.
-The Hydrologic budget: Consideration for precipitation (P) events,
evapotranspiration (ET) -which affect the flow rates considered for design of the
wetland.
-Hydraulic Residence Time(HRT): The HRT is defined as the time a molecule of water
stays in the wetland on average, from entrance to exit, and is typically calculated as
the water volume in the reactor divided by the flow rate. (Gabriela , et al., 2017)
-Porosity: This is considered basing on the substrate material to be used in the
wetland.
Design Procedure for Constructed Wetland
This is a design procedure that follows the P-K-C* approach according to Kadlec &
Wallace (2009).
Procedure:
The procedure illustrated is for a design considering the pollutant concentration for
Biochemical Oxygen Demand (BOD).
1.Setting influent flow and concentrations:
Considering a 50% reduction in BOD in the primary treatment system, the influent
concentration into the wetland is 441mg/l
The flow considered is 88 litres per hour (2.93x10⁻⁴m3/s)
2.Setting target effluent concentrations
Derived from the Guidelines and Standards for Wastewater Reuse, an effluent BOD
level of 30mg/l is appropriate for effluent to be used in back yard irrigation and toilet
flushing.

36
-Selecting k- rates for targeted parameters
-Appropriate trend multiplier (1 + ѱ) according to the regulatory compliance interval in
which case it is the re-use standards
C= Ctrend (1+ ѱ): Ctrend is the mean value of the desired effluent= 1.5 for an average
effluent of 14mg/l; where C is the influent concentration.
Selection of P value (Apparent number of Tanks in Series)
It is important to consider variability in nature of flow through the wetland therefore
the wetland is considered as a series of tanks.
P=3 for BOD in a horizontal sub-surface flow wetland.
3.Selection of C* values for BOD loading:
The background concentration (C*) is an irreducible effluent concentration that results
from internal biogeochemical cycling within wetlands. (Gabriela , et al., 2017)
(Kadlec & Wallace, 2009) suggest computing background concentration from the
equation below for a given BOD concentration.
C* = 0.6 + 0.4(Ci) 0.55
4. Estimation of wetland area:
The area is obtained from the p-k-C* equation earlier stated and afterwards the mass
loading checked against the loading charts if appropriate and adjustments to the k
values can be considered until an appropriate area is obtained. The area chosen was
based on the parameter that gives the largest area. The Biochemical Oxygen Demand
gives the largest area requirement.

37
Figure 6: Summary of design procedure for constructed
Source Kadlec &Wallace (2009)
Table 10: Parameters and Dimensions of constructed wetland:
Input Parameters Value Output Parameters Value
Inlet Pollutant Ci (mg/l) 441
Outlet Pollutant
Concentration
(mg/l) 18.46897
Apparent TIS rate constant k (m/yr) 377.1
Hydraulic Retention
Time (days) 2.88
Apparent number of TIS for pollutant
reduction(P) 3 Volume 20

38
Porosity
0.35(Gravel)
0.25(Pumice)
0.95(Plastic)
Effluent Mass
Loading gBOD/d 53.19064
Depth h 0.5
Area (m2)
18(Gravel)
16(Pumice)
10(Plastic)
Background Concentration C* (mg/l) 28
Flow Rate (m3/d) 1.056
Areal Rate Coefficient (ka) m/yr 66
Considering the largest area generated from the substrate of the lowest porosity as
the overall wetland area. The overall area is then divided into compartments for the
different substrate. The goal is to assess the variation in performance of the different
substrate placed in a wetland basin.
Substrate Configuration:
The wetland consists of pumice, plastic (waste bottle caps) and gravel. They are
arranged in the following ways to enable experimentation of the various materials in
terms of treatment efficiency.
Poin
t of
wate
r d
istr
ibu
tion
Pumice
Sam
pli
ng
poin
t
Pumice
Sam
pli
ng
poin
t
Pumice
Bottle caps
Sam
pli
ng
poin
t
Gravel
Sam
pli
ng
poin
t
Gravel
Gravel
Sam
pli
ng
poin
t
Gravel
Sam
pli
ng
poin
t
Gravel
- Direction of water flow

39
Figure 7: Substrate configuration
Plant Configuration:
The presence of plants is one of the important features in subsurface flow constructed
wetlands. They have several properties in relation to the treatment process as well as
the aesthetic qualities that make them an essential component of the design.
Po
int
of
wate
r d
istr
ibu
tio
n
Horse tail reed
Sam
plin
g
po
int
Horse tail reed
Sam
plin
g
po
int
Horse tail reed
Horse tail reed
Sam
plin
g
po
int
Horse tail reed
Sam
plin
g
po
int
Horse tail reed
Horse tail reed
Sam
plin
g
po
int
Horse tail reed
Sam
plin
g
po
int
Horse tail reed
- Direction of water flow
Figure 8: Plant configuration
The selected plant was horsetail reed. It is an ever green plant that looks like a mini
bamboo. Grows in sandy or gravel areas and can withstand water logged areas. A new
seedling takes 20-45 days to grow and it grows up to 0.91m tall. It has a dense fibrous
root system that is about 2m deep.
Operation and Maintenance
40
The wetland vegetation should be monitored to ensure that unwanted plant species
(weeds) do not overtake the intended plant community (Gabriela , et al., 2017). This is
achieved through removing the weeds.
Other major maintenance operations include;
-Adjustment of water levels
-Maintenance of flow uniformity (inlet and outlet structures)
-Management of vegetation
-Odor control.
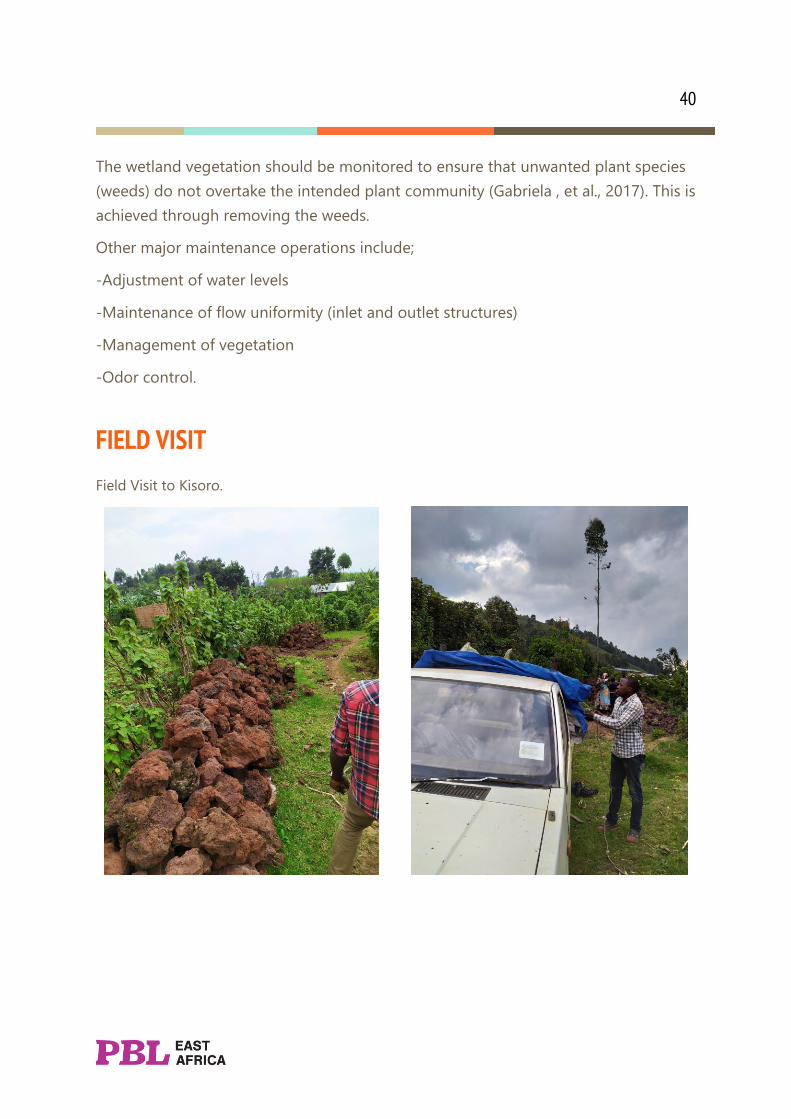
FIELD VISIT
Field Visit to Kisoro.

41
Team Communication
Figure 9 - Makerere PBL Teams having a video call with the Aalto University Team

42
Internship activities
Setting Out
This is the transferring of points from paper (drawings) to ground through use of
measuring techniques. It is done to enable realization of construction works according
to the drawings.
Materials and Tools used:
Pegs: These are important in marking the positions identified during the setting
out process.
Tape measure: This is helpful in measuring the required dimensions based on the
drawings.
Mallet: This is used in entering the pegs into the ground during the setting out
process.
Rope: This is used during setting out to demarcate straight edges.
Square: This tool is used for marking the right angle during the setting out
procedure.
Procedure:
The setting out process was done using the square method where a builder’s square
is used to mark out the straight edges from corners. On the site, the setting out was
done to guide the excavation works. The areas for construction of the anaerobic
baffled reactor and constructed wetland were set out based on the drawings.
The reference point for the anaerobic baffled reactor (ABR) was the Africa Hall
kitchen wall. At equal distances of 2m points were marked on the ground and this
line was taken as the edge of the ABR. The constructed wetland reference line was
considered as the slab of the gas cage and its edge was marked in reference to the
line of this slab.
The points were marked using pegs and placed at distances indicated on the
drawings to mark the first corners of the units to be constructed and a rope
connected to these pegs.
43
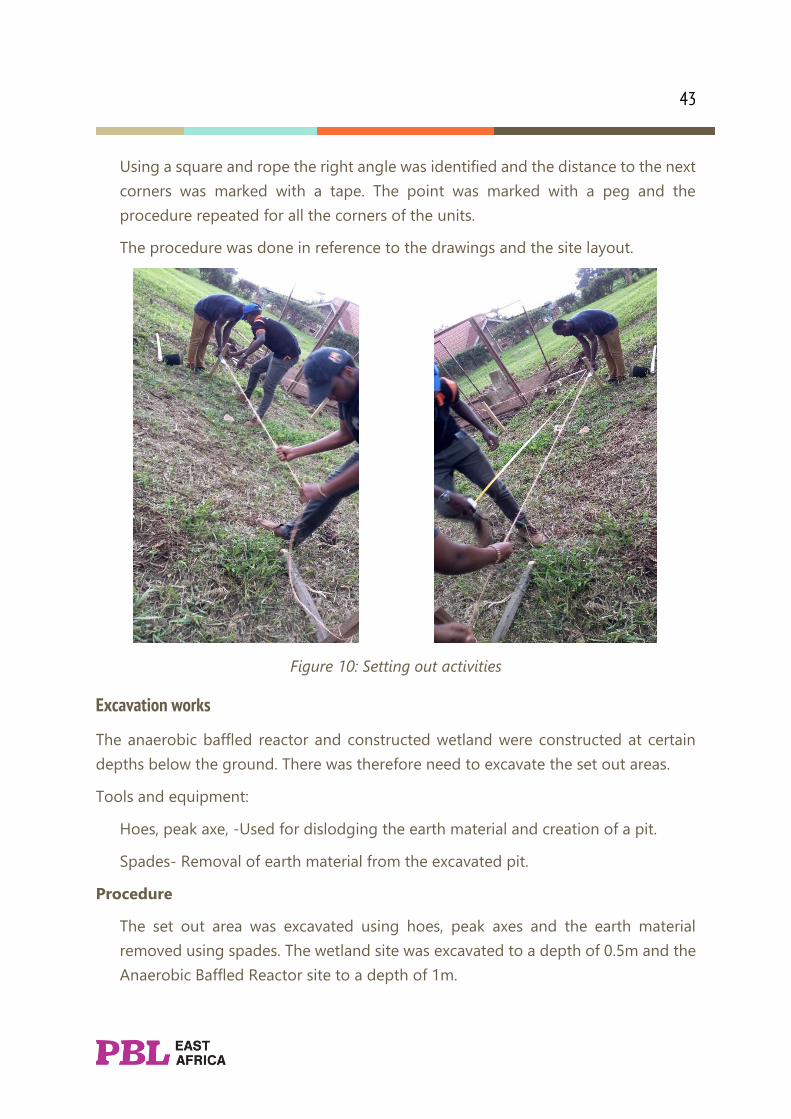
Using a square and rope the right angle was identified and the distance to the next
corners was marked with a tape. The point was marked with a peg and the
procedure repeated for all the corners of the units.
The procedure was done in reference to the drawings and the site layout.
Figure 10: Setting out activities
Excavation works
The anaerobic baffled reactor and constructed wetland were constructed at certain
depths below the ground. There was therefore need to excavate the set out areas.
Tools and equipment:
Hoes, peak axe, -Used for dislodging the earth material and creation of a pit.
Spades- Removal of earth material from the excavated pit.
Procedure
The set out area was excavated using hoes, peak axes and the earth material
removed using spades. The wetland site was excavated to a depth of 0.5m and the
Anaerobic Baffled Reactor site to a depth of 1m.

44
The earth was removed and heaped on the edges and left to be used for backfill
purposes
The excavated base was levelled and the level was checked using a water level to
ensure that the base was evenly levelled.
Figure 11: Excavation of site
Casting of concrete Blinding
A concrete mix of 1:2:4 (cement, sand, aggregate) was cast for the concrete blinding
in both the excavated pits of the constructed wetland and the ABR. The concrete was
laid to a depth of 100mm in the ABR pit and 50mm in the constructed wetland pit.
Tools and materials
Wheel barrow- Wheel barrow was used to move materials like cement from the store
to the point where mixing of concrete would take place. It was also used to transport
sand from the point where it was stacked to the point where mixing would take place.
The wheel barrow was also used to transport concrete from the mixing point to the
point where concrete would be cast.
Mortar Pan- This was used to hold mortar and use where the wheelbarrow would not
be used comfortably especially while working in the pit.
Pegs or Marker-These were used as gauges to indicate the required elevation of the
concrete. A marker would be used to indicate gauge on the formwork while a nail
would be nailed into the formwork to also indicate a gauge.
Hose pipe- This was used for spraying water for curing onto the surface of concrete.
45
Straight edge- This was used to level the concrete surface after casting by moving it
along the surface and ensuring no aggregates are exposed while leaving a smooth
finish.
The materials included;
Cement- This was used as binder to bond the aggregates together. The cement which
was used was kept in the store in-order to protect it from adverse weather conditions
like rain that reduces the quality of the cement through un-wanted hydration reactions.
Fine aggregate- The fine aggregates where used as a filler to cement and lake sand
was used for most cases.
Coarse aggregate- This was used in the concrete and aggregates of 0.5 inch were
selected.
Procedure:
Fresh concrete was prepared from the mixing point on the site, transported to the
point of placing (the excavated pits of the ABR and the constructed wetland).
In the pit a mesh and Damp proof material were placed across the entire area prior
to casting the concrete. Pegs were driven into the ground at different points to
help in monitoring the concrete gauge.
Using pegs driven into the ground at different point in the excavated pit to a
required depth of the concrete to be cast, the concrete was placed to achieve the
required gauge.
The concrete was spread evenly until the required gauge was achieved and using
a straight edge the concrete was levelled.
The concrete was left to set and cured using water from a hose pipe before the
construction activities proceeded.

46
Figure 12: Casting of blinding concrete
Brick work of compartment walls
The brick work was done to create the up flow compartments in the ABR and the cells
in the constructed wetland. A mortar mix of 1:4 (cement, sand) was used for both the
brick joints and the finishes.
Tools and materials
Wheel barrow- Wheel barrow was used to move materials like cement from
the store to the point where mixing of mortar would take place. It was also
used to transport sand from the point where it was stacked to the point
where mixing would take place. The wheel barrow was also used to transport
mortar to the point where brick work would be taking place.
Spade- It was used to load the wheelbarrow with fine aggregates and it was
also used mix and mingle the mortar several times before and after water
was added.

47
Mortar Pan- This was used to hold mortar and use where the wheelbarrow
would not be used comfortably.
Trowel- A trowel was used to create apply mortar into the joints and also to
apply mortar beds for the bricks. The trowel would also be used to create
even surfaces of the mortar joints and mortar beds.
Plumb bob- A plumb bob is an instrument that is used to check the
verticality of any structure. In this case the plumb bob was used to check the
verticality of walls and bricks relative to other set bricks.
Spirit Level- A spirit level was used in checking the elevations of the block’s
top surface also to transfer level from one brick to another.
Water level- Water level was an instrument used to transfer elevations of the
bricks from one brick to another.
Tape measure- This was used to make measurements of the positions of the
bricks during the construction of the wall compartments.
String-This was used to check for linearity of the wall itself and its relative
alignment with other walls.
Procedure:
First the mortar was mixed manually by loading the sand onto the wheelbarrow
and transferred to the mixing area to form a heap. The mixing area was a
concrete platform to prevent the mortar from being contaminated with soil.
Water would then be added to the mix by carefully making a depression within
the cement sand heap. Mixing of the mortar would then continue until the
mortar becomes homogeneous and attains a uniform colour.
The mixed mortar would then be loaded onto the wheelbarrow and transferred
to where the brick work was to be done.
The walls from at the very bottom were set first. The setting involved using a
string placed against a reference point to adjust the initial bricks of the wall.
Before setting the initial brick, some water is added to the surface of the
blinding and this is done to ensure that the surface does not absorb water from
the mortar which would cause it to crack.

48
After setting out the initial bricks, and a string is maintained in position, the
subsequent bricks would be laid following the string to check for linearity of
each and every brick. This was done until all the first course is done.
The subsequent courses would then be laid but every other brick on the second
and subsequent courses would be checked for verticality using a plumb bob.
To ensure a uniform elevation throughout the full length of the wall, a brick at
one end of the course is made the reference point and is used to transfer levels
to the brick on the other end of the wall. In case the levels would not be the
same, mortar adjustments would be done to ensure uniform elevations of the
wall.
In case of a T-junction of the brick work. A builders’ square would be used to
make sure the walls are at right angles as indicated on the plan.
The walls of the ABR were raised to a height of 1.3m while those of the constructed
wetland to a height of 0.8m. The process for both units involved fitting of 4inch pipes
at different sections as openings for fittings which were placed later on.

49
Figure 13: Brick wall construction
Plastering and Finishes
Plastering was done to create a layer of mortar around walls, which provides dampness
protection to the walls and also improves on aesthetics of the structure. Plastering was
done using cement and sand mortar with a ratio of 1:4. It is important to note that the
water cement ratio of mortar to be used for plastering was different and higher than
the water to cement ratio of mortar to be used in block work.
Sikalite a water-proofing admixture was used in the mortar mix for every bag of cement
used. The sikalite occupies the capillary spaces formed in the mortar mix and increases
the water-proofing properties of the mix to protect the walls of the structure from
moisture and prevent loss of water through seepage.
Tools and Materials:
Fine aggregate (sand) - The fine aggregates where used as a filler to cement so as
to create mortar.
Cement- This was used as binder to bond the fine aggregates and to improve the
adhesion of mortar on the walls and columns. The cement which was used was kept
in the store in-order to protect it from adverse weather conditions like rain that
reduces the quality of the cement through un-wanted hydration reactions.
Water- This was used to mix the mortar and also to wet the surface before the
initial bricks would be set out. The importance of water was to react with cement
and form a binding medium.

50
The tools included;
Wheel barrow. Wheel barrow was used to move materials like cement from the
store to the point where mixing of mortar would take place. It was also used to
transport sand from the point where it was stacked to the point where mixing
would take place. The wheel barrow was also used to transport mortar from the
point where mixing was done to the plastering area. It was used to load the
wheelbarrow with fine aggregates.
Mortar Pan- This was used to hold mortar where the wheelbarrow would not be
used comfortably.
Trowel. A trowel was used to apply mortar on to the surface of the wall.
Wooden float. This was used to fill the gaps left when the mortar is cut and to
generally apply a smooth finish.
Steel float. This was used to apply lime to the plastered surface and create a cement
screed finish.
Straight edge. It was used to level the plastered mortar to form even surfaces.
Procedure:
The mortar was mixed using the procedures discussed under brick work activities.
Mixing of mortar was done using manual means.
Setting up of gauges to indicate the exact thickness of mortar required on the wall.
This was done by applying mortar thickness to the wall. The required thickness was
then measured off from the wall and marked and the gauge was then transferred
to all the other points on the wall.
Application of cement sand mortar onto the wall followed after and it was done
using a trowel.
The mortar was levelled using an aluminum straight edge. This was then followed
by application of a wooden float.
A cement screed finish was applied to the plastered wall using a steel float. A steel
float helps to give a smooth finish.

51
Figure 14: Finishing works
Casting of the Anaerobic Baffled Reactor Slab
A concrete slab of thickness 150mm was placed above the walls of the ABR and it was
placed with voids to create space for access chambers. The reinforced concrete was
finished and left to set while curing it with water from a hose pipe to gain strength
enough for support of loads.
Formwork/shuttering
Formwork was installed to be able to contain fresh concrete until it acquires a set that
enables it to withstand loads. Formwork was done for the ABR slab. Wooden formwork
52
was applied since it is cost effective and the timber can be used for other applications
after it is removed.
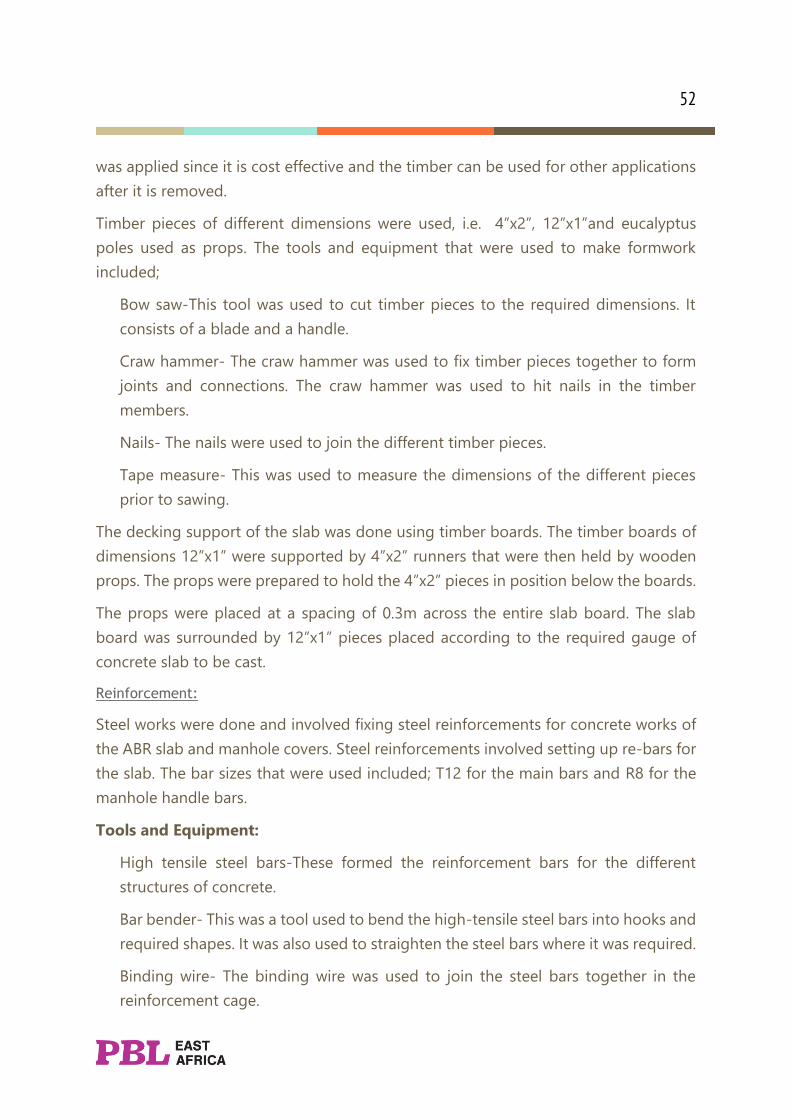
Timber pieces of different dimensions were used, i.e. 4”x2”, 12”x1”and eucalyptus
poles used as props. The tools and equipment that were used to make formwork
included;
Bow saw-This tool was used to cut timber pieces to the required dimensions. It
consists of a blade and a handle.
Craw hammer- The craw hammer was used to fix timber pieces together to form
joints and connections. The craw hammer was used to hit nails in the timber
members.
Nails- The nails were used to join the different timber pieces.
Tape measure- This was used to measure the dimensions of the different pieces
prior to sawing.
The decking support of the slab was done using timber boards. The timber boards of
dimensions 12”x1” were supported by 4”x2” runners that were then held by wooden
props. The props were prepared to hold the 4”x2” pieces in position below the boards.
The props were placed at a spacing of 0.3m across the entire slab board. The slab
board was surrounded by 12”x1” pieces placed according to the required gauge of
concrete slab to be cast.
Reinforcement:
Steel works were done and involved fixing steel reinforcements for concrete works of
the ABR slab and manhole covers. Steel reinforcements involved setting up re-bars for
the slab. The bar sizes that were used included; T12 for the main bars and R8 for the
manhole handle bars.
Tools and Equipment:
High tensile steel bars-These formed the reinforcement bars for the different
structures of concrete.
Bar bender- This was a tool used to bend the high-tensile steel bars into hooks and
required shapes. It was also used to straighten the steel bars where it was required.
Binding wire- The binding wire was used to join the steel bars together in the
reinforcement cage.

53
Axel saw- This was used to cut the steel reinforcement bars
Tape measure-This was used to measure off the required length of the bars and
the hooks.
Procedure:
The steel reinforcement bars were delivered to site in the folded form for ease
transportation. They were then straightened on site manually using a bar bender.
A tape measure was used to measure the required length of the steel bar and the
points to be cut were marked.
An axel saw was then used to cut the steel bars to the required length.
A bender was used to make the hooks and bends of the length specified to create
the anchors.
A damp proof material (DPM) was placed at the base of the formwork to seal the
gaps left within the slab formwork boards and prevent the water from the concrete
from seeping through. The DPM also protects the concrete from having direct
contact with the wooden formwork which does not leave a smooth finish after the
concrete has set.
The steel bars were then positioned within the formwork in either direction at the
spacing of 40mm as specified in the drawings.
Figure 15: Reinforcement cage on ABR slab

54
Concrete Casting:
The freshly mixed concrete was then loaded onto a wheel barrow which moved
it to the casting place for the slab.
A mortar pan was then be used to pour the concrete into the formwork and this
is done until the gauge mark was reached.
The concrete was spread evenly until the required gauge was achieved and
using a straight edge the concrete was levelled.
The concrete was left to set and cured using water from a hose pipe as the
construction activities proceeded.
After a period of 14 days, the formwork was stripped off from the concrete and
prepared for application of finishes. The slab was allocated enough time to set
and gain strength before being loaded.
Figure 16: Casting of ABR top slab
Filling of substrate
The substrate used in the constructed wetland was done in reference to the substrate
configuration illustrated in the constructed wetland design section. Gravel plastic in
the form of waste plastic bottle caps and pumice were placed in the compartments as
shown in the layout;

55
Substrate configuration
Po
int
of
wate
r d
istr
ibu
tio
n
Pumice
Sam
plin
g
po
int
Pumice
Sam
plin
g
po
int
Pumice
Bottle caps Sam
plin
g
po
int
Gravel
Sam
plin
g
po
int
Gravel
Gravel
Sam
plin
g
po
int
Gravel
Sam
plin
g
po
int
Gravel
- Direction of water flow
Substrate specifications:
The constructed wetland was filled with gravel of 0.5 inch diameter. The gravel was
cleaned using water to remove fines that increase solid particles in the wastewater
flowing through the wetland.
The pumice was packed in two forms i.e. randomly packed and linearly packed
(Straight rows of piled pumice rocks)
The anaerobic baffled reactor in the anaerobic filter chamber was filled with gravel
placed on a concrete support. The concrete support was perforated such that water
rises through the substrate (up flow mechanism).
56
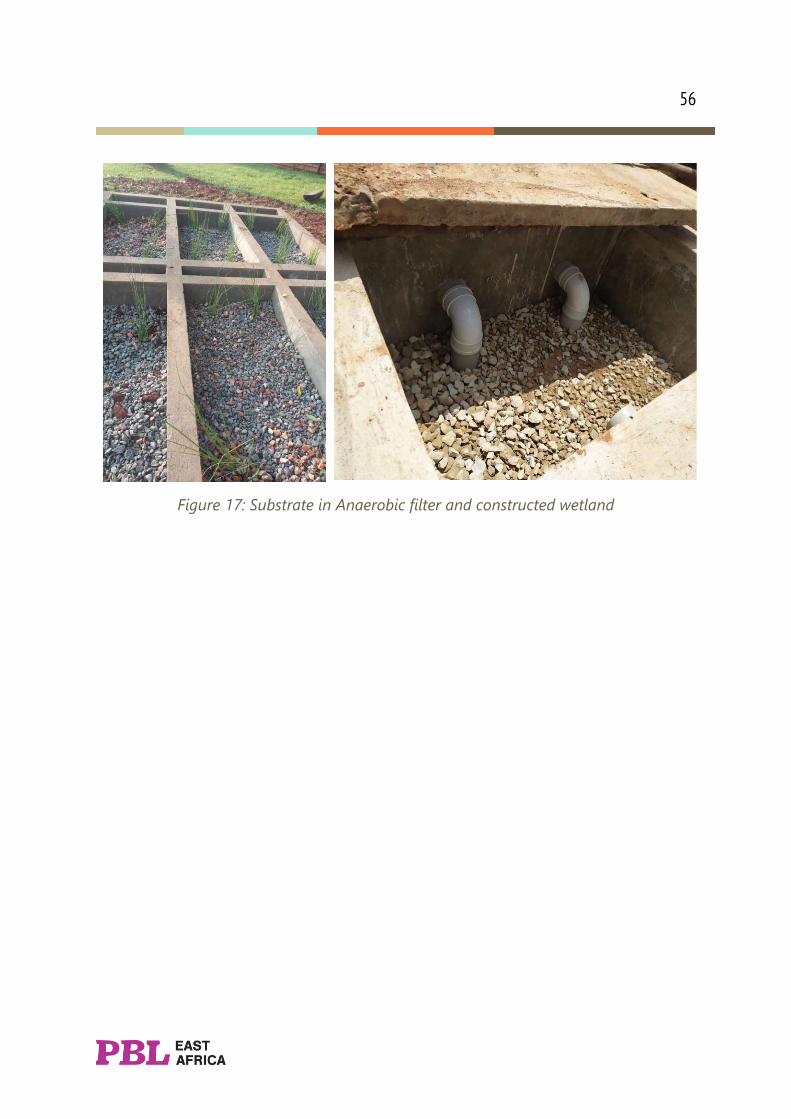
Figure 17: Substrate in Anaerobic filter and constructed wetland

57
RESULTS AND ACHIEVEMENTS.
Prizes:
WEGE PRIZE
The Wege Prize is an annual competition that ignites game-changing solutions to
problems. It focuses on challenging multidisciplinary groups of students to
redesign the way economies work through adopting circular economy principles.
Wet Technik participated in this competition and was able to reach the finals where
we emerged in third place.
CLIMATE LAUNCHPAD.
This is one of the largest green business idea competitions in the world that helps
identify and develop startups that look to have a positive climate impact.. We were

58
able to complete in 3rd place of the National Finals and we will compete at the Global
Finals in Amsterdam in November.
Established Networks and Partnerships: Partner Role
United Social Ventures
Wet Technik has been able to
successfully partner with United Social
Ventures a supporting agency for social
ventures creating a pipeline for youth-
led social start-ups in Uganda to
become more impactful, financially
sustainable, and scalable, through
different programs. Resilient Africa Network
This organisation enhances resilience-
related knowledge and shares it globally,
engaging students, faculty, staff, and
development experts from around the
world to collaborate on solving
resilience related problems.
Conclusion
The entire PBL experience has been one of the most exciting and educative processes
that we have gone through. We are truly grateful for the opportunity to interact with
mentors from all walks of life.
We have developed so many skills as a team and we have been able to appreciate
the importance of a multidisciplinary approach to problem solving.
59
References
[1] I. S. H. fbr, "Greywater Recycling: planning fundamentals and operation information,"
Association for Rainwater Harvesting and Water Utilisation, 2005.
[2] N. E. E. R. Institute, "Greywater Reuse In Rural Schools Wise Water Management
Guidance Manual," United Nations Children's Fund, Nagpur, 2007.
[3] K. Tayler, Faecal Sludge and Septage Treatment: A guide for low- and middle-income
countries, England: Practical Action Publishing Ltd, 2018.
[4] K. F. S. Pillay, "The Anaerobic Baffled Reactor: An appropriate technology for on-site
sanitation," Pollution Research Group, Centre for Water and Wastewater Research,
Durban, 2004.
[5] D. Stuckey, "Anaerobic Baffled Reactor (ABR) for Wastewater Treatment," Imperial
College London, London, 2010.
[6] U. HABITAT, Constructed Wetlands Manual, Kathmandu: UN-HABITAT Water for Asian
Cities Programme Nepal, 2008.
[7] G. Dotro, G. Langergraber, P. Molle, J. Nivala, J. Puigagut, O. Stein and M. Von Sperling,
Treatment Wetlands, Chennai: IWA Publishing, 2017.
[8] D. Gabriela , G. Langergraber, P. Molle, N. Jaime , J. Puigagut, . S. Otto and M. Von
Sperling, Treatment Wetlands, Chennai: IWA Publishing, 2017.
[9] R. H. Kadlec and S. D. Wallace, Treatment Wetlands, Boca Raton: CRC Press, 2009.

60
Annex
Appendix 1: Daily flow values from Africa kitchen
Time Flow Value (Ltrs)
DAY Monday Tuesday Wednesday Thursday Friday Saturday Sunday Average Max Total
7-7:30 52.5 70 70 140 70 70 0 67.50 140 473
7:30-8 52.5 35 70 70 70 35 0 47.50 70 333
8-8:30 52.5 70 35 65 52.5 105 8.75 55.54 105 389
8:30-9 52.5 70 35 52.5 17.5 52.5 0 40.00 70 280
9-9:30 52.5 17.5 17.5 52.5 17.5 17.5 0 25.00 52.5 175
9:30-10 52.5 35 35 70 35 17.5 52.5 42.50 70 298
10-10:30 35 70 17.5 52.5 10 17.5 52.5 36.43 70 255
10:30-11 35 17.5 17.5 52.5 17.5 8.75 0 21.25 52.5 149
11-11:30 35 70 35 52.5 10 17.5 17.5 33.93 70 238
11:30-12 17.5 17.5 35 35 35 17.5 0 22.50 35 158
12-12:30 17.5 35 17.5 17.5 5 17.5 35 20.71 35 145
12:30-1 17.5 17.5 17.5 10 17.5 17.5 17.5 16.43 17.5 115
1-1:30 35 15 35 0 52.5 17.5 17.5 24.64 52.5 173
1:30-2 8.75 87.5 0 17.5 5 17.5 0 19.46 87.5 136
2-2:30 8.75 20 0 0 17.5 52.5 17.5 16.61 52.5 116
2:30-3 17.5 17.5 5 0 17.5 8.75 0 9.46 17.5 66
3-3:30 0 35 35 35 0 0 0 15.00 35 105
3:30-4 35 60 0 60 0 0 0 22.14 60 155
4-4:30 17.5 52.5 17.5 52.5 17.5 0 17.5 25.00 52.5 175
4:30-5 140 35 35 35 17.5 8.75 0 38.75 140 271
5-5:30 17.5 70 35 70 17.5 0 0 30.00 70 210
5:30-6 17.5 17.5 52.75 17.5 35 17.5 35 27.54 52.75 193
Average 35.00 42.50 28.08 43.52 24.43 23.47 12.33 27.14
max 140 87.5 70 140 70 105 52.5 55.54
Total 770 935 617.75 957.5 537.5 516.25 271.25

Appendix 2: Drawings of constructed wetland and ABR