westwood business center - loopnet
TRANSCRIPT

WESTWOOD BUSINESS CENTER2222-2228 West Nor thern Avenue, Phoenix, AZ 85021
Offering Memorandum

NON-ENDORSEMENT & DISCLAIMER NOTICECONFIDENTIALITY & DISCLAIMERThe information contained in the following Marketing Brochure is proprietary and strictly confidential. It is intended to be reviewed only by
the party receiving it from Marcus & Millichap and should not be made available to any other person or entity without the written consent of
Marcus & Millichap. This Marketing Brochure has been prepared to provide summary, unverified information to prospective purchasers, and to
establish only a preliminary level of interest in the subject property. The information contained herein is not a substitute for a thorough due
diligence investigation. Marcus & Millichap has not made any investigation, and makes no warranty or representation, with respect to the
income or expenses for the subject property, the future projected financial performance of the property, the size and square footage of the
property and improvements, the presence or absence of contaminating substances, PCB’s or asbestos, the compliance with State and Federal
regulations, the physical condition of the improvements thereon, or the financial condition or business prospects of any tenant, or any tenant’s
plans or intentions to continue its occupancy of the subject property. The information contained in this Marketing Brochure has been obtained
from sources we believe to be reliable; however, Marcus & Millichap has not verified, and will not verify, any of the information contained
herein, nor has Marcus & Millichap conducted any investigation regarding these matters and makes no warranty or representation whatsoever
regarding the accuracy or completeness of the information provided. All potential buyers must take appropriate measures to verify all of the
information set forth herein. Marcus & Millichap is a service mark of Marcus & Millichap Real Estate Investment Services, Inc.
© 2017 Marcus & Millichap. All rights reserved.
NON-ENDORSEMENT NOTICEMarcus & Millichap is not affiliated with, sponsored by, or endorsed by any commercial tenant or lessee identified in this
marketing package. The presence of any corporation’s logo or name is not intended to indicate or imply affiliation with, or sponsorship or
endorsement by, said corporation of Marcus & Millichap, its affiliates or subsidiaries, or any agent, product, service, or commercial listing of
Marcus & Millichap, and is solely included for the purpose of providing tenant lessee
information about this listing to prospective customers.
ALL PROPERTY SHOWINGS ARE BY APPOINTMENT ONLY.
PLEASE CONSULT YOUR MARCUS & MILL ICHAP AGENT FOR MORE DETAILS.

WESTWOOD BUSINESS CENTER2 2 2 2 - 2 2 2 8 W E S T N O R T H E R N A V E N U E
P H O E N I X , A Z 8 5 0 2 1
EDWARD J. NELSONFirst Vice President Investments
Sacramento OfficeCell 916.425.9179
Office [email protected]
License CA 01452610
EXCLUSIVELY L ISTED BY
O F F I C E S N A T I O N W I D E A N D T H R O U G H O U T C A N A D A
WWW.MARCUSMILLICHAP.COM

BURGER KING
MC DONALD’S

01 23
07 33
15
EXECUTIVE SUMMARYSECTION 1 Investment Overview • Investment Highlights Summary of Terms
COMPETITIVE COMPARABLESSECTION 4 Sales Comparables • Lease Comparables
PROPERTY DESCRIPTIONSECTION 2 Property Details • Regional Map
MARKET OVERVIEWSECTION 5 Location Overview • Location Highlights Demographics
FINANCIAL ANALYSISSECTION 3 Pricing Details • Operating Data • Rent Roll
TABLE OF CONTENTS
EXCLUSIVELY LISTED BY:
WESTWOOD BUSINESS CENTERP H O E N I X , A R I Z O N A

This information has been secured from sources we believe to be reliable, but we make no representations or warranties, expressed or implied, as to the accuracy of the information. References to square footage or age are approximate. Buyer must verify the information and bears all risk for any inaccuracies. Any projections, opinions, as-sumptions or estimates used herein are for example purposes only and do not represent the current or future performance of the property. Marcus & Millichap Real Estate
Investment Services is a service mark of Marcus & Millichap Real Estate Investment Services, Inc. © 2017 Marcus & Millichap ACT ID Z0030279
$5,800,000OFFERING PRICE

1
WE
ST
WO
OD
B
US
IN
ES
S
CE
NT
ER
//
E
XE
CU
TI
VE
S
UM
MA
RY
EXECUTIVESUMMARY
WESTWOOD BUSINESS CENTER

WE
ST
WO
OD
B
US
IN
ES
S
CE
NT
ER
//
E
XE
CU
TI
VE
S
UM
MA
RY
2
OFFERING HIGHLIGHTS
2222-2228 West Northern Avenue, Phoenix, AZ 85021
OFFERING PRICE
$5,800,000
VITAL DATA
Price $5,800,000
Cap Rate - Current 6.01%
Cap Rate - Proforma 11.71%
Price/SF $63.45
Gross Square Feet 91,405 SF
Occupancy 71.65%
WESTWOOD BUSINESS CENTER
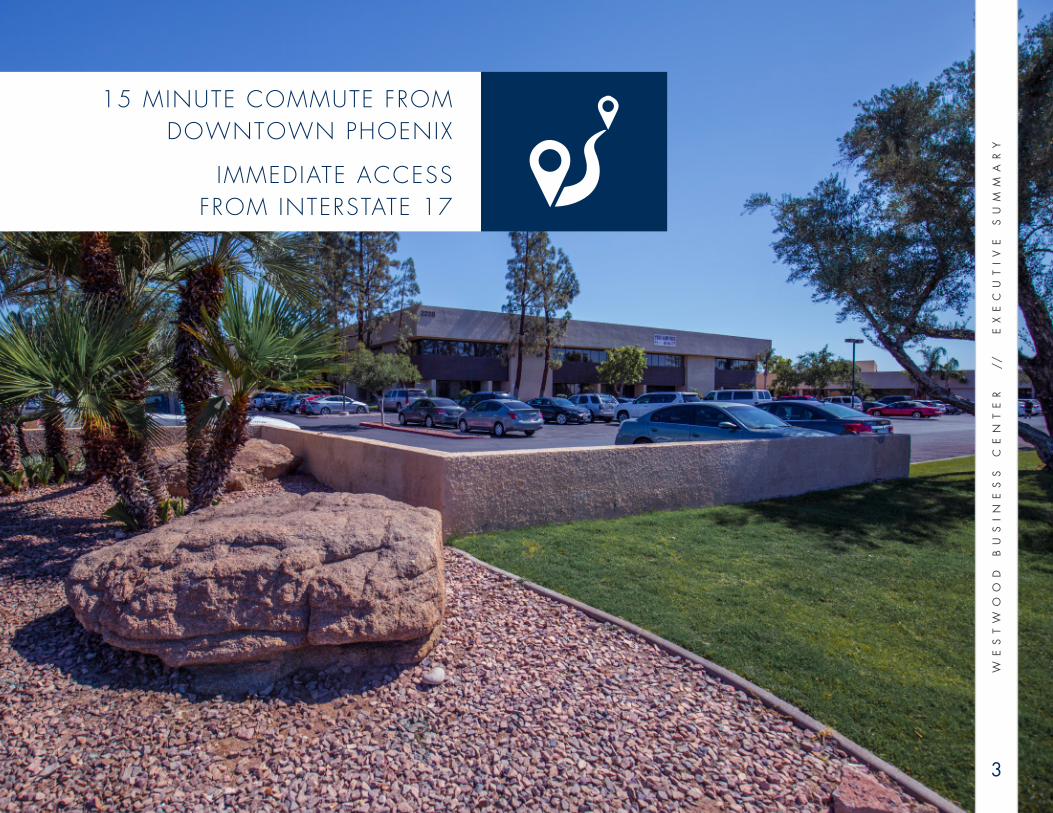
15 MINUTE COMMUTE FROM DOWNTOWN PHOENIX
IMMEDIATE ACCESS FROM INTERSTATE 17
WE
ST
WO
OD
B
US
IN
ES
S
CE
NT
ER
//
E
XE
CU
TI
VE
S
UM
MA
RY
3

WE
ST
WO
OD
B
US
IN
ES
S
CE
NT
ER
//
E
XE
CU
TI
VE
S
UM
MA
RY
4
INVESTMENT OVERVIEWThe offering consists of a 91,405-square foot professional office park referred to as Westwood Business Center located in Phoenix, Arizona. More specifically, the property is located in the Black Canyon Corridor of Phoenix at the signalized corner of West Northern Avenue and North 23rd Avenue, approximately 1/8 mile east of Interstate-17. Comprised of four separate buildings, Westwood Business Center, is situated on 5.40 acres of commercially zoned land (one parcel). Currently 71.65% occupied, the property offers substantial upside upon lease up.
Constructed in 1984, Westwood Business Center’s four buildings range from one to three stories with an attractive interior courtyard including a large koi pond. The property contains 37 total suites of which 15 are currently vacant. The vacant suites range from 570 to 7,265-square feet. The remaining 22 suites are occupied by a range of professional office tenants at market rents. The property offers an ample parking ratio of four spaces per 1,000-square feet (374 total spaces of which 137 are covered). The owner has kept the interior and exterior of the property in excellent condition with currently no deferred maintenance.
Westwood Business Center’s immediate Interstate-17 location (one of the valley’s two major corridors) enjoys traffic counts in excess of 228,000 vehicles per day. Tenants and visitors of Westwood enjoy a short 15 minute commute to Downtown Phoenix and a 15 minute commute to Phoenix Sky Harbor Airport. Furthermore, Interstate-17 links both Interstate-10 and the Loop 101 freeways, providing access to a large labor pool. The Black Canyon Corridor is home to major corporations including Hartford Insurance, Bank of America, Wells Fargo, American Express, Arizona Public Service, USAA, Farmers Insurance, Safeway, Cox Communications, Discover Card, Blue Cross Blue Shield, Pet Smart and Allstate Insurance. Conveniently adjacent to the subject property is a 2012 construction 51,000-square foot LA Fitness offering a wide range of exercise options to the tenants of the subject property.
Listed for $6,090,000 or $63.45-per square foot, Westwood Business Center is being offered well-below replacement cost. The offering allows an investor the opportunity to acquire a “turn key” professional office building well-located in Phoenix, Arizona with a significant amount of upside potential.

► Immediate Access From Interstate 17 (228,000 Vehicles per Day)
► Excellent Visibility Along Northern Avenue
► Well Below Replacement Cost ($63.45 Per Square Foot)
► Currently 71.65% Occupied (Upside In Lease Up)
► Within One Mile of Metrocenter Mall and Numerous
Surrounding Retail Centers
INVESTMENT HIGHLIGHTS

WE
ST
WO
OD
B
US
IN
ES
S
CE
NT
ER
//
E
XE
CU
TI
VE
S
UM
MA
RY
6
SUMMARY OF TERMSINTEREST OFFEREDMarcus & Millichap has been selected to exclusively market for sale Westwood Business Center located in Phoenix, Arizona.
TERMS OF SALEWestwood Business Center is offered is offered at $5,800,000 based on a $63.45 Price Per Square Foot. The net operating income figures for the
Property assume a fiscal year starting 7/1/2018. Historical operating documentation, third party reports and Argus model can be found in the online
document data portal.
PROPERTY TOURSProspective purchasers are encouraged to visit the subject property prior to submitting offers. However, all property tours must be arranged with the
Marcus & Millichap listing agents. Please do not contact the tenants, on-site management or staff without prior approval.property tours must be arranged
with the Marcus & Millichap listing agents. At no time shall the tenants, on-site management or staff be contacted without prior approval.

DOWNTOWN PHOENIXNORTHERN GARDENS APARTMENTSROYAL PALM
CONDOMINIUMS
NORTHERN BUSINESS CENTER
PROPOSED APARTMENTS
PROPOSED APARTMENTS
7

This information has been secured from sources we believe to be reliable, but we make no representations or warranties, expressed or implied, as to the accuracy of the information. References to square footage or age are approximate. Buyer must verify the information and bears all risk for any inaccuracies. Any projections, opinions, as-sumptions or estimates used herein are for example purposes only and do not represent the current or future performance of the property. Marcus & Millichap Real Estate
Investment Services is a service mark of Marcus & Millichap Real Estate Investment Services, Inc. © 2017 Marcus & Millichap ACT ID Z0030279

9
WE
ST
WO
OD
B
US
IN
ES
S
CE
NT
ER
//
P
RO
PE
RT
Y
DE
SC
RI
PT
IO
N
PROPERTYDESCRIPTION
WESTWOOD BUSINESS CENTER
10
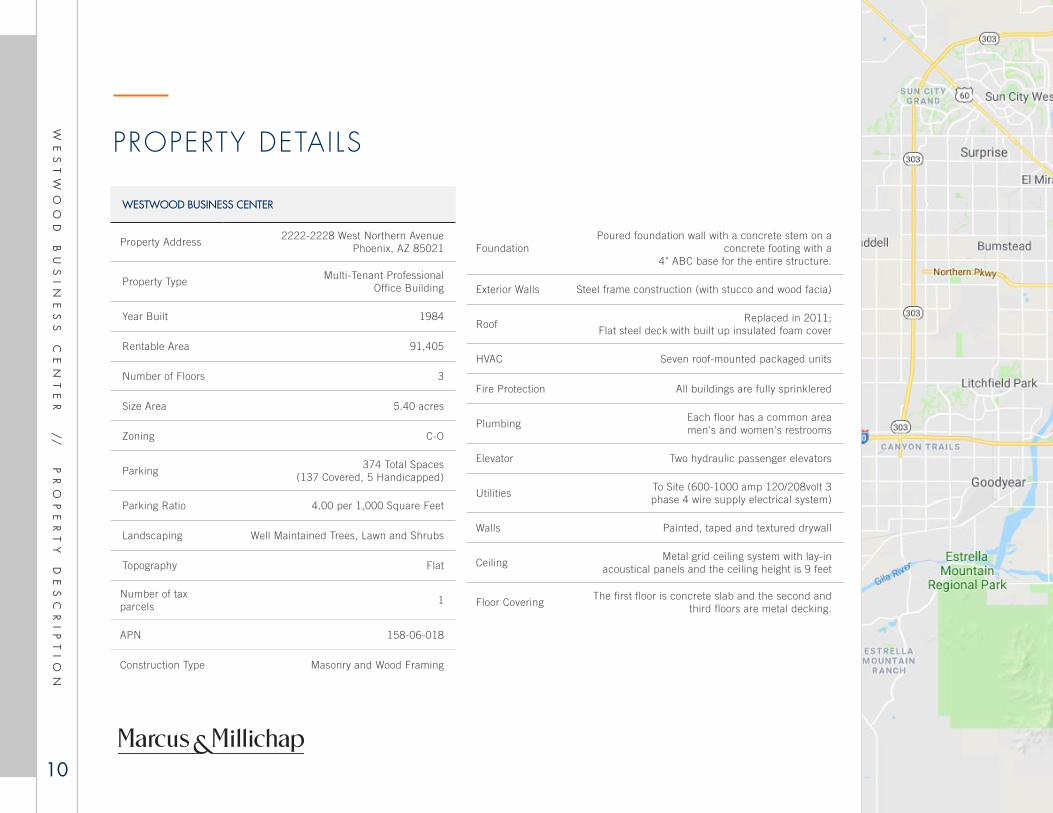
PROPERTY DETAILS
WESTWOOD BUSINESS CENTER
Property Address2222-2228 West Northern Avenue
Phoenix, AZ 85021
Property TypeMulti-Tenant Professional
Office Building
Year Built 1984
Rentable Area 91,405
Number of Floors 3
Size Area 5.40 acres
Zoning C-O
Parking374 Total Spaces
(137 Covered, 5 Handicapped)
Parking Ratio 4.00 per 1,000 Square Feet
Landscaping Well Maintained Trees, Lawn and Shrubs
Topography Flat
Number of tax parcels
1
APN 158-06-018
Construction Type Masonry and Wood Framing
FoundationPoured foundation wall with a concrete stem on a
concrete footing with a 4" ABC base for the entire structure.
Exterior Walls Steel frame construction (with stucco and wood facia)
RoofReplaced in 2011;
Flat steel deck with built up insulated foam cover
HVAC Seven roof-mounted packaged units
Fire Protection All buildings are fully sprinklered
PlumbingEach floor has a common area men's and women's restrooms
Elevator Two hydraulic passenger elevators
UtilitiesTo Site (600-1000 amp 120/208volt 3 phase 4 wire supply electrical system)
Walls Painted, taped and textured drywall
CeilingMetal grid ceiling system with lay-in
acoustical panels and the ceiling height is 9 feet
Floor CoveringThe first floor is concrete slab and the second and
third floors are metal decking.
WE
ST
WO
OD
B
US
IN
ES
S
CE
NT
ER
//
P
RO
PE
RT
Y
DE
SC
RI
PT
IO
N
10

WESTWOOD BUSINESS CENTER
WE
ST
WO
OD
B
US
IN
ES
S
CE
NT
ER
//
P
RO
PE
RT
Y
DE
SC
RI
PT
IO
N
11

This information has been secured from sources we believe to be reliable, but we make no representations or warranties, expressed or implied, as to the accuracy of the information. References to square footage or age are approximate. Buyer must verify the information and bears all risk for any inaccuracies. Any projections, opinions, as-sumptions or estimates used herein are for example purposes only and do not represent the current or future performance of the property. Marcus & Millichap Real Estate
Investment Services is a service mark of Marcus & Millichap Real Estate Investment Services, Inc. © 2017 Marcus & Millichap ACT ID Z0030279
6.01% 11.71%CAP RATE PROFORMA CAP RATE

13
WE
ST
WO
OD
B
US
IN
ES
S
CE
NT
ER
//
F
IN
AN
CI
AL
A
NA
LY
SI
S
FINANCIALANALYSIS
WESTWOOD BUSINESS CENTER
PR
OP
ER
TY
N
AM
E
HE
RE
//
F
IN
AN
CI
AL
A
NA
LY
SI
S
17
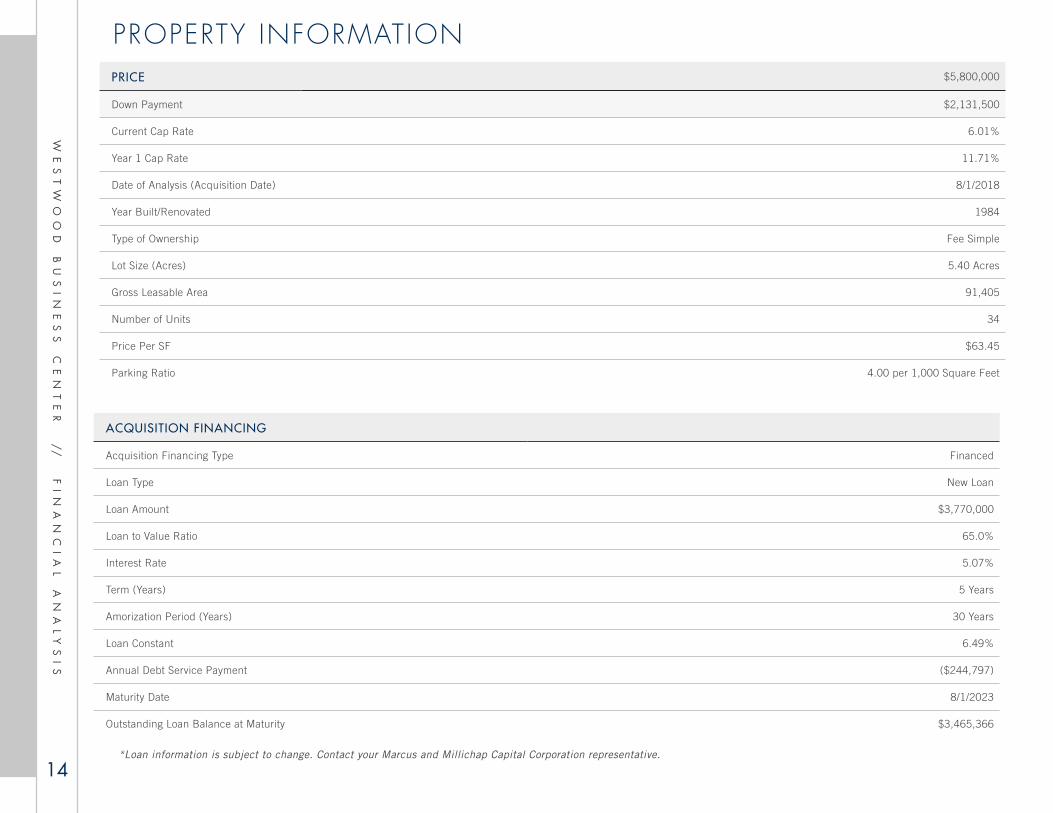
PROPERTY INFORMATION
*Loan information is subject to change. Contact your Marcus and Millichap Capital Corporation representative.
PRICE $5,800,000
Down Payment $2,131,500
Current Cap Rate 6.01%
Year 1 Cap Rate 11.71%
Date of Analysis (Acquisition Date) 8/1/2018
Year Built/Renovated 1984
Type of Ownership Fee Simple
Lot Size (Acres) 5.40 Acres
Gross Leasable Area 91,405
Number of Units 34
Price Per SF $63.45
Parking Ratio 4.00 per 1,000 Square Feet
ACQUISITION FINANCING
Acquisition Financing Type Financed
Loan Type New Loan
Loan Amount $3,770,000
Loan to Value Ratio 65.0%
Interest Rate 5.07%
Term (Years) 5 Years
Amorization Period (Years) 30 Years
Loan Constant 6.49%
Annual Debt Service Payment ($244,797)
Maturity Date 8/1/2023
Outstanding Loan Balance at Maturity $3,465,366
WE
ST
WO
OD
B
US
IN
ES
S
CE
NT
ER
//
F
IN
AN
CI
AL
A
NA
LY
SI
S
14

OPERATING DATA - INCOME
INCOME CURRENT PRO FORMA
Scheduled Base Rental Income $1,044,432 $1,407,228
Expense Reimbursement Income $41,734 $58,664
Total Other Income $18,540 $25,000
Potential Gross Revenue $1,104,706 $1,490,892
Less: General Vacancy $104,362
Effective Gross Income $1,104,706 $1,386,530
Less: Expenses ($756,234) ($707,225)
Net Operating Income $348,472 $679,305
Cash Flow $348,472 $679,305
Debt Service ($244,797) ($244,797)
Debt Service Coverage Ratio 1.42 2.77
Net Cash Flow After Debt Service $103,675 $434,508
Principal Reduction
Total Return $103,675 5.11% $434,508 21.40%
WE
ST
WO
OD
B
US
IN
ES
S
CE
NT
ER
//
F
IN
AN
CI
AL
A
NA
LY
SI
S
15

OPERATING DATA - EXPENSESOPERATING EXPENSES CURRENT PRO FORMA
Real Estate Taxes $113,231 $113,231
Insurance $14,021 $14,021
Utilities - Electric $236,358 $240,000
Utilities - Water $32,791 $33,000
Garbage $3,861 $3,861
Repairs & Maintenance $80,154 $50,000
Telephone / Internet CAM $5,199 $5,199
Security Service / Fire Control $49,272 $49,272
Cleaning Janitorial $83,614 $86,000
Management Fees $44,188 $55,462
Pest Control $3,617 $3,617
Landscaping $33,562 $33,562
HVAC $56,366 $20,000
Total Expenses $756,234 $707,225
Expenses Per SF
% of EGI 68.46% 51.01%
WESTWOOD BUSINESS CENTER
TENANT SUITE SF % OF TOTAL SF
LEASE COMMENCE LEASE EXPIRE MONTHLY
RENT RENT/ SF OPTIONS/TERMS
RESolutions Education Service Provider, Inc A110 6,098 6.67% 9/1/2011 6/30/2022 $8,131 $1.33
Fletcher Companies B101 3,997 4.37% 4/1/2018 3/31/2021 $3,997 $1.00
Aerobiology Lab Associates B110 1,833 2.00% 6/1/2013 7/31/2019 $2,520 $1.37
Allied International Credit Corp B202 4,258 4.66% 12/1/2007 8/31/2018 $6,564 $1.54
Mi Casa Su Casa, LLC B210 5,993 6.55% 1/1/2016 6/30/2021 $6,742 $1.12
Southwest Financial Planning Corporation, Inc. B214 1,495 1.64% 2/1/2009 2/28/2019 $1,869 $1.25
RENT ROLL
WE
ST
WO
OD
B
US
IN
ES
S
CE
NT
ER
//
F
IN
AN
CI
AL
A
NA
LY
SI
S
16

WESTWOOD BUSINESS CENTER
TENANT SUITE SF % OF TOTAL SF LEASE COMMENCE LEASE EXPIRE MONTHLY
RENT RENT/ SF OPTIONS/TERMS
RGIS, LLC C110 1,529 1.67% 7/1/2011 10/31/2019 $2,039 $1.35
Publishers Management Corporation C120 & C140 4,428 4.84% 9/1/2017 9/30/2020 $6,130 $1.37 1/3
Bud Industries, Inc. C130 1,630 1.78% 2/1/2010 1/31/2019 $2,173 $1.33
Tricia Hammond C201 1,370 1.50% 3/1/2016 5/31/2019 $1,713 $1.25
D&G Arizona Enterprises, Inc. C205 932 1.02% 9/1/2011 8/31/2019 $1,282 $1.38
U.S. Security Associates, Inc. C212 3,989 4.36% 2/1/2011 6/30/2019 $6,448 $1.62
Healthcare Collections-I, LLC. D100 7,634 8.35% 1/1/2014 5/31/2023 $8,906 $1.17 1/5
Paid in Full, Inc. D101 2,682 2.93% 2/1/2016 2/28/2019 $2,906 $1.08
Kaleidoscope Family Solutions, Inc D207 1,156 1.26% 1/1/2016 3/31/2019 $1,421 $1.23
Xcellent Accounting Options, LLC D208 891 0.97% 9/1/2017 11/30/2020 $1,040 $1.17 1/2
Care Givers of Arizona, Inc. D240 3,006 3.29% 8/1/2018 7/31/2022 $3,570 $1.19 2/3
Arizona Skin & Laser Institute, LTD. D300 12,570 13.75% 10/1/2007 5/31/2022 $19,585 $1.56
Vacant A100 7,265 7.95% $0.00
Vacant B100 1,152 1.26% $0.00
Vacant B102 3,010 3.29% $0.00
Vacant B120 923 1.01% $0.00
Vacant B212 570 0.62% $0.00
Vacant C100 2,304 2.52% $0.00
Vacant C200 1,856 2.03% $0.00
Vacant C203 1,276 1.40% $0.00
Vacant C208 1,254 1.37% $0.00
Vacant D209 1,698 1.86% $0.00
Vacant D250 767 0.84% $0.00
Vacant D260 770 0.84% $0.00
Vacant D265 738 0.81% $0.00
Vacant D270 1,413 1.55% $0.00
TOTAL AVAILABLE 25,914 28.35%
TOTAL OCCUPIED 65,491 71.65% $87,036
TOTAL 91,405 100% $87,036
RENT ROLL CONT'D
WE
ST
WO
OD
B
US
IN
ES
S
CE
NT
ER
//
F
IN
AN
CI
AL
A
NA
LY
SI
S
17

This information has been secured from sources we believe to be reliable, but we make no representations or warranties, expressed or implied, as to the accuracy of the information. References to square footage or age are approximate. Buyer must verify the information and bears all risk for any inaccuracies. Any projections, opinions, as-sumptions or estimates used herein are for example purposes only and do not represent the current or future performance of the property. Marcus & Millichap Real Estate
Investment Services is a service mark of Marcus & Millichap Real Estate Investment Services, Inc. © 2017 Marcus & Millichap ACT ID Z0030279
$63.45PRICE PER SQUARE FOOT

19
WE
ST
WO
OD
B
US
IN
ES
S
CE
NT
ER
//
C
OM
PA
RA
BL
E
PR
OP
ER
TI
ES
COMPARABLEPROPERTIES
WESTWOOD BUSINESS CENTER

PROPERTY NAME SALES DATE YEAR BUILT/RENOVATED PRICE RENTABLE
SFCAP RATE PARKING RATIO
Westwood Business Center 2222-2228 West Northern Ave, Phoenix, AZ 1984 $5,800,000 91,405 6.01% 4.0 per 1,000 SF
3333 E Camelback Road, Phoenix, AZ 12/19/2017 1984 $21,250,000 96,248 5.2 per 1,000 SF
2222 W Dunlap Avenue, Phoenix, AZ 1/1/2018 1998 $9,500,000 138,430 6.0 per 1,000 SF
1221-1313 E Osborn Road, Phoenix, AZ 3/29/2018 1987 $9,750,000 89,214 7.90% 3.5 per 1,000 SF
5150 N 16th Street, Phoenix, AZ 4/11/2018 1975 $6,000,000 53,417 4.0 per 1,000 SF
6245 N 24th Street, Phoenix, AZ 2/17/2017 1980 $7,075,000 44,174 6.50% 4.5 per 1,000 SF
SALES COMPARABLES – SUMMARY
WE
ST
WO
OD
B
US
IN
ES
S
CE
NT
ER
//
C
OM
PA
RA
BL
E
PR
OP
ER
TI
ES
20

4
5
1
2
3
WESTWOOD BUSINESS CENTER
WE
ST
WO
OD
B
US
IN
ES
S
CE
NT
ER
//
C
OM
PA
RA
BL
E
PR
OP
ER
TI
ES
21

3333 E CAMELBACK ROAD3333 E Camelback Road, Phoenix, AZ 85018
WESTWOOD BUSINESS CENTER2222-2228 West Northern Avenue, Phoenix, AZ 85021
1
SALES COMPARABLES
SALES PRICE $5,800,000
Price/Rentable SF $63.45
Rentable SF 91,405
Year Built/Renovated 1984
CAP Rate 6.01%
Occupancy 71.65%
SOLD PRICE $21,250,000
Price/Rentable SF $220.78
Rentable SF 96,248
Year Built/Renovated 1984
Occupancy 95.60%
COMMENTS
95.6% leased at time of sale.
WE
ST
WO
OD
B
US
IN
ES
S
CE
NT
ER
//
C
OM
PA
RA
BL
E
PR
OP
ER
TI
ES
22

THE ASHBY ON OSBORN1221-1313 E Osborn Road, Phoenix, AZ 85014
CONCORDE COMMERCE CENTER2222 W Dunlap Avenue, Phoenix, AZ 85021
32
SOLD PRICE $6,090,000
Price/Rentable SF $68.63
Rentable SF 138,430
Year Built/Renovated 1998
Occupancy 13%
SOLD PRICE $9,750,000
Price/Rentable SF $109.29
Rentable SF 89,214
Year Built/Renovated 1987
CAP Rate 7.90%
Occupancy 80%
COMMENTS
13% leased at time of sale.
COMMENTS
80% leased at time of sale.
WE
ST
WO
OD
B
US
IN
ES
S
CE
NT
ER
//
C
OM
PA
RA
BL
E
PR
OP
ER
TI
ES
23

BILTMORE 246245 N 24th Street, Phoenix, AZ 85016
WILLOWICK SQUARE5150 N 16th Street, Phoenix, AZ 85016
54
SOLD PRICE $6,000,000
Price/Rentable SF $112.32
Rentable SF 53,417
Year Built/Renovated 1975
Occupancy 74.70%
SOLD PRICE $7,075,000
Price/Rentable SF $160.16
Rentable SF 44,174
Year Built/Renovated 1980
CAP Rate 6.50%
Occupancy 64.10%
COMMENTS
74.7% leased at time of sale.
COMMENTS
64.1% leased at time of sale.
SALES COMPARABLES
WE
ST
WO
OD
B
US
IN
ES
S
CE
NT
ER
//
C
OM
PA
RA
BL
E
PR
OP
ER
TI
ES
24


PROPERTY NAME SQUAREFEET OCCUPANCY AVAILABLE
SF ASKING RENT LEASE TYPE
Westwood Business Center2222-2228 West Northern Avenue, Phoenix, AZ 85021 91,405 71.65% 25,914 Full Service
Northwest Business Center II 9201 N 25th Avenue, Phoenix, AZ 85021
57,058 33.20% 38,095 $1.63 Full Service
The Corporate Center 9630 N 25th Avenue, Phoenix, AZ 85021
116,813 51.50% 56,616 $1.67-$1.83 Full Service
Concorde Commerce Center 2222 W Dunlap Avenue, Phoenix, AZ 85021
138,430 12.20% 121,482 $2.00 Full Service
Crescent Corporate Center 2400 W Dunlap Avenue, Phoenix, AZ 85021
108,451 55% 58,143 $1.33-$1.38 Full Service
Park North 1717 W Northern Avenue, Phoenix, AZ 85021
62,938 35.40% 40,690 $1.25 Full Service
LEASE COMPARABLES – SUMMARY
WE
ST
WO
OD
B
US
IN
ES
S
CE
NT
ER
//
C
OM
PA
RA
BL
E
PR
OP
ER
TI
ES
26

PR
OP
ER
TY
N
AM
E
HE
RE
//
C
OM
PA
RA
BL
E
PR
OP
ER
TI
ES
4
5
3
1
2
WESTWOOD BUSINESS CENTER
WE
ST
WO
OD
B
US
IN
ES
S
CE
NT
ER
//
C
OM
PA
RA
BL
E
PR
OP
ER
TI
ES
27

NORTHWEST BUSINESS CENTER I I9201 N 25th Avenue, Phoneix, AZ 85021
WESTWOOD BUSINESS CENTER2222-2228 West Northern Avenue, Phoenix, AZ 85021
1
LEASE COMPARABLES
Rentable SF 91,405
Occupancy 71.65%
Year Built 1984
Available SF 25,914
Lease Type Full Service
Rentable SF 57,058
Occupancy 33.20%
Year Built 1983
Rent/SF $1.63
Available SF 38,095
Lease Type Full Service
WE
ST
WO
OD
B
US
IN
ES
S
CE
NT
ER
//
C
OM
PA
RA
BL
E
PR
OP
ER
TI
ES
28

CONCORDE COMMERCE CENTER2222 W Dunlap Avenue, Phoenix, AZ 85021
THE CORPORATE CENTER9630 N 25th Avenue, Phoenix, AZ 85021
32
Rentable SF 138,430
Occupancy 12.20%
Year Built 1998
Rent/SF $2.00
Available SF 121,482
Lease Type Full Service
Rentable SF 116,813
Occupancy 51.50%
Year Built 1982
Rent/SF $1.67 - $1.83
Available SF 56,616
Lease Type Full Service
WE
ST
WO
OD
B
US
IN
ES
S
CE
NT
ER
//
C
OM
PA
RA
BL
E
PR
OP
ER
TI
ES
29

PARK NORTH1717 W Northern Avenue, Phoenix, AZ 85021
CRESCENT CORPORATE CENTER2400 W Dunlap Avenue, Phoenix, AZ 85021
54
Rentable SF 62,938
Occupancy 35.40%
Year Built 1985
Rent/SF $1.25
Available SF 40,690
Lease Type Full Service
Rentable SF 108,451
Occupancy 55.00%
Year Built 1987
Rent/SF $1.33 - $1.38
Available SF 58,143
Lease Type Full Service
LEASE COMPARABLES
WE
ST
WO
OD
B
US
IN
ES
S
CE
NT
ER
//
C
OM
PA
RA
BL
E
PR
OP
ER
TI
ES
30


This information has been secured from sources we believe to be reliable, but we make no representations or warranties, expressed or implied, as to the accuracy of the information. References to square footage or age are approximate. Buyer must verify the information and bears all risk for any inaccuracies. Any projections, opinions, as-sumptions or estimates used herein are for example purposes only and do not represent the current or future performance of the property. Marcus & Millichap Real Estate
Investment Services is a service mark of Marcus & Millichap Real Estate Investment Services, Inc. © 2017 Marcus & Millichap ACT ID Z0030279
440,294TOTAL POPULATION WITHIN 5-MILE RADIUS

33
WE
ST
WO
OD
B
US
IN
ES
S
CE
NT
ER
//
M
AR
KE
T
OV
ER
VI
EW
MARKETOVERVIEW
WESTWOOD BUSINESS CENTER

LOCATION OVERVIEWThe Phoenix metro is often referred to as the Valley of the Sun and consists of Maricopa and
Pinal counties. The region is hemmed in by mountains to the north and east. American Indian
reservations to the east and south limit development in those directions, leaving the southeastern
corridor and western half of the metro as the primary growth areas. The most populous city is
Phoenix, which encompasses about 520 square miles, is the capital city and boasts a population
of nearly 1.6 million. Interstate 10 is a major trucking route directly connecting the region to
Southern California, which is supporting a growing distribution industry. Various rail and air lines
connect the metro to cities around the world.
Phoenix offers a lower cost of living than other metros its size, a moderate climate and a variety
of recreational and cultural options. In addition to outdoor activities, sports enthusiasts can enjoy
one of the most complete lineups of major-league teams found in any city, including teams in all
four major sports. The Cactus League holds spring training baseball throughout the Valley, and the
area has numerous golf courses and tennis courts. Phoenix is home to the world-famous Heard
Museum and Frank Lloyd Wright’s Taliesin West. Music venues include Phoenix Symphony Hall
and the Orpheum Theatre. Higher-education institutions include Arizona State University, Grand
Canyon University and community colleges.
WE
ST
WO
OD
B
US
IN
ES
S
CE
NT
ER
//
M
AR
KE
T
OV
ER
VI
EW
34

► Phoenix claims multiple Fortune 500 headquarters, including Freeport-
McMoRan, Republic Services, Insight Enterprises and Avnet.
► The construction, high-tech manufacturing, healthcare and tourism industries
dominate the Phoenix economy.
► Healthcare is a critical industry, with around 20 hospitals and the UA medical
school located in the metro. Also, the Mayo Clinic has added multiple facilities
located throughout the Valley
WESTWOOD BUSINESS CENTERP H O E N I X , A Z
LOCATION HIGHLIGHTS
WE
ST
WO
OD
B
US
IN
ES
S
CE
NT
ER
//
M
AR
KE
T
OV
ER
VI
EW
35

DEMOGRAPHICS HIGHLIGHTS
440,294
164,507 $60,114
TOTAL POPULATION WITHIN 5-MILES
TOTAL HOUSEHOLDS WITHIN 5-MILES
AVERAGE HOUSEHOLD INCOMEWITHIN 5-MILES
WE
ST
WO
OD
B
US
IN
ES
S
CE
NT
ER
//
M
AR
KE
T
OV
ER
VI
EW
36

UNIT TYPE 1 MILE 3 MILES 5 MILES
2022 ProjectionTotal Population
21,658 176,888 431,594
2017 EstimateTotal Population
21,754 180,223 440,294
2010 CensusTotal Population
20,288 167,258 407,963
2000 CensusTotal Population
20,811 172,734 428,986
Daytime Populations2017 Estimate
25,759 191,971 485,180
HOUSEHOLDS 1 MILE 3 MILES 5 MILES
2022 ProjectionTotal Households
8,975 66,818 166,507
2017 EstimateTotal Households
8,830 66,067 164,893
2010 CensusTotal Households
8,283 62,172 154,485
2000 CensusTotal Households
8,993 66,471 165,238
HOUSEHOLDS BY INCOME 1 MILE 3 MILES 5 MILES
2017 Estimate
$200,000 or More 2.52% 3.11% 2.99%
$150,000 - $199,999 1.32% 2.19% 2.41%
$100,000 - $149,000 7.43% 8.41% 8.71%
$75,000 - $99,999 6.61% 8.34% 9.28%
$50,000 - $74,999 15.13% 17.07% 17.69%
$35,000 - $49,999 16.83% 15.54% 15.24%
$25,000 - $34,999 13.17% 12.01% 12.39%
$15,000 - $24,999 16.78% 15.25% 14.33%
Under $15,000 19.99% 18.49% 17.83%
Average Household Income $52,159 $59,059 $60,114
Median Household Income $34,840 $38,977 $40,842
Per Capita Income $21,254 $21,799 $22,664
POPULATION PROFILE 1 MILE 3 MILES 5 MILES
Population By Age
2017 Estimate Total Population 21,754 180,223 440,294
Under 20 27.51% 28.02% 27.53%
20 to 34 Years 26.18% 22.28% 22.43%
35 to 39 Years 6.96% 6.70% 6.77%
40 to 49 Years 12.97% 13.14% 13.26%
50 to 64 Years 16.68% 17.21% 17.80%
Age 65+ 9.69% 12.65% 12.21%
Median Age 32.59 34.8 35.03
Population 25+ by Education Level
2017 Estimate Population Age 25+ 13,890 116,879 287,961
Elementary (0-8) 5.36% 6.71% 6.90%
Some High School (9-11) 10.38% 10.39% 10.09%
High School Graduate (12) 29.94% 29.24% 27.97%
Some College (13-15) 23.94% 23.55% 24.05%
Associate Degree Only 8.64% 7.87% 7.89%
Bachelors Degree Only 13.45% 12.53% 13.53%
Graduate Degree 6.58% 7.99% 7.96%
Population by Gender
2016 Estimate Total Population 00,000 00,000 00,000
Male Population 00.00% 00.00% 00.00%
Female Population 00.00% 00.00% 00.00%
WE
ST
WO
OD
B
US
IN
ES
S
CE
NT
ER
//
M
AR
KE
T
OV
ER
VI
EW
37

E X C L U S I V E LY L I S T E D B Y
WESTWOOD BUSINESS CENTER
EDWARD J. NELSONFirst Vice President Investments
Sacramento OfficeCell 916.425.9179
Office [email protected]
License CA 01452610