westminster noise measurement survey 2008 for westminster
TRANSCRIPT
Westminster Noise Measurement Survey 2008
For Westminster City Council
FINAL REPORT
December 08
Scott Wilson Ltd
D119026_2
Westminster Noise Measurement Survey 2008
FINAL REPORT
Issue No Current Status
Date Prepared by Reviewed by Approved by
02 Final 19/12/2008 Chris Skinner Alf Maneylaws Paul Shields
This document has been prepared for the titled project or named part thereof and should not be relied upon or used for any other project without an independent check being carried out as to its suitability and the prior written authority of Scott Wilson Ltd being obtained. Scott Wilson Ltd accepts no responsibility for the consequences of this document being used for any purpose other than the purposes for which it was commissioned. Any person using or relying on the document for any such other purpose agrees and will by such use or reliance be taken to confirm his or her agreement to indemnify Scott Wilson Ltd for all loss or damage resulting there from. Scott Wilson Ltd accepts no responsibility or liability for this document to any other party than the party, which commissioned its preparation.
Scott Wilson Ltd 12 Regan Way
Chetwynd Business Park Chilwell
Nottingham NG9 6RZ
Phone: +44 (0)115 907 7000 Fax: +44 (0)115 907 7001
www.scottwilson.com
Westminster Noise Measurement Survey 2008: Final Report
D119026_2
Scott Wilson Ltd December 2008
TABLE OF CONTENTS
EXECUTIVE SUMMARY ................................................................................................................. I
1. INTRODUCTION ..................................................................................................................... 1
1.1 BACKGROUND ................................................................................................................... 1 1.2 WESTMINSTER NOISE MEASUREMENT SURVEY 2008 .......................................................... 2
2. BACKGROUND AND SITE SELECTION................................................................................ 3
2.1 PHASE 1 ........................................................................................................................... 3 2.2 PHASE 2 ........................................................................................................................... 3 2.3 ALTERNATIVE SITE SELECTION........................................................................................... 3 2.4 INSTRUMENTATION ............................................................................................................ 5 2.5 MEASUREMENT PROTOCOLS AND SITE PRO-FORMA............................................................ 6 2.6 TIMING OF MEASUREMENTS ............................................................................................... 6 2.7 DATA ANALYSIS AND PRESENTATION .................................................................................. 6
3. PHASE 1 RESULTS................................................................................................................ 8
3.1 PHASE 1 ........................................................................................................................... 8 3.2 PHASE 1 COMPARISON TO 2003 SURVEY ......................................................................... 10 3.3 PHASE 1 COMPARISON TO LONDON AND NATIONAL SURVEYS ............................................ 13 3.4 REAR FAÇADES IN WESTMINSTER .................................................................................... 15
4. PHASE 2 RESULTS.............................................................................................................. 19
4.1 PHASE 2 ......................................................................................................................... 19 4.2 COMPARISON BETWEEN PHASE 1 AND PHASE 2 ................................................................ 20
5. AUDIBLE NOISE SOURCES ................................................................................................ 24
6. MAXIMUM NOISE LEVELS .................................................................................................. 25
6.1 ANALYSIS OF LAFMAX, NOISE LEVELS .................................................................................. 25 6.2 RESULTS ........................................................................................................................ 25
7. CONCLUSIONS .................................................................................................................... 30
8. RECOMMENDATIONS.......................................................................................................... 31
9. REFERENCES ...................................................................................................................... 32
APPENDIX A NOISE & VIBRATION TERMINOLOGY AND PERCEPTION............................ 33
NOISE PERCEPTION AND TERMINOLOGY....................................................................................... 33 VIBRATION PERCEPTION AND TERMINOLOGY ................................................................................ 34
APPENDIX B SITE-BY-SITE DATA – PHASE 1 SITES........................................................... 36
APPENDIX C SITE-BY-SITE DATA – PHASE 2 SITES........................................................... 57
APPENDIX D ADDITIONAL RESULTS – WEEKEND MONITORING ..................................... 73
APPENDIX E ADDITIONAL RESULTS – VIBRATION MONITORING .................................... 78
Westminster Noise Measurement Survey 2008: Final Report
D119026_2
Scott Wilson Ltd December 2008
APPENDIX F ADDITIONAL RESULTS – LONG TERM MONITORING .................................. 81
APPENDIX G INSTRUMENTATION ........................................................................................ 83

Westminster Noise Measurement Survey 2008: Final Report
D119026_2 i
Scott Wilson Ltd December 2008
EXECUTIVE SUMMARY
Scott Wilson was commissioned by Westminster City Council to undertake the Westminster Noise
Measurement Survey 2008. This survey comprised noise measurements at the front and rear of 35
properties across the City of Westminster.
The measurements were split into two phases. Phase 1 included measurements at one randomly
selected residential address in each of the 20 wards in Westminster. Phase 2 include a further 15
measurement sites, at locations selected by Westminster City Council in and around the Central
Activities Zone (CAZ).
The results from Phase 1 of the survey provide a new baseline for the noise measurements and
also provide some figures for comparison with the previous 2003 Westminster Noise Survey. The
average noise levels from Phase 1 of this survey are slightly below those from the 2003 survey,
although by looking at data from individual sites, it is considered that this is most likely to be due to
the different sampling methodologies used, and not necessarily an indication that average noise
levels have reduced significantly over this period.
The Phase 1 results have been compared against the World Health Organisation Guidelines for
Community Noise. The average levels at the front of the properties are considerably above these
guidelines, whilst those at the rear are just below the daytime guideline of 55 dB LAeq,day and
approximately 3 dB above the night time guideline level. Eighteen out of the twenty front
measurement sites exceed the day-time guideline figure of 55 dB LAeq and all front measurement
sites exceed the night-time guideline figure of 45 dB LAeq. At the rear location, six sites exceed the
day-time guideline, whilst all but three sites exceed the night-time guideline.
The data from Phase 1 of the survey have also been compared against average noise levels for
the UK and for outer London, obtained from the 2000/2001 National Noise Incidence Study. This
comparison shows significantly higher average noise levels within Westminster than in either Outer
London or the UK. These differences are generally greater during the night time (with the variation
between noise levels during the day and night smaller in Westminster), and are generally higher for
the LA90 noise indicators.
Phase 2 of the survey has allowed typical noise levels at residential addresses within the Central
Activities Zone to be compared with those from Phase 1 (average of Westminster). Some small
differences are seen between the data for the two phases, with the Phase 2 sites showing slightly
higher noise levels. Again it is the night time and LA90 indicators which show this difference the
most.
Westminster Noise Measurement Survey 2008: Final Report
D119026_2 1
Scott Wilson Ltd December 2008
1. INTRODUCTION
1.1 Background
1.1.1 A number of previous noise surveys across the City of Westminster, London and the UK
have been undertaken over the last 20 years. Key studies are summarised below:
• National Noise Incidence Study 1990 (NNIS 1990)1
A national survey of noise levels outside 1000 dwellings over England and Wales,
carried out for the then Department of the Environment.
• National Noise Incidence Study 2000/2001 (NNIS 2001)2
A follow on from NNIS 1990, measurements were undertaken outside 1160
dwellings over the UK, carried out for Defra and the Devolved Administrations.
This survey allowed a new assessment of average noise levels over the country
and comparisons against data from the 1990 survey.
• Westminster Noise Survey 20033
Due to the design of the National Noise Incidence Studies, no measurements
were undertaken in central London boroughs, as the population weighting of site
selection resulted in locations within the more populous outer boroughs. During
March 2003, a separate survey was undertaken for Westminster City Council
including measurements at 38 residential sites within the borough.
• London Noise Survey 20044
A survey during 2004 in three further inner London Boroughs (Camden,
Southwark and Tower Hamlets), undertaken for the GLA. These data was also
analysed in conjunction with that from the Westminster Noise Survey 2003 to
provide a picture of inner London noise levels5.
1.1.2 In order to provide data to assist the City of Westminster in the development of a noise
strategy, and update the data from the 2003 Westminster Noise Survey, Scott Wilson were
commissioned to carry out the 2008 Westminster Noise Measurement Survey against the
background of these previous measurement surveys.
1.1.3 A summary of noise terminology and perception is included as Appendix A to this report.
Westminster Noise Measurement Survey 2008: Final Report
D119026_2 2
Scott Wilson Ltd December 2008
1.2 Westminster Noise Measurement Survey 2008
1.2.1 The Westminster Noise Measurement Survey 2008 consisted of measurements at a total of
35 sites, and was split into two phases of measurements:
• Phase 1
A series of 20 measurements, one randomly selected address in each ward within
the City of Westminster.
• Phase 2
Measurements at a further 15 sites selected by Westminster City council at
locations within or close to the Central Activities Zone (CAZ).
1.2.2 At each site noise measurements were made for a continuous 24-hour weekday period,
avoiding Monday morning and Friday evening rush hours. Measurement locations were
standardised to 1.2 m above floor level and 1 m from the façade of the building wherever
possible. Where the property was a flat above ground level, the measurements were
undertaken at this height above floor level of the property, rather than ground level. In a
small number of cases, it was necessary to install the measurement equipment at a higher
level, such as on a first floor flat roof or balcony where no suitable location at ground floor
level was available.
1.2.3 Measurements were made at the front and rear of a property at each location. In some
cases, where it was not possible to take measurements at the front and rear of the same
property, representative locations on two separate properties were used.
1.2.4 A summary of the data collected at each site, together with time histories of the noise levels
measured are included as Appendix B (Phase 1 sites) and Appendix C (Phase 2 sites) of
this report.
1.2.5 Additional parameters were measured at a small number of properties, including tri-axial
vibration measurements and calibrated sound recordings. The measurement period was
also extended over a weekend at some locations in order to provide noise measurement
data over the weekend period in addition to the standard 24-hour period during the week.
The results of the additional weekend monitoring are presented in Appendix D of this
report, and the results of the vibration monitoring are included as Appendix E.
1.2.6 Long term noise measurements were made at one additional site. Measurements at this
site were made over a period of some 6 weeks covering the duration of most site
measurements. Data from this site is presented in Appendix F of this report.
Westminster Noise Measurement Survey 2008: Final Report
D119026_2 3
Scott Wilson Ltd December 2008
2. BACKGROUND AND SITE SELECTION
2.1 Phase 1
2.1.1 Phase 1 of the Westminster Noise Measurement Survey 2008 consisted of 20 sites, one
randomly selected residential address in each ward within the City of Westminster. This
approach was chosen in order to ensure geographic coverage over the entirety of
Westminster.
2.1.2 In contrast, Phase 1 of the 2003 survey was focussed on 2 wards within Westminster in
order to maintain an identical site selection protocol to that used for the NNIS 2001. For the
2008 survey, it was decided that ensuring the geographic coverage was a higher priority
than allowing direct comparison back to the 2003 survey.
2.1.3 For the two wards common to Phase 1 of the 2003 and 2008 surveys, the measurement
address was selected at random from the ten addresses used in 2003. For all other wards,
a random address was selected, with probability of selection proportional to population
(using average figures based on populations of Census Super-Output Areas and residential
property counts).
2.1.4 For each site, the selected address was identified, and where consent could not be
obtained to measure at this address, or the property was not appropriate to install the
monitoring equipment, an alternative was sought according to the methodology in Section
2.3 below.
2.2 Phase 2
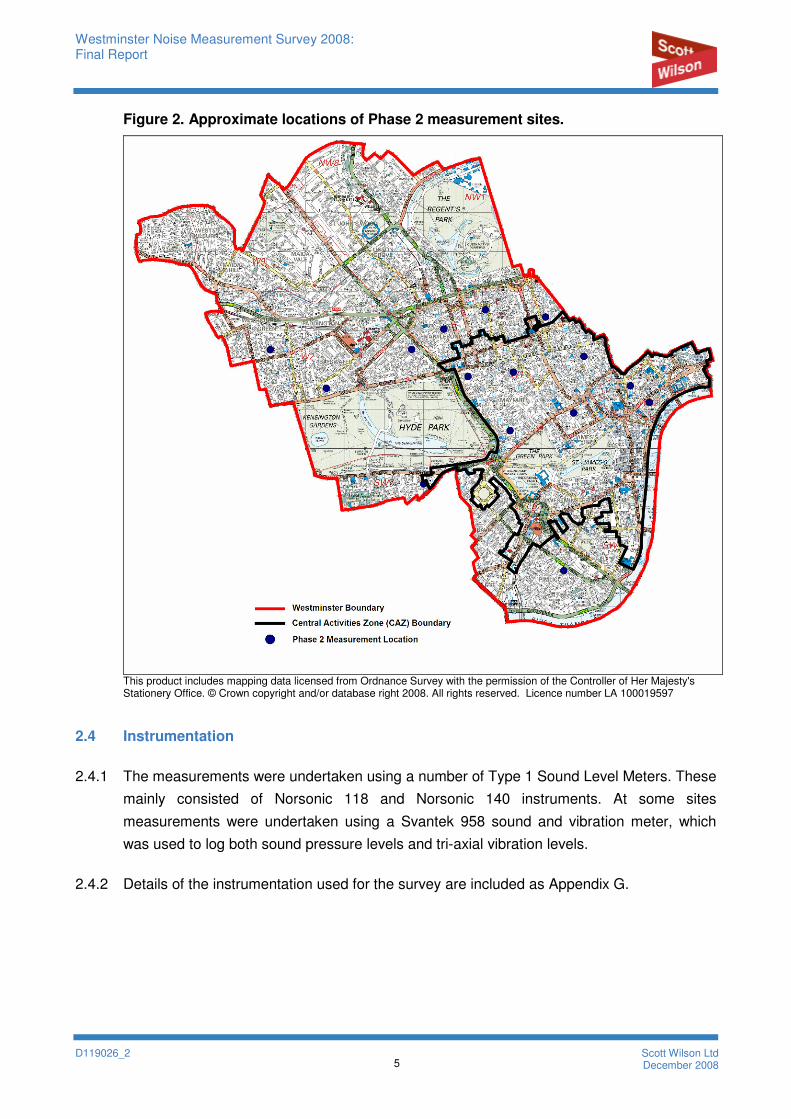
2.2.1 Phase 2 of the survey focussed on the Central Activities Zone (CAZ) in the City of
Westminster. 15 locations within the CAZ and close to its boundaries were selected by
Westminster City Council, and two residential addresses were selected within a 100 yard
radius of each of these locations. The measurement address was then selected from these
two alternatives, again applying the alternative site selection criteria in Section 2.3 below
where necessary.
2.3 Alternative Site Selection
2.3.1 Where consent could not be obtained to undertake the measurements at the selected
address, an alternative address, with a noise environment as representative as possible of
the selected location was used. In particular, the location of significant noise sources
(normally the local road), orientation with respect to local roads, presence of any acoustic
Westminster Noise Measurement Survey 2008: Final Report
D119026_2 4
Scott Wilson Ltd December 2008
barriers, and any other significant local noise sources were considered in selecting
alternative addresses.
2.3.2 In a small number of cases, where no suitable measurement address was found at the
selected location, or the selected address was not a unique residential address, an
alternative, similar location was selected either by means of selection on site of an
equivalent nearby location, or the drawing of a new random sample within the same
Census Super-Output area.
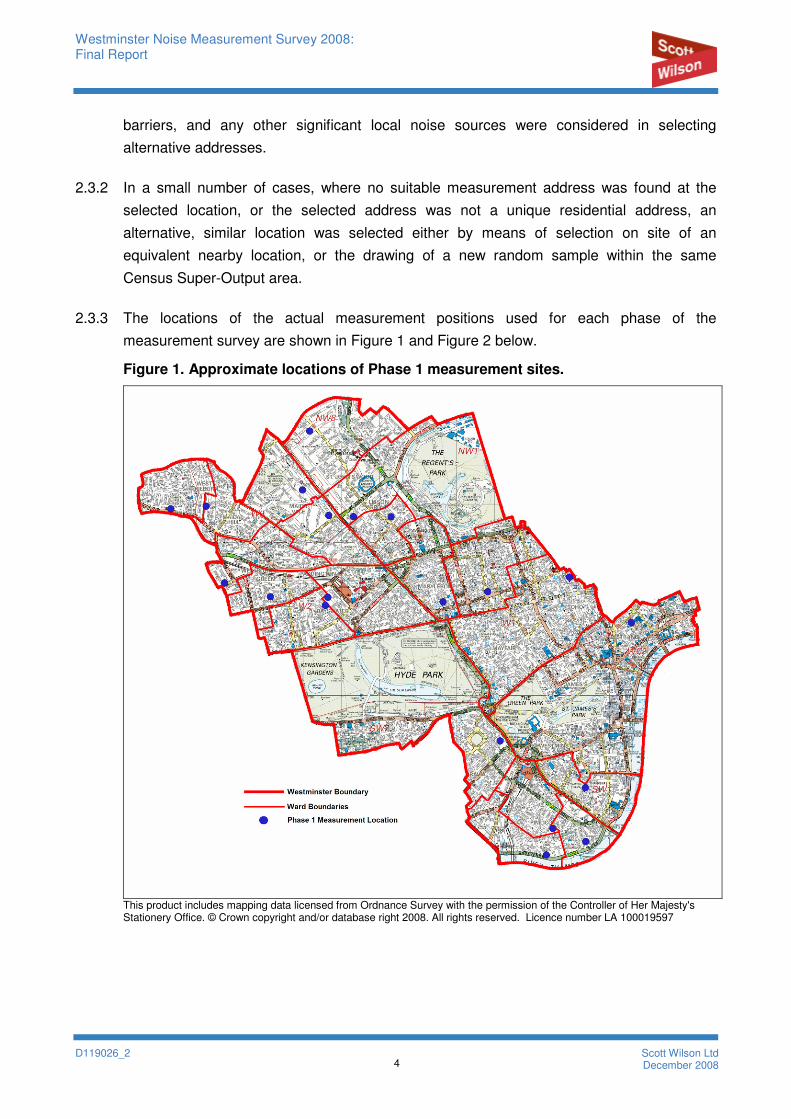
2.3.3 The locations of the actual measurement positions used for each phase of the
measurement survey are shown in Figure 1 and Figure 2 below.
Figure 1. Approximate locations of Phase 1 measurement sites.
This product includes mapping data licensed from Ordnance Survey with the permission of the Controller of Her Majesty's Stationery Office. © Crown copyright and/or database right 2008. All rights reserved. Licence number LA 100019597
Westminster Noise Measurement Survey 2008: Final Report
D119026_2 5
Scott Wilson Ltd December 2008
Figure 2. Approximate locations of Phase 2 measurement sites.
This product includes mapping data licensed from Ordnance Survey with the permission of the Controller of Her Majesty's Stationery Office. © Crown copyright and/or database right 2008. All rights reserved. Licence number LA 100019597
2.4 Instrumentation
2.4.1 The measurements were undertaken using a number of Type 1 Sound Level Meters. These
mainly consisted of Norsonic 118 and Norsonic 140 instruments. At some sites
measurements were undertaken using a Svantek 958 sound and vibration meter, which
was used to log both sound pressure levels and tri-axial vibration levels.
2.4.2 Details of the instrumentation used for the survey are included as Appendix G.
Westminster Noise Measurement Survey 2008: Final Report
D119026_2 6
Scott Wilson Ltd December 2008
2.5 Measurement Protocols and Site Pro-Forma
2.5.1 The measurement protocols used at all sites were based on those from the National Noise
Incidence Studies, and hence consistent with these surveys, the Westminster Noise Survey
2003 and the London Noise Survey 2004.
2.5.2 Key elements of the measurement protocol were:
• Measurements at a height of 1.2 m above floor level and 1 m from the building
façade wherever possible.
• All measurements to include 24-hours (synchronised on hours) on weekdays.
Measurements during Monday morning and Friday afternoon rush-hours were
avoided.
• Local school holiday periods and bank holidays avoided.
• Weather constraints were imposed on measurements, sustained periods of heavy
rain and strong winds were avoided where these might have interfered with the
operation of the instrumentation or the measurement results.
2.6 Timing of Measurements
2.6.1 The weather conditions during the survey were variable. Site selection was completed by
mid-March 2008, but due to poor weather conditions, it was not possible to undertake any
measurements until the week commencing 31st March.
2.6.2 No measurements were undertaken during the local school holiday period of 5th April to 20th
April 2008. The majority of site measurements were undertaken during the period from 21st
April 2008 to 15th May 2008, and the weather remained mostly dry with warm days and light
winds. At the very end of the site measurements, the weather deteriorated, but some
instruments were left in place for a longer duration in order to ensure that a 24-hour period
during reasonable weather conditions was captured.
2.7 Data Analysis and Presentation
2.7.1 For the calculation of day, evening and night time indicators, and the 24-hour Lden indicator,
the following time periods have been used:
• Day time: 07:00 – 19:00
• Evening: 19:00 – 23:00
Westminster Noise Measurement Survey 2008: Final Report
D119026_2 7
Scott Wilson Ltd December 2008
• Night time: 23:00 – 07:00
2.7.2 All measurements were taken over contiguous 1-hour time frames, with further
measurements over 5-minute or 125 ms intervalsa. When calculating noise levels over
longer periods (e.g. 12 hour day, 16 hour day, 8 hour night, etc.), these have been
calculated by means of a logarithmic average for Leq noise levels, or arithmetic averages for
statistical noise levels. Whilst this gives a true longer duration Leq, it does not necessarily
provide a true statistical noise level over these longer assessment periods. However, this
approach is consistent with that taken for the NNIS in 1990 and replicated for the NNIS
2001 and Westminster Noise Survey 2003.
2.7.3 Average levels calculated across a number of sites (for example all sites within Phase 1 or
Phase 2 of the survey), have been calculated as arithmetic averages of the noise indicators
concernedb. In the case of time histories, arithmetic average levels across the sites have
been calculated for each hour period, and these averages presented graphically.
a Where statistical levels could not be recorded over 5-minute time frames a time-history of LAeq,125ms noise levels was
recorded to allow statistical levels over different time periods to be calculated. For sites where simultaneous noise and vibration measurements were undertaken, this was recorded as an LAeq,100ms time history due to limitations of the instrument. b Note that this arithmetic averaging has been applied for all noise indicators (including LAeq and statistical indicators).
Westminster Noise Measurement Survey 2008: Final Report
D119026_2 8
Scott Wilson Ltd December 2008
3. PHASE 1 RESULTS
3.1 Phase 1
3.1.1 This section presents the results from Phase 1 of the Westminster Noise Measurement
Survey 2008, and compares these results with World Health Organisation Guidelines, and
the results from London and national noise surveys.
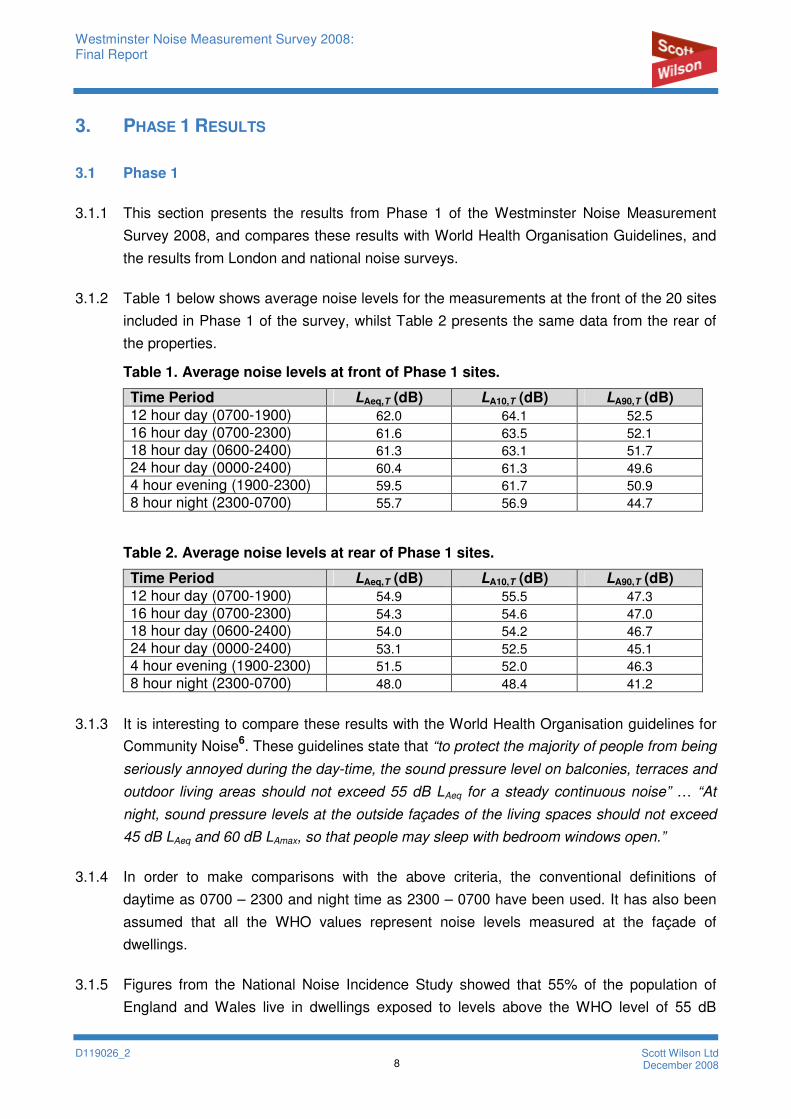
3.1.2 Table 1 below shows average noise levels for the measurements at the front of the 20 sites
included in Phase 1 of the survey, whilst Table 2 presents the same data from the rear of
the properties.
Table 1. Average noise levels at front of Phase 1 sites.
Time Period LAeq,T (dB) LA10,T (dB) LA90,T (dB)
12 hour day (0700-1900) 62.0 64.1 52.5
16 hour day (0700-2300) 61.6 63.5 52.1
18 hour day (0600-2400) 61.3 63.1 51.7
24 hour day (0000-2400) 60.4 61.3 49.6
4 hour evening (1900-2300) 59.5 61.7 50.9
8 hour night (2300-0700) 55.7 56.9 44.7
Table 2. Average noise levels at rear of Phase 1 sites.
Time Period LAeq,T (dB) LA10,T (dB) LA90,T (dB)
12 hour day (0700-1900) 54.9 55.5 47.3
16 hour day (0700-2300) 54.3 54.6 47.0
18 hour day (0600-2400) 54.0 54.2 46.7
24 hour day (0000-2400) 53.1 52.5 45.1
4 hour evening (1900-2300) 51.5 52.0 46.3
8 hour night (2300-0700) 48.0 48.4 41.2
3.1.3 It is interesting to compare these results with the World Health Organisation guidelines for
Community Noise6. These guidelines state that “to protect the majority of people from being
seriously annoyed during the day-time, the sound pressure level on balconies, terraces and
outdoor living areas should not exceed 55 dB LAeq for a steady continuous noise” … “At
night, sound pressure levels at the outside façades of the living spaces should not exceed
45 dB LAeq and 60 dB LAmax, so that people may sleep with bedroom windows open.”
3.1.4 In order to make comparisons with the above criteria, the conventional definitions of
daytime as 0700 – 2300 and night time as 2300 – 0700 have been used. It has also been
assumed that all the WHO values represent noise levels measured at the façade of
dwellings.
3.1.5 Figures from the National Noise Incidence Study showed that 55% of the population of
England and Wales live in dwellings exposed to levels above the WHO level of 55 dB
Westminster Noise Measurement Survey 2008: Final Report
D119026_2 9
Scott Wilson Ltd December 2008
LAeq,day; and that 68% of the population of England and Wales live in dwellings exposed to
levels above the night time WHO level of 45 dB LAeq,night.
3.1.6 Calculations of equivalent percentages for Westminster cannot easily be made, as the
uncertainties would be very large based on only 20 sites. However, it is interesting to note
that the average levels at the front of the properties are considerably above these
guidelines. Average levels at the rear of properties are just below the daytime guideline of
55 dB LAeq,day and approximately 3 dB above the night time guideline level.
3.1.7 It is also interesting to note that 18 out of the 20 front measurement sites exceed the day-
time guideline figure of 55 dB LAeq and all of the 20 front measurement sites exceed the
night-time guideline figure of 45 dB LAeq.
3.1.8 When the measurements taken at the rear of the Phase 1 sites are compared against the
WHO guidance, it can be seen that six sites exceed the day-time guideline, whilst all but 3
sites exceed the night-time guideline. The rear façades of the properties are generally
significantly quieter than the front façades, although the night time levels at these are still
generally above the WHO guideline level.
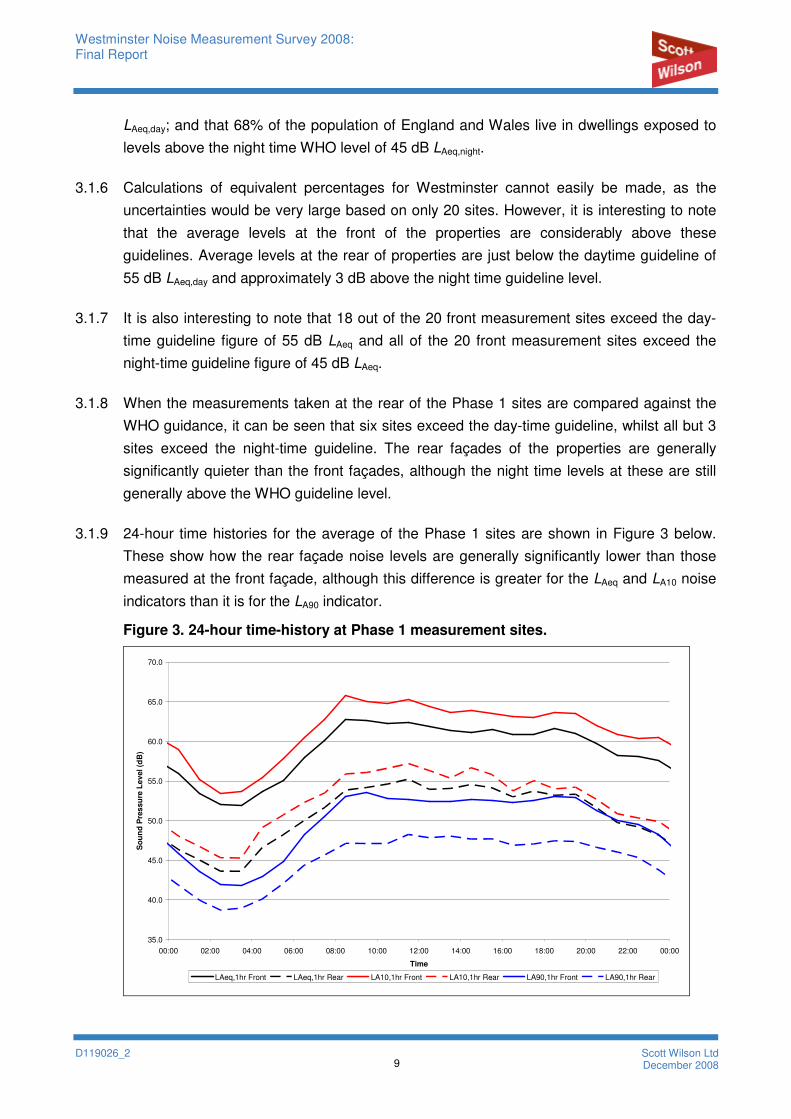
3.1.9 24-hour time histories for the average of the Phase 1 sites are shown in Figure 3 below.
These show how the rear façade noise levels are generally significantly lower than those
measured at the front façade, although this difference is greater for the LAeq and LA10 noise
indicators than it is for the LA90 indicator.
Figure 3. 24-hour time-history at Phase 1 measurement sites.
35.0
40.0
45.0
50.0
55.0
60.0
65.0
70.0
00:00 02:00 04:00 06:00 08:00 10:00 12:00 14:00 16:00 18:00 20:00 22:00 00:00
Time
So
un
d P
res
su
re L
ev
el
(dB
)
LAeq,1hr Front LAeq,1hr Rear LA10,1hr Front LA10,1hr Rear LA90,1hr Front LA90,1hr Rear
Westminster Noise Measurement Survey 2008: Final Report
D119026_2 10
Scott Wilson Ltd December 2008
3.2 Phase 1 Comparison to 2003 Survey
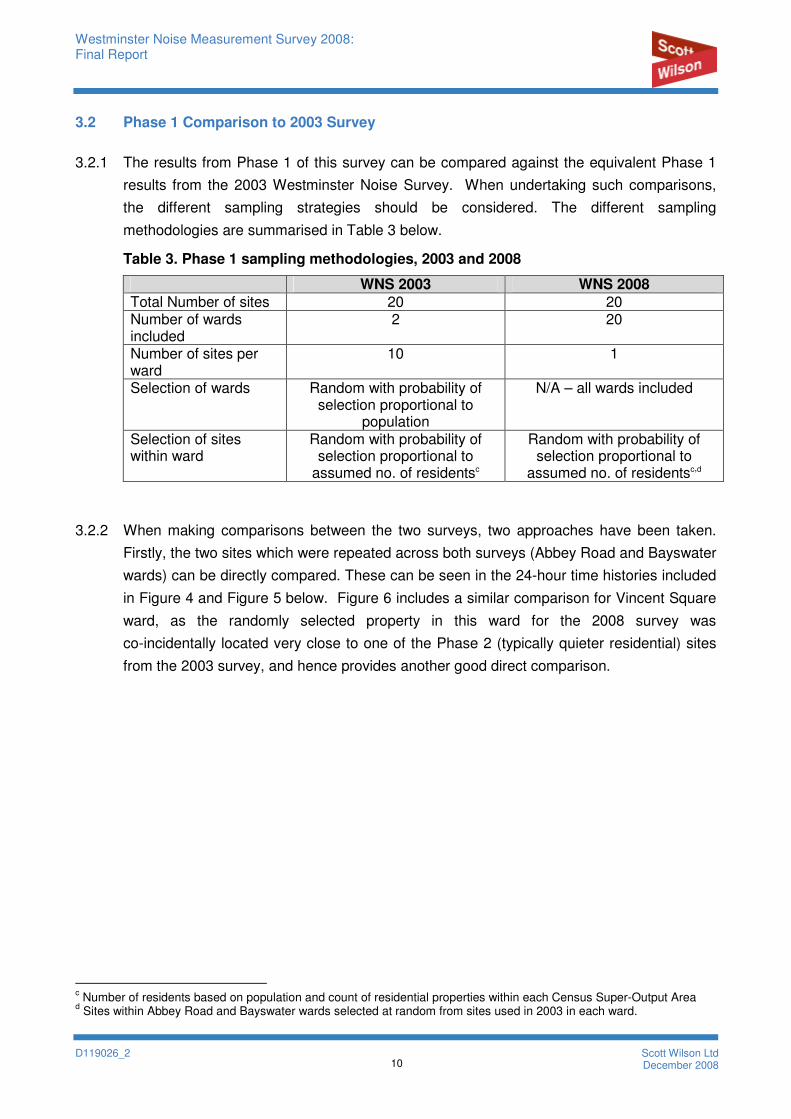
3.2.1 The results from Phase 1 of this survey can be compared against the equivalent Phase 1
results from the 2003 Westminster Noise Survey. When undertaking such comparisons,
the different sampling strategies should be considered. The different sampling
methodologies are summarised in Table 3 below.
Table 3. Phase 1 sampling methodologies, 2003 and 2008
WNS 2003 WNS 2008
Total Number of sites 20 20 Number of wards included
2 20
Number of sites per ward
10 1
Selection of wards Random with probability of selection proportional to
population
N/A – all wards included
Selection of sites within ward
Random with probability of selection proportional to
assumed no. of residentsc
Random with probability of selection proportional to
assumed no. of residentsc,d
3.2.2 When making comparisons between the two surveys, two approaches have been taken.
Firstly, the two sites which were repeated across both surveys (Abbey Road and Bayswater
wards) can be directly compared. These can be seen in the 24-hour time histories included
in Figure 4 and Figure 5 below. Figure 6 includes a similar comparison for Vincent Square
ward, as the randomly selected property in this ward for the 2008 survey was
co-incidentally located very close to one of the Phase 2 (typically quieter residential) sites
from the 2003 survey, and hence provides another good direct comparison.
c Number of residents based on population and count of residential properties within each Census Super-Output Area
d Sites within Abbey Road and Bayswater wards selected at random from sites used in 2003 in each ward.
Westminster Noise Measurement Survey 2008: Final Report
D119026_2 11
Scott Wilson Ltd December 2008
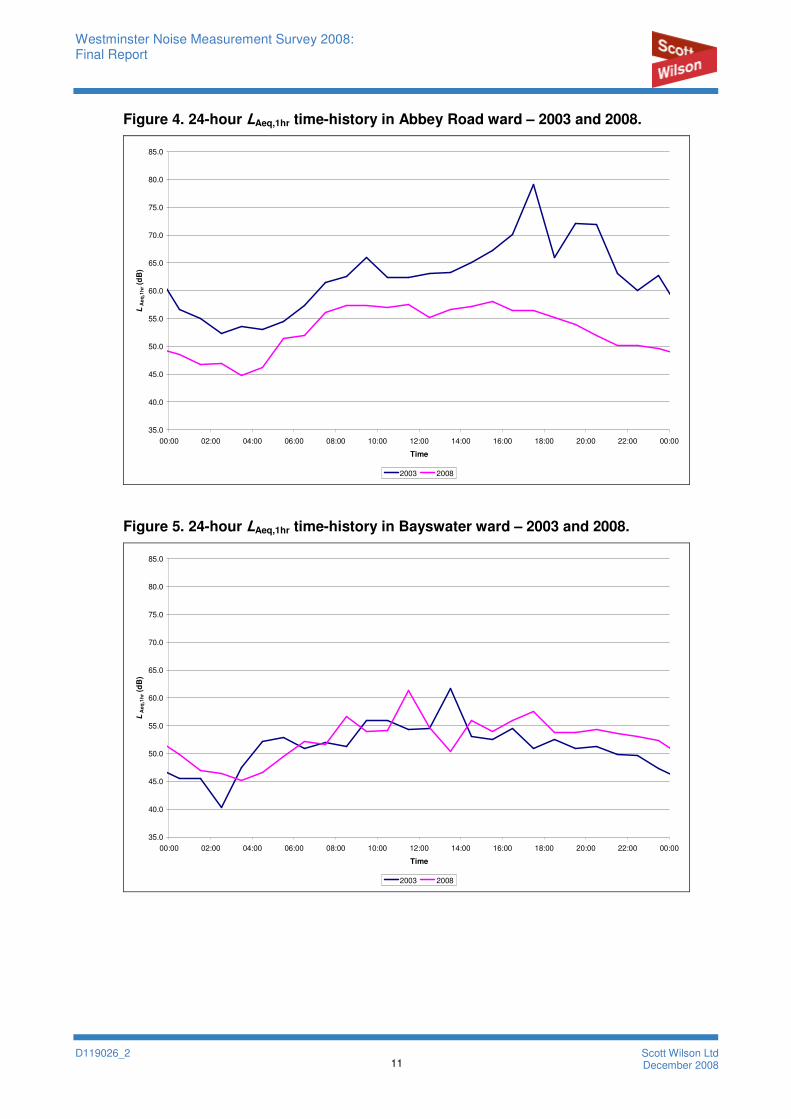
Figure 4. 24-hour LAeq,1hr time-history in Abbey Road ward – 2003 and 2008.
35.0
40.0
45.0
50.0
55.0
60.0
65.0
70.0
75.0
80.0
85.0
00:00 02:00 04:00 06:00 08:00 10:00 12:00 14:00 16:00 18:00 20:00 22:00 00:00
Time
LA
eq
,1h
r (d
B)
2003 2008
Figure 5. 24-hour LAeq,1hr time-history in Bayswater ward – 2003 and 2008.
35.0
40.0
45.0
50.0
55.0
60.0
65.0
70.0
75.0
80.0
85.0
00:00 02:00 04:00 06:00 08:00 10:00 12:00 14:00 16:00 18:00 20:00 22:00 00:00
Time
LA
eq
,1h
r (d
B)
2003 2008
Westminster Noise Measurement Survey 2008: Final Report
D119026_2 12
Scott Wilson Ltd December 2008
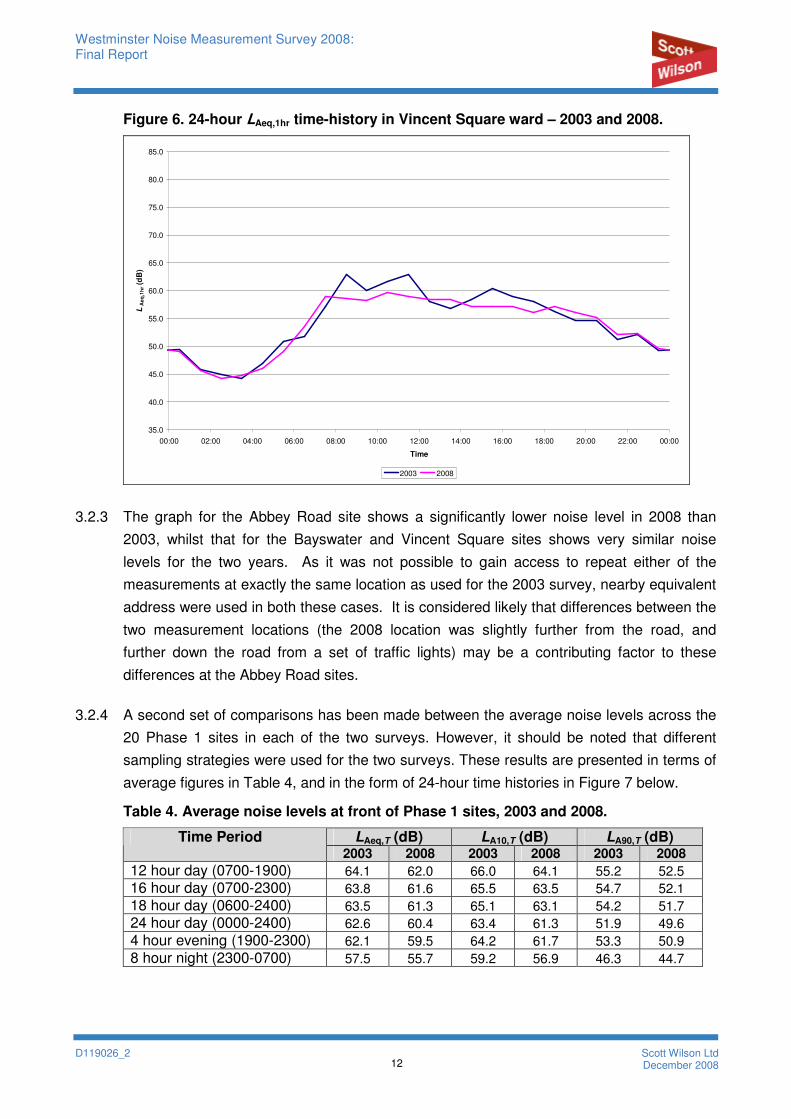
Figure 6. 24-hour LAeq,1hr time-history in Vincent Square ward – 2003 and 2008.
35.0
40.0
45.0
50.0
55.0
60.0
65.0
70.0
75.0
80.0
85.0
00:00 02:00 04:00 06:00 08:00 10:00 12:00 14:00 16:00 18:00 20:00 22:00 00:00
Time
LA
eq
,1h
r (d
B)
2003 2008
3.2.3 The graph for the Abbey Road site shows a significantly lower noise level in 2008 than
2003, whilst that for the Bayswater and Vincent Square sites shows very similar noise
levels for the two years. As it was not possible to gain access to repeat either of the
measurements at exactly the same location as used for the 2003 survey, nearby equivalent
address were used in both these cases. It is considered likely that differences between the
two measurement locations (the 2008 location was slightly further from the road, and
further down the road from a set of traffic lights) may be a contributing factor to these
differences at the Abbey Road sites.
3.2.4 A second set of comparisons has been made between the average noise levels across the
20 Phase 1 sites in each of the two surveys. However, it should be noted that different
sampling strategies were used for the two surveys. These results are presented in terms of
average figures in Table 4, and in the form of 24-hour time histories in Figure 7 below.
Table 4. Average noise levels at front of Phase 1 sites, 2003 and 2008.
LAeq,T (dB) LA10,T (dB) LA90,T (dB) Time Period 2003 2008 2003 2008 2003 2008
12 hour day (0700-1900) 64.1 62.0 66.0 64.1 55.2 52.5
16 hour day (0700-2300) 63.8 61.6 65.5 63.5 54.7 52.1
18 hour day (0600-2400) 63.5 61.3 65.1 63.1 54.2 51.7
24 hour day (0000-2400) 62.6 60.4 63.4 61.3 51.9 49.6
4 hour evening (1900-2300) 62.1 59.5 64.2 61.7 53.3 50.9
8 hour night (2300-0700) 57.5 55.7 59.2 56.9 46.3 44.7
Westminster Noise Measurement Survey 2008: Final Report
D119026_2 13
Scott Wilson Ltd December 2008
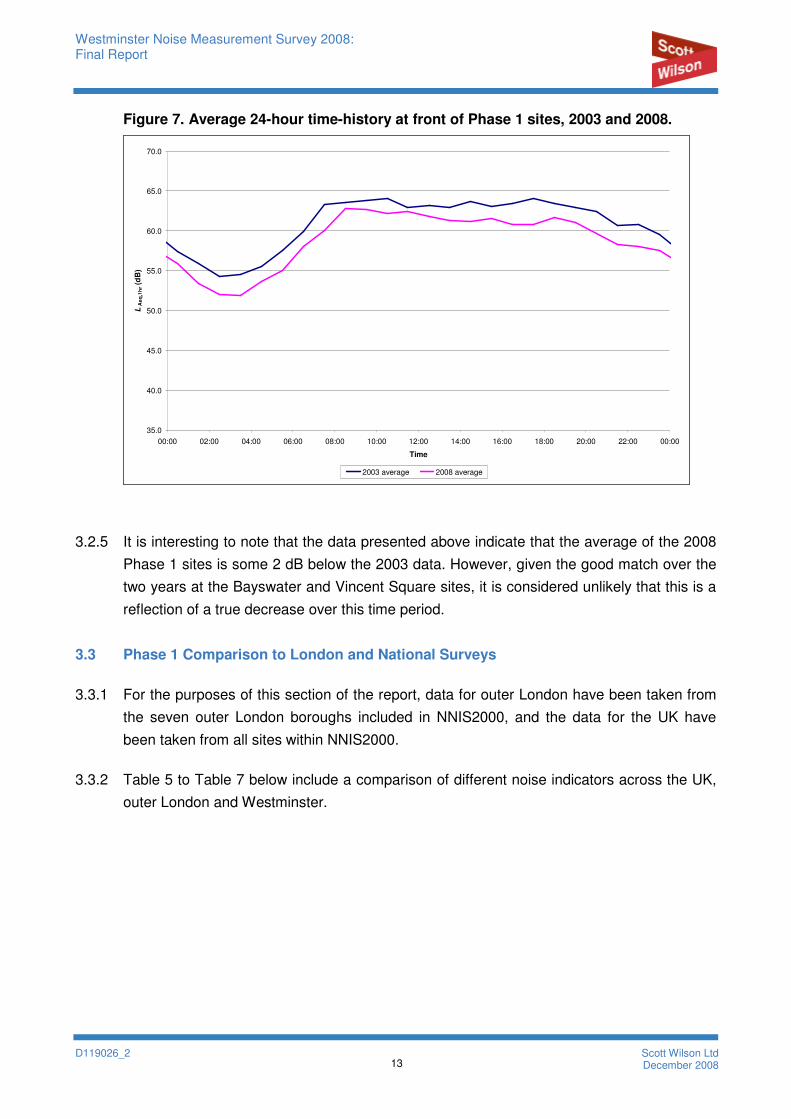
Figure 7. Average 24-hour time-history at front of Phase 1 sites, 2003 and 2008.
35.0
40.0
45.0
50.0
55.0
60.0
65.0
70.0
00:00 02:00 04:00 06:00 08:00 10:00 12:00 14:00 16:00 18:00 20:00 22:00 00:00
Time
LA
eq
,1h
r (d
B)
2003 average 2008 average
3.2.5 It is interesting to note that the data presented above indicate that the average of the 2008
Phase 1 sites is some 2 dB below the 2003 data. However, given the good match over the
two years at the Bayswater and Vincent Square sites, it is considered unlikely that this is a
reflection of a true decrease over this time period.
3.3 Phase 1 Comparison to London and National Surveys
3.3.1 For the purposes of this section of the report, data for outer London have been taken from
the seven outer London boroughs included in NNIS2000, and the data for the UK have
been taken from all sites within NNIS2000.
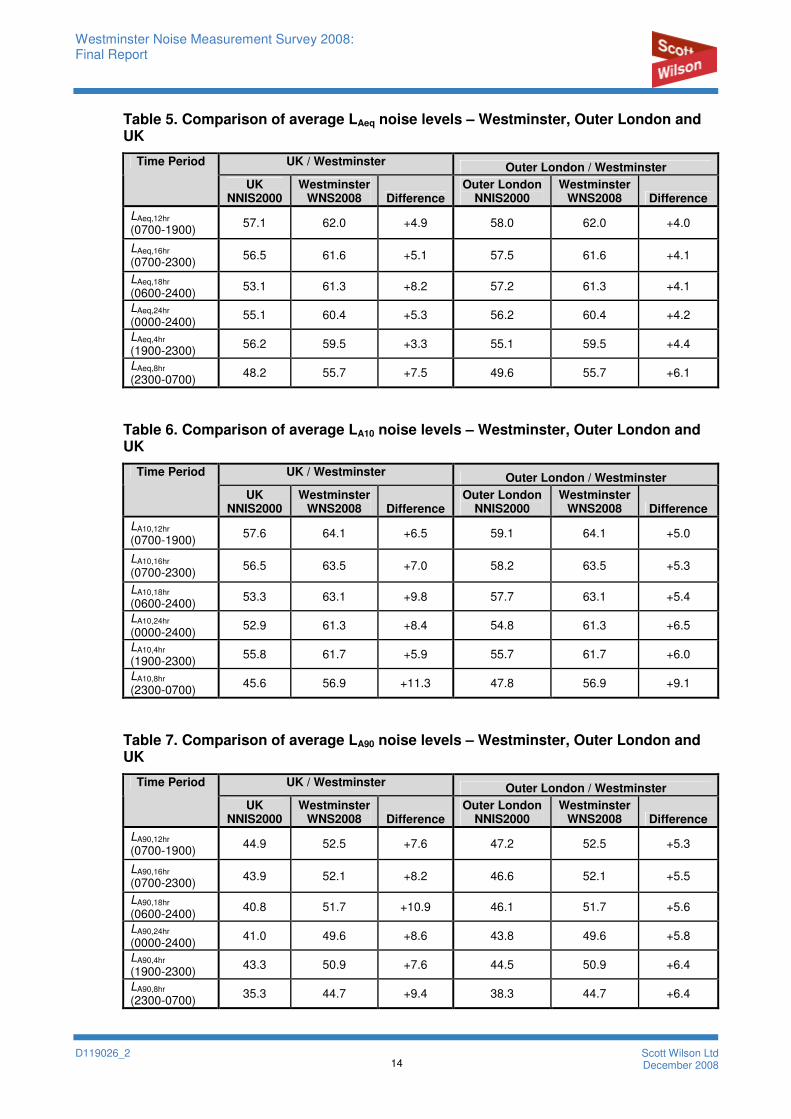
3.3.2 Table 5 to Table 7 below include a comparison of different noise indicators across the UK,
outer London and Westminster.
Westminster Noise Measurement Survey 2008: Final Report
D119026_2 14
Scott Wilson Ltd December 2008
Table 5. Comparison of average LAeq noise levels – Westminster, Outer London and UK
UK / Westminster Outer London / Westminster
Time Period
UK NNIS2000
Westminster WNS2008 Difference
Outer London NNIS2000
Westminster WNS2008 Difference
LAeq,12hr
(0700-1900) 57.1 62.0 +4.9 58.0 62.0 +4.0
LAeq,16hr
(0700-2300) 56.5 61.6 +5.1 57.5 61.6 +4.1
LAeq,18hr
(0600-2400) 53.1 61.3 +8.2 57.2 61.3 +4.1
LAeq,24hr
(0000-2400) 55.1 60.4 +5.3 56.2 60.4 +4.2
LAeq,4hr
(1900-2300) 56.2 59.5 +3.3 55.1 59.5 +4.4
LAeq,8hr
(2300-0700) 48.2 55.7 +7.5 49.6 55.7 +6.1
Table 6. Comparison of average LA10 noise levels – Westminster, Outer London and UK
UK / Westminster Outer London / Westminster
Time Period
UK NNIS2000
Westminster WNS2008 Difference
Outer London NNIS2000
Westminster WNS2008 Difference
LA10,12hr
(0700-1900) 57.6 64.1 +6.5 59.1 64.1 +5.0
LA10,16hr
(0700-2300) 56.5 63.5 +7.0 58.2 63.5 +5.3
LA10,18hr
(0600-2400) 53.3 63.1 +9.8 57.7 63.1 +5.4
LA10,24hr
(0000-2400) 52.9 61.3 +8.4 54.8 61.3 +6.5
LA10,4hr
(1900-2300) 55.8 61.7 +5.9 55.7 61.7 +6.0
LA10,8hr
(2300-0700) 45.6 56.9 +11.3 47.8 56.9 +9.1
Table 7. Comparison of average LA90 noise levels – Westminster, Outer London and UK
UK / Westminster Outer London / Westminster
Time Period
UK NNIS2000
Westminster WNS2008 Difference
Outer London NNIS2000
Westminster WNS2008 Difference
LA90,12hr
(0700-1900) 44.9 52.5 +7.6 47.2 52.5 +5.3
LA90,16hr
(0700-2300) 43.9 52.1 +8.2 46.6 52.1 +5.5
LA90,18hr
(0600-2400) 40.8 51.7 +10.9 46.1 51.7 +5.6
LA90,24hr
(0000-2400) 41.0 49.6 +8.6 43.8 49.6 +5.8
LA90,4hr
(1900-2300) 43.3 50.9 +7.6 44.5 50.9 +6.4
LA90,8hr
(2300-0700) 35.3 44.7 +9.4 38.3 44.7 +6.4
Westminster Noise Measurement Survey 2008: Final Report
D119026_2 15
Scott Wilson Ltd December 2008
3.3.3 These data show that average LAeq noise levels are some 3 to 8 dB higher in Westminster
than the UK average, whilst they are some 4 to 6 dB higher than the outer London average.
The differences for both LA10 and LA90 noise levels are slightly higher than these.
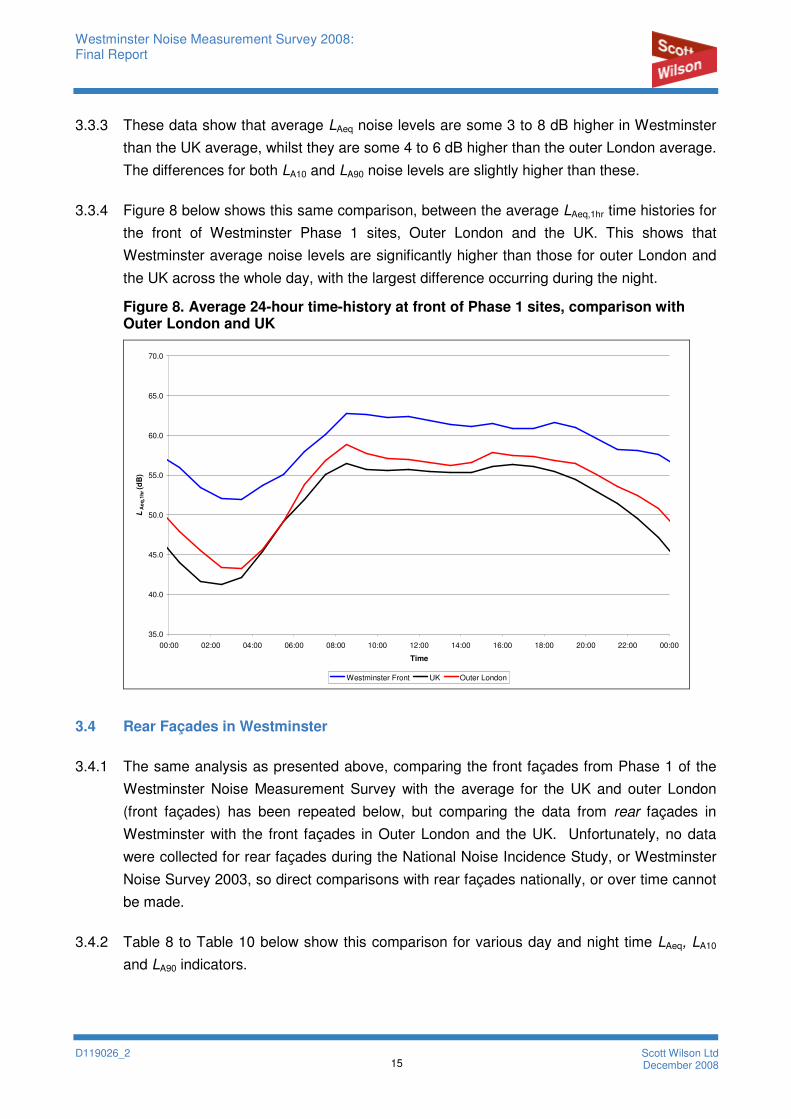
3.3.4 Figure 8 below shows this same comparison, between the average LAeq,1hr time histories for
the front of Westminster Phase 1 sites, Outer London and the UK. This shows that
Westminster average noise levels are significantly higher than those for outer London and
the UK across the whole day, with the largest difference occurring during the night.
Figure 8. Average 24-hour time-history at front of Phase 1 sites, comparison with Outer London and UK
35.0
40.0
45.0
50.0
55.0
60.0
65.0
70.0
00:00 02:00 04:00 06:00 08:00 10:00 12:00 14:00 16:00 18:00 20:00 22:00 00:00
Time
LA
eq
,1h
r (d
B)
Westminster Front UK Outer London
3.4 Rear Façades in Westminster
3.4.1 The same analysis as presented above, comparing the front façades from Phase 1 of the
Westminster Noise Measurement Survey with the average for the UK and outer London
(front façades) has been repeated below, but comparing the data from rear façades in
Westminster with the front façades in Outer London and the UK. Unfortunately, no data
were collected for rear façades during the National Noise Incidence Study, or Westminster
Noise Survey 2003, so direct comparisons with rear façades nationally, or over time cannot
be made.
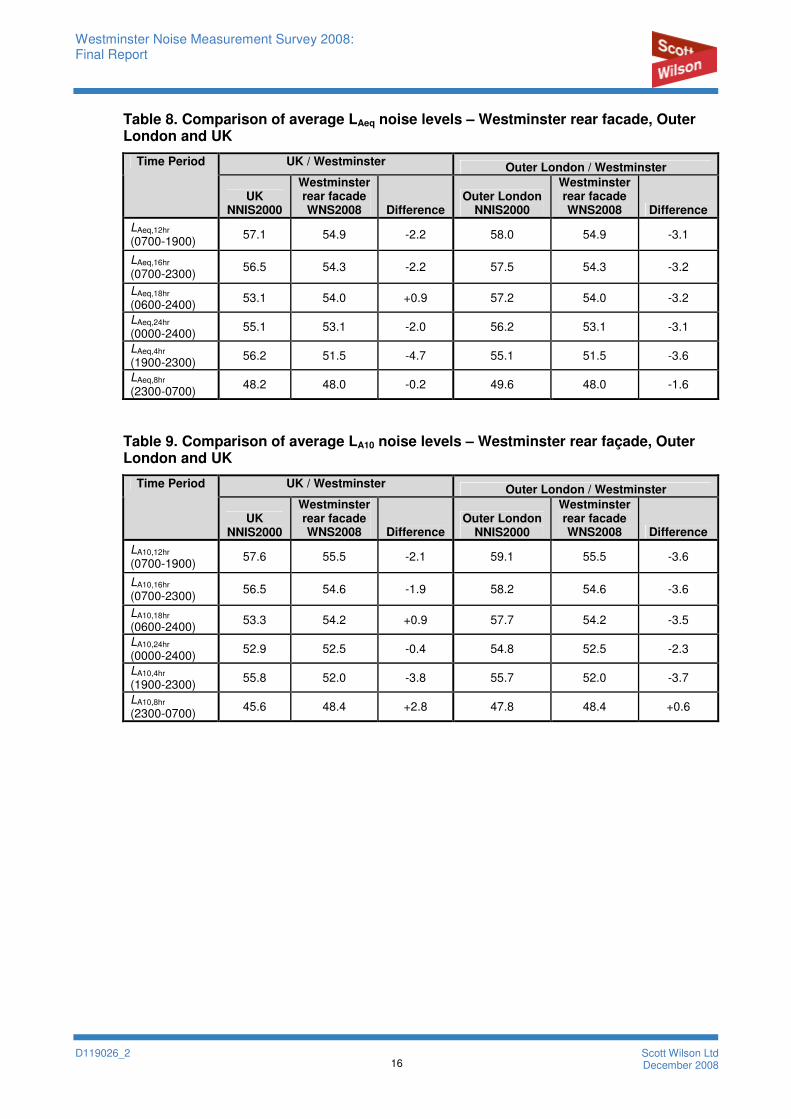
3.4.2 Table 8 to Table 10 below show this comparison for various day and night time LAeq, LA10
and LA90 indicators.
Westminster Noise Measurement Survey 2008: Final Report
D119026_2 16
Scott Wilson Ltd December 2008
Table 8. Comparison of average LAeq noise levels – Westminster rear facade, Outer London and UK
UK / Westminster Outer London / Westminster
Time Period
UK NNIS2000
Westminster rear facade WNS2008 Difference
Outer London NNIS2000
Westminster rear facade WNS2008 Difference
LAeq,12hr
(0700-1900) 57.1 54.9 -2.2 58.0 54.9 -3.1
LAeq,16hr
(0700-2300) 56.5 54.3 -2.2 57.5 54.3 -3.2
LAeq,18hr
(0600-2400) 53.1 54.0 +0.9 57.2 54.0 -3.2
LAeq,24hr
(0000-2400) 55.1 53.1 -2.0 56.2 53.1 -3.1
LAeq,4hr
(1900-2300) 56.2 51.5 -4.7 55.1 51.5 -3.6
LAeq,8hr
(2300-0700) 48.2 48.0 -0.2 49.6 48.0 -1.6
Table 9. Comparison of average LA10 noise levels – Westminster rear façade, Outer London and UK
UK / Westminster Outer London / Westminster
Time Period
UK NNIS2000
Westminster rear facade WNS2008 Difference
Outer London NNIS2000
Westminster rear facade WNS2008 Difference
LA10,12hr
(0700-1900) 57.6 55.5 -2.1 59.1 55.5 -3.6
LA10,16hr
(0700-2300) 56.5 54.6 -1.9 58.2 54.6 -3.6
LA10,18hr
(0600-2400) 53.3 54.2 +0.9 57.7 54.2 -3.5
LA10,24hr
(0000-2400) 52.9 52.5 -0.4 54.8 52.5 -2.3
LA10,4hr
(1900-2300) 55.8 52.0 -3.8 55.7 52.0 -3.7
LA10,8hr
(2300-0700) 45.6 48.4 +2.8 47.8 48.4 +0.6
Westminster Noise Measurement Survey 2008: Final Report
D119026_2 17
Scott Wilson Ltd December 2008
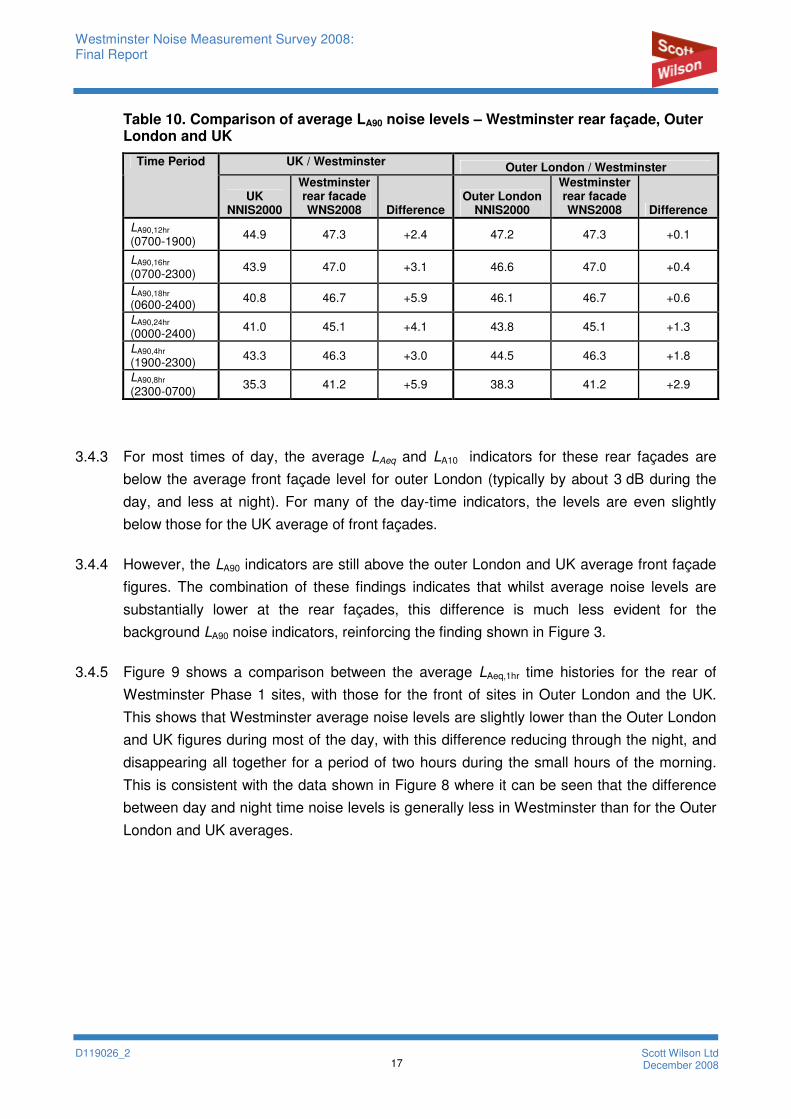
Table 10. Comparison of average LA90 noise levels – Westminster rear façade, Outer London and UK
UK / Westminster Outer London / Westminster
Time Period
UK NNIS2000
Westminster rear facade WNS2008 Difference
Outer London NNIS2000
Westminster rear facade WNS2008 Difference
LA90,12hr
(0700-1900) 44.9 47.3 +2.4 47.2 47.3 +0.1
LA90,16hr
(0700-2300) 43.9 47.0 +3.1 46.6 47.0 +0.4
LA90,18hr
(0600-2400) 40.8 46.7 +5.9 46.1 46.7 +0.6
LA90,24hr
(0000-2400) 41.0 45.1 +4.1 43.8 45.1 +1.3
LA90,4hr
(1900-2300) 43.3 46.3 +3.0 44.5 46.3 +1.8
LA90,8hr
(2300-0700) 35.3 41.2 +5.9 38.3 41.2 +2.9
3.4.3 For most times of day, the average LAeq and LA10 indicators for these rear façades are
below the average front façade level for outer London (typically by about 3 dB during the
day, and less at night). For many of the day-time indicators, the levels are even slightly
below those for the UK average of front façades.
3.4.4 However, the LA90 indicators are still above the outer London and UK average front façade
figures. The combination of these findings indicates that whilst average noise levels are
substantially lower at the rear façades, this difference is much less evident for the
background LA90 noise indicators, reinforcing the finding shown in Figure 3.
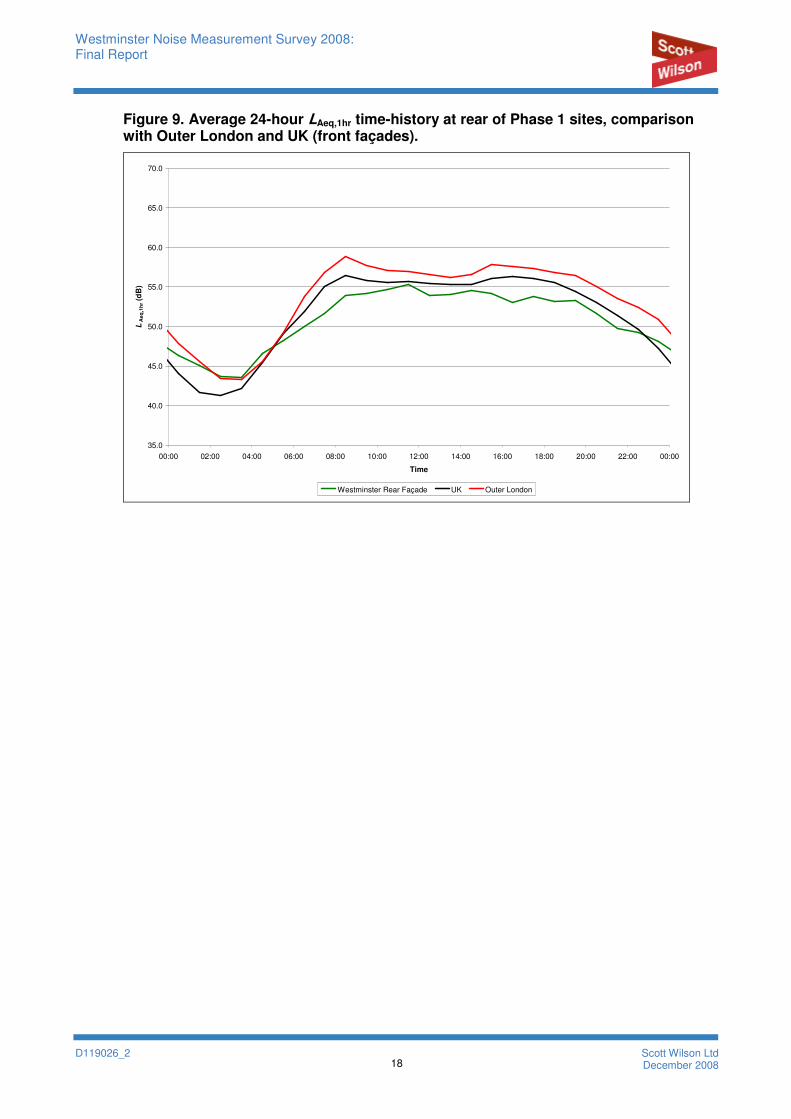
3.4.5 Figure 9 shows a comparison between the average LAeq,1hr time histories for the rear of
Westminster Phase 1 sites, with those for the front of sites in Outer London and the UK.
This shows that Westminster average noise levels are slightly lower than the Outer London
and UK figures during most of the day, with this difference reducing through the night, and
disappearing all together for a period of two hours during the small hours of the morning.
This is consistent with the data shown in Figure 8 where it can be seen that the difference
between day and night time noise levels is generally less in Westminster than for the Outer
London and UK averages.
Westminster Noise Measurement Survey 2008: Final Report
D119026_2 18
Scott Wilson Ltd December 2008
Figure 9. Average 24-hour LAeq,1hr time-history at rear of Phase 1 sites, comparison with Outer London and UK (front façades).
35.0
40.0
45.0
50.0
55.0
60.0
65.0
70.0
00:00 02:00 04:00 06:00 08:00 10:00 12:00 14:00 16:00 18:00 20:00 22:00 00:00
Time
LA
eq
,1h
r (d
B)
Westminster Rear Façade UK Outer London
Westminster Noise Measurement Survey 2008: Final Report
D119026_2 19
Scott Wilson Ltd December 2008
4. PHASE 2 RESULTS
4.1 Phase 2
4.1.1 Phase 2 of the 2008 Westminster Noise Measurement Survey consisted of measurements
at a further 15 locations in the Central Activities Zone (CAZ) and its borders. These
locations were selected by Westminster City Council as areas of interest representative of
the CAZ. As for Phase 1 of the survey, measurements were undertaken at both the front
and rear of one residential property at each location.
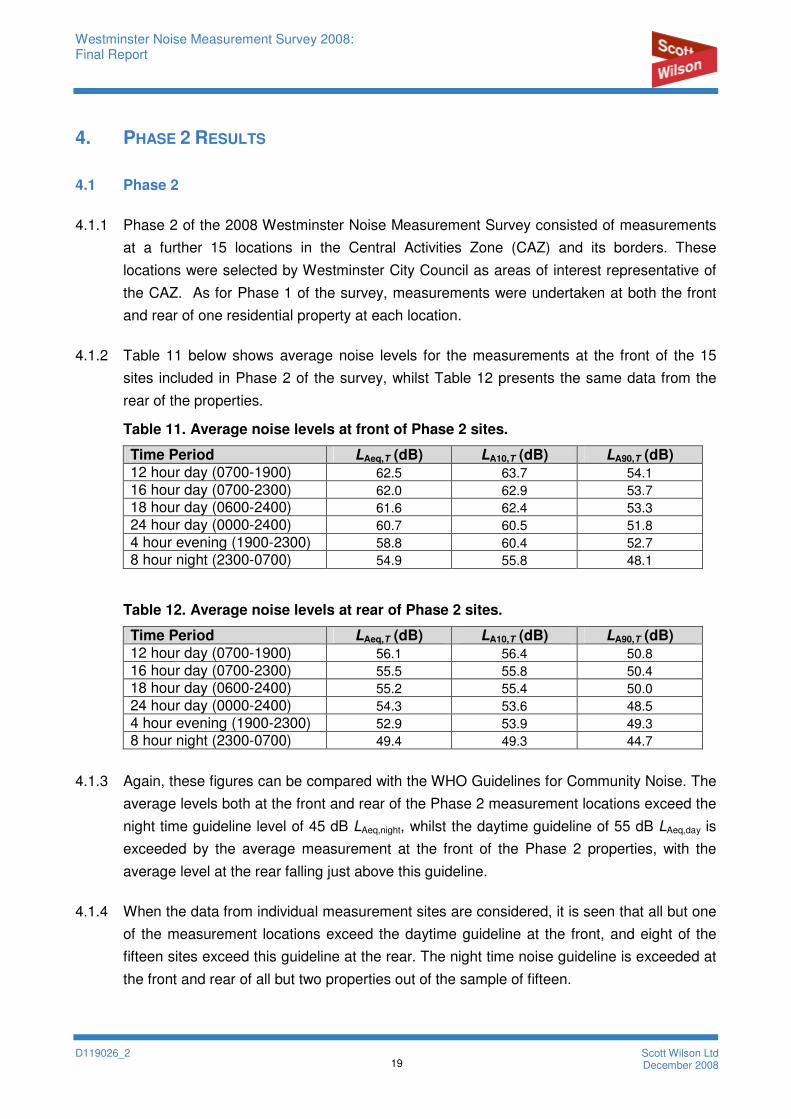
4.1.2 Table 11 below shows average noise levels for the measurements at the front of the 15
sites included in Phase 2 of the survey, whilst Table 12 presents the same data from the
rear of the properties.
Table 11. Average noise levels at front of Phase 2 sites.
Time Period LAeq,T (dB) LA10,T (dB) LA90,T (dB) 12 hour day (0700-1900) 62.5 63.7 54.1
16 hour day (0700-2300) 62.0 62.9 53.7
18 hour day (0600-2400) 61.6 62.4 53.3
24 hour day (0000-2400) 60.7 60.5 51.8
4 hour evening (1900-2300) 58.8 60.4 52.7
8 hour night (2300-0700) 54.9 55.8 48.1
Table 12. Average noise levels at rear of Phase 2 sites.
Time Period LAeq,T (dB) LA10,T (dB) LA90,T (dB) 12 hour day (0700-1900) 56.1 56.4 50.8
16 hour day (0700-2300) 55.5 55.8 50.4
18 hour day (0600-2400) 55.2 55.4 50.0
24 hour day (0000-2400) 54.3 53.6 48.5
4 hour evening (1900-2300) 52.9 53.9 49.3
8 hour night (2300-0700) 49.4 49.3 44.7
4.1.3 Again, these figures can be compared with the WHO Guidelines for Community Noise. The
average levels both at the front and rear of the Phase 2 measurement locations exceed the
night time guideline level of 45 dB LAeq,night, whilst the daytime guideline of 55 dB LAeq,day is
exceeded by the average measurement at the front of the Phase 2 properties, with the
average level at the rear falling just above this guideline.
4.1.4 When the data from individual measurement sites are considered, it is seen that all but one
of the measurement locations exceed the daytime guideline at the front, and eight of the
fifteen sites exceed this guideline at the rear. The night time noise guideline is exceeded at
the front and rear of all but two properties out of the sample of fifteen.
Westminster Noise Measurement Survey 2008: Final Report
D119026_2 20
Scott Wilson Ltd December 2008
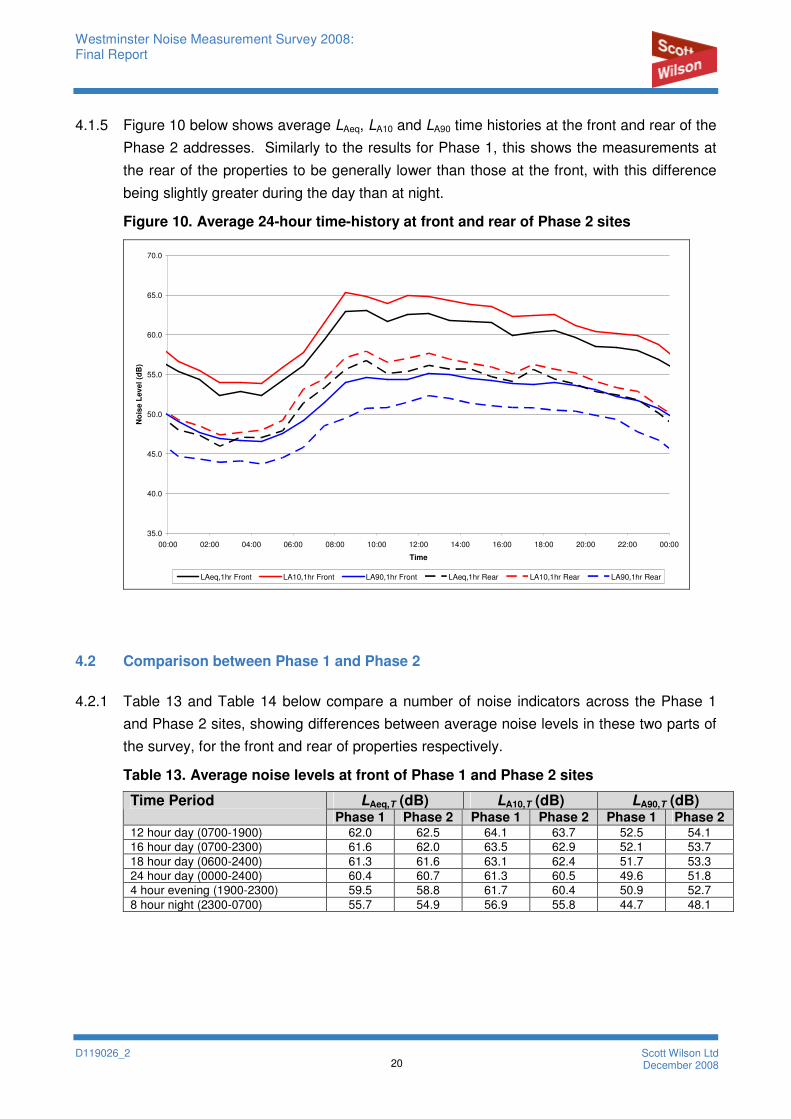
4.1.5 Figure 10 below shows average LAeq, LA10 and LA90 time histories at the front and rear of the
Phase 2 addresses. Similarly to the results for Phase 1, this shows the measurements at
the rear of the properties to be generally lower than those at the front, with this difference
being slightly greater during the day than at night.
Figure 10. Average 24-hour time-history at front and rear of Phase 2 sites
35.0
40.0
45.0
50.0
55.0
60.0
65.0
70.0
00:00 02:00 04:00 06:00 08:00 10:00 12:00 14:00 16:00 18:00 20:00 22:00 00:00
Time
No
ise L
ev
el
(dB
)
LAeq,1hr Front LA10,1hr Front LA90,1hr Front LAeq,1hr Rear LA10,1hr Rear LA90,1hr Rear
4.2 Comparison between Phase 1 and Phase 2
4.2.1 Table 13 and Table 14 below compare a number of noise indicators across the Phase 1
and Phase 2 sites, showing differences between average noise levels in these two parts of
the survey, for the front and rear of properties respectively.
Table 13. Average noise levels at front of Phase 1 and Phase 2 sites
LAeq,T (dB) LA10,T (dB) LA90,T (dB) Time Period Phase 1 Phase 2 Phase 1 Phase 2 Phase 1 Phase 2
12 hour day (0700-1900) 62.0 62.5 64.1 63.7 52.5 54.1 16 hour day (0700-2300) 61.6 62.0 63.5 62.9 52.1 53.7
18 hour day (0600-2400) 61.3 61.6 63.1 62.4 51.7 53.3 24 hour day (0000-2400) 60.4 60.7 61.3 60.5 49.6 51.8
4 hour evening (1900-2300) 59.5 58.8 61.7 60.4 50.9 52.7
8 hour night (2300-0700) 55.7 54.9 56.9 55.8 44.7 48.1
Westminster Noise Measurement Survey 2008: Final Report
D119026_2 21
Scott Wilson Ltd December 2008
Table 14. Average noise levels at rear of Phase 1 and Phase 2 sites.
LAeq,T (dB) LA10,T (dB) LA90,T (dB) Time Period Phase 1 Phase 2 Phase 1 Phase 2 Phase 1 Phase 2
12 hour day (0700-1900) 55.0 56.1 55.7 56.4 47.5 50.8 16 hour day (0700-2300) 54.5 55.5 54.8 55.8 47.3 50.4
18 hour day (0600-2400) 54.2 55.2 54.4 55.4 46.9 50.0 24 hour day (0000-2400) 53.2 54.3 52.8 53.6 45.3 48.5
4 hour evening (1900-2300) 51.8 52.9 52.3 53.9 46.6 49.3
8 hour night (2300-0700) 48.3 49.4 48.7 49.3 41.5 44.7
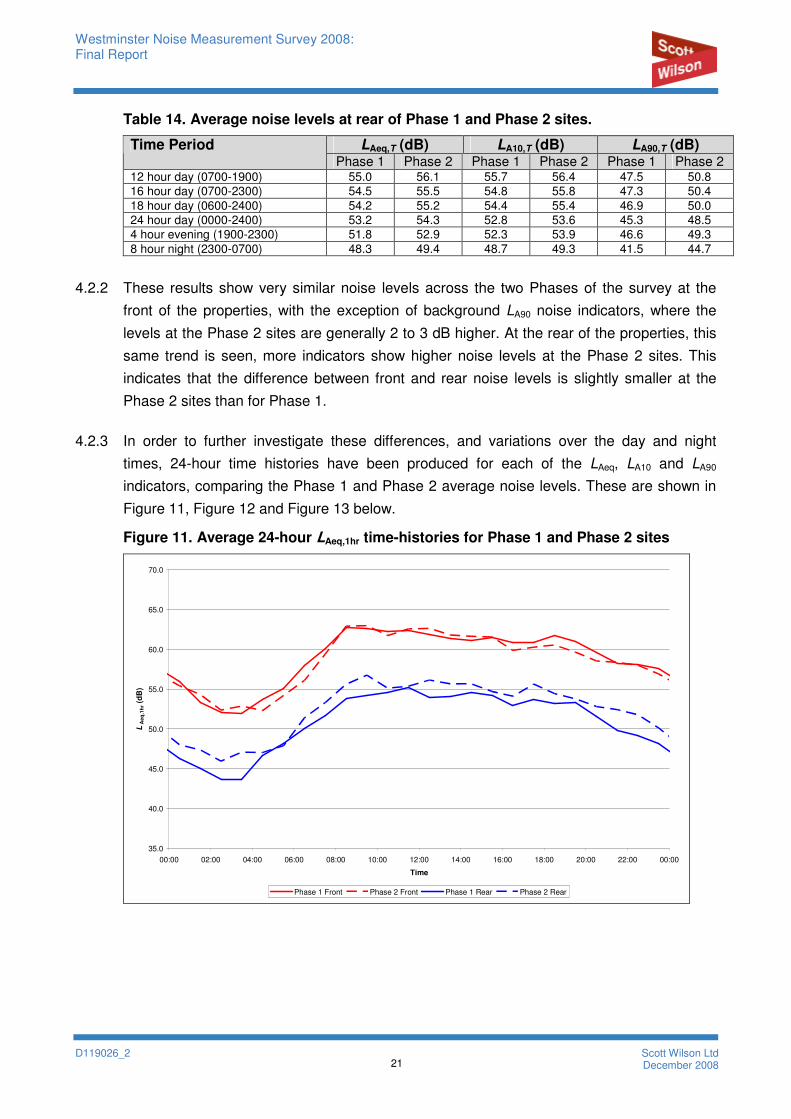
4.2.2 These results show very similar noise levels across the two Phases of the survey at the
front of the properties, with the exception of background LA90 noise indicators, where the
levels at the Phase 2 sites are generally 2 to 3 dB higher. At the rear of the properties, this
same trend is seen, more indicators show higher noise levels at the Phase 2 sites. This
indicates that the difference between front and rear noise levels is slightly smaller at the
Phase 2 sites than for Phase 1.
4.2.3 In order to further investigate these differences, and variations over the day and night
times, 24-hour time histories have been produced for each of the LAeq, LA10 and LA90
indicators, comparing the Phase 1 and Phase 2 average noise levels. These are shown in
Figure 11, Figure 12 and Figure 13 below.
Figure 11. Average 24-hour LAeq,1hr time-histories for Phase 1 and Phase 2 sites
35.0
40.0
45.0
50.0
55.0
60.0
65.0
70.0
00:00 02:00 04:00 06:00 08:00 10:00 12:00 14:00 16:00 18:00 20:00 22:00 00:00
Time
LA
eq
,1h
r (d
B)
Phase 1 Front Phase 2 Front Phase 1 Rear Phase 2 Rear
Westminster Noise Measurement Survey 2008: Final Report
D119026_2 22
Scott Wilson Ltd December 2008
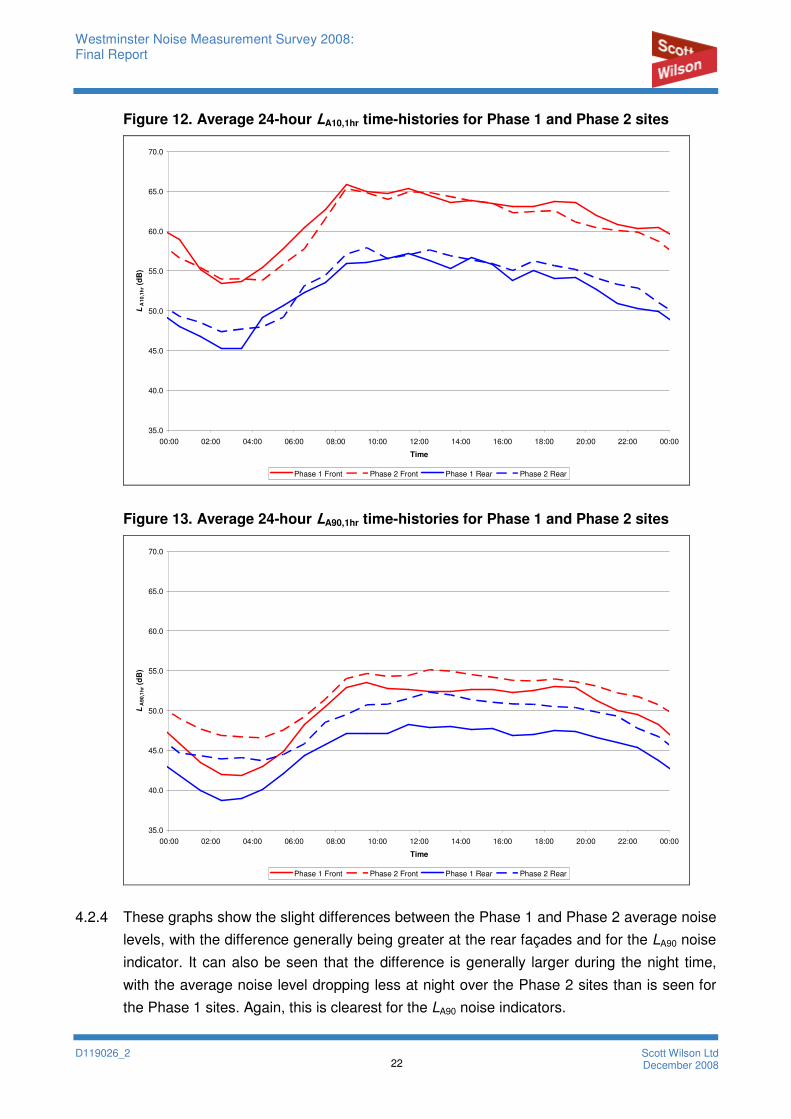
Figure 12. Average 24-hour LA10,1hr time-histories for Phase 1 and Phase 2 sites
35.0
40.0
45.0
50.0
55.0
60.0
65.0
70.0
00:00 02:00 04:00 06:00 08:00 10:00 12:00 14:00 16:00 18:00 20:00 22:00 00:00
Time
LA
10
,1h
r (d
B)
Phase 1 Front Phase 2 Front Phase 1 Rear Phase 2 Rear
Figure 13. Average 24-hour LA90,1hr time-histories for Phase 1 and Phase 2 sites
35.0
40.0
45.0
50.0
55.0
60.0
65.0
70.0
00:00 02:00 04:00 06:00 08:00 10:00 12:00 14:00 16:00 18:00 20:00 22:00 00:00
Time
LA
90
,1h
r (d
B)
Phase 1 Front Phase 2 Front Phase 1 Rear Phase 2 Rear
4.2.4 These graphs show the slight differences between the Phase 1 and Phase 2 average noise
levels, with the difference generally being greater at the rear façades and for the LA90 noise
indicator. It can also be seen that the difference is generally larger during the night time,
with the average noise level dropping less at night over the Phase 2 sites than is seen for
the Phase 1 sites. Again, this is clearest for the LA90 noise indicators.
Westminster Noise Measurement Survey 2008: Final Report
D119026_2 23
Scott Wilson Ltd December 2008
4.2.5 These findings of increased noise levels over Phase 2, with a reduced drop in noise level at
night closely mirror the differences between Westminster and Outer London, which in turn
mirrors the differences between Outer London and the UK.
Westminster Noise Measurement Survey 2008: Final Report
D119026_2 24
Scott Wilson Ltd December 2008
5. AUDIBLE NOISE SOURCES
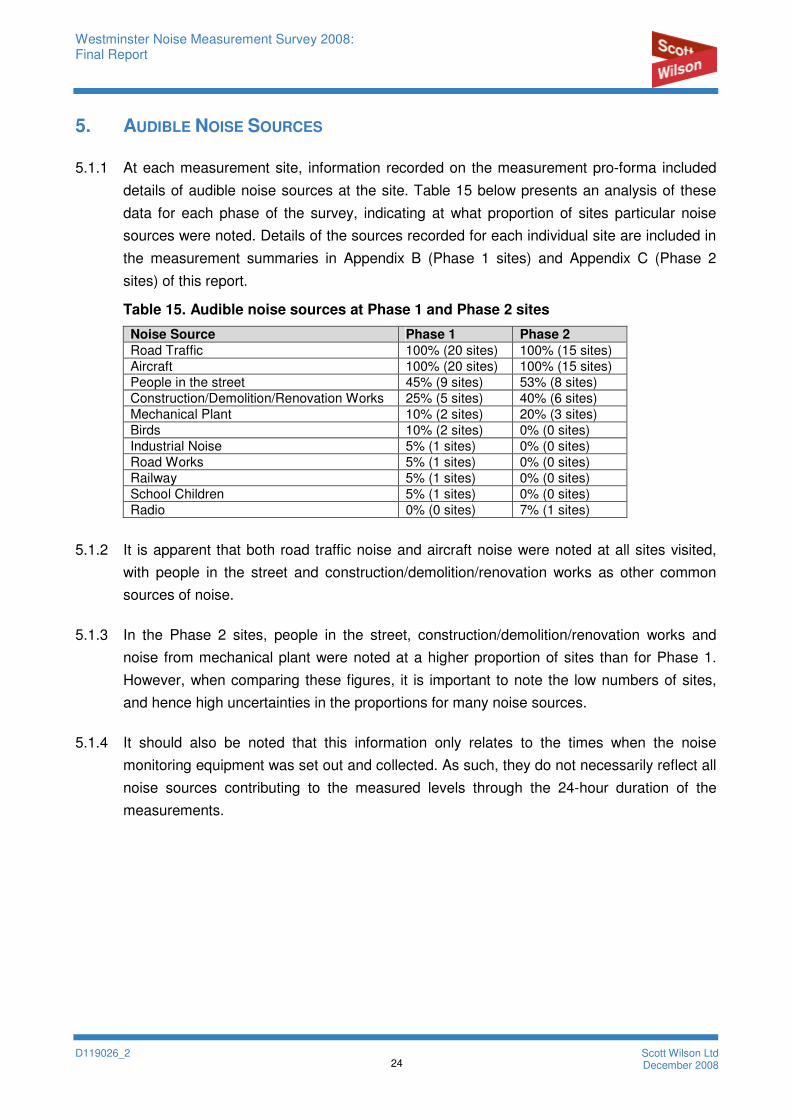
5.1.1 At each measurement site, information recorded on the measurement pro-forma included
details of audible noise sources at the site. Table 15 below presents an analysis of these
data for each phase of the survey, indicating at what proportion of sites particular noise
sources were noted. Details of the sources recorded for each individual site are included in
the measurement summaries in Appendix B (Phase 1 sites) and Appendix C (Phase 2
sites) of this report.
Table 15. Audible noise sources at Phase 1 and Phase 2 sites
Noise Source Phase 1 Phase 2
Road Traffic 100% (20 sites) 100% (15 sites)
Aircraft 100% (20 sites) 100% (15 sites)
People in the street 45% (9 sites) 53% (8 sites)
Construction/Demolition/Renovation Works 25% (5 sites) 40% (6 sites)
Mechanical Plant 10% (2 sites) 20% (3 sites)
Birds 10% (2 sites) 0% (0 sites)
Industrial Noise 5% (1 sites) 0% (0 sites)
Road Works 5% (1 sites) 0% (0 sites)
Railway 5% (1 sites) 0% (0 sites)
School Children 5% (1 sites) 0% (0 sites)
Radio 0% (0 sites) 7% (1 sites)
5.1.2 It is apparent that both road traffic noise and aircraft noise were noted at all sites visited,
with people in the street and construction/demolition/renovation works as other common
sources of noise.
5.1.3 In the Phase 2 sites, people in the street, construction/demolition/renovation works and
noise from mechanical plant were noted at a higher proportion of sites than for Phase 1.
However, when comparing these figures, it is important to note the low numbers of sites,
and hence high uncertainties in the proportions for many noise sources.
5.1.4 It should also be noted that this information only relates to the times when the noise
monitoring equipment was set out and collected. As such, they do not necessarily reflect all
noise sources contributing to the measured levels through the 24-hour duration of the
measurements.
Westminster Noise Measurement Survey 2008: Final Report
D119026_2 25
Scott Wilson Ltd December 2008
6. MAXIMUM NOISE LEVELS
6.1 Analysis of LAFmax, Noise Levels
6.1.1 Further analysis of maximum noise levels at all sites has been undertaken in order to
investigate typical maximum noise levels experienced.
6.1.2 This analysis has been based on 5-minute time periods, as this is the shortest interval for
which data was available at all sites. Where 5-minute maximum noise levels were not
recorded directly, these have been calculated based on 125 ms or 100 ms measurements.
In all cases, LAFmax noise levels have been obtained for each five minute period at each site
(for the front and rear façades separately)e.
6.1.3 In order to put these maximum noise levels in context, they have been compared against
suggested guideline levels.
6.1.4 For the night time period (23:00 to 07:00), the WHO Guidelines for Community Noise6
recommend a maximum of 60 dB LAFmax outside bedroom windows. Hence, the percentage
of 5-minute periods during the night time where this level is exceeded has been calculated
at each site.
6.1.5 No similar guidance on LAFmax noise levels during the daytime is available. For this period, a
level of 80 dB LAFmax has been used in the analysis, and the number of 5-minute periods
when this is exceeded has been calculated for each site.
6.1.6 It is important to note that the cause of these maximum noise levels cannot be identified. In
some cases, maximum noise levels may come from within the property, or from the
opening/closing of doors at the property, etc.
6.2 Results
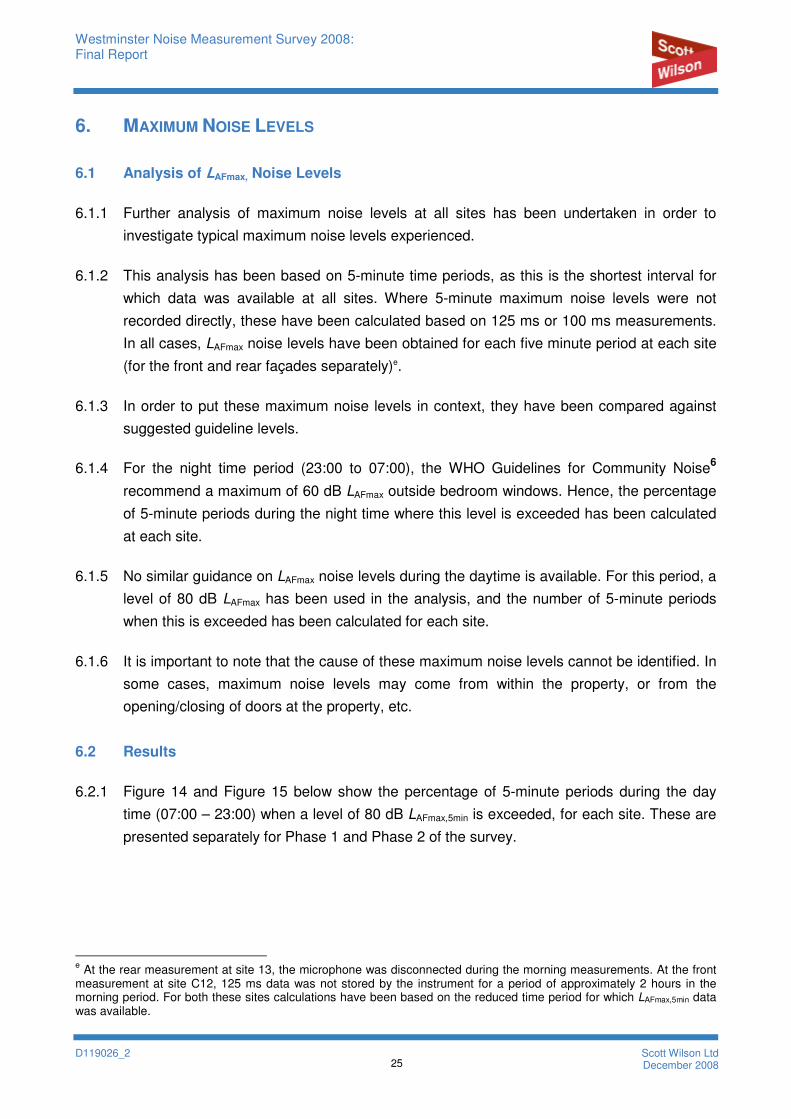
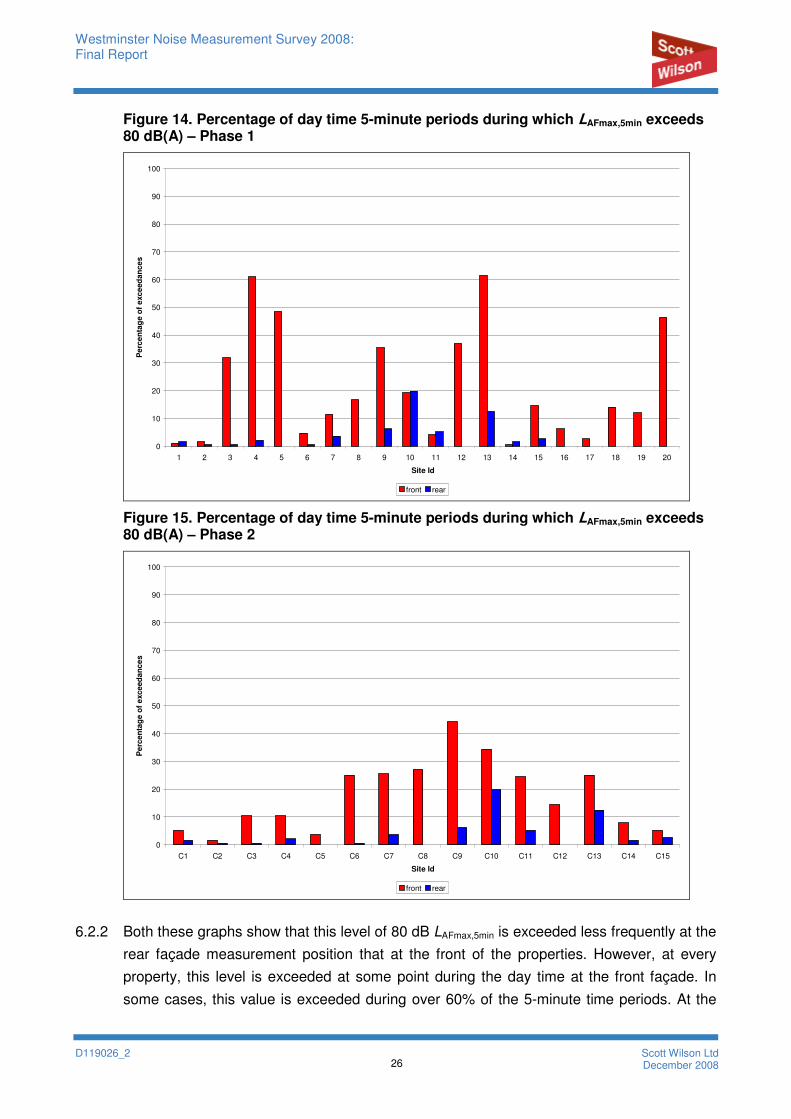
6.2.1 Figure 14 and Figure 15 below show the percentage of 5-minute periods during the day
time (07:00 – 23:00) when a level of 80 dB LAFmax,5min is exceeded, for each site. These are
presented separately for Phase 1 and Phase 2 of the survey.
e At the rear measurement at site 13, the microphone was disconnected during the morning measurements. At the front
measurement at site C12, 125 ms data was not stored by the instrument for a period of approximately 2 hours in the morning period. For both these sites calculations have been based on the reduced time period for which LAFmax,5min data was available.
Westminster Noise Measurement Survey 2008: Final Report
D119026_2 26
Scott Wilson Ltd December 2008
Figure 14. Percentage of day time 5-minute periods during which LAFmax,5min exceeds 80 dB(A) – Phase 1
0
10
20
30
40
50
60
70
80
90
100
1 2 3 4 5 6 7 8 9 10 11 12 13 14 15 16 17 18 19 20
Site Id
Pe
rce
nta
ge o
f e
xc
eed
an
ce
s
front rear
Figure 15. Percentage of day time 5-minute periods during which LAFmax,5min exceeds 80 dB(A) – Phase 2
0
10
20
30
40
50
60
70
80
90
100
C1 C2 C3 C4 C5 C6 C7 C8 C9 C10 C11 C12 C13 C14 C15
Site Id
Pe
rce
nta
ge o
f e
xc
eed
an
ce
s
front rear
6.2.2 Both these graphs show that this level of 80 dB LAFmax,5min is exceeded less frequently at the
rear façade measurement position that at the front of the properties. However, at every
property, this level is exceeded at some point during the day time at the front façade. In
some cases, this value is exceeded during over 60% of the 5-minute time periods. At the
Westminster Noise Measurement Survey 2008: Final Report
D119026_2 27
Scott Wilson Ltd December 2008
majority of rear façades, this level is exceeded at some point during the day, although
never for more than 20% of the 5 minute time periods.
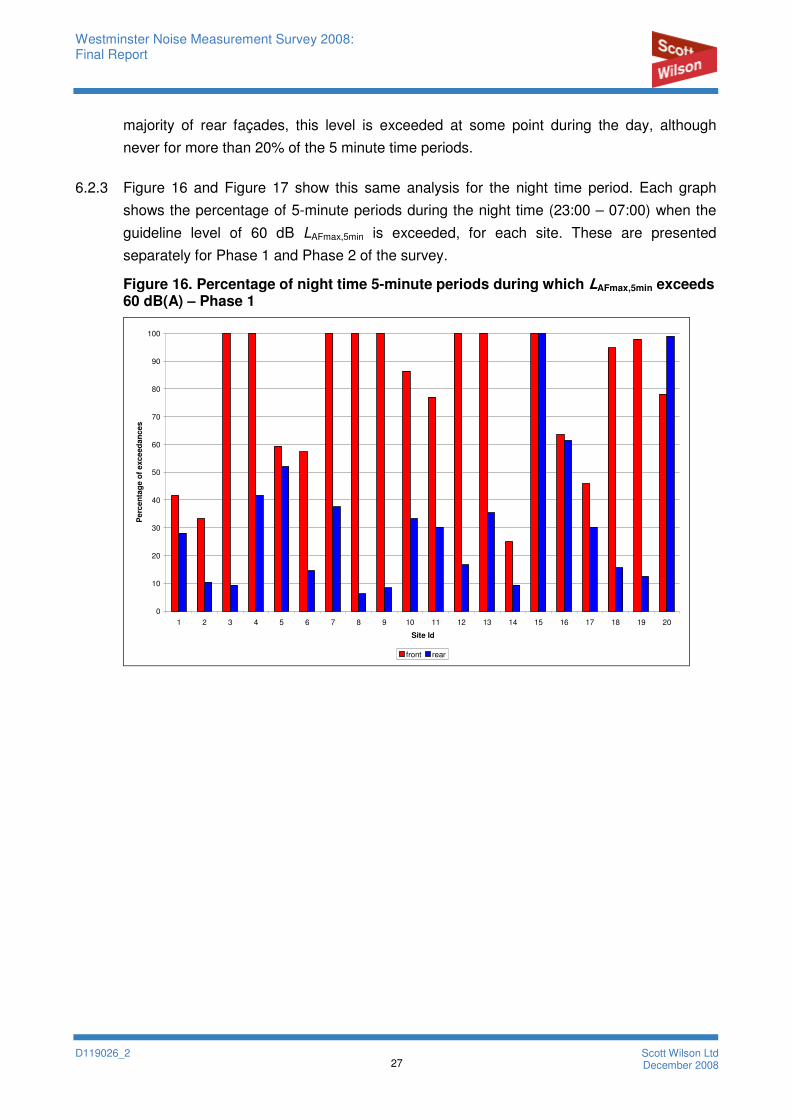
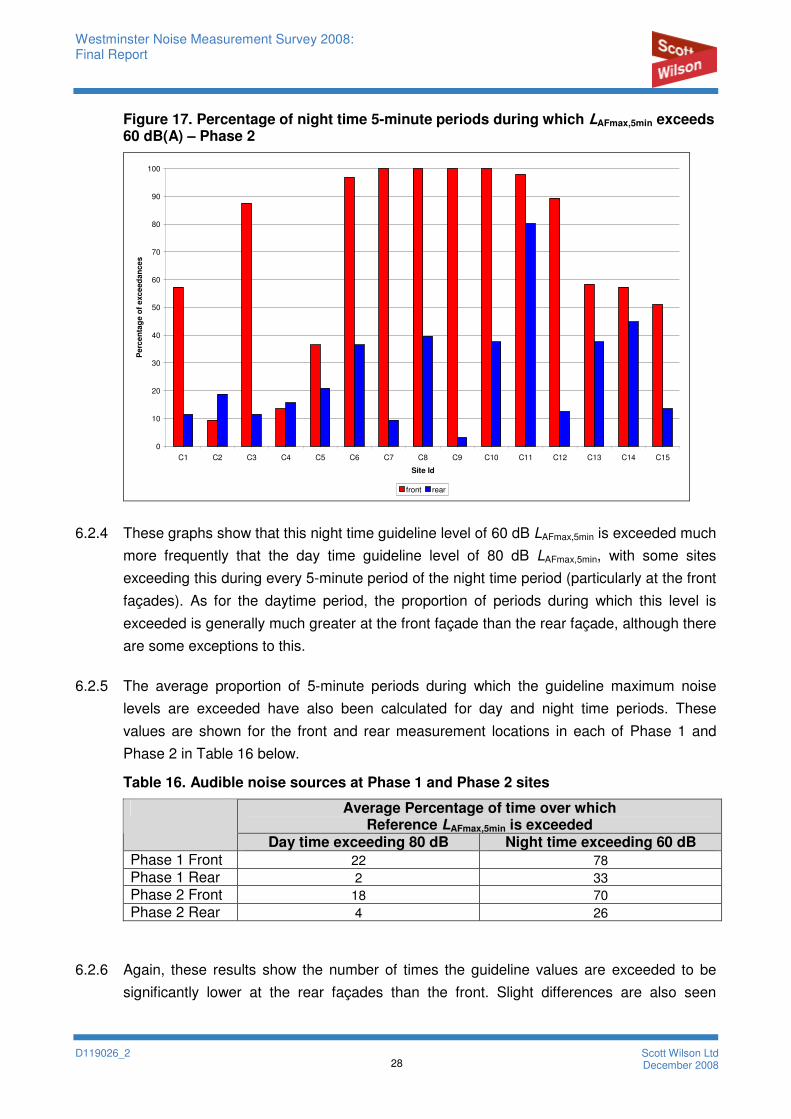
6.2.3 Figure 16 and Figure 17 show this same analysis for the night time period. Each graph
shows the percentage of 5-minute periods during the night time (23:00 – 07:00) when the
guideline level of 60 dB LAFmax,5min is exceeded, for each site. These are presented
separately for Phase 1 and Phase 2 of the survey.
Figure 16. Percentage of night time 5-minute periods during which LAFmax,5min exceeds 60 dB(A) – Phase 1
0
10
20
30
40
50
60
70
80
90
100
1 2 3 4 5 6 7 8 9 10 11 12 13 14 15 16 17 18 19 20
Site Id
Pe
rce
nta
ge o
f e
xc
eed
an
ce
s
front rear
Westminster Noise Measurement Survey 2008: Final Report
D119026_2 28
Scott Wilson Ltd December 2008
Figure 17. Percentage of night time 5-minute periods during which LAFmax,5min exceeds 60 dB(A) – Phase 2
0
10
20
30
40
50
60
70
80
90
100
C1 C2 C3 C4 C5 C6 C7 C8 C9 C10 C11 C12 C13 C14 C15
Site Id
Pe
rce
nta
ge o
f e
xc
eed
an
ce
s
front rear
6.2.4 These graphs show that this night time guideline level of 60 dB LAFmax,5min is exceeded much
more frequently that the day time guideline level of 80 dB LAFmax,5min, with some sites
exceeding this during every 5-minute period of the night time period (particularly at the front
façades). As for the daytime period, the proportion of periods during which this level is
exceeded is generally much greater at the front façade than the rear façade, although there
are some exceptions to this.
6.2.5 The average proportion of 5-minute periods during which the guideline maximum noise
levels are exceeded have also been calculated for day and night time periods. These
values are shown for the front and rear measurement locations in each of Phase 1 and
Phase 2 in Table 16 below.
Table 16. Audible noise sources at Phase 1 and Phase 2 sites
Average Percentage of time over which Reference LAFmax,5min is exceeded
Day time exceeding 80 dB Night time exceeding 60 dB Phase 1 Front 22 78
Phase 1 Rear 2 33
Phase 2 Front 18 70
Phase 2 Rear 4 26
6.2.6 Again, these results show the number of times the guideline values are exceeded to be
significantly lower at the rear façades than the front. Slight differences are also seen
Westminster Noise Measurement Survey 2008: Final Report
D119026_2 29
Scott Wilson Ltd December 2008
between the Phase 1 and Phase 2 sites, with the percentage of the time periods when the
guideline levels are exceeded generally being higher for Phase 1 than Phase 2. Whilst this
appears to be contrary to the findings of generally slightly higher noise levels at the Phase
2 measurement positions, these differences between the two phases are small, and are
unlikely to be statistically significant given the relatively small sample sizes.
Westminster Noise Measurement Survey 2008: Final Report
D119026_2 30
Scott Wilson Ltd December 2008
7. CONCLUSIONS
7.1.1 Key findings from Phase 1 of this survey are:
• Average noise levels from Phase 1 of this survey are slightly below those from the 2003
survey, although it is considered that this is most likely to be due to the different
sampling methodologies used for site selection, and not necessarily an indication that
average noise levels have reduced significantly over this period.
• A comparison with the World Health Organisation Guidelines for Community Noise
shows that average levels at the front of the properties are considerably above these
guidelines. Average noise levels at the rear of properties are significantly lower than
those at the front, being just below the daytime guideline of 55 dB LAeq,day and
approximately 3 dB above the night time guideline level.
• Eighteen out of the twenty front measurement sites exceed the day-time WHO guideline
figure of 55 dB LAeq and all of the 20 front measurement sites exceed the night-time
guideline figure of 45 dB LAeq.
• At the rear location, six sites out of the twenty in Phase 1 exceed the WHO day-time
guideline, whilst all but three sites exceed the night-time guideline.
• Significantly higher average noise levels within Westminster than in either outer London
or the UK. These differences are generally largest during the night time (with the
difference between noise levels during the day and night smaller in Westminster), and
for the LA90 noise indicators.
7.1.2 Phase 2, looking at noise levels in typical locations within and close to the Central Activities
Zone has shown key findings including:
• Some small differences are seen between the data for the two phases, with the Phase
2 sites showing slightly higher noise levels, for the following indicators:
o Night time noise levels higher at Phase 2 sites, with a smaller difference
between day and night time noise levels.
o LA90 indicators higher at Phase 2 sites at many times of the day.
o Higher noise levels for many indicators at the rear of Phase 2 sites, compared to
the rear of Phase 1 sites.
Westminster Noise Measurement Survey 2008: Final Report
D119026_2 31
Scott Wilson Ltd December 2008
8. RECOMMENDATIONS
8.1.1 Particular items of note identified from this survey, which may be worth further investigation
include:
• The difference between front and rear façades in Westminster. This may include further
measurements at a range of different types of location, and/or the collection of
comparative rear façade data for areas outside of Westminster.
• The smaller difference between day time and night time noise levels in Phase 2 than
Phase 1, and in all of Westminster than outer London and the UK average. Further
investigation into this is likely to require further measurements at appropriately selected
sites.
8.1.2 In order to add further value to the large database of noise measurements which exist
within the City of Westminster, both from this survey and from the 2003 Westminster Noise
Survey, the following items may be worth considering for future investigation:
• Repeating further elements of the 2003 Westminster Noise Survey to allow comparison
between 2003 and the present (examples might include repeating more measurements
in the Abbey Road and Bayswater wards, and/or repeating measurements at the 2003
Phase 2 “typical quieter residential sites”).
• Further long term noise measurements at a selection of sites over the City of
Westminster to provide more information on the long term variations in noise levels. As
well as weekday/weekend differences, this could provide more detailed information on
seasonal variations, effects of school holidays, etc.
• Comparison between measured noise levels from the 2008 Westminster Noise
Measurement Survey and predicted noise levels from noise maps (Westminster City
Council noise map and/or Defra London noise map). With the inclusion of front and rear
measurement positions, and the long-term measurement site, a total of 71 locations
would be available for such comparisons.
• Further noise measurements focussing on residential sites affected by specific noise
sources which may be of interest in developing the noise strategy. Examples of noise
sources might include: industrial noise, railway noise, etc.
• Additional manned monitoring to further investigate the contribution of different noise
sources throughout the day.
Westminster Noise Measurement Survey 2008: Final Report
D119026_2 32
Scott Wilson Ltd December 2008
9. REFERENCES
1. Sargent JW, Fothergill LC, The noise climate around our homes, BRE Information Paper
IP21/93.
2. Skinner CJ, Grimwood CJ, The national noise incidence study 2000/2001 (United Kingdom): Volume 1 – Noise Levels; BRE Report No. 206344f.
3. Grimwood CJ, Skinner CJ, Westminster Noise Survey 2003; BRE Report No. 211943f.
4. Skinner CJ, Healey J, Grimwood CJ, London Noise Survey – Phase 1 (2004); BRE Report No. 215080.
5. Skinner CJ, Walls C, London Noise Survey – Four Inner London Boroughs: Analysis of Data from London Noise Survey Phase 1 (2004) and Westminster Noise Survey (2003); BRE Report No, 221083.
6. Guidelines for Community Noise, World Health Organisation, 2000.
Westminster Noise Measurement Survey 2008: Final Report
D119026_2 33
Scott Wilson Ltd December 2008
Appendix A NOISE & VIBRATION TERMINOLOGY AND PERCEPTION
Noise Perception and Terminology
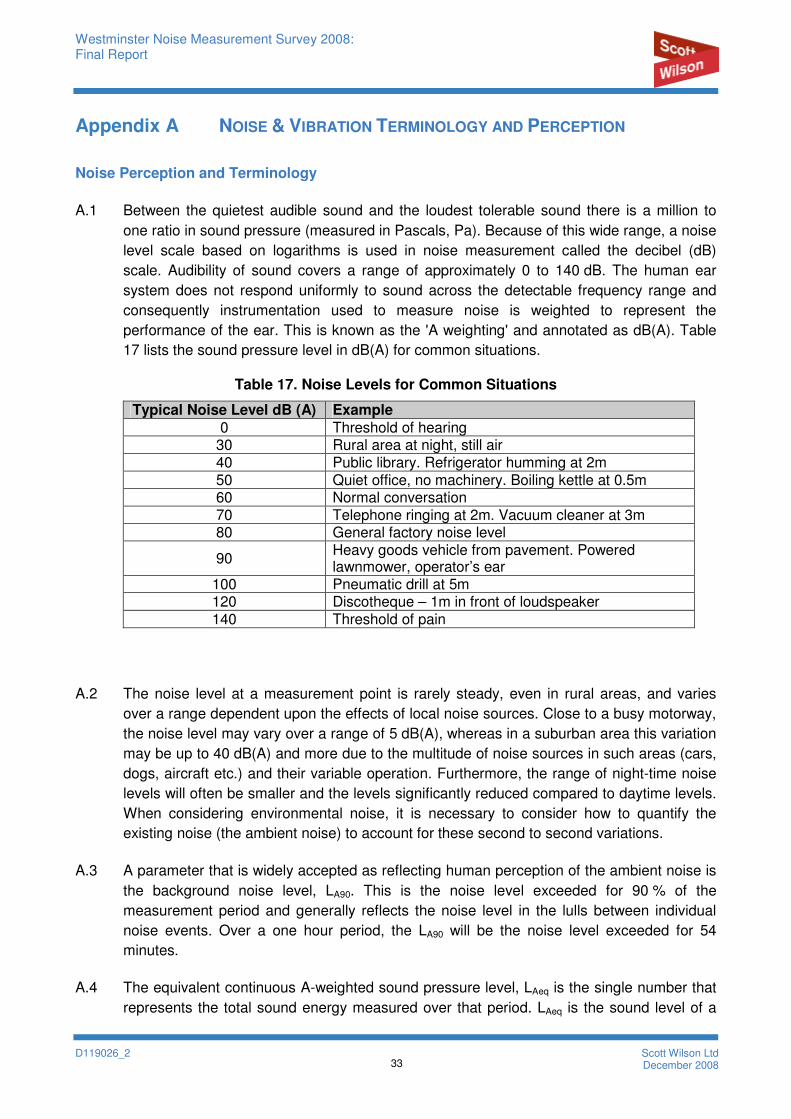
A.1 Between the quietest audible sound and the loudest tolerable sound there is a million to
one ratio in sound pressure (measured in Pascals, Pa). Because of this wide range, a noise
level scale based on logarithms is used in noise measurement called the decibel (dB)
scale. Audibility of sound covers a range of approximately 0 to 140 dB. The human ear
system does not respond uniformly to sound across the detectable frequency range and
consequently instrumentation used to measure noise is weighted to represent the
performance of the ear. This is known as the 'A weighting' and annotated as dB(A). Table
17 lists the sound pressure level in dB(A) for common situations.
Table 17. Noise Levels for Common Situations
Typical Noise Level dB (A) Example
0 Threshold of hearing 30 Rural area at night, still air 40 Public library. Refrigerator humming at 2m 50 Quiet office, no machinery. Boiling kettle at 0.5m 60 Normal conversation 70 Telephone ringing at 2m. Vacuum cleaner at 3m 80 General factory noise level
90 Heavy goods vehicle from pavement. Powered lawnmower, operator’s ear
100 Pneumatic drill at 5m 120 Discotheque – 1m in front of loudspeaker 140 Threshold of pain
A.2 The noise level at a measurement point is rarely steady, even in rural areas, and varies
over a range dependent upon the effects of local noise sources. Close to a busy motorway,
the noise level may vary over a range of 5 dB(A), whereas in a suburban area this variation
may be up to 40 dB(A) and more due to the multitude of noise sources in such areas (cars,
dogs, aircraft etc.) and their variable operation. Furthermore, the range of night-time noise
levels will often be smaller and the levels significantly reduced compared to daytime levels.
When considering environmental noise, it is necessary to consider how to quantify the
existing noise (the ambient noise) to account for these second to second variations.
A.3 A parameter that is widely accepted as reflecting human perception of the ambient noise is
the background noise level, LA90. This is the noise level exceeded for 90 % of the
measurement period and generally reflects the noise level in the lulls between individual
noise events. Over a one hour period, the LA90 will be the noise level exceeded for 54
minutes.
A.4 The equivalent continuous A-weighted sound pressure level, LAeq is the single number that
represents the total sound energy measured over that period. LAeq is the sound level of a
Westminster Noise Measurement Survey 2008: Final Report
D119026_2 34
Scott Wilson Ltd December 2008
notionally steady sound having the same energy as a fluctuating sound over a specified
measurement period. It is commonly used to express the energy level from individual
sources that vary in level over their operational cycle.
A.5 The LA10 noise indicator is the noise level exceeded for 10% of the measurement period,
and is hence an indicator of the higher noise levels experienced, whilst excluding very short
duration high noise levels. This indicator is often used as an indicator of road traffic noise
levels.
A.6 Human subjects are generally only capable of noticing changes in steady levels of no less
than 3 dB(A). It is generally accepted that a change of 10 dB(A) in an overall, steady noise
level is perceived to the human ear as a doubling (or halving) of the noise level. (These
findings do not necessarily apply to transient or non-steady noise sources such as changes
in noise due to changes in road traffic flow, or intermittent noise sources).
Vibration Perception and Terminology
A.7 When an object is in contact with a vibrating surface it is displaced about its reference
(stationary) position. Displacement (in mm) is therefore one parameter that can be used to
describe the magnitude of a vibration. For sinusoidal signals, displacement, velocity (ms-1)
and acceleration (ms-2) amplitudes are related mathematically by a function of frequency
and time. If phase is neglected, as is always the case when making time-average
measurements, then the velocity can be obtained by dividing the acceleration signal by a
factor proportional to frequency (measured in Hertz, Hz) and the displacement can be
obtained by dividing the acceleration signal by a factor proportional to the square of
frequency. Modern electronic integrating meters are capable of providing a wide range of
measurement parameters during any single vibration measurement.
A.8 For a complex acceleration signal giving rise to a complicated time history, there are
several additional quantities which can be used to describe this vibration:
• the peak value is the maximum instantaneous acceleration measured during the
measurement time, T. It is a useful indicator of the magnitude of short duration
shocks;
• the root mean square value (rms) is obtained by taking the square root of the mean
of the sum of the squares of the instantaneous acceleration measured during the
total measurement time, T;
• the peak particle velocity (ppv) is the maximum instantaneous velocity of a particle
at a point during a given time interval;
• the Vibration Dose Value (VDV) is defined in BS 6472: 19926, and is used to assess
the likelihood of adverse comment due to vibration.
6 Since the completion of these measurements, this standard has been superseded by BS 6472:2008 (June 2008). This
new version of the standard uses a different frequency weighting on the vertical (‘z’) axis VDV values.
Westminster Noise Measurement Survey 2008: Final Report
D119026_2 35
Scott Wilson Ltd December 2008
A.9 Human perception to vibration is of the order of 0.15mms-1 to 0.3mms-1 ppv, in the
frequency range 0.1 Hz to 1500 Hz. (The lowest note, ‘A’, on a full size piano keyboard has
a fundamental frequency of 28 Hz). However, the human body is not equally sensitive to all
frequencies of vibration and weighting curves to reflect the frequency dependency of the
body have been developed and are contained within ISO Standards. Those frequencies to
which the human body is most sensitive are given a much heavier weighting than those at
frequencies to which the body is less sensitive. This weighting gives a good correlation
between the measured vibration level and the subjective feeling or impact produced by the
vibration.
A.10 The weightings can be incorporated into modern vibration meters, thus enabling
measurement of vibration levels that correspond to human perception. Those vibrations
occurring between 1-80 Hz are of particular interest when measuring exposure to whole-
body vibration.
A.11 Sensitivity to mechanical vibration is also known to be dependent on the direction of
excitation and also the human body responds differently when standing (longitudinal)
compared to when lying down (lateral). Whole-body vibrations are consequently measured
in the directions of an orthogonal co-ordinate system having its origins at the location of the
heart.
Westminster Noise Measurement Survey 2008: Final Report
D119026_2 36
Scott Wilson Ltd December 2008
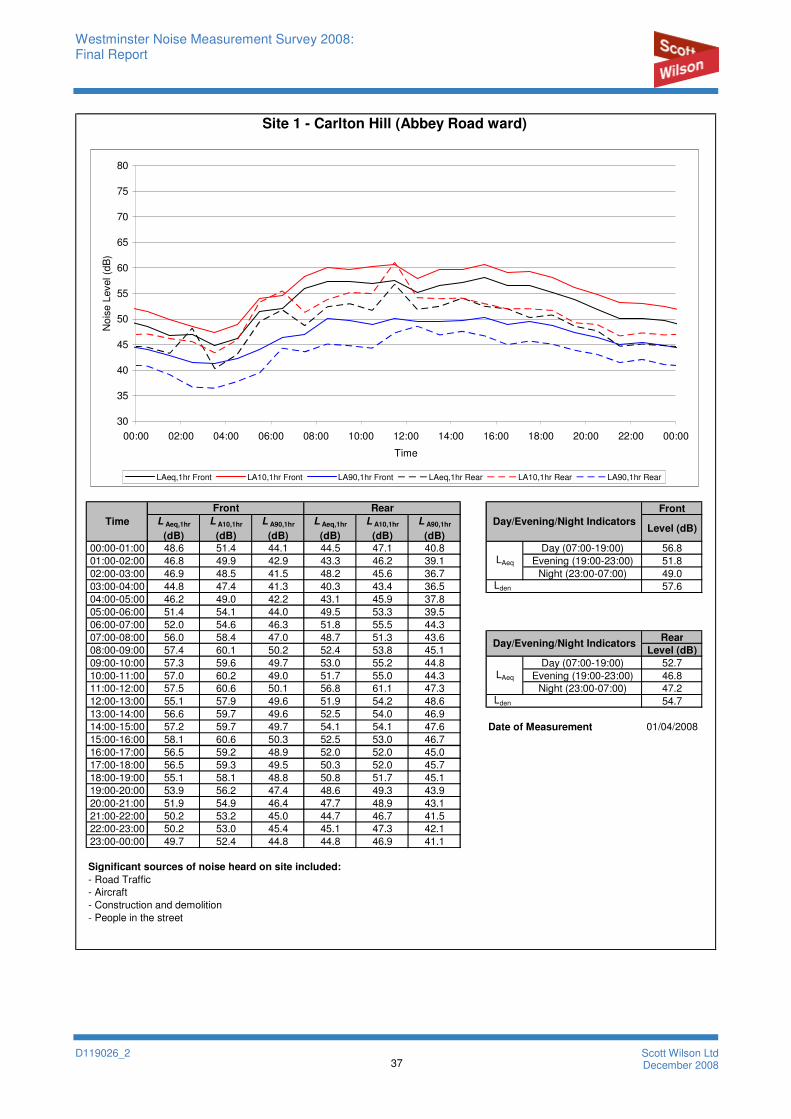
Appendix B SITE-BY-SITE DATA – PHASE 1 SITES
B.1 The following pages contain data sheets from each site within Phase 1 of the survey. Each
sheet contains the following data:
•••• LAeq,1hr, LA10,1hr and LA90,1hr data tabulated over the 24-hour measurement period
for both front and rear measurement positions.
•••• Graphical representation of 24-hour time histories for LAeq,1hr, LA10,1hr and LA90,1hr
noise indicators from both measurement positions.
•••• Day, evening and night average LAeq,T noise levels, and 24-hour weighted
average Lden noise level, again at front and rear of property.
•••• Summary of significant noise sources noted at each site during site visits.
•••• Any other relevant notes and comments from site visits.
Westminster Noise Measurement Survey 2008: Final Report
D119026_2 37
Scott Wilson Ltd December 2008
Front
L Aeq,1hr
(dB)
L A10,1hr
(dB)
L A90,1hr
(dB)
L Aeq,1hr
(dB)
L A10,1hr
(dB)
L A90,1hr
(dB)Level (dB)
00:00-01:00 48.6 51.4 44.1 44.5 47.1 40.8 Day (07:00-19:00) 56.8
01:00-02:00 46.8 49.9 42.9 43.3 46.2 39.1 Evening (19:00-23:00) 51.8
02:00-03:00 46.9 48.5 41.5 48.2 45.6 36.7 Night (23:00-07:00) 49.0
03:00-04:00 44.8 47.4 41.3 40.3 43.4 36.5 57.6
04:00-05:00 46.2 49.0 42.2 43.1 45.9 37.8
05:00-06:00 51.4 54.1 44.0 49.5 53.3 39.5
06:00-07:00 52.0 54.6 46.3 51.8 55.5 44.3
07:00-08:00 56.0 58.4 47.0 48.7 51.3 43.6 Rear
08:00-09:00 57.4 60.1 50.2 52.4 53.8 45.1 Level (dB)
09:00-10:00 57.3 59.6 49.7 53.0 55.2 44.8 Day (07:00-19:00) 52.7
10:00-11:00 57.0 60.2 49.0 51.7 55.0 44.3 Evening (19:00-23:00) 46.8
11:00-12:00 57.5 60.6 50.1 56.8 61.1 47.3 Night (23:00-07:00) 47.2
12:00-13:00 55.1 57.9 49.6 51.9 54.2 48.6 54.7
13:00-14:00 56.6 59.7 49.6 52.5 54.0 46.9
14:00-15:00 57.2 59.7 49.7 54.1 54.1 47.6 Date of Measurement 01/04/2008
15:00-16:00 58.1 60.6 50.3 52.5 53.0 46.7
16:00-17:00 56.5 59.2 48.9 52.0 52.0 45.0
17:00-18:00 56.5 59.3 49.5 50.3 52.0 45.7
18:00-19:00 55.1 58.1 48.8 50.8 51.7 45.1
19:00-20:00 53.9 56.2 47.4 48.6 49.3 43.9
20:00-21:00 51.9 54.9 46.4 47.7 48.9 43.1
21:00-22:00 50.2 53.2 45.0 44.7 46.7 41.5
22:00-23:00 50.2 53.0 45.4 45.1 47.3 42.1
23:00-00:00 49.7 52.4 44.8 44.8 46.9 41.1
Significant sources of noise heard on site included:
- Road Traffic
- Aircraft
- Construction and demolition
- People in the street
LAeq
Lden
LAeq
Lden
Day/Evening/Night Indicators
Time
Site 1 - Carlton Hill (Abbey Road ward)
Front Rear
Day/Evening/Night Indicators
30
35
40
45
50
55
60
65
70
75
80
00:00 02:00 04:00 06:00 08:00 10:00 12:00 14:00 16:00 18:00 20:00 22:00 00:00
Time
No
ise
Level (d
B)
LAeq,1hr Front LA10,1hr Front LA90,1hr Front LAeq,1hr Rear LA10,1hr Rear LA90,1hr Rear
Westminster Noise Measurement Survey 2008: Final Report
D119026_2 38
Scott Wilson Ltd December 2008
Front
L Aeq,1hr
(dB)
L A10,1hr
(dB)
L A90,1hr
(dB)
L Aeq,1hr
(dB)
L A10,1hr
(dB)
L A90,1hr
(dB)Level (dB)
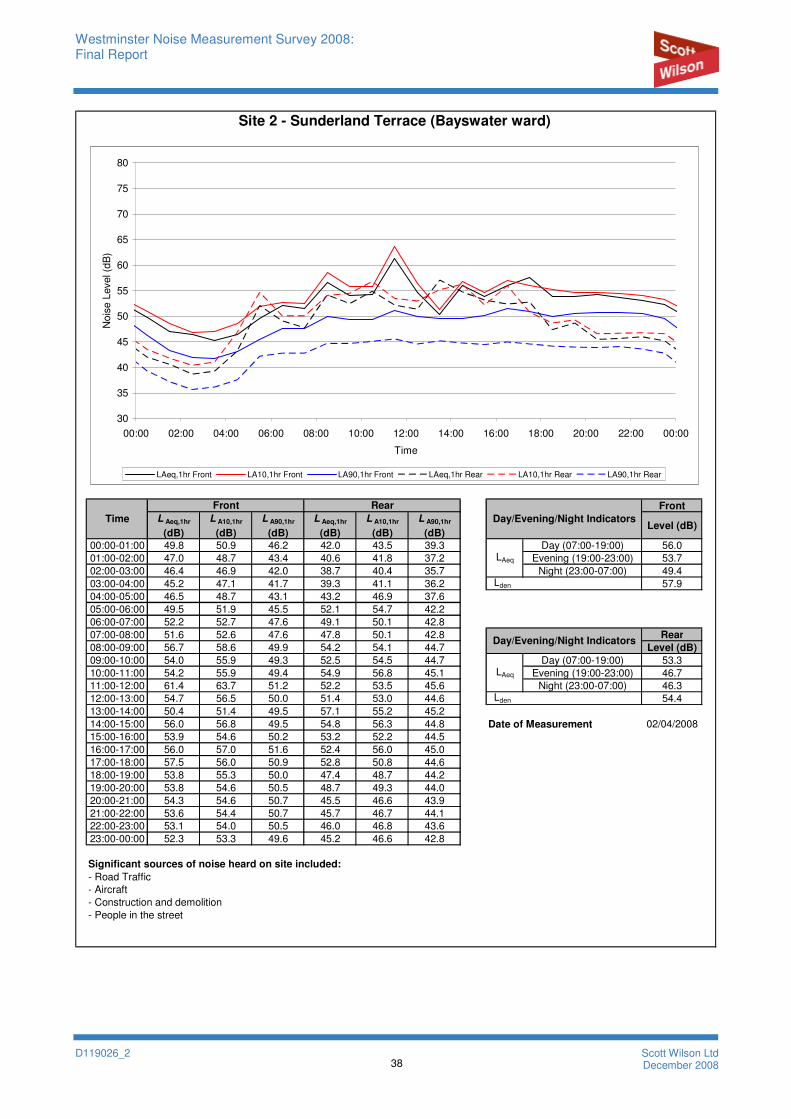
00:00-01:00 49.8 50.9 46.2 42.0 43.5 39.3 Day (07:00-19:00) 56.0
01:00-02:00 47.0 48.7 43.4 40.6 41.8 37.2 Evening (19:00-23:00) 53.7
02:00-03:00 46.4 46.9 42.0 38.7 40.4 35.7 Night (23:00-07:00) 49.4
03:00-04:00 45.2 47.1 41.7 39.3 41.1 36.2 57.9
04:00-05:00 46.5 48.7 43.1 43.2 46.9 37.6
05:00-06:00 49.5 51.9 45.5 52.1 54.7 42.2
06:00-07:00 52.2 52.7 47.6 49.1 50.1 42.8
07:00-08:00 51.6 52.6 47.6 47.8 50.1 42.8 Rear
08:00-09:00 56.7 58.6 49.9 54.2 54.1 44.7 Level (dB)
09:00-10:00 54.0 55.9 49.3 52.5 54.5 44.7 Day (07:00-19:00) 53.3
10:00-11:00 54.2 55.9 49.4 54.9 56.8 45.1 Evening (19:00-23:00) 46.7
11:00-12:00 61.4 63.7 51.2 52.2 53.5 45.6 Night (23:00-07:00) 46.3
12:00-13:00 54.7 56.5 50.0 51.4 53.0 44.6 54.4
13:00-14:00 50.4 51.4 49.5 57.1 55.2 45.2
14:00-15:00 56.0 56.8 49.5 54.8 56.3 44.8 Date of Measurement 02/04/2008
15:00-16:00 53.9 54.6 50.2 53.2 52.2 44.5
16:00-17:00 56.0 57.0 51.6 52.4 56.0 45.0
17:00-18:00 57.5 56.0 50.9 52.8 50.8 44.6
18:00-19:00 53.8 55.3 50.0 47.4 48.7 44.2
19:00-20:00 53.8 54.6 50.5 48.7 49.3 44.0
20:00-21:00 54.3 54.6 50.7 45.5 46.6 43.9
21:00-22:00 53.6 54.4 50.7 45.7 46.7 44.1
22:00-23:00 53.1 54.0 50.5 46.0 46.8 43.6
23:00-00:00 52.3 53.3 49.6 45.2 46.6 42.8
Significant sources of noise heard on site included:
- Road Traffic
- Aircraft
- Construction and demolition
- People in the street
Time
Site 2 - Sunderland Terrace (Bayswater ward)
Front Rear
Day/Evening/Night Indicators
LAeq
Lden
LAeq
Lden
Day/Evening/Night Indicators
30
35
40
45
50
55
60
65
70
75
80
00:00 02:00 04:00 06:00 08:00 10:00 12:00 14:00 16:00 18:00 20:00 22:00 00:00
Time
No
ise
Level (d
B)
LAeq,1hr Front LA10,1hr Front LA90,1hr Front LAeq,1hr Rear LA10,1hr Rear LA90,1hr Rear
Westminster Noise Measurement Survey 2008: Final Report
D119026_2 39
Scott Wilson Ltd December 2008
Front
L Aeq,1hr
(dB)
L A10,1hr
(dB)
L A90,1hr
(dB)
L Aeq,1hr
(dB)
L A10,1hr
(dB)
L A90,1hr
(dB)Level (dB)
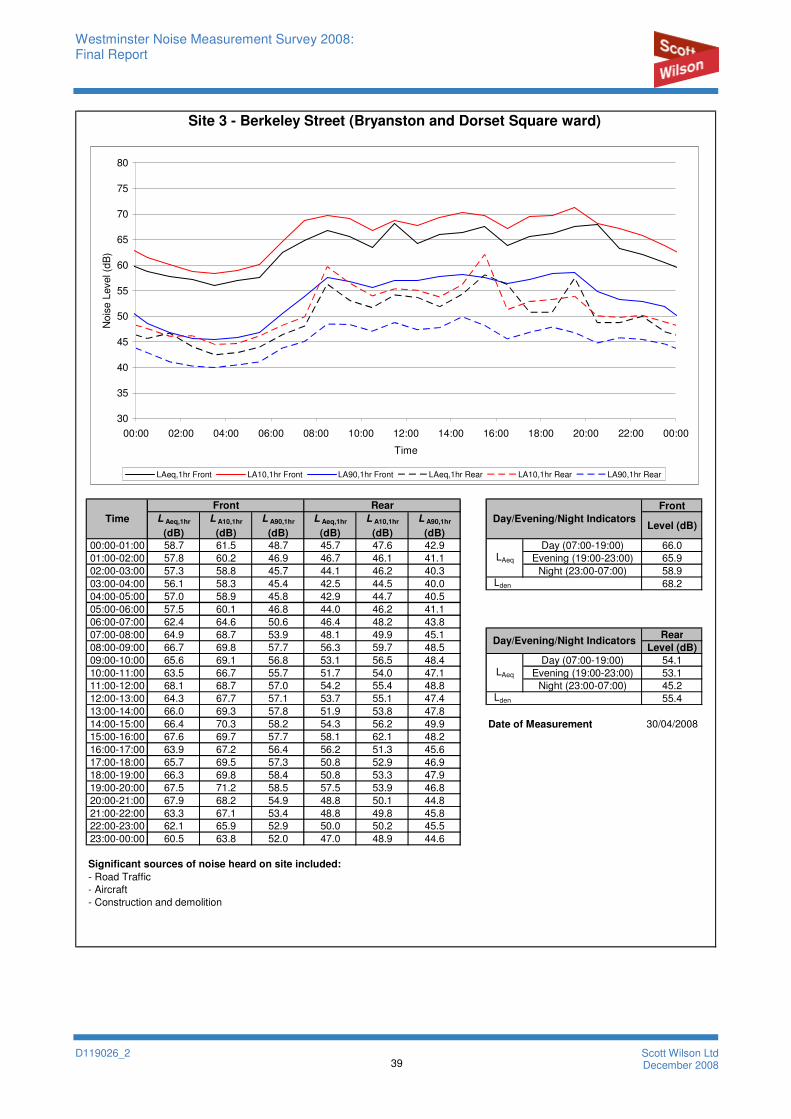
00:00-01:00 58.7 61.5 48.7 45.7 47.6 42.9 Day (07:00-19:00) 66.0
01:00-02:00 57.8 60.2 46.9 46.7 46.1 41.1 Evening (19:00-23:00) 65.9
02:00-03:00 57.3 58.8 45.7 44.1 46.2 40.3 Night (23:00-07:00) 58.9
03:00-04:00 56.1 58.3 45.4 42.5 44.5 40.0 68.2
04:00-05:00 57.0 58.9 45.8 42.9 44.7 40.5
05:00-06:00 57.5 60.1 46.8 44.0 46.2 41.1
06:00-07:00 62.4 64.6 50.6 46.4 48.2 43.8
07:00-08:00 64.9 68.7 53.9 48.1 49.9 45.1 Rear
08:00-09:00 66.7 69.8 57.7 56.3 59.7 48.5 Level (dB)
09:00-10:00 65.6 69.1 56.8 53.1 56.5 48.4 Day (07:00-19:00) 54.1
10:00-11:00 63.5 66.7 55.7 51.7 54.0 47.1 Evening (19:00-23:00) 53.1
11:00-12:00 68.1 68.7 57.0 54.2 55.4 48.8 Night (23:00-07:00) 45.2
12:00-13:00 64.3 67.7 57.1 53.7 55.1 47.4 55.4
13:00-14:00 66.0 69.3 57.8 51.9 53.8 47.8
14:00-15:00 66.4 70.3 58.2 54.3 56.2 49.9 Date of Measurement 30/04/2008
15:00-16:00 67.6 69.7 57.7 58.1 62.1 48.2
16:00-17:00 63.9 67.2 56.4 56.2 51.3 45.6
17:00-18:00 65.7 69.5 57.3 50.8 52.9 46.9
18:00-19:00 66.3 69.8 58.4 50.8 53.3 47.9
19:00-20:00 67.5 71.2 58.5 57.5 53.9 46.8
20:00-21:00 67.9 68.2 54.9 48.8 50.1 44.8
21:00-22:00 63.3 67.1 53.4 48.8 49.8 45.8
22:00-23:00 62.1 65.9 52.9 50.0 50.2 45.5
23:00-00:00 60.5 63.8 52.0 47.0 48.9 44.6
Significant sources of noise heard on site included:
- Road Traffic
- Aircraft
- Construction and demolition
LAeq
Lden
LAeq
Lden
Day/Evening/Night Indicators
Time
Site 3 - Berkeley Street (Bryanston and Dorset Square ward)
Front Rear
Day/Evening/Night Indicators
30
35
40
45
50
55
60
65
70
75
80
00:00 02:00 04:00 06:00 08:00 10:00 12:00 14:00 16:00 18:00 20:00 22:00 00:00
Time
No
ise
Level (d
B)
LAeq,1hr Front LA10,1hr Front LA90,1hr Front LAeq,1hr Rear LA10,1hr Rear LA90,1hr Rear
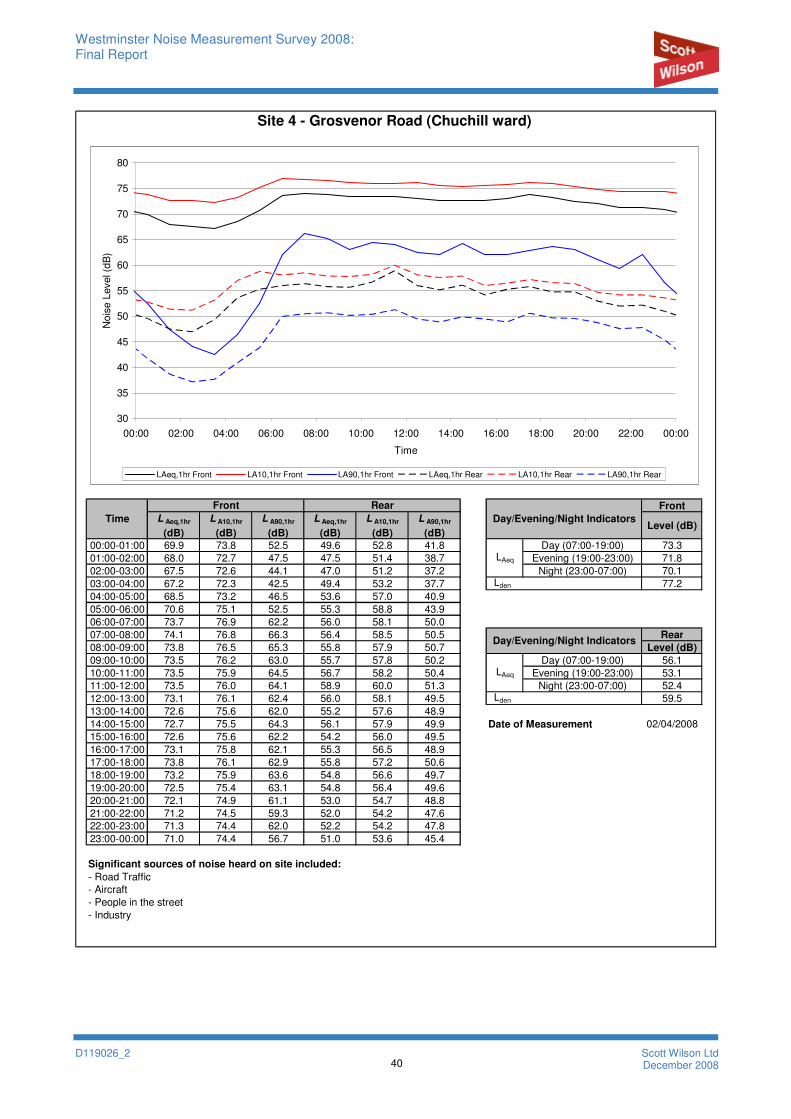
Westminster Noise Measurement Survey 2008: Final Report
D119026_2 40
Scott Wilson Ltd December 2008
Front
L Aeq,1hr
(dB)
L A10,1hr
(dB)
L A90,1hr
(dB)
L Aeq,1hr
(dB)
L A10,1hr
(dB)
L A90,1hr
(dB)Level (dB)
00:00-01:00 69.9 73.8 52.5 49.6 52.8 41.8 Day (07:00-19:00) 73.3
01:00-02:00 68.0 72.7 47.5 47.5 51.4 38.7 Evening (19:00-23:00) 71.8
02:00-03:00 67.5 72.6 44.1 47.0 51.2 37.2 Night (23:00-07:00) 70.1
03:00-04:00 67.2 72.3 42.5 49.4 53.2 37.7 77.2
04:00-05:00 68.5 73.2 46.5 53.6 57.0 40.9
05:00-06:00 70.6 75.1 52.5 55.3 58.8 43.9
06:00-07:00 73.7 76.9 62.2 56.0 58.1 50.0
07:00-08:00 74.1 76.8 66.3 56.4 58.5 50.5 Rear
08:00-09:00 73.8 76.5 65.3 55.8 57.9 50.7 Level (dB)
09:00-10:00 73.5 76.2 63.0 55.7 57.8 50.2 Day (07:00-19:00) 56.1
10:00-11:00 73.5 75.9 64.5 56.7 58.2 50.4 Evening (19:00-23:00) 53.1
11:00-12:00 73.5 76.0 64.1 58.9 60.0 51.3 Night (23:00-07:00) 52.4
12:00-13:00 73.1 76.1 62.4 56.0 58.1 49.5 59.5
13:00-14:00 72.6 75.6 62.0 55.2 57.6 48.9
14:00-15:00 72.7 75.5 64.3 56.1 57.9 49.9 Date of Measurement 02/04/2008
15:00-16:00 72.6 75.6 62.2 54.2 56.0 49.5
16:00-17:00 73.1 75.8 62.1 55.3 56.5 48.9
17:00-18:00 73.8 76.1 62.9 55.8 57.2 50.6
18:00-19:00 73.2 75.9 63.6 54.8 56.6 49.7
19:00-20:00 72.5 75.4 63.1 54.8 56.4 49.6
20:00-21:00 72.1 74.9 61.1 53.0 54.7 48.8
21:00-22:00 71.2 74.5 59.3 52.0 54.2 47.6
22:00-23:00 71.3 74.4 62.0 52.2 54.2 47.8
23:00-00:00 71.0 74.4 56.7 51.0 53.6 45.4
Significant sources of noise heard on site included:
- Road Traffic
- Aircraft
- People in the street
- Industry
Time
Site 4 - Grosvenor Road (Chuchill ward)
Front Rear
Day/Evening/Night Indicators
LAeq
Lden
LAeq
Lden
Day/Evening/Night Indicators
30
35
40
45
50
55
60
65
70
75
80
00:00 02:00 04:00 06:00 08:00 10:00 12:00 14:00 16:00 18:00 20:00 22:00 00:00
Time
No
ise
Level (d
B)
LAeq,1hr Front LA10,1hr Front LA90,1hr Front LAeq,1hr Rear LA10,1hr Rear LA90,1hr Rear

Westminster Noise Measurement Survey 2008: Final Report
D119026_2 41
Scott Wilson Ltd December 2008
Front
L Aeq,1hr
(dB)
L A10,1hr
(dB)
L A90,1hr
(dB)
L Aeq,1hr
(dB)
L A10,1hr
(dB)
L A90,1hr
(dB)Level (dB)
00:00-01:00 57.2 62.3 44.2 49.5 52.7 41.1 Day (07:00-19:00) 62.8
01:00-02:00 50.3 51.5 41.6 44.3 47.3 38.9 Evening (19:00-23:00) 58.6
02:00-03:00 48.9 50.0 40.9 42.8 45.8 38.2 Night (23:00-07:00) 55.2
03:00-04:00 50.6 51.0 40.5 43.8 46.9 38.3 63.9
04:00-05:00 51.0 52.1 41.3 49.5 48.6 39.1
05:00-06:00 51.1 52.9 42.5 46.0 48.0 40.1
06:00-07:00 54.9 54.8 45.5 48.9 50.8 43.0
07:00-08:00 60.1 61.3 48.8 50.9 51.7 45.0 Rear
08:00-09:00 67.7 68.0 53.1 61.7 67.0 48.6 Level (dB)
09:00-10:00 63.1 66.1 54.0 55.2 57.5 49.1 Day (07:00-19:00) 55.9
10:00-11:00 64.6 65.2 52.2 53.7 55.9 47.5 Evening (19:00-23:00) 52.3
11:00-12:00 63.7 66.2 53.1 58.4 59.0 48.1 Night (23:00-07:00) 49.1
12:00-13:00 62.6 66.0 51.8 57.3 60.1 48.0 57.4
13:00-14:00 62.1 63.5 52.3 52.7 54.3 48.0
14:00-15:00 60.6 62.8 51.6 52.7 53.7 47.8 Date of Measurement 29/04/2008
15:00-16:00 60.7 62.4 51.9 52.5 53.7 47.7
16:00-17:00 60.3 60.4 51.7 52.2 53.2 48.2
17:00-18:00 58.6 59.3 51.4 53.4 54.6 48.0
18:00-19:00 60.9 62.9 51.8 55.7 56.5 49.0
19:00-20:00 60.7 63.0 52.4 53.1 54.9 49.0
20:00-21:00 58.8 60.8 50.9 54.3 56.5 47.5
21:00-22:00 57.7 57.6 49.2 50.5 51.7 45.5
22:00-23:00 55.8 55.9 47.9 49.9 50.7 44.4
23:00-00:00 61.0 66.3 47.5 54.5 58.1 44.2
Significant sources of noise heard on site included:
- Road Traffic
- Aircraft
- Construction
LAeq
Lden
LAeq
Lden
Day/Evening/Night Indicators
Time
Site 5 - Bernhardt Crescent (Church Street ward)
Front Rear
Day/Evening/Night Indicators
30
35
40
45
50
55
60
65
70
75
80
00:00 02:00 04:00 06:00 08:00 10:00 12:00 14:00 16:00 18:00 20:00 22:00 00:00
Time
No
ise
Level (d
B)
LAeq,1hr Front LA10,1hr Front LA90,1hr Front LAeq,1hr Rear LA10,1hr Rear LA90,1hr Rear

Westminster Noise Measurement Survey 2008: Final Report
D119026_2 42
Scott Wilson Ltd December 2008
Front
L Aeq,1hr
(dB)
L A10,1hr
(dB)
L A90,1hr
(dB)
L Aeq,1hr
(dB)
L A10,1hr
(dB)
L A90,1hr
(dB)Level (dB)
00:00-01:00 45.3 46.1 39.4 42.1 43.5 39.2 Day (07:00-19:00) 53.1
01:00-02:00 45.1 45.2 37.3 39.8 41.5 37.0 Evening (19:00-23:00) 53.1
02:00-03:00 42.5 40.8 35.2 37.8 39.5 34.7 Night (23:00-07:00) 45.6
03:00-04:00 39.4 38.8 34.3 36.4 37.6 33.8 55.2
04:00-05:00 44.5 43.1 35.8 37.8 39.7 34.6
05:00-06:00 45.7 48.2 39.3 43.4 43.1 38.0
06:00-07:00 47.6 46.7 40.9 51.1 54.9 40.0
07:00-08:00 50.0 52.3 41.1 50.8 52.0 40.2 Rear
08:00-09:00 52.9 55.2 41.8 50.8 50.5 41.1 Level (dB)
09:00-10:00 53.7 56.3 42.5 57.0 58.4 42.5 Day (07:00-19:00) 54.4
10:00-11:00 52.9 55.3 41.7 55.5 56.8 41.8 Evening (19:00-23:00) 50.2
11:00-12:00 53.4 55.6 41.1 51.2 53.8 40.5 Night (23:00-07:00) 44.3
12:00-13:00 53.1 53.8 41.6 50.0 52.4 41.3 54.5
13:00-14:00 51.7 54.4 42.3 47.0 50.4 40.4
14:00-15:00 52.8 55.5 43.8 48.9 51.1 42.9 Date of Measurement 24/04/2008
15:00-16:00 52.7 55.2 44.3 49.5 50.6 43.6
16:00-17:00 51.8 54.6 43.8 53.1 50.7 43.4
17:00-18:00 53.5 55.8 44.4 51.5 51.9 43.7
18:00-19:00 55.9 57.0 44.7 61.5 51.6 43.9
19:00-20:00 54.7 56.7 44.4 53.9 51.8 43.3
20:00-21:00 53.1 54.6 43.7 50.7 49.5 43.2
21:00-22:00 51.2 52.9 42.5 44.9 46.8 42.3
22:00-23:00 52.5 51.6 41.8 44.6 45.9 41.6
23:00-00:00 48.9 51.4 41.2 43.6 45.4 40.8
Significant sources of noise heard on site included:
- Road Traffic
- Aircraft
Time
Site 6 - Portnall Road (Harrow Road ward)
Front Rear
Day/Evening/Night Indicators
LAeq
Lden
LAeq
Lden
Day/Evening/Night Indicators
30
35
40
45
50
55
60
65
70
75
80
00:00 02:00 04:00 06:00 08:00 10:00 12:00 14:00 16:00 18:00 20:00 22:00 00:00
Time
No
ise
Level (d
B)
LAeq,1hr Front LA10,1hr Front LA90,1hr Front LAeq,1hr Rear LA10,1hr Rear LA90,1hr Rear
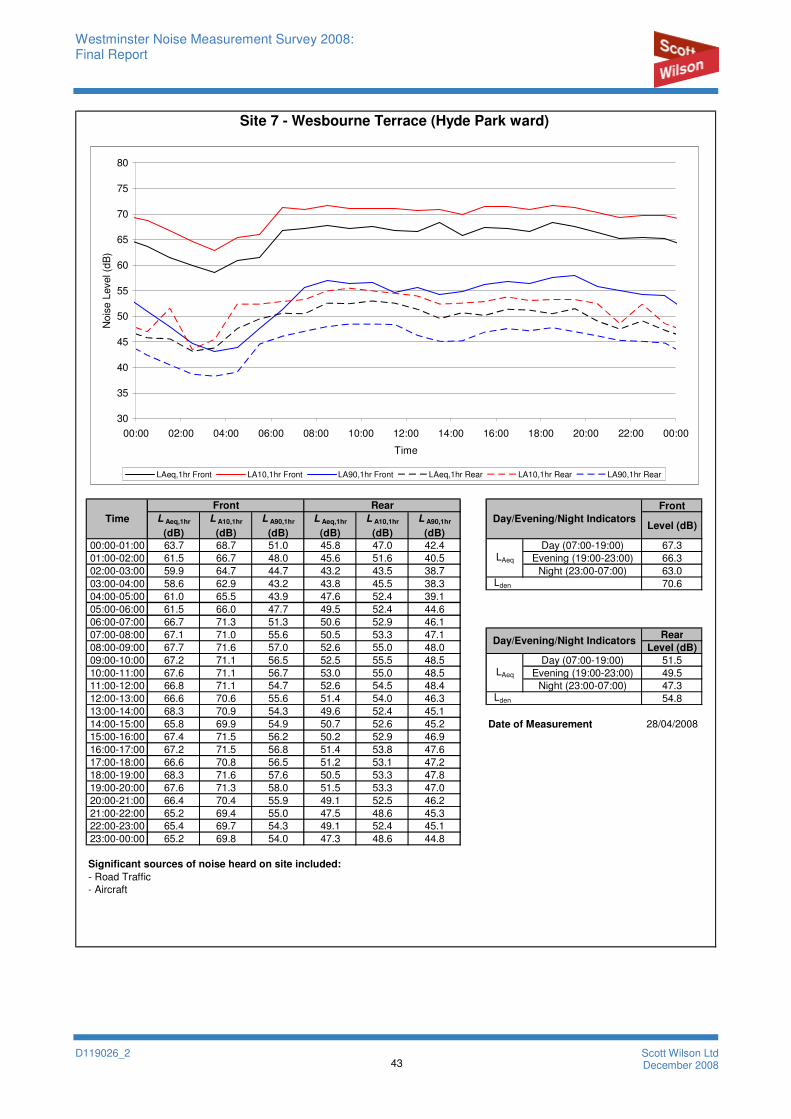
Westminster Noise Measurement Survey 2008: Final Report
D119026_2 43
Scott Wilson Ltd December 2008
Front
L Aeq,1hr
(dB)
L A10,1hr
(dB)
L A90,1hr
(dB)
L Aeq,1hr
(dB)
L A10,1hr
(dB)
L A90,1hr
(dB)Level (dB)
00:00-01:00 63.7 68.7 51.0 45.8 47.0 42.4 Day (07:00-19:00) 67.3
01:00-02:00 61.5 66.7 48.0 45.6 51.6 40.5 Evening (19:00-23:00) 66.3
02:00-03:00 59.9 64.7 44.7 43.2 43.5 38.7 Night (23:00-07:00) 63.0
03:00-04:00 58.6 62.9 43.2 43.8 45.5 38.3 70.6
04:00-05:00 61.0 65.5 43.9 47.6 52.4 39.1
05:00-06:00 61.5 66.0 47.7 49.5 52.4 44.6
06:00-07:00 66.7 71.3 51.3 50.6 52.9 46.1
07:00-08:00 67.1 71.0 55.6 50.5 53.3 47.1 Rear
08:00-09:00 67.7 71.6 57.0 52.6 55.0 48.0 Level (dB)
09:00-10:00 67.2 71.1 56.5 52.5 55.5 48.5 Day (07:00-19:00) 51.5
10:00-11:00 67.6 71.1 56.7 53.0 55.0 48.5 Evening (19:00-23:00) 49.5
11:00-12:00 66.8 71.1 54.7 52.6 54.5 48.4 Night (23:00-07:00) 47.3
12:00-13:00 66.6 70.6 55.6 51.4 54.0 46.3 54.8
13:00-14:00 68.3 70.9 54.3 49.6 52.4 45.1
14:00-15:00 65.8 69.9 54.9 50.7 52.6 45.2 Date of Measurement 28/04/2008
15:00-16:00 67.4 71.5 56.2 50.2 52.9 46.9
16:00-17:00 67.2 71.5 56.8 51.4 53.8 47.6
17:00-18:00 66.6 70.8 56.5 51.2 53.1 47.2
18:00-19:00 68.3 71.6 57.6 50.5 53.3 47.8
19:00-20:00 67.6 71.3 58.0 51.5 53.3 47.0
20:00-21:00 66.4 70.4 55.9 49.1 52.5 46.2
21:00-22:00 65.2 69.4 55.0 47.5 48.6 45.3
22:00-23:00 65.4 69.7 54.3 49.1 52.4 45.1
23:00-00:00 65.2 69.8 54.0 47.3 48.6 44.8
Significant sources of noise heard on site included:
- Road Traffic
- Aircraft
LAeq
Lden
LAeq
Lden
Day/Evening/Night Indicators
Time
Site 7 - Wesbourne Terrace (Hyde Park ward)
Front Rear
Day/Evening/Night Indicators
30
35
40
45
50
55
60
65
70
75
80
00:00 02:00 04:00 06:00 08:00 10:00 12:00 14:00 16:00 18:00 20:00 22:00 00:00
Time
No
ise
Level (d
B)
LAeq,1hr Front LA10,1hr Front LA90,1hr Front LAeq,1hr Rear LA10,1hr Rear LA90,1hr Rear

Westminster Noise Measurement Survey 2008: Final Report
D119026_2 44
Scott Wilson Ltd December 2008
Front
L Aeq,1hr
(dB)
L A10,1hr
(dB)
L A90,1hr
(dB)
L Aeq,1hr
(dB)
L A10,1hr
(dB)
L A90,1hr
(dB)Level (dB)
00:00-01:00 49.5 52.7 41.1 46.4 48.3 40.8 Day (07:00-19:00) 55.9
01:00-02:00 44.3 47.3 38.9 48.2 51.7 39.5 Evening (19:00-23:00) 52.3
02:00-03:00 42.8 45.8 38.2 43.7 45.1 39.3 Night (23:00-07:00) 49.1
03:00-04:00 43.8 46.9 38.3 42.8 44.2 40.3 57.4
04:00-05:00 49.5 48.6 39.1 42.1 43.3 40.7
05:00-06:00 46.0 48.0 40.1 42.0 43.1 44.5
06:00-07:00 48.9 50.8 43.0 43.3 44.3 45.3
07:00-08:00 50.9 51.7 45.0 46.8 48.6 46.4 Rear
08:00-09:00 61.7 67.0 48.6 48.1 50.0 46.2 Level (dB)
09:00-10:00 55.2 57.5 49.1 48.8 51.1 46.1 Day (07:00-19:00) 55.5
10:00-11:00 53.7 55.9 47.5 50.2 53.2 46.0 Evening (19:00-23:00) 48.8
11:00-12:00 58.4 59.0 48.1 54.3 57.0 46.0 Night (23:00-07:00) 45.5
12:00-13:00 57.3 60.1 48.0 49.7 53.5 45.5 55.3
13:00-14:00 52.7 54.3 48.0 50.0 53.3 46.0
14:00-15:00 52.7 53.7 47.8 50.2 53.0 45.8 Date of Measurement 02/04/2008
15:00-16:00 52.5 53.7 47.7 51.0 54.4 47.1
16:00-17:00 52.2 53.2 48.2 48.3 50.3 46.1
17:00-18:00 53.4 54.6 48.0 65.0 67.7 45.9
18:00-19:00 55.7 56.5 49.0 48.7 51.4 45.3
19:00-20:00 53.1 54.9 49.0 50.5 55.2 45.2
20:00-21:00 54.3 56.5 47.5 49.4 52.1 45.4
21:00-22:00 50.5 51.7 45.5 46.7 47.9 45.0
22:00-23:00 49.9 50.7 44.4 47.9 49.3 43.7
23:00-00:00 54.5 58.1 44.2 48.9 51.7 42.1
Significant sources of noise heard on site included:
- Road Traffic
- Aircraft
- People in the street
Time
Site 8 - Wilton Street (Knightsbridge and Belgravia ward)
Front Rear
Day/Evening/Night Indicators
LAeq
Lden
LAeq
Lden
Day/Evening/Night Indicators
30
35
40
45
50
55
60
65
70
75
80
00:00 02:00 04:00 06:00 08:00 10:00 12:00 14:00 16:00 18:00 20:00 22:00 00:00
Time
No
ise
Level (d
B)
LAeq,1hr Front LA10,1hr Front LA90,1hr Front LAeq,1hr Rear LA10,1hr Rear LA90,1hr Rear
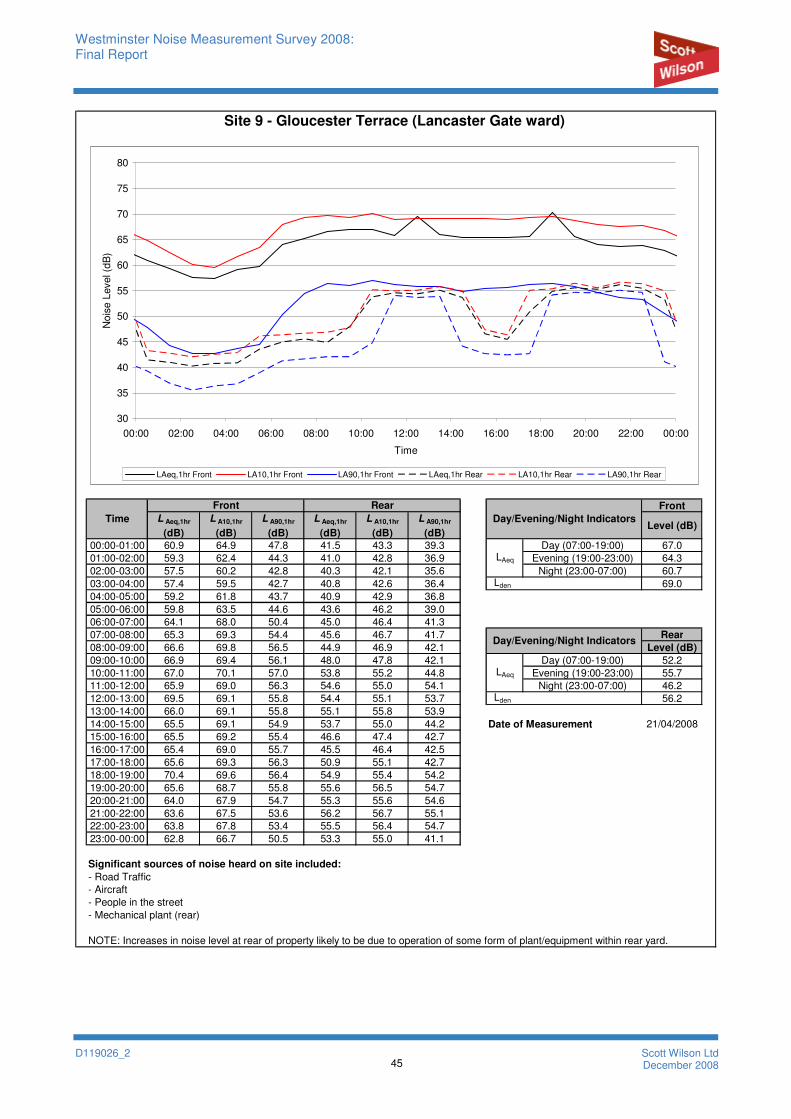
Westminster Noise Measurement Survey 2008: Final Report
D119026_2 45
Scott Wilson Ltd December 2008
Front
L Aeq,1hr
(dB)
L A10,1hr
(dB)
L A90,1hr
(dB)
L Aeq,1hr
(dB)
L A10,1hr
(dB)
L A90,1hr
(dB)Level (dB)
00:00-01:00 60.9 64.9 47.8 41.5 43.3 39.3 Day (07:00-19:00) 67.0
01:00-02:00 59.3 62.4 44.3 41.0 42.8 36.9 Evening (19:00-23:00) 64.3
02:00-03:00 57.5 60.2 42.8 40.3 42.1 35.6 Night (23:00-07:00) 60.7
03:00-04:00 57.4 59.5 42.7 40.8 42.6 36.4 69.0
04:00-05:00 59.2 61.8 43.7 40.9 42.9 36.8
05:00-06:00 59.8 63.5 44.6 43.6 46.2 39.0
06:00-07:00 64.1 68.0 50.4 45.0 46.4 41.3
07:00-08:00 65.3 69.3 54.4 45.6 46.7 41.7 Rear
08:00-09:00 66.6 69.8 56.5 44.9 46.9 42.1 Level (dB)
09:00-10:00 66.9 69.4 56.1 48.0 47.8 42.1 Day (07:00-19:00) 52.2
10:00-11:00 67.0 70.1 57.0 53.8 55.2 44.8 Evening (19:00-23:00) 55.7
11:00-12:00 65.9 69.0 56.3 54.6 55.0 54.1 Night (23:00-07:00) 46.2
12:00-13:00 69.5 69.1 55.8 54.4 55.1 53.7 56.2
13:00-14:00 66.0 69.1 55.8 55.1 55.8 53.9
14:00-15:00 65.5 69.1 54.9 53.7 55.0 44.2 Date of Measurement 21/04/2008
15:00-16:00 65.5 69.2 55.4 46.6 47.4 42.7
16:00-17:00 65.4 69.0 55.7 45.5 46.4 42.5
17:00-18:00 65.6 69.3 56.3 50.9 55.1 42.7
18:00-19:00 70.4 69.6 56.4 54.9 55.4 54.2
19:00-20:00 65.6 68.7 55.8 55.6 56.5 54.7
20:00-21:00 64.0 67.9 54.7 55.3 55.6 54.6
21:00-22:00 63.6 67.5 53.6 56.2 56.7 55.1
22:00-23:00 63.8 67.8 53.4 55.5 56.4 54.7
23:00-00:00 62.8 66.7 50.5 53.3 55.0 41.1
Significant sources of noise heard on site included:
- Road Traffic
- Aircraft
- People in the street
- Mechanical plant (rear)
NOTE: Increases in noise level at rear of property likely to be due to operation of some form of plant/equipment within rear yard.
LAeq
Lden
LAeq
Lden
Day/Evening/Night Indicators
Time
Site 9 - Gloucester Terrace (Lancaster Gate ward)
Front Rear
Day/Evening/Night Indicators
30
35
40
45
50
55
60
65
70
75
80
00:00 02:00 04:00 06:00 08:00 10:00 12:00 14:00 16:00 18:00 20:00 22:00 00:00
Time
No
ise
Level (d
B)
LAeq,1hr Front LA10,1hr Front LA90,1hr Front LAeq,1hr Rear LA10,1hr Rear LA90,1hr Rear

Westminster Noise Measurement Survey 2008: Final Report
D119026_2 46
Scott Wilson Ltd December 2008
Front
L Aeq,1hr
(dB)
L A10,1hr
(dB)
L A90,1hr
(dB)
L Aeq,1hr
(dB)
L A10,1hr
(dB)
L A90,1hr
(dB)Level (dB)
00:00-01:00 57.4 60.7 46.4 45.9 47.3 42.7 Day (07:00-19:00) 64.2
01:00-02:00 55.5 54.4 43.8 49.2 45.8 40.8 Evening (19:00-23:00) 60.1
02:00-03:00 49.6 49.6 41.2 42.6 44.5 37.9 Night (23:00-07:00) 55.4
03:00-04:00 51.3 51.1 41.8 41.2 42.9 38.4 64.8
04:00-05:00 50.8 50.5 42.9 43.0 44.8 39.8
05:00-06:00 56.0 56.4 44.2 51.8 56.3 41.6
06:00-07:00 57.9 59.6 48.3 57.5 59.5 46.5
07:00-08:00 59.9 61.9 48.9 53.5 54.6 45.4 Rear
08:00-09:00 68.1 72.6 54.2 56.3 60.3 47.5 Level (dB)
09:00-10:00 67.3 69.8 59.0 54.9 56.0 48.3 Day (07:00-19:00) 56.4
10:00-11:00 66.2 70.0 54.2 54.2 57.7 46.6 Evening (19:00-23:00) 50.0
11:00-12:00 62.5 65.1 52.8 53.9 56.5 47.2 Night (23:00-07:00) 50.6
12:00-13:00 62.9 66.2 53.4 51.7 53.9 46.6 58.2
13:00-14:00 64.3 67.7 53.4 58.4 57.4 49.6
14:00-15:00 63.2 67.8 52.2 57.2 59.5 49.1 Date of Measurement 01/04/2008
15:00-16:00 61.1 63.7 51.9 62.9 64.9 50.3
16:00-17:00 61.9 64.1 52.1 52.2 54.1 47.9
17:00-18:00 61.5 65.3 53.0 51.8 54.0 48.0
18:00-19:00 62.3 65.7 53.5 51.6 53.0 47.9
19:00-20:00 61.8 64.7 51.8 53.0 53.2 47.5
20:00-21:00 60.3 62.4 50.0 49.5 50.9 46.8
21:00-22:00 58.1 60.6 48.6 47.6 49.0 45.9
22:00-23:00 59.2 61.8 48.4 47.4 49.0 44.9
23:00-00:00 57.0 58.9 47.6 45.6 47.5 43.2
Significant sources of noise heard on site included:
- Road Traffic
- Aircraft
- Road works
- People in the street
Time
Site 10 - Randolph Avenue (Little Venice ward)
Front Rear
Day/Evening/Night Indicators
LAeq
Lden
LAeq
Lden
Day/Evening/Night Indicators
30
35
40
45
50
55
60
65
70
75
80
00:00 02:00 04:00 06:00 08:00 10:00 12:00 14:00 16:00 18:00 20:00 22:00 00:00
Time
No
ise
Level (d
B)
LAeq,1hr Front LA10,1hr Front LA90,1hr Front LAeq,1hr Rear LA10,1hr Rear LA90,1hr Rear
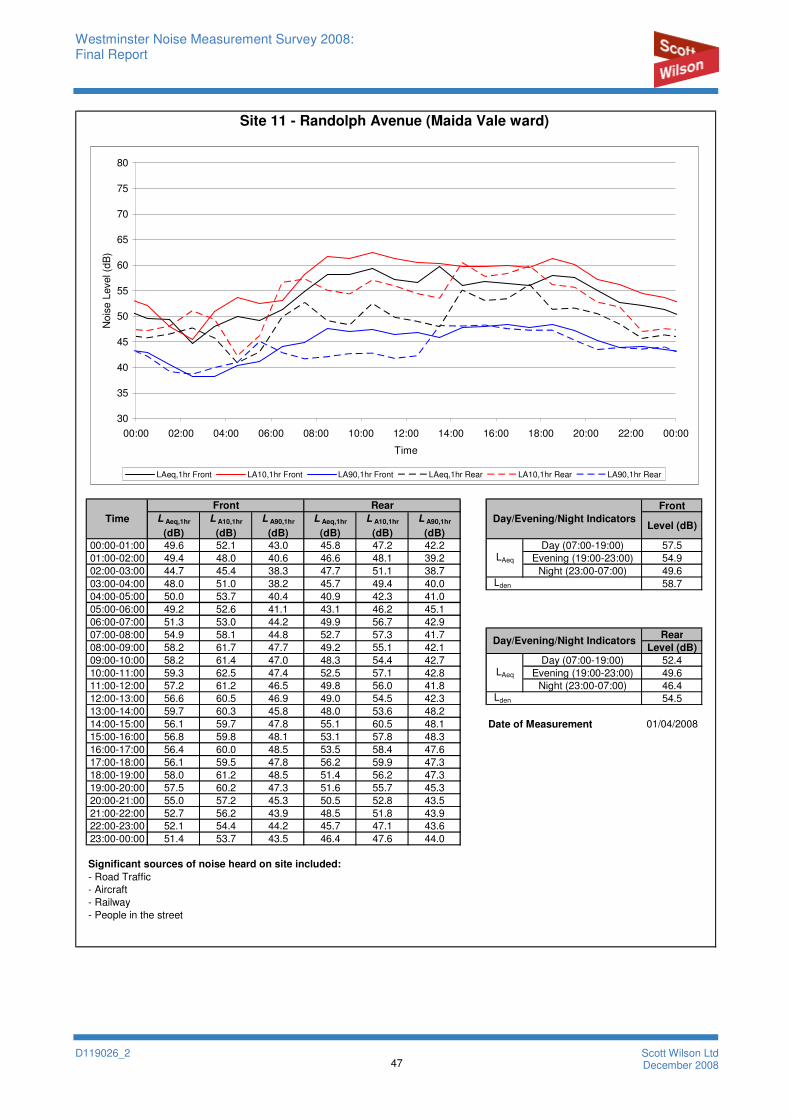
Westminster Noise Measurement Survey 2008: Final Report
D119026_2 47
Scott Wilson Ltd December 2008
Front
L Aeq,1hr
(dB)
L A10,1hr
(dB)
L A90,1hr
(dB)
L Aeq,1hr
(dB)
L A10,1hr
(dB)
L A90,1hr
(dB)Level (dB)
00:00-01:00 49.6 52.1 43.0 45.8 47.2 42.2 Day (07:00-19:00) 57.5
01:00-02:00 49.4 48.0 40.6 46.6 48.1 39.2 Evening (19:00-23:00) 54.9
02:00-03:00 44.7 45.4 38.3 47.7 51.1 38.7 Night (23:00-07:00) 49.6
03:00-04:00 48.0 51.0 38.2 45.7 49.4 40.0 58.7
04:00-05:00 50.0 53.7 40.4 40.9 42.3 41.0
05:00-06:00 49.2 52.6 41.1 43.1 46.2 45.1
06:00-07:00 51.3 53.0 44.2 49.9 56.7 42.9
07:00-08:00 54.9 58.1 44.8 52.7 57.3 41.7 Rear
08:00-09:00 58.2 61.7 47.7 49.2 55.1 42.1 Level (dB)
09:00-10:00 58.2 61.4 47.0 48.3 54.4 42.7 Day (07:00-19:00) 52.4
10:00-11:00 59.3 62.5 47.4 52.5 57.1 42.8 Evening (19:00-23:00) 49.6
11:00-12:00 57.2 61.2 46.5 49.8 56.0 41.8 Night (23:00-07:00) 46.4
12:00-13:00 56.6 60.5 46.9 49.0 54.5 42.3 54.5
13:00-14:00 59.7 60.3 45.8 48.0 53.6 48.2
14:00-15:00 56.1 59.7 47.8 55.1 60.5 48.1 Date of Measurement 01/04/2008
15:00-16:00 56.8 59.8 48.1 53.1 57.8 48.3
16:00-17:00 56.4 60.0 48.5 53.5 58.4 47.6
17:00-18:00 56.1 59.5 47.8 56.2 59.9 47.3
18:00-19:00 58.0 61.2 48.5 51.4 56.2 47.3
19:00-20:00 57.5 60.2 47.3 51.6 55.7 45.3
20:00-21:00 55.0 57.2 45.3 50.5 52.8 43.5
21:00-22:00 52.7 56.2 43.9 48.5 51.8 43.9
22:00-23:00 52.1 54.4 44.2 45.7 47.1 43.6
23:00-00:00 51.4 53.7 43.5 46.4 47.6 44.0
Significant sources of noise heard on site included:
- Road Traffic
- Aircraft
- Railway
- People in the street
LAeq
Lden
LAeq
Lden
Day/Evening/Night Indicators
Time
Site 11 - Randolph Avenue (Maida Vale ward)
Front Rear
Day/Evening/Night Indicators
30
35
40
45
50
55
60
65
70
75
80
00:00 02:00 04:00 06:00 08:00 10:00 12:00 14:00 16:00 18:00 20:00 22:00 00:00
Time
No
ise
Level (d
B)
LAeq,1hr Front LA10,1hr Front LA90,1hr Front LAeq,1hr Rear LA10,1hr Rear LA90,1hr Rear
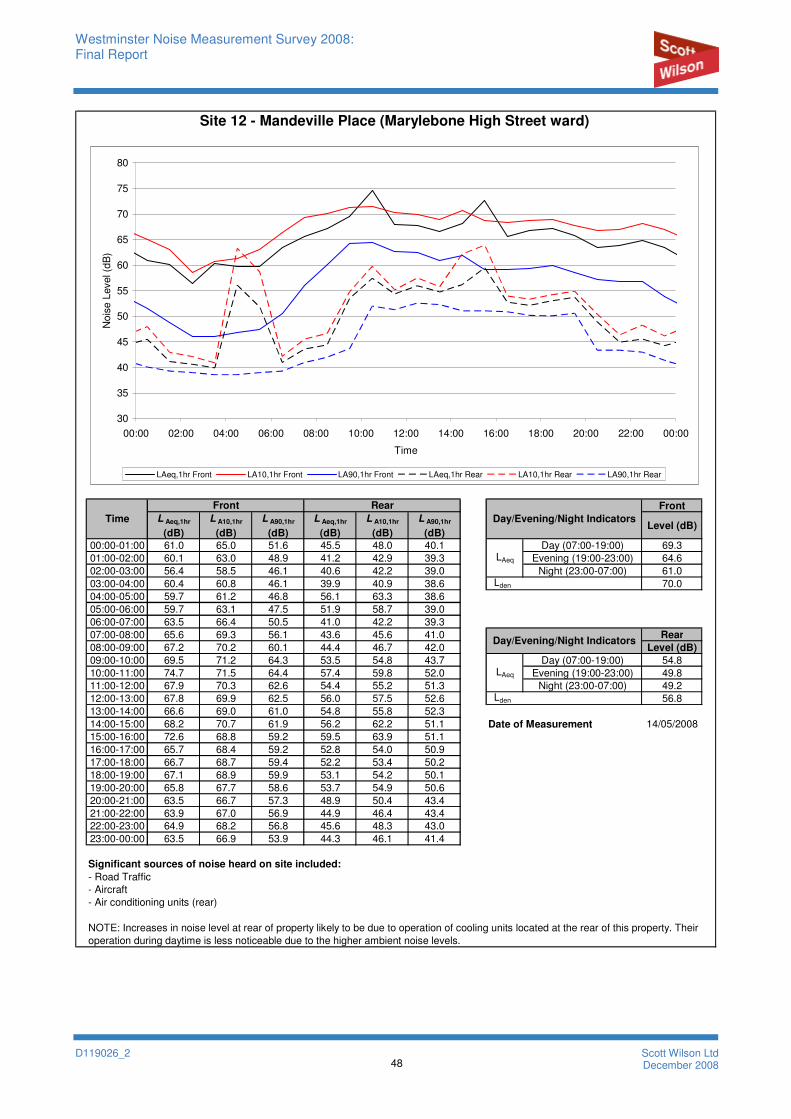
Westminster Noise Measurement Survey 2008: Final Report
D119026_2 48
Scott Wilson Ltd December 2008
Front
L Aeq,1hr
(dB)
L A10,1hr
(dB)
L A90,1hr
(dB)
L Aeq,1hr
(dB)
L A10,1hr
(dB)
L A90,1hr
(dB)Level (dB)
00:00-01:00 61.0 65.0 51.6 45.5 48.0 40.1 Day (07:00-19:00) 69.3
01:00-02:00 60.1 63.0 48.9 41.2 42.9 39.3 Evening (19:00-23:00) 64.6
02:00-03:00 56.4 58.5 46.1 40.6 42.2 39.0 Night (23:00-07:00) 61.0
03:00-04:00 60.4 60.8 46.1 39.9 40.9 38.6 70.0
04:00-05:00 59.7 61.2 46.8 56.1 63.3 38.6
05:00-06:00 59.7 63.1 47.5 51.9 58.7 39.0
06:00-07:00 63.5 66.4 50.5 41.0 42.2 39.3
07:00-08:00 65.6 69.3 56.1 43.6 45.6 41.0 Rear
08:00-09:00 67.2 70.2 60.1 44.4 46.7 42.0 Level (dB)
09:00-10:00 69.5 71.2 64.3 53.5 54.8 43.7 Day (07:00-19:00) 54.8
10:00-11:00 74.7 71.5 64.4 57.4 59.8 52.0 Evening (19:00-23:00) 49.8
11:00-12:00 67.9 70.3 62.6 54.4 55.2 51.3 Night (23:00-07:00) 49.2
12:00-13:00 67.8 69.9 62.5 56.0 57.5 52.6 56.8
13:00-14:00 66.6 69.0 61.0 54.8 55.8 52.3
14:00-15:00 68.2 70.7 61.9 56.2 62.2 51.1 Date of Measurement 14/05/2008
15:00-16:00 72.6 68.8 59.2 59.5 63.9 51.1
16:00-17:00 65.7 68.4 59.2 52.8 54.0 50.9
17:00-18:00 66.7 68.7 59.4 52.2 53.4 50.2
18:00-19:00 67.1 68.9 59.9 53.1 54.2 50.1
19:00-20:00 65.8 67.7 58.6 53.7 54.9 50.6
20:00-21:00 63.5 66.7 57.3 48.9 50.4 43.4
21:00-22:00 63.9 67.0 56.9 44.9 46.4 43.4
22:00-23:00 64.9 68.2 56.8 45.6 48.3 43.0
23:00-00:00 63.5 66.9 53.9 44.3 46.1 41.4
Significant sources of noise heard on site included:
- Road Traffic
- Aircraft
- Air conditioning units (rear)
LAeq
Lden
Day/Evening/Night Indicators
Site 12 - Mandeville Place (Marylebone High Street ward)
Front Rear
Day/Evening/Night Indicators
NOTE: Increases in noise level at rear of property likely to be due to operation of cooling units located at the rear of this property. Their
operation during daytime is less noticeable due to the higher ambient noise levels.
LAeq
Lden
Time
30
35
40
45
50
55
60
65
70
75
80
00:00 02:00 04:00 06:00 08:00 10:00 12:00 14:00 16:00 18:00 20:00 22:00 00:00
Time
No
ise
Level (d
B)
LAeq,1hr Front LA10,1hr Front LA90,1hr Front LAeq,1hr Rear LA10,1hr Rear LA90,1hr Rear
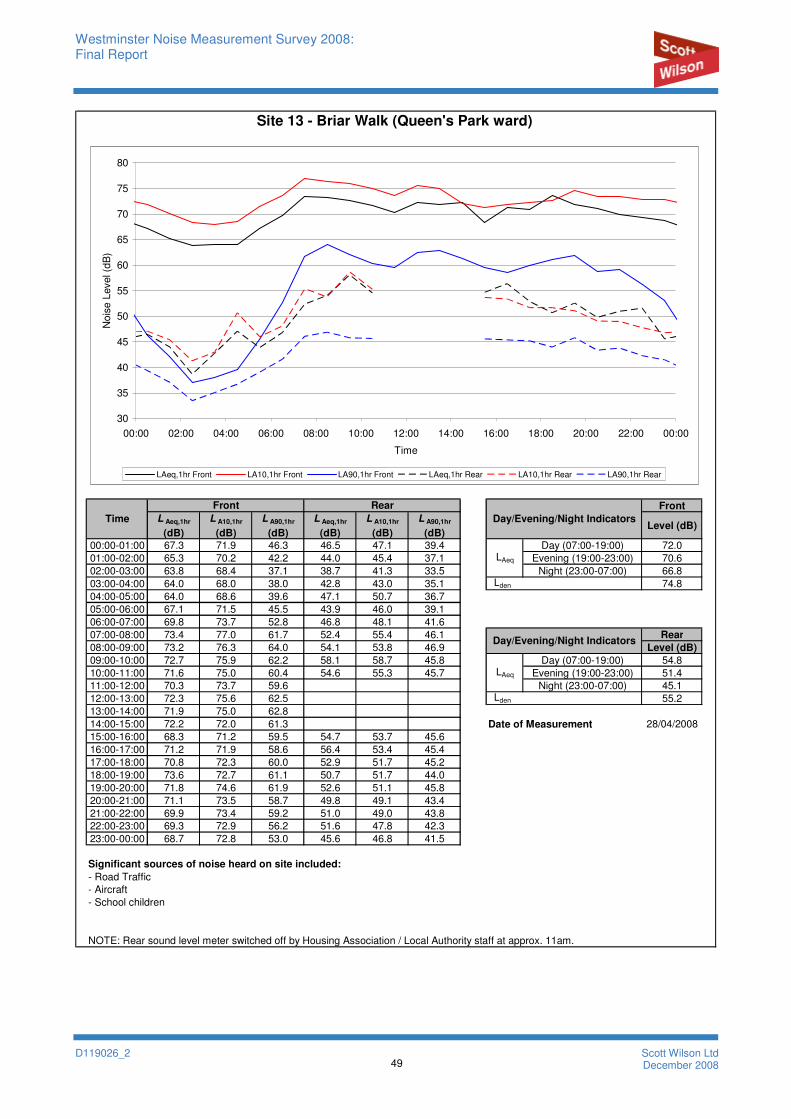
Westminster Noise Measurement Survey 2008: Final Report
D119026_2 49
Scott Wilson Ltd December 2008
Front
L Aeq,1hr
(dB)
L A10,1hr
(dB)
L A90,1hr
(dB)
L Aeq,1hr
(dB)
L A10,1hr
(dB)
L A90,1hr
(dB)Level (dB)
00:00-01:00 67.3 71.9 46.3 46.5 47.1 39.4 Day (07:00-19:00) 72.0
01:00-02:00 65.3 70.2 42.2 44.0 45.4 37.1 Evening (19:00-23:00) 70.6
02:00-03:00 63.8 68.4 37.1 38.7 41.3 33.5 Night (23:00-07:00) 66.8
03:00-04:00 64.0 68.0 38.0 42.8 43.0 35.1 74.8
04:00-05:00 64.0 68.6 39.6 47.1 50.7 36.7
05:00-06:00 67.1 71.5 45.5 43.9 46.0 39.1
06:00-07:00 69.8 73.7 52.8 46.8 48.1 41.6
07:00-08:00 73.4 77.0 61.7 52.4 55.4 46.1 Rear
08:00-09:00 73.2 76.3 64.0 54.1 53.8 46.9 Level (dB)
09:00-10:00 72.7 75.9 62.2 58.1 58.7 45.8 Day (07:00-19:00) 54.8
10:00-11:00 71.6 75.0 60.4 54.6 55.3 45.7 Evening (19:00-23:00) 51.4
11:00-12:00 70.3 73.7 59.6 Night (23:00-07:00) 45.1
12:00-13:00 72.3 75.6 62.5 55.2
13:00-14:00 71.9 75.0 62.8
14:00-15:00 72.2 72.0 61.3 Date of Measurement 28/04/2008
15:00-16:00 68.3 71.2 59.5 54.7 53.7 45.6
16:00-17:00 71.2 71.9 58.6 56.4 53.4 45.4
17:00-18:00 70.8 72.3 60.0 52.9 51.7 45.2
18:00-19:00 73.6 72.7 61.1 50.7 51.7 44.0
19:00-20:00 71.8 74.6 61.9 52.6 51.1 45.8
20:00-21:00 71.1 73.5 58.7 49.8 49.1 43.4
21:00-22:00 69.9 73.4 59.2 51.0 49.0 43.8
22:00-23:00 69.3 72.9 56.2 51.6 47.8 42.3
23:00-00:00 68.7 72.8 53.0 45.6 46.8 41.5
Significant sources of noise heard on site included:
- Road Traffic
- Aircraft
- School children
NOTE: Rear sound level meter switched off by Housing Association / Local Authority staff at approx. 11am.
LAeq
Lden
LAeq
Lden
Day/Evening/Night Indicators
Time
Site 13 - Briar Walk (Queen's Park ward)
Front Rear
Day/Evening/Night Indicators
30
35
40
45
50
55
60
65
70
75
80
00:00 02:00 04:00 06:00 08:00 10:00 12:00 14:00 16:00 18:00 20:00 22:00 00:00
Time
No
ise
Level (d
B)
LAeq,1hr Front LA10,1hr Front LA90,1hr Front LAeq,1hr Rear LA10,1hr Rear LA90,1hr Rear
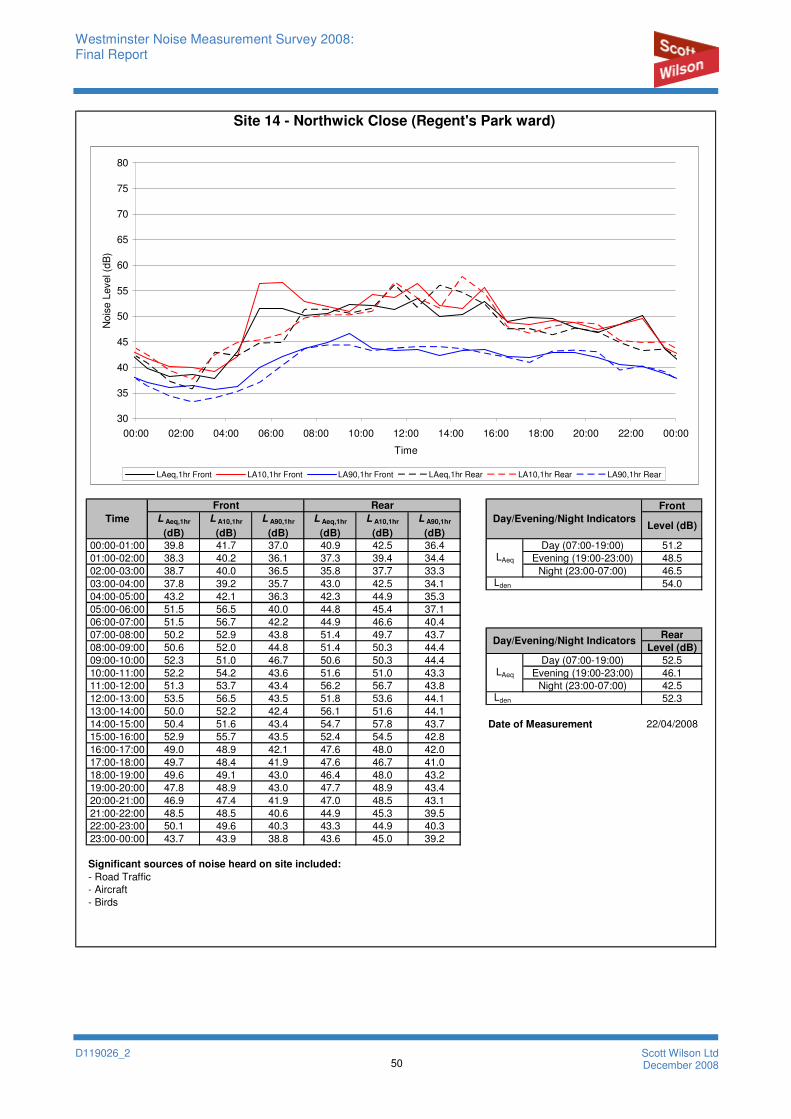
Westminster Noise Measurement Survey 2008: Final Report
D119026_2 50
Scott Wilson Ltd December 2008
Front
L Aeq,1hr
(dB)
L A10,1hr
(dB)
L A90,1hr
(dB)
L Aeq,1hr
(dB)
L A10,1hr
(dB)
L A90,1hr
(dB)Level (dB)
00:00-01:00 39.8 41.7 37.0 40.9 42.5 36.4 Day (07:00-19:00) 51.2
01:00-02:00 38.3 40.2 36.1 37.3 39.4 34.4 Evening (19:00-23:00) 48.5
02:00-03:00 38.7 40.0 36.5 35.8 37.7 33.3 Night (23:00-07:00) 46.5
03:00-04:00 37.8 39.2 35.7 43.0 42.5 34.1 54.0
04:00-05:00 43.2 42.1 36.3 42.3 44.9 35.3
05:00-06:00 51.5 56.5 40.0 44.8 45.4 37.1
06:00-07:00 51.5 56.7 42.2 44.9 46.6 40.4
07:00-08:00 50.2 52.9 43.8 51.4 49.7 43.7 Rear
08:00-09:00 50.6 52.0 44.8 51.4 50.3 44.4 Level (dB)
09:00-10:00 52.3 51.0 46.7 50.6 50.3 44.4 Day (07:00-19:00) 52.5
10:00-11:00 52.2 54.2 43.6 51.6 51.0 43.3 Evening (19:00-23:00) 46.1
11:00-12:00 51.3 53.7 43.4 56.2 56.7 43.8 Night (23:00-07:00) 42.5
12:00-13:00 53.5 56.5 43.5 51.8 53.6 44.1 52.3
13:00-14:00 50.0 52.2 42.4 56.1 51.6 44.1
14:00-15:00 50.4 51.6 43.4 54.7 57.8 43.7 Date of Measurement 22/04/2008
15:00-16:00 52.9 55.7 43.5 52.4 54.5 42.8
16:00-17:00 49.0 48.9 42.1 47.6 48.0 42.0
17:00-18:00 49.7 48.4 41.9 47.6 46.7 41.0
18:00-19:00 49.6 49.1 43.0 46.4 48.0 43.2
19:00-20:00 47.8 48.9 43.0 47.7 48.9 43.4
20:00-21:00 46.9 47.4 41.9 47.0 48.5 43.1
21:00-22:00 48.5 48.5 40.6 44.9 45.3 39.5
22:00-23:00 50.1 49.6 40.3 43.3 44.9 40.3
23:00-00:00 43.7 43.9 38.8 43.6 45.0 39.2
Significant sources of noise heard on site included:
- Road Traffic
- Aircraft
- Birds
Time
Site 14 - Northwick Close (Regent's Park ward)
Front Rear
Day/Evening/Night Indicators
LAeq
Lden
LAeq
Lden
Day/Evening/Night Indicators
30
35
40
45
50
55
60
65
70
75
80
00:00 02:00 04:00 06:00 08:00 10:00 12:00 14:00 16:00 18:00 20:00 22:00 00:00
Time
No
ise
Level (d
B)
LAeq,1hr Front LA10,1hr Front LA90,1hr Front LAeq,1hr Rear LA10,1hr Rear LA90,1hr Rear
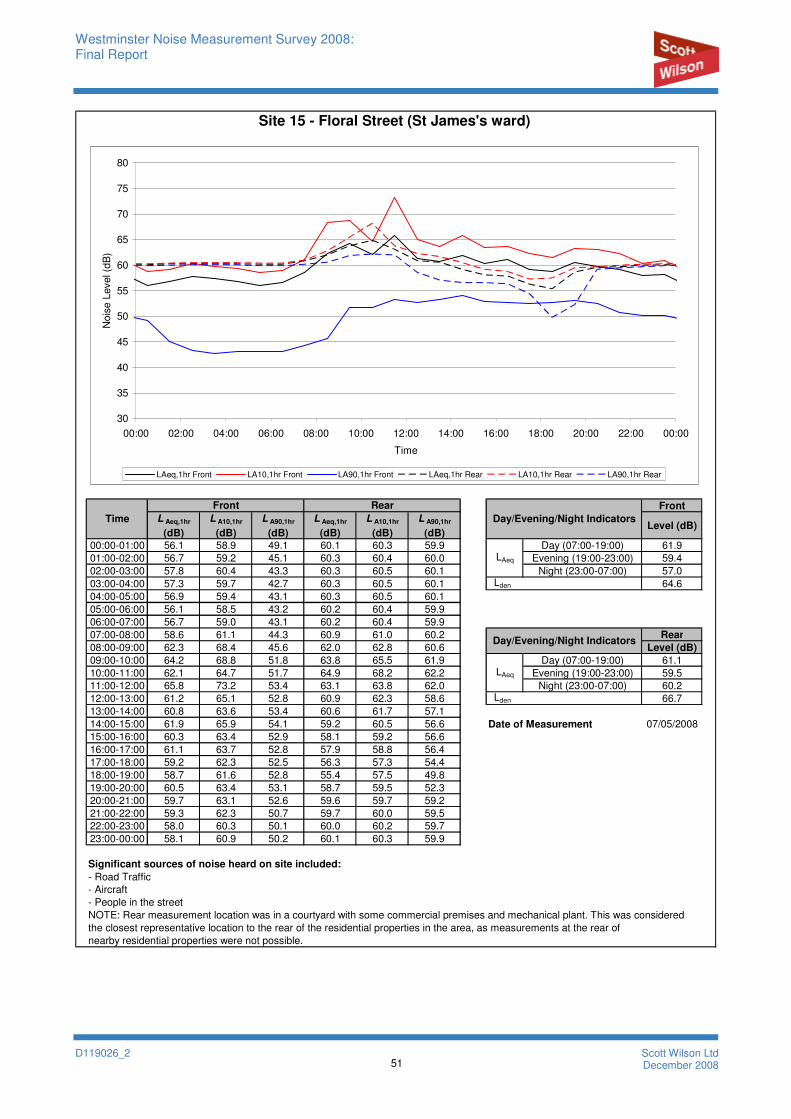
Westminster Noise Measurement Survey 2008: Final Report
D119026_2 51
Scott Wilson Ltd December 2008
Front
L Aeq,1hr
(dB)
L A10,1hr
(dB)
L A90,1hr
(dB)
L Aeq,1hr
(dB)
L A10,1hr
(dB)
L A90,1hr
(dB)Level (dB)
00:00-01:00 56.1 58.9 49.1 60.1 60.3 59.9 Day (07:00-19:00) 61.9
01:00-02:00 56.7 59.2 45.1 60.3 60.4 60.0 Evening (19:00-23:00) 59.4
02:00-03:00 57.8 60.4 43.3 60.3 60.5 60.1 Night (23:00-07:00) 57.0
03:00-04:00 57.3 59.7 42.7 60.3 60.5 60.1 64.6
04:00-05:00 56.9 59.4 43.1 60.3 60.5 60.1
05:00-06:00 56.1 58.5 43.2 60.2 60.4 59.9
06:00-07:00 56.7 59.0 43.1 60.2 60.4 59.9
07:00-08:00 58.6 61.1 44.3 60.9 61.0 60.2 Rear
08:00-09:00 62.3 68.4 45.6 62.0 62.8 60.6 Level (dB)
09:00-10:00 64.2 68.8 51.8 63.8 65.5 61.9 Day (07:00-19:00) 61.1
10:00-11:00 62.1 64.7 51.7 64.9 68.2 62.2 Evening (19:00-23:00) 59.5
11:00-12:00 65.8 73.2 53.4 63.1 63.8 62.0 Night (23:00-07:00) 60.2
12:00-13:00 61.2 65.1 52.8 60.9 62.3 58.6 66.7
13:00-14:00 60.8 63.6 53.4 60.6 61.7 57.1
14:00-15:00 61.9 65.9 54.1 59.2 60.5 56.6 Date of Measurement 07/05/2008
15:00-16:00 60.3 63.4 52.9 58.1 59.2 56.6
16:00-17:00 61.1 63.7 52.8 57.9 58.8 56.4
17:00-18:00 59.2 62.3 52.5 56.3 57.3 54.4
18:00-19:00 58.7 61.6 52.8 55.4 57.5 49.8
19:00-20:00 60.5 63.4 53.1 58.7 59.5 52.3
20:00-21:00 59.7 63.1 52.6 59.6 59.7 59.2
21:00-22:00 59.3 62.3 50.7 59.7 60.0 59.5
22:00-23:00 58.0 60.3 50.1 60.0 60.2 59.7
23:00-00:00 58.1 60.9 50.2 60.1 60.3 59.9
Significant sources of noise heard on site included:
- Road Traffic
- Aircraft
- People in the street
LAeq
Lden
NOTE: Rear measurement location was in a courtyard with some commercial premises and mechanical plant. This was considered
the closest representative location to the rear of the residential properties in the area, as measurements at the rear of
nearby residential properties were not possible.
Time
Site 15 - Floral Street (St James's ward)
Front Rear
Day/Evening/Night Indicators
LAeq
Lden
Day/Evening/Night Indicators
30
35
40
45
50
55
60
65
70
75
80
00:00 02:00 04:00 06:00 08:00 10:00 12:00 14:00 16:00 18:00 20:00 22:00 00:00
Time
No
ise
Level (d
B)
LAeq,1hr Front LA10,1hr Front LA90,1hr Front LAeq,1hr Rear LA10,1hr Rear LA90,1hr Rear

Westminster Noise Measurement Survey 2008: Final Report
D119026_2 52
Scott Wilson Ltd December 2008
Front
L Aeq,1hr
(dB)
L A10,1hr
(dB)
L A90,1hr
(dB)
L Aeq,1hr
(dB)
L A10,1hr
(dB)
L A90,1hr
(dB)Level (dB)
00:00-01:00 54.1 57.8 42.7 53.3 54.4 42.4 Day (07:00-19:00) 60.4
01:00-02:00 51.1 50.6 39.8 49.6 50.0 39.2 Evening (19:00-23:00) 56.9
02:00-03:00 50.0 49.8 38.1 46.0 49.7 38.9 Night (23:00-07:00) 53.4
03:00-04:00 47.3 49.5 38.7 44.0 47.0 38.6 61.9
04:00-05:00 52.7 55.7 41.9 51.2 54.8 43.0
05:00-06:00 52.2 55.1 42.6 50.4 52.6 43.0
06:00-07:00 57.6 60.6 48.4 58.1 61.8 47.3
07:00-08:00 58.6 62.0 49.1 58.2 62.1 47.6 Rear
08:00-09:00 58.8 62.3 49.8 58.2 61.8 47.6 Level (dB)
09:00-10:00 64.7 63.5 48.8 60.9 63.0 47.0 Day (07:00-19:00) 58.5
10:00-11:00 59.2 62.9 48.5 58.3 62.3 47.4 Evening (19:00-23:00) 54.7
11:00-12:00 59.5 62.9 48.5 59.2 61.8 46.7 Night (23:00-07:00) 52.4
12:00-13:00 59.3 62.4 48.2 58.4 61.9 47.5 60.4
13:00-14:00 58.8 62.6 48.8 58.4 62.1 47.0
14:00-15:00 60.2 63.5 48.0 59.5 62.7 46.4 Date of Measurement 30/04/2008
15:00-16:00 59.5 62.4 50.3 56.0 59.0 49.0
16:00-17:00 62.0 62.2 48.6 58.7 59.6 46.7
17:00-18:00 59.8 61.2 49.2 56.4 59.3 47.7
18:00-19:00 60.1 62.3 49.7 58.0 59.8 47.9
19:00-20:00 59.3 61.9 48.5 57.7 61.0 47.8
20:00-21:00 56.5 58.1 47.5 53.6 55.8 47.0
21:00-22:00 55.8 57.5 47.0 53.2 55.7 46.3
22:00-23:00 54.7 55.9 45.6 52.1 53.3 44.7
23:00-00:00 54.8 56.2 45.3 51.5 52.8 44.3
Significant sources of noise heard on site included:
- Road Traffic
- Aircraft
- Birds
Time
Site 16 - St George's Square Mews (Tachbrook ward)
Front Rear
Day/Evening/Night Indicators
LAeq
Lden
LAeq
Lden
Day/Evening/Night Indicators
30
35
40
45
50
55
60
65
70
75
80
00:00 02:00 04:00 06:00 08:00 10:00 12:00 14:00 16:00 18:00 20:00 22:00 00:00
Time
No
ise
Level (d
B)
LAeq,1hr Front LA10,1hr Front LA90,1hr Front LAeq,1hr Rear LA10,1hr Rear LA90,1hr Rear
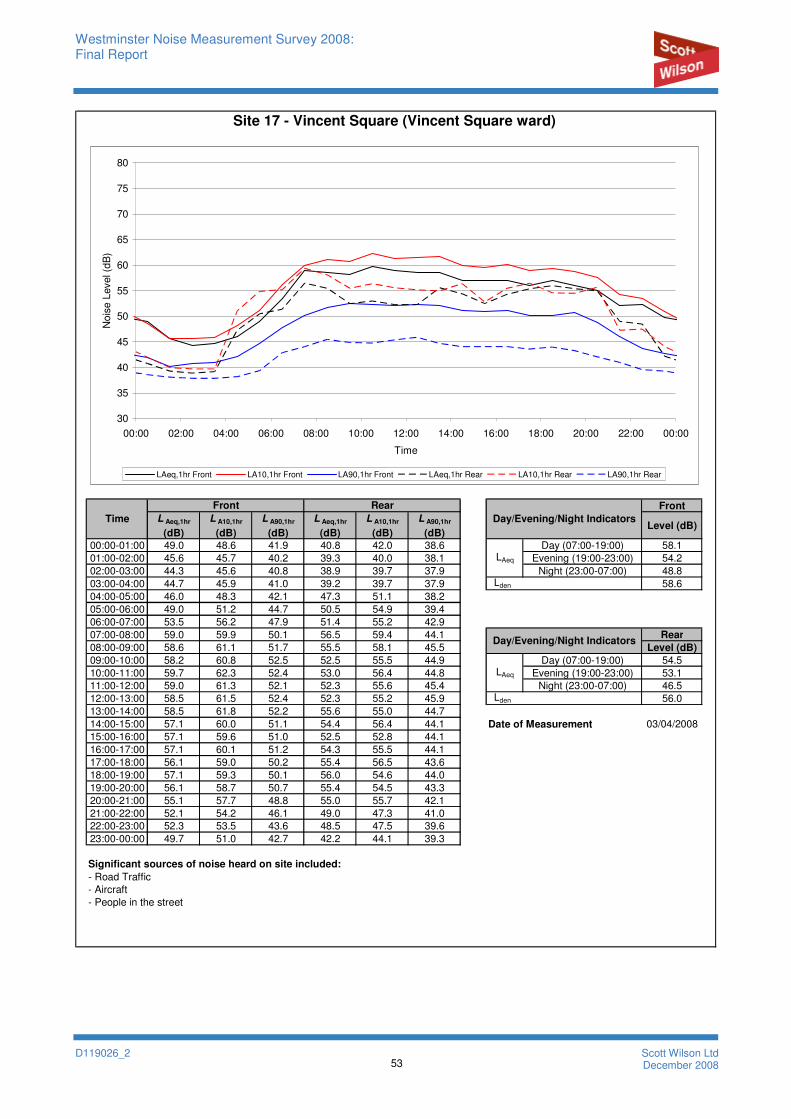
Westminster Noise Measurement Survey 2008: Final Report
D119026_2 53
Scott Wilson Ltd December 2008
Front
L Aeq,1hr
(dB)
L A10,1hr
(dB)
L A90,1hr
(dB)
L Aeq,1hr
(dB)
L A10,1hr
(dB)
L A90,1hr
(dB)Level (dB)
00:00-01:00 49.0 48.6 41.9 40.8 42.0 38.6 Day (07:00-19:00) 58.1
01:00-02:00 45.6 45.7 40.2 39.3 40.0 38.1 Evening (19:00-23:00) 54.2
02:00-03:00 44.3 45.6 40.8 38.9 39.7 37.9 Night (23:00-07:00) 48.8
03:00-04:00 44.7 45.9 41.0 39.2 39.7 37.9 58.6
04:00-05:00 46.0 48.3 42.1 47.3 51.1 38.2
05:00-06:00 49.0 51.2 44.7 50.5 54.9 39.4
06:00-07:00 53.5 56.2 47.9 51.4 55.2 42.9
07:00-08:00 59.0 59.9 50.1 56.5 59.4 44.1 Rear
08:00-09:00 58.6 61.1 51.7 55.5 58.1 45.5 Level (dB)
09:00-10:00 58.2 60.8 52.5 52.5 55.5 44.9 Day (07:00-19:00) 54.5
10:00-11:00 59.7 62.3 52.4 53.0 56.4 44.8 Evening (19:00-23:00) 53.1
11:00-12:00 59.0 61.3 52.1 52.3 55.6 45.4 Night (23:00-07:00) 46.5
12:00-13:00 58.5 61.5 52.4 52.3 55.2 45.9 56.0
13:00-14:00 58.5 61.8 52.2 55.6 55.0 44.7
14:00-15:00 57.1 60.0 51.1 54.4 56.4 44.1 Date of Measurement 03/04/2008
15:00-16:00 57.1 59.6 51.0 52.5 52.8 44.1
16:00-17:00 57.1 60.1 51.2 54.3 55.5 44.1
17:00-18:00 56.1 59.0 50.2 55.4 56.5 43.6
18:00-19:00 57.1 59.3 50.1 56.0 54.6 44.0
19:00-20:00 56.1 58.7 50.7 55.4 54.5 43.3
20:00-21:00 55.1 57.7 48.8 55.0 55.7 42.1
21:00-22:00 52.1 54.2 46.1 49.0 47.3 41.0
22:00-23:00 52.3 53.5 43.6 48.5 47.5 39.6
23:00-00:00 49.7 51.0 42.7 42.2 44.1 39.3
Significant sources of noise heard on site included:
- Road Traffic
- Aircraft
- People in the street
LAeq
Lden
LAeq
Lden
Day/Evening/Night Indicators
Time
Site 17 - Vincent Square (Vincent Square ward)
Front Rear
Day/Evening/Night Indicators
30
35
40
45
50
55
60
65
70
75
80
00:00 02:00 04:00 06:00 08:00 10:00 12:00 14:00 16:00 18:00 20:00 22:00 00:00
Time
No
ise
Level (d
B)
LAeq,1hr Front LA10,1hr Front LA90,1hr Front LAeq,1hr Rear LA10,1hr Rear LA90,1hr Rear

Westminster Noise Measurement Survey 2008: Final Report
D119026_2 54
Scott Wilson Ltd December 2008
Front
L Aeq,1hr
(dB)
L A10,1hr
(dB)
L A90,1hr
(dB)
L Aeq,1hr
(dB)
L A10,1hr
(dB)
L A90,1hr
(dB)Level (dB)
00:00-01:00 61.6 65.2 43.6 41.6 43.0 39.5 Day (07:00-19:00) 66.4
01:00-02:00 57.4 58.4 40.8 40.5 42.0 38.0 Evening (19:00-23:00) 64.6
02:00-03:00 57.4 54.8 40.3 43.0 42.6 37.5 Night (23:00-07:00) 60.9
03:00-04:00 55.5 52.2 40.7 41.0 42.3 37.9 68.9
04:00-05:00 58.3 56.5 42.3 41.2 42.8 39.0
05:00-06:00 59.7 62.4 43.5 41.5 42.9 39.2
06:00-07:00 64.4 69.3 47.1 47.2 48.9 41.0
07:00-08:00 65.2 70.1 50.1 51.2 50.1 47.1 Rear
08:00-09:00 67.2 71.2 54.2 52.4 52.3 47.4 Level (dB)
09:00-10:00 66.5 70.6 53.8 54.3 53.8 48.3 Day (07:00-19:00) 52.4
10:00-11:00 66.0 70.3 54.1 50.8 50.4 44.8 Evening (19:00-23:00) 50.1
11:00-12:00 66.2 70.2 53.6 51.0 52.1 47.6 Night (23:00-07:00) 43.3
12:00-13:00 69.0 70.5 53.2 52.8 55.0 44.8 53.3
13:00-14:00 65.4 69.7 52.7 49.0 49.4 46.8
14:00-15:00 65.6 69.9 52.9 52.5 51.3 47.0 Date of Measurement 07/05/2008
15:00-16:00 65.9 70.0 53.7 52.5 51.2 47.2
16:00-17:00 66.1 70.5 52.8 50.7 50.2 44.5
17:00-18:00 66.1 70.4 53.2 52.1 53.2 45.0
18:00-19:00 66.5 70.7 53.6 55.3 52.7 44.3
19:00-20:00 65.9 70.2 52.2 50.7 49.5 44.4
20:00-21:00 64.4 69.1 50.2 52.0 50.0 44.2
21:00-22:00 63.6 67.9 48.1 49.7 50.3 43.7
22:00-23:00 64.0 68.2 48.7 45.8 46.8 44.0
23:00-00:00 64.1 68.9 46.7 45.4 46.3 42.9
Significant sources of noise heard on site included:
- Road Traffic
- Aircraft
Time
Site 18 - St George's Drive (Warwick ward)
Front Rear
Day/Evening/Night Indicators
LAeq
Lden
LAeq
Lden
Day/Evening/Night Indicators
30
35
40
45
50
55
60
65
70
75
80
00:00 02:00 04:00 06:00 08:00 10:00 12:00 14:00 16:00 18:00 20:00 22:00 00:00
Time
No
ise
Level (d
B)
LAeq,1hr Front LA10,1hr Front LA90,1hr Front LAeq,1hr Rear LA10,1hr Rear LA90,1hr Rear

Westminster Noise Measurement Survey 2008: Final Report
D119026_2 55
Scott Wilson Ltd December 2008
Front
L Aeq,1hr
(dB)
L A10,1hr
(dB)
L A90,1hr
(dB)
L Aeq,1hr
(dB)
L A10,1hr
(dB)
L A90,1hr
(dB)Level (dB)
00:00-01:00 56.5 59.4 51.9 43.7 45.8 40.7 Day (07:00-19:00) 62.0
01:00-02:00 55.7 58.0 52.6 40.9 43.4 37.9 Evening (19:00-23:00) 59.7
02:00-03:00 55.3 56.8 52.8 39.2 41.8 35.5 Night (23:00-07:00) 56.6
03:00-04:00 56.6 58.0 54.7 42.1 42.6 35.8 64.5
04:00-05:00 56.4 57.8 54.1 47.7 49.6 38.1
05:00-06:00 56.4 58.5 52.6 47.5 49.6 39.9
06:00-07:00 57.7 60.1 53.3 47.2 48.8 43.2
07:00-08:00 60.4 63.5 53.0 52.9 56.2 47.1 Rear
08:00-09:00 62.1 65.1 56.2 53.0 54.8 48.8 Level (dB)
09:00-10:00 62.1 65.0 55.5 51.8 53.9 47.0 Day (07:00-19:00) 53.6
10:00-11:00 60.8 64.0 54.0 51.3 52.7 44.9 Evening (19:00-23:00) 49.2
11:00-12:00 60.4 63.3 53.3 56.0 55.4 44.9 Night (23:00-07:00) 45.1
12:00-13:00 59.9 62.6 49.8 57.2 59.3 47.2 54.3
13:00-14:00 64.7 62.7 51.7 55.5 56.4 45.8
14:00-15:00 59.0 61.5 52.5 52.1 53.5 45.7 Date of Measurement 28/04/2008
15:00-16:00 66.3 61.8 53.2 51.6 53.2 46.5
16:00-17:00 60.5 63.4 53.1 50.0 51.5 46.4
17:00-18:00 60.2 63.3 53.2 54.1 54.0 48.0
18:00-19:00 60.6 63.7 53.0 51.4 53.2 47.3
19:00-20:00 61.8 65.1 53.2 50.2 52.4 45.9
20:00-21:00 59.2 62.1 51.5 51.4 50.6 44.7
21:00-22:00 58.8 61.8 52.0 47.2 48.6 44.0
22:00-23:00 58.1 61.4 51.5 45.5 47.2 43.3
23:00-00:00 57.5 60.7 52.0 44.9 46.6 42.5
Significant sources of noise heard on site included:
- Road Traffic
- Aircraft
- Construction (to rear)
LAeq
Lden
LAeq
Lden
Day/Evening/Night Indicators
Time
Site 19 - Westbourne Place Road (Westbourne ward)
Front Rear
Day/Evening/Night Indicators
30
35
40
45
50
55
60
65
70
75
80
00:00 02:00 04:00 06:00 08:00 10:00 12:00 14:00 16:00 18:00 20:00 22:00 00:00
Time
No
ise
Level (d
B)
LAeq,1hr Front LA10,1hr Front LA90,1hr Front LAeq,1hr Rear LA10,1hr Rear LA90,1hr Rear
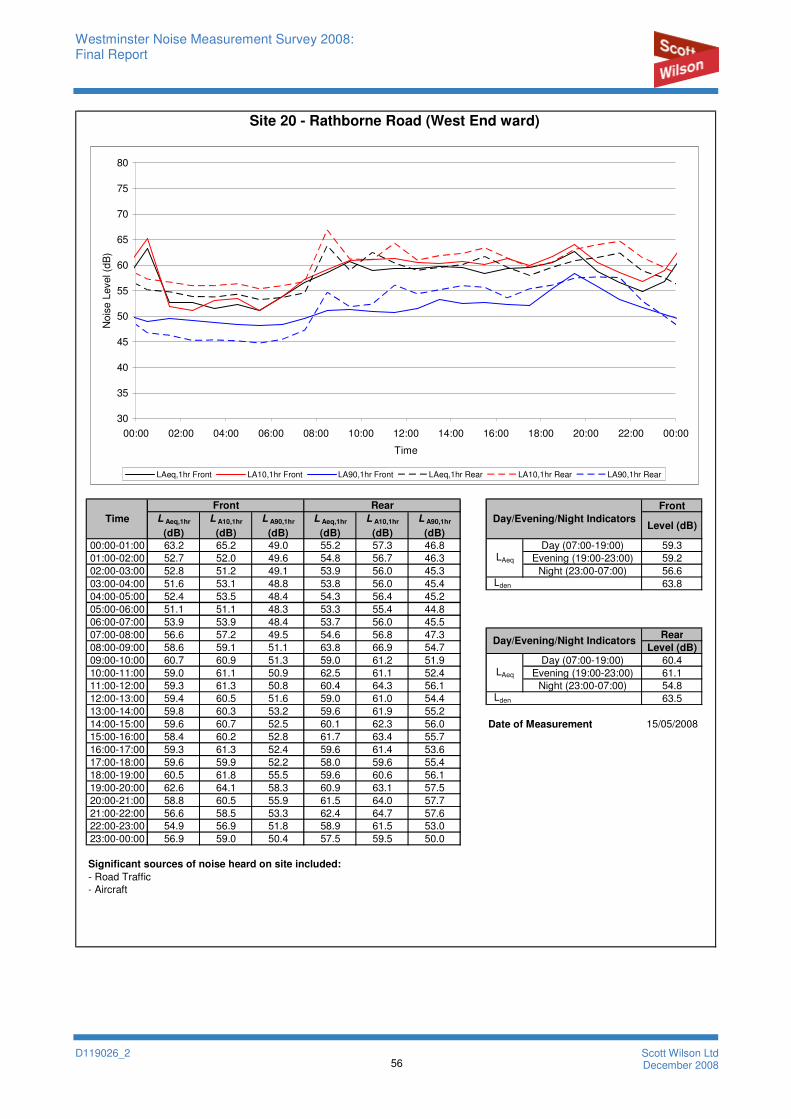
Westminster Noise Measurement Survey 2008: Final Report
D119026_2 56
Scott Wilson Ltd December 2008
Front
L Aeq,1hr
(dB)
L A10,1hr
(dB)
L A90,1hr
(dB)
L Aeq,1hr
(dB)
L A10,1hr
(dB)
L A90,1hr
(dB)Level (dB)
00:00-01:00 63.2 65.2 49.0 55.2 57.3 46.8 Day (07:00-19:00) 59.3
01:00-02:00 52.7 52.0 49.6 54.8 56.7 46.3 Evening (19:00-23:00) 59.2
02:00-03:00 52.8 51.2 49.1 53.9 56.0 45.3 Night (23:00-07:00) 56.6
03:00-04:00 51.6 53.1 48.8 53.8 56.0 45.4 63.8
04:00-05:00 52.4 53.5 48.4 54.3 56.4 45.2
05:00-06:00 51.1 51.1 48.3 53.3 55.4 44.8
06:00-07:00 53.9 53.9 48.4 53.7 56.0 45.5
07:00-08:00 56.6 57.2 49.5 54.6 56.8 47.3 Rear
08:00-09:00 58.6 59.1 51.1 63.8 66.9 54.7 Level (dB)
09:00-10:00 60.7 60.9 51.3 59.0 61.2 51.9 Day (07:00-19:00) 60.4
10:00-11:00 59.0 61.1 50.9 62.5 61.1 52.4 Evening (19:00-23:00) 61.1
11:00-12:00 59.3 61.3 50.8 60.4 64.3 56.1 Night (23:00-07:00) 54.8
12:00-13:00 59.4 60.5 51.6 59.0 61.0 54.4 63.5
13:00-14:00 59.8 60.3 53.2 59.6 61.9 55.2
14:00-15:00 59.6 60.7 52.5 60.1 62.3 56.0 Date of Measurement 15/05/2008
15:00-16:00 58.4 60.2 52.8 61.7 63.4 55.7
16:00-17:00 59.3 61.3 52.4 59.6 61.4 53.6
17:00-18:00 59.6 59.9 52.2 58.0 59.6 55.4
18:00-19:00 60.5 61.8 55.5 59.6 60.6 56.1
19:00-20:00 62.6 64.1 58.3 60.9 63.1 57.5
20:00-21:00 58.8 60.5 55.9 61.5 64.0 57.7
21:00-22:00 56.6 58.5 53.3 62.4 64.7 57.6
22:00-23:00 54.9 56.9 51.8 58.9 61.5 53.0
23:00-00:00 56.9 59.0 50.4 57.5 59.5 50.0
Significant sources of noise heard on site included:
- Road Traffic
- Aircraft
Time
Site 20 - Rathborne Road (West End ward)
Front Rear
Day/Evening/Night Indicators
LAeq
Lden
LAeq
Lden
Day/Evening/Night Indicators
30
35
40
45
50
55
60
65
70
75
80
00:00 02:00 04:00 06:00 08:00 10:00 12:00 14:00 16:00 18:00 20:00 22:00 00:00
Time
No
ise
Level (d
B)
LAeq,1hr Front LA10,1hr Front LA90,1hr Front LAeq,1hr Rear LA10,1hr Rear LA90,1hr Rear

Westminster Noise Measurement Survey 2008: Final Report
D119026_2 57
Scott Wilson Ltd December 2008
Appendix C SITE-BY-SITE DATA – PHASE 2 SITES
C.1 The following pages contain data sheets from each site within Phase 2 of the survey. Each
sheet contains the following data:
•••• LAeq,1hr, LA10,1hr and LA90,1hr data tabulated over the 24-hour measurement period
for both front and rear measurement positions.
•••• Graphical representation of 24-hour time histories for LAeq,1hr, LA10,1hr and LA90,1hr
noise indicators from both measurement positions.
•••• Day, evening and night average LAeq,T noise levels, and 24-hour weighted
average Lden noise level, again at front and rear of property.
•••• Summary of significant noise sources noted at each site during site visits.
•••• Any other relevant notes and comments from site visits.

Westminster Noise Measurement Survey 2008: Final Report
D119026_2 58
Scott Wilson Ltd December 2008
Front
L Aeq,1hr
(dB)
L A10,1hr
(dB)
L A90,1hr
(dB)
L Aeq,1hr
(dB)
L A10,1hr
(dB)
L A90,1hr
(dB)Level (dB)
00:00-01:00 51.8 55.6 38.1 41.1 44.9 36.4 Day (07:00-19:00) 58.0
01:00-02:00 48.2 53.2 35.5 42.1 43.6 40.3 Evening (19:00-23:00) 54.9
02:00-03:00 42.8 46.5 35.2 41.1 42.6 39.4 Night (23:00-07:00) 49.3
03:00-04:00 45.4 49.6 35.1 41.2 42.5 39.3 58.8
04:00-05:00 46.0 50.0 35.1 43.1 43.4 40.1
05:00-06:00 45.5 49.8 37.0 44.1 45.0 41.6
06:00-07:00 42.5 45.7 38.8 47.4 47.3 44.3
07:00-08:00 46.1 49.5 45.0 46.5 47.5 44.5 Rear
08:00-09:00 52.0 55.9 46.0 54.6 58.8 45.6 Level (dB)
09:00-10:00 54.5 58.3 49.8 63.3 62.7 45.6 Day (07:00-19:00) 55.2
10:00-11:00 62.5 69.2 49.1 53.1 53.4 44.5 Evening (19:00-23:00) 49.4
11:00-12:00 60.1 66.0 46.8 54.4 56.8 45.2 Night (23:00-07:00) 43.5
12:00-13:00 59.7 65.3 51.2 54.7 57.2 51.0 54.6
13:00-14:00 58.6 63.9 48.7 55.7 57.1 50.7
14:00-15:00 57.1 62.1 49.6 50.2 51.6 45.8 Date of Measurement 22/04/2008
15:00-16:00 60.2 65.0 45.1 46.3 48.4 42.0
16:00-17:00 57.0 61.3 45.1 45.4 46.9 41.7
17:00-18:00 54.9 59.9 44.1 49.7 51.4 43.5
18:00-19:00 55.6 61.4 44.4 47.9 49.9 43.5
19:00-20:00 54.4 58.7 45.2 47.0 48.1 44.9
20:00-21:00 54.0 58.4 44.1 48.5 51.0 45.2
21:00-22:00 55.1 59.2 43.1 50.0 51.7 45.4
22:00-23:00 55.7 59.2 41.4 51.1 49.1 42.1
23:00-00:00 54.9 58.7 39.8 43.9 46.1 40.3
Significant sources of noise heard on site included:
- Road Traffic
- Aircraft
LAeq
Lden
LAeq
Lden
Day/Evening/Night Indicators
Time
Site C1 - Newton Road
Front Rear
Day/Evening/Night Indicators
30
35
40
45
50
55
60
65
70
75
80
85
00:00 02:00 04:00 06:00 08:00 10:00 12:00 14:00 16:00 18:00 20:00 22:00 00:00
Time
No
ise
Level (d
B)
LAeq,1hr Front LA10,1hr Front LA90,1hr Front LAeq,1hr Rear LA10,1hr Rear LA90,1hr Rear
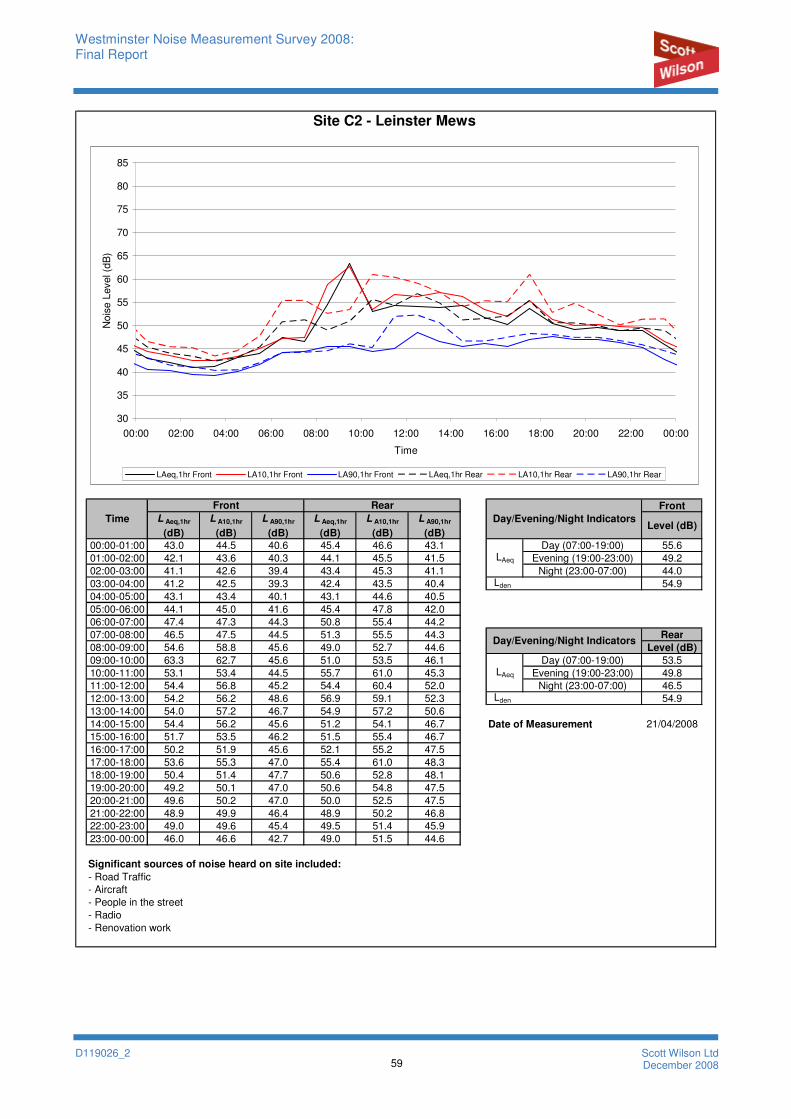
Westminster Noise Measurement Survey 2008: Final Report
D119026_2 59
Scott Wilson Ltd December 2008
Front
L Aeq,1hr
(dB)
L A10,1hr
(dB)
L A90,1hr
(dB)
L Aeq,1hr
(dB)
L A10,1hr
(dB)
L A90,1hr
(dB)Level (dB)
00:00-01:00 43.0 44.5 40.6 45.4 46.6 43.1 Day (07:00-19:00) 55.6
01:00-02:00 42.1 43.6 40.3 44.1 45.5 41.5 Evening (19:00-23:00) 49.2
02:00-03:00 41.1 42.6 39.4 43.4 45.3 41.1 Night (23:00-07:00) 44.0
03:00-04:00 41.2 42.5 39.3 42.4 43.5 40.4 54.9
04:00-05:00 43.1 43.4 40.1 43.1 44.6 40.5
05:00-06:00 44.1 45.0 41.6 45.4 47.8 42.0
06:00-07:00 47.4 47.3 44.3 50.8 55.4 44.2
07:00-08:00 46.5 47.5 44.5 51.3 55.5 44.3 Rear
08:00-09:00 54.6 58.8 45.6 49.0 52.7 44.6 Level (dB)
09:00-10:00 63.3 62.7 45.6 51.0 53.5 46.1 Day (07:00-19:00) 53.5
10:00-11:00 53.1 53.4 44.5 55.7 61.0 45.3 Evening (19:00-23:00) 49.8
11:00-12:00 54.4 56.8 45.2 54.4 60.4 52.0 Night (23:00-07:00) 46.5
12:00-13:00 54.2 56.2 48.6 56.9 59.1 52.3 54.9
13:00-14:00 54.0 57.2 46.7 54.9 57.2 50.6
14:00-15:00 54.4 56.2 45.6 51.2 54.1 46.7 Date of Measurement 21/04/2008
15:00-16:00 51.7 53.5 46.2 51.5 55.4 46.7
16:00-17:00 50.2 51.9 45.6 52.1 55.2 47.5
17:00-18:00 53.6 55.3 47.0 55.4 61.0 48.3
18:00-19:00 50.4 51.4 47.7 50.6 52.8 48.1
19:00-20:00 49.2 50.1 47.0 50.6 54.8 47.5
20:00-21:00 49.6 50.2 47.0 50.0 52.5 47.5
21:00-22:00 48.9 49.9 46.4 48.9 50.2 46.8
22:00-23:00 49.0 49.6 45.4 49.5 51.4 45.9
23:00-00:00 46.0 46.6 42.7 49.0 51.5 44.6
Significant sources of noise heard on site included:
- Road Traffic
- Aircraft
- People in the street
- Radio
- Renovation work
Time
Site C2 - Leinster Mews
Front Rear
Day/Evening/Night Indicators
LAeq
Lden
LAeq
Lden
Day/Evening/Night Indicators
30
35
40
45
50
55
60
65
70
75
80
85
00:00 02:00 04:00 06:00 08:00 10:00 12:00 14:00 16:00 18:00 20:00 22:00 00:00
Time
No
ise
Level (d
B)
LAeq,1hr Front LA10,1hr Front LA90,1hr Front LAeq,1hr Rear LA10,1hr Rear LA90,1hr Rear
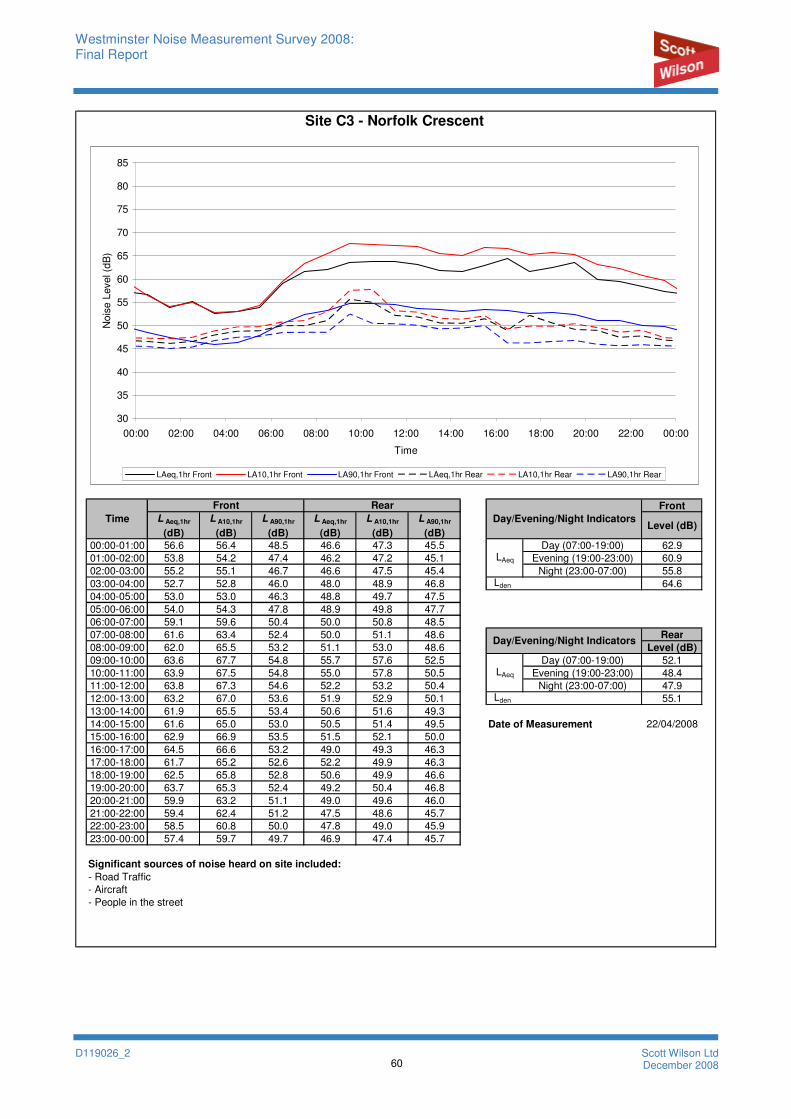
Westminster Noise Measurement Survey 2008: Final Report
D119026_2 60
Scott Wilson Ltd December 2008
Front
L Aeq,1hr
(dB)
L A10,1hr
(dB)
L A90,1hr
(dB)
L Aeq,1hr
(dB)
L A10,1hr
(dB)
L A90,1hr
(dB)Level (dB)
00:00-01:00 56.6 56.4 48.5 46.6 47.3 45.5 Day (07:00-19:00) 62.9
01:00-02:00 53.8 54.2 47.4 46.2 47.2 45.1 Evening (19:00-23:00) 60.9
02:00-03:00 55.2 55.1 46.7 46.6 47.5 45.4 Night (23:00-07:00) 55.8
03:00-04:00 52.7 52.8 46.0 48.0 48.9 46.8 64.6
04:00-05:00 53.0 53.0 46.3 48.8 49.7 47.5
05:00-06:00 54.0 54.3 47.8 48.9 49.8 47.7
06:00-07:00 59.1 59.6 50.4 50.0 50.8 48.5
07:00-08:00 61.6 63.4 52.4 50.0 51.1 48.6 Rear
08:00-09:00 62.0 65.5 53.2 51.1 53.0 48.6 Level (dB)
09:00-10:00 63.6 67.7 54.8 55.7 57.6 52.5 Day (07:00-19:00) 52.1
10:00-11:00 63.9 67.5 54.8 55.0 57.8 50.5 Evening (19:00-23:00) 48.4
11:00-12:00 63.8 67.3 54.6 52.2 53.2 50.4 Night (23:00-07:00) 47.9
12:00-13:00 63.2 67.0 53.6 51.9 52.9 50.1 55.1
13:00-14:00 61.9 65.5 53.4 50.6 51.6 49.3
14:00-15:00 61.6 65.0 53.0 50.5 51.4 49.5 Date of Measurement 22/04/2008
15:00-16:00 62.9 66.9 53.5 51.5 52.1 50.0
16:00-17:00 64.5 66.6 53.2 49.0 49.3 46.3
17:00-18:00 61.7 65.2 52.6 52.2 49.9 46.3
18:00-19:00 62.5 65.8 52.8 50.6 49.9 46.6
19:00-20:00 63.7 65.3 52.4 49.2 50.4 46.8
20:00-21:00 59.9 63.2 51.1 49.0 49.6 46.0
21:00-22:00 59.4 62.4 51.2 47.5 48.6 45.7
22:00-23:00 58.5 60.8 50.0 47.8 49.0 45.9
23:00-00:00 57.4 59.7 49.7 46.9 47.4 45.7
Significant sources of noise heard on site included:
- Road Traffic
- Aircraft
- People in the street
LAeq
Lden
LAeq
Lden
Day/Evening/Night Indicators
Time
Site C3 - Norfolk Crescent
Front Rear
Day/Evening/Night Indicators
30
35
40
45
50
55
60
65
70
75
80
85
00:00 02:00 04:00 06:00 08:00 10:00 12:00 14:00 16:00 18:00 20:00 22:00 00:00
Time
No
ise
Level (d
B)
LAeq,1hr Front LA10,1hr Front LA90,1hr Front LAeq,1hr Rear LA10,1hr Rear LA90,1hr Rear

Westminster Noise Measurement Survey 2008: Final Report
D119026_2 61
Scott Wilson Ltd December 2008
Front
L Aeq,1hr
(dB)
L A10,1hr
(dB)
L A90,1hr
(dB)
L Aeq,1hr
(dB)
L A10,1hr
(dB)
L A90,1hr
(dB)Level (dB)
00:00-01:00 42.6 42.6 39.2 37.9 39.8 34.7 Day (07:00-19:00) 59.1
01:00-02:00 44.6 41.7 38.4 36.2 37.9 34.0 Evening (19:00-23:00) 47.6
02:00-03:00 40.5 40.6 38.0 35.1 36.4 33.3 Night (23:00-07:00) 43.9
03:00-04:00 42.5 40.9 38.1 49.7 41.3 34.2 57.1
04:00-05:00 40.0 40.9 38.4 46.9 46.8 35.0
05:00-06:00 44.7 46.4 41.9 43.4 43.5 39.5
06:00-07:00 46.6 48.4 43.5 46.2 47.4 40.5
07:00-08:00 50.3 52.2 44.8 53.0 49.9 41.9 Rear
08:00-09:00 57.2 60.6 45.4 53.9 52.5 43.8 Level (dB)
09:00-10:00 57.6 61.8 48.4 49.6 51.3 44.4 Day (07:00-19:00) 50.2
10:00-11:00 56.8 56.8 48.0 48.6 50.6 45.0 Evening (19:00-23:00) 44.8
11:00-12:00 67.1 65.8 48.1 48.3 49.1 45.0 Night (23:00-07:00) 44.6
12:00-13:00 61.3 63.7 47.6 48.8 50.3 45.0 52.2
13:00-14:00 55.3 54.9 46.6 51.0 49.6 42.1
14:00-15:00 56.2 59.7 46.5 53.2 47.4 41.8 Date of Measurement 22/04/2008
15:00-16:00 56.8 59.7 46.0 48.3 46.7 41.2
16:00-17:00 48.5 50.3 44.6 46.7 46.3 41.4
17:00-18:00 48.9 51.0 44.9 43.7 45.5 41.4
18:00-19:00 50.3 51.1 45.3 45.8 47.0 41.7
19:00-20:00 48.9 49.5 43.8 46.2 47.1 41.2
20:00-21:00 46.5 48.5 43.1 45.1 46.8 40.8
21:00-22:00 47.9 49.6 41.9 43.6 45.1 38.3
22:00-23:00 46.7 49.3 41.6 43.7 44.8 38.7
23:00-00:00 45.4 46.4 40.2 40.5 42.1 37.1
Significant sources of noise heard on site included:
- Road Traffic
- Aircraft
- Renovation
Time
Site C4 - Bryanston Mews
Front Rear
Day/Evening/Night Indicators
LAeq
Lden
LAeq
Lden
Day/Evening/Night Indicators
30
35
40
45
50
55
60
65
70
75
80
85
00:00 02:00 04:00 06:00 08:00 10:00 12:00 14:00 16:00 18:00 20:00 22:00 00:00
Time
No
ise
Level (d
B)
LAeq,1hr Front LA10,1hr Front LA90,1hr Front LAeq,1hr Rear LA10,1hr Rear LA90,1hr Rear
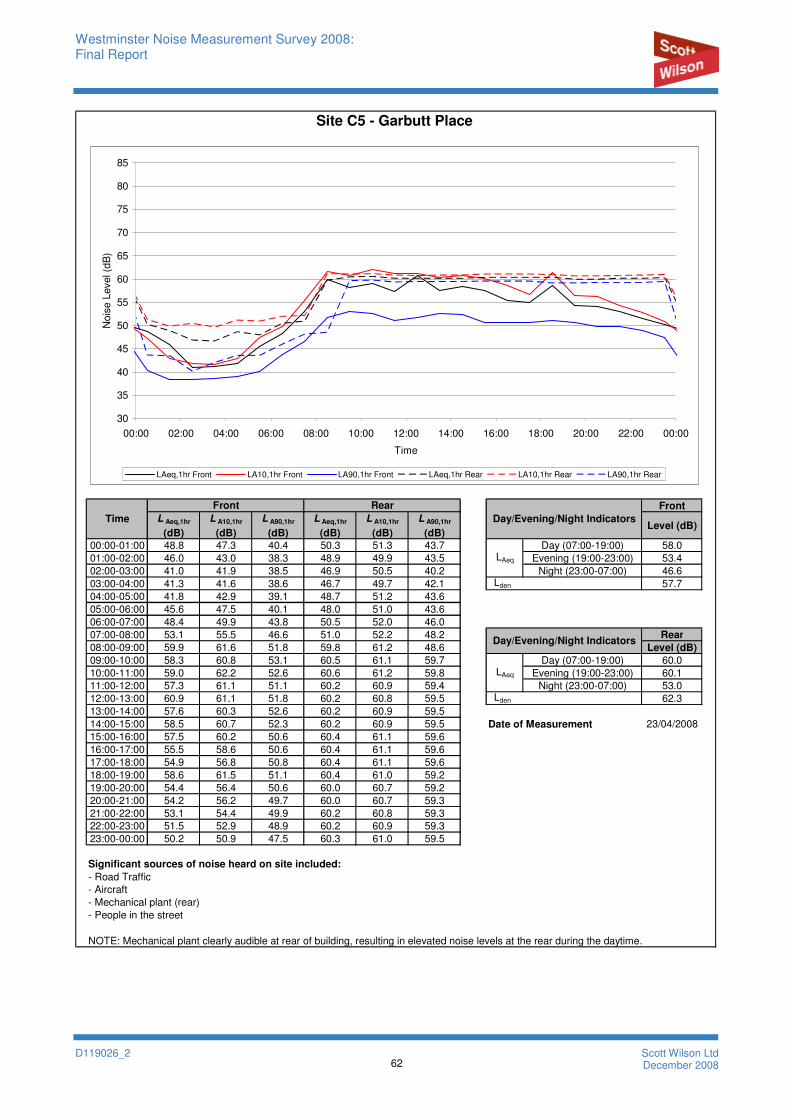
Westminster Noise Measurement Survey 2008: Final Report
D119026_2 62
Scott Wilson Ltd December 2008
Front
L Aeq,1hr
(dB)
L A10,1hr
(dB)
L A90,1hr
(dB)
L Aeq,1hr
(dB)
L A10,1hr
(dB)
L A90,1hr
(dB)Level (dB)
00:00-01:00 48.8 47.3 40.4 50.3 51.3 43.7 Day (07:00-19:00) 58.0
01:00-02:00 46.0 43.0 38.3 48.9 49.9 43.5 Evening (19:00-23:00) 53.4
02:00-03:00 41.0 41.9 38.5 46.9 50.5 40.2 Night (23:00-07:00) 46.6
03:00-04:00 41.3 41.6 38.6 46.7 49.7 42.1 57.7
04:00-05:00 41.8 42.9 39.1 48.7 51.2 43.6
05:00-06:00 45.6 47.5 40.1 48.0 51.0 43.6
06:00-07:00 48.4 49.9 43.8 50.5 52.0 46.0
07:00-08:00 53.1 55.5 46.6 51.0 52.2 48.2 Rear
08:00-09:00 59.9 61.6 51.8 59.8 61.2 48.6 Level (dB)
09:00-10:00 58.3 60.8 53.1 60.5 61.1 59.7 Day (07:00-19:00) 60.0
10:00-11:00 59.0 62.2 52.6 60.6 61.2 59.8 Evening (19:00-23:00) 60.1
11:00-12:00 57.3 61.1 51.1 60.2 60.9 59.4 Night (23:00-07:00) 53.0
12:00-13:00 60.9 61.1 51.8 60.2 60.8 59.5 62.3
13:00-14:00 57.6 60.3 52.6 60.2 60.9 59.5
14:00-15:00 58.5 60.7 52.3 60.2 60.9 59.5 Date of Measurement 23/04/2008
15:00-16:00 57.5 60.2 50.6 60.4 61.1 59.6
16:00-17:00 55.5 58.6 50.6 60.4 61.1 59.6
17:00-18:00 54.9 56.8 50.8 60.4 61.1 59.6
18:00-19:00 58.6 61.5 51.1 60.4 61.0 59.2
19:00-20:00 54.4 56.4 50.6 60.0 60.7 59.2
20:00-21:00 54.2 56.2 49.7 60.0 60.7 59.3
21:00-22:00 53.1 54.4 49.9 60.2 60.8 59.3
22:00-23:00 51.5 52.9 48.9 60.2 60.9 59.3
23:00-00:00 50.2 50.9 47.5 60.3 61.0 59.5
Significant sources of noise heard on site included:
- Road Traffic
- Aircraft
- Mechanical plant (rear)
- People in the street
NOTE: Mechanical plant clearly audible at rear of building, resulting in elevated noise levels at the rear during the daytime.
LAeq
Lden
Time
LAeq
Lden
Day/Evening/Night Indicators
Site C5 - Garbutt Place
Front Rear
Day/Evening/Night Indicators
30
35
40
45
50
55
60
65
70
75
80
85
00:00 02:00 04:00 06:00 08:00 10:00 12:00 14:00 16:00 18:00 20:00 22:00 00:00
Time
No
ise
Level (d
B)
LAeq,1hr Front LA10,1hr Front LA90,1hr Front LAeq,1hr Rear LA10,1hr Rear LA90,1hr Rear
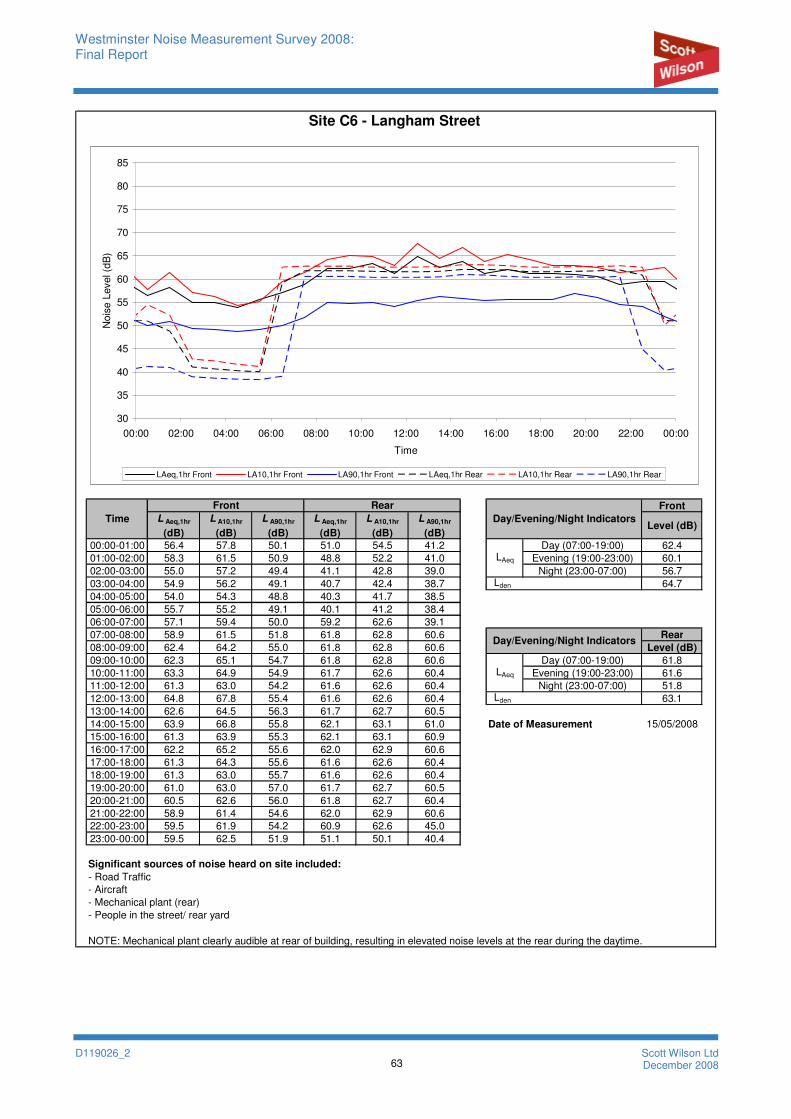
Westminster Noise Measurement Survey 2008: Final Report
D119026_2 63
Scott Wilson Ltd December 2008
Front
L Aeq,1hr
(dB)
L A10,1hr
(dB)
L A90,1hr
(dB)
L Aeq,1hr
(dB)
L A10,1hr
(dB)
L A90,1hr
(dB)Level (dB)
00:00-01:00 56.4 57.8 50.1 51.0 54.5 41.2 Day (07:00-19:00) 62.4
01:00-02:00 58.3 61.5 50.9 48.8 52.2 41.0 Evening (19:00-23:00) 60.1
02:00-03:00 55.0 57.2 49.4 41.1 42.8 39.0 Night (23:00-07:00) 56.7
03:00-04:00 54.9 56.2 49.1 40.7 42.4 38.7 64.7
04:00-05:00 54.0 54.3 48.8 40.3 41.7 38.5
05:00-06:00 55.7 55.2 49.1 40.1 41.2 38.4
06:00-07:00 57.1 59.4 50.0 59.2 62.6 39.1
07:00-08:00 58.9 61.5 51.8 61.8 62.8 60.6 Rear
08:00-09:00 62.4 64.2 55.0 61.8 62.8 60.6 Level (dB)
09:00-10:00 62.3 65.1 54.7 61.8 62.8 60.6 Day (07:00-19:00) 61.8
10:00-11:00 63.3 64.9 54.9 61.7 62.6 60.4 Evening (19:00-23:00) 61.6
11:00-12:00 61.3 63.0 54.2 61.6 62.6 60.4 Night (23:00-07:00) 51.8
12:00-13:00 64.8 67.8 55.4 61.6 62.6 60.4 63.1
13:00-14:00 62.6 64.5 56.3 61.7 62.7 60.5
14:00-15:00 63.9 66.8 55.8 62.1 63.1 61.0 Date of Measurement 15/05/2008
15:00-16:00 61.3 63.9 55.3 62.1 63.1 60.9
16:00-17:00 62.2 65.2 55.6 62.0 62.9 60.6
17:00-18:00 61.3 64.3 55.6 61.6 62.6 60.4
18:00-19:00 61.3 63.0 55.7 61.6 62.6 60.4
19:00-20:00 61.0 63.0 57.0 61.7 62.7 60.5
20:00-21:00 60.5 62.6 56.0 61.8 62.7 60.4
21:00-22:00 58.9 61.4 54.6 62.0 62.9 60.6
22:00-23:00 59.5 61.9 54.2 60.9 62.6 45.0
23:00-00:00 59.5 62.5 51.9 51.1 50.1 40.4
Significant sources of noise heard on site included:
- Road Traffic
- Aircraft
- Mechanical plant (rear)
- People in the street/ rear yard
NOTE: Mechanical plant clearly audible at rear of building, resulting in elevated noise levels at the rear during the daytime.
Time
Site C6 - Langham Street
Front Rear
Day/Evening/Night Indicators
LAeq
Lden
Day/Evening/Night Indicators
LAeq
Lden
30
35
40
45
50
55
60
65
70
75
80
85
00:00 02:00 04:00 06:00 08:00 10:00 12:00 14:00 16:00 18:00 20:00 22:00 00:00
Time
No
ise
Level (d
B)
LAeq,1hr Front LA10,1hr Front LA90,1hr Front LAeq,1hr Rear LA10,1hr Rear LA90,1hr Rear
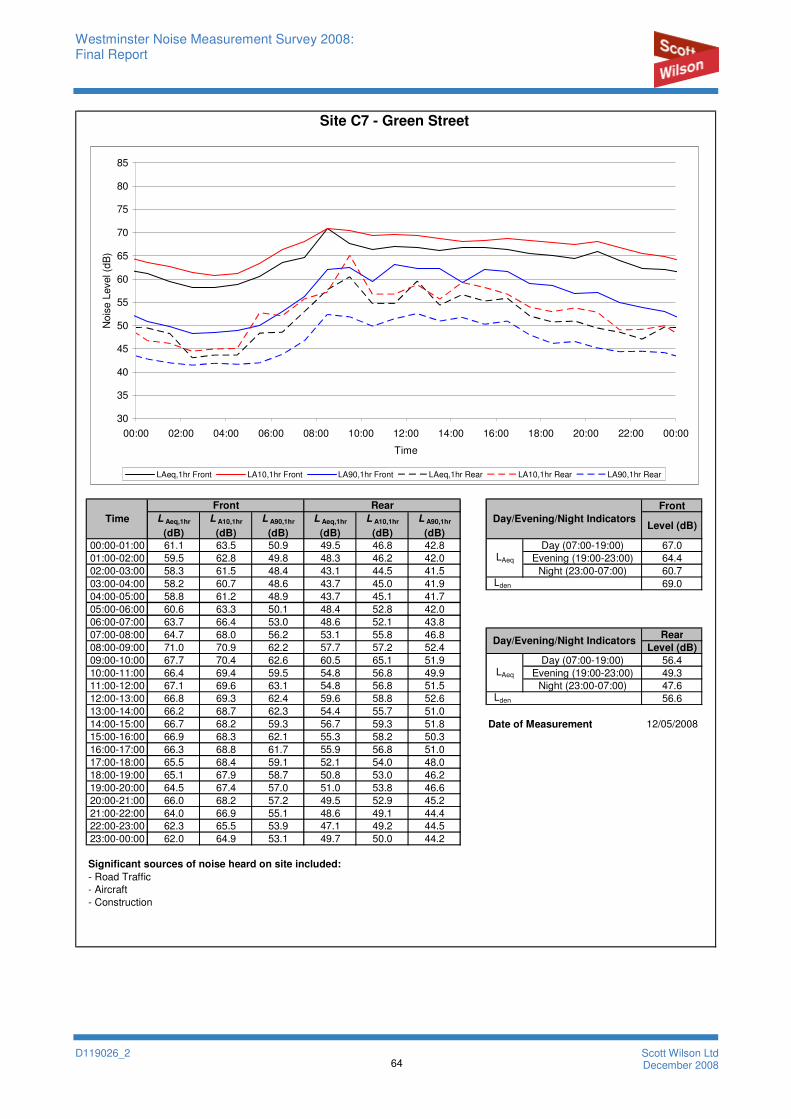
Westminster Noise Measurement Survey 2008: Final Report
D119026_2 64
Scott Wilson Ltd December 2008
Front
L Aeq,1hr
(dB)
L A10,1hr
(dB)
L A90,1hr
(dB)
L Aeq,1hr
(dB)
L A10,1hr
(dB)
L A90,1hr
(dB)Level (dB)
00:00-01:00 61.1 63.5 50.9 49.5 46.8 42.8 Day (07:00-19:00) 67.0
01:00-02:00 59.5 62.8 49.8 48.3 46.2 42.0 Evening (19:00-23:00) 64.4
02:00-03:00 58.3 61.5 48.4 43.1 44.5 41.5 Night (23:00-07:00) 60.7
03:00-04:00 58.2 60.7 48.6 43.7 45.0 41.9 69.0
04:00-05:00 58.8 61.2 48.9 43.7 45.1 41.7
05:00-06:00 60.6 63.3 50.1 48.4 52.8 42.0
06:00-07:00 63.7 66.4 53.0 48.6 52.1 43.8
07:00-08:00 64.7 68.0 56.2 53.1 55.8 46.8 Rear
08:00-09:00 71.0 70.9 62.2 57.7 57.2 52.4 Level (dB)
09:00-10:00 67.7 70.4 62.6 60.5 65.1 51.9 Day (07:00-19:00) 56.4
10:00-11:00 66.4 69.4 59.5 54.8 56.8 49.9 Evening (19:00-23:00) 49.3
11:00-12:00 67.1 69.6 63.1 54.8 56.8 51.5 Night (23:00-07:00) 47.6
12:00-13:00 66.8 69.3 62.4 59.6 58.8 52.6 56.6
13:00-14:00 66.2 68.7 62.3 54.4 55.7 51.0
14:00-15:00 66.7 68.2 59.3 56.7 59.3 51.8 Date of Measurement 12/05/2008
15:00-16:00 66.9 68.3 62.1 55.3 58.2 50.3
16:00-17:00 66.3 68.8 61.7 55.9 56.8 51.0
17:00-18:00 65.5 68.4 59.1 52.1 54.0 48.0
18:00-19:00 65.1 67.9 58.7 50.8 53.0 46.2
19:00-20:00 64.5 67.4 57.0 51.0 53.8 46.6
20:00-21:00 66.0 68.2 57.2 49.5 52.9 45.2
21:00-22:00 64.0 66.9 55.1 48.6 49.1 44.4
22:00-23:00 62.3 65.5 53.9 47.1 49.2 44.5
23:00-00:00 62.0 64.9 53.1 49.7 50.0 44.2
Significant sources of noise heard on site included:
- Road Traffic
- Aircraft
- Construction
LAeq
Lden
LAeq
Lden
Day/Evening/Night Indicators
Time
Site C7 - Green Street
Front Rear
Day/Evening/Night Indicators
30
35
40
45
50
55
60
65
70
75
80
85
00:00 02:00 04:00 06:00 08:00 10:00 12:00 14:00 16:00 18:00 20:00 22:00 00:00
Time
No
ise
Level (d
B)
LAeq,1hr Front LA10,1hr Front LA90,1hr Front LAeq,1hr Rear LA10,1hr Rear LA90,1hr Rear
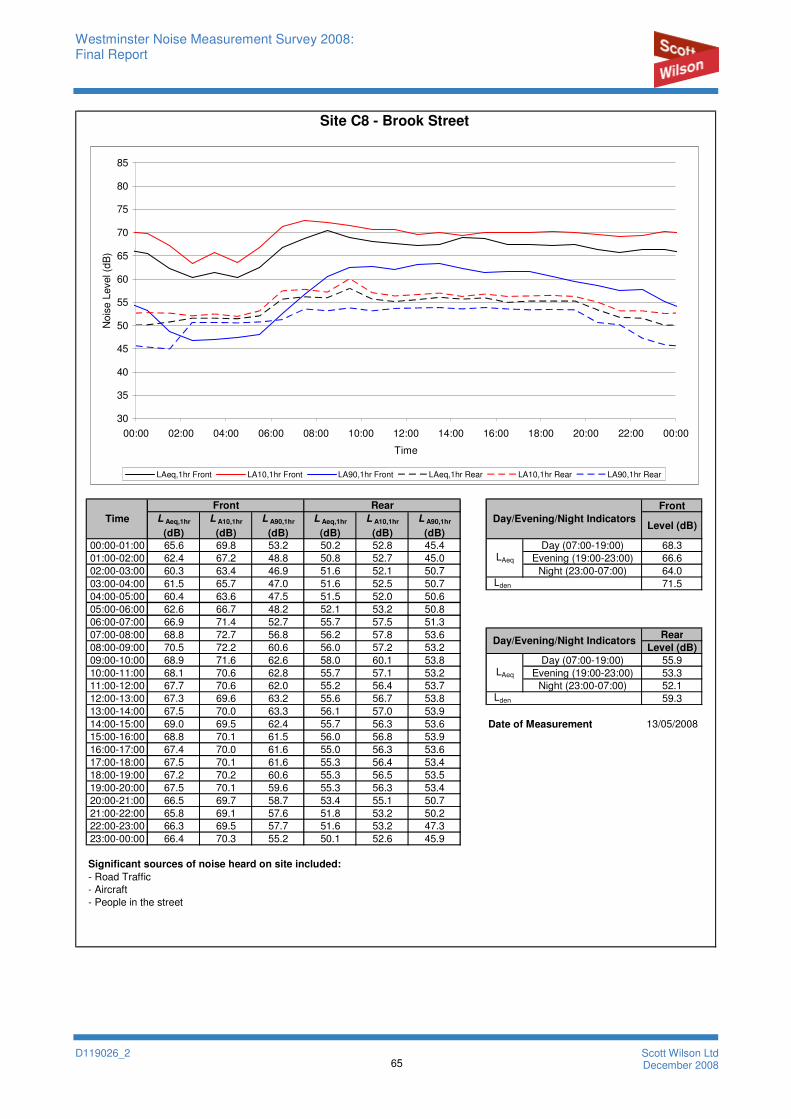
Westminster Noise Measurement Survey 2008: Final Report
D119026_2 65
Scott Wilson Ltd December 2008
Front
L Aeq,1hr
(dB)
L A10,1hr
(dB)
L A90,1hr
(dB)
L Aeq,1hr
(dB)
L A10,1hr
(dB)
L A90,1hr
(dB)Level (dB)
00:00-01:00 65.6 69.8 53.2 50.2 52.8 45.4 Day (07:00-19:00) 68.3
01:00-02:00 62.4 67.2 48.8 50.8 52.7 45.0 Evening (19:00-23:00) 66.6
02:00-03:00 60.3 63.4 46.9 51.6 52.1 50.7 Night (23:00-07:00) 64.0
03:00-04:00 61.5 65.7 47.0 51.6 52.5 50.7 71.5
04:00-05:00 60.4 63.6 47.5 51.5 52.0 50.6
05:00-06:00 62.6 66.7 48.2 52.1 53.2 50.8
06:00-07:00 66.9 71.4 52.7 55.7 57.5 51.3
07:00-08:00 68.8 72.7 56.8 56.2 57.8 53.6 Rear
08:00-09:00 70.5 72.2 60.6 56.0 57.2 53.2 Level (dB)
09:00-10:00 68.9 71.6 62.6 58.0 60.1 53.8 Day (07:00-19:00) 55.9
10:00-11:00 68.1 70.6 62.8 55.7 57.1 53.2 Evening (19:00-23:00) 53.3
11:00-12:00 67.7 70.6 62.0 55.2 56.4 53.7 Night (23:00-07:00) 52.1
12:00-13:00 67.3 69.6 63.2 55.6 56.7 53.8 59.3
13:00-14:00 67.5 70.0 63.3 56.1 57.0 53.9
14:00-15:00 69.0 69.5 62.4 55.7 56.3 53.6 Date of Measurement 13/05/2008
15:00-16:00 68.8 70.1 61.5 56.0 56.8 53.9
16:00-17:00 67.4 70.0 61.6 55.0 56.3 53.6
17:00-18:00 67.5 70.1 61.6 55.3 56.4 53.4
18:00-19:00 67.2 70.2 60.6 55.3 56.5 53.5
19:00-20:00 67.5 70.1 59.6 55.3 56.3 53.4
20:00-21:00 66.5 69.7 58.7 53.4 55.1 50.7
21:00-22:00 65.8 69.1 57.6 51.8 53.2 50.2
22:00-23:00 66.3 69.5 57.7 51.6 53.2 47.3
23:00-00:00 66.4 70.3 55.2 50.1 52.6 45.9
Significant sources of noise heard on site included:
- Road Traffic
- Aircraft
- People in the street
Time
Site C8 - Brook Street
Front Rear
Day/Evening/Night Indicators
LAeq
Lden
LAeq
Lden
Day/Evening/Night Indicators
30
35
40
45
50
55
60
65
70
75
80
85
00:00 02:00 04:00 06:00 08:00 10:00 12:00 14:00 16:00 18:00 20:00 22:00 00:00
Time
No
ise
Level (d
B)
LAeq,1hr Front LA10,1hr Front LA90,1hr Front LAeq,1hr Rear LA10,1hr Rear LA90,1hr Rear

Westminster Noise Measurement Survey 2008: Final Report
D119026_2 66
Scott Wilson Ltd December 2008
Front
L Aeq,1hr
(dB)
L A10,1hr
(dB)
L A90,1hr
(dB)
L Aeq,1hr
(dB)
L A10,1hr
(dB)
L A90,1hr
(dB)Level (dB)
00:00-01:00 63.9 67.2 55.0 48.5 49.0 47.9 Day (07:00-19:00) 70.2
01:00-02:00 63.2 66.4 52.9 48.3 49.0 47.7 Evening (19:00-23:00) 70.8
02:00-03:00 61.6 65.6 50.9 47.8 48.4 47.2 Night (23:00-07:00) 63.5
03:00-04:00 63.7 67.6 50.5 47.9 48.5 47.3 72.8
04:00-05:00 61.5 65.1 49.0 48.1 48.6 47.5
05:00-06:00 63.9 67.1 49.9 48.2 48.5 47.4
06:00-07:00 63.9 67.9 51.6 49.1 49.4 47.7
07:00-08:00 67.1 70.2 56.1 49.4 50.1 48.3 Rear
08:00-09:00 69.4 71.3 59.8 51.2 52.2 48.6 Level (dB)
09:00-10:00 73.5 70.9 61.1 55.3 54.4 49.3 Day (07:00-19:00) 54.4
10:00-11:00 67.8 70.5 62.3 53.1 54.9 50.2 Evening (19:00-23:00) 50.0
11:00-12:00 68.8 71.9 62.7 59.3 59.2 50.0 Night (23:00-07:00) 48.7
12:00-13:00 69.7 71.6 63.3 54.3 55.6 49.6 56.4
13:00-14:00 69.0 71.2 63.9 51.9 53.5 49.3
14:00-15:00 67.9 70.3 61.7 53.6 54.5 49.6 Date of Measurement 13/05/2008
15:00-16:00 72.3 70.3 61.5 54.0 55.6 50.0
16:00-17:00 67.6 69.8 61.1 54.4 55.9 50.3
17:00-18:00 68.1 70.1 62.5 55.2 57.6 50.7
18:00-19:00 73.6 70.6 63.2 53.0 54.2 49.7
19:00-20:00 71.6 70.2 63.4 50.5 51.1 49.2
20:00-21:00 70.1 70.5 64.3 50.3 50.8 48.7
21:00-22:00 72.2 70.3 62.5 50.1 50.0 48.4
22:00-23:00 68.6 69.7 60.4 48.8 49.4 47.9
23:00-00:00 65.1 68.2 57.3 51.0 49.6 48.0
Significant sources of noise heard on site included:
- Road Traffic
- Aircraft
- People in the street
LAeq
Lden
LAeq
Lden
Day/Evening/Night Indicators
Time
Site C9 - Wardour Street
Front Rear
Day/Evening/Night Indicators
30
35
40
45
50
55
60
65
70
75
80
85
00:00 02:00 04:00 06:00 08:00 10:00 12:00 14:00 16:00 18:00 20:00 22:00 00:00
Time
No
ise
Level (d
B)
LAeq,1hr Front LA10,1hr Front LA90,1hr Front LAeq,1hr Rear LA10,1hr Rear LA90,1hr Rear
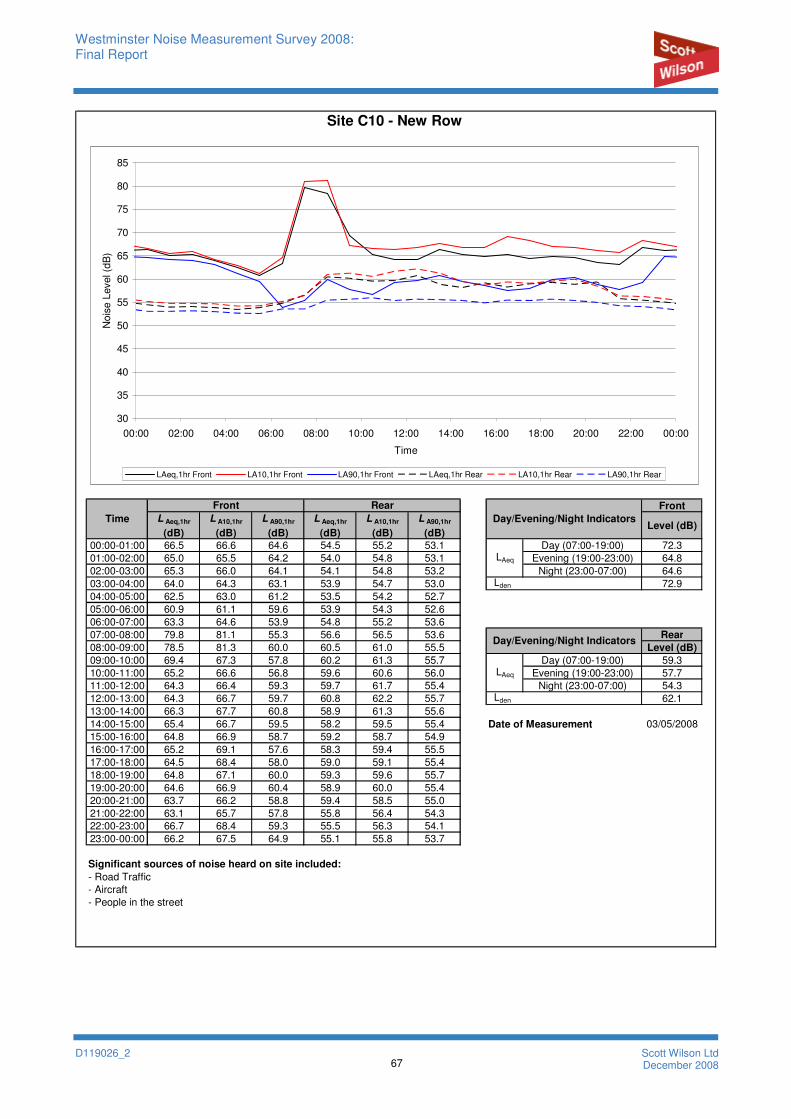
Westminster Noise Measurement Survey 2008: Final Report
D119026_2 67
Scott Wilson Ltd December 2008
Front
L Aeq,1hr
(dB)
L A10,1hr
(dB)
L A90,1hr
(dB)
L Aeq,1hr
(dB)
L A10,1hr
(dB)
L A90,1hr
(dB)Level (dB)
00:00-01:00 66.5 66.6 64.6 54.5 55.2 53.1 Day (07:00-19:00) 72.3
01:00-02:00 65.0 65.5 64.2 54.0 54.8 53.1 Evening (19:00-23:00) 64.8
02:00-03:00 65.3 66.0 64.1 54.1 54.8 53.2 Night (23:00-07:00) 64.6
03:00-04:00 64.0 64.3 63.1 53.9 54.7 53.0 72.9
04:00-05:00 62.5 63.0 61.2 53.5 54.2 52.7
05:00-06:00 60.9 61.1 59.6 53.9 54.3 52.6
06:00-07:00 63.3 64.6 53.9 54.8 55.2 53.6
07:00-08:00 79.8 81.1 55.3 56.6 56.5 53.6 Rear
08:00-09:00 78.5 81.3 60.0 60.5 61.0 55.5 Level (dB)
09:00-10:00 69.4 67.3 57.8 60.2 61.3 55.7 Day (07:00-19:00) 59.3
10:00-11:00 65.2 66.6 56.8 59.6 60.6 56.0 Evening (19:00-23:00) 57.7
11:00-12:00 64.3 66.4 59.3 59.7 61.7 55.4 Night (23:00-07:00) 54.3
12:00-13:00 64.3 66.7 59.7 60.8 62.2 55.7 62.1
13:00-14:00 66.3 67.7 60.8 58.9 61.3 55.6
14:00-15:00 65.4 66.7 59.5 58.2 59.5 55.4 Date of Measurement 03/05/2008
15:00-16:00 64.8 66.9 58.7 59.2 58.7 54.9
16:00-17:00 65.2 69.1 57.6 58.3 59.4 55.5
17:00-18:00 64.5 68.4 58.0 59.0 59.1 55.4
18:00-19:00 64.8 67.1 60.0 59.3 59.6 55.7
19:00-20:00 64.6 66.9 60.4 58.9 60.0 55.4
20:00-21:00 63.7 66.2 58.8 59.4 58.5 55.0
21:00-22:00 63.1 65.7 57.8 55.8 56.4 54.3
22:00-23:00 66.7 68.4 59.3 55.5 56.3 54.1
23:00-00:00 66.2 67.5 64.9 55.1 55.8 53.7
Significant sources of noise heard on site included:
- Road Traffic
- Aircraft
- People in the street
Time
Site C10 - New Row
Front Rear
Day/Evening/Night Indicators
LAeq
Lden
LAeq
Lden
Day/Evening/Night Indicators
30
35
40
45
50
55
60
65
70
75
80
85
00:00 02:00 04:00 06:00 08:00 10:00 12:00 14:00 16:00 18:00 20:00 22:00 00:00
Time
No
ise
Level (d
B)
LAeq,1hr Front LA10,1hr Front LA90,1hr Front LAeq,1hr Rear LA10,1hr Rear LA90,1hr Rear

Westminster Noise Measurement Survey 2008: Final Report
D119026_2 68
Scott Wilson Ltd December 2008
Front
L Aeq,1hr
(dB)
L A10,1hr
(dB)
L A90,1hr
(dB)
L Aeq,1hr
(dB)
L A10,1hr
(dB)
L A90,1hr
(dB)Level (dB)
00:00-01:00 60.6 61.7 57.8 55.0 56.6 52.9 Day (07:00-19:00) 65.3
01:00-02:00 60.3 59.9 56.9 53.6 55.9 50.4 Evening (19:00-23:00) 62.7
02:00-03:00 59.5 59.5 57.0 53.0 55.4 50.0 Night (23:00-07:00) 61.4
03:00-04:00 60.6 58.6 57.2 56.1 57.7 50.8 68.7
04:00-05:00 60.1 60.8 57.1 53.6 56.0 50.1
05:00-06:00 63.1 62.8 57.7 55.2 57.6 51.5
06:00-07:00 63.8 64.6 58.5 56.2 58.3 52.6
07:00-08:00 66.1 68.5 59.6 59.7 61.6 56.5 Rear
08:00-09:00 67.5 70.6 59.9 59.2 61.1 56.6 Level (dB)
09:00-10:00 66.7 69.1 59.5 60.3 60.7 56.9 Day (07:00-19:00) 60.4
10:00-11:00 65.0 67.2 59.7 60.3 61.1 59.2 Evening (19:00-23:00) 58.4
11:00-12:00 67.1 69.0 60.4 61.3 61.9 59.5 Night (23:00-07:00) 55.4
12:00-13:00 65.0 67.9 59.7 61.7 63.0 59.8 63.2
13:00-14:00 64.4 66.5 59.3 60.5 61.3 59.1
14:00-15:00 63.2 65.5 59.2 61.1 61.7 58.3 Date of Measurement 06/05/2008
15:00-16:00 64.6 67.3 60.0 60.4 61.9 58.4
16:00-17:00 64.2 66.5 60.6 60.3 61.0 58.6
17:00-18:00 63.8 65.3 60.8 59.8 60.7 58.2
18:00-19:00 63.3 65.1 60.7 60.1 61.3 57.9
19:00-20:00 64.0 65.3 60.2 59.6 60.4 57.3
20:00-21:00 61.9 63.1 59.8 58.7 59.5 56.5
21:00-22:00 61.5 62.8 59.5 58.0 58.6 54.9
22:00-23:00 63.1 64.6 59.3 56.6 57.3 54.1
23:00-00:00 61.6 62.2 58.5 58.2 57.5 53.5
Significant sources of noise heard on site included:
- Road Traffic
- Aircraft
- People in the street
LAeq
Lden
LAeq
Lden
Day/Evening/Night Indicators
Time
Site C11 - John Adam Street
Front Rear
Day/Evening/Night Indicators
30
35
40
45
50
55
60
65
70
75
80
85
00:00 02:00 04:00 06:00 08:00 10:00 12:00 14:00 16:00 18:00 20:00 22:00 00:00
Time
No
ise
Level (d
B)
LAeq,1hr Front LA10,1hr Front LA90,1hr Front LAeq,1hr Rear LA10,1hr Rear LA90,1hr Rear
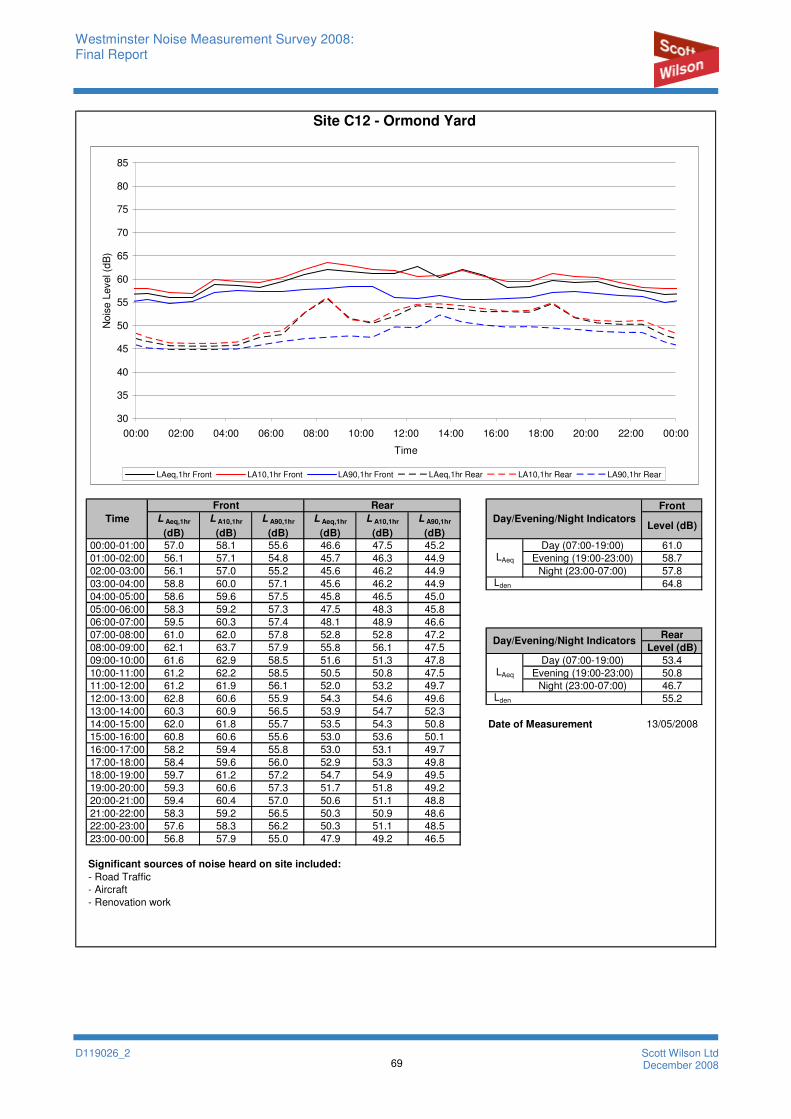
Westminster Noise Measurement Survey 2008: Final Report
D119026_2 69
Scott Wilson Ltd December 2008
Front
L Aeq,1hr
(dB)
L A10,1hr
(dB)
L A90,1hr
(dB)
L Aeq,1hr
(dB)
L A10,1hr
(dB)
L A90,1hr
(dB)Level (dB)
00:00-01:00 57.0 58.1 55.6 46.6 47.5 45.2 Day (07:00-19:00) 61.0
01:00-02:00 56.1 57.1 54.8 45.7 46.3 44.9 Evening (19:00-23:00) 58.7
02:00-03:00 56.1 57.0 55.2 45.6 46.2 44.9 Night (23:00-07:00) 57.8
03:00-04:00 58.8 60.0 57.1 45.6 46.2 44.9 64.8
04:00-05:00 58.6 59.6 57.5 45.8 46.5 45.0
05:00-06:00 58.3 59.2 57.3 47.5 48.3 45.8
06:00-07:00 59.5 60.3 57.4 48.1 48.9 46.6
07:00-08:00 61.0 62.0 57.8 52.8 52.8 47.2 Rear
08:00-09:00 62.1 63.7 57.9 55.8 56.1 47.5 Level (dB)
09:00-10:00 61.6 62.9 58.5 51.6 51.3 47.8 Day (07:00-19:00) 53.4
10:00-11:00 61.2 62.2 58.5 50.5 50.8 47.5 Evening (19:00-23:00) 50.8
11:00-12:00 61.2 61.9 56.1 52.0 53.2 49.7 Night (23:00-07:00) 46.7
12:00-13:00 62.8 60.6 55.9 54.3 54.6 49.6 55.2
13:00-14:00 60.3 60.9 56.5 53.9 54.7 52.3
14:00-15:00 62.0 61.8 55.7 53.5 54.3 50.8 Date of Measurement 13/05/2008
15:00-16:00 60.8 60.6 55.6 53.0 53.6 50.1
16:00-17:00 58.2 59.4 55.8 53.0 53.1 49.7
17:00-18:00 58.4 59.6 56.0 52.9 53.3 49.8
18:00-19:00 59.7 61.2 57.2 54.7 54.9 49.5
19:00-20:00 59.3 60.6 57.3 51.7 51.8 49.2
20:00-21:00 59.4 60.4 57.0 50.6 51.1 48.8
21:00-22:00 58.3 59.2 56.5 50.3 50.9 48.6
22:00-23:00 57.6 58.3 56.2 50.3 51.1 48.5
23:00-00:00 56.8 57.9 55.0 47.9 49.2 46.5
Significant sources of noise heard on site included:
- Road Traffic
- Aircraft
- Renovation work
Time
Site C12 - Ormond Yard
Front Rear
Day/Evening/Night Indicators
LAeq
Lden
LAeq
Lden
Day/Evening/Night Indicators
30
35
40
45
50
55
60
65
70
75
80
85
00:00 02:00 04:00 06:00 08:00 10:00 12:00 14:00 16:00 18:00 20:00 22:00 00:00
Time
No
ise
Level (d
B)
LAeq,1hr Front LA10,1hr Front LA90,1hr Front LAeq,1hr Rear LA10,1hr Rear LA90,1hr Rear
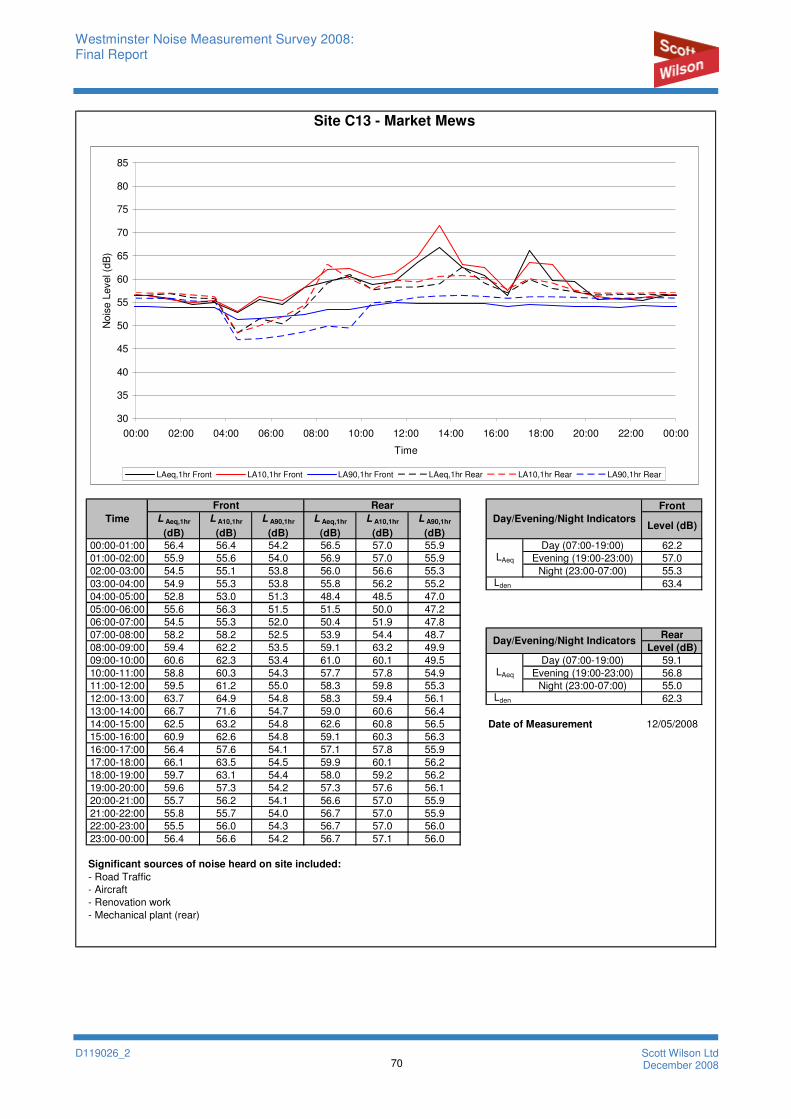
Westminster Noise Measurement Survey 2008: Final Report
D119026_2 70
Scott Wilson Ltd December 2008
Front
L Aeq,1hr
(dB)
L A10,1hr
(dB)
L A90,1hr
(dB)
L Aeq,1hr
(dB)
L A10,1hr
(dB)
L A90,1hr
(dB)Level (dB)
00:00-01:00 56.4 56.4 54.2 56.5 57.0 55.9 Day (07:00-19:00) 62.2
01:00-02:00 55.9 55.6 54.0 56.9 57.0 55.9 Evening (19:00-23:00) 57.0
02:00-03:00 54.5 55.1 53.8 56.0 56.6 55.3 Night (23:00-07:00) 55.3
03:00-04:00 54.9 55.3 53.8 55.8 56.2 55.2 63.4
04:00-05:00 52.8 53.0 51.3 48.4 48.5 47.0
05:00-06:00 55.6 56.3 51.5 51.5 50.0 47.2
06:00-07:00 54.5 55.3 52.0 50.4 51.9 47.8
07:00-08:00 58.2 58.2 52.5 53.9 54.4 48.7 Rear
08:00-09:00 59.4 62.2 53.5 59.1 63.2 49.9 Level (dB)
09:00-10:00 60.6 62.3 53.4 61.0 60.1 49.5 Day (07:00-19:00) 59.1
10:00-11:00 58.8 60.3 54.3 57.7 57.8 54.9 Evening (19:00-23:00) 56.8
11:00-12:00 59.5 61.2 55.0 58.3 59.8 55.3 Night (23:00-07:00) 55.0
12:00-13:00 63.7 64.9 54.8 58.3 59.4 56.1 62.3
13:00-14:00 66.7 71.6 54.7 59.0 60.6 56.4
14:00-15:00 62.5 63.2 54.8 62.6 60.8 56.5 Date of Measurement 12/05/2008
15:00-16:00 60.9 62.6 54.8 59.1 60.3 56.3
16:00-17:00 56.4 57.6 54.1 57.1 57.8 55.9
17:00-18:00 66.1 63.5 54.5 59.9 60.1 56.2
18:00-19:00 59.7 63.1 54.4 58.0 59.2 56.2
19:00-20:00 59.6 57.3 54.2 57.3 57.6 56.1
20:00-21:00 55.7 56.2 54.1 56.6 57.0 55.9
21:00-22:00 55.8 55.7 54.0 56.7 57.0 55.9
22:00-23:00 55.5 56.0 54.3 56.7 57.0 56.0
23:00-00:00 56.4 56.6 54.2 56.7 57.1 56.0
Significant sources of noise heard on site included:
- Road Traffic
- Aircraft
- Renovation work
- Mechanical plant (rear)
LAeq
Lden
LAeq
Lden
Day/Evening/Night Indicators
Time
Site C13 - Market Mews
Front Rear
Day/Evening/Night Indicators
30
35
40
45
50
55
60
65
70
75
80
85
00:00 02:00 04:00 06:00 08:00 10:00 12:00 14:00 16:00 18:00 20:00 22:00 00:00
Time
No
ise
Level (d
B)
LAeq,1hr Front LA10,1hr Front LA90,1hr Front LAeq,1hr Rear LA10,1hr Rear LA90,1hr Rear
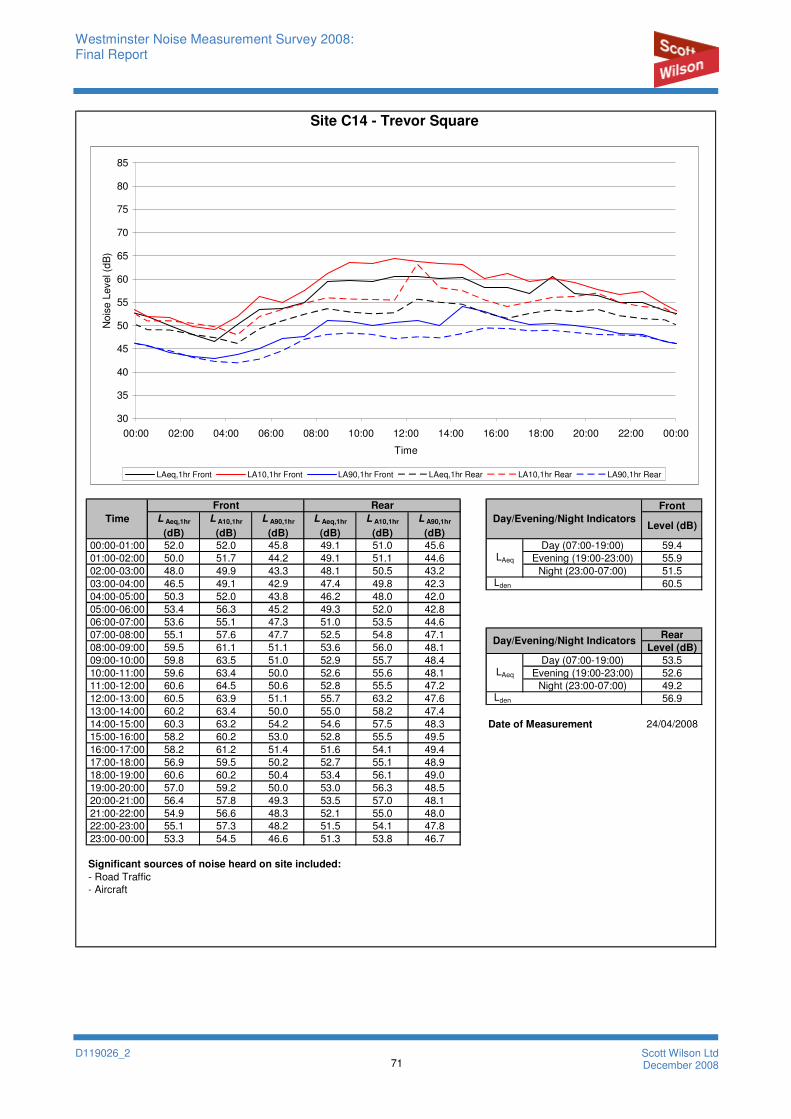
Westminster Noise Measurement Survey 2008: Final Report
D119026_2 71
Scott Wilson Ltd December 2008
Front
L Aeq,1hr
(dB)
L A10,1hr
(dB)
L A90,1hr
(dB)
L Aeq,1hr
(dB)
L A10,1hr
(dB)
L A90,1hr
(dB)Level (dB)
00:00-01:00 52.0 52.0 45.8 49.1 51.0 45.6 Day (07:00-19:00) 59.4
01:00-02:00 50.0 51.7 44.2 49.1 51.1 44.6 Evening (19:00-23:00) 55.9
02:00-03:00 48.0 49.9 43.3 48.1 50.5 43.2 Night (23:00-07:00) 51.5
03:00-04:00 46.5 49.1 42.9 47.4 49.8 42.3 60.5
04:00-05:00 50.3 52.0 43.8 46.2 48.0 42.0
05:00-06:00 53.4 56.3 45.2 49.3 52.0 42.8
06:00-07:00 53.6 55.1 47.3 51.0 53.5 44.6
07:00-08:00 55.1 57.6 47.7 52.5 54.8 47.1 Rear
08:00-09:00 59.5 61.1 51.1 53.6 56.0 48.1 Level (dB)
09:00-10:00 59.8 63.5 51.0 52.9 55.7 48.4 Day (07:00-19:00) 53.5
10:00-11:00 59.6 63.4 50.0 52.6 55.6 48.1 Evening (19:00-23:00) 52.6
11:00-12:00 60.6 64.5 50.6 52.8 55.5 47.2 Night (23:00-07:00) 49.2
12:00-13:00 60.5 63.9 51.1 55.7 63.2 47.6 56.9
13:00-14:00 60.2 63.4 50.0 55.0 58.2 47.4
14:00-15:00 60.3 63.2 54.2 54.6 57.5 48.3 Date of Measurement 24/04/2008
15:00-16:00 58.2 60.2 53.0 52.8 55.5 49.5
16:00-17:00 58.2 61.2 51.4 51.6 54.1 49.4
17:00-18:00 56.9 59.5 50.2 52.7 55.1 48.9
18:00-19:00 60.6 60.2 50.4 53.4 56.1 49.0
19:00-20:00 57.0 59.2 50.0 53.0 56.3 48.5
20:00-21:00 56.4 57.8 49.3 53.5 57.0 48.1
21:00-22:00 54.9 56.6 48.3 52.1 55.0 48.0
22:00-23:00 55.1 57.3 48.2 51.5 54.1 47.8
23:00-00:00 53.3 54.5 46.6 51.3 53.8 46.7
Significant sources of noise heard on site included:
- Road Traffic
- Aircraft
Time
Site C14 - Trevor Square
Front Rear
Day/Evening/Night Indicators
LAeq
Lden
LAeq
Lden
Day/Evening/Night Indicators
30
35
40
45
50
55
60
65
70
75
80
85
00:00 02:00 04:00 06:00 08:00 10:00 12:00 14:00 16:00 18:00 20:00 22:00 00:00
Time
No
ise
Level (d
B)
LAeq,1hr Front LA10,1hr Front LA90,1hr Front LAeq,1hr Rear LA10,1hr Rear LA90,1hr Rear

Westminster Noise Measurement Survey 2008: Final Report
D119026_2 72
Scott Wilson Ltd December 2008
Front
L Aeq,1hr
(dB)
L A10,1hr
(dB)
L A90,1hr
(dB)
L Aeq,1hr
(dB)
L A10,1hr
(dB)
L A90,1hr
(dB)Level (dB)
00:00-01:00 49.2 50.2 41.3 38.1 39.3 36.8 Day (07:00-19:00) 56.5
01:00-02:00 49.4 48.5 39.1 37.6 38.8 36.3 Evening (19:00-23:00) 54.9
02:00-03:00 46.3 48.1 36.4 35.8 37.0 34.5 Night (23:00-07:00) 48.8
03:00-04:00 47.0 45.3 34.1 35.7 36.7 33.8 58.1
04:00-05:00 41.9 45.1 34.6 43.9 43.5 33.8
05:00-06:00 44.9 47.3 36.7 42.4 43.2 34.6
06:00-07:00 51.2 50.9 41.4 52.7 54.9 36.8
07:00-08:00 53.7 55.1 44.4 52.0 53.9 38.0 Rear
08:00-09:00 57.8 60.5 48.2 51.0 51.5 38.4 Level (dB)
09:00-10:00 57.0 57.9 47.1 49.6 51.1 38.7 Day (07:00-19:00) 55.5
10:00-11:00 55.1 55.6 46.9 47.9 47.0 37.7 Evening (19:00-23:00) 51.0
11:00-12:00 58.4 58.9 46.9 46.2 48.0 38.1 Night (23:00-07:00) 45.1
12:00-13:00 55.4 57.4 48.8 47.8 48.4 41.7 55.5
13:00-14:00 56.6 59.0 49.5 51.3 52.4 42.0
14:00-15:00 56.0 58.6 48.3 51.8 53.8 41.9 Date of Measurement 08/05/2008
15:00-16:00 55.7 57.7 49.2 50.8 51.7 42.1
16:00-17:00 56.6 58.4 48.4 50.5 49.8 41.4
17:00-18:00 58.1 59.8 48.3 64.6 56.3 41.7
18:00-19:00 55.5 59.3 47.4 55.2 57.0 40.3
19:00-20:00 55.1 57.5 46.4 54.8 57.0 40.0
20:00-21:00 53.8 55.4 46.1 45.9 46.3 39.3
21:00-22:00 56.5 58.4 45.2 50.9 50.5 39.0
22:00-23:00 53.7 55.2 45.5 45.5 47.5 39.2
23:00-00:00 52.3 53.8 44.2 40.1 41.5 38.6
Significant sources of noise heard on site included:
- Road Traffic
- Aircraft
- Renovation work
LAeq
Lden
LAeq
Lden
Day/Evening/Night Indicators
Time
Site C15 - Denbigh Street
Front Rear
Day/Evening/Night Indicators
30
35
40
45
50
55
60
65
70
75
80
85
00:00 02:00 04:00 06:00 08:00 10:00 12:00 14:00 16:00 18:00 20:00 22:00 00:00
Time
No
ise
Level (d
B)
LAeq,1hr Front LA10,1hr Front LA90,1hr Front LAeq,1hr Rear LA10,1hr Rear LA90,1hr Rear
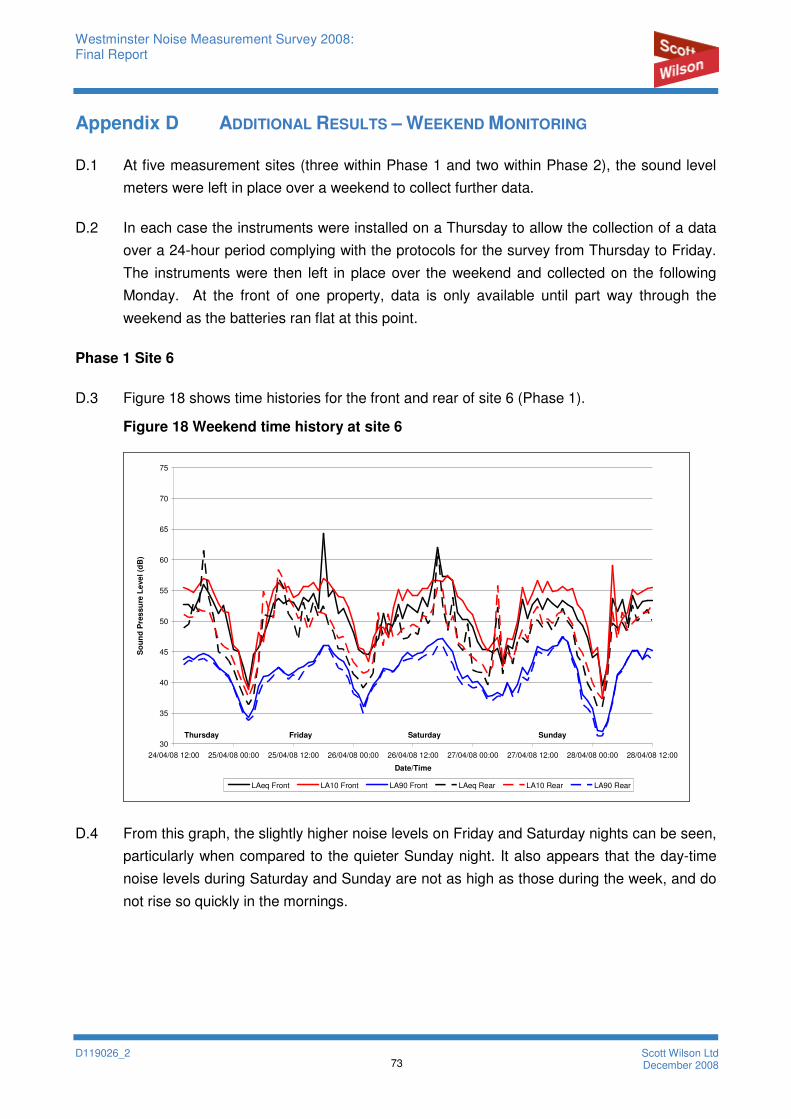
Westminster Noise Measurement Survey 2008: Final Report
D119026_2 73
Scott Wilson Ltd December 2008
Appendix D ADDITIONAL RESULTS – WEEKEND MONITORING
D.1 At five measurement sites (three within Phase 1 and two within Phase 2), the sound level
meters were left in place over a weekend to collect further data.
D.2 In each case the instruments were installed on a Thursday to allow the collection of a data
over a 24-hour period complying with the protocols for the survey from Thursday to Friday.
The instruments were then left in place over the weekend and collected on the following
Monday. At the front of one property, data is only available until part way through the
weekend as the batteries ran flat at this point.
Phase 1 Site 6
D.3 Figure 18 shows time histories for the front and rear of site 6 (Phase 1).
Figure 18 Weekend time history at site 6
30
35
40
45
50
55
60
65
70
75
24/04/08 12:00 25/04/08 00:00 25/04/08 12:00 26/04/08 00:00 26/04/08 12:00 27/04/08 00:00 27/04/08 12:00 28/04/08 00:00 28/04/08 12:00
Date/Time
So
un
d P
res
su
re L
eve
l (d
B)
LAeq Front LA10 Front LA90 Front LAeq Rear LA10 Rear LA90 Rear
Thursday Friday Saturday Sunday
Monday
D.4 From this graph, the slightly higher noise levels on Friday and Saturday nights can be seen,
particularly when compared to the quieter Sunday night. It also appears that the day-time
noise levels during Saturday and Sunday are not as high as those during the week, and do
not rise so quickly in the mornings.
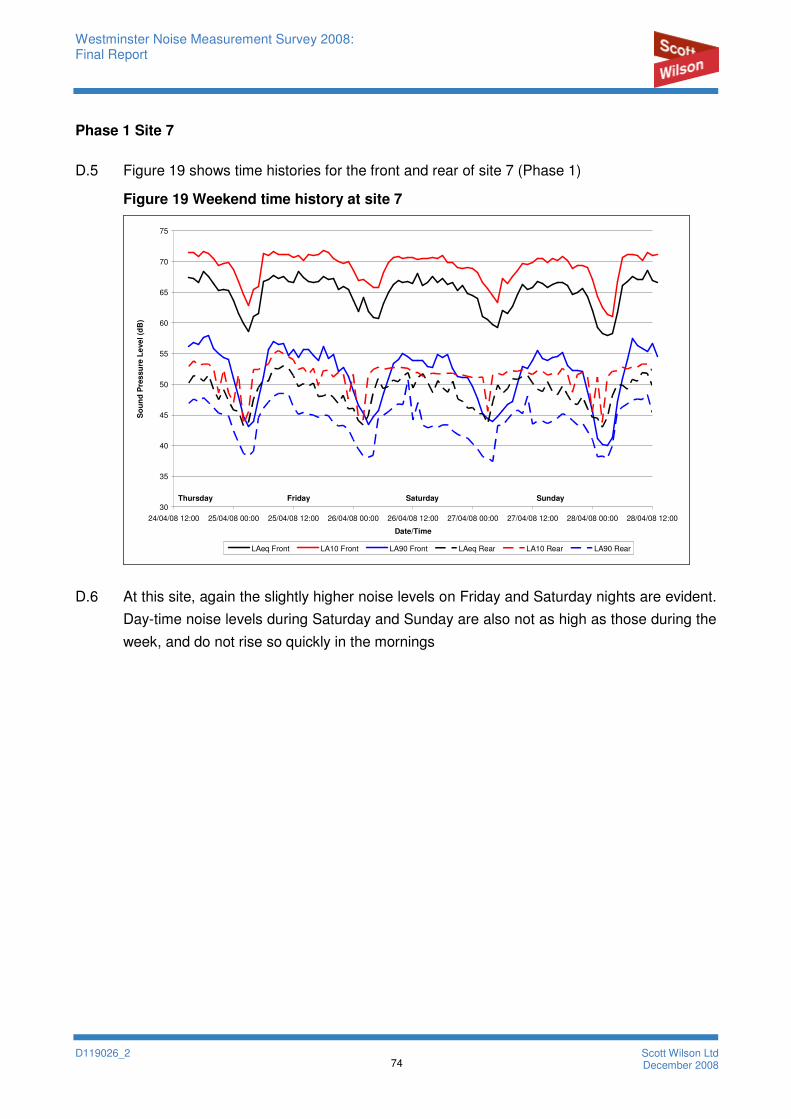
Westminster Noise Measurement Survey 2008: Final Report
D119026_2 74
Scott Wilson Ltd December 2008
Phase 1 Site 7
D.5 Figure 19 shows time histories for the front and rear of site 7 (Phase 1)
Figure 19 Weekend time history at site 7
30
35
40
45
50
55
60
65
70
75
24/04/08 12:00 25/04/08 00:00 25/04/08 12:00 26/04/08 00:00 26/04/08 12:00 27/04/08 00:00 27/04/08 12:00 28/04/08 00:00 28/04/08 12:00
Date/Time
So
un
d P
res
su
re L
eve
l (d
B)
LAeq Front LA10 Front LA90 Front LAeq Rear LA10 Rear LA90 Rear
Thursday Friday Saturday Sunday
Monday
D.6 At this site, again the slightly higher noise levels on Friday and Saturday nights are evident.
Day-time noise levels during Saturday and Sunday are also not as high as those during the
week, and do not rise so quickly in the mornings
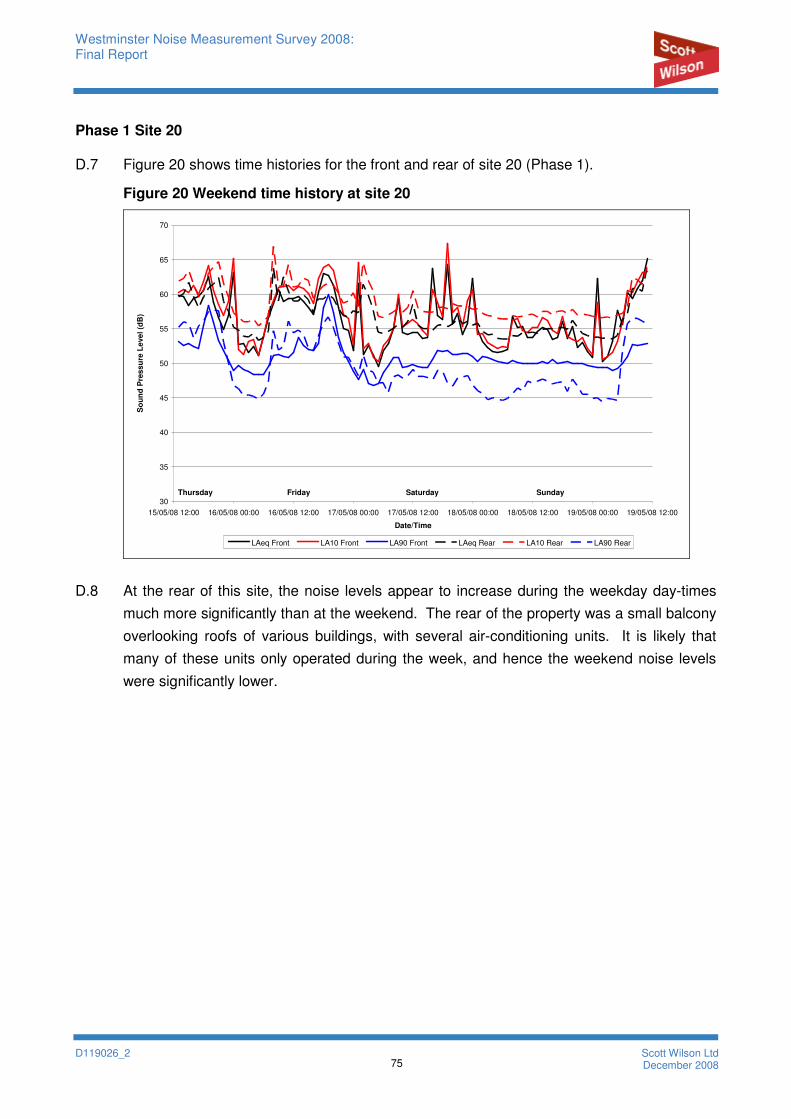
Westminster Noise Measurement Survey 2008: Final Report
D119026_2 75
Scott Wilson Ltd December 2008
Phase 1 Site 20
D.7 Figure 20 shows time histories for the front and rear of site 20 (Phase 1).
Figure 20 Weekend time history at site 20
30
35
40
45
50
55
60
65
70
15/05/08 12:00 16/05/08 00:00 16/05/08 12:00 17/05/08 00:00 17/05/08 12:00 18/05/08 00:00 18/05/08 12:00 19/05/08 00:00 19/05/08 12:00
Date/Time
So
un
d P
res
su
re L
eve
l (d
B)
LAeq Front LA10 Front LA90 Front LAeq Rear LA10 Rear LA90 Rear
Thursday Friday Saturday Sunday
Monday
D.8 At the rear of this site, the noise levels appear to increase during the weekday day-times
much more significantly than at the weekend. The rear of the property was a small balcony
overlooking roofs of various buildings, with several air-conditioning units. It is likely that
many of these units only operated during the week, and hence the weekend noise levels
were significantly lower.
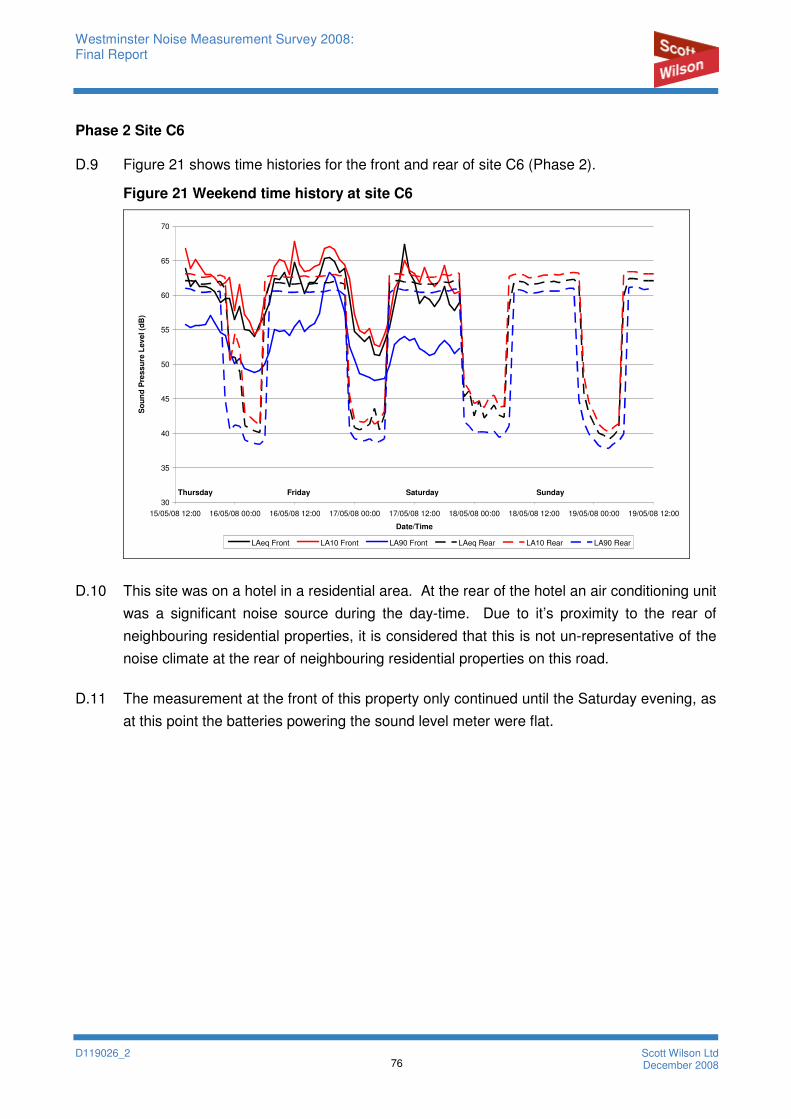
Westminster Noise Measurement Survey 2008: Final Report
D119026_2 76
Scott Wilson Ltd December 2008
Phase 2 Site C6
D.9 Figure 21 shows time histories for the front and rear of site C6 (Phase 2).
Figure 21 Weekend time history at site C6
30
35
40
45
50
55
60
65
70
15/05/08 12:00 16/05/08 00:00 16/05/08 12:00 17/05/08 00:00 17/05/08 12:00 18/05/08 00:00 18/05/08 12:00 19/05/08 00:00 19/05/08 12:00
Date/Time
So
un
d P
res
su
re L
ev
el (d
B)
LAeq Front LA10 Front LA90 Front LAeq Rear LA10 Rear LA90 Rear
Thursday Friday Saturday Sunday
Monday
D.10 This site was on a hotel in a residential area. At the rear of the hotel an air conditioning unit
was a significant noise source during the day-time. Due to it’s proximity to the rear of
neighbouring residential properties, it is considered that this is not un-representative of the
noise climate at the rear of neighbouring residential properties on this road.
D.11 The measurement at the front of this property only continued until the Saturday evening, as
at this point the batteries powering the sound level meter were flat.
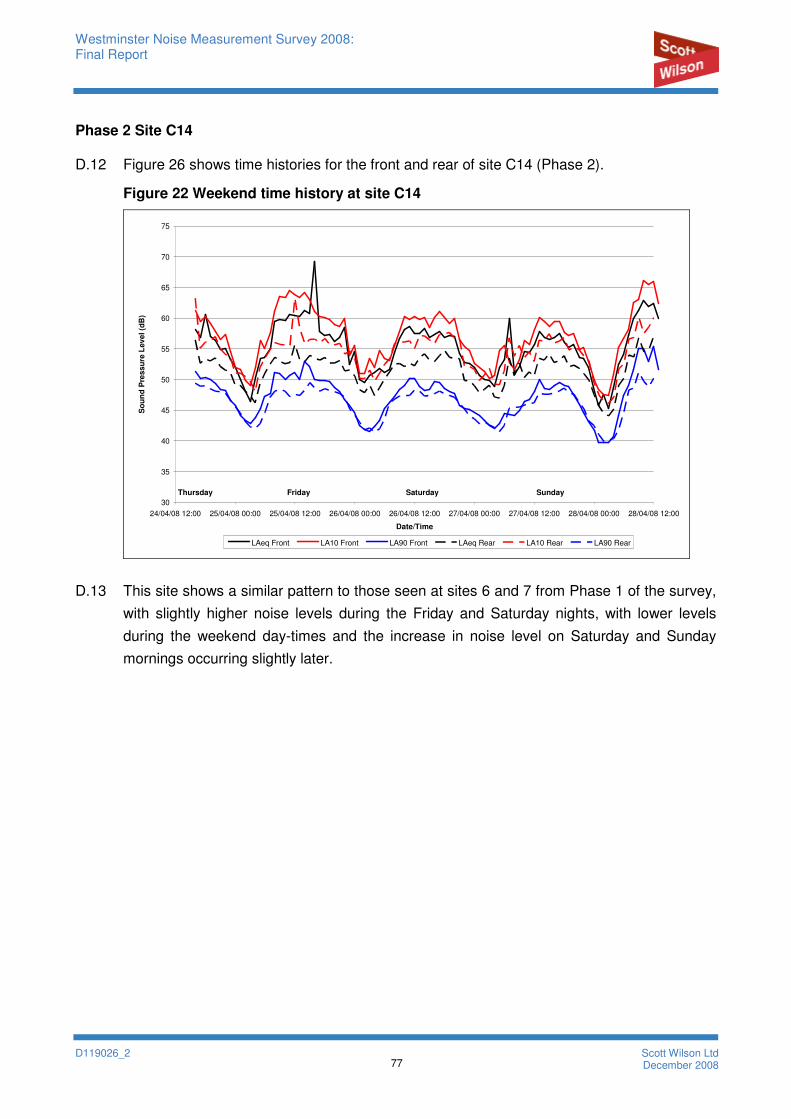
Westminster Noise Measurement Survey 2008: Final Report
D119026_2 77
Scott Wilson Ltd December 2008
Phase 2 Site C14
D.12 Figure 26 shows time histories for the front and rear of site C14 (Phase 2).
Figure 22 Weekend time history at site C14
30
35
40
45
50
55
60
65
70
75
24/04/08 12:00 25/04/08 00:00 25/04/08 12:00 26/04/08 00:00 26/04/08 12:00 27/04/08 00:00 27/04/08 12:00 28/04/08 00:00 28/04/08 12:00
Date/Time
So
un
d P
res
su
re L
ev
el (d
B)
LAeq Front LA10 Front LA90 Front LAeq Rear LA10 Rear LA90 Rear
Thursday Friday Saturday Sunday
Monday
D.13 This site shows a similar pattern to those seen at sites 6 and 7 from Phase 1 of the survey,
with slightly higher noise levels during the Friday and Saturday nights, with lower levels
during the weekend day-times and the increase in noise level on Saturday and Sunday
mornings occurring slightly later.
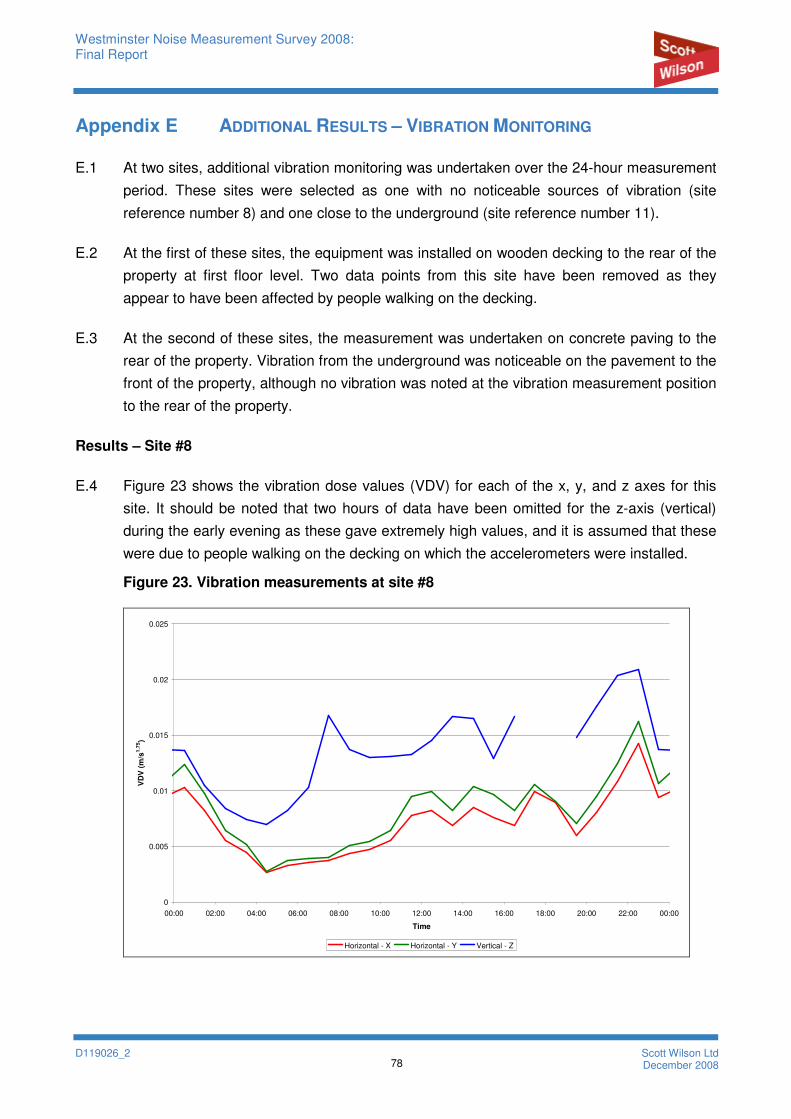
Westminster Noise Measurement Survey 2008: Final Report
D119026_2 78
Scott Wilson Ltd December 2008
Appendix E ADDITIONAL RESULTS – VIBRATION MONITORING
E.1 At two sites, additional vibration monitoring was undertaken over the 24-hour measurement
period. These sites were selected as one with no noticeable sources of vibration (site
reference number 8) and one close to the underground (site reference number 11).
E.2 At the first of these sites, the equipment was installed on wooden decking to the rear of the
property at first floor level. Two data points from this site have been removed as they
appear to have been affected by people walking on the decking.
E.3 At the second of these sites, the measurement was undertaken on concrete paving to the
rear of the property. Vibration from the underground was noticeable on the pavement to the
front of the property, although no vibration was noted at the vibration measurement position
to the rear of the property.
Results – Site #8
E.4 Figure 23 shows the vibration dose values (VDV) for each of the x, y, and z axes for this
site. It should be noted that two hours of data have been omitted for the z-axis (vertical)
during the early evening as these gave extremely high values, and it is assumed that these
were due to people walking on the decking on which the accelerometers were installed.
Figure 23. Vibration measurements at site #8
0
0.005
0.01
0.015
0.02
0.025
00:00 02:00 04:00 06:00 08:00 10:00 12:00 14:00 16:00 18:00 20:00 22:00 00:00
Time
VD
V (
m/s
1.7
5)
Horizontal - X Horizontal - Y Vertical - Z
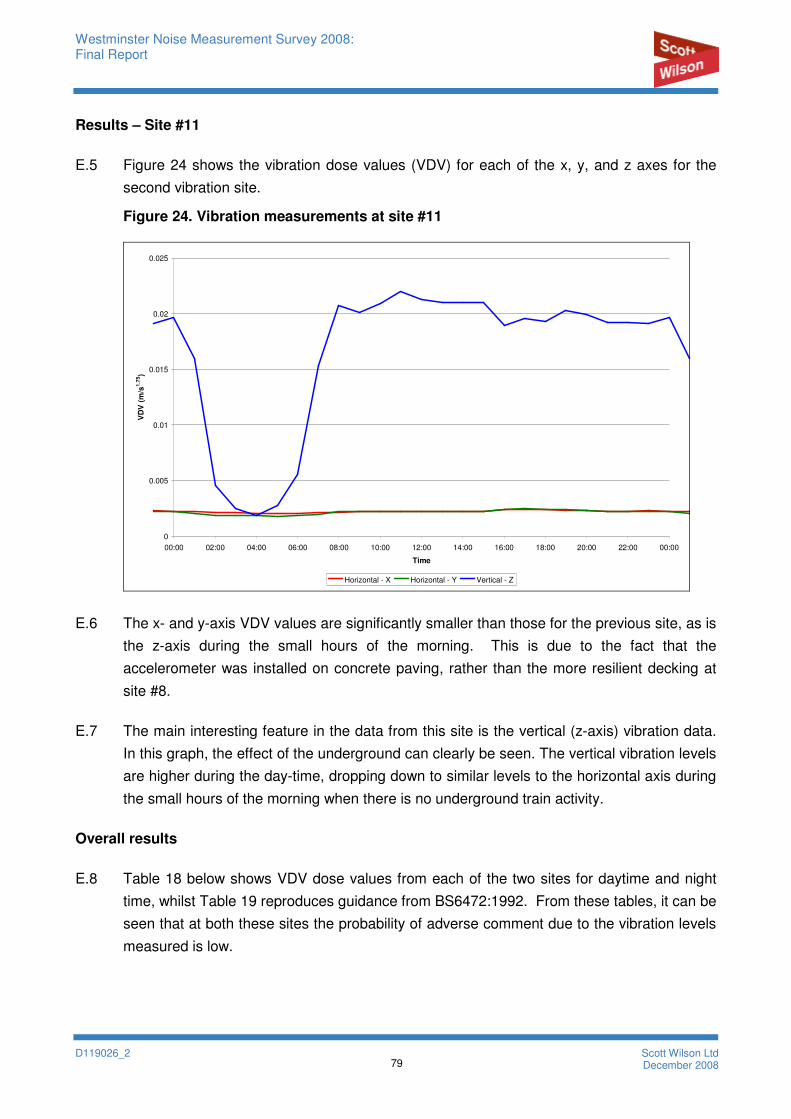
Westminster Noise Measurement Survey 2008: Final Report
D119026_2 79
Scott Wilson Ltd December 2008
Results – Site #11
E.5 Figure 24 shows the vibration dose values (VDV) for each of the x, y, and z axes for the
second vibration site.
Figure 24. Vibration measurements at site #11
0
0.005
0.01
0.015
0.02
0.025
00:00 02:00 04:00 06:00 08:00 10:00 12:00 14:00 16:00 18:00 20:00 22:00 00:00
Time
VD
V (
m/s
1.7
5)
Horizontal - X Horizontal - Y Vertical - Z
E.6 The x- and y-axis VDV values are significantly smaller than those for the previous site, as is
the z-axis during the small hours of the morning. This is due to the fact that the
accelerometer was installed on concrete paving, rather than the more resilient decking at
site #8.
E.7 The main interesting feature in the data from this site is the vertical (z-axis) vibration data.
In this graph, the effect of the underground can clearly be seen. The vertical vibration levels
are higher during the day-time, dropping down to similar levels to the horizontal axis during
the small hours of the morning when there is no underground train activity.
Overall results
E.8 Table 18 below shows VDV dose values from each of the two sites for daytime and night
time, whilst Table 19 reproduces guidance from BS6472:1992. From these tables, it can be
seen that at both these sites the probability of adverse comment due to the vibration levels
measured is low.
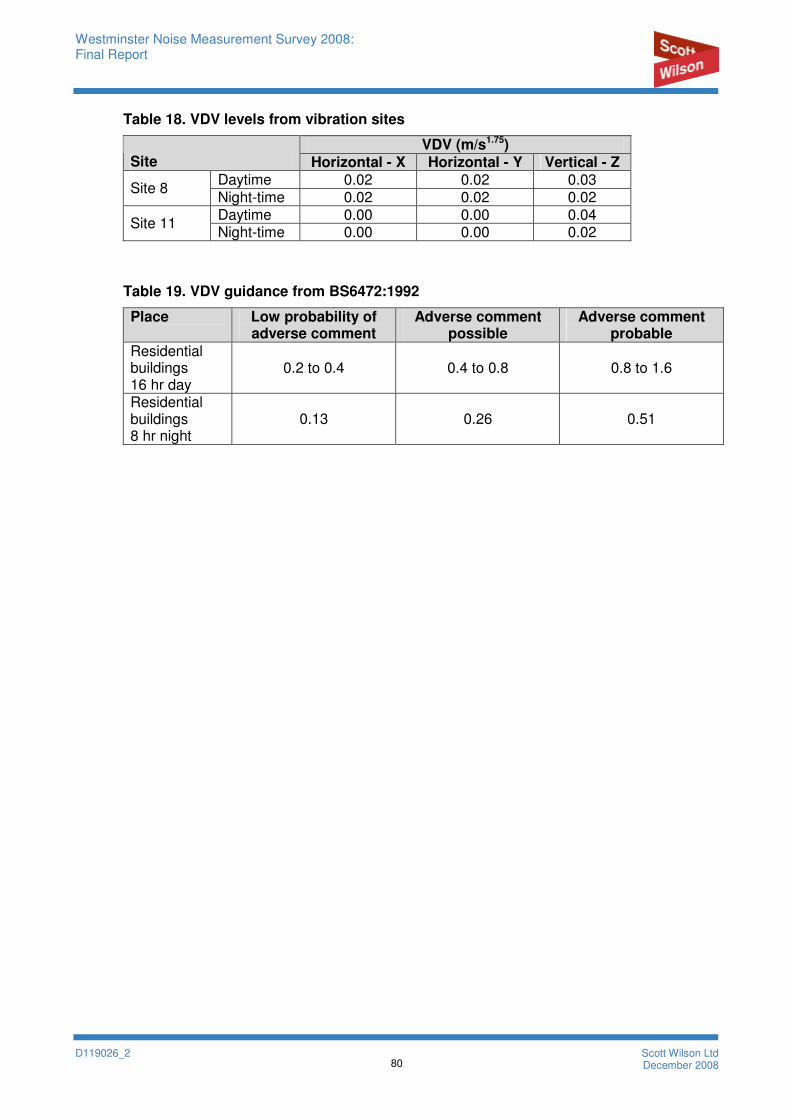
Westminster Noise Measurement Survey 2008: Final Report
D119026_2 80
Scott Wilson Ltd December 2008
Table 18. VDV levels from vibration sites
VDV (m/s1.75) Site Horizontal - X Horizontal - Y Vertical - Z
Daytime 0.02 0.02 0.03 Site 8
Night-time 0.02 0.02 0.02 Daytime 0.00 0.00 0.04
Site 11 Night-time 0.00 0.00 0.02
Table 19. VDV guidance from BS6472:1992
Place Low probability of adverse comment
Adverse comment possible
Adverse comment probable
Residential buildings 16 hr day
0.2 to 0.4 0.4 to 0.8 0.8 to 1.6
Residential buildings 8 hr night
0.13 0.26 0.51

Westminster Noise Measurement Survey 2008: Final Report
D119026_2 81
Scott Wilson Ltd December 2008
Appendix F ADDITIONAL RESULTS – LONG TERM MONITORING
F.1 Throughout the duration of most of the measurements, an additional sound level meter was
installed at the City Guardians’ office on Shirland Road. This was installed on Thursday 3rd
April 2008, and collected on Monday 19th May 2008.
F.2 Figure 25 shows the LAeq, LA10 and LA90 time histories at this site. Weekend and school
holiday periods have been identified on this chart.
Figure 25. Time history of long term measurement at Shirland Road
30
35
40
45
50
55
60
65
70
75
80
Thu
03
/04
/08
Fri
04
/04/0
8
Sat
05
/04/0
8
Su
n 0
6/0
4/0
8
Mo
n 0
7/0
4/0
8
Tue
08
/04
/08
We
d 0
9/0
4/0
8
Thu
10
/04
/08
Fri
11
/04/0
8
Sat
12
/04/0
8
Su
n 1
3/0
4/0
8
Mo
n 1
4/0
4/0
8
Tue
15
/04
/08
We
d 1
6/0
4/0
8
Thu
17
/04
/08
Fri
18
/04/0
8
Sat
19
/04/0
8
Su
n 2
0/0
4/0
8
Mo
n 2
1/0
4/0
8
Tue
22
/04
/08
We
d 2
3/0
4/0
8
Thu
24
/04
/08
Fri
25
/04/0
8
Sat
26
/04/0
8
Su
n 2
7/0
4/0
8
Mo
n 2
8/0
4/0
8
Tue
29
/04
/08
We
d 3
0/0
4/0
8
Thu
01
/05
/08
Fri
02
/05/0
8
Sat
03
/05/0
8
Su
n 0
4/0
5/0
8
Mo
n 0
5/0
5/0
8
Tue
06
/05
/08
We
d 0
7/0
5/0
8
Thu
08
/05
/08
Fri
09
/05/0
8
Sat
10
/05/0
8
Su
n 1
1/0
5/0
8
Mo
n 1
2/0
5/0
8
Tue
13
/05
/08
We
d 1
4/0
5/0
8
Thu
15
/05
/08
Fri
16
/05/0
8
Sat
17
/05/0
8
Su
n 1
8/0
5/0
8
Mo
n 1
9/0
5/0
8
Tue
20
/05
/08
Date/Time
So
un
d P
ress
ure
Le
ve
l (d
B)
LAeq,1hr LAF10,1hr LAF90,1hr
School Easter Holidays
F.3 This graph clearly shows the daily and weekly variations in noise level. In particular, it can
be seen that the weekend day-times generally experience lower noise levels than the
weekdays, whilst the levels on Friday and Saturday nights are generally higher than those
during the week. This can be seen more clearly in Figure 26 which shows average time
histories for weekdays and weekends taken from this data. This figures also shows a more
gradual increase in noise levels in the morning at weekends than weekdays
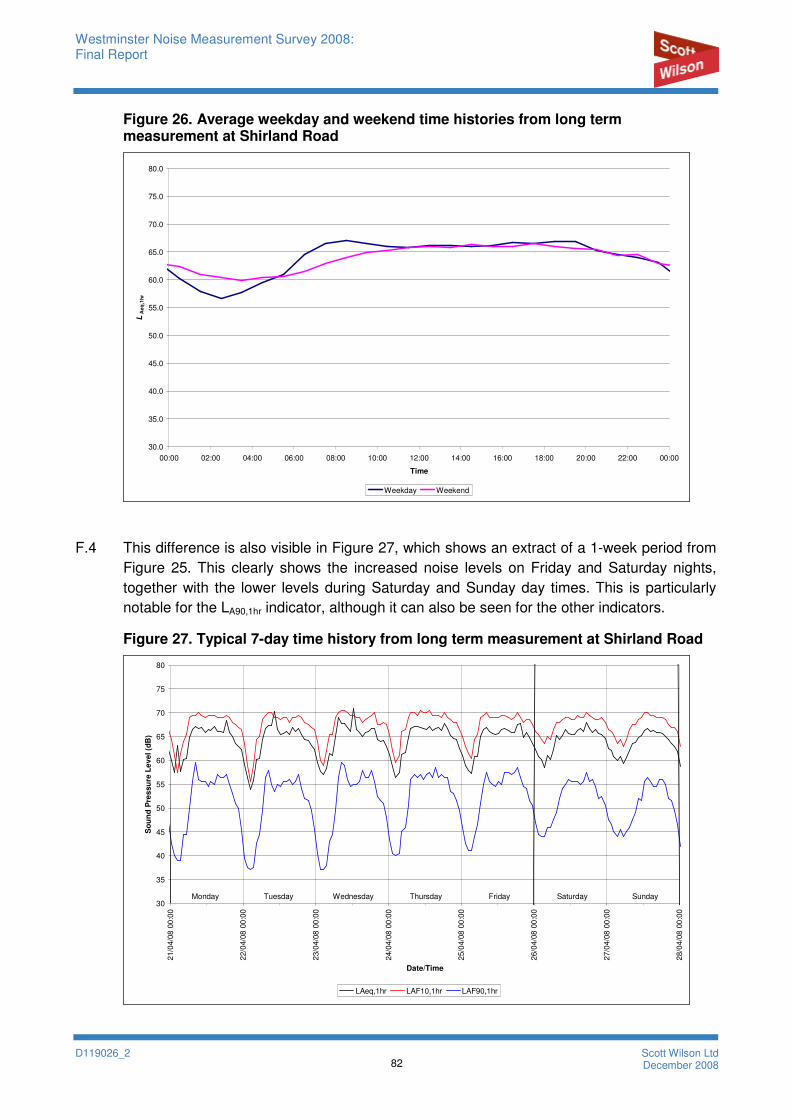
Westminster Noise Measurement Survey 2008: Final Report
D119026_2 82
Scott Wilson Ltd December 2008
Figure 26. Average weekday and weekend time histories from long term measurement at Shirland Road
30.0
35.0
40.0
45.0
50.0
55.0
60.0
65.0
70.0
75.0
80.0
00:00 02:00 04:00 06:00 08:00 10:00 12:00 14:00 16:00 18:00 20:00 22:00 00:00
Time
LA
eq
,1h
r
Weekday Weekend
F.4 This difference is also visible in Figure 27, which shows an extract of a 1-week period from
Figure 25. This clearly shows the increased noise levels on Friday and Saturday nights,
together with the lower levels during Saturday and Sunday day times. This is particularly
notable for the LA90,1hr indicator, although it can also be seen for the other indicators.
Figure 27. Typical 7-day time history from long term measurement at Shirland Road
30
35
40
45
50
55
60
65
70
75
80
21/0
4/0
8 0
0:0
0
22/0
4/0
8 0
0:0
0
23/0
4/0
8 0
0:0
0
24/0
4/0
8 0
0:0
0
25/0
4/0
8 0
0:0
0
26/0
4/0
8 0
0:0
0
27/0
4/0
8 0
0:0
0
28/0
4/0
8 0
0:0
0
Date/Time
So
un
d P
res
su
re L
ev
el (d
B)
LAeq,1hr LAF10,1hr LAF90,1hr
Monday Tuesday Wednesday Thursday Friday Saturday Sunday
Westminster Noise Measurement Survey 2008: Final Report
D119026_2 Scott Wilson Ltd
Appendix G INSTRUMENTATION
G.1 The following noise monitoring equipment was used throughout the Westminster Noise
Measurement Survey 2008:
•••• Norsonic 118 sound level meter, serial number 31441;
•••• Norsonic 118 sound level meter, serial number 31442;
•••• Norsonic 140 sound level meter, serial number 1403025;
•••• Norsonic 140 sound level meter, serial number 1403077;
•••• Norsonic 140 sound level meter, serial number 1403078;
•••• Norsonic 140 sound level meter, serial number 1403079;
•••• Norsonic 140 sound level meter, serial number 1403080;
•••• Svantek 958 noise and vibration meter, serial number 14212;
•••• GRAS 40AE microphone, serial number 93759;
•••• Norsonic 1225 microphone, serial number 52264;
•••• Norsonic 1225 microphone, serial number 52279;
•••• Norsonic 1225 microphone, serial number 91818;
•••• Norsonic 1225 microphone, serial number 91838;
•••• Norsonic 1225 microphone, serial number 91977;
•••• Norsonic 1225 microphone, serial number 91990;
•••• Norsonic 1225 microphone, serial number 91803;
•••• GRAS 40AL microphone, serial number 7571;
•••• GRAS 40AL microphone, serial number 5726;
•••• GRAS 40AL microphone, serial number 8727;
•••• GRAS 40AL microphone, serial number 8245;
•••• GRAS 40AL microphone, serial number 9467;
•••• GRAS 40AL microphone, serial number 9446;
•••• Bruël & Kjær type 2238 sound level meter, serial number 2541001 (long term site);
•••• Bruël & Kjær 4188 microphone; serial number 2547570 (long term site);
•••• Bruël & Kjær 4231 acoustic calibrator; serial number 2217876.