westgard qc order form
TRANSCRIPT

WestgardQCOrderFormWestgard QC, 7614 Gray Fox Trail, Madison WI 53717 CALL 1-608-833-4718 if you wish to pay by purchase order or other means.
Item Price (US$) Quantity Subtotal
NEW! Basic Method Validation, 4th Edition 2020 $80.00
Most Popular! Basic QC Practices manual, 4th Edition $80.00
Six Sigma Quality Design & Control, 2nd Edition $90.00
Six Sigma Risk Analysis and Tools $90.00
Poor Lab’s Guide to the Regulations, 2019 Edition $80.00
Basic Quality Management Systems $80.00
WestgardOnlineCourses
NEW! Six Sigma Metrics $195.00
Quality Management and Design of Analytical Systems (5 credits) $75.00
"Westgard Rules" and Levey-Jennings Charts mini-course (3 credits) $75.00
Most Popular! Basic QC Practices – complete online course (14 credits) $135.00
Basic Method Validation – complete online course (15 credits) $175.00
Grand Subtotal
Shipping & Handling: Within US = $9 Canada & Mexico = Add 10%; Europe, Asia, & all other countries = Add 20%
Sales Tax (Add 5.5% in WI, 6.0% in CT)
GRAND TOTAL
Visithttp://www.westgard.com/store.htmtoplaceorderonlineUsecouponcodeSKIPTHEFORMtosave$15offanypurchase
Your Name Institution & Department Street Address City State Zip Code Country Business Phone/Business Fax E-mail Address Credit Card Type (circle one) VISA Mastercard American Express Credit Card Number Exp. Date Signature

Basic QC PracticesFOURTH EDITION
Training in Statistical Quality Control for Medical Laboratories
James O. Westgard, PhD
with contributions fromPatricia L. Barry, BS, MT(ASCP)
Sharon S. Ehrmeyer, PhD, MT(ASCP) David Plaut, BA
Elsa F. Quam, BS, MT(ASCP)Bernard E. Statland, MD, PhD
Sten Westgard, MS
Copyright © 1998, 2002, 2010, 20167614 Gray Fox Trail, Madison WI 53717
Phone 608-833-4718 HTTP://WWW.WESTGARD.COM

Library of Congress Control Number: 2016911016
ISBN 1-886958-30-0ISBN-13 978-1-886958-30-2
Published by Westgard QC, Inc.7614 Gray Fox TrailMadison, WI 53717
Phone 608-833-4718
Copyright © 1998, 2002, 2010, 2016 by Westgard QC, Inc. (WQC). All rights reserved. No part of this publication may be reproduced, stored in a retrieval system, or transmitted in any form or by any means, electronic, mechanical, photocopying, recording, or other-wise, without prior written permission of Westgard QC, Inc..

Preface to the 4th EditionJames O. Westgard, PhD
It was 1998 when we published the first edition of this book, 2002 for the second edition, and 2008 for the third edition. Since that time, it might be hoped that the advances in technology have improved the Total Testing Process to the point where a book on Basic QC Practices is no longer necessary. Many think that analytical quality is a given and laboratories should focus on pre-analytic and post-analytic processes, rather than analytic processes. Let us remind you that there is nothing more dangerous to our patients than test results that are wrong! Neither doctors nor patients can adequately inspect the products of our testing processes to make sure they are okay. They depend on us to make sure the numbers are correct. Analytical quality is perhaps even more critical today when patient testing is performed by many different measurement procedures in different laboratory settings by personnel with different laboratory skills.
Quality is like safety; our efforts must first attempt to prevent problems from occurring, but if and when problems happen, it is essential they be detected before they endanger the patient. In a perfect world of analytical testing, all problems would be prevented. Unfortunately, we do NOT yet live in a perfect world, there continue to be analytical problems with today’s measurement sys-tems, and we still need the capability to detect those problems when they occur. One of the most cost-effective tools for detection is Statistical Quality Control (SQC). It is a powerful tool when properly designed and properly implemented, however, SQC can itself be very problematic if poorly designed or improperly implemented.
You need to look no further than the US regulatory guidelines to recognize there still are serious problems with QC. According to the CLIA Final Rule and the related “interpretative guidelines,” laboratories may now comply by develop-ing Individualized QC Plans (IQCP) based on principles of risk management. Unfortunately, laboratories have little experience with risk management and the new risk-based QC Plans may, in fact, be very risky. That’s why this 4th edition is needed.
This book will help you understand the principles and practices so you can do the right SQC right. The first right has to do with implementing the right control rules and right numbers of control measurements in order to detect medi-cally important errors. The second right has to do with knowing how to properly implement SQC procedures, which involves many details about setting up control charts, plotting control data, interpreting control results, recognizing when test results can be reported, and deciding when it is necessary to trouble-shooting problems and fix the testing process.
Doing the right SQC right is a prerequisite to the implementation of QC Plans. We introduce the concept of a Total QC Plan that includes a right-sized SQC procedure as an essential control. A new tool, called Westgard Sigma Rules

provides a simple way for right-sizing SQC procedures. The QC Plan should then be developed by adding pre-analytic and post-analytic controls, as well as specific controls that target particular failure modes. Here’s where the principles of risk management should be useful and we introduce a simplified risk evaluation meth-odology that should be practical for applications in medical laboratories.
This 4th edition provides a broad perspective on quality management and increasingly considers the influence of global standards such as ISO 15189. The English edition still includes a detailed discussion of the US CLIA regulatory requirements and CMS’s interpretative guidelines for IQCP, whereas other language editions emphasize the relevant regulatory and/or accreditation require-ments.
Acknowledgments
This book would not exist without the help of others. A number of colleagues have helped with the writing over the years and are identified in the list of authors and contributors. Their help has been critical for conveying the ideas and practices that are necessary to make SQC practical in medical laboratories.
We appreciate the loyal support of many of you in the laboratory com-munity! This QC business is a labor of love that is made worthwhile by your interests in our ideas and your applications of our recommended practices. Your warm reception around the world continues to inspire our efforts to provide these educational and training materials.
James O. Westgard
Sten A. Westgard
James O. WestgardMadison Wisconsin

About the authors and contributors
James O. Westgard, PhD, is an Emeritus Professor in the Department of Pathology and Laboratory Medicine at the University of Wisconsin Medical School. He is also the President of Westgard QC, Inc. His com-plete bio can be found at http://www.westgard.com/jimbio.htm
Patricia L. Barry, BS, MT(ASCP), is a Quality Specialist in the Clinical Laboratories at the University of Wisconsin Hospital and Clinics.
Sharon S. Ehrmeyer, PhD, MT(ASCP), is a Professor in the Depart-ment of Pathology and Laboratory Medicine and Director of the Clinical Laboratory Sciences Program at the University of Wisconsin Medical School.
David S. Plaut, BA, is a Scientific Specialist with more than 30 years of experience in clinical chemistry. He is a fixture at national, regional, and local meetings, where his presentations regularly attract standing-room-only crowds.
Elsa F. Quam, BS, MT(ASCP), is a Quality Specialist in the Clinical Laboratories at the University of Wisconsin Hospital and Clinics.
Bernard E. Statland, MD, PhD, was Director, Office of Device Evalua-tion, Center for Devices and Radiological Health, US Food and Drug Administration.
Sten Westgard, MS, is Director of Client Services and Technology for Westgard QC, where (among other duties) he manages the website and online training portal...and nags his father to write more books.

There's more online at Westgard WebIn order to accomodate all the updates, revisions, and entirely new chapters into this edition, yet still keep it a reasonable length, we had to make a few cuts. Notably, we moved the self-assessment questions and answers, glossary and reference lists online.
Go to http://www.westgard.com/bqcextras.html for links to these online features:
• Glossary of terms
• Complete reference list for this book.
• Links to spreadsheets, worksheets and other downloads.
• Access to online QC calculators, including some calculators and plot-ters not available to the general public.
• New in this 4th edition: free access to an online short course in "West-gard Rules" – which will allow access to an online lecture as well as the opportunity to earn continuing education credits.

Westgard QC, Inc, Copyright © 2016
Table of Contents
1. Managing Analytical Quality ................................................................................................1
2. Understanding Statistical Quality Control (SQC) ............................15
3. Preparing a Control Chart ....................................................................................................25
4. Interpreting SQC Results using “Westgard Rules” .........................45
5. Interpreting Multilevel SQC Results ......................................................................59
6. Solving the Out-of-Control Problems ....................................................................77
7. Documenting SQC Results and Actions .............................................................89
8. Doing the Right Thing Right ..............................................................................................95
9. Selecting the Right Control Materials .............................................................103
10. Performing the Right Calculations ...................................................................117
11. Selecting the Right SQC Procedure .................................................................135
12. Determining the Right Frequency of Controls ................................153

Basic QC Practices, 4th Edition
13. Controlling the Total Testing Process ..........................................................161
14. Complying with CLIA QC Regulations ........................................................171
15. Developing a QC Plan ............................................................................................................191
16. Evaluating Risk ..............................................................................................................................207
17. Mitigating Risk ................................................................................................................................221
18. Implementing Repeat Patient Test Controls ......................................233
19. Developing a QA Program to monitor the QC Plan ..................245
20. Monitoring Quality with EQA and PT ..........................................................253
21. Implementing a Quality Management System .................................271
22. Managing pre- and post-analytical quality ...........................................291
23. Implementing a Quality Management System .................................309
Index ................................................................................................................................................329

Westgard QC, Inc. Copyright © 2016
Page 9
1. Managing Analytical QualityJames O. Westgard, PhD
The management of quality in medical laboratories today is generally subject to national or international guidelines for good laboratory practice. For example, many countries adopt ISO 15189 one of the guidelines for quality and competency [1]. Similar guidance for implementing a “Quality Management System” is found in consensus guidelines developed by the Clinical Laboratory Standards Institute (CLSI), in their documents HS1 [2] and GP26 [3]. In addition, there may be regulatory requirements in some countries, such as the US CLIA rules [4], as well as professional guidelines for accreditation and inspection, such as the College of American Pathologists (CAP), The Joint Commission (TJC), or COLA in the US.
Directors, managers, and supervisors must understand the guidance documents that govern practices in their laboratory. Analysts need to understand certain technical requirements for the operation of analytical processes, particularly the validation of methods and Statistical Quality Control (SQC). Our purpose in this introduction is to describe the big picture of quality management and then focus on the basic practices that must be implemented at the bench level for managing analytical quality.
What is Quality?Everyone talks about quality, but what exactly does “Quality” mean? You can find many definitions in the literature, but we need one that helps us understand laboratory quality in a practical way. Here are some definitions that provide a good starting point:
• ANSI/ASQC A3-1978. Quality – the totality of features and characteristics of a product or service that bear on its ability to satisfy given needs [5].
• Juran – Quality is fitness for use [6].
• Crosby – Quality is conformance to requirements [7].
• Deming – Quality should be aimed at the needs of the customer [8].

Basic QC Practices, 4th Edition
Page 10
These definitions are from industry and from some of the quality gurus who guided industrial quality management in the last half of the 20th century. Notice that all these definitions focus on the needs or requirements of the customer, in our case the patient (consumer) and the physician (user) who acts on behalf of the patient. Note also that there may be many dimensions to quality, i.e., many features or characteristics that are important. The following is a good synthesis of these definitions and should provide us with a starting point for understanding quality in a quantitative way:
• CDC 1986. The quality of a laboratory testing service depends on providing the totality of features and characteristics that conform to the stated or implied needs of users or customers [9].
Note that this definition is 30 years old! Quality management in medical laboratories has a long history and was not invented by ISO or CLSI or CLIA. Those guidelines emerged from attempts to summarize or codify practices that had already been developed in laboratories and to transfer “good laboratory practices” more widely throughout the field.
This definition of quality acknowledges the “totality of features and characteristics” that makes quality multi-dimensional. Some-times when we argue about quality, we are actually arguing about different characteristics, e.g., a physician says they are upset about the poor quality of a test. We argue that the test was in-control and meets the requirements for allowable error. But the physician is actually upset about turnaround time, a very different characteristic of quality. If the laboratory requirement for turnaround time was set at 1 hour and the report was not provided until 2 hours, then the physician has a right to complain that the laboratory did not provide the quality of service expected. That also shows the importance of defining how good the test or service must be.
Conformance to stated or implied needs, i.e., goals, objectives, or requirements, is the key to making quality a quantitative and measurable characteristic. For turnaround time, the laboratory needs to establish its requirements for reporting routine, priority, and emergency test results. Discussions with the users, in this

Westgard QC, Inc. Copyright © 2016
Page 11
case physicians and nurses, should help identify the clinical needs. Because the measure is in units of time, i.e., minutes or hours, that are understood by both the customer and the laboratory, we can communicate, define, and measure quality in terms of time.
Analytical quality is not as easy to understand. How should the requirement be stated? Should it be in the form of allowable bias, allowable imprecision, or allowable total error? And how do you come up with a number? In this case, the physician-user and patient-consumer do not have the technical understanding to discuss the performance characteristics of a measurement procedure, there-fore, laboratory scientists must be responsible for understanding the clinical needs and interpreting those needs in terms of analytical performance goals. That’s our responsibility for “implied needs” in the definition of quality. The laboratory must take responsibil-ity because the physician and patient cannot define quality in the technical terms that are used in the laboratory.
What is Quality Management?Again, we’ll start with some definitions, this time from the CLSI HS1 document that describes a model for quality management 2 :
• “Quality – Degree to which a set of inherent characteristics fulfill requirements (ISO 9000).
• Quality assurance – Part of quality management focused on providing confidence that quality requirements will be fulfilled (ISO 9000)
• Quality control – Part of quality management focused on fulfilling quality requirements (ISO 9000)
• Quality indicators – Observations, statistics, or data defined by the organization or service that typify the performance of a given work process and provide evidence that the organization or service is meeting its quality intentions (AABB).
• Quality management – Coordinated activities to direct and control an organization with regard to quality (ISO 9000)

Basic QC Practices, 4th Edition
Page 12
• Quality management system – Management system to direct and control an organization with regard to quality (ISO 9000); Note: Systematic and process-oriented efforts are essential to meet quality objectives.
• Quality policy – Overall intentions and direction of an organization related to quality as formally expressed by top management (ISO 9000)
• Quality system essentials – Set of coordinated building blocks for quality management.” [HS1] describes the “Quality System Essentials” (QSE) as follows:
• Documents and Records, • Organization, • Personnel, • Equipment, • Purchasing and Inventory, • Process Control, • Information Management,• External and Internal Assessment, • Process Improvement, • Customer Service and Satisfaction, and• Facilities and Safety.
These definitions, though official and widely used in the ISO and CLSI documents, do not by themselves create an understanding of what to do to manage quality, or how to do it. Quality management is a complex process that involves many elements, components, and essentials and requires careful organization and implementation. And remember that “systematic and process-oriented efforts are essential to meet quality objectives.”

Westgard QC, Inc. Copyright © 2016
Page 13
What is a systematic process for managing quality? For laboratory scientists, it may be easier to understand quality management in terms of the scientific method. We all trained in the fundamental approach to scientific experimentation, as described by the Plan-Do-Check-Act (PDCA) cycle. We learned to identify a problem or question, plan an experiment to address the issue, do the experiment, check the experimental data, then act on that data. Often the action leads to planning a better experiment and repeating the process until we are able to conclusively answer the question of interest. We can adapt this scientific approach to provide a model for quality management, as shown in Figure 1-1.
This model clearly reflects the PDCA cycle, where the “plan” is at the top, “do” describes the laboratory processes for getting the work done, “check” includes both quality control and quality assess-ment, and “act” reflects the actions needed to correct problems and improve the process. In describing this process, we’ll start with the “do” because the definition of work processes and standardization of how the work gets done is usually the first step in managing quality.
QQ QQ Q
Planning
Laboratory
Processes
ControlAssessment
Improvement QGoals
Six Sigma
Risk Management
Quality Indicators
CLSI, ISO Guidelines
Re-engineeringSix Sigma Design
Lean
InspectionAccreditation
Figure 1-1. Total Quality Management (TQM) Process Framework and related programs for Quality Improvement.

Basic QC Practices, 4th Edition
Page 14
• Quality Laboratory Processes (QLP) refers to the policies, procedures, personnel standards, physical resources, etc., that determine how work gets done in the laboratory. Laboratory method manuals describe the standard operating procedures (SOPs) and processes for producing test results.
• Quality Control (QC) refers to procedures for monitoring work processes, detecting problems, and making corrections prior to the delivery of products and services. Statistical QC is a major procedure for monitoring the analytical performance of laboratory testing processes.
• Quality Assessment (QA) refers to the broader monitoring of other dimensions or other characteristics of quality such as turnaround time, patient preparation, specimen acquisition, and result reporting that are monitored through broad QA activities. Proficiency Testing (PT) or External Quality Assessment (EQA) provide an external or outside measure of performance. Note that we use the term assessment here instead of assurance because the emphasis is on obtaining measures of quality. Quality assurance is the outcome of the whole process, not simply a component in the process.
• Quality Improvement (QI) is aimed at determining the root causes or sources of the problems being identified by QC and QA. The causes of some problems can be determined by individual analysts, but many of the most difficult problems require a team problem-solving process that utilizes particular QI tools (such as flowcharts, Pareto diagrams, cause and effect or “fishbone” diagrams, force field analysis, etc.).
• Quality Planning (QP) (also Quality Design) is concerned with establishing and validating processes that meet customer needs. The selection and validation of new methods and instruments fits here, as well as the selection and design of Statistical QC procedures and analytical quality systems.
• Quality Goals (QG) represent the objectives or requirements that must be achieved to satisfy the needs of customers. For analytical quality, the requirement should be to provide test results that are correct within stated limits. ISO often uses

Westgard QC, Inc. Copyright © 2016
Page 15
the phrase “intended use” as a general expression of clinical needs or requirements, but we want to be more specific here and clearly recognize the importance of defining the goals and requirements that must be achieved to satisfy the needs for “intended use.”
These components work together to provide a feedback loop. QLP defines the policies, procedures, and processes that are needed to get the work done. QC and QA measure how well the work is getting done. When problems are detected, QI focuses on the root causes, which can then be eliminated through QP, in this case actually re-planning the testing processes and implementing new and better ways of doing the work, which leads to changes in QLP. Thus, this management process provides a cycle for continuous improvement of quality!
An important insight is that the definition of quality goals and the implementation of a Quality Planning process are essential to quality assurance! Yet these two components are often missing, or not well-developed, in many laboratories today. Just as well-defined financial budgets guide our management of resources, we also need error-budgets to guide our management of quality [10]. Such error budgets are critical for the selection and validation of analytical methods and also for the development of QC systems that guarantee we do not overspend and produce test results that exceed the desired requirements for quality. The need to define “tolerance limits” or allowable errors is an essential part of Six Sigma QM [11], thus the extension of TQM with Six Sigma concepts and metrics makes quality management a much more quantitative process.
This quality management process can be applied to any part of the laboratory total testing process and there are many additional tools and techniques that enhance this central process:
• CLSI and ISO guidelines and standards provide guidance on best laboratory practices that should be implemented in the laboratory;
• Inspection and accreditation provide an external audit of the laboratory quality system to assess weaknesses that need improvement;

Basic QC Practices, 4th Edition
Page 16
• Quality Indicators are quantitative monitors of performance that provide an assessment and comparison of laboratory services; Proficiency Testing (PT) and External Quality Assessment (EQA) are commonly used as external monitors of analytical performance;
• Six Sigma provides quantitative tools for measuring quality against requirements on an absolute or Sigma-scale, with industrial benchmarks for how good quality should be (6-Sigma) and what quality is not acceptable for routine production processes (below 3-Sigma);
• Risk management provides tools such as Failure Mode Effect Analysis (FMEA) to identify causes or errors and to provide guidance for mitigation of risks (prevention, detection, elimination, recovery); Patient Safety provides an emphasis on identifying and correcting problems in the Total Testing Process, which includes pre-analytic, analytic, and post-analytic processes (or pre-examination, examination, and post-examination processes, in ISO terminology).
• Design for Six Sigma provides a detailed planning methodology for achieving quality goals and improving process performance; Re-engineering provides guidance for major re-design of processes; Lean provides a methodology that focuses on reducing cycle time to optimize efficiency and reduce cost. The application of Lean in laboratories today demonstrates the evolution of business process re-engineering and attests to the increasing importance of planning! When coupled with Six Sigma (often called Lean Six Sigma), laboratories have a planning methodology that combines efficiency and quality.
All of these approaches supplement the central quality man-agement process and contribute to better quality management by providing new techniques, tools, and methodology for preventive actions, corrective actions, indicators of performance, measures of quality, identification of root causes, optimization of quality, reduction of costs, maximization of efficiency, etc. They should be understood as part of the total quality management process, or Quality Manage-ment System [12], not as alternatives to that process.

Westgard QC, Inc. Copyright © 2016
Page 17
To some extent, the different tools relate to the level of improve-ment that is desirable and the amount of change that is needed, as well as the resources necessary to support that level of improvement. Individual analysts who are responsible for different analytic systems can identify problems with those systems and make improvements to prevent or detect those problems. Section and department teams will be necessary for broader processes and major improvements in analytical processes within a laboratory, for example, to develop effective analytical quality systems. Cross-functional teams will be necessary to address the pre-analytic and post-analytic parts of the Total Testing Processes and to develop broad quality systems that address the needs of the patient consumer and physician user.
What activities take priority in implementing quality management?The CLSI HS1 guidelines recommend the following priorities for implementing the Quality System Essentials:
“Confirmation of leadership commitment is paramount to the success of quality management system implementation. QSE organization needs to be one of the first QSEs implemented.
“The following activities set the foundation and direction for implementing the quality management system and… can be implemented in the order that best suits the particular requirements of the organization or service.
• “Development of the quality manual documents (QSE: Documents and Records)
• Development of the program for occurrence management (QSE: Occurrence Management)
• Development of processes for controlling documents and records (QSE: Documents and Records)
• Analysis and validation or verification of work processes, with development of procedures and instructions (QSE: Process Control); and
• Implementation of process controls (QSE: Process Control).”

Basic QC Practices, 4th Edition
Page 18
Management commitment and leadership are critical the starting point for quality management, along with establishing an organizational structure that supports the development and docu-mentation of quality work processes, as well as method validation, process control, and occurrence monitoring. In the context of the quality management process in Figure 1-1, the development and documentation of work processes corresponds to our component for Quality Laboratory Processes. The monitoring of performance via process control and occurrence monitoring correspond to our Qual-ity Control and Quality Assessment components. Thus, once work processes are established, the next priority is process control, which is the focus of this book.
What’s the point?It is important to understand that Statistical Quality Control is one part of the overall quality management process or system, but it is an essential part and must involve all the analysts in the laboratory. Other parts may involve mainly the laboratory director, managers, and supervisors, but QC involves everyone and everyone must have some education and training to carry out their responsibilities. In that sense, QC is an essential competency for all laboratory analysts and a fundamental skill that must be assured through professional education and in-service training. In these chapters, we’ve divided the materials into four areas for study that are appropriate for operators and analysts who have different levels of responsibility.
Basic Training 101 – Applying SQC. Not everyone needs to understand everything in this book, but everyone should study this first group of lessons. These chapters are concerned with doing SQC, understanding its importance, and recognizing how it fits into the overall QC Plan or Quality System. These lessons assume that the testing application is overseen by someone who takes care of the technical details of establishing or implementing QC, which are described in later chapters.
Analysts working in a production laboratory need better skills in interpreting QC data. Decisions about accepting or rejecting test results on the basis of QC should be clear and logical. However, it is still difficult to know what to do when there is a problem. QC

Westgard QC, Inc. Copyright © 2016
Page 19
Troubleshooting requires a deeper understanding and interpretation of QC data, QC records, and EQA results.
Basic Training 102 – Implementing the Right SQC Right. Analysts who have responsibility for particular methods and systems, or who work independently with little supervision, need to understand the details of QC. QC actually seems easy when everything is properly set up and maintained. But that’s not the situation in many laboratories. You need to be able to calculate control limits properly, implement appropriate control rules and numbers of control measurements, and define when controls will be analyzed. These are complex issues that are influenced by both regulatory and accreditation requirements, as well as scientific principles.
Someone – probably you since you’re the one reading the book – needs to define what QC procedures are to be used for the tests in your laboratory. This responsibility often resides with the medical director of the laboratory, but may be delegated to managers or supervisors or quality technical specialists. Someone needs to know how to select the right control rules and the right number of control measurements. This problem often arises when old methods or systems are replaced by newer ones that have better stability and performance, but this activity should also be part of the annual review of laboratory procedures. Many laboratories continue to do the “same old QC” because they don’t know how to plan, design, or select QC procedures that account for the quality required by the test and the method performance observed.
Basic Training 103 – Developing a Quality Control Plan. As of January 2016, medical laboratories in the US have a new option for QC by implementing a risk-based QC Plan. Because of increasing emphasis on risk management in ISO standards, laboratories around the world have become interested in risk-based QC plans. The advantage of a QC Plan is that its coverage includes pre-analytic and post-analytic phases of the Total Testing Process and it implements specific analytic controls targeted at identified weaknesses or failure modes. The US implementation guidelines recommend a qualitative process to identify hazards. Risk evaluation should then follow to assess the importance of each potential hazard and its risk to patients. Formal risk evaluation generally makes use of a common

Basic QC Practices, 4th Edition
Page 20
industrial tool known as Failure Modes and Assessment Analysis (FMEA). An introduction to a simplified FMEA process is described to provide the basic framework for risk evaluation.
Basic Training 104 – Building a Quality Management System. SQC is the foundation for quality management in a medical laboratory, but many other quality management tools, techniques, and programs are useful for expanding quality practices to provide a comprehensive quality management system. Other practices, such as method evaluation, are essential for selecting appropriate measurement procedures and are a prerequisite to selecting appropriate SQC procedures. Participation in programs for External Quality Assessment or Proficiency Testing are essential for monitoring the routine quality achieved in a laboratory. All these tools and programs can be integrated into a Six Sigma Quality Management System to provide a practical structure for managing quality in a medical laboratory.

Westgard QC, Inc. Copyright © 2016
Page 21
References1. ISO 15189. Medical laboratories – Particular requirements for quality
and competence. ISO, Geneva, 2012.
2. CLSI HS1-A2. A Quality Management System Model for Health Care. Clinical and Laboratory Standards Institute, Wayne, PA, 2004.
3. CLSI GP26-A3. Application of a Quality Management System Model for Laboratory Services. Clinical and Laboratory Standards Institute, Wayne, PA, 2004.
4. US Centers for Medicare & Medicaid Services (CMS). Medicare, Medicaid, and CLIA Programs. Laboratory Requirements Relating to Quality Systems and Certain Personnel Qualifications. Final Rule. Fed Regist Jan 24 2003;1 :3 40-3 14.
5. ANSI/ASQC A3 Quality Systems Terminology. Milwaukee, WI:ASQC Press, 1978.
. Juran JM. The quality triology. Quality Progress. 198 ;August: 19-24.
7. Crosby PB. Quality is Free. New York:New American Press, 19 9.
8. Deming WE. Out of the Crisis. Cambridge MA;MIT Center for Advanced Engineering Study, 1986.
9. Centers for Disease Control. Proceedings of the 1986 Institute – Managing the quality of laboratory test results in a changing health care environment. DuPont Company, 1987.
10. Westgard JO. Error budgets for quality management: Practical tools for planning and assuring the analytical quality of laboratory testing processes. Clin Lab Manag Review 199 ;10:3 -403.
11. Westgard JO. Six Sigma Quality Design and Control: Desirable precision and requisite QC for laboratory measurement processes, 2nd ed. Madison WI:Westgard QC, 200 .
12. Westgard JO, Westgard SA. Basic Quality Management Systems. Westgard QC, Inc. Madison WI 2014.

Basic QC Practices, 4th Edition
Page 22

Westgard QC, Inc. Copyright © 2016
Page 15
2. Understanding Statistical Quality Control (SQC)
James O. Westgard, PhDThe product of a laboratory testing process is a number. Unlike a physical product that can be inspected to assess whether it looks good or bad, you can’t look at a test result and tell whether it is valid. 247 – what do you think? If this is a patient sample, do you think the test result is of good quality or not (meaning the correct value)?
Assume the value of 247 is measured on a stable sample that has been analyzed before and has the range of values shown in the histogram below. Do you think the test result is of good quality? Given that values between 240 and 260 have often been observed in past measurements, it is expected that this new value should also fall in that range if everything is working acceptably. Therefore, other patient test results included in this run of measurements are also probably correct.
0
1
2
3
4
5
6
7
8
234
239
245
249
254
259
264
Mor
e
Freq
uency
Values
Histogram
Figure 2-1: An example Histogram

Basic QC Practices, 4th Edition
Page 16
A simple graphic tool – the QC chartIn the medical laboratory, control charts are used to compare today’s observed value of a stable control material with what is expected based on past history. As shown in Figure 2-2, by turning the histogram sideways and spreading the results out according to the time they were collected, it is easy to see how each observation compares to the expected distribution or range of past observations, which are described by the central line (expected mean value) and certain limits calculated from the mean and standard deviation (SD) of past control data. In this figure, the limit lines correspond to the mean ± 1 SD, ± 2 SD, and ± 3 SD.
Assuming a Gaussian or normal distribution, it would be expected that about 68% of the points fall within the mean ± 1 SD, 95% within the mean ± 2 SD, and 99.7% within the mean ± 3 SD. Therefore, it would be very unexpected (0.3% chance) to observe a control value greater than 3 SD from the mean and such an obser-vation usually indicates there is a problem with the method. It is somewhat unexpected to observe a control value greater than 2 SD from the mean, but this will happen at least 5% of the time when analyzing one control per run, so it may indicate a false alarm instead of a real problem. It is very common (32% chance) to see individual values beyond 1 SD from the mean, therefore this control limit is of no value for making a judgment about method performance based on a single control value.
That’s the idea behind Statistical Quality Control. See if you can get the right answer for a sample with known values. The right answer is actually a range of values that are calculated from the mean and standard deviation of past results. That mean and mul-tiples of the SD can be shown on a control chart to make it simple to plot new control measurements and see how they compare with the expected range of values.

Westgard QC, Inc. Copyright © 2016
Page 17
In the beginning, there was ShewhartWalter A. Shewhart was a statistician at Bell Telephone Laboratories who developed the scientific basis for statistical process control. Shewhart stated that:
“the object of industry is to set up economic ways of satisfying human wants and in so doing to reduce everything possible to routines requiring a minimum amount of human effort. Through the use of the scientific method, extended to take account of modern statistical concepts, it has been found possible to set up limits within which the results of routine efforts must lie if they are to be economical. Deviations in the results of a routine process outside such limits indicate that the routine has broken down and will no longer be economical until the cause of trouble is removed.”
0
1
2
3
4
5
6
7
8
234
239
245
249
254
259
264
Mor
eValues
0 2 4 6 8
234
245
254
264
235
240
245
250
255
260
265
270
1 2 3 4 5 6 7 8 9 1011121314151617181920212223
Figure 2-2: The Idea of a QC Chart
• Determine the expected distribution of control values•Calculate mean and SD from control data to establish control limits for chart• Expect control values to fall within control limits:
95% within 2 SD99.7% within 3 SD
• Plot control values vs. time on chart• Identify unexpected values

Basic QC Practices, 4th Edition
Page 18
Shewhart made this statement in the preface to his book on the Economic Control of Quality of Manufactured Product that was published in 1931 [1].
Statistical process control, from the beginning, has been con-cerned with achieving the desired quality (satisfying human wants) at minimum cost (economic control). Shewhart identified critical elements such as the expected variation of a routine process, a way to set limits that will identify when the routine has broken down, and the need to eliminate causes of trouble when the process was observed to exceed those limits.
Almost twenty years passed before Levey and Jennings in-troduced statistical process control to medical laboratories in 1950 [2]. Shewhart’s original recommendation called for making a group of measurements, calculating the average and range (maximum difference), then plotting the mean and range on two different control charts. Levey and Jennings proposed making duplicate measurements on a patient specimen. Because the actual level of the measured constituent varied from specimen to specimen, this was a more difficult application. Henry and Seaglove 3 developed an alternative procedure in which a stable reference sample was analyzed repeatedly and individual measurements were plotted directly on a control chart. This type of control chart on which individual values or single values are plotted directly is commonly known today as a Levey-Jennings chart.
Since that time, industry has developed stable control materials that mimic patient samples, thus today there are safe QC materials readily available for most established tests. A better understand-ing of the performance characteristics of QC procedures has been developed [4] to describe the probabilities of error detection (Ped) and false rejection (Pfr), which has led to refinements such as multirule procedures (“Westgard Rules”) for evaluating and interpreting control data [5]. Strategies for cost-effective operation have been further refined on the basis of the quality and productivity of the analytical testing process [6]. CLSI developed a consensus guideline (C24) for in 1990, currently available as C24-A3 [7].

Westgard QC, Inc. Copyright © 2016
Page 19
Software and informatics now typically implement statisti-cal QC. A computer performs the necessary calculations, prepares graphic displays, applies selected control rules, and issue alerts when problems occur. Today, support for handling QC is provided by most automated analyzers, middleware, laboratory and hospital information systems, and even point-of-care devices.
Learning the QC languageLet’s start with commonly-used terms and then add official definitions from ISO and CLSI.
Statistical process control is the general term used to describe those aspects of a control system in which statistics are applied to determine whether observed performance is within the expected variation of the process, in contrast to other components of a QC Plan such as preventive maintenance, instrument function checks, operation training, etc., that are part of a broad definition of quality control.
Quality control procedure is a general term that is used in medical laboratories, often as a synonym for Statistical QC procedure, where a specific number of control materials and control measurements are employed and the results interpreted by a defined control rule or set of rules.
Control chart is a graphic method for displaying control rules and evaluating whether a measurement procedure is in-control or out-of-control. Control results are plotted versus time or sequential run number and lines are generally drawn from point to point to highlight any trends, systematic shifts, and random excursions.
Control limits are lines drawn on a control chart to provide graphic criteria for assessing whether a measurement procedure is in-control or out-of-control. These control limits are usually calculated from the mean and standard deviation (SD or s) determined for a given control material. Typically the interpretation is based on a specified number of control results or points exceeding a certain control limit. When in-control, patient test results are reported. When out-of-control, the run is rejected and no test results can be reported.

Basic QC Practices, 4th Edition
Page 20
Control rule means a decision criterion for judging whether an analytical run is in-control or out-of-control. It is commonly defined by a symbol of the form AL, where A is the abbreviation for a statistic or represents the number of control measurements, and L identifies the control limits, usually specified by the multiple of the standard deviation.
Here are some example control rules:
13s refers to a control rule that is commonly used with a Levey-Jennings chart when the control limits are set as the mean +3s and the mean –3s. A run is rejected when a single control measurement exceeds the mean +3s or the mean –3s control limit.
12s refers to the control rule that is commonly used with a Levey-Jennings chart when the control limits are set as the mean ± 2s. In the original Westgard multirule QC procedure, this rule is used as a warning rule to trigger careful inspection of the control data by other rejection rules.
[See later for more details when (and when not) to use a warning rule of this type.]
-3s-2s-1s
Mean+1s+2s+3s
1 2 543 6 7 8 9 10
13s ruleviolation
+3s+2s+1s
-3s-2s-1s
Mean
1 2 543 6 7 8 9 10
12s ruleviolation

Westgard QC, Inc. Copyright © 2016
Page 21
22s refers to the control rule that is used with a Levey-Jennings chart when the control limits are set as the mean ± 2s. In this case, however, the run is rejected when 2 consecutive control measurements exceed the same mean +2s or the same mean –2s.
R4s refers to a control rule where a reject occurs when 1 control measurement in a group exceeds the mean +2s and another exceeds the mean –2s. This is only to be interpreted within a single run. So in the graphic at right, the data points at 5 and 6 must represent observations from the same run.
Run, analytical run, and run length refer to the interval, which could be a period of time or group of samples, for which a decision on control status is to be made. The US CLIA requirements define a maximum run length of 24 hours for many chemistry tests, and 8 hours for hematology and blood gas tests, Many laboratories define a shorter period based on the changes or events that affect the performance of a testing process, such as changing operators, reagents, recalibration, or other factors that make the testing process susceptible to problems. As testing volume increases, many labs also increase their run QC frequency. For random access automated systems, a run is usually defined as a time interval at which controls are reanalyzed. For batch instruments and manual systems, a run is often defined as a group (or batch) of samples that are analyzed at the same time.
+3s+2s+1s
-3s-2s-1s
Mean
1 2 543 6 7 8 9 10
22s ruleviolation
+3s+2s+1s
-3s-2s-1s
Mean
1 2 543 6 7 8 9 10
R4s ruleviolation

Basic QC Practices, 4th Edition
Page 22
Now, here are the official ISO and CLSI definitions:
• Analytical run – an interval (i.e., a period of time or series of measurements) within which the accuracy and precision of the measuring system is expected to be stable; between which events may occur causing the measurement process to be more susceptible (i.e., greater risk) to errors that are important to detect (CLSI C24-A3 section 7.1)
• Quality control – part of quality management focused on fulfilling quality requirements (ISO 9000)
• Quality control plan – a document that describes the practices, resources, and sequences of specified activities to control the quality of a particular test system or test process to ensure requirements for their intended purpose are met (CLSI EP23A [8])
• Quality control rule – decision criterion used to determine if a given quality control observation should be accepted or rejected (CLSI C24-A3)
• Quality control strategy – the number of control materials, the number of measurements to be made on these materials, the location of those control materials in an analytical run, and the statistical control rules applied (CLSI C24-A3)
• Statistical quality control – a procedure in which stable samples are measured and the observed results compared with limits that describe the variation expected when the measurement method is working properly (CLSI C24-A3)
Hopefully, these official terms now make sense and you have the necessary vocabulary to understand some of the reference docu-ments, as well as policies and procedures in your own laboratory.

Westgard QC, Inc. Copyright © 2016
Page 23
What’s the point?The idea is simple – characterize the variation that is expected when analyzing a stable control material, then check to see if today’s results are consistent with the expected range of variation. You might think of SQC as establishing the normal or reference range for a control material, then verifying that today’s result on that control material falls within the expected range. It’s analogous to the use of a normal or reference range for assessing patient test results and identifying abnormal conditions that require attention.
The complication is that statistics are used to determine the expected range. Many laboratory analysts are afraid of statistics and find SQC intimidating. All the regulations, national and inter-national guidelines, and laboratory quality policies and procedures can also be intimidating. We think that an understanding of the basic principles and the terminology are essential to create the proper learning environment and the skills needed in the medical laboratory. SQC is a tool that is widely applicable to many tests and analytic systems throughout the medical laboratory, but the quality of our QC practices still depends on having skilled analysts who are able to use this tool to assure the quality of laboratory test results.

Basic QC Practices, 4th Edition
Page 24
References1. Shewhart WA. Economic Control of Quality of Manufactured
Product. New York; D. an Hostrand Company, Inc., 1931.
2. Levey S, Jennings ER. The use of control charts in the clinical laboratory. Am J Clin Pathol 1950;20:1059-66.
3. Henry RJ, Segalove M. The running of standards in clinical chemistry and the use of the control chart. J Clin Pathol 1952;27:493-501.
4. Westgard JO, Groth T, Aronsson T, Falk H, de erdier C-H. Performance characteristics of rules for internal quality control: probability for false rejection and error detection. Clin Chem 1977;23:1857-67.
5. Westgard JO, Barry PL, Hunt MR, Groth T. A multi-rule Shewhart chart for quality control in clinical chemistry. Clin Chem 1981;27:493-501.
6. Westgard JO, Barry PL. Cost-Effective Quality Control: Managing the quality and productivity of analytical processes. Washington DC:AACC Press, 1986.
7. CLSI C24-A3. Statistical Quality Control for Quantitative Measurement Procedures. Clinical Laboratory Standards Institute, Wayne, PA 2006.
8. CLSI EP23A. Laboratory Quality Control Based on Risk Management. Clinical Laboratory Standardis Institute, Wayne, PA 2011.

Basic QC Practices, 4th Edition
Page 148
Westgard Sigma Rules2 Levels of Controls
Data QC
13s 22s R4s 41s 8X
Take Corrective Action
Report Results
No
Sigma Scale = (%TEa-%Bias)/%CV6σ 5σ 4σ 3σ
No No No
Yes Yes Yes Yes Yes
N=2R=1
N=2R=1
N=2R=2
N=4R=1
N=8R=1N=4R=2
No
Westgard Sigma RulesThese rules of thumb have been formalized in a new tool called “Westgard Sigma Rules,” which was introduced in our book Basic Quality Management Systems 8 . Figure 11- shows the Westgard Sigma Rules for 2 levels of control materials.
On first glance, this figure looks just like the usual “Westgard Rules.” But there is no 2 SD warning rule here. That is an important distinction, but the most important change is at the bottom of the diagram where there is a Sigma-scale. That scale provides guid-ance for which rules should be applied based on the sigma quality determined in your laboratory.
Figure 11-6. Westgard Sigma Rules for 2 levels of controls. Note Sigma-scale at the bottom of the diagram. To apply, determine Sigma-metric, locate on the Sigma-scale, identify rules above and to the left, find N and R above the sigma value.
.

Westgard QC, Inc., Copyright © 2016
Page 153
12. Determining the Right Frequency of Controls
James O. Westgard, PhDFor monitoring the analytical testing process, the use of SQC and liquid controls provide an effective technique that can be widely applied in medical laboratories. Liquid controls can also be used to “verify the attainment of the intended quality of test results,” which is one of the technical requirements of ISO 15189. However, there is still an issue of how often controls need to be analyzed, i.e., the frequency of SQC. There are many factors that need to be considered when determining run length and how often controls need to be analyzed.
How often should liquid controls be run?At first, it seems like it should be simple to define how often controls should be run, but it gets complicated because of the accreditation guidelines, regulatory requirements, and the different types of analytic systems and different modes of operation.
ISO 15189 Guidelines. There is no specific guidance for the frequency of SQC, but instead a general requirement to design SQC procedures that are appropriate for the test, method or examination procedure being used, and the intended use of that test [1].
5.6 Assuring quality of examination procedures
5.6.1 The laboratory shall design internal quality control systems that verify the attainment of the intended quality of results. It is important that the control system provide staff members with clear and easily understood information on which to base technical and medical decisions. Special attention should be paid to the elimination of mistakes in the process of handling samples, requests, examinations, reports, etc.
ISO typically provides “high-level guidance,” meaning that it describes what should be accomplished, without any details on how to accomplish it. More detailed guidelines are often found in

Westgard QC, Inc., Copyright © 2016
Page 161
13. Controlling the Total Testing Process
James O. Westgard, PhDHaving described SQC in detail in the previous chapters, now we want to discuss the sources of error that can be monitored by SQC and the need for other QC mechanisms to monitor the Total Testing Process. The combination of QC mechanisms should make up a QC Plan, which is the focus of the next set of chapters
SQC is a powerful control technique because it uses a liquid sample that is subjected to many of the same steps of the testing process as a real patient sample. By going through the analytical testing process, the liquid control is able to check many variables, factors and components in an analytic system. SQC provides a single control technique that can be used on multiple analytic tests and systems. Nonetheless, many people find SQC difficult to imple-ment, especially in small laboratories and in Point-of-Care (POC) applications, because of the cost, training, and data calculations that are needed.
US CLIA regulations administered by CMS (Centers for Medi-care and Medicaid Services) have specified that the minimum SQC should be 2 levels of controls analyzed daily [1]. However, many Point-of-Care devices have relied on other types of “built-in” control mechanisms that manufacturers provide to monitor the performance of their analytic devices. In the 1990s, CMS allowed the use of daily electronic controls for POC applications. With the final CLIA rule in 2003, CMS more formally defined an option called “Equivalent QC” that required laboratories employing electronic QC to analyze liquid controls at least weekly or monthly, depending on the documented stability of the particular analytic device. The details of “EQC” were provided in the State Operations Manual (SOM) which supplements the actual CLIA regulation [2].
Manufacturers today provide more extensive built-in controls that may include integrated quality control samples that are auto-matically sampled and processed internally by the analytic device, calibration checks, measuring system function checks, and electronic

Westgard QC, Inc., Copyright © 2016
Page 171
14. Complying with CLIA QC Regulations
James O. Westgard, PhDThe CLIA regulations for QC are based on test complexity, which describes the difficulty of performing the test methodology. For purposes of QC, there are three categories of test complexity: waived, non-waived, and Provider-Performed Microscopy (PPM, which is reserved for a selected group of practitioners). For waived tests, the laboratory is supposed to follow the manufacturer’s directions, including any recommendations for QC. For non-waived tests, the laboratory must comply with the CLIA requirements found in subpart K (Quality Systems for Nonwaived Testing) [1], which are shown at the end of this chapter.
Prior to January 1, 2014, the CLIA regulations provided 3 op-tions for compliance, which we call Default QC, Right SQC, and EQC:
• Default QC. Analyze a minimum testing of 2 levels of controls each day of patient testing, as specified in 493.125 (d)(3i).
• Right QC. Establish QC procedures to monitor the accuracy and precision of the complete analytic process, establish the number, type, and frequency of testing control materials based on the performance (precision, bias) verified by the laboratory, detect immediate errors that occur due to test system failure, adverse environmental conditions, and operator performance, and monitor over time the accuracy and precision of test performance that may be influenced by changes in test system performance and environmental conditions, and variance in operator performance, as described in 493.125 (a-c).
• EQC. Implement a procedure for “equivalent quality testing” as stated in 493.125 (d), in accordance with CMS’s requirements for “Equivalent QC” (EQC) found in Appendix C of the State Operations Manual (SOM) 2 .
Basic QC Practices, 4th Edition
Page 184
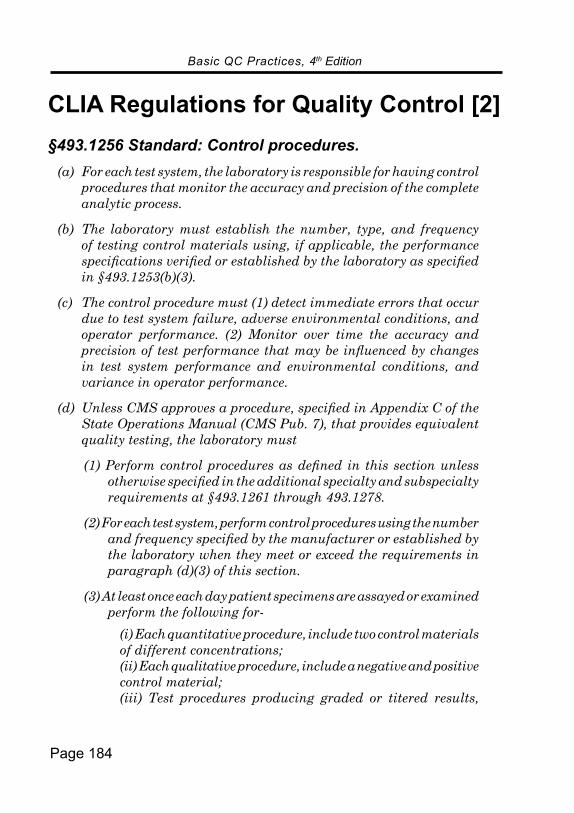
CLIA Regulations for Quality Control [2] §493.1256 Standard: Control procedures.
(a) For each test system, the laboratory is responsible for having control procedures that monitor the accuracy and precision of the complete analytic process.
(b) The laboratory must establish the number, type, and frequency of testing control materials using, if applicable, the performance specifications verified or established by the laboratory as specified in §493.1253(b)(3).
(c) The control procedure must (1) detect immediate errors that occur due to test system failure, adverse environmental conditions, and operator performance. (2) Monitor over time the accuracy and precision of test performance that may be in uenced by changes in test system performance and environmental conditions, and variance in operator performance.
(d) nless CMS approves a procedure, specified in Appendix C of the State Operations Manual (CMS Pub. 7), that provides equivalent quality testing, the laboratory must
( ) erform control procedures as defined in this section unless otherwise specified in the additional specialty and subspecialty requirements at §493.1261 through 493.1278.
(2) For each test system, perform control procedures using the number and frequency specified by the manufacturer or established by the laboratory when they meet or exceed the requirements in paragraph (d)(3) of this section.
(3) At least once each day patient specimens are assayed or examined perform the following for-
(i) Each quantitative procedure, include two control materials of different concentrations;(ii) Each qualitative procedure, include a negative and positive control material;(iii) Test procedures producing graded or titered results,

Westgard QC, Inc., Copyright © 2016
Page 191
15. Developing a QC PlanJames O. Westgard, PhD
The concept of a QC Plan is good, but it is difficult to perform a proper risk assessment to implement a risk-based Individualized QC Plan! There is an alternative approach in the form of a Total QC Plan that is more widely applicable, particularly for applications other than Point-of-Care testing. In fact, we recommend the general application of Total QC Plans whenever Statistical QC procedures can be implemented for daily control.
We use the term “Total QC Plan” for our approach to identifying and assembling control mechanisms to monitor the Total Testing Process, which includes pre-analytic, analytic, and post-analytic phases of the process. Critical to this approach is optimizing or right-sizing the SQC procedure to assure detection of medically important errors, as described in chapter 11 and the application of Westgard Sigma Rules. Compliance to the CLIA QC requirements is achieved by analysis of control materials and does not depend on formal risk assessment. Nonetheless, a Total QC Plan can provide an effective approach for controlling the Total Testing Process by adding pre-analytic and post-analytic controls to the right-sized SQC procedure.
The decision on whether to develop a Total QC Plan or Indi-vidualized QC Plan should be made on the basis of your review of current QC practices and their compliance with the CLIA QC op-tions, review of the manufacturer’s QC instructions and performance claims, as well as your assessment of the Sigma-metric of the test and test system. The laboratory director must be involved in this decision because CMS specifically assigns the responsibility to the director 1 :
Per the existing CLIA regulations, the laboratory director is responsible for deciding whether the laboratory will utilize IQCP for some or all of its tests and for ensuring that the QCP he/she develops effectively meets the IQCP requirements. It is also incumbent upon the laboratory director to consider the laboratory’s clinical and legal responsibilities for providing accurate and reliable testing when approving and signing off on the QCP.

Westgard QC, Inc., Copyright © 2016
Page 207
16. Evaluating RiskJames O. Westgard, PhD
If SQC is not performed each day of testing with at least 2 levels of control materials, the laboratory must develop a risk-based QC Plan to comply with the CMS option for Individualized Quality Control Plan (IQCP). CMS requires no formal methodology, nor use of any of the common industrial tools such as Failure Mode Effects Analysis, otherwise known as FMEA. In fact, the CMS/CDC guidance that was issued in 2015 [1] does not actually require risk assessment, only hazard identification. You can download the CMS/CDC “Step-by-Step Guide for Developing an IQCP” and only need to follow the 3 CMS/CDC worksheets that were described in chapter 15.
Nevertheless, in this chapter, we are going to describe how risk assessment should be done to improve the reliability of IQCPs.
Risk ManagementThe purpose is to identify specific susceptibilities, or failure modes, that may cause errors in test results. Manufacturers attempt to identify those failure modes in the development of their test systems, eliminate them through design improvements and scheduled preventive maintenance, and integrate procedural controls or functional checks to detect failures and alert the operators to problems. Such manufacturer controls should always be included in any QC Plan, but additional controls may still be needed because of the operating conditions for a test system in your laboratory. The need for these other controls is the focus of risk-based QC Plans and the application of Risk Management concepts and principles to the Total Testing Process in the medical laboratory.
Risk Management is widely used in industry, including the manufacturers of diagnostic test systems that are intended for use in medical laboratories. The fundamental guidance for manufacturers of medical devices is found in ISO 14971 [2] and supplemented by CLSI EP18A2 [3], the latter being aimed at both device manufac-turers and medical laboratories and is more readily available and readable by laboratory analysts. The heart of Risk Management

Westgard QC, Inc., Copyright © 2016
Page 221
17. Mitigating RiskJames O. Westgard, PhD
The previous chapter provided guidance for performing a Risk Assessment, recommending a 3 factor model that includes severity, occurrence, and detection; a ranking scale of 0, 1, and 2 for each risk factor; a risk calculation based on the equation SEV*OCC*(2-DET); and a prioritization of calculated risks of 2 and greater (up to 8) for further actions. Those targeted failure modes must then be addressed to mitigate their risks.
Mitigating risksMitigation is the term that is used to describe an action to eliminate, lower, or prevent risk. The strategies for reducing risk depend on the particular risk factor that is being targeted. For example, manufacturers design their test systems to ensure safety characteristics (e.g., precision, bias, reportable range, etc.) are appropriate for the intended clinical use, plus provide information for safe use of test results (specimen types, reference ranges, possible interferences, sample requirements, known limitations, etc.). Manufacturers reduce occurrence by making improvements that eliminate failure modes during the design and production of new test systems and by recommending preventive and corrective actions in their instructions for use. In situations where occurrence of failures cannot be entirely eliminated or prevented, manufacturers add controls to detect and alert the operators of potentially harmful conditions.
Laboratories have fewer options for mitigating risks. Figure 17-1 outlines the laboratory strategies:
• First, for occurrence, the laboratory must confirm that safety characteristics are appropriate by performing validation studies. To accomplish this, the laboratory should define the quality required for the intended clinical use, evaluate imprecision and bias, and calculate a Sigma-metric to assess quality on the Sigma scale. Note that a laboratory cannot modify a manufacturer’s method or instructions for use unless

Westgard QC, Inc., Copyright © 2016
Page 233
18. Implementing Repeat Patient Test Controls
James O. Westgard, PhDIn the approach for developing QC Plans discussed in these lessons, the laboratory should preferably implement SQC whenever possible in order to comply with the CLIA QC option of analyzing two levels of controls per day. If the laboratory implements a Statistical QC procedure that satisfies this “default” option, a formal risk assessment is not required and a Total QC Plan can more easily be developed to monitor the Total Testing Process. If SQC cannot be implemented for daily operation, then the requirements for an Individualized QC Plan must be satisfied – risk assessment, QC Plan, and quality assurance plan.
While there are many control mechanisms recommended in the CLSI EP23A “QC Toolbox” 1 , only a few of those controls (other than the manufacturer’s built-in controls) are practical in POC set-tings where IQCPs are most likely to be used. One control that we recommend is the Repeat Patient Test (RPT) control, which makes use of existing patient samples.
The re-testing of patient samples is intuitively understood by analysts and operators as a check on the variability of a test. An RPT can monitor the effects of operator skills, reagents, test system components and functions, and environmental conditions. The fact that real patient samples are tested means there is no issue with the commutability of samples, in contrast to concerns about the behavior of the stabilized control samples that are used for Statistical QC and Proficiency Testing. On the other hand, there will be an issue with the stability of fresh samples. Repeat testing must be performed within the time period of known sample stability. Manufacturers typically specify that time period in their directions for use and laboratories can experimentally verify stability by retesting samples repeatedly over a period of hours or even days.
In principle, the RPT control has many of the capabilities of SQC procedures without requiring separate control materials. It also has potential limitations due to the instability of samples that

Westgard QC, Inc., Copyright © 2016
Page 245
19. Developing a QA Program to monitor the QC Plan
James O. Westgard, PhDRemember, an Individualized QC Plans requires 3 components – a Risk Assessment, a QC Plan, and a Quality Assessment (QA) plan [1].
CMS has approved a procedure which permits laboratories to develop and customize quality control procedures in their healthcare setting. This procedure is termed Individualized Quality Control Plan (IQCP). An IQCP is comprised of three parts, a risk assessment (RA), a Quality Control Plan (QCP), and a Quality Assessment (QA) plan. he A is the identification and
Total QC PlanRight-Sized SQC
Pre- & post-analytic controls
Individualized QC Plan(1) Risk Assessment
(2) QC Plan(3) QA Plan
Monitor Performance, Quality, and Safety
Improve Quality & Safety
Audit QC Practices
Validate Safety Characteristics
Determine Sigma Quality
Analyze2 levels of
controls/day?
Figure 19-1. Approach for developing Total or Individualized QC Plans

Westgard QC, Inc., Copyright © 2016
Page 253
20. Monitoring Quality with EQA and PTDavid Plaut, BA and James O. Westgard, PhD
The discussion of quality control in earlier chapters has focused on data and results from a single laboratory. Such “internal QC” or “intra-laboratory QC” is essential for detecting problems that arise during the routine operation of laboratory methods. Those problems are caused by the instability of the method, i.e., changes in performance compared to what was observed earlier. In essence, internal QC compares laboratory performance to itself over time, assuming that the performance observed earlier represents correct or accurate test results. This assumption should be confirmed by method validation experiments and must be verified on a continuing basis by “external quality assessment programs.”
The CLSI C24-A3 document on principles of SQC [1] recom-mends that laboratories participate in EQA programs:
9.0 Interlaboratory QC Programs: When laboratories share a common pool (lot number) of control materials and report the results to an interlaboratory program, a database is created that yields statistical information, which may be used to describe or define: ( ) intralaboratory and interlaboratory imprecison; ( ) individual laboratory bias relative to a peer group; and (3) relationship of analytical and statistical parameters of imprecision and relative bias to medical requirements. For laboratory self-evaluation, peer-related bias and relative imprecision are useful parameters. Participation in an interlaboratory program provides an effective mechanism to complement external quality assessment (proficiency survey) programs…
What is external quality assessment? In an external quality assessment program, a group of laboratories analyze the same specimens (usually the same control materials, exact same lot numbers) and submit their results to a central facility where the data are examined for outliers, and means and SDs are calculated to characterize the performance of the group of laboratories, and reports are generated to compare the performance

Westgard QC, Inc., Copyright © 2016
Page 271
21. Implementing a Quality Management System
James O. Westgard, PhDQuality management has been described as the implementation of the scientific method, or the Plan-Do-Check-Act cycle (PDCA) [1]. Our formulation of the PDCA cycle is represented by components for Quality Laboratory Processes, Quality Control, Quality Assessment, Quality Improvement, and Quality Planning – all of which are centered on the Quality Goals, objectives and requirements to be achieved by the medical laboratory. Quality management involves the policies, processes, and procedures that are needed to organize, implement, and support laboratory testing. Quality assurance is the outcome of this quality management process.
From these lessons, it should be clear that the achievement of quality is a complex process and doesn’t happen by chance. It takes well-planned and well-managed activities to achieve quality. Quality Control is just one part or component that is essential for quality assurance. In turn, quality assurance depends on many other capabilities, as identified by the Quality System Essentials (QSEs) in the CLSI Quality Management System (QMS) model 2,3 . The QMS model provides the “big picture” that describes all the activities that are necessary in a medical laboratory to guarantee the quality of laboratory tests and services.
Like the CLSI QMS model, there are other guidelines from ISO 15189 [4] and the US CLIA regulations [5] that describe similar Good Laboratory Practices, but these guidelines and documents differ in their organization and their terminology. The best guidance for quality management is an understanding of all these recommenda-tions, guidelines, and rules, plus a practical perspective on what will work in the medical laboratory.
The CLSI QSEs identify management requirements in terms of organization, personnel, equipment, purchasing and inventory, process control, information management, occurrence management, external and internal assessment, process improvement, customer services and satisfaction, and facilities and safety. The ISO man-

Westgard QC, Inc., Copyright © 2016
Page 291
22: Managing pre- and post-analytical quality
Sten Westgard, MS“Happy families are all alike. Every unhappy family is unhappy in its own way.” Leo Tolstoy, Anna Karenina
Great Russian novels have their uses. In laboratories, analytical errors are mostly all alike: every method has some amount of analytical error, in the form of systematic and random error. As noted in previous chapters, there are reliable ways to monitor, control, and improve the analytical process. (Believe it or not, this is the Happy part)
But when we discuss pre-analytical and post-analytical error, each laboratory has pre-analytical errors in their own way (This is the Unhappy part). Of course, the many differences in pre-analytical error are to be expected. While the analytical process is essentially the same in each laboratory (the instruments and methods are designed to perform the same process), the path that the patient specimen takes to reach that instrument is unique to each healthcare setting. And often the return of the test result also has its own unique path and ends up on a one-of-a-kind report.
Accordingly, since the problems tend to be unique, the solu-tions must often be customized. This makes it more challenging to describe guidelines for pre-analytical and post-analytical problems.
Errors Outside the BoxThe definition of what constitutes a pre-analytical and post-analytical error can also be confusing. Recently, the literature has defined not only pre-analytical errors, but pre-pre-, pre-, post-, and post-post- analytical errors. Analytical errors are often narrowly defined as errors “in the box,” which occur only within the laboratory and sometimes only during the actual analysis step when the specimen is inside the instrument. Everything else is outside the box.

Westgard QC, Inc., Copyright © 2016
Page 309
23. Assuring the Right Quality Right James O. Westgard, PhD, Sten Westgard, MS
The previous chapters (we hope) gave a lot of information about quality control and the way it is used and the way it should be used.
It may seem overwhelming at first.
In this chapter, we’re going to try and summarize key points and turn them into actions you can take now. So we’re going to give you some “Top 10” lists, which are so popular in our media and lit-erature. These should help you remember all the information from the previous chapters in an easy way – but remember to go back and look at those chapters whenever you have questions.
Doing the right QC right is not easy! It takes a lot of study to understand the concepts and principles, then even more hard work to master the details of calculating the data, setting up the control charts, selecting the right control rules, and implementing QC right in the daily operations in the laboratory. Then there may be difficul-ties in convincing others that changes or improvements are really needed in the QC practices already in use in the laboratory. You will hear many reasons given why you can’t change what’s being done. Here we’ll try to address the most common complaints, com-mon problems, and needs for improvement. These are our “top-ten” lists. Unfortunately, they could be much longer in the real world, but the “top ten” should be sufficient to help you understand the both the problems and the difficulties of making improvements in your laboratory.
Common Complaints
#1 Q-Complaint. Why do we need to change QC? We’ve always done it this way!Q-Answer. Change is always difficult and especially when basic concepts and principles are understood. QC has often been taught as a set of traditions handed down from one analyst to the next. After so many “hand-offs”, it’s possible that the original ideas and

Westgard QC, Inc., Copyright © 2016
Page 329
IndexSymbols
1:2s control rule definition 20, 47, 491:3s control rule definition 20, 472:2s control rule definition 21, 482of3:2s control rule definition 503:1s control rule definition 504:1s control rule definition 486:x control rule definition 507:T control rule definition 518:x control rule definition 499:x control rule definition 5110:x control rule definition 49ΔSEcrit 142
AAcross materials 60Across run 61, 73Allowable bias 11Allowable imprecision 11Allowable total error 11, 140. 284Analytical QC Plan 283Analytical Run 22, 156Analytic Controls 200Analyzer Acceptability 200Assay control limits 117Assayed values 124Automation 297–299
BBad control habits 78–79Batch mode 157Bottle values 123–124, 314
CCAP 9, 179, 180, 240Cartridge stability 229Changing control lots 127Charts of Operating Specifications ( see also OP-
Specs charts) 321CLIA 9, 21, 117, 191, 197, 204, 208, 229, 233
, 246, 259, 273run length 154–155
CLSI 169CLSI C24-A3 22, 104–105, 156, 181, 285
Assay Control Materials 124cumulative mean and SD 125Establish Mean for New Lot 128Establish SD for new Lot 128imprecision 118–119interlaboratory QC programs 253
CLSI EP18A2 207, 282CLSI EP23A 176, 177, 180, 208, 213, 222, 223
, 226, 233, 247, 282CLSI EP26A 241, 243CLSI GP26 9CLSI guidance 175CLSI HS1-A2 17, 272, 274CLSI “source of errors matrix” 292Coefficient of variation, CV 122
cumulative 126Coefficient of variation index, CVI 131, 257COLA 9Collection and processing of specimens 199Commutability 226Continuous mode 158–159Control charts 16, 19, 32–41Control concentration level 99Control limits 19, 27, 32, 117, 123, 181, 314
cumulative 127Control materials 25–26, 123
Assayed versus unassayed 108Assigned values 124concentration levels 108lot changes 127–128Matrix 104–106Pre-treatment steps 106Stability 107Vendor considerations 109–110Vial-to-vial variability 107–108
Control mechanisms 224Control repeats 78, 96Control results 41–42Control rules 20, 100Controls (see also control materials) 153–160Control stability 99Corrective action 281Critical Difference 241Customer complaints 201CVI 257, 258

Basic QC Practices, 4th Edition
Page 330
DDefault QC 155, 171, 175, 194Defect rates 250Detectability 177, 211Detection 173, 182, 208, 213,
214, 221, 222, 227Developing an IQCP: A step-by-step guide 158,
177
EEffort 225Electronic QC 161, 166, 166–167, 168, 168–
169EP23A 182EQA 253EQC 171, 180Equivalent QC 161Equivalent quality testing 180Error detection (Ped) 18, 55, 56Error frequency 303–304Error sources 164Event-driven QC 157Examination procedure 276External Quality Assessment (EQA) 16. 169, 254EZ Rules 285, 325
FFailure Mode Effects Analysis (FMEA) 16,
175, 204, 207, 208, 210, 211, 216, 217, 227Failure modes 177, 197, 204, 205, 207, 208False alarm 103False rejection (Pfr) 18, 27, 55, 56Frequency of Controls 153–160, 203
GGaussian distribution 16Good laboratory habits 79–84Good Laboratory Practices 271
HHazard identification 178Hazards 197, 210Hazards checklist 198
High sigma TQC strategy 285Histogram 16–17HS1 (see also CLSI HS1) 9
IImmediate notification of critical values 200Imprecision 142Individualized Quality Control Plan (see IQCP) Instrument and environmental conditions 200Instrument and reagent factors 163, 164Integration/Report/Chart 163Intended quality of results 280Internal procedural controls 161Interpretative guidance and safety informa-
tion 201Interpretative Guidelines 174IQCP 158, 162, 172, 174, 179, 181, 182, 18
3, 191, 194, 196, 197, 199, 206, 207, 209, 210, 223, 225, 230, 233, 245, 246, 248, 251
ISO 9000 11, 12ISO 73, 165, 172, 271, 272, 273, 276–279, 280–
281, 319ISO 15198 102ISO 22367 281
LLabeling of specimens and samples 199Lean 16, 299–300Levey and Jennings 18Low sigma TQC strategy 285
MManagement responsibility 98, 102Matrix 104–106Matrix effect 104Mean 16, 26, 32, 99, 118–120, 123
cumulative 126Mean and SD calculations
Assigned values 124Cumulative interval values 124Cumulative-to-date values 125Fixed interval values 124Moving interval values 125
Measurand 276

Westgard QC, Inc., Copyright © 2016
Page 331
Measurement uncertainty (MU) 286Method stability 99Moderate sigma TQC strategy 285Multirule QC (see also “Westgard Rules”) 45–57
NNGSP 240Non-conformities 251, 281Normal distribution 16Normalized OPSpecs Charts 325
OOccurrence 173, 177, 182, 208, 210,
213, 221, 227, 228Operator variability 227OPSpecs charts 285, 325Out of control problems 77–88
PParallel testing 55Patient identification 199Patient Safety 16Peer comparison 254–257
advantages 268report 260, 260–263
Plan-Do-Check-Act cycle 13, 271Point of Care (POC) 191-192, 197, 202, 216-218,
225, 226, 227, 229, 238, 243, 282, 313Post-analytical errors 162-163, 165, 291,
294, 301–302, 322Post-Analytic Controls 200Practicality 224Pre-analytical errors 162-164, 291–294, 303–305,
322Pre-analytical workstations 298–299Pre-Analytic Controls 199Preliminary review 163Preventive actions 281Probability for error detection (Ped) 144Probability for false rejection (Pfr) 144Proficiency Testing (PT) 16, 194, 204,
229, 233, 323, 253-254, 265-267Provider-Performed Microscopy 171
QQA plan 248QC Plan 158, 169, 175, 191, 193, 208, 245
, 282QC protocol 60–61, 95QC review 200Quality System Essentials (QSE) 12, 17, 271-274Quality 11
definition 9–10Quality Assessment plan (QA) 173, 249Quality Assessment (QA) 14, 172, 178, 245-246Quality Assurance 11, 196, 209Quality Assurance monitoring 158Quality Control (QC) 14, 22
definition 11Quality Control Plan (QCP) 22, 172, 173, 176,
178, 247Quality Control strategy 22Quality Design 14Quality Goals (QG) 14Quality Improvement (QI) 14Quality Indicators 11, 247Quality Laboratory Processes (QLP) 14, 18, 165Quality Management 11Quality Management System 12, 271Quality Policy 12Quality System 274
RR:4s control rule definition 21, 48Random error 81, 120Reagent acceptability 200Reagent lot-to-lot acceptability 241Reliability 225“Repeated, repeated, got lucky!” 95Repeat Patient Test (RPT) 226,
227, 229, 233, 235, 236Residual risk 227, 282Results/Readout/Raw Data 163Right QC 171Right-sized SQC 205Risk 175, 178, 207Risk Analysis 175, 282, 319, 322Risk Assessment 158, 172-174,
176, 178, 204, 207, 209-210, 215, 221, 245-246

Basic QC Practices, 4th Edition
Page 332
Risk-Based QC Plan 192, 193, 207, 218Risk Estimation 175Risk Evaluation 175Risk Factors 212Risk Management 16,
166, 169, 176, 207, 222, 282Risk Mitigation 183, 208, 221, 227-228Risk Priority Number (RPN) 212, 214Root cause analysis 173Run length 21, 153–160Running a new control 79
SSample acceptability 200, 229Sample instability 228Sample preparation 163Sample presentation 164Sample requirements 199SDI 257Serial testing 55Severity 77, 182, 204, 208, 210, 221, 222, 228Severity 210, 213, 227Shewhart 17Sigma-metric 141, 142, 144, 303–305, 322significant figures 119, 123Six Sigma 15, 16, 300Six Sigma Quality Management 250, 319Six Sigma Quality Management System 284, 287Six Sigma Quality Management Systems 320sources of error 159sources of errors 162Specimen collection 163, 164standard devation index, SDI 130–131standard deviation 99, 118, 120–122, 123
cumulative 121, 126standard deviation index, SDI 257standard deviation (SD) 16, 26–27Standard Operating Procedure (SOP) 285Standard Operating Procedures (SOPs) 295–
296, 320Standard Operating Procedures, SOPs 169State Operations Manual (SOM) 161, 171Statistical process control 18, 19Statistical QC 101–102, 200Statistical quality contro 22Step-by-Step Guide for Developing an IQCP 207systematic error 80–81, 82, 120
TTest report delivery 201Test result review 200The Joint Commission 179tolerance limits 15Total error 258–259total error graph 259Total QC Plan 182, 191, 192, 194, 195, 196, 1
99, 201, 204, 205, 206, 208, 210, 230, 233, 246, 283, 322
Total QC plans 320Total QC strategies 320Total QC Strategy 283Total QC strategy (TQC) 285Total Quality Control Plan 286Total Quality Management 319Total Quality Management (TQM) 13Total Testing process 208Total Testing Pros 16, 17, 161, 162, 165, 166,
167, 191, 192, 196, 197, 199, 202, 204, 207, 233, 275, 284, 292, 319
Traceability 277trouble-shooting
guides 84–88Trueness of measurement 277turn-around time 300turnaround time 251Turnaround time 218, 228Turnaround Time 201
UUncertainty of measurement 277
VValue Stream Mapping 301
Wwarning rule 52, 55, 60, 65, 67, 69, 73“Westgard Rules” 58
interpretation 59–76modern recommendations 56–57traditional 46
“Westgard Rules” 18Westgard Sigma Rules 191, 196, 203, 204, 285
, 312, 321, 325

Westgard QC, Inc., Copyright © 2016
Page 333
within material 60within run 60within-run 60
YYouden plot 257Youden Plot 264, 266
Zz-score 129