western central atlantic fishery commission …sedarweb.org/docs/wsupp/s8rd29 fao619.pdf · fao...
TRANSCRIPT

FAO Fisheries Report No. 619 FIRM/R619
ISSN 0429-9337
WESTERN CENTRAL ATLANTIC FISHERY COMMISSION REPORT ON THE FAO/DANIDA/CFRAMP/WECAFC REGIONAL WORKSHOPS ON THE ASSESSMENT OF THE CARIBBEAN SPINY LOBSTER (Panulirus argus) Belize City, Belize, 21 April–2 May 1997 Merida, Mexico, 1–12 June 1998
DANIDA Denmark Funds-in-Trust
Food and Agriculture Organization of the United Nations
CARICOM Fisheries Resources Assessment Program (CFRAMP)

Copies of FAO publications can be requested from: Sales and Marketing Group
Information Division FAO
Viale delle Terme di Caracalla 00100 Rome, Italy
E-mail: [email protected] Fax: (+39) 06 57053360

FAO Fisheries Report No. 619 FIRM/R619
WESTERN CENTRAL ATLANTIC FISHERY COMMISSION
REPORT ON THE FAO/DANIDA/CFRAMP/WECAFC
REGIONAL WORKSHOPS ON THE ASSESSMENT OF THE CARIBBEAN SPINY LOBSTER (Panulirus argus)
BELIZE CITY, BELIZE, 21 APRIL - 2 MAY 1997
AND
MÉRIDA, YUCATÁN, MÉXICO, 1-12 JUNE 1998
FOOD AND AGRICULTURE ORGANIZATION OF THE UNITED NATIONS ROME, 2001

The desi gnations employed and the presentation of the material in this information product do not imply the expr ession of any opinion whatsoever on the part of the Food and Agriculture Organization of the U nited Nati ons concerning the legal status of any country, territory, city or area or of its authorities , or concerni ng the delimitation of its frontiers or boundaries.
All rights reserved. Reproduction and dissemination of material in this information product for educational or other non-commercial pur poses are authorized without any prior written permission from the copyright holders provided the source is fully acknowledged. Reproduction of material in this information product for resale or other commercial purposes is prohibited without written permission of the copyright hol ders. Applicati ons for such permission should be addressed to the Chi ef, Publishi ng Management Service, Information Division, FAO, Vial e delle Terme di Caracalla, 00100 Rome, Italy or by e-mail to [email protected]
© FAO 2001
ISBN 92-5-104540-2

iii
PREPARATION OF THIS DOCUMENT
This document was prepared by the Food and Agriculture Organization of the United Nations (FAO), which organized the two "FAO/DANIDA/CFRAMP/WECAFC Regional Workshops on the Assessment of the Caribbean Spiny Lobster (Panulirus argus)" through the Project "Training in Fish Stock Assessment and Fishery Research Planning" funded by the Danish International Development Agency (DANIDA) in collaboration with the CARICOM Fisheries Resource Assessment and Management Program (CFRAMP), funded by the Canadian International Development Agency (CIDA). The work was accomplished under the guidance and with support of FAO/Western Central Atlantic Fishery Commission.
The Workshops were held in Belize City, Belize, from 21 April to 2 May 1997 and in Mérida, Yucatán, México, from 1 to 12 June 1998. An administrative report of the first Workshop is available as Denmark Funds-in-Trust, FI:GCP/INT/575/DEN, Report on Activity No. 35, FAO, Rome. Part I of this document includes a brief report on the two Workshops, reviews of lobster fisheries and biology and the results of assessments of lobster resources by countries and sub-regions, all prepared by various authors. Part II contains edited and in most cases merged national reports presented at the two Workshops, as well as a rather complete list of important references, which have been checked for accuracy as far as access permitted. Part III contains brief descriptions of stock assessment methods used during the Workshops and/or to be used during future Stock Assessment Workshops. The editors have tried to present the results as comprehensive and clear as possible, knowing that this document would be used as a starting point for further regional activities. The delay in publishing it is much regretted.
Siebren C. Venema Project Manager
GCP/INT/575/DEN

iv
FAO/Western Central Atlantic Fishery Commission. Report on the FAO/DANIDA/CFRAMP/WECAFC Regional Workshops on the Assessment of the Caribbean Spiny Lobster (Panulirus argus). Belize City, Belize, 21 April-2 May 1997 and Merida, Yucatan, Mexico, 1-12 June 1998. FAO Fisheries Report. No. 619. Rome, FAO. 2001. 381p.
ABSTRACT This document consists of three parts. Part I contains the proceedings of the two workshops, including lists of participants and the results of stock assessments by country and/or sub-region made during the two workshops. Part II contains a combination of edited national reports in the original language, as presented at the two workshops on the spiny lobster fisheries in the Bahamas, Belize, Bermuda, Brazil, Colombia, Cuba, the Dominican Republic, Honduras, Jamaica, Mexico, Nicaragua, Saint Lucia, the USA and Venezuela. It also contains a combined list of all references of Parts I and II. Part III contains nine notes on stock assessment methods applicable to resources of spiny lobsters.
Distribution: CFRAMP Donor Agencies FAO Fisheries Department FAO Offices in the Region FAO Regional Fisheries Officers Participants to the Workshop WECAFC Distribution List WECAFC National Correspondents

v
TABLE OF CONTENTS Page
Part I LOBSTER ASSESSMENT REPORTS edited by Paul Medley
1
Section Title 1. Report of workshops held in Belize City and Merida
by K. Cochrane and S.C. Venema 1
2. Regional review by N.M. Ehrhardt 123. Biology by A.M. Arce and M.E. de León 174. Review of larval recruitment patterns and variability in spiny
lobster (Panulirus argus) by R. Cruz, B. Luckhurst and R. Muller 26
5. Region 1: Brazil and Venezuela by G. Andrade de Pasquier, J.A. Negreiros Aragão, R. N. de Lima Conceição, R.C. de Almeida Carvalho, N.M. Ehrhardt and C.A. Sobreira Rocha
33
6. Region 2: Belize, Southwest Cuba and Mexico by M.Arce, A. Clemetson, M.E. de León, J. Gonzalez Cano, S. Marshalleck, S. O'Brian, R. Puga, V. R. Restrepo, G. Richards, V. Rios Lara, E. Sosa Cordero and C. Zetina
52
7. Region 3: Nicaragua, Honduras, Colombia and Jamaica by R. Barnutti, J. Gallo, J. Gonzalez Cano, S. Grant, R. Gutierrez, A. Irias, M. Pérez, J. Rodriguez and M. Suazo
74
8. Region 4: Bahamas, Bermuda, North Cuba, St. Lucia, Turks and Caicos Islands and the United States of America by G. Bethel, R. Cruz, V. Deleveaux, D. Harper, B. Luckhurst, W. Joseph, P. Medley and R. Muller
91
9. Bioeconomics by J.C. Seijo, E. Pérez, R. Puga and R.C.de Almeida Carvalho
115
10. Management: Review of existing regulations by K. Cochrane, M. Tandstad, R. Cruz, N.M. Ehrhardt, J. Gonzalez Cano, P. Medley, V.R. Restrepo and J.C. Seijo
136
11. Conclusions and recommendations 155
Part II NATIONAL REPORTS AND REFERENCES compiled and edited by Siebren Venema
161
Section Title 1. National report on the spiny lobster fishery in the Bahamas
by V.K.W. Deleveaux and G. Bethel 161
2. National report on the spiny lobster fishery in Belize by G. Richards
168
3. National report on the spiny lobster fishery in Bermuda by B.E. Luckhurst
175

vi
Section Title Page
4. National report on the spiny lobster fishery in Brazil by C.A. Sobreira Rocha, R. N. de Lima Conceição, R.C. de Almeida Carvalho and J. A. Negreiros Aragão
179
5. Aspectos de las pesquerías y de la biología de la langosta espinosa en la República de Colombia por J. Gallo, M. Rojas y F. Correa
184
6. National report on the lobster fisheries in Cuba by M.E. de León, R. Puga and J. Baisre
197
7. La pesca de langosta en la República Dominicana por J. Infante 2038. La pesquería de la langosta en Honduras
por A. Irias, J. Rodriguez y M. Suazo 206
9. National report of Jamaica by S. Grant 21610. La pesquería de langosta en México: Yucatán y Quintana Roo
por E. Sosa Cordero, V. Rios Lara, A.M. Arce y M. Cabrera Vazquez 227
11. Informe de Nicaragua sobre la langosta del Caribe por S.Martinez 23812. Informe nacional de Nicaragua por R. Barnutty y M. Pérez Moreno 25213. Saint Lucia country report by W. Joseph 25514. Spiny lobster fisheries of the United States of America
by D. Harper and R. Muller 258
15. Additional report of the United States of America by R.G. Muller 27916. La pesquería de langosta en Venezuela por J.C. Fernandez 28317. Reporte adicional de Venezuela por G Andrade de Pasquier 28818. References compiled by M.E. de León, J. Schofield and S.C. Venema 292
Part III STOCK ASSESSMENT METHODS by J. Gonzalez Cano and V.R. Restrepo
323
Section Title 1. Relative abundance and standardized effort by V.R. Restrepo 3252. Mortality from mean lengths by J. Gonzalez Cano 3293. Catch curves by J. Gonzalez Cano 3324. Length-based cohort analysis by J. Gonzalez Cano 3365. Dynamic depletion models by V.R. Restrepo 3456. Production models by J. Gonzalez Cano 3577. Age-structured production models by V.R. Restrepo 3668. Reference points by V.R. Restrepo 3699. Tuned age-structured assessments by V.R. Restrepo 375

CARIBBEAN SPINY LOBSTER, Panulirus argus

1
PART I LOBSTER ASSESSMENT REPORTS
edited by P.A. Medley
1 REPORT ON WORKSHOPS HELD IN BELIZE CITY AND MERIDA K. Cochrane and S.C. Venema
1.1 BACKGROUND TO THE WORKSHOPS This report covers the methods, progress, results and conclusions of two international workshops on assessment and management of the Caribbean spiny lobster, Panulirus argus. The workshops were held in Belize City, Belize, from 21 April to 2 May 1997, and Mérida, Mexico, from 1 to 12 June 1998, respectively. Both were sponsored by the CARICOM Fisheries Resources Assessment and Management Program (CFRAMP) and the FAO/DANIDA Project GCP/INT/575/DEN. The workshops were also organised as training exercises in data processing, stock assessment and report writing. Lecture notes on useful methods were prepared and presented by the consultants Gonzalez-Cano and Restrepo (see Part III). The Caribbean spiny lobster occurs from North Carolina in the United States of America and Bermuda in the north to Rio de Janeiro, Brazil, in the south. In an east-west direction, it occurs from the Gulf of Mexico to the Antilles islands. It is found in coral reef and rocky areas and extends to a depth of up to 90m (Cervignón et al. 1993).
Figure 1.1 Landings of P. argus from all countries in the WECAFC area from 1950 to 1996, as recorded on the FAO Fishstat database
The fisheries for this species make a major economic and social contribution to many of the nations of the region (See Chapter 2). Over 30 000 tonnes of spiny lobster were recorded on the FAO database, Fishstat, as having been landed in 1996, following an almost linear increase in annual landings since 1950, the earliest year for which these data are available (Figure 1.1).
0
10000
20000
30000
40000
1950
1955
1960
1965
1970
1975
1980
1985
1990
1995
years
tota
l lan
ding
s (t
onne
s)

2
This steady increase over a period of nearly 50 years is cause for concern and indicated the need for an urgent examination of the status of the lobster resources in each of the lobster producing nations and in the region as a whole. These workshops were initiated to play a role in addressing this need. The stock or stocks of spiny lobster cross many national boundaries and this imposes specific difficulties and requirements for their effective management. The necessity for managing transboundary stocks (i.e. either shared, as in the case of lobster, or straddling) over their entire range is well understood, and is reflected in the Code of Conduct for Responsible Fisheries, which encompasses the precautionary approach. The Code of Conduct for Responsible Fisheries was unanimously adopted by the FAO Conference in November 1995. It describes the principles and standards which should be applied in the conservation, management and development of all fisheries and also covers the capture of fish, processing and trade of fish and fish products, fishing operations, aquaculture and the integration of fisheries into coastal area management. The Code is aimed at members and non-members of the FAO, fishing bodies, subregional, regional and global organisations, both governmental and non-governmental, and all people involved in fisheries and activities related to fisheries. The Code is not binding and its implementation is voluntary. However, it is consistent with, and parts are based on, the United Nations Convention on the Law of the Sea of 1982. It contains provisions already covered by other legally binding instruments such as the Agreement to Promote Compliance with International Conservation and Management Measures by Fishing Vessels on the High Seas, 1993. All aspects of the Code are highly relevant to the spiny lobster fisheries in the WECAFC area and should be studied by the relevant authorities. However, considerations in the management of transboundary resources are particularly relevant to the two lobster workshops. There is little doubt that the spiny lobster resource of the region is transboundary. The working hypothesis for this workshop was that there are four separate sub-stocks and, through larval drift, there are probably also significant exchanges between these sub-stocks (see Chapter 4). Where resources are transboundary, effective management requires that the stock is managed over the full range of its distribution (Code of Conduct, 7.3.1). The implications of this, and other requirements for responsible utilisation of transboundary resources, can be summarised as follows.
1. For transboundary fish stocks... the States involved should co-operate to ensure effective conservation and management of the resources. This should be achieved ... through a ... fisheries organisation or arrangement (Code of Conduct, 7.1.3).
2. To be effective, fisheries management should be concerned with the whole stock unit over its entire area of distribution (Code of Conduct, 7.3.1).
3. In order to conserve and manage transboundary fish stocks... management measures should be compatible. Compatibility should be achieved in a manner consistent with the rights, competencies and interests of the States concerned (Code of Conduct, 7.3.2).
4. States... should foster and promote international co-operation and co-ordination ...including information gathering and exchange, fisheries research, management and development (Code of Conduct, 7.3.4).
5. States should compile fishery-related and other supporting scientific data relating to fish stocks... in an internationally agreed format and provide them in a timely manner to the organisation... should agree on a mechanism for co-operation to compile and exchange such data (Code of Conduct, 7.4.6).

3
1.2 PARTICIPATING COUNTRIES Participants from the Bahamas, Belize, Brazil, Colombia, Cuba, the Dominican Republic, Honduras, Jamaica, Mexico, Nicaragua, the United States of America and Venezuela attended both meetings, while Bermuda and St Lucia were represented only at the 1998 and 1997 meetings respectively. Haiti was invited to participate in the meetings, but was unable to attend. Inputs from the Turks and Caicos Islands were presented through a consultant. Lists of participants and staff are presented at the end of this section. Country statements were prepared for each workshop, based on a given outline. The two statements as presented in Part II of this document were combined, with the exception of those for Nicaragua, the USA and Venezuela.
1.3 WORKSHOP OBJECTIVES The overall objectives of the workshops were as follows.
1. To undertake stock assessments for each country, using the data that were available and using methods that were appropriate to the resource dynamics, fishery and data in each country.
2. To consider the management and fishery implications for each country of the results obtained from the stock assessments.
3. To interpret the national results in terms of sub-regional and regional linkages, including sharing of the stock and fishery interactions.
4. For those countries where sufficient progress could be made in the underlying stock assessments, to implement bioeconomic models using economic data from the country and results from the stock assessments. For those countries that did not have the data necessary to achieve this objective, some basic training in the application and use of bioeconomic models was to be provided.
5. To characterise the population dynamics of the stock(s) so as to build models to examine the implications of alternative management regimes, including costs, benefits and uncertainty considerations. As a result of time constraints, this objective could only be realised for some countries and only at the national, rather than the stock or sub-stock level.
Within these overall objectives, greatest emphasis was placed on obtaining the best estimate of the status of the stocks. As far as possible, assessments included evaluation of variability in recruitment to the juvenile stocks and fisheries, differences in underlying assumptions and their affect on results, and consideration and description of other sources of error. Some level of stock assessment was attempted for each country but, depending on the data available, the assessments ranged from simple length-converted catch curve analysis to age-structured ADAPT-type analyses (see Part III). Careful consideration was given at the 1997 workshop to the likely stock structure of P. argus in the WECAFC region. While no conclusive statements could be made on the existence of discrete stocks, it was agreed that, for working purposes at least, four possible sub-stocks could be identified, based on the distribution of the species, the nature of the coastal shelf and the prevailing currents within the region. These ‘sub-stocks’ are:
• Brazil, possibly including Venezuela;
• Colombia, Nicaragua, Honduras and Jamaica;
• Mexico, Belize and southern Cuba;

4
• Northern Cuba, United States of America (Florida), Bahamas, Turks and Caicos Islands and Bermuda.
Because the available data were almost exclusively based on national monitoring and sampling, assessments were undertaken by country, but the national results within each ‘sub-stock’ were then considered sub-regionally:
• Group 1: Brazil and Venezuela
• Group 2: Belize, SW Cuba and Mexico
• Group 3: The Bahamas, Bermuda, North Cuba, the Turks and Caicos Islands and Saint Lucia
• Group 4: Colombia, Honduras, Jamaica, Nicaragua and the Dominican Republic
Full bioeconomic analyses could only be undertaken on three national fisheries, which had the most data available and on which the most complete stock assessments were carried out during the second workshop. These were the Gulf of Batabanó (Cuba), Isla Mujeres (Mexico) and Brazil. These bioeconomic analyses, reported in Chapter 9, included consideration of some of the most important sources of uncertainty, and generated indicators of the economic and biological performance of a range of different management options. At the end of the 1998 workshop, some time was still needed to be spent by the national participants on checking the models developed and the data used in them, and also on exploring other management alternatives. Nevertheless, these models now represent very valuable decision-making tools, and can and should be utilised to advise and inform the decision-makers in each country on management options available to them and their impacts. In most, if not all of the other countries for which full bioeconomic analyses could not be undertaken, the stock assessment results provided new and important information on the status of the resources and fisheries and highlighted the general nature of any management actions required. Descriptions of the analyses undertaken and the results are provided in Chapters 5 to 8 inclusive. Finally, the results of the stock assessments undertaken for each country and sub-region were considered within the regional context and regional patterns and features considered and described (See Chapter 10). Responsible fisheries management requires co-operation in research and management between countries sharing common resources. The existing management regimes in the region were considered in the light of the results of the workshop and the requirements for improved management were considered, with particular emphasis on regional requirements.

5
Participants at the Regional Workshop on the Assessment of the Caribbean Spiny Lobster, Panulirus argus Fisheries in the WECAFC area, Belize City,
Belize, 21 April - 2 May 1997 BAHAMAS1 DELEVEAUX, Vallierre Fisheries Officer Department of Fisheries Ministry of Agriculture and Fisheries P.O. Box N-3028 Nassau, The Bahamas Tel.: 001(242) 393-1014/5 Fax: 001(242) 393-0238 e-mail: [email protected] BELIZE O’BRIAN, Shirlene Fisheries Department Ministry of Agriculture and Fisheries P.O. Box 148 Belize City, Belize Tel.: (501- 2) 44552/32623 Fax: (501- 2) 32983 RICHARDS, Gilbert Fisheries Department Ministry of Agriculture and Fisheries P.O. Box 148 Belize City, Belize Tel.: (501) 2- 44552/32623 Fax: (501) 2- 32983 BRAZIL LIMA CONCEIÇÃO, Raimundo Nonato de Laboratório de Ciências do Mar. Av. Abolição 3207 - Meireles Caixa Postal 52.756, CEP 60.165-081 Fortaleza, Ceará, Brazil Tel: (55-85) 242 6422 Fax: (55-85) 242 83 55 e-mail: [email protected] SOBREIRA ROCHA, Carlos Artur Director, Laboratorio de Ciências do Mar Universidade Federal do Ceará Av. da Abolição 3207- Meireles Caixa Postal 52.756, CEP 60.165-081 Fortaleza ,Ceará, Brazil Tel.: (55-85) 242 6422 Fax: (55-85) 242 8355 e-mail: [email protected] COLOMBIA 1 The lists of participants have been updated as far as possible, using the addresses given at the Workshop held at Merida, Mexico in September 2000
GALLO NIETO, Jorge Subdireccion de Ordenamiento y Desarrollo Pesquiero Instituto Nacional de Pesca y Aquicultura Diagonal 27, No. 15-09, Bogotá, Colombia Tel.: (57-1) 616-8147 Fax: (57-1) 621-5028 e-mail: [email protected] [email protected] CUBA LEÓN, María Estela de Centro de Investigaciones Pesqueras Ministerio de la Industria Pesqueras 5ta Ave. y Calle 248 Barlovento, Santa Fé Ciudad de la Habana, Cuba Fax: (53-7) 249827 e-mail: [email protected] [email protected] PUGA, Rafael Centro de Investigaciones Pesqueras 5ta Ave. y Calle 248 Barlovento, Santa Fé Ciudad de la Habana, Cuba Fax: (53-7) 249827 e-mail: [email protected] [email protected] DOMINICAN REPUBLIC INFANTE, José Técnico Secretaría deRecursos Naturales y Medio Ambiente Santo Domingo, Dominican Republic Tel/Fax: 001 (809) 532-4876 e-mail: [email protected] HONDURAS IRIAS, Alexis Dirección General de Pesca y Acuicultura Dirección General de la Pesca y Acuicultura Colonia Lomalinda Norte Blvd. Miraflores Avenida FAO Apartado Postal 359, Tegucigalpa, Honduras Tel.: (504) 2311921/2328394 Fax: (504) 2324054/2325375 e-mail: [email protected]

6
HONDURAS RODRIGUEZ, Javier Dirección General de la Pesca y Acuicultura Colonia Lomalinda Norte Blvd. Miraflores Avenida FAO Apartado Postal 359 Tegucigalpa, Honduras Tel.: (504) 2311921/2328394 Fax: (504) 2324054/2325375 e-mail: [email protected] JAMAICA GRANT, Sandra2
Ministry of Agriculture and Mining Fisheries Division P.O.Box 470 Marcus Garvey Dr. Kingston 13, Jamaica MEXICO RIOS LARA, Verónica CRIP- Yucalpetén Apartado Postal 73, 97320 Yucalpetén, Yucatán México Fax: (52-993) 54028 e-mail: [email protected] [email protected] SOSA CORDERO, Eloy Scientifico ECOSUR-Chetumal Zona Industrial No. 2; Carretera Bacalar-Chetumal A.P. 424, Chetumal, Quintana Roo México CP 77000 Tel.: (52-983) 21666 or 20115 Fax: (52-983) 20447 e-mail: [email protected] NICARAGUA BARNUTTI, Renaldy Biólogo Centro de Investigación de Recursos Hidrobiológicos (CIRH) Apartado 200 Managua, Nicaragua Tel.: (505-2) 2700956 Fax: (505-2) 2700977 e-mail: [email protected]) NICARAGUA
2 Sandra Grant is now based at CFRAMP in Belize City [email protected]
GUTIERREZ, Ronaldo Biólogo Centro de Investigación de Recursos Hidrobiológicos (CIRH) Apartado 2020 Managua, Nicaragua Tel.: (505-2) 2700956 Fax: (505-2) 2700977 e-mail: [email protected]) MARTÍNEZ CASCO, Sergio Director Centro de Investigación de Recursos Hidrobiológicos (CIRH) Apartado 2020 Managua, Nicaragua Tel.: (505-2) 2700956 Fax: (505-2) 2700977 e-mail: [email protected] SAINT LUCIA JOSEPH, Williana Fisheries Biologist Fisheries Department Ministry of Agriculture, Lands, Fisheries and Co-operative New Government Building Waterfront, Castries, Saint Lucia Tel.: 001 (758) 452-6172 Fax: 001 (758) 452-3853 UNITED STATES OF AMERICA HARPER, Doug Fisheries Biologist National Marine Fisheries Service 75 Virginia Beach Drive Miami, Florida 33149, USA Tel.: (305) 361-4257 Fax: (305) 361-4499 e-mail: [email protected] MULLER, Robert Senior Research Scientist Fish and Wildlife Conservation Commission Florida Marine Research institure 100 Eighth Ave., Southeast St Petersburg, Florida 33701-5095, USA Tel.: (727) 896-8626 Ext 4118 Fax: (813) 823- e -mail: [email protected] VENEZUELA FERNANDEZ, Juan Carlos Biologo - Director General Fundacion Científica Los Roques (ONG)

7
Apartado Postal 1139 Caracas 1010-A, Venezuela Tel.: 0058-2 263-9729 Fax: 0058-2 261-3461 e-mail: [email protected] CFRAMP STAFF MARSHALLECK, Stephanie RAU Leader CARICOM-CFRAMP P.O. Box 642 Belize City, Belize Tel.: (501-2) 34443 Fax: (501-2) 34446 e-mail: [email protected] REED, Shawna Technical Advisor CFRAMP P.O.Box 642 Belize City, Belize Fax: (501-2) 34446 Tel.: (501-2) 34443 e-mail: [email protected] HAUGHTON, Milton Scientific Director P.O.Box 642 Belize City, Belize Tel.: (501-2) 34443 Fax: (501-2) 34446 email: [email protected] FAO CONSULTANTS CRUZ IZQUIERDO, Raul3 Jefe Grupo Langosta Centro de Investigaciones Marinas Universidad de Habana Calle 16, 114 entra 1era y3era, Miramar Playa, Ciudad de la Habana, Cuba Tel: (537) 23-0617 Fax : (537) 24-2087 e-mail: [email protected] FAO CONSULTANTS EHRHARDT, Nelson Professor, Rosenstiel School of Marine and Atmospheric Science (RSMAS) 4600 Rickenbacker Causeway Miami, Florida 33149-1098, USA
3 Then at CIP, Havana
Tel.: (001-305) 361-4741 Fax.: (001-305) 361-4902 e-mail: [email protected] GONZALEZ CANO, Jaime Investigador CRIP - Puerto Morelos Apartado Postal 580 77500, Cancún, Quintana Roo. México Tel. (0052-98) 878859/10457 Fax. (0052-987) 10456 e-mail: [email protected] MEDLEY, Paul A.4 Consultant Sunny View, Main Street Alne Y061 1RT, York, UK Tel./Fax: (0044-1347) 838236 e-mail: [email protected] RESTREPO, Victor R.5 Senior Scientist ICCAT C. Corazon de Maria 8, 6th floor 28002 Madrid, Spain Tel.: (0034-1) 4165600 Fax: (0034-1) 4152612 e-mail: [email protected] FAO STAFF CHAKALALL, Bisessar Regional Fisheries Officer Secretary of WECAFC FAO Sub-regional Office for the Caribbean (SLAC) P.O Box 631-C Central Bank Building Bridgetown, Barbados Tel.: 001 (246) 4267110 Fax: 001 (246) 4276075 e-mail: [email protected] COCHRANE, Kevern (see next list) VENEMA, Siebren C. (see next list)
4 Then at the Department of the Environment & Coastal Resources, Turks and Caicos Islands 5 Then at the University of Miami

8
Second Regional Workshop on the Assessment of the Caribbean Spiny Lobster, Panulirus argus Fisheries in the WECAFC area, Mérida, Yucatán,
Mexico 1-12 June 1998 BAHAMAS BETHEL, Gregory Department of Fisheries Ministry of Agriculture and Fisheries P.O. Box N-3028 Nassau, The Bahamas Tel.: 001-242- 393-1014/5 Fax: 001-242- 393-0238 e-mail: [email protected] [email protected] DELEVEAUX, Vallierre Fisheries Officer Department of Fisheries Ministry of Agriculture and Fisheries P.O. Box N-3028 Nassau, The Bahamas Tel.: 001-242- 393-1014/5 Fax: 001-242- 393-0238 e-mail: [email protected] [email protected] BELIZE RICHARDS, Gilbert Fisheries Department Ministry of Agriculture and Fisheries P.O. Box 148, Belize City, Belize Tel.: 00501- 2- 44552 or 32623 Fax: 00501- 2- 32983 BERMUDA LUCKHURST, Brian Senior Fisheries Officer Division of Fisheries P.O Box CR 52 Crawl CR BX, Bermuda Tel. (001-441) 2931785 Fax 001-441-2932716 email: [email protected] BRAZIL ARAGÃO, José Agusto Negreiros. Departamento de Pesca e Aquicultura do Ministério de Agricultura DPA/MA Brasilia, Brazil e-mail: [email protected] e-mail: [email protected] BRAZIL
CARVALHO, Roberto Claudio de Almeida Laboratorio de Ciências do Mar Av. da Abolição 3207- Meireles Caixa Postal 52.756 CEP 60.165-081 Fortaleza ,Ceará, Brazil Tel.: (0055-85) 242 6422 Fax: (0055-85) 242 8355 CONCEIÇÃO, Raimundo Nonato de Lima Laboratório de Ciências do Mar. Av. Abolição 3207 - Meireles Caixa Postal 52.756, CEP 60.165-081 Fortaleza, Ceará, Brazil Tel: 0055-85- 242 6422 Fax: 0055-85- 242 83 55 e-mail: [email protected] COLOMBIA GALLO NIETO, Jorge Subdireccion de Ordenamiento y Desarrollo Pesquiero Instituto Nacional de Pesca y Aquicultura Diagonal 27, No. 15-09, Bogotá, Colombia Tel.: (57-1) 616-8147 Fax: (57-1) 621-5028 e-mail: [email protected] [email protected] CUBA BAISRE, Julio A. Ministerio de la Industria Pesquera 5ta Ave. y Calle 248 Barlovento, Santa Fé, Ciudad Habana, Cuba Fax: 0053-7-339168 e-mail: [email protected] LEÓN, María Estela de Centro de Investigaciones Pesqueras Ministerio de la Industria Pesqueras 5ta Ave. y Calle 248 Barlovento, Santa Fé Ciudad de la Habana, Cuba Fax: (53-7) 249827 e-mail: FAO-CUBcfield.fao.org [email protected] CUBA PUGA, Rafael Centro de Investigaciones Pesqueras

9
5ta Ave. y Calle 248 Barlovento, Santa Fé Ciudad de la Habana, Cuba Fax: (53-7) 249827 e-mail: [email protected] [email protected] DOMINICAN REPUBLIC INFANTE, José Técnico Secretaría deRecursos Naturales y Medio Ambiente Santo Domingo, Dominican Republic Tel/Fax: 001 (809) 532-4876 e-mail: [email protected] HONDURAS RODRIGUEZ, Javier Dirección General de la Pesca y Acuicultura Colonia Lomalinda Norte Blvd. Miraflores Avenida FAO Apartado Postal 359 Tegucigalpa, Honduras Tel.: (504) 2311921/2328394 Fax: (504) 2324054/2325375 e-mail: [email protected] SUAZO, Manuel Dirección General de la Pesca y Acuicultura Colonia Lomalinda Norte Blvd. Miraflores Avenida FAO Apartado Postal 359 Tegucigalpa, Honduras Tel.: (504) 2311921/2328394 Fax: (504) 2324054/2325375 e-mail: [email protected] JAMAICA GRANT, Sandra6 Development and Conservation of Fisheries P.O.Box 470 Marcus Garvey Drive Kingston 13, Jamaica Tel.: (001-876) 9238811 to 3 Fax: (001-876) 9237572 e-mail: [email protected] MEXICO ARCE, Ana Minerva ECOSUR-Chetumal Zona Industrial No. 2 Carretera Bacalar-Chetumal A.P. 424. Chetumal, Quintana Roo 6 Sandra Grant is now based at CFRAMP in Belize City [email protected]
México CP 77000 Tel.: (0052-983) 21666 or 20115 Fax: (0052-983) 20447 e-mail: [email protected] CABRERA, Miguel Angel CINVESTAV-Unidad Mérida Carretera Antigua a Progresso Km 6 Apartado Postal 73, Mérida 97110 Yucatán, México e-mail: [email protected] RIOS LARA, Verónica CRIP- Yucalpetén Apartado Postal 73, 97320 Yucalpetén, Yucatán México Fax: (52-993) 54028 e-mail: [email protected] [email protected] SALAS, Silvia Fisheries Centre 2204 Main Mall Vancouver B.C., V6T 1Z4, Canada Tel :001-604-8222731 (Office) Tel. Domicilio 001-604-2221181 (Home) e-mail: [email protected] SOSA CORDERO, Eloy Scientifico ECOSUR-Chetumal Zona Industrial No. 2; Carretera Bacalar-Chetumal A.P. 424, Chetumal, Quintana Roo México CP 77000 Tel.: (52-983) 21666 or 20115 Fax: (52-983) 20447 e-mail: [email protected] ZETINA MOGUEL, Carlos E. CRIP- Yucalpeten Apartado Postal 73, 97320 Yucalpetén, Yucatán, México Fax: 0052-993-54028 email: [email protected] NICARAGUA BARNUTTI, Renaldy Biólogo Centro de Investigación de Recursos Hidrobiológicos (CIRH) Apartado 200 Managua, Nicaragua Tel.: (505-2) 2700956

10
Fax: (505-2) 2700977 e-mail: [email protected]) PÉREZ MORENO, Manuel Centro de Investigación de Recursos Hidrobiológicos (CIRH) Apartado 200 Managua, Nicaragua Tel.: (505-2) 2700956 Fax: (505-2) 2700977 e-mail: [email protected]) \ UNITED STATES OF AMERICA MULLER, Robert Senior Research Scientist Fish and Wildlife Conservation Commission Florida Marine Research institure 100 Eighth Ave., Southeast St Petersburg, Florida 33701-5095, USA Tel.: (727) 896-8626 Ext 4118 Fax: (813) 823- e -mail: [email protected] VENEZUELA ANDRADE, Glenys Fondo Nacional de Investigaciones Agropecuarias Maracay, Venezuela Tel.: 0058-43-834308 Fax: 0058-43-831423 e-mail: [email protected] CFRAMP STAFF CLEMETSON, Antoinette RAU Leader P.O.Box 642 Belize City, Belize Tel.: (00501-2)-34443 Fax: (00501-2)-34446 email: [email protected] CFRAMP STAFF HAUGHTON, Milton Scientific Director CARICOM Fisheries Unit P.O. Box 642 Princess Margaret Drive Belize City, Belize Tel.: (00501-2) 34443-5 Fax: (00501-2) 34446 email: [email protected]
FAO CONSULTANTS CRUZ IZQUIERDO, Raul Jefe Grupo Langosta Centro de Investigaciones Marinas Universidad de Habana Calle 16, 114 entra 1era y3era, Miramar Playa, Ciudad de la Habana, Cuba Tel: (537) 23-0617 Fax : (537) 24-2087 e-mail: [email protected] EHRHARDT, Nelson Professor Rosenstiel School of Marine and Atmospheric Science (RSMAS) 4600 Rickenbacker Causeway Miami, Florida 33149-1098, USA Tel.: (001-305) 361-4741 Fax.: (001-305) 361-4902 e-mail: [email protected] GONZALEZ CANO, Jaime Investigador CRIP - Puerto Morelos Apartado Postal 580 77500, Cancún, Quintana Roo. México Tel. (0052-98) 878859/10457 Fax. (0052-987) 10456 e-mail: [email protected] MEDLEY, Paul A. Consultant Sunny View, Main Street Alne Y061 1RT, York, UK Tel./Fax: (0044-1347) 838236 e-mail: [email protected] PÉREZ, Eduardo Centro Universitario Marista A.C. Km 7 Carretera Antigua Mérida-Progreso X Av. Marcelino Champagnat, Mérida C.P. 97110, Yucatán, México Tel.: 0052-99-815225 Fax: 0052-99-815243 e-mail: [email protected] FAO CONSULTANTS RESTREPO, Victor R.7 Senior Scientist ICCAT C. Corazon de Maria 8, 6th floor 28002 Madrid, Spain Tel.: (0034-1) 4165600 Fax: (0034-1) 4152612 e-mail: [email protected]
7 Then at the University of Miami

11
SEIJO, Juan Carlos Rector Centro Marista de Estudios Superiores, A.C. Periferico Norte Tablaje 13941 Carretera Merida-Progreso C.P. 97300, Yucatán, México Tel.: (0052-99) 410302 Fax: (0052-99) 410307 e-mail: [email protected] FAO STAFF CHAKALALL, Bisessar Regional Fisheries Officer Secretary of WECAFC FAO Sub-regional Office for the Caribbean (SLAC) P.O Box 631-C Central Bank Building Bridgetown, Barbados Tel.: 001 (246) 4267110 Fax: 001 (246) 4276075 e-mail: [email protected] COCHRANE, Kevern Fishery Resources Officer Fishery Resources Division Fisheries Department FAO 00100 Rome, Italy Tel.: (0039-6) 52256109 Fax: (0039-6) 52253020 e-mail: [email protected] TANDSTAD, Merete APO Fisheries Management Fishery Resources Division Fisheries Department FAO 00100 Rome, Italy Tel: (0039-06)-57052019 Fax: (0039-06).57053020 e-mail: [email protected] FAO STAFF VENEMA, Siebren C. Project Manager, GCP/INT/575/DEN Case sparse 92 Terontola (Ar) 52040, Italy Tel/ Fax: (0039-0575) 678037 e-mail: [email protected]

12
2 REGIONAL REVIEW N. M. Ehrhardt
The spiny lobster, Panulirus argus, is widely distributed in the Central Western Atlantic Ocean from Brazil to Bermuda. The species sustains fisheries which are second only to penaeid shrimps as the economically most important fisheries in the region with a total ex-vessel value of about US$350 million in 1995 (Fig. 2.1). Historic overall landings (Fig. 2.2) show that the fisheries started in the early 1960s, as demand for spiny lobsters increased in the markets of more developed countries. This fishery expansion as depicted by trends in landings appeared to have reached a stable level in 1984 since during the period 1984-1997, landings have oscillated between 35000 and 42000 tonnes whole weight with only a slight increasing trend (Fig. 2.2). An asymptotic historic landing growth model fitted to the data in Figure 2.2 indicates that long-term average landings may be constrained about an asymptotic maximum landing level of 43500 metric tons whole weight. The indication is, therefore, that at present spiny lobster resources in the region may be generating landings that are close to their maximum.
Figure 2.1 Annual value of reported landings of P. argus Spiny lobster fisheries are mostly artisanal or semi-industrial. This is the consequence of spiny lobsters being highly accessible and cacheable with simple gear types such as spears, aggregating devices (casitas or condominium), traps and gillnets. On the other hand, the high ex-vessel prices paid for the product (US$4 to US$25 kg-1 depending on the fishery/country) attracts many small-scale fishers. In this regard, spiny lobsters are a unique resource when compared with other fishery resources in the region, in that it generates a relatively high return on the low capital investment in boats and gear. These conditions result in a generally low opportunity cost for other fishery resources in tropical fisheries, thus increasing the fishing pressure over spiny lobsters. The main spiny lobster resources in the Central Western Atlantic Ocean are principally located on the larger continental shelf - reef areas of the region. Thus, the shelves of Brazil (what is believed to be the most up-stream stock), Honduras-Nicaragua, Belize-Mexico, Florida, the Bahamas, and south of Cuba are conspicuous areas where main fisheries are located. A review of landings by countries indicates that 6 countries associated with those areas are producing between 70 and 80% of the overall regional landings (Fig. 2.3). Cuba historically produced the largest landings in the region followed by Brazil, the Bahamas, the
050
100150200250300350400
84 86 88 90 92 94 96
Year
Valu
e of
Cat
ch (M
illio
ns U
S$)

13
United States, Honduras and Nicaragua. Generally, landing trends by these countries show rather large inter-annual variability.
Figure 2.2 Total landings of spiny lobster. The expected landings are generated from a simple asymptotic model, and can be used to extrapolate to the maximum landings, in
this case of about 43500 tonnes
Figure 2.3 Landings broken down by shelf area Some of these main fisheries were still developing in the 1970s, while in the mid-1980s declining landing trends were followed by increasing trends in the 1990s. The exception to these patterns is the fishery in Cuba where after many years of stable landings, a significant steady decrease in landings is observed starting in 1989. Landings of the most important spiny lobster producing countries have converged toward landing levels which are in the range 6000 to 8000 tonnes whole weight per year during the 1991-1997 period (Fig. 2.3). Figure 2.4 shows the landing trends historically observed in Mexico and Belize. A similar general trend is observed during the later half of the time series (1986-1997). Less conspicuous trends are observed between historic landings in Florida and the South of Cuba (Batabanó Bay area; Fig. 2.5), but strikingly, landing trends observed in Brazil and Florida are very well correlated (Fig. 2.6). Similarities in spiny lobster production trends may be indicative of similar biological processes that may be present in the sub-regional stocks
05000
1000015000200002500030000350004000045000
50 55 60 65 70 75 80 85 90 95
Year
Land
ings
(who
le w
eigh
t mt)
TotalExpected
0
2000
4000
6000
8000
10000
12000
14000
16000
60 64 68 72 76 80 84 88 92 96Year
Land
ings
(who
le w
eigh
t mt)
CubaBahamasFloridaBrazilNic+Hond+Col

14
sustaining these fisheries or that pueruli may be transported for long periods of time in the ocean currents thus potentially recruiting in other regions. These linkages, however, need to be established because of the obvious regional versus country implications of fishery management strategies that could be implemented to optimise use of these resources.
Figure 2.4 Landings from Belize and Mexico
Figure 2.5 Landings from SW Cuba and Florida
0200400600800
10001200140016001800
78 80 82 84 86 88 90 92 94 96 98
Year
Land
ings
(who
le w
eigh
t mt)
BelizeMexico
0100020003000400050006000700080009000
60 64 68 72 76 80 84 88 92 96
Year
Land
ings
(who
le w
eigh
t mt)
Cuba (Batabano)Florida

15
Figure 2.6 Landings from Florida and Brazil
Figure 2.7 Catch and effort for Brazil and Florida fisheries
0100020003000400050006000700080009000
60 64 68 72 76 80 84 88 92 96
Year
Land
ings
(who
le w
eigh
t mt)
Florida
Brazil
Brazil
0
2000
4000
6000
8000
10000
0 50000 100000 150000
Fishing Effort (1000 trap-days)
Land
ings
(who
le w
eigh
t mt)
Florida
0
2000
4000
6000
8000
10000
0 200 400 600 800 1000
Fishing Effort (1000 traps)
Land
ings
(who
le w
eigh
t mt)

16
In most countries in the region spiny lobster fisheries are of open access. However, due to an excess of fishing effort, some countries, such as the United States and Bermuda, have recently adopted measures to limit access. In the case of Cuba, access to spiny lobster fishing is already strictly controlled, therefore production planning allows optimisation of lobster production in that country. In general, limitation of fishing effort in these three countries appears to have facilitated implementation of management strategies to optimise use of this resource. This is in clear contrast to open access fisheries where over-capitalisation seems to be a common feature. In an analysis performed at the second workshop, it is pointed out that significant increases in fishing effort have been reported in the Honduras-Nicaragua fisheries and that artisanal fleets are conspicuously replacing industrial fleets in Brazil in spite of the very high levels of fishing effort already deployed in this fishery. Figure 2.7 shows trends of landings and fishing effort levels in the Brazil and in the Florida fisheries including the era of open access. From the figure it is evident that effort levels have far exceeded the levels required to obtain similar landing levels in these two countries. For this reason a trap reduction programme was established in 1992 in the Florida fishery with the aim of reducing fishing effort from about 1 million traps to less than 300 thousand. It is believed that the later amount of effort should generate similar landings as with 1 million traps, but with a considerably higher average catch per trap. Because of the artisanal nature of these fisheries, catch and effort statistics are difficult to collect or to document properly in meaningful time and space scales. This difficulty prevents more accurate analysis of the regional characteristics of the fisheries, the evolution of fishing effort and fishing tactics, as well as the effectiveness of fishery management. Given the extraordinary value of these fisheries, long range stock assessment work should be implemented under the sponsorship of the countries and industries involved, so as to secure the future sustainability of spiny lobster production through wise management.

17
3 BIOLOGY A.M. Arce and M. E. de León
3.1 INTRODUCTION The following review of the biology of spiny lobster was used as a source of information for the stock assessments carried out during the workshop. This section is not exhaustive, but does provide an overview of the current perceptions on life history, growth and mortality for this species. In using all the information of this section, careful consideration should be given to the uncertainty surrounding many of the results. In most cases no standard errors or other measures of accuracy are given for parameter estimates. Those interested in using estimates are urged to seek out original papers to verify the accuracy of reported results.
3.2 LIFE HISTORY The spiny lobster Panulirus argus is able to utilise a variety of environments and it changes habitats several times during its ontogenetic development. The species ranges from Bermuda and North Carolina (USA) to Rìo de Janeiro in Brazil. After mating, females may move several kilometres to the edges of the reefs or coastal shelves to incubate and release larvae (Buesa, 1965). The larvae are planktonic in oceanic waters where they are thought to spend 6-10 months, including 11 pelagic larval stages (Lewis et al., 1952; Baisre, 1964; Sims and Ingle, 1967). During their long period in the plankton, the larvae become widely distributed throughout the Caribbean ocean (Alfonso et al. 1991; Baisre et al., 1978). The phyllosoma larvae metamorphose into pueruli, which swim across the continental or insular shelf to arrive at the coast every month of the year, but with a main settlement peak in September-December (Cruz et al., 1995; Briones, 1994; Young, 1991; Peacock, 1974 and Bannerot et al., 1992). The pueruli settle in clumps of Laurencia (Marx and Herrnkind, 1985; Herrnkind and Butler, 1986; Lalana et al. 1989) associated with 29 species of algae (Brito and Seers, 1994) and occasionally in the algal web on submerged mangrove roots (Witham et al., 1964). After settlement pueruli moult and become post-puerulus, known as the algae phase (Butler et al., 1997) with a size range of 6 - 15mm CL. Post-pueruli become juveniles between 10-15 months after settlement (Cruz et al., 1995; Davis, 1978). Post-algal sizes 26-35mm CL still occupy vegetated habitats, but late juveniles (>35mm CL) and sub-adults (70-76mm CL) tend to occupy patches of reef habitats without vegetation (Arce et al., 1997). Juveniles leave the settlement (post-algae juveniles) and seek refuge in caves, coral reefs, sponges and soft corals (Herrnkind et al., 1994). Older juveniles migrate offshore and recruit to the fishery at 76mm CL (Cruz et al., 1986a; Davis, 1978). In Florida males attain the size of 76mm CL in an average of 23 months, whereas females require an average of 30 months (Muller et al., 1997). Figure 3.1 illustrates the average times required to pass from one stage to the next, based on data from Cuba.

18
Figure 3.1 Life history periods as suggested by seasonal peaks in indices
3.3 REPRODUCTION
3.3.1 Seasonality Panulirus argus reproduction appears to be consistently higher in the spring and summer months (March-July) although this activity is observed all year round (Table 3.1). In Cuba, reproduction occurs throughout the year with greatest numbers of berried females occurring between March to May and a subsidiary peak in September. On the Nicaraguan shelf the greatest reproductive activity has been observed during March and September-November (Castaño and Cadima 1993). In Colombia, main peaks of reproduction were reported for May and from September to October, although reproductive activity was also observed all year round (Gallo et al., 1998). However, as these last results
J A S O N D J F M A M J J A S O N D
J F M A M J J A S O N D
J F M A M J J A S O N D
J F M A M J J A S O N D
7 Months
9 Months
primary spawning
secondaryspawning
secondaryspawning
larvalsettlement
17 Months
25 Months
recruitment tothe fishery
area
recruitment tothe nursery
area

19
are not consistent with other reports in the region (Table 3.1), they should be verified through further studies. Table 3.1 Mean monthly relative frequencies of females in the process of reproduction
Brazil Belize
(South) Belize
(Central) Cuba Mexico,
Quintana Roo
Turks & Caicos Islands
USA, Florida
Nicaragua
Ivo (1996) FAO
(1968b) FAO
(1968b) Cruz & León
(1991)1
Ramirez (1996)
Medley & Ninnes (1997)2
Lyons et al, (1981)
Castaño & Cadima
(1993) %Mature %Berried %Berried % B&S3 % B&S3 %Tar spot % B&S3 % Berried J 6.4 8 15 19.5 0.4 2.5 F 12.5 17 22 20.0 0.3 6 M 16.3 27 32 51.6 6.2 15.5 A 12.9 26 40 61.1 19.3 2.5 M 12.5 20 32 54.8 22.7 5 J 11.7 10 25 71.4 32.4 12.5 J 7.8 8 25 21.3 2.5 A 4.5 11.8 0.6 7 19 50.2 16.4 2.5 S 3.3 35.5 1.3 9.5 14 33.2 15.8 17.5 O 4.5 52.3 10.5 11 9 33.2 5.8 10 N 5.8 41.7 4.8 2 6 19.2 3.4 11 D 1.6 33.6 2 8 28.3 1.6 2.5 1Data are used from the years 1982 to 1989 2Estimates use a logit model to correct for size bias in the sample. 3% B&S- Berried and spermatophored females
3.3.2 Size Size at first maturity was found to be in the range 78-83mm CL for all countries. In Brazil, the size at first maturity was estimated at 201mm total length by Soares and Cavalcante (1985). For Cuba, the smallest size that a berried lobster was captured was 67mm CL (Cruz and León, 1991) and the estimated sizes at 50% and 100% maturity were 81mm and 97mm CL, respectively. In the Turks and Caicos Islands, tar spot (spermatophore) data were recorded from sampled landings. A logit model was used to separate season and size (Medley and Ninnes, 1997). The results largely agree with other assessments, size at first maturity was 83mm, 50% fecundity occurred at 93mm and full fecundity at approximately 108mm CL (Fig. 3.1). For the Nicaraguan shelf, the most frequent reproductive sizes were 85-89 mm CL; however, berried females of 70-74mm CL have also been reported (Castaño and Cadima, 1993). For Colombia, the estimated size at 50% maturity was 92mm CL, however, the smallest female carrying eggs was only 72mm CL (Gallo et al. 1998). In 1996, the Florida Department of Environmental Protection collected data to develop a lobster fecundity model (Cox et al. 1997). Female lobsters with eggs were observed from April through to October. In the first season of sampling, the number of eggs (E) from 129 females ranged from 147 000 (72mm CL) to 1 952 000 (141mm CL) and the following fecundity-length relationship was obtained:
E = 98.34 2TL - 1 261 651 (r2 = 0.91, n = 129, for the size range 72-141 mm)
A relationship between fecundity and carapace length estimated for SW Cuba was:

20
E=0. 5911 9866.2CL
Ivo and Gesteira (1986) estimated the following functional relationship between total length and fecundity: E = - 801536 + 4610.5 LT This equation was transformed (approximately) into one based on carapace length using a morphometric transformation (Rios, 1991): E = -1031600 + 17474.2 LC
Figure 3.1 Tar spot probabilities for female lobsters estimated from a logit model,
Turks and Caicos Islands (Medley and Ninnes, 1997)
3.4 MORPHOMETRIC CONVERSIONS Available morphometric conversions are presented in Table 3.2. No standard errors are available for parameter estimates, and models should therefore be treated with caution. Cuba’s morphometric conversion estimates were derived from the largest sample, and also featured the widest size range (including fishery independent samples) over the longest period (1960-1990). In the absence of local data, it was recommended that Cuba's morphometric models be used for practical reasons. Cuba reported puerulus (at settlement) mean carapace length equal to 5.8mm, post-puerulus (after one moult) mean carapace length equal to 7.0mm.
0
0.10.20.3
0.4
0.5
0.60.70.8
0.9
73 83 93 103 113 123 133CL (mm)
Tar s
pot p
roba
bilit
y

21
Table 3.2 Morphometric conversion equations by country Location
Sex
Relationship
Reference
Belize Γ+Ε LC = 2.6142 S2L + 8.5148
Fisheries Dept. /
Γ+Ε LC = 0.5441 Lt + 3.1627 CFRAMP Γ+Ε LC = 1.392 S2w + 6.6738 (unpublished data) Brazil Γ
LC = 0.6071 Lt - 5.2631
Ivo (1996)
Ε LC = 0.5432 Lt + 0.3442 Rios (1991) Γ+Ε LC = 0.379 LT - 4.99 Γ+Ε Lt = 0.612 LT + 5.62 Γ+Ε WT = 6.6 10-05 LT
2.90 Cuba Γ
LT = 2.519 LC + 32.8431
40 ≤ LC ≤ 160
Ε LT = 2.9290 LC + 9.8740 30 ≤ LC ≤ 130 Γ+Ε LT = 2.5402 LC + 36.3535 30 ≤ LC ≤ 160 Γ LC = 0.3925 LT - 11.7974 120 ≤ LT ≤ 430 Ε LC = 0.3374 LT - 2.3439 110 ≤ LT ≤ 400 Γ+Ε LC = 0.3838 LT - 11.6569 110 ≤ LT ≤ 430 Γ+Ε LC = 0.29 LT + 0.29 15 ≤ LT ≤ 60 Γ WT = 0.00207 LC
2.792 Cruz et al. (1981) Ε WT = 0.00279 LC
2.736 Γ+Ε WT = 0.00460 LC
2.630 Florida, USA
Γ
WT = 0.00287 LC
2.71 Estimates
Ε WT = 0.00195 LC2.81 determined during
Γ WT = 3.38 Wt - 23.8 1997 working Ε WT = 2.97 Wt - 0.327 group session Mexico,Yucatan Γ
LT= 1.47 +1.39 Lt
Zetina et al. (1996)
Ε LT= 2.42 +1.34 Lt Γ LC= 0.81+ 0.59 Lt Ε LC= -0.06+ 0.45 Lt Γ WT= 0.05 LT
2.93 Ε WT= 0.62 LT
2.72 Mexico, Bahía de la
Γ
LC = 0.65 Lt - 9.11
Coba-Cetina
Ascensión Ε LC = 0.56 Lt - 1.23 (1990) Γ+Ε LC = 0.611 Lt - 5.44 Γ LC = 3.064 S2L - 0.016 Ε LC = 2.749 S2L + 5.57 Γ Lt = 4.38 S2L + 22.83 Ε Lt = 4.69 S2L + 16.63 México ,Quintana Roo
Γ
LC = 0.672 Lt - 0.98985
Gonzalez-Cano
Ε LC = 0.5687Lt + 0.01377 (1991) Γ Lt = 1.3568 Lc + 2.7894 Ε Lt = 1.5542 Lc + 1.98659 Γ LT = 1.6430 Lt - 0.87812 Ε LT = 1.5476 Lt + 0.02239 Γ Lt = 0.5876 LT + 1.08196 Ε Lt = 0.61937 LT + 0.70223 Γ Lc = 0.4122 LT - 0.71368 Ε Lc = 0.3722 LT - 0.12092 Γ LT = 2.32684 Lc + 2.72253 Ε LT = 2.54141 Lc + 1.75760 Γ Wt=0.031236 * Lt
3.18764 Ε Wt=0.044841 * Lt
3.02943 S2L = 2nd segment length (mm), S2w = 2nd segment width (mm), LC = Carapace length (mm), Lt = Tail length (mm), LT = Total length (mm), Total weight = WT (g), Tail weight = Wt (g)
3.5 GROWTH Numerous factors (notably temperature, maturation and season) affect the growth of spiny lobster Panulirus argus. Several studies reported sex-specific growth rates, with a higher rate

22
for males than for females. For example, Hunt and Lyons (1986) reported that the growth rate for females was 33.3% lower than the estimate for males. However, such sex-specific growth differences have not been found in juveniles (<76mm CL).
3.5.1 von Bertalanffy Growth Model Many estimates of spiny lobster growth have been obtained in the region since the 1960s using a variety of methods, primarily length-frequency based analyses (Table 3.3) Obtaining reliable estimates of von Bertalanffy growth parameters from length-frequency analyses depends on many factors, particularly on the range of sizes represented in the samples. The León et al. (1995) estimates for spiny lobsters in Cuba were considered to be the most reliable during the 1998 working group session. These estimates were derived using the SLCA method and were based on a large sample size collected during the 1990s covering the widest range of size classes.
Table 3.3 Von Bertalanffy growth parameter estimates
Zone Sex Method K L∞ φ´ To References
Bahamas Γ
Ε
Unknown 0.26
0.23
190
190
3.931 Waugh (1980)
Bermuda Γ
Ε
Unknown 0.18
0.15
204
192
3.831 0.82
1.0
Evans (1988)
Brazil Γ
Ε
Modal Progression
Analysis
0.34
0.38
141
148
4.111 Santos et al. (1964)
Brazil Γ
Ε
ELEFAN 0.229
0.236
257
233
4,19 Ivo (1996)
Brazil Γ
Ε
SLCA 0.26
0.18
207
162
3.97 González Cano and Rocha (1995)
Cuba, SW Γ
Ε
Bhattacharya 0.22
0.31
169
139
3.79 -0.70
0.08
Cruz, et al. (1981)
Cuba, SW Γ+Ε Bhattacharya 0.16 174 3.68 0.32 Buesa (1972)
Cuba, SW Γ
Ε
ELEFAN 0.29
0.31
250
209
4.19 Báez, et al. (1991)
Cuba, SW Γ
Ε
Tagging 0.27
0.39
250
171
4.151
Phillips, et al. (1992)
Cuba, SW Γ
Ε
ELEFAN 0.31
0.24
190
174
3.951 León, et al. (1994)
Cuba, SW Γ
Ε
Fournier 0.21
0.21
178
171
3.811
Báez, et al. (1994)
Cuba, SW
Cuba, SE
Γ
Ε
Γ
SLCA 0.24
0.18
0.22
184
155
186
3.851
3.881
0.45
0.37
0.44
León, et al. (1995)

23
Zone Sex Method K L∞ φ´ To References
Cuba, NE
Cuba, NW
Cuba, all areas
Ε
Γ
Ε
Γ
Ε
Γ
Ε
0.22
0.23
0.19
0.22
0.22
0.23
0.19
156
185
153
175
166
185
155
3.831
3.851
3.861
0.41
0.44
0.38
0.43
0.42
0.44
0.37
Florida, USA Γ+Ε Tagging 0.34 190 4.091 Davis (1977)
Florida, USA Γ+Ε Tagging 0.25 190 3.951 Warner et al. (1977)
Jamaica Γ+Ε MPA 0.22 192 3.891 Munro (1974)
Martinique Γ
Ε
Unknown 0.25
0.23
190
188
3.931 Clairovin (1980)
Mexico, Isla Mujeres
Γ
Ε
SLCA 0.24
0.22
198
165
3.951 0.41
0.86
Gonzalez-Cano (1991)
Mexico, Isla Mujeres
Γ
Ε
SLCA 0.25
0.22
217
146
4.04 González Cano and Rocha (1995)
Mexico, Isla
Mujeres
Γ
Ε
SLCA 0.30
0.30
142
122
3.721 Arce (1990)
Mexico, Bahía de la Ascención
Γ
Ε
Fabens 0.20
0.25
257
215
4.091 Lozano-Alvarez et al. (1991a)
Nicaragua Γ
Ε
Γ+Ε
ELEFAN 0.23
0.40
0.3
169
160
161
3.89 Castaño and Cadima (1993)
Virgin Islands, USA
Γ
Ε
Tagging 0.44
0.32
153
133
3.881 Olsen and Koblic (1975)
Sub-regional
Nicaragua, Jamaica, Colombia
Γ
Ε
Γ+Ε
ELEFAN 0.23
0.21
0.26
180
163
190
3.971 -0.84
-0.95
-0.68
Estimates made during the 1997 working group session.

24
3.5.2 Discrete Moult Models Several studies in the region have presented growth models that include the two distinct components of lobster growth: moult increment and inter-moult period (or moult interval). Arce et al. (1991) used the unit step function to model discrete growth increments. The model requires an age at initial size, which was defined as time of settlement (in this case), and values of moult increments (mm) and inter-moult periods (weeks) to describe the lobster cohort growth, in a single equation. Muller et al. (1997) modelled moult interval using generalised linear models to estimate the probability of an individual moulting and the moult increment as a function of carapace length, time, sex, season and location. Similarly, Zetina and Ríos (in press) developed two step-shape models for spiny lobster growth. Parameters were estimated using the likelihood equations and Bayesian methods. Although the moult-based model is apparently a more realistic fit to model the growth in spiny lobsters (Caddy, 1977), the simple von Bertalanffy function is still widely applied. This primarily results from the fact that the former type of model tends to have more rigorous data requirements (such as from tagging or other experimental studies) and it is not easily incorporated into many standard stock assessment techniques.
3.6 NATURAL MORTALITY It was found that most reliable estimates for M ranged between 0.3-0.4 year-1. As for other marine species, obtaining good natural mortality estimates is a difficult task. However, the consistent pattern emerging from a variety of methods (Table 3.4) suggests an average natural mortality is likely to lie in this range.
3.7 SUMMARY AND RECOMMENDATIONS It is apparent from the review of biological information that several aspects of the biology of spiny lobster remain uncertain. Interpretation of models and parameters vary across the range for this species. This may be partly due to statistical observation errors, but could also reflect genuine changes in this species' biology between areas and over time. Unfortunately it is not possible to make the distinction between observation errors and systematic changes as much of the necessary information is missing from the published reports. Uncertainty is particularly important in growth models as they form an integral part of many stock assessment methods, particularly where the species cannot be aged directly, as is the case of the spiny lobster. Errors in growth estimates can lead to incorrect assessments and poor management decisions. It is necessary to address the problem in two ways. Firstly, the degree of uncertainty should be assessed with respect to the models and the parameters. This can be useful in stochastic simulations and incorporated in local studies using Bayesian methods. Secondly, uncertainty could be reduced by combining data sets for analyses and to produce more reliable parameter estimates. This may be of particular value in morphometric studies, where a significant difference between measurements can be used to test for stock differences. Analysis of growth may require special consideration. Current models tend to agree on growth rates between 75 and 100mm CL, but differ wildly outside these sizes. It should be possible to develop a model based on the wide variety of available data, particularly tagging data, that will provide a state-of-the-art growth model, which may be adapted to each region.

25
Table 3.4 Estimates of natural mortality (year-1)
Country Sex Method M Author
Bahamas Γ+Ε ? 0.36 Ehrhardt
Brazil Γ+Ε Pauly (1980)3 0.30 Ivo (1996)
Colombia Γ Empirical formula2 0.54 Gallo et al. (1998)
Ε 0.51
Γ+Ε 0.62
Cuba Γ+Ε Tagging 0.26 Buesa (1972)
Γ+Ε Tagging 0.44 Cruz et al., (1986a)
Γ+Ε Empirical formula2 0.34 Cruz et al. (1981)
Florida, USA Γ+Ε Pauly (1980)3 0.42 Powers and Sutherland (1989)
Florida, USA Γ+Ε Longevity 0.30 Muller et al. (1997)
Jamaica Γ Pauly (1980)3 0.59 Haughton (1988)
Ε
0.67
Γ+Ε
0.62
Nicaragua Γ Empirical formula2 0.41 Estimated during the 1998 working group session
Ε 0.50
Γ+Ε 0.45
Virgin Is. Γ Tagging 0.46 Olsen and Koblic (1975)
Γ 0.43
Ε 0.52
Turks & Caicos
Γ+Ε Depletion model4 0.36 Medley and Ninnes (1997)
1The working group used as an average value for longevity of 13.9 years from Ivo (1996), in conjunction with the model for natural mortality of Hoenig (1983) where the relation between Z and longevity (Tm) is: Z = 1.46 - 1.01 Tm
1.01. 2Cruz et al (1981) developed an empirical equation to estimate crustacean natural mortality based on mortality and growth parameters and mean water temperature from a number of data sets, similar to Pauly’s equation used for finfish:
M = 0.0277 - 0.0004 * L∞ + 0.5397 * K + 0.0119 * T
Where L∞ = CL (mm), K = Growth rate (year-1) and T = Temperature (oC). Using this equation, M values for the region range between 0.3 and 0.35 year-1.
3Pauly's (1980) method was developed for finfish and is unreliable for crustaceans, which may explain the generally higher values obtained through this method. Where possible, these values should be re-estimated using Cruz et al. (1981) method.
4The depletion model provides an estimate independent of growth models and size data.

26
4 REVIEW OF LARVAL RECRUITMENT PATTERNS AND VARIABILITY IN SPINY LOBSTER (Panulirus argus) R. Cruz, B. Luckhurst and R. Muller
The Caribbean region is the main lobster producer, at a world scale, standing for 17% (about 33 000 tonnes) of the average total world production of lobsters (200 000 t) in the period 1978-1991. Panulirus argus is the most abundant species and of high commercial importance. Understanding recruitment to the fishable stock of a species depends on knowledge of the oceanic processes and biological factors that operate during the different phases of the long life cycle. However, for the species P. argus only limited data exist on the puerulus and juvenile phases and their relationship with environmental variables. Collectors have been used successfully to catch the puerulus stage of spiny lobster in Bermuda, Florida, Mexico and Cuba. Three types of collectors have been developed in the region, to investigate levels of settlement. These include the modified Witham types, used in Bermuda (Luckhurst, unpublished data) and Florida (Hunt, pers. comm.); the Gusi Collector, used in the Mexican-Caribbean (Briones, 1994) and the Phillips collector (Phillips, 1972) modified in Cuba (Cruz et al., 1991).
Figure 4.1. Life cycle of the Caribbean spiny lobster Panulirus argus As has been described in Section 3.2, the Caribbean spiny lobster P. argus is able to utilise a variety of environments and changes habitats several times during its ontogenetic development. A summary of the life cycle is presented in Figure 4.1. This includes 11 stages of oceanic phyllosoma larvae, over a period of 6–10 months. During this long planktonic phase the larvae become widely distributed throughout the Atlantic Ocean. The phyllosoma larvae metamorphose into the puerulus stage, which swims across the continental or insular shelf to arrive at the coast. This occurs throughout the year, but with a main settlement peak in September-December. Puerulus become juveniles ten months after settlement. The juveniles concentrate in shallow water (nursery area). Older juveniles tend to migrate into deeper water and recruit to the fishery at 76mm CL (Florida and Cuba). Mating takes place mainly in February–March.

27
The puerulus settlement at different locations in the Caribbean in the period since 1988 is compared in Figures 4.2 and 4.3. There were variations in this pattern of settlement between Bermuda, Florida Keys, Mexico (Bahia de la Ascensión) and Cuba (Gulf of Batabanó). The three last regions showed that some settlement occurred throughout the year. In contrast, for the stations in Bermuda (St. Catherine, Whale, Bailey’s and Flat’s), the settlement period is concentrated basically between two months (August – September) and the magnitude of larval recruitment was much lower during the rest of the year (Fig. 4.3).
Figure 4.2 Monthly Panulirus argus pueruli in the south of Cuba and the Mexican
Caribbean When comparing the relative abundance of pueruli between these locations, significantly different settlement levels were observed. The causes of the differences between areas in the magnitude of pueruli recruitment into the coastal zones is unknown, but will depend mainly on variability of the oceanic processes and size of the breeding stock. The pattern of puerulus settlements in the Florida Keys showed a larger peak in the beginning of the year (February-March) with the lowest index occurring in August (Fig. 4.4). The Bermuda stations showed only one peak in August. The south coast of Cuba and the Mexican Caribbean showed two peaks per year, one in May and the larger peak in October. In other areas studied in the Caribbean the settlement followed a very similar seasonal pattern, from November-December in Jamaica (Young, 1991) and September and May in Antigua (Peacock, 1974 and Bannerot et al. 1992, respectively).
Cuba
010203040506070
Jan-
88
Jan-
89
Jan-
90
Jan-
91
Jan-
92
Jan-
93
Jan-
94
Jan-
95
Puer
ulus
Set
tlem
ent I
ndex
Mexico
0
5
10
15
20
Jan-
88
Jul-8
8
Jan-
89
Jul-8
9
Jan-
90
Jul-9
0
Jan-
91
Jul-9
1
Jan-
92
Jul-9
2
Jan-
93Puer
ulus
Set
tlem
ent I
ndex

28
Figure 4.3 Monthly Panulirus argus pueruli in Florida Keys and Bermuda
Table 4.1 Maximum cross-correlations of pueruli with environmental series showing maximum time lags in months. Gulf of Batabanó, Cuba
Locations SOI W (km/h) T (° C) S (‰) RF (mm)
R Lag R Lag R Lag R Lag R Lag
0.48 (SW) 5 Hicacos 0.47 1
0.52 (NW) 2 0.49 7 0.23 14 0.25 9
Matías 0.48 6 0.46 (SW) 3 0.34 4 0.25 14 0.23 9
Cantiles 0.49 5 0.46 (SW) 3 0.45 4 0.39 16 0.30 5
SOI – Southern Oscillation Index, W (km/h) – Direction of Wind, T (C°) – Water Temperature, RF – Rainfall, R = maximum cross correlations, L = lags (months) and NS = not significant (95
%) (Cruz et al., in press). When comparing the spawning season with the maximum puerulus settlement in the different regions, an estimation of the duration of the larval phase can be obtained. In the Mexican Caribbean and south of Cuba it is between 6 to 7 months respectively (Fig. 4.5 and 4.6) and in Florida it is between 9 and 10 months (Fig. 4.7). The mechanism of retention in the area south of Cuba (Garcia et al., 1991) and between Dry Tortugas and the Florida Keys (Yeung, 1993), and the different temperature of water between these areas, leads to the conclusion that the larvae remain for 6 to 10 months adrift in the ocean. It is not clear how sea temperature influences embryonic development and larval growth. Environmental variables play an important role in the pelagic stages of spiny lobsters. In the Cuban archipelago the most drastic change seems to be associated with the sea level and the water movements resulting from the winds (Table 4.1), which are affected by ENSO
Florida
0.0010.0020.0030.0040.0050.0060.0070.00
Jan-88
Jan-89
Jan-90
Jan-91
Jan-92
Jan-93
Jan-94
Jan-95
Jan-96
Puer
ulus
Set
tlem
ent I
ndex
Bermuda
0102030405060
Jan-88
Jul-88
Jan-89
Jul-89
Jan-90
Jul-90
Jan-91
Jul-91
Jan-92
Jul-92
Jan-93
Jul-93
Jan-94
Jul-94
Puer
ulus
Set
tlem
ent I
ndex

29
Figure 4.4 Mean monthly pueruli settlement of Panulirus argus at Florida Keys, Bermuda, Cuba and Mexico
05
101520253035
J F M A M J J A S O N DMonths
Puer
ulus
Set
tlem
ent I
ndex BERMUDA
FLORIDA
0
10
20
30
J F M A M J J A S O N DMonths
Puer
ulus
Set
tlem
ent
Inde
x
0
5
10
15
20
jJ F M A M J J A S O N DMonths
Puer
ulus
Set
tlem
ent I
ndex
CUBA
0
2
4
6
8
10
E F M A M J J A S O N D
Months
Puer
ulus
Set
tlem
ent I
ndex
MEXICO

30
Figure 4.5. Relationships between the spawning season and puerulus settlement in the south of Cuba
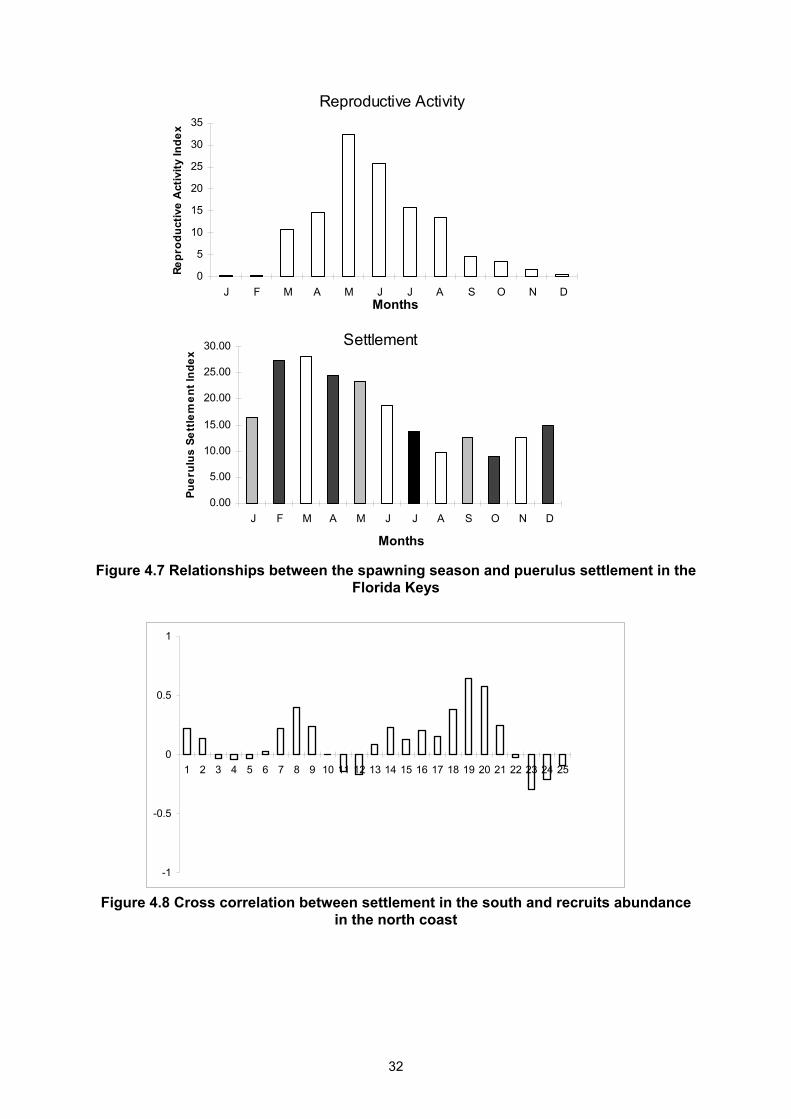
events with different magnitudes and intensities (Cruz et al. in press). Nevertheless, the factors by which larvae return to the coast are not yet completely understood. For P. cygnus, the intensity of the Leeuwin Current, which is related to ENSO events and the impact of westerly winds, constitutes the main cause of variation in the level of pueruli settlement in Western Australia (Pearce and Phillips, 1988; Phillips et al., 1991; Caputi and Brown, 1993; Phillips et al., 1994a). In the Pacific region the changes in the recruitment levels are related to inter-annual variation of ENSO events and with the sea level four years earlier for Panulirus interruptus (Pringle, 1986; Phillips et al., 1994b) and Panulirus marginatus (Polovina and Mitchum, 1992), respectively. The data from Bermuda, Cuba, Florida and Mexico provide a clear indication of the importance of the pueruli data in the assessment of recruitment in spiny lobster fisheries. Moreover, the relationships of environmental events with settlement indicate that in the species P. argus, P. cygnus and P. marginatus, oceanic processes are affecting settlement along the coasts of these countries. Further studies of these aspects are necessary. Recent studies carried out on spiny lobster life cycles indicate that there is a close relationship between the level of pueruli settlement as measured on collectors and abundance of recruits to the fisheries. This occurs 1.5 years (Forcucci et al., 1994) and two years (Cruz et al., 1991; Phillips et. al., 1994a) after settlement in Panulirus argus in Florida and Cuba, respectively. Data on puerulus settlement in the south coast have been cross-correlated with the abundance of recruits to the fisheries on the north coast (Fig. 4.8). Significant correlations are observed at lags of 18 and 19 months. Research on the spiny lobster fisheries should try to produce a better understanding of the relationships between life history and oceanic processes. Workshop results suggest that the planktonic period of the larvae is between 6 to 10 months. Monthly settlement of pueruli showed a seasonal pattern that was very similar within the Caribbean and in Bermuda
0
5
10
15
20
25
30
J A S O N D E F M A M J J A S O N D
Months
Perc
enta
ges
Berr
ied
Fem
ales
Reproductive Activity
0.00
5.00
10.00
15.00
20.00
E F M A M J J A S O N D
Months
Puer
ulus
Set
tlem
ent I
ndex
Settlement

31
(September-December) and different in Florida (February-March). The variations in settlement in the different sites are probably attributable to the variables in the local effect of environmental factors, which control water flow and retention.
Figure 4.6 Relationships between the spawning season and puerulus settlement in the
Mexican Caribbean
05
1015202530354045
J F M A M J J A S O N D
Month
PercentageBerriedFemales
Berried Females
0123456789
10
J F M A M J J A S O N D
Month
Puer
ulus
Set
tlem
ent I
ndex
Settlement
32
Figure 4.7 Relationships between the spawning season and puerulus settlement in the Florida Keys
Figure 4.8 Cross correlation between settlement in the south and recruits abundance in the north coast
0
5
10
15
20
25
30
35
J F M A M J J A S O N DMonths
Repr
oduc
tive
Act
ivity
Inde
x
Reproductive Activity
0.00
5.00
10.00
15.00
20.00
25.00
30.00
J F M A M J J A S O N D
Months
Puer
ulus
Set
tlem
ent I
ndex
Settlement
-1
-0.5
0
0.5
1
1 2 3 4 5 6 7 8 9 10 11 12 13 14 15 16 17 18 19 20 21 22 23 24 25

33
5 REGION 1: BRAZIL AND VENEZUELA
G. Andrade de Pasquier, J.A. Negreiros Aragão, R.N. de Lima Conceição, R.C. de Almeida Carvalho, N.M. Ehrhardt (Group Leader) and C.A. Sobreira Rocha
5.1 FISHERIES INFORMATION AND MONITORING PROGRAMMES
5.1.1 Brazil
5.1.1.1 Catch and Effort Spiny lobster catch and effort statistics are collected by the Instituto Brasileiro de Meio Ambiente (IBAMA) through two sources: the landings control system and the log-book system. The landings control system is used to collect catch and effort data from artisanal and semi-industrial fleets. The system covers all the fisheries in selected landing places within a region and maintains a monthly register of all boats and vessels that operate in the entire region. Expansion factors are used to estimate the total catch and effort by species based on the register and data from a sampling programme. CPUE is estimated for all species and fisheries.
The log-book system is used to monitor operations of individual vessels in the industrial fleets. The log-book records catch in numbers and weight by species and fishing effort by gear type and pre-established 1-degree squares over the entire continental shelf. The information gathered from log-books is used to estimate seasonal and annual CPUE, total catch and total effort for the industrial fleets.
Data on spiny lobster exports by commercial size categories are available from a database available at the Ministry of Industry and Commerce. These data are used to corroborate annual spiny lobster landing statistics.
Coverage of the catch and effort sampling algorithms used in the national fishery statistical system has changed significantly through years, regions, fleets, and fisheries as a consequence of discontinuities of funding and/or changes in priorities. Therefore, inconsistencies in the database are common and in some cases it is not possible to combine data by specific fleet/gear types and regions. The immediate consequence of this is that effort estimation is inaccurate or at best restricted to fleets that are more accessible.
The Laboratório de Ciências do Mar (LABOMAR), Universidade Federal do Ceará, has maintained a spiny lobster biological sampling programme in the Fortaleza area (Ceará) since 1962. The biological data collected include tail length frequencies segregated by species (P. leavicauda and P. argus) and sex and other biological information on maturity, individual weights and morphometrics. These data are collected at landing places as well as in processing plants. More recently, biological samples are being collected on a monthly basis in the two main spiny lobster producing states of Rio Grande do Norte and Ceará through the Centro de Pesquisa e Extensao Pesqueira do Nordeste (CEPENE) of IBAMA. During the years 1994 and 1995 CEPENE developed a large programme of ecological and bio-economic studies to contribute to the understanding of the utilisation and management of the spiny lobster resources.
The biological sampling effort performed by LABOMAR has been reduced in the 1990s as a consequence of a diminished budget.
5.1.1.2 Socio-economic Data During the period 1995-1996, economic data were collected from a sample of vessels in the spiny lobster fleet stratified by vessel size and gear type. The samples included 24 small and medium size gillnet boats, 10 small and medium size trap boats, 3 large industrial trap boats,

34
6 small boats with diving gear and 3 small trap sail boats. The data collected consisted of operating costs, fixed costs, depreciation and revenues of fishing trip operations from May to December over two years. These data were made available to the workshop for developing a bio-economic model.
5.1.2 Venezuela
5.1.2.1 Catch The spiny lobster fishery in Venezuela is artisanal and mostly restricted to insular areas. 50 to 60% of the catch is landed at the Parque Nacional Archipiélago Los Roques (PNALR), (latitude 11º48’ and 11º58’ N and longitude 66º 32’ and 66º 52’ W). Also, about 20 to 30% of the landings originate from Los Testigos and La Blanquilla Islands (Fishery Statistics MAC-SARPA 1997). Spiny lobster landings are not processed in any form in Venezuela. Thus, landings are transported whole and marketed directly to restaurants and fish houses on the mainland. Some fish houses and a few merchants have just begun to export fresh spiny lobsters in refrigerated containers.
Landing statistics are available since 1977 for the PNALR and since 1985 for the entire country. The official landing statistics for PNALR corresponding to the period 1984-1988 released by the Ministry of Agriculture and Livestock (MAC) were found significantly lower than similar statistics collected during those years by scientists from FCLR working in PNALR. Using the concurrent data series, an equation to correct the MAC data was developed at the workshop:
MAC = 0.3797*FCLR
The PNALR MAC landing statistics, which were considered less reliable, were corrected by a factor of 0.3797-1 and then incorporated into the total national statistics (Fig. 5.1).
Figure 5.1 Landings of spiny lobsters, P. argus, in Venezuela and at PNALR.
The historic 1977-1997 landing trend (Fig. 5.1) indicates that 300 000 to 400 000 kilograms whole weight of spiny lobsters were landed during the period 1977-1991 followed by a pronounced increase in landings starting in 1992. This increase in landings is believed to be the result of the new fishing areas of Los Testigos and La Blanquilla islands starting in 1990. The observed increment brought landings to about 1.2 million kg whole weight in 1997. These landings appear to have stabilised in the last 4 years.
5.1.2.2 Effort Traps, free diving and gillnetting have been the three most common fishing gear used to catch spiny lobsters in Venezuela. Since 1994, gillnets have been banned from the fishery in PNALR. No formal statistics on fishing effort are presently available for the fishery although
0.0E+002.0E+054.0E+056.0E+058.0E+051.0E+061.2E+061.4E+061.6E+061.8E+06
77 80 83 86 89 92 95
Fishing season (6 months/year)
Land
ings
who
le w
eigh
t (kg
)
PNALR Total

35
sporadic effort statistics are compiled at PNALR. For example, it is noted that during the period 1994-1997 the number of free divers operating in PNALR increased from 148 to 218 and that the number of traps used annually during the same period decreased from 9520 to 7210. These changes are indicative of a significant increase in the amount of diver effort selecting the smaller spiny lobsters distributed in the shallower areas of the reefs at PNALR, and a significant decrease of traps that target deeper, thus larger and older spiny lobsters. The reasons for this shift of fishing effort units cannot be explained at the present time with the information available at the workshop
5.1.2.3 CPUE During the period of relatively constant landings, divers' CPUE decreased considerably from 1994 to 1997, while trap catch rates have slightly improved in those years (Table 5.1). Since these two forms of fishing are acting sequentially relative to the cohorts, the decrease in diver’s CPUE may be due to increased competition for a fixed annual resource as the number of free divers increase. The reverse may be happening in the trap fishery.
Table 5.1 Estimated CPUE based on PNALR data for the years effort information is available.
Year Divers (kg diver-1 season-1)
Traps (kg trap-1 season-1)
1994 5157.8 80.2
1995 4252.1 66.1
1996 3135.7 93.2
1997 2966.9 90.8
5.1.2.4 Socio-economic data No economic data are available to perform a bio-economic analysis of this fishery. However, production costs and net profit by gear types was estimated for the PNALR fishery in 1987. Similar information is available for 1996 and 1997 for a small area of the fishery (0.2% of the national landings) in the Falcon State. In 1998, the price paid per kilogram for whole spiny lobster in Venezuela is US$5.61.
A social survey carried out in 1987 estimated that 767 people were actively participating in the PNALR fishery. Of these, 79.5% were fishermen and the remaining participated in other associated activities (FCLR, 1989). No information is available on the labour force presently participating in this industry at the national level.
5.2 FISHERIES-INDEPENDENT INFORMATION
5.2.1 Pueruli collectors
5.2.1.1 Brazil Very limited research on the recruitment mechanisms of spiny lobsters has been carried out in Brazil. In 1988, a limited pilot study prospecting for puerulus was initiated in the state of Ceará, but only lasted for three years before it was terminated through lack of financial support. The results obtained from that pilot project are not sufficient to draw any conclusions on annual trends in recruitment abundance. However, a collector appropriate to the conditions of the region was designed to collect puerulus and environmental information. The experience gained during the project would be useful if a regional project to study puerulus abundance is established in Brazil in the future.

36
5.2.1.2 Venezuela Cobo de Barany et al. (1975) report on the catch of post larvae obtained during a one year survey (Table 5.2), using Witham collectors as well as collectors developed by Fundación Científica Los Roques (FCLR).
Table 5.2 Monthly distribution of spiny lobster larval stages collected by Cobo de Barany et al. (1975).
Stage Jan Feb Mar Apr May Jun Jul Aug Sep Oct Nov Dec I x x x x x x x II x x x x III x x x x x x x x IV x x x V x x x x VI x x x x VII VIII x x IX X
5.2.2 Environmental data
5.2.2.1 Brazil Brazil’s north-eastern region is characterised by a semi-arid climate with seasonal easterly to south-easterly winds throughout the year. These wind patterns determine the environmental conditions (temperature and rainfall) observed in this region. The Fundação Cearense de Meteorologia (FUNCEME) is the institution responsible for the collection of climate information in the north-eastern region. The climatic database consists of historic daily statistics on rainfall, air temperature, humidity, barometric pressure, wind speed and wind direction. This information is available for different weather stations in the region.
Oceanographic data are not available in time series form. However, the general dynamics of ocean currents and temperature profiles are known from oceanographic cruises historically carried out in the region.
Prevailing seasonal winds and ocean currents are believed to control spiny lobster larval retention mechanisms, and therefore influencing recruitment and stock abundance variability. Data on daily wind speed and direction were available for analysis at the workshop. These data covered the period 1974-1997.
5.2.2.2 Venezuela There is no historic information on seasonal environmental conditions in the region inhabited by spiny lobsters in Venezuela. The only data available are for one year (1988-1989) consisting of air temperature, wind, sea surface temperature, salinity, dissolved oxygen, inorganic nutrients, and primary productivity.
5.2.3 Tagging
5.2.3.1 Venezuela Cobo de Barany et al. (1975) report on the tagging of 279 spiny lobsters during a one-year period (October 1968 to October 1969) with a total recapture of 11 tagged individuals. Reported time at large varied from 3 to 94 days and no changes in size were observed in the recaptured lobsters, except in one where the carapace length increased by 8.4mm.

37
5.2.4 Other Information
5.2.4.1 Venezuela Cobo de Barany et al. (1975) reported sexual dimorphism in length-weight relationships. They found that among individuals of similar weight, females reached a larger carapace length. Similarly, among individuals of the same carapace length, females reached a larger total length. However, these findings could not be statistically corroborated in later studies (FCLR, 1989).
Monthly sampling during the 1986-1988 fishing seasons, showed that about one half of the spiny lobsters sampled were mature females during any month of the year. This is indicative of a protracted spawning activity in the spiny lobster stock of Venezuela. Simmons (1980) reported that females of 76mm CL produce an average of 500 000 eggs, while 127mm CL females produce an average of 1 500 000 eggs. It has been estimated that 82.4% of the females between 70 and 120mm CL contribute to the reproductive output of the stock (FCLR, 1989).
Age at first maturity has not been defined for this stock, however, Cobo de Barany et al. (1975) found mature females of 65mm CL and FCLR (1989) reported a minimum size at maturity of 80mm CL with a larger proportion of mature females in the 90 to 130mm CL range. Also, FCLR (1989) reports that the size at 50% maturity is 100mm CL.
5.3 STOCK ASSESSMENT RESULTS AND STATUS OF THE STOCKS
5.3.1 Brazil
5.3.1.1 Data and Parameters Used in Stock Assessments The following data series were available and used at the workshop:
• Biological samples – tail size frequency distributions by 10mm intervals and sex for the period 1974-1993.
• Log-book data – catch in numbers and weight, and fishing effort measured in trap-days by month and year for the period 1974-1993.
• Daily information on wind intensity and wind direction in Fortaleza during the period 1974-1993.
• The following parameters for natural mortality (M) and von Bertalanffy growth model (K and L∞) estimated by Ivo (1996) were used in the stock assessment:
• Males: M= 0.302 year-1; K= 0.236 year-1; L∞ = 453mm (total length)
• Females: M= 0.302 year-1; K= 0.234 year-1; L∞ = 425mm (total length)
5.3.1.2 Methods Data on annual tail length frequencies in the landings by sex were used in tuned length cohort analysis (TLCA) following the algorithm suggested by Ehrhardt and Legault (1996) (see section 3: Methods). The algorithm consists of fitting a length converted catch curve to the annual tail length frequency data for each sex separately. An estimate of the annual fishing mortality rate (F) is obtained as the difference between the total mortality rate (Z) estimated by the slope in the catch curve and the natural mortality rate (M) assigned to the species. Estimated F-values were subsequently used as calibration indices in a Jones-type length cohort analysis that estimated abundance and fishing mortality rates by size. The initial F/Z required by the method estimates abundance of the largest size group from the catch in that size group. Thus the initial F/Z was adjusted until the weighted average fishing mortality rate for a specified length class range equalled that of the estimated fishing

38
mortality rate obtained for the same length class range, but from length converted catch curve analysis.
Data on annual tail length compositions in the landings were converted to annual age compositions by slicing length frequencies at age using the sex-specific growth models. These data were used in a calibrated age-structured sequential population analysis (SPA) following the ADAPT statistical reasoning given in Section 3: Methods. The conceptual ADAPT algorithm used here estimates fishing mortality rates at age and abundance at age by minimising an objective function (using MS Excel 'Solver') for initial mortality rates at age for the last year in the data set (1993). Several objective functions were developed to make use of information generated from TLCA as well as by dynamically changing the annual catchability parameter. However, the objective function used in the minimisation procedure was the standard least-squares, defined as:
293
74)(min i
ii NqCPUE −∑
=
where CPUEi is the catch in numbers per trap-day for ages 3 and 4 in year i, q is the overall catchability coefficient, and Ni is the average abundance of ages 3 and 4 estimated by ADAPT in year i. The catchability coefficient (q) was estimated as:
( )∑∑
∑∑
==
==
∗= 4
3
2
,
93
74
4
3,,
93
74
jji
i
jjiji
i
N
NCPUEq
where j refers to ages 3 and 4 used in the calibration.
Abundance at age 2 in every year as estimated by SPA was defined as recruitment. Similarly, abundance of ages 3 to 8 in females and 3 to 7 in males were defined as mature stock abundance in a stock-recruitment analysis. A stock-recruitment model was developed based on a Ricker-type spawner-recruit relationship with a 2 year delay, and wind speed during the peak spawning months (February-June) as an environmental variable influencing recruitment. Thus, the model used was expressed as:
iiii
TSSR e ∗+∗−∗∗=+δβα2
where Ri+2 is recruitment in year i+2, Si is the parent stock, Ti is wind velocity (m sec-1) and the remaining symbols are parameters estimated by a least squares multiple linear regression of ln(Ri+2/Si) on Si and Ti.
A seasonal depletion model (see Section 3: Methods) was fitted to the monthly catch and effort data for the period 1974-93. In light of the analyses obtained from cohort analyses, one of the assumptions in the basic depletion model was relaxed: The catchability coefficient was not assumed to be constant for the entire time series. Instead, it was allowed to vary annually, following a simple random walk model of the type:
iii eqq ε1−=
where Εi is a normally distributed random variable with mean zero and variance 2
εσ . The model was fitted by minimising the negative log-likelihood for the normal distribution:

39
2
2
2))ˆln()(ln(2 εσ
ε∑∑ +− t
i
ttt UUn
,
where Ut represents CPUE in month t and 2
εσ was fixed to achieve a given coefficient of variation in log space (10% in the base case).
In theory, allowing for a random walk in q should accommodate situations in which gear efficiency, selectivity, or both, change smoothly over time without having to estimate a separate catchability for each season. However, whether this is achieved may depend upon the available data, and may not be easily evaluated without resorting to simulation.
To portray several exploitation scenarios, a yield- and spawning-biomass-per-recruit analysis was performed using the standard growth, natural mortality, maturity and average exploitation patterns estimated for the species.
5.3.1.3 Results and Discussion Figure 5.2 shows observed and expected CPUE (catch in numbers per trap-day of 3 and 4 year olds) resulting from ADAPT calibrations of females and males catch-at-age data. The observed and expected values in the figure capture the general trends of annual CPUE. However, the expected values are lower than the observed values during the earlier years, but higher in later years. These results are indicative of a departure of annual catchabilities from the average overall catchability coefficient used in the calibrations. When calibration was attempted with ages 2 to 4, a consistent larger negative bias was observed in the ADAPT fits. This condition was found to be related to a large decrease in CPUE of age 2 in both male and female lobsters starting in 1988. The decrease in CPUE may be attributed to a significant change in the exploitation pattern toward ages 3 and older starting that year and not to a significant decrease in the recruitment levels during those years.
Abundance estimates (total numbers of individuals of ages 2+) obtained by tuned length cohort analysis (dotted line) and by tuned age-structured sequential population analysis (continuous line) are shown by gender and years in Figure 5.3. The general trends are remarkably similar both between sexes as well as between methods. In periods of peak abundance, males are slightly less abundant than females (Fig. 5.3). In general, it is observed that two periods of increased abundance existed in the late 1970s and 1980s. These two periods are contrasted by a period of lower abundance in mid 1980s. This apparent low abundance was found related to lower recruitment levels of age 2 individuals during the period 1982-1985. These low-recruitment years were found correlated to years of stronger average winds in the region, which may have resulted in a relaxation of (as yet unknown) larval retention mechanisms during those years. Estimates of annual fishing mortality rates by sex, by tuned length cohort analysis (segmented line) and tuned sequential population analysis (continuous line) are presented in Figure 5.4. It appears that males are subjected to higher levels of fishing mortality than females (Fig. 5.4). In both cases, however, the levels are much higher than the natural mortality of 0.302 year-1 assigned to the species, thus indicating that the stocks may be fully exploited during most of the time period covered in this analysis.
Although the absolute fishing mortality values are not the same between methods, in general it is noted that there is a decreasing trend in fishing mortality rates throughout the years considered in this study (Fig. 5.4). The decreasing trends are slightly larger for the SPA estimates than the TLCA estimates in both females and males. The apparent decreasing trend in fishing mortality rates could be attributed to observed changes in technology in the fleets that are operating in the fishery in the later years. A large increase of less efficient artisanal boats and the departure of the larger and more efficient vessels from the industrial fleet took place in the later years of the fishery (Table 5.2). This trend in fleet composition

40
resulted from significant economic impacts that forced the incorporation of less sophisticated vessels that are cheaper to operate and to crew, which could have resulted in a decrease in fishing power. Catchability has decreased significantly with increases in fishing effort among both females and males (Fig. 5.5). Similarly, there has been a general decreasing trend in fishing power through time (Fig. 5.6). Changes in catchability are usually expected in passive gear fisheries, such as trap and gillnet fisheries, as fishing effort increases. Therefore, the much lower q-values observed in the later years of the series may be the result of less efficient fishing effort units entering the fishery.
Figure 5.2 Observed and expected CPUE (catch in numbers per trap-day of ages 3 and
4) resulting from ADAPT calibrations of females and males catch-at-age data.
FEMALES
-3.00-2.50-2.00-1.50-1.00-0.500.00
74 76 78 80 82 84 86 88 90 92
YEAR
CPU
EOBSERVEDEXPECTED
MALES
-3.50-3.00-2.50-2.00-1.50-1.00-0.500.00
74 76 78 80 82 84 86 88 90 92
YEAR
CPU
E

41
Figure 5.3 Abundance estimates (total numbers of individuals of ages 2+) from tuned length cohort analysis (dotted line) and by tuned age-structured sequential population
analysis (continuous line) for females and males.
Figure 5.4 Annual fishing mortality rate estimates by tuned length cohort analysis (segmented line) and tuned sequential population analysis (continuous line) for
females and males.
FEMALES
0.0E+00
1.0E+07
2.0E+07
3.0E+07
4.0E+07
74 76 78 80 82 84 86 88 90 92
YEAR
ABUN
DAN
CE
(NUM
BERS
)
NSPANTLCA
MALES
0.0E+00
5.0E+06
1.0E+07
1.5E+07
2.0E+07
2.5E+07
3.0E+07
74 76 78 80 82 84 86 88 90 92YEAR
ABUN
DAN
CE
(NUM
BER
S)
FEMALES
0.0
0.2
0.4
0.6
0.8
1.0
1.2
74 76 78 80 82 84 86 88 90 92YEAR
FISH
ING
MO
RTA
LITY
R
ATE
FSPAFTLCA
MALES
0.0
0.5
1.0
1.5
2.0
74 76 78 80 82 84 86 88 90 92
YEAR
FISH
ING
MO
RTA
LITY
RA
TE

42
Results of the depletion model provide a different interpretation of events. In effect, abundance appears to have decreased throughout the study period and followed the historic trend in average CPUE (males and females combined; Fig. 5.7) as expected for depletion models. This model suggests annual fishing mortality rates have been constantly increasing during the same period (Fig. 5.8) and annual catchability coefficients show variability with no apparent trend (Fig. 5.9). Results from this model are indicative of a fishery undergoing significant increasing fishing pressure, and consequently stock abundance has decreased to significantly low levels relative to the mid 1970s. These results, however, will need to be verified once fishing effort statistics used in monthly CPUE estimates are standardised to take into consideration the significant changes in fleet operation dynamics as well as fleet compositions observed in the fishery.
Figure 5.5 Annual catchability trends on fishing effort for females and males.
FEMALES
0.0E+001.0E-082.0E-083.0E-084.0E-085.0E-086.0E-087.0E-08
2.0E+07 4.0E+07 6.0E+07
EFFORT (trap-days)
CATC
HAB
ILIT
Y
MALES
0.0E+00
2.0E-08
4.0E-08
6.0E-08
8.0E-08
2.0E+07 4.0E+07 6.0E+07
EFFORT (trap-days)
CAT
CHA
BILI
TY

43
Figure 5.6 Historic catchability trends for females and males.
Figure 5.7 Historic abundance from sequential model estimations and average (males
and females combined) CPUE. An attempt was made to analyse temporal recruitment trends resulting from the SPA that are so important to spiny lobster population dynamics. Figure 5.10 shows recruitment estimates at age 2 relative to parent stock (ages 3+) two years prior. As expected, no clear stock-recruitment trends are observed in the data shown, indicating once more the apparently complex nature of the recruitment mortality processes. Seasonal wind speed information during peak spawning months (February-June) was prepared from daily wind data available at workshop to explore the effects of wind on recruitment success (Ri+2/Si).
FEMALES
0.0E+001.0E-08
2.0E-083.0E-08
4.0E-085.0E-08
6.0E-087.0E-08
74 76 78 80 82 84 86 88 90 92YEAR
CATC
HABI
LITY
(C
PUE/
NAVE
)
MALES
0.0E+001.0E-082.0E-083.0E-084.0E-085.0E-086.0E-087.0E-08
74 76 78 80 82 84 86 88 90 92
YEAR
CATC
HABI
LITY
(C
PUE/
NAVE
)
0.000.050.100.150.200.250.300.350.40
74 76 78 80 82 84 86 88 90 92 94
YEAR
CPU
E A
ND
SC
ALE
D N Scaled N average
Average CPUE

44
Figure 5.8 Annual fishing mortality rates estimated by the depletion model.
Figure 5.9 Annual catchability coefficients estimated by the depletion model.
Figure 5.10 Recruitment estimates at age 2 relative to parent stock (ages 3+) two years earlier.
0
0.2
0.4
0.6
0.8
1
74 76 78 80 82 84 86 88 90 92 94
YEARF
0
0.005
0.01
0.015
0.02
0.025
74 76 78 80 82 84 86 88 90 92 94
YEAR
CA
TCH
AB
ILIT
Y (q
)
0.0E+00
5.0E+061.0E+07
1.5E+072.0E+07
2.5E+073.0E+07
3.5E+07
0.0E+00 1.0E+07 2.0E+07 3.0E+07
Parent stock at time i
Rec
ruitm
ent a
t tim
e i+
2

45
Figure 5.11 Wind speed anomalies at spawning time and corresponding recruitment success anomalies two years later. Time scale corresponds to spawning time.
Figure 5.11 shows wind speed anomalies (observation minus mean divided by standard deviation) at spawning time and corresponding recruitment success anomalies. There is a negative correlation evident between these two variables 1974-1987, however, the correlation becomes positive 1988-1990. This later effect may be significantly influenced by the high uncertainty usually associated with recruitment estimates generated by SPA in the last few years of the database. The parameters of the Ricker-type spawner-recruitment model were significantly different from zero (F2,14=16.75; p<0.001; multiple correlation coefficient = 0.84; α = 2.38, β = -4.98 10-
8, and δ = -0.432). The fitted model was used to estimate the expected recruitment for each year. It can be concluded that the model captures well the historic recruitment trend and can explain recruitment variability (Fig. 5.12).
Figure 5.12 Observed and expected recruitment from the Ricker-type spawner-recruitment model.
It is noted from the previous analysis that the general decreasing trend in recruitment observed during the period 1976-1983 may have resulted from the persistently higher wind speeds during the spawning season during those years (Fig. 5.11). However, observed recruitment increased significantly starting in 1983 once a large and decreasing change in wind patterns after that year occurred. Also conspicuous are the high values of recruitment in 1987 and 1988 estimated for the 1985 and 1986 year classes (Fig. 5.11), respectively. The increasing trend in recruitment in the mid-1980s is responsible for the higher levels of abundance estimated from TLCA and SPA starting in 1987.
Yield- and spawner-biomass-per-recruit analyses were carried out to assess the relative status of the stock. F0.1 was estimated as 0.64, at which level the spawning biomass relative to that when unexploited was 0.22. Similarly, it was estimated F≤0.45 was needed to
0.0E+00
5.0E+06
1.0E+07
1.5E+07
2.0E+07
2.5E+07
3.0E+07
3.5E+07
74 76 78 80 82 84 86 88 90 92YEAR
REC
RU
ITM
ENT
(#'S
)
ExpectedObserved
-2.0-1.5-1.0-0.50.00.51.01.52.02.5
74 76 78 80 82 84 86 88 90 92
YEAR
AN
OM
ALY
WINDR/S

46
maintain the spawning-biomass-per-recruit above 0.30 of the unexploited level. The annual F-values estimated from SPA for female spiny lobsters exceeded 0.45 in 12 out of the 20 years and was exceeded in 17 out of the 20 years in the analysis performed with the depletion model. This is another indication of the fully utilised status of the fishery.
5.3.1.4 Conclusions and Recommendations The spiny lobster fishery in Brazil has undergone significant changes through its recent history. These changes refer to fleet composition, gear types, and operational modes. All these changes have not been well documented. Therefore, it is not possible to quantify with the existing data the changes in fishing efficiency, selectivity patterns or exploitation patterns emerging from changes in the operational characteristics of the fleets. In spite of these changes, total fishing effort exerted on the stocks continues to be estimated as the ratio of total catch to CPUE, which is estimated from a progressively smaller and less efficient fraction of the industrial trap vessels. The industrial trap fleet has been reduced to less than 10% of its original size and replaced by much less efficient artisanal type boats and semi-industrial vessels. Contrasting with the observed changes, no detailed statistical information on the fishing operations is available for the very large artisanal fleet that has grown rapidly in the last few years. It is imperative, therefore, to improve the fishery statistical systems to collect more accurate catch and effort data by gear and fleet components in this fishery. Until these data are collected it would not be possible to standardise effort adequately, and consequently, it would not be possible to have access to less biased indices of abundance which are required in stock assessment work.
From a biological standpoint, the spiny lobster resources of Brazil are multi-species with Panulirus argus predominating. Biological sampling has been significantly reduced since 1994, and samples collected during this time appear to be highly biased toward smaller sizes with an almost total absence of individuals larger than 285mm total length. This is the consequence of reduced funding to carry out biological sampling over a wider, thus more representative, strata of landing places, fleets and gears. For this reason, during this workshop it was not possible to integrate data for the period 1994-1997 to the historic 1974-1993 database. One way to circumvent the absence of unbiased biological samples is to re-construct length frequency statistics from historic spiny lobster production statistics reported by commercial size categories and from easily collectable size frequencies within commercial size categories.
A review of the scientific literature pertaining to P. argus in Brazil clearly demonstrated the need to estimate growth of the species by sex. The existing growth equations do not portray the well-known sexual dimorphism exhibited by the species. Biased growth parameter estimates almost certainly will result in erroneous conclusions about the status of the stock.
Three stock assessment methods were applied to the existing 1974-1993 landings by length and age compositions, and fishing effort. Two of the methods (TLCA and SPA) gave abundance and fishing mortality rate estimates which are indicative of a stock undergoing significant growth in the late 1970s and then in the late 1980’s after a prolonged period of low recruitment, and thus of lower population abundance. The third method, using the depletion model, suggests the stock has been continuously decreasing in abundance since the early years of the fishery, while fishing mortality has been continuously increasing. While the first two methods indicate a conspicuous decrease in catchability through time, the third model suggests that catchability has varied with no apparent trend. Two of the models (SPA and the depletion model) depend heavily on the assumption that CPUE is proportional to abundance. SPA requires an index of abundance to calibrate initial fishing mortality conditions while using information contained in the age structure of landings. Conversely, depletion models make exclusive use of the knowledge extracted from seasonal trends in CPUE, thus, making them more dependent on the accuracy of such indices. On the other hand, TLCA models in spite of the critically important assumption of population equilibrium (a condition that has probably been violated in this fishery) generates similar trends in stock abundance as those generated by SPA. These inconsistencies in some of the assessment

47
results generated by the models appear to lie with the poor statistical quality of the CPUE indices.
Despite the differences in trends of abundance and fishing mortality obtained in the assessments, all results indicate high levels of exploitation, which risk stock collapse. On the other hand, it is noted that recruitment appears to be significantly influenced by environmental conditions created by wind speed. The SPA model generated a recruitment pattern, which appeared consistent with a stock-recruitment dynamics model including wind speed as an explanatory variable. If the SPA-estimated recruitment and parent stock abundance are proven correct, then the protracted period of low recruitment observed in the 1980s may be a consequence of a strong environmental effect, and not spawning stock depletion.
The apparent decreasing trends in catchability with increasing levels of fishing effort usually observed in fisheries with passive gear such as traps and gillnets is credible since as gear density increases, interactions among gear become more significant. This is a result of each unit sharing a lesser fraction of the stock available per unit of area of influence as the number of units increase. Also, catchability is expected to decrease if less efficient gear replace more efficient gear. Both these aspects are present in the spiny lobster fishery of Brazil and the SPA results may in part be indicative of the processes observed in the fishery. It is noted that the dynamics of catchability may have profound implications on the economics of fishing operations since it relates to the efficiency of capture by specific fishing operations. Therefore, special attention must be paid in future analyses to check for trends in catchability.
Fishing mortality rate is usually high among crustacean resources in the tropics, as a consequence of the high prices they attract. The P. argus fishery of Brazil is no exception to this exploitation trend. Fishing mortality rates estimated by the various methods all suggest that in the late 1980s and early 1990s the stock was fully utilised. The current status of the stock is critical given the significantly increasing pattern of small, less efficient, artisanal boats entering the fishery in recent years. There is an urgent need to compile appropriate stock assessment data for these later years to confirm whether fishing mortality trends and their relationship with fishing effort as it is currently estimated is correct.
If the stock abundance scenarios estimated by cohort analysis (length and age based) are correct, then the stock may be defined as undergoing significant changes dominated by density and environmentally driven recruitment. The long-term cycles in abundance depicted by these models show no clear trends other than those due to recruitment variability, possibly caused by environmental changes. On the other hand, if the abundance scenario depicted by the depletion model proves correct, then the stock in the early 1990s was considerably depleted from its condition in the mid 1970s. Given this, fishery regulations that aim for optimal utilisation of the resource need to be considered. Among these, stricter minimum size controls and closed seasons are required. It will also be necessary to limit or possibly reduce effort.
5.3.2 Venezuela The stock assessment carried out during the workshop is a preliminary exercise that refers to the PNALR fishery only. Length frequencies combined only for the 1986-87 and 1988-89 fishing seasons were used since information on the length structure of the spiny lobsters landed in other seasons or areas is not available.
5.3.2.1 Methods and Data Information on maturity at size was available for the period 1983-1988. These data were used to estimate a relative cumulative maturity at size distribution (Fig. 5.13). The length at which 50% of the females were found mature was 104mm CL. Also plotted in Figure 5.13 are the percent frequency distributions of CL landed by the three gear types used in the fishery. It is clear from the figure that free divers are capturing a significant fraction of the smaller

48
immature females in the 85-95mm CL range while also landing individuals in the 85-115mm CL range. This contrasts with size frequencies in landings reported by trap and gillnets, which are mainly in the 105-155mm CL range.
Figure 5.13 Percent frequency distributions of carapace length landed by the three
gear types used in the fishery and relative cumulative frequency distribution of maturity at size (CL).
The stock assessment exercise consisted in the application of a calibrated length cohort analysis algorithm developed by Ehrhardt and Legault (1996) (see Section 3: Methods) to length frequency statistics combined by sex and by two seasons (1986/87-1987/88). For this purpose, length frequencies in the average total landings for the two seasons were estimated from the sample length frequencies. The length frequencies were obtained for both sexes combined and were transformed to percentage by weight based on a length-weight relationship for the species in Venezuela given as W = 6.184499*CL2.08. These frequencies were used to estimate a fishing mortality rate for calibration from a two-season length converted catch curve. Then, in a two-season calibrated cohort analysis, average abundance and fishing mortality rates by size and for the stock as a whole were estimated. In the absence of a reliable growth equation for the spiny lobster in Venezuela, a von Bertalanffy growth equation for sexes combined estimated by León et al. (1995) for the species in Cuba was adopted in the analysis, with the growth parameters L∞ = 184.8mm CL; K = 0.209 year-1 and to = 0.43 years.
The fishing mortality rate resulting from the length converted catch curve using a natural mortality rate of M=0.3 year-1 was F=0.68 (Fig 5.14). This F was used to calibrate the initial F/Z in the length cohort analysis. As a result, a weighted average PNARL stock-wide (70-170mm CL) fishing mortality rate of F=0.34 and an average stock abundance of 598 172 individuals were estimated by this method. The total average stock biomass in the PNALR fishery was estimated to be 431 682kg whole weight. The exploitation pattern (Fat-size/Fmax-at-
size) and the average stock abundance are presented in Figure 5.15. It can be concluded that size classes in the range 95-145mm CL are the most impacted by the fishery (Fig. 5.15). The weighted average fishing mortality rate for this size range was estimated to be F=0.56, a value which is almost twice as high as the assumed natural mortality rate.
0
20
40
60
80
100
75 95 115 135 155 175
Carapace Length (mm)
Freq
uenc
y (%
) Maturity
Gillnet
Diving
Traps

49
Figure 5.14 Length-converted catch curve using a natural mortality rate of M=0.3 used to estimate the F-calibrating index.
An analysis of spawning-biomass-per-recruit was carried out to obtain the average status of the stock during the 1986/87 and 1987/88 fishing seasons. For this purpose the exploitation pattern at size and the maturity schedule at size were transformed to age using the von Bertalanffy growth equation. As a result of adopting a target of 30% unexploited spawning biomass, F0,30%SBR = 0.55 and 378g yield-per-recruit were estimated. The current fishing mortality corresponding to the mature stock (104-177mm CL) was estimated as 0.64. Thus, on average, the fishery in PNALR has been exerting a fishing mortality rate on the mature stock 16% larger than that which maintains spawning stock biomass at 30% of its unexploited size.
Figure 5.15 Average stock abundance and exploitation pattern.
5.3.2.2 Conclusions Spiny lobster landing statistics in the Venezuelan fishery are inaccurate. Historic trends in national landings had to be corrected according to observed trends in landings at Los Roques National Park. Thus, significant sources of error may still be included in the landings from other regions. A significant increase in landings, from about 400 tonnes to about 1000 tonnes was observed during the 1989-1992 period. This increase is believed to be the result of an expansion of the fishery to other insular areas of the shelf. Although there are no long-term fishing effort statistics, some apparent shifts from trapping to scuba diving is taking place in the PNALR area. The CPUE associated with these two gear types show trends that could be due to gear interaction effects.
A two-season (1986/87-1987/88) length frequency database corresponding to three gear types that operated at PNALR was available at the workshop for stock assessments. A
0.00
2.00
4.00
6.00
8.00
10.00
12.00
0.00 5.00 10.00 15.00
Relative Age (Years)
Ln(C
/dt)
ObservedExpected
020000400006000080000
100000120000140000160000
75 95 115
135
155
175
CL (mm)
Aver
age
Abun
danc
e (#
's)
0.0
0.2
0.4
0.6
0.8
1.0
1.2
Expl
oita
tion
Patte
rn
Average Abundance Exploitation Pattern

50
limited assessment based on tuned length cohort analysis applied to the PNALR fishery data provided a preliminary fishing mortality rate of 0.34 year-1 for all the length classes exploited in the fishery. Similarly, a fishing mortality rate of 0.56 was estimated for the mature stock only. An analysis of size at first maturity with data available at the workshop demonstrated that the fishery is capturing spiny lobsters below that size and that the exploitation pattern shows that lobsters in the 95-145mm CL range are the ones primarily targeted by the fishery at PNALR. Total average abundance for each of the two fishing seasons was estimated at 598 172 individuals or 431 682kg. Average landings for each of the seasons was estimated at 180 118kg whole weight.
Spawning biomass per recruit analysis indicates that a fishing mortality rate of 0.55 is required to keep a 30% of the pristine spawning biomass. Thus, given the preliminary estimate of F=0.56 estimated for the mature stock and for a fishing season just prior to the large observed increase in landings, the analysis suggests that at present this fishery is experiencing high levels of exploitation. This conclusion is based on an extremely short data series, so there is a need to check these results as soon as possible.
5.4 RECOMMENDATIONS
5.4.1 Brazil Specific recommendations have emerged from the analyses performed at the workshop. It is recommended:
• To expand the biological data collection system to generate more representative samples of the entire fishery. Thus, the system should include more areas, fleets and gear types, as these have changed significantly in the recent history of the fishery.
• To significantly improve the existing statistical system for catch and effort data gathering to include the large artisanal fishery. This is particularly important in light of the large increases observed in the artisanal fleet and the significant reductions observed in the industrial fleet.
• To fully revise the existing catch and effort database and to perform effort standardisation studies to improve historic seasonal and annual CPUE estimates.
• To fully revise the large 1974-1997 size composition database to improve estimates needed for stock assessment work. Special attention should be given to the incorporation of existing landing statistics stratified by commercial size categories to the length frequency estimation methods. This is critically important for the years after 1993 for which only biased length frequencies are available.
• To initiate studies on the potential fishery management merit of area closures, more specifically in closer-to-shore areas where artisanal fishing effort may be depleting juveniles.
• To revise the implementation of existing regulations since there is a need to strictly enforce minimum sizes as well as seasonal closures to protect the spawning stock. At the same time, it is advisable to set a limit on the size of the artisanal fishery, estimated from available data.
• To consider a long-range puerulus assessment programme to develop a meaningful fishery independent recruitment index that could be used in stock assessment work.

51
5.4.2 Venezuela Based on the results of this study, it is recommended:
• To establish a long-term spiny lobster biological sampling programme to collect length frequencies by gear type.
• To substantially improve the existing spiny lobster landings statistical system. Fishing effort statistics should be included in the improved system. Given the artisanal character of the spiny lobster fisheries in this country, it is likely the frame survey based methods will be required to estimate catch and effort by gear types and by defined regions.
• To form a stock assessment group responsible for national spiny lobster assessment work and the generation of management advice for this fishery.
• To concentrate monitoring on the free-diving effort that appears to be increasing and impacting lobsters prior to reaching first maturity.

52
6 REGION 2: BELIZE, SOUTHWEST CUBA AND MEXICO
M. Arce, A. Clemetson, M. E. de León, J. Gonzalez Cano, S. Marshalleck, S. O’Brian, R. Puga, V.R. Restrepo (Group Leader), G. Richards, V. Rios Lara, E. Sosa Cordero and C. Zetina
6.1 FISHERIES INFORMATION AND MONITORING PROGRAMMES
6.1.1 Belize In Belize, catch figures are available from the beginning of the fishery, 1932 to 1997 (Fig. 6.1 shows the landings since 1950). The time series 1932-1992 comprises information taken from the Cooperatives. This includes both export and production information originally recorded in tail weight. These data come directly from the purchase slips of the Co-operatives and are transcribed by officers from the Fisheries Department, accounting for approximately 95% of the entire production in the nation. The more recent time series of data, 1993-present, contains local consumption as well as Cooperative reports. The more recent database is being supplemented by a sampling programme that targets outlying market sites, and at-sea information (sex, length, weight, and maturity of individuals).
Effort data for Belize are available as time series utilising different measures. Specifically, 1965-1985 estimates of the number of fishers are available along with an approximation of total fishing days per year (Glaholt, 1986). This information is not available by fleet or by gear. There is also a series of effort recorded monthly, in fishing days and number of fishers, for 1973-1981. For 1993-1997, information is available on boat-days by gear and by fleet, and, more recently (since 1996), on soak-time for the trap fishery and dive-days for the diver fishery. The latter information is being obtained through the on-going data collection programme of the fisheries department. The programme includes biological sampling for lobster size frequency data. Two historical time series of CPUE were available at the workshops: Catch per fisher for the period 1965-85 (Fig. 6.2), and catch per fisher-day for the period 1973-1981.
In Belize, the fishery earns approximately US$12.5 million annually. While detailed economic information was not available for this assessment workshop, some information is known of the costs of production and the fishers’ (indirect) involvement in the industry.
6.1.2 Southwest Cuba In Cuba, catch and effort data by gear type and fishing days, as well as catch by export size category, are obtained monthly from the nine companies that exploit the resource. Total landings off the southern coast (of which 70% correspond to the south-west platform) show an increasing trend between 1962 and 1985, when production reached 11 064mt (Fig. 6.1). Thereafter, landings declined to a low of 6406mt in 1990, and became stable around 7317mt for the period 1991-1996. Fishing effort for the SW region, as measured by the number of fishing units, increased steadily since 1982, from 89 000 units, and then became stable around 141 000 units between 1987 and 1995 (Fig. 6.3). Of the fishing units, 86% use artificial shelters (“casitas”) and the remainder traps (“jaulones”). Jaulones are a type of trap equipped with large wings that guide lobsters inside when on their seasonal migrations in the autumn. In terms of CPUE for the south-west of Cuba, no long-term historical information was available at the workshops. Figure 6.2 shows the trend in CPUE for the last 12 years in terms of tonnes per days fished.

53
Figure 6.1 Reported landings (mt whole weight) for Belize, South Cuba and Mexico. 1997 landings for Quintana Roo are preliminary.
Belize Landings
0
200
400
600
800
1000
1200
1950 1960 1970 1980 1990 2000
Mexico Landings
0
300
600
900
1200
1500
1800
1950 1960 1970 1980 1990 2000
Q. Roo
Yucatan
Total
S. CUBA Landings
0
2000
4000
6000
8000
10000
12000
1950 1960 1970 1980 1990 2000

54
Figure 6.2 Long term series of nominal CPUE for the region. The longer series for Mexico corresponds to Quintana Roo and the shorter one to Yucatán.
Belize CPUE
0
200
400
600
800
1000
1200
1400
1960 1970 1980 1990 2000
Kg/fi
sher
Cuba CPUE
0
50
100
150
200
250
300
350
1960 1970 1980 1990 2000
Tonn
es /
days
fish
ed
Mexico CPUE
0123456789
10
1960 1970 1980 1990 2000
Tonn
es /
boat
or
Tonn
es /
boat
da
y

55
Figure 6.3 Number of fishing units deployed in the SW Cuba fishery, 1982-1995. The Cuban fishery can be subdivided into three main seasons:
• The “levante” season from June to September, during which catches come mostly from casitas.
• The “recalo” season, when catches predominantly come from traps. It is during this season lobsters start to migrate around October or November.
• The closed season when most recruitment takes place. During this period lobsters aggregate in the casitas spread throughout the fishing grounds.
The “levante” season is primarily the act of fishing on the new recruit aggregations and is characterised by a rapid decline in CPUE. The “recalo” season, which starts about 4 months after the fishing season opens, is triggered by the massive migrations of lobsters in response to environmental cues, such as cold fronts. Fishing in this last season is conducted with traps and jaulones.
6.1.3 Mexico Annual catch records are available for Quintana Roo, since 1955 (Fig. 6.1). These landings can be partitioned by zone (North, Central and South) from 1969 onwards. From the 1982/83 fishing season, through 1996, weekly and monthly records are available for trips by fishing cooperatives in the north and central zones. In addition, official landings data are available on a monthly basis, by zone, starting in 1982. The first three types of catch data were available during the workshop. Annual landings for Quintana Roo show a generally increasing trend for over 20 years (1965 to 1988, Fig. 6.1), reaching a maximum of 1177 tonnes (whole weight). Subsequently, landings fell sharply from 1989 to 1993, reaching a low of 420 tonnes. Thus, landings from the early 1990s are of similar magnitude to those of the early 1960s, when the fleet size was only one-half of the current size. For the region of Yucatán, official landings data for the period 1976-1996 are available (Fig. 6.1).
Nominal effort data are available for Quintana Roo, in number of boats and fishermen, from 1966 to 1994. Effort data in number of trips are available for several cooperatives and fishing locations in the north and central zones, starting in 1982/83. For the north zone, these data can be partitioned by gear type: traps, compressor, or diving. For the period 1990-1992, more detailed records are available, but fragmented in coverage: hours diving (south zone), and number of casitas visited (central zone). It should be noted that, for diving, effort measured by number of trips showed the same tendency as effort measured by hours diving (Sosa Cordero et al., 1993). Thus, measuring number of trips appears to be at least as useful
50
60
70
80
90
100
110
120
130
82 83 84 85 86 87 88 89 90 91 92 93 94 95
Artificial reefs 10^3
10
12
14
16
18
20
22
Traps 10^3
reefs
traps

56
as the more costly practice of measuring hours of diving. The available effort data for Quintana Roo indicate that nominal effort rose steadily between the 1960s and the 1980s. However, during the 1980s, there were changes to the fishing operations which imply greater fishing power, such as the consolidation of gear types that were first introduced during the 1970s (traps, SCUBA, compressors, casitas, etc.) and new boat types (fibreglass with outboard motors). At the same time, there was also an expansion in the fishing areas. All of this suggests that the effective fishing effort may have reached very high levels after the mid-1980s.
Limited effort data are available for Yucatán. The main type of fishing operation consists of a 24-foot boat with a compressor and one diver, fishing at about 2 knots for 6 hours. Approximately 400 such fishing units operate currently in Yucatán.
For Mexico, two historical series of CPUE were available. For the Yucatán coast in the period 1989-1995, CPUE was estimated from the daily catch by boat in one fishing zone, during the first month of each year’s fishing season (Fig. 6.2). For Quintana Roo, nominal CPUE (tonnes boat-1) shows a generally-decreasing trend from 1966 to 1995, a decrease from 8.5mt boat-1 to less than 1mt boat-1 (Fig. 6.2). Aside from suggesting a likely decline in relative abundance, this drop in CPUE is indicative of the recent decrease in yield (and utility) per unit of fishing. A decline of similar characteristics is also evident from the more detailed CPUE data available since the 1980s: in Bahía de la Ascensión (central zone), CPUE declined from 0.047mt trip-1 in 1986/87 to 0.031mt trip-1 in 1994/95; in Holbox (north zone), CPUE declined from 0.069mt trip-1 in 1983/84 to 0.016mt trip-1 in 1993/94.
6.2 FISHERIES-INDEPENDENT INFORMATION
6.2.1 Pueruli collectors Several collectors to catch the puerulus stage have been developed since 1987. Cuba used a Phillips collector (Phillips, 1972), modified by Cruz et al. (1991), to catch pueruli of P. argus. It consists of a triangular aluminium frame with channels which support three grey PVC sheets, 59 x 30 x 1.0 cm thick, covered with artificial seaweed. The collector is moored at the surface within the protection of coastal reefs. The collectors are checked after every new moon. The settlement index is calculated as the mean of the number of pueruli per collector month per season (Cruz et al., 1995). Details of sampling methodology are described by Cruz et al. (1991; 1995). The puerulus stage caught in the collectors has distinctive morphological characteristics compared to the post-puerulus stage. The puerulus stage is easily distinguished by the configuration of the coastal area (Phillips, 1972) and is completely transparent with only the eye pigmented. After one moult, the post-puerulus stage is distinguished by dark bands along the side of the body; on the legs, the dark bands are fragmented. The carapace length of the pueruli (sample of 225, mean 5.78 mm, SE 0.06, range 4.24 - 7.08 mm) is slightly smaller than the post-puerulus stage (829 sample, mean 6.99, SE 0.009, range 4.81 - 16.50) (Cruz et al., 1991). The juvenile, having undergone two or more moults, has the adult coloration. Any juveniles caught on the collectors are assumed to belong to the previous month.
Different regions in the Cuban archipelago with different hydrological and fishery characteristics were selected to examine pueruli and juvenile recruitment. The period of maximum recruitment of puerulus stage to the Cuban archipelago is from September to December. The monthly settlement of pueruli (1988-1994) shows a seasonal pattern that was very similar to all the locations in the archipelago.
Recent studies carried out on spiny lobster life cycles indicate that there is a close relationship between the level of pueruli settlement, as measured by collectors, and the abundance of recruits to the fisheries. This occurs about 1.5 years after settlement for Panulirus argus in Florida and Cuba (Forcucci et al., 1994; Cruz et al., 1991; Phillips et al., 1994a), after 2-3 years for the rock lobster Jasus edwardsii in New Zealand (Breen and

57
Booth, 1989) and after 3-4 years for Panulirus cygnus in Western Australia (Hancock, 1981; Morgan et al., 1982; Phillips et al., 1994a; Caputi et al., 1995).
In Quintana Roo, Mexico, there is information on the settlement of pueruli since 1987 for the Bahía de la Ascensión and the Central coast. Modified collectors of the Australian type have been used by the research group of the Instituto de Ciencias del Mar y Limnología (UNAM)-Estación Puerto Morelos. These data were not available at the workshop, but they can be obtained from recently published literature (Briones, 1994). Distinguishable features observed during the period 1987-1992 for a selected station include: a) pulses of settlement between third quarter and new moon, b) a consistent peak in autumn, and c) an increasing trend throughout the period (Briones, 1994).
6.2.2 Juveniles and Pre-recruits An index of juvenile abundance for SW Cuba is available since 1982, based on monthly monitoring of artificial concrete block reefs designed by Cruz et al. (1986a) and placed in a nursery area off the SE of Isla de la Juventud. Lobsters are caught by divers and the data collected include the number of juveniles (14-50mm CL) in each block structure and carapace length measurements for females and males. In addition, size distributions of pre-recruits, based on the number of lobster below the minimum legal size (69mm CL), have been obtained since 1993 from monthly monitoring of commercial catch at the artificial shelters known as pesqueros. The annual index of pre-recruits to the fishery was calculated as the average number of undersized lobster per pesquero per month (Cruz et al., 1995). According to the latter data set, peak recruitment to the SW Cuba fishery takes place in March-May, coinciding with the closed season (Fig. 6.4). There was a strong correlation between the juvenile (fishery-independent) and pre-recruit (from monitoring pesqueros) indices (r = 0.89, p < 0.005). This suggests that variation in the pre-recruits index could be explained by the estimates of juveniles. Moreover, the pre-recruit index from 1983/84 to 1988/89 was larger than that obtained from 1989/90 to 1991/92, a period when the recruitment fell to the lowest level of the last ten years.
Figure 6.4 Mean monthly index of recruits (lobsters <76 mm CL) in SW Cuba.
In Yucatán, Mexico, fishery-independent estimates of density were obtained for the Alacranes Reef area at the end of the 1996/97 fishing season, and for coastal areas at the start of the 1997/98 fishing season (Ríos et al., 1998; Zetina and Ríos, 1997). For the north of Quintana Roo, fishery-independent information have been collected (Nov 1993-Oct 1994) with artificial habitats (minicasita) in a nursery area (Arce et al., 1997). The highest values of the recruitment index were recorded during February-July, contrasting with low values observed during September-December. According to Arce et al. (1997), a likely population bottleneck affecting post-algal juveniles (26-35mm CL) is the scarcity of natural habitat offering shelter – hard bottom and patch reef (Arce et al., 1997).
0.0
0.1
0.2
0.3
0.4
0.5
J F M A M J J A S O N D
Inde
x

58
6.2.3 Tagging Between 1981 and 1985, fifteen thousand lobsters were tagged in Cuba (Buesa 1965; Cruz et al. 1986b). The data were used to estimate movement patterns, growth and natural mortality. In the north of Quintana Roo, Mexico, a tagging experiment on pre-recruits was used to estimate survival. Different estimation procedures applied to these data gave inconsistent results, such as an average survival of 0.5 month-1, and a natural mortality of 0.25 year-1 (Sosa Codero, in prep).
6.2.4 Environmental influences The intensity of the anticyclonic gyre created by the Cuban counter-current off the south coast, the general orientation of the Caribbean current from east to west (Emilsson, 1971; Garcia et al., 1991), and the high densities of larvae present in these areas (Baisre et al., 1978; Alfonso et al., 1991) suggest that this area may provide its own principle source of recruitment larvae. Therefore, the main variations in recruitment of pueruli to the Cuban coast are probably attributable to local oceanographic variations. Hernández and Puga (1995) show evidence of the influence of El Niño on ambient conditions and lobster catches in the SW Cuba region.
Cross correlation of environmental factors with puerulus settlement indicates that the variations in settlement into the different sites is probably attributed to the variability in the local effects of environmental factors which control flow rates and retention processes. The persistent anticyclonic gyre together with small and less persistent eddies close to the south coast, enable the retention and recruitment of larvae from different parts of the Caribbean, thus ensuring the recruitment of high numbers of pueruli to the south Cuban shelf. The high catches in these fishing grounds (80% of Cuba’s landings) support this hypothesis.
Various presentations made during the workshops suggest that hurricanes have a significant effect on lobster fisheries. Hurricane Gilbert of 1988 had a profound negative impact on subsequent lobster landings (primarily two years later) in the Yucatán and SW Cuba areas.
6.2.5 Other information In Cuba, the size and sex composition of the individuals that colonise the pesqueros are monitored. Lobsters from 20 to 170mm CL are found under the pesqueros, though occasionally post-puerulus from 12 to 15mm CL have been caught. A high colonisation rate occurs during the period of maximum recruitment (March-May) in the fishing areas (Cruz et al., 1991a). During these months, 40-50 % of the population in the fishing area are individuals lower than the legal minimum size (69mm CL). From, June to December, the mean size increases as the number of new recruits decreases. The number of lobsters found in the pesqueros is very variable and is likely to be a reflection of spatial differences in density, age structure, and the types of artificial shelters used. The mean size in a nursery area is significantly different between lobsters that colonise the pesqueros and lobsters that inhabit concrete blocks. Mean size of lobsters increases with depth of capture (r= 0.9262, P < 0.05) with the mean CL of males being significantly higher than that of females below 6m depth. The sex ratio of lobsters in the pesqueros does not differ significantly from 1:1, which is the same ratio as P. argus in natural shelters.
6.3 STOCK ASSESSMENT RESULTS AND STATUS OF THE STOCKS
6.3.1 Belize Length frequency samples were available for 1996 only. Attempts were made to estimate mortality rates with length-converted catch curves, length cohort analysis fitted to these data. In all cases, estimates of total mortality (Z) were between 1.3 and 2.2 year-1. The group noted that these estimates maybe unreliable due to small sample sizes and the possibility of lobster migration out of the sampled areas. However, the group stressed the importance of

59
continuing the data collection system in order to establish a long-term database, which could form the basis for more rigorous analyses on the status of the stock.
Time series of landings (from exports) are available since the 1930s. Rough effort estimates also are available for several time periods within this series (see CPUE in Fig. 6.2), so that a production model could be fitted. However, the group noted several sources of uncertainty that would make it undesirable to present any production model results based on these data alone. For example, the available time series of CPUE data for the 1970s-1980s suggests a continuous population decline. Since then, catches have continued to increase, but there is no recent historical information on catch rates to determine the rate at which the population has declined further. It was recommended that Belize seek ways to retrieve historical catch-effort records from the fishing cooperatives for further analyses such as effort standardisation. Thus, the available data was not sufficient to utilise for extensive stock assessment purposes.
6.3.2 Cuba Assessments for the south of Cuba were restricted to the region of the Gulf of Batabanó, which accounts for over 61% of the Cuban lobster landings. Two assessment approaches were used: a depletion model based on fishing seasons, and a calibrated sequential population analysis (SPA).
The fishery can be subdivided in three main seasons (see Section 6.2.2). Recruitment takes place primarily during the closed season, as lobsters aggregate in the “casitas”. A rapid decline in CPUE, due to “fishing out” these aggregations, characterises the “levante” season. Overall, catches have a tendency to decline during the levante season, increase sharply at the onset of the “recalo” season, and then continue to decline until the end of the fishing year. Figure 6.5 presents the CPUE data (thousand lobsters per days fished) by sex and fishing season. Note that CPUE observations are available for the closed season in years when some fishing was allowed.
Several types of seasonal depletion models were tested for these data. The working group settled on one that used three seasonal time steps: c (closure, duration of 3 months starting in March), l (levante, duration of 5 months), and r (recalo, duration of 4 months). Recruitment was assumed to take place as a single pulse during each closed season. Data were available for the 1982/83 to 1996/97 fishing years. These consisted of total catch and CPUE by sex for each fishing season, and a fishery-independent index of juvenile abundance. The latter index was lagged one year ahead for the purpose of fitting, i.e. assuming that the juvenile index in year t is related to recruitment in year t+1. The CPUE indices were assumed to be linearly related to abundance. The juvenile index was assumed to have a non-linear relationship with recruitment, as explained below. The basic population model equations were
N N R es s sZs
+−= +1 ( )
and
sz
sss ZeRNN s /)1)((2/1−
+ −+= where s stands for fishing season (c, l or r), N is stock size in numbers, Z is total mortality (F+M, with M=0.34 year-1), and R is recruitment which takes place only when s=c. For estimation purposes, it was assumed that the catches are exact, so that the population trajectory is completely determined by the values of the initial stock size (in the closed season of 1982), the observed catches, and each subsequent recruitment, Rc. Thus, the values of F were computed numerically so that the observed catch each season equalled
sZ
sss ZeNFC s /)1( −−= .

60
Figure 6.5. Observed (solid circles) and predicted seasonal CPUE series for SW Cuba. Predictions are from depletion models (squares) and from sequential population
analyses (diamonds). Bottom: Non-linear relationship between the observed fishery-independent index of juvenile recruitment and the estimated recruitment in the SPA or
depletion models.
Males
0
100200
300400
500
80 85 90 95 100Year
CPUE
(tho
usan
ds/d
ays
fishe
d)
ObserveddepletionSPA
0
100
200
300
400
500
80 85 90 95 100Year
CPUE
(tho
usan
ds/d
ays
fishe
d)
0
100
200
300
400
500
80 85 90 95 100Year
CPUE
(tho
usan
ds/d
ays
fishe
d)
Females
0
100
200300
400
500
80 85 90 95 100Year
CPUE
(tho
usan
ds/d
ays
fishe
d)
0
100
200
300
400
500
80 85 90 95 100Year
CPUE
(tho
usan
ds/d
ays
fishe
d)
0
100
200
300
400
500
80 85 90 95 100Year
CPUE
(tho
usan
ds/d
ays
fishe
d)
02000400060008000
100001200014000
0 10 20 30 40 50 60Juvenile index
Recr
uits
(tho
usan
ds)
0
5000
10000
15000
20000
0 10 20 30 40 50 60Juvenile index
Recr
uits
(tho
usan
ds)

61
The abundance index data were fitted to the model predictions in order to find the best parameter estimates:
2/1+= ccc NqCPUE ,
CPUE q Nl l l= +1 2/ , CPUE q Nr r r= +1 2/ ,
)ln(JIbaRc += .
Estimation was conducted by least squares after logarithmic transformation using an Excel spreadsheet. The objective function to be minimised was
∑ ∑∑ +t t
Rj
ss
s
nn 22
22εε ,
where the Εs are the loge(CPUE) residuals for each season, and ΕR denotes the log residuals between estimated recruitment and that predicted by the logarithmic equation above. Thus, the parameters estimated were the initial stock size (N at the closed season in 1982), recruitment each year between 1983 and 1996, the q values for each of the three CPUE series, and a and b in the juvenile index – recruitment relationship.
Figure 6.5 shows the fitted index values. There was generally good agreement between the observations and the predicted values, with relatively better fits for the recalo CPUE series. The (annual) estimated trends in recruitment, population size and fishing mortality are shown in Figure 6.6. These results are indicative of an overall decline in stock size and recruitment over time. Of particular interest is the low recruitment of 1990, which is thought to have occurred as a result of loss of appropriate juvenile nursery grounds with the passage of hurricane Gilbert in 1988.
The sequential population analysis was done with the same series of relative abundance data but partitioned into ages according to the observed catch-at-age. The method used is known as “ADAPT” (see Section 3: Methods) and consists of a VPA (backwards computation of fishing mortality and stock sizes) calibrated with the relative abundance data. The analyses were conducted with ages 2-7+ for each sex. A least squares objective function similar to the above was minimised in order to estimate the model’s parameters, consisting of catchabilities (q) for each series, and the age-specific fishing mortality values in the terminal year. In the analysis, it was assumed that the fishing mortality rate for the age 7+ group was 87.5% lower than that for age 6 throughout the years. This choice was made based on the group’s perception that older individuals are not fully available to the fishery. Time did not permit a treatment of the juvenile index that would be identical to that made during the depletion model analysis. In order to approximate the non-linear relationship between recruitment and the index, the index was subjected to a square root transformation before the analysis; the transformed index series was then assumed to be linearly related to recruitment. Figure 6.5 shows the fitted CPUE values from the SPA. The fits were very similar to those obtained with the depletion model.
Results of the SPA are presented in Figure 6.6 and in Table 6.1. Estimated trends in various quantities are very similar to those of the depletion analyses, but the SPA tended to estimate higher recruitment and population sizes. Also the SPA suggests that the declining trend in recruitment may be reversing in recent years, particularly for females. The group was unable to carry out sensitivity analyses and variance estimation to examine the robustness of this result. As such, estimates of the recent recruitment “rebound” from the SPA should be viewed as preliminary. Both sets of analyses suggest that fishing mortality has decreased over the time period examined. However, the fishing mortality appears to be increasing again in recent years.

62
Figure 6.6 Estimates of recruitment, stock size, and fishing mortality in the SW Cuba fishery using depletion models and sequential population analysis.
Figure 6.7 Estimated stock-recruitment data for SW Cuba from sequential population analysis (SSB = biomass of age 4+ females). The lines represent three alternative
stock-recruitment models. Figure 6.7 presents the estimated stock-recruitment data (spawning stock biomass in tonnes for females ages 4 and older, and recruits of both sexes combined) and models. Three alternative models were considered for the bioeconomic models of Chapter 9: a constant recruitment equal to the mean observed value, a fitted Beverton-Holt relationship, and a segmented model. The segmented model assumes that recruitment is constant and equal to the asymptote of the Beverton-Holt relationship for spawning stock biomass equal to or greater than the lowest observed value; for lower spawning stock biomass, recruitment falls linearly towards the origin.
Males
0
5000
10000
15000
20000
80 85 90 95 100
Year
Recr
uitm
ent
(thou
sand
s)
DepletionSPA
0
5000
10000
15000
20000
25000
30000
35000
40000
45000
80 85 90 95 100
Year
Popu
latio
n Si
ze (t
hous
ands
)
0.00
0.10
0.20
0.30
0.40
0.50
0.60
0.70
0.80
80 85 90 95 100
Year
Mea
n Fi
shin
g M
orta
lityFemales
0
5000
10000
15000
20000
80 82 84 86 88 90 92 94 96 98
Year
Recr
uitm
ent
(thou
sand
s)
DepletionSPA
0
10000
20000
30000
40000
50000
80 85 90 95 100
Year
Popu
latio
n Si
ze (t
hous
ands
)
0.00
0.10
0.20
0.30
0.40
0.50
0.60
0.70
0.80
80 85 90 95 100
Year
Mea
n Fi
shin
g M
orta
lity
0
5000
10000
15000
20000
25000
30000
0 2000 4000 6000 8000
SSB (tonnes)
Thou
sand
recr
uits

63
Table 6.1 Sequential population analyses estimates of fishing mortality and stock size for spiny lobsters in the Gulf of Batabanó, Cuba.
MALES FEMALES Population size (in thousands)
Age Year
2 3 4 5 6 7+ 2 3 4 5 6 7+
82 9013 4453 968 208 70 42 16330 10696 5477 2010 630 32283 9706 3923 964 243 91 57 17543 11459 5315 1863 608 37884 10896 4759 1037 256 95 65 16759 12302 6189 2167 669 40385 10469 5163 1155 271 102 70 15487 11764 6370 2297 730 43986 9290 4170 1064 298 106 74 15420 10808 5325 2031 694 47387 9666 4684 1297 344 131 79 14609 10860 5889 2289 800 54188 9709 4742 1205 355 134 92 11730 10270 5770 2337 784 55889 7538 4748 1422 379 151 95 11075 8227 5296 2352 914 61690 7762 3774 1261 401 155 108 10439 7823 4444 1993 817 66591 8023 4817 1712 514 195 123 9642 7394 4928 2429 986 78192 7220 4736 1787 538 207 133 9247 6820 4403 2332 975 77493 6909 4390 1809 584 225 146 9796 6555 4212 2074 920 75894 6389 4282 1710 623 258 167 11143 6952 4127 2051 801 72395 6321 3903 1597 482 238 168 11036 7905 4403 1982 760 54896 5928 3540 1184 446 208 193 13695 7816 4775 1983 681 45297 3134 974 333 211 217 9699 4594 2194 737 448
Fishing mortality rate 2 3 4 5 6 7+ 2 3 4 5 6 7+
82 0.49 1.19 1.04 0.49 0.35 0.31 0.01 0.36 0.74 0.86 0.61 0.5383 0.37 0.99 0.99 0.60 0.52 0.45 0.01 0.28 0.56 0.69 0.58 0.5184 0.41 1.08 1.00 0.58 0.51 0.45 0.01 0.32 0.65 0.75 0.58 0.5185 0.58 1.24 1.01 0.59 0.53 0.47 0.02 0.45 0.80 0.86 0.60 0.5286 0.34 0.83 0.79 0.48 0.50 0.44 0.01 0.27 0.50 0.59 0.45 0.4087 0.37 1.02 0.96 0.60 0.51 0.45 0.01 0.29 0.58 0.73 0.57 0.4988 0.38 0.86 0.82 0.52 0.55 0.48 0.01 0.32 0.56 0.60 0.46 0.4189 0.35 0.99 0.93 0.55 0.52 0.45 0.01 0.28 0.64 0.72 0.52 0.4690 0.14 0.45 0.56 0.38 0.44 0.39 0.00 0.12 0.26 0.36 0.32 0.2891 0.19 0.65 0.82 0.57 0.56 0.49 0.01 0.18 0.41 0.57 0.51 0.4592 0.16 0.62 0.78 0.53 0.53 0.47 0.00 0.14 0.41 0.59 0.53 0.4693 0.14 0.60 0.73 0.48 0.48 0.42 0.00 0.12 0.38 0.61 0.53 0.4794 0.15 0.65 0.93 0.62 0.62 0.54 0.00 0.12 0.39 0.65 0.73 0.6495 0.24 0.85 0.94 0.50 0.42 0.37 0.01 0.16 0.46 0.73 0.76 0.6796 0.30 0.95 0.93 0.41 0.32 0.23 0.01 0.19 0.44 0.65 0.60 0.57
The estimated fishing mortality values from the SPA and the Beverton-Holt relationship were used to compute equilibrium yield (see Section 3: Methods). The per-recruit computations were carried out to age 15, assuming that ages 8+ had equal selectivity to age group 7+. Growth was assumed to follow the relationships estimated by de Leon (see Chapter 3). Figure 6.8 presents the sex/age-specific fishing mortality vectors (the average of the last 2 years in the SPA) and the resulting equilibrium yield curves expressed as a function of the current (1995-1996) fishing mortality.
The equilibrium yield curves in Figure 6.8 suggest that the F producing maximum sustainable yield (FMSY) may be 25% below the current F level. Considering this result, and considering the declining levels of recruitment estimated for the last decade, there is cause for concern about the status of the resource. It is possible that the reduction in fishing mortality achieved throughout the 1990s has not been sufficient to prevent further declines in recruitment. Although the results of the SPA and the juvenile index suggest that recruitment levels may be starting to rebound, it seems prudent to exert further controls to protect the stock. This

64
could be achieved, for example, by a lengthening of the closed season with the proviso that fishing effort be controlled. Such a measure could potentially reduce fishing mortality and improve yields through the protection of recruits.
Figure 6.8. Equilibrium yield analysis for SW Cuba. Top: Input fishing mortality vectors at age. Bottom: Equilibrium yield as a function of the multiplier of the fishing mortality
vectors in the top figure. It should be noted that, due to insufficient time, the group was unable to carry out an analysis of uncertainty. It is recommended that further analyses be made in order to estimate the uncertainty in stock status and relevant biological reference points. This would permit a more detailed evaluation of management options in the context of a risk-averse (precautionary) approach.
6.3.3 Mexico Separate analyses were conducted for various regions using different methods, depending on data availability. The analyses are presented below in geographical sequence, from the south-central area of Quintana Roo, to Northern Quintana Roo (Isla Mujeres and Holbox), to Yucatán. With the exception of the annual addition of recruits into each area, all of the models utilised assume that the populations are closed. This assumption may be unreasonable given the known migratory behaviour of adult lobsters and the short distances that separate some of the areas examined. With this caveat in mind, the results of these assessments should be taken as being preliminary. Some attempt should be made to define “unit stocks” on the basis that such definitions will (a) minimise potential biases due to violations in the closed population assumption (or, alternatively, account explicitly for migration between sub-areas in spatially-structured models), (b) encompass populations that will behave more or less uniformly in response to exploitation, and (c) encompass populations that could be effectively monitored and managed as separate units.
0.0000
0.2000
0.4000
0.6000
0.8000
1.0000
0 5 10 15Age
Fish
ing
mor
talit
ymalefemale
0
1000
2000
3000
4000
5000
6000
7000
0 0.5 1 1.5 2Fishing mortality multiplier
Equ
ilibr
ium
yie
ld (m
t) malefemaletotal

65
6.3.3.1 South-central Quintana Roo
Figure 6.9 Observed (circles) and predicted CPUE from the depletion model applied to Bahia Ascension, Mexico.
Monthly records of catch (in weight) and effort (trips) were available for the 1981/82 to 1995/96 fishing years in Bahia Ascencion. This fishery presents an excellent opportunity for depletion model analyses as it is thought to be a closed population after recruitment. A depletion model like that used for SW Cuba (previous section) was used, but with monthly time steps instead of seasonal ones, and assuming recruitment takes place in June of each year, as suggested by the observed CPUE trends (Figure 6.9). Natural mortality was assumed to be 0.35 year-1. The CPUE data were log transformation and the model fitted with least squares in a spreadsheet. The fitted CPUE are also shown in Figure 6.9. The model was unable to correctly explain the very high CPUE observed at the start of the fishing season in many years. However, it seems to capture the trend in CPUE adequately. Note that the depletion model assumes that the catch and CPUE data are in numbers, but weights were used instead. This problem could not be circumvented because no average weight data were available to make conversions. However, the biases introduced by this problem may be relatively minor because all the landings are restricted to small lobsters.
Figure 6.10 Results from the annual recruitment index model applied to south-central
Quintana Roo.
0
5
10
15
20
25
30
35
40
1981 1983 1985 1987 1989 1991 1993 1995 1997Year
CP
UE
0
20
40
60
80
100
1980 1985 1990 1995Year
Recr
uitm
ent I
ndex
0
5
10
15
20
1980 1985 1990 1995Year
CPUE
00.2
0.40.60.8
11.2
1980 1985 1990 1995Year
Fish
ing
mor
tality
0100
200300
400500
600
1980 1985 1990 1995Year
Catc
h

66
Figure 6.11 Results from the monthly depletion model applied to Isla Holbox, Mexico The recruitment estimates from the monthly depletion model were used as a recruitment index in a depletion model (using the CEDA package, MRAG 1992) with annual catch and effort data from a wider region, comprising the central and southern areas of Quintana Roo. The results suggest that fishing mortality has declined during the time period examined while stock size has been relatively stable (Fig. 6.10). The most recent (1995) estimate of F is about equal to the assumed value of natural mortality, suggesting that lobsters in the area are not very highly exploited.
6.3.3.2 Northern Quintana Roo A depletion model based on monthly data was fitted for Isla Holbox (1983-1995 fishing years). As with the Bahia Ascencion analysis, above, catch and CPUE data were in biomass units. The Holbox fishery is similar to that in SW Cuba in that CPUE increases greatly during lobster migration. The model fitted to these data assumed that recruitment took place annually at the onset of increased CPUE, typically in the winter months when the cold fronts begin. The main purpose of these analyses was to obtain an index of recruitment that could be used in subsequent analyses for the Isla Mujeres fishery.
Figure 6.11 presents the observed and predicted CPUE, as well as the estimated F, recruitment and total population size (biomass) trajectories. These results suggest that stock size has been declining as fishing mortality has increased up to levels around 0.7 year-1. Note, however, that the results may be quite sensitive to the lack of mean weight information that could lead to analyses based on numbers.
An age-structured (SPA) analysis of the fishery in Isla Mujeres was conducted with data from 1983 to 1985. Two series of CPUE (hookah and scuba) were used as indices of population abundance (all ages, in biomass). Another series, for trap CPUE, was not used in the analyses because the group felt it was inferior to the others as an index of relative abundance. The calibration procedure was the same as that used for the SPA of the SW
05
10152025303540
1983 1985 1987 1989 1991 1993 1995 1997Year
CPU
E
0
50
100
150
200
250
1983 1988 1993
Year
Popu
latio
n si
ze
NbarRecr
0
10
20
30
40
50
60
70
80
1983 1988 1993Year
Catc
h
0
0.2
0.4
0.6
0.8
1
1.2
F
catchF

67
Cuba data, except that the ratio of the F at age 7+ relative to F at age 6 was assumed to equal 0.65 every year. This choice was based on the residual patterns from several trial runs.
Two sets of SPA were run using alternative indices of recruitment (i.e. age 2 lobster). Initially, the recruitment estimates from the depletion model applied to Bahia Ascencion were used. These results, not presented here in any detail, were used as inputs to the bioeconomic model of Section 9. Subsequently, it became apparent that the back-calculated recruitment values from the VPA were much more consistent with the recruitment estimates from Holbox than they were with the recruitment estimates from Bahia Ascencion. Given that Holbox is adjacent to Isla Mujeres, the second set of analyses was undertaken using the Holbox results as a recruitment index.
Figure 6.12 presents the observed and predicted indices of abundance for each of the sex-specific analyses. Results of the SPA are presented in Figure 6.13 and Table 6.2. These results suggest a population decline throughout the period, consistent with the trends in CPUE. Fishing mortality shows a peak in 1989 with a subsequent decrease and then an increase in the two most recent years. The group was unable to investigate the precision of the very high value of fishing mortality for females in 1995. It is possible that these data exhibit a retrospective pattern in which the more recent values maybe over (or under) estimated as more data are added. Nevertheless, it appears that both spawning biomass and recruitment have been declining (Figure 6.13) while current F levels are high for females.
An equilibrium yield analysis, similar to that of SW Cuba, was done using the SPA results and the fitted stock-recruitment relationship in Figure 6.13. Figure 6.14 shows the input fishing mortality vectors (the average of the last 3 years in the SPA) and the resulting equilibrium yield curves as a function of the multiplier of the current fishing mortality.
These analyses suggest that the stock may be able to withstand much higher levels of fishing mortality than currently exerted. This result is reasonable on the basis of the input data alone, in that the estimated selectivity pattern targets primarily mature individuals. Thus, lobsters would be able to reproduce at least once before becoming available to the fishery. However these results must be viewed with caution because it is not clear that the Isla Mujeres fishery is a closed population as assumed by the SPA. In addition, it is also possible that the results may be biased due to under-reporting of catches. It is likely that an improved

68
Figure 6.12 Observed and predicted indices of abundance in the SPA applied to Isla Mujeres, Mexico
understanding of spiny lobsters in the area would be obtained by jointly analysing the Holbox, Isla Mujeres and adjacent areas, possibly including Yucatán.
Scuba CPUE
0
5
10
15
20
82 84 86 88 90 92 94 96Year
Inde
x
OBS PRED FEMPRED MAL
Hookah CPUE
0
5
10
15
20
82 84 86 88 90 92 94 96Year
Inde
x
OBS PRED FEMPRED MAL
Recruitment index
0
0.5
1
1.5
2
2.5
82 84 86 88 90 92 94 96Year
Inde
x
OBS PRED FEMPRED MAL

69
Figure 6.13 Results of the SPA applied to Isla Mujeres, Mexico. The lower-right figure shows the estimated stock-recruitment relationship
Figure 6.14 Equilibrium yield analysis for Isla Mujeres, Mexico. Top: Input fishing mortality vectors at age. Bottom: Equilibrium yield as a function of the multiplier of the
fishing mortality vectors in the top figure.
0
200
400
600
800
1000
1982 1987 1992Year
Rec
ruits
(100
0s)
malefemale
0
500
1000
1500
2000
2500
3000
3500
1982 1987 1992Year
Popu
latio
n si
ze (1
000s
)
00.20.40.60.8
11.21.41.61.8
1982 1987 1992Year
Fish
ing
mor
talit
(4+)
0
200
400
600
800
1000
1200
1400
0 50 100 150 200 250 300SSB (tonnes)
Rec
ruits
(100
0s)
0
0.2
0.4
0.6
0.8
1
1.2
1.4
0 5 10 15Age
Fish
ing
mor
talit
y
malefemale
0
50
100
150
200
250
300
0 0.5 1 1.5 2Fishing mortality multiplier
Equ
ilibr
ium
yie
ld (m
t)
malefemaletotal

70
Table 6.2 Sequential population analyses estimates of fishing mortality and stock size for spiny lobsters in Isla Mujeres, Mexico. MALES FEMALES
Population size (in thousands) Age Year
2 3 4 5 6 7+ 2 3 4 5 6 7+
83 897 699 653 300 157 257 745 528 342 158 55 1684 746 628 463 431 182 250 645 521 346 209 68 1485 549 524 408 290 273 267 536 452 328 196 103 2386 566 383 328 247 167 348 427 374 282 184 90 5487 613 396 240 198 142 306 428 298 230 152 71 4688 570 427 244 143 120 286 470 298 183 132 75 5289 559 394 256 138 73 232 435 320 170 87 52 4390 393 382 219 152 79 165 343 295 174 81 27 2291 401 272 234 127 91 147 319 236 176 90 32 1492 474 280 167 143 77 155 336 222 146 96 40 1793 709 332 180 100 88 152 529 236 139 80 40 2494 395 498 221 108 57 156 324 371 154 80 35 2795 443 278 339 139 63 132 366 228 250 89 34 1996 312 187 221 79 108 0 257 151 155 5 6Fishing mortality rate 2 3 4 5 6 7+ 2 3 4 5 6 7+ 83 0.0071 0.0633 0.0649 0.1495 0.1994 0.1276 0.008 0.073 0.143 0.489 1.390 0.889 84 0.0039 0.082 0.1175 0.1053 0.1660 0.1063 0.006 0.111 0.216 0.363 0.977 0.625 85 0.0091 0.1189 0.1519 0.1989 0.1098 0.0703 0.009 0.122 0.228 0.435 0.536 0.343 86 0.0079 0.1203 0.1522 0.2038 0.2264 0.1449 0.011 0.135 0.268 0.601 0.917 0.587 87 0.0121 0.1357 0.1674 0.153 0.1324 0.0847 0.014 0.135 0.205 0.357 0.548 0.351 88 0.0181 0.163 0.2165 0.322 0.2814 0.1801 0.034 0.210 0.392 0.590 0.887 0.568 89 0.0309 0.2399 0.1726 0.2079 0.3672 0.235 0.040 0.258 0.393 0.811 1.362 0.872 90 0.0197 0.1394 0.1943 0.1582 0.2051 0.1312 0.024 0.164 0.315 0.571 1.132 0.725 91 0.0084 0.1377 0.1401 0.1488 0.1025 0.0656 0.012 0.129 0.258 0.459 0.707 0.453 92 0.0037 0.0947 0.1627 0.1384 0.1014 0.0649 0.005 0.118 0.252 0.516 0.592 0.379 93 0.0024 0.0584 0.1556 0.2174 0.1011 0.0647 0.005 0.079 0.201 0.473 0.606 0.388 94 0.0007 0.0344 0.1106 0.188 0.1776 0.1137 0.001 0.043 0.195 0.506 0.979 0.627 95 0.0009 0.0465 0.0775 0.2181 0.2873 0.2163 0.002 0.061 0.128 2.613 1.985 1.495
6.3.3.3 Yucatán As mentioned earlier, the available time series of CPUE data for Yucatán is rather short (annual data for 1989-1997) and contains little contrast (Figure 6.3) that would permit the use of methods such as those outlined above. A tentative assessment was performed with a dynamic biomass model using a Bayesian approach. The model used was (Punt and Hilborn, 1996; Gonzalez-Cano and Restrepo, 1998):
By+1 = By + g(By) - Cy
with g(By) = rBy(1-(By/B∞)), and B0 = p B∞ (i.e. p represents the fraction of the virgin biomass at the start of the time series in 1976. Data used were the fishing season catch series (tonnes whole weight) 1976 to 1997 and the CPUE in the first month of each season between 1989 and 1997. A log-normal likelihood function was used:
L(B∞, r, q, p | Data)= Π (1/√2*s2*π)*EXP {-((loge(Uobs)- loge(Uexp))2/2*s2)}
where Uobs and Uexp are observed and expected CPUE. Uniform priors B∞ = 0 to 105000mt, r = 0 to 0.4 year-1, q = 4.7 10-7 to 1.4 10-6, p = 0.2 to 1 were used. The results, for the range of priors used, give posterior means as follows: B∞ = 40000mt, r = 0.23, q = 1.01 10-6 and p =

71
0.6. The posterior mean MSY was 801mt. These posterior mean estimates were similar to the estimation obtained in Rios et al. (1998) with a shorter time series (1976 to 1995).
These results may be sensitive to the choice of priors, particularly since the data contain very little contrast. Still, the results suggest that historical landings may have been below MSY levels.
6.3.4 Regional A rigorous overall assessment for the region examined by the working group covering Belize, Mexico and South Cuba was not attempted because there was a lack of understanding about the mechanisms (e.g. larval dispersal, adult migration) connecting the various areas. However, it was mentioned that certain types of analyses could be useful in combining multiple series of data. As an illustration only, a dynamic production model of the Fox-type was fitted simultaneously to data from Belize, Quintana Roo, Yucatán, and the south of Cuba (with the long-term annual catch and CPUE data mentioned in section 6.3). The landings data were in tonnes whole weight starting in 1950, and there was a CPUE series for each area: 1965-1985 for Belize (tonnes per boat-day), 1966-1995 for Quintana Roo (tonnes per boat), 1989-1997 in Yucatán (tonnes per boat-day), and 1983-1996 for the south of Cuba (tonnes per day fished). The model was fitted assuming a common intrinsic rate of growth, r, in all areas, and separate carrying capacities (K) for each area. It was assumed that all 4 stocks were in equilibrium at a biomass corresponding to the catch levels in 1950.
The model estimated a rate of growth of r=0.20 and MSY values of (in tonnes whole weight):
Belize 733
Quintana Roo 634
S. Cuba 9341
Yucatán 715
Regional total 11424
These results should be considered as preliminary because the CPUE series have not been standardized and thus some of the effort values used may not be good measures of effective effort. Nonetheless, the results suggest that similar approaches could be explored as a useful tool for broader analyses in the future.
Figure 6.15 Normalised recruitment series estimated for three sub-areas in the region: Gulf of Batabanó (Cuba), Bahia Ascension (Mexico) and Isla Mujeres (Mexico)
A comparison of recruitment trends in the various areas was attempted. Figure 6.15 shows the available estimates for Bahia Ascencion and Isla Mujeres in Mexico, and the Gulf of Batabanó in Cuba. All series were normalised to have zero mean and unit variance. The
-2-1.5
-1-0.5
00.5
11.5
22.5
1982 1986 1990 1994Year
Nor
mal
ised
recr
uitm
ent B Ascension Isla Mujeres G. Batabano

72
recruitment series for Holbox was not included because it was already used in calibrating the Isla Mujeres SPA. The figure suggests that all three areas have undergone similar recruitment fluctuations (primarily a decline) over the last 15 years. This observation gives support to the hypothesis that the areas examined may be affected by similar mechanisms that affect recruitment, e.g., through larval dispersal. However, the group’s understanding of such mechanisms is very limited at the moment. Nevertheless, this should be further investigated to allow for a regional assessment in the future, perhaps including other areas as well.
6.4 CONCLUSIONS AND RECOMMENDATIONS Much progress was made during the two workshops, leading to several sub-regional assessments. However, much work also remains to be done in order to improve upon these assessments, or to carry out new ones.
One common assumption in the analyses presented above is that the CPUE series used are indices of relative abundance. No detailed (disaggregated, e.g. by trip) catch and effort data were available at the workshops to permit effort standardisation analyses which might account for changes in gear efficiency or spatial differences. Thus, the analyses presented above represent what could be achieved with the data at hand. It is evident that most countries in the region are not collecting disaggregated catch and effort data to monitor the many fisheries in the region. The routine collection of such data could greatly improve the stock assessments. As well, fishery-independent information can play an important role in monitoring trends in abundance. The monitoring of juveniles in southern Cuba is a good example of how such an index can be used, not only to calibrate the assessment, but also as a metric of future recruitment into the fishery. While generally expensive and tedious to collect, fishery-independent data have many obvious benefits.
Another common assumption in the assessments presented above is that of closed (adult) populations. As mentioned in the section for the assessment results in Mexican sub-areas, such an assumption may be untenable when small areas are analysed separately. The group’s choices of what areas would be analysed were largely dependent on data availability. In the future, working groups wishing to assess these stocks should look at the feasibility of combining data sets in what may comprise more meaningful management units.
6.4.1 Belize In Belize, fishing for Lobster is regulated by the Fisheries Act of 1948, and includes the regulations given in Chapter 10. A measure of compliance is not available at this time. However, from local and regional information it is known that illegal fishing activity is prevalent from both local and foreign fishers. The effectiveness of the Conservation Compliance Unit within the Belize Fisheries Department is greatly lessened by logistical difficulties (boat availability, fuel, adequate staffing etc.).
6.4.2 Cuba Lobster management regulations in Cuba (see Chapter 10), are adhered to rigorously, and enforced by a fisheries inspection unit. Management is adaptively including catch forecasts based on indices of puerulus settlement and juvenile abundance. Nevertheless, we need more stock assessment work and more life cycle research for improving the management system.
6.4.3 Mexico In Mexico, regulation is implemented through permits and concessions issued to fishing co-operatives. A list of conservation measures for Mexico is given in Chapter 10. In the central zone of Quintana Roo (Bahias de la Ascención y Espíritu Santo) the possibility of decreasing the minimum size from 82.5mm CL to 74mm CL is being studied.

73
The Alacranes Reef (in Yucatán), which provides 15% to 25% of the state’s landings, was declared National Park in 1994. A management plan for this zone is currently being revised, providing for a core of no fishing and a buffer zone. Some management measures in Yucatán are not enforced, such as the minimum size (in 1996, 28% of the catch corresponded to sub-legal lobsters).
In Quintana Roo, as well, more attention needs to be given to the implementation of management regulations. The presence of tourist developments in parts of the north zone provides an incentive for the sale of undersized lobsters, and of fresh lobsters during the closed season, to restaurants. However, the closed season regulation is reasonably adhered to in other parts of the north zone (Isla Holbox) and in the central and south zones. Adherence to the minimum size regulation needs to be evaluated critically. Enforcement of measures prohibiting the capture of berried females is more difficult to implement and enforce, partly due to the predominance of fishing with hooks. In general, an improved enforcement system is necessary, perhaps based on increased sanctions for infractions. In addition, the high level of fishing effort suggests that serious consideration should be given to effort controls, in addition to the existing biological conservation measures.

74
7 REGION 3: NICARAGUA, HONDURAS, COLOMBIA AND JAMAICA
R. Barnutti, J. Gallo, J. Gonzalez Cano (Group Leader), S. Grant, R. Gutierrez, A. Irias, M. Pérez, J. Rodriguez and M. Suazo
7.1 FISHERIES INFORMATION AND MONITORING PROGRAMMES
7.1.1 Catch Sampling Age slicing methods were used to generate the age structure compositions from the fishing grounds in each country. The aim was to compare the ages of individuals being fished in the different sites of the Honduras-Nicaragua-Colombia Platform. Considering the similarity of the size structures to those of the Cuban platform, the Cuban method was utilised. It was then possible to compare the different age compositions in the different areas, including Jamaica. Similar patterns were observed for the three countries in spite of the variations (Fig. 7.1).
Figure 7.1. Panulirus argus proportions by age on the Honduras-Nicaragua-Colombia Platform. Similar proportions are also found in waters of Jamaica.
The resulting age structures were based on growth parameter estimates adopted by the group (K=0.23, 0.21 year-1; L∞=180, 163mm and t0=-0.841, -0.950 years for males and females, respectively). These were used by the four countries, and thus the estimated ages were very dependent on this assumption. More work will have to be done on growth to obtain better estimates. It was observed that selectivity for larger individuals in Nicaragua is related to the depth and the longitudinal gradient. This is corroborated by Arango and Márquez (1993) in the area where the Colombian fleet operates, where the average size of individual is: males (108mm CL) and females (97mm CL).
7.1.2 Catch Availability of catch data has been one of the biggest problems for the assessment of the lobster fisheries in this area. The catch history for countries other than Nicaragua exists only
0
0.1
0.2
0.3
0.4
0.5
0.6
0 1 2 3 4 5 6 7 8 9
Age
Prop
ortio
n

75
Figure 7.2 Selectivity curves (cumulative proportion) of lobsters caught by different
fleets along the depth gradient very recently, and it was necessary to assess the reliability of those data which were available.
7.1.2.1 Nicaragua Five fleets operate in the Caribbean platform of Nicaragua: trap-artisanal, SCUBA-artisanal, SCUBA-industrial, trap-national-industrial and trap-foreign-industrial. These differ in the areas of operation (depth), type and number of gear. Annual catch records are available since 1964 (Table 7.1) but these data do not include information on gear type. Figure 7.3 shows the catches for period 1964-1997 for the national and foreign industrial fleets and the artisanal fleet.
It is important to point out that since the 1990s, the artisanal SCUBA and industrial SCUBA fleets combined are producing larger catches than the industrial fleets taken separately. When the production for both industrial fleets are aggregated, catches range from almost 300% down to 50% higher. This indicates that in recent years catches from the industrial SCUBA fishery have increased substantially.
In Honduras and Colombia annual catch records were available for the period 1979-1996. For Honduras, however, it was not possible to determine how reliable catches were, except for the period 1993-1996 in which catches were recorded by the Central Bank. Catches before this period were provided by the Fisheries General Director (DIGEPESCA), but they may be unreliable. For Colombia, catches were disaggregated into those from the area of Luna Verde on the platform, and those from other areas around the country.
0
0.2
0.4
0.6
0.8
1
1.2
65 75 85 95 105 115 125 135 145 155 165 175 185 195Carapace Length (mm)
Prop
ortio
n
SCUBA.Ind.Fleet
SCUBA Art.Fleet
Trap Art. Fleet
Trap.Ind.Fleet

76
Table 7.1.Catches in the Honduras-Nicaragua-Colombia Platform and estimates of catches in Pedro Bank and southern shelf of Jamaica (tonnes whole weight).
Jamaica Honduras Colombia Nicaragua Platform OutliersPlatform Pedro
Bank South Shelf
1962 729.79 437.87 291.92
1963
1964 294.89
1965 342.27
1966 451.36
1967 552.27
1968 501.82 292.68 175.61 117.07
1969 485.45
1970 590.59 590.59
1971 372.86 372.86
1972 508.08 508.08
1973 689.13 689.13 455.56 27.34 182.22
1974 1295.04 1295.04
1975 2493.16 2493.16
1976 3059.78 3059.78
1977 3428.65 3428.65
1978 3890.92 3890.92
1979 11.697 2667.49 2679.19
1980 2575.91 16.05 2226.40 4818.37
1981 2958.91 6.801 1348.55 4314.27 231.11 138.67 92.44
1982 2800.27 15.51 1239.69 4055.46 230.00 138.00 92.00
1983 4419.95 29.40 1317.53 5766.88 400.00 24.00 160.00
1984 6590.96 204.56 1215.49 8011.01
1985 6819.75 107.18 985.78 7912.70
1986 7180.19 64.74 777.81 8022.74 550.00 330.00 22.00
1987 5235.26 628.38 550.32 6413.96
1988 5235.26 347.92 1022.59 6605.77 1370.51
1989 5235.26 542.69 1390.60 7168.55 1933.30
1990 5483.56 699.11 903.35 7086.01
1991 6723.44 418.10 1239.10 8380.64
1992 5088.36 300.32 2319.34 7708.02
1993 2990.41 264.41 2136.46 5391.28 150.00 90.00 60.00
1994 3069.84 148.74 2741.18 5959.76 214.50 128.70 85.80
1995 3745.00 231.55 4126.46 8103.02 350.22 210.13 140.09
1996 4194.31 188.70 4357.00 8740.01 405.50 81.10 324.40
1997 3154.58 216.04 4772.7 8143.35

77
Figure 7.3 Catches for the different fleets in Nicaragua, 1964-1996. At a regional level, it was important to estimate the catch history of the Honduras-Nicaragua-Colombia platform. This is because it is believed that during the recent war in Nicaragua, catches were taken from different areas of the entire platform and that, although in Nicaragua effort decreased during the 1980s, the stock was still subject to fishing. One very important objective was to generate, with the data available, the catch history up to 1997 for the entire platform. Previously Ehrhardt (1994) estimated the catch history using imports to the USA, but only for 1958-1990. In this last workshop, imported catches in the USA from these three countries, for 1978-1997, were compared with those reported in each country. For Honduras, comparison of US imports to catch records of the Central Bank showed no significant differences (1993-1997). As expected, records from the Central Bank were slightly higher than the imports. However, records provided by DIGEPESCA between 1979 and 1997 differed significantly for the period 1979-1989. It was decided that imports to the USA before 1993 would be taken into consideration and those from the Central Bank for period 1993-1997. The same procedure was followed for Nicaragua and Colombia. In both cases, there were small differences, but where possible catches reported in each country were used rather than US imports.
There are two problems with the way catch is recorded, which need to be considered carefully and solved as soon as possible. Firstly, imports are registered in different landed forms and it was necessary to convert landings to catches in whole weight. Accurate conversion factors are required to improve catch estimates. Secondly, there are two very low data points, which need to be explained. According to the group, these values are erroneous and thus a smoothing procedure was followed to derive an estimate of the true values. Table 7.1 and Figure 7.4 show catches of each country and the resultant catch history for the platform. This catch time series best represents the dynamics of the fishery and its current status at the platform level. According to this series, before the war in Nicaragua, the fishery had fully developed and was entering the stage of stabilisation. However, the war may have had an effect in delaying this transition. The increment of catches and effort in Nicaragua indicates that this stabilisation period has again been reached.
0
1000
2000
3000
4000
5000
6000
1964
1966
1968
1970
1972
1974
1976
1978
1980
1982
1984
1986
1988
1990
1992
1994
1996
Year
Cat
ch (t
onne
s w
hole
wei
ght)
National Ind. F.Foreign. I. FArtisanalOthersAll FleetForeign & Nat.I.F.

78
For the entire platform, results during this last work session indicate that the Average Maximum Catches (AMC) for the whole period is 5023 tonnes (whole weight) and for the stable period (1985-1997) is 7283 tonnes whole weight. During 1990-1997 the percentage of contribution of each country to total catches is shown in Table 7.2.
Figure 7.4. Time series of catches of Honduras, Nicaragua and Colombia and for the entire platform, 1970-1997.
Table 7.2. Percentage of catches taken from the shared platform by country.
Honduras Colombia Nicaragua 1990 77.39 9.87 12.75 1991 80.23 4.99 14.79 1992 66.01 3.90 30.09 1993 55.47 4.90 39.63 1994 51.51 2.50 45.99 1995 46.22 2.86 50.93 1996 47.99 2.16 49.85 1997 43.86 3.00 53.13
Average (%) 58.58 4.27 37.14
On the other hand, in Jamaica, there are sporadic catch data since 1962. Historically, the Fisheries Division did not systematically collect lobster landings. For several years, sample surveys were conducted which were used to estimate the total landings. Since 1995, with assistance from CFRAMP, the Fisheries Division began a data collection programme. A focused lobster data collection programme began in September 1996, which was revised after the last lobster workshop in April 1997. This present programme covers (1) South Shelf and (2) Pedro Bank. Unfortunately, very little data is being collected on the Pedro Bank, which is important to the Honduras, Nicaragua and Colombia Platform. It is estimated that in
0
1000
2000
3000
4000
5000
6000
7000
8000
9000
10000
1962
1964
1966
1968
1970
1972
1974
1976
1978
1980
1982
1984
1986
1988
1990
1992
1994
1996
Year
Tons
(who
le w
eigh
t) HondurasColombiaNicaraguaPlatformOutliers

79
the early years, Pedro Bank contributed 60% of the total landings (Fig. 7.5; Table 7.1). In 1996-1997 the contribution decreased to only 20% of total lobster landings. Since 1997 total landings by gear type have been recorded.
Figure 7.5 Time series of estimated catches on the Pedro Bank, the Southern shelf and for all Jamaica, 1962-1997.
7.1.3 Effort In Nicaragua nominal effort (number of boats) for the National Industrial Trap Fleet exists on an annual basis (1970-1997). For the Foreign Industrial Trap Fleet, this is only available since foreign vessels could be licensed in 1987. For both these fleets, the accumulated effective fishing days per month is also available between 1992-1997. Figure 7.6 shows fishing effort for 1992-1997. The effort applied still needs to be checked before conducting further analysis, as some data suggest greater effort than the number of licensed vessels could exert on a monthly basis. Nevertheless, the series was filtered to represent the effort being applied during this period by the foreign trap, national trap and SCUBA industrial fleets.
Figure 7.6 also shows that the SCUBA industrial fleet effort has been increasing at a rate of 50% a year from 1993 onwards. This can only be explained if more boats have entered the fishery.
This sort of descriptive analysis can not be undertaken for Honduras, where effort has only been recorded for the period 1996-1997, as 182 vessels (88 industrial trap vessels, 87 SCUBA diving industrial vessels and 7 combining both characteristics). Unfortunately, this type of information does not exist for previous years. Neither does information exist on the number of boats nor the number of traps by vessel in the artisanal fishery. It has been estimated that on average 880 traps are lifted on a daily basis, indicating that a vessel introduces between 2640 and 3000 traps in the fishing areas (Berthou and L´Espagnol, 1997). A similar number is used by the foreign fleet vessels of Honduras in waters of Nicaragua. The Nicaraguan industrial trap vessels work on a regular basis with an average of 1400-1500 traps. By 1997, the Colombian fleet consisted of 10 trap vessels, operating an
0
100
200
300
400
500
600
700
800
1961
1963
1965
1967
1969
1971
1973
1975
1977
1979
1981
1983
1985
1987
1989
1991
1993
1995
1997
Year
Land
ings
(ton
nes
who
le w
eigh
t)
Total landings
Pedro Bank
South Shelf

80
average of 339 traps each. Figure 7.7 shows that the number could have been the same for 1993-1997.
Figure 7.6. Accumulated fishing days per month of the three industrial fleets in
Nicaragua, 1992-1997. In Jamaica effort is only available for 1996 and 1997. In 1996 effort was collected on monthly basis for all gears combined. With improved data collection during 1997 Table 7.3 shows the monthly effort now available by gear type (trap, net, SCUBA and free-diving). Table. 7.3. Contribution of effort for each gear type used in the southern shelf platform
of Jamaica. Gear Type Landings
(mt whole wt) % contribution
by gear type Boats Fishers
Trap 103.43 0.38 >3000 >10000 Scuba 45.14 0.17 37 400 Free dive 87.88 0.32 33 600 Net 8.19 0.03 14 50 Hoohka 18.37 0.07 20 140 Wooden traps 8.21 0.03 4 48 TOTAL 271.22
7.1.4 CPUE Considering the information in sections 7.1.2 and 7.1.3 the longest CPUE series is for Nicaragua (1988-1997) followed by Colombia (1993-1997). For the former, monthly CPUE data is available for the National and Foreign trap fleet and SCUBA industrial fleet. This data still needs to be corrected before any formal analysis is done on the fishing areas of Nicaragua. Furthermore, catch and effort data have not been gathered for the artisanal trap and SCUBA fleets, but should be collected for future assessments of the fishery. In Colombia, monthly CPUE are from Luna Verde fishing area only.
0
200
400
600
800
1000
1200
1992 1993 1994 1995 1996 1997Months
Accu
mul
ated
fish
ing
days
per
mon
th Foreign trapNational trapSCUBA

81
Figure 7.7. Catches and accumulated number of effective fishing days per month of the trap lobster Colombian Fleet in the Luna Verde area, 1993-1997.
In Jamaica during 1996-1997, detailed data were gathered to estimate CPUE. Data was only available for 3 of the 6 possible gears. It was found that although SCUBA contributed to only 17% of the total landings, its CPUE is the highest of the three gears (Table 7.4).
Table 7.4. Monthly CPUE for three gears (1996-1997). CPUE (kg/trip) SCUBA Free-
diving Trap
July 46.26 17.22 0.64 August 6.07 6.37 0.36 September 15.78 7.71 0.76 October 17.69 9.15 1.30 November 17.69 9.15 0.11 December 15.90 0.00 0.68
7.1.4.1 Standardisation procedure Given the lack of necessary data sets and information to assess the status of the Panulirus argus stock on the Honduras-Nicaragua-Colombia Platform, and with the idea of conducting different assessments in the future, a preliminary exercise for CPUE standardisation was undertaken. Standardisation of effort is required to combine information from different data series for assessing the status of the fishery at the national level and for the entire platform. In principle, the exercise considered the information of all types of gear in Nicaragua. Table 7.5 includes indices of conversion to be used in the absence of this sort of data in areas like Honduras.
Indices in this table were used to estimate effort being applied (number of traps) using the national industrial trap fleet of Nicaragua as reference. Results indicate that in 1997 the applied effort in Nicaragua by all the fleets was equivalent to operating with 621 755 traps; 586 435 traps in Honduras and 3390 traps in Colombia. This is equivalent to having 345 boats (National trap industrial fleet) operating with 1800 traps producing 12.65 tonnes boat-1 year-1 on average in Nicaragua. Using the same method, effort being applied in Honduras was estimated as 326 boats and 2 boats for Colombia. It is important to mention that results in Honduras are very sensitive to the estimated number of boats in the artisanal fleet. To
0
5000
10000
15000
20000
25000
30000
35000
93 94 95 96 97 98
Catc
hes
(lbs
)
0
100
200
300
400
500
600
Effort (days)− Catch --- Effort
Year

82
improve on these results, estimates of artisanal effort should be made by DIGEPESCA. Although results should be considered as preliminary, the standardisation procedure indicates that up to 1997, the total effort applied on the entire platform is equivalent to 673 boats and 1 211 580 traps. While waiting for better estimates from the artisanal fishery in Honduras, results of the standardisation can be used for comparison purposes (e.g. in biomass dynamic models and reference points).
Table 7.5 Standardisation indices of all gears for Nicaragua in 1997. Trap SCUBA Artisanal National
Industrial Foreign
Industrial Artisanal Industrial
Trap Artisanal 1.00 0.47 0.61 1350 0.21 National Industrial 2.14 1.00 1.31 2896 609 Foreign Industrial 1.63 0.76 1.00 2204 464
SCUBA Artisanal 7.40 10-4 3.45 10-4 5.00 10-4 1.00 0.21 Industrial 3.50 10-3 1.64 10-3 2.20 10-3 4.75 1.00
7.1.5 Socio-economic data The fishing sector of Nicaragua has integrated all aspects of the fishery. In most cases the same company catches, processes and markets the lobster. Everything is in a single productive and managerial unit. There is only one Industrial Fishing Association (CAPENIC) and a single confederation of artisanal fishermen (FENICPESCA) representing their respective members for purchasing and sales. There are no specific companies for each one of the intermediate steps between harvest and export (except some intermediaries that can not be considered as companies). A similar structure exists in Honduras and Colombia.
Data on operational costs for vessels of the national industrial trap fleet and industrial SCUBA fleet was gathered in 1996, although no conclusive results were produced. However, at least in Nicaragua, it is known that economic statistics have been recorded, but they are confidential and were not available for this workshop.
7.1.6 Sub-regional summary In spite of the importance of the fishery in this area (landings of 7283 tonnes whole weight) there is not enough data to conduct proper fisheries stock assessments. Reliable data are available in Nicaragua since 1992 and Colombia since 1993. Still, it was found that effort data in Nicaragua need to be checked before further analyses are carried out. In Honduras, a lot of work needs to be done, most importantly setting up a sustainable routine data collection programme.
Recently, Nicaragua and Colombia have improved their data collection. For the period 1992-1996 production of each commercial category is available, but only since 1997 have researchers of Centro de Investigación en Recursos Hidrobiológicos (CIRH) been able to collect data at different landing sites. In Colombia, catch size frequencies from Luna Verde are only available for period 1994-1995.
In this region, from a total catch of 8453 tons (whole weight) in 1995, 44.5% was from Honduras, 48.66% from Nicaragua, 2.74% from Colombia, 2.5% and 1.6% from the Pedro Bank and southern shelf of Jamaica. As 93.16% of catches are taken by Honduras and Nicaragua and proportions of catches have changed as observed during the 1980s and 1990s, it is highly recommended that standardised data collection programmes be established in both countries. Lobsters in the catches of all countries present similar

83
characteristics, indicating that the stock to some extent is being shared. Thus assessment efforts in the future should consider all countries concerned.
Results of the effort standardisation procedure show the importance of having good estimates of catches, and characteristics related to the operation of each fleet in each country. This aspect is regarded as very important because the artisanal fishery is seen to be increasing in Nicaragua and most probably in Honduras as well. In addition, since 1996 entrepreneurs of the industrial fleet in Nicaragua have started to complain. They argue that catches have decreased and one of the possible explanations is the increase of the artisanal fishery. Under these conditions, assessing the most appropriate effort in each country and at the platform level is now necessary. To a certain extent this is considered in next section.
7.2 FISHERIES INDEPENDENT INFORMATION Independent data to produce relative abundance indices have not been generated in any Region 3 country yet. This type of index is important because it provides information on abundance per unit area in number of individuals or biomass. This information is costly to collect, so a lack of funding is often responsible for the lack of these data. In lobster fisheries in general the main reliance is on fisheries dependent information.
7.2.1 Collectors of pueruli No formal study has been conducted in this region. The only attempts that have taken place have been in Nicaragua and Jamaica. In Nicaragua, with the assistance of the United States Agency for International Development (USAID), a post-larvae collector survey study was developed in Nicaragua in the area of Cayos Misquitos during 1996. Unfortunately, the study was not successful because the collectors were removed after only a short period. Cayos Misquitos is a likely area of pueruli settlement and a nursery for juveniles. The area is 40 miles from the mainland with water depths of 10-20m and extensive mangrove formations. An equally good location for monitoring recruitment may be Cayos Perla, which has similar conditions to those of Cayos Misquitos.
In Jamaica, in 1992 a Master’s thesis in Zoology from the University of the West Indies was completed on the use of Witham collectors in the Discovery Bay area (north coast) and Bowden Harbour (south coast) (Young, 1992). The aims of the study were: (1) to estimate the magnitude and the most plausible pattern of post-larvae settlement and (2) develop methods for rearing lobsters from pueruli to adults. Results show that collectors attracted pueruli and early juveniles (6 to 10mm CL). Individuals up to 43mm CL were also found. Thirteen collectors were checked every fortnight during 72 weeks, recovering 1529 pueruli (an average of 21 pueruli week-1). The individuals were taken to the University Port Royal Hatchery and kept in tanks to conduct studies on the growth based on four different diets.
Since 1995 there has been a bilateral agreement developing greater co-operation between Jamaica and Mexico. One of the projects refers to the establishment of collectors and casitas. Officers from Jamaica visited areas in the Quintana Roo State to observe the operation of casitas and to identify areas suitable for the deployment of pueruli collectors. The Mexican technical adviser visited Jamaica and conducted a training course for a programme on collectors (pueruli and juveniles) and for casitas. A site was identified at Bowden Harbor, from which a programme will be developed.
Although this type of study has not been carried out in Colombia, the area of Luna Verde has been identified as a good location for pueruli collectors. Specifically Islas Providencia, Albulquerque and Bolivar are plausible areas for this purpose due to the shallow waters and an integration of a reef terrace, mangroves and a lagoon system. In Honduras, it has been suggested that Alligator Bank is an area of high pueruli settlement.

84
7.2.2 Environmental influences The platform of Honduras-Nicaragua and Colombia in the Caribbean region represents the largest extension in Central America, covering a total of 109 072km2 (Ehrhardt, 1994). A great number of cays, banks and islands are present as well as different types of substrate. Waters in this area are influenced by the Aliases and winds from the north-east and east. Precipitation ranges from 3000 to 5000mm year-1 and winter-summer water temperature varies very little from 27.00C to 28.50C, respectively. On the coast of Nicaragua, changes of salinity at the sea surface are not significant (35.8 to 36.0 ppm). At depths of 75m there are no seasonal changes in salinity, although temperature reports show differences of 4 0C. The pattern of currents in the southern part of the entire platform, in general terms, coincides with the Gulf Current. Near the Banks of Mosquitos the current produces a gyre southwards along the coast, especially during the last months of the year.
Despite the information above, no studies have been done correlating these factors and the distribution of any of the stages of P. argus in space and time among these countries. In the case of Colombia, data have been gathered sporadically during oceanographic research cruises. In Honduras records of precipitation and temperature might be obtained, but at this moment, it is not possible to determine the period and area covered. In Jamaica, the Meteorological Office has gathered data on different environmental parameters since the late 1970s, although no lobster stock assessment has used this type of information. In addition, the University of West Indies collects information on environmental parameters during research studies, but this information needs to be linked to lobster populations.
To understand the dynamics of the resources on the platform, it is desirable to gather more data and carry out analyses on the influences of different environmental factors on this resource. It is believed that drifting post-larvae settle at different sites over this platform. Improved knowledge of currents and post-larvae densities are needed to understand these settlement patterns.
There is a joint fishing agreement between Jamaica and Colombia for the Joint Regime Area (Alice Shoal, Serranilla and Bajo Nuevo), which includes fishing resources, oceanography, and mapping of Alice Shoal. The oceanographic work includes information on the Honduras-Nicaragua-Colombia Platform and Pedro Bank, and was carried out by the Colombian Oceanography Institute. Available oceanographic information covers current movements, eddies, plankton levels, satellite images and depth. It is planned to extend theses activities to the other fishing grounds.
7.2.3 Tagging Jamaica is the only country in this region that has attempted to do tagging studies. In 1991, the Canadian International Development Agency (CIDA) financed a capture-recapture study on Pedro Bank, which included ten research cruises. However, recapture was low and appeared insufficient to do any analysis.
In spite of the difficulties to which mark-recapture studies are prone, a study of this nature is necessary. The available data shows a gradient of sizes and ages with depth. From the samples of commercial catches, it has been observed that as lobsters grow older (larger), they move to deeper waters and are vulnerable to different fishing techniques and fleets along the longitudinal gradient. A tagging study should focus primarily on addressing the following: (1) migratory patterns on the platform, (2) rates of movement on the longitudinal gradient (3) growth, (4) size-age fishing mortality by gear. With this sort of information, it would be possible to address several issues, including whether the resource is being shared and to what extent and how different strategies and regulations need to be co-ordinated between management authorities.

85
Table 7.6 Fishing mortality (F) values from the Nicaraguan fleet, 1992-1996, estimated using a depletion model.
All fleets National fleet
Foreign fleet
Industrial SCUBA fleet
Aug - 1993 0.058 0.00995 0.01989 0.028 Sep 0.067 0.00717 0.02679 0.033 Oct 0.050 0.00985 0.01232 0.028 Nov 0.070 0.01235 0.02780 0.030 Dec 0.065 0.00783 0.03034 0.026 Jan - 1994 0.063 0.00727 0.02458 0.032 Feb 0.077 0.00908 0.03163 0.036 Mean 0.064 0.009 0.025 0.030 Total 0.771 0.109 0.297 0.365 Jun - 1996 0.042 0.01036 0.031 Jul 0.099 0.01079 0.03777 0.050 Aug 0.077 0.00991 0.00510 0.062 Sep 0.113 0.00975 0.03731 0.066 Oct 0.087 0.00645 0.02115 0.060 Nov 0.101 0.00936 0.01732 0.074 Dec 0.161 0.01285 0.04293 0.105 Mean 0.097 0.010 0.027 0.070 Total 1.165 0.119 0.323 0.834
Table 7.7 Summary of results From LCA, TLCA, Y/R and RSB for male and female P. argus in the Nicaraguan Caribbean, considering two selectivity patterns.
Selectivity from LCA exploitation
pattern
“Knife edge “ Selection
(3 years old) MALES Fmax 1.26 1.80 F0.1 0.57 0.63 Recruited Spawning Biomass (RSB) at Fmax
0.29 0.27
F at RSB = 30 % 1.15 1.4 F current (from TLCA) 0.55 FEMALES Fmax 1.36 1.38 F0.1 0.58 0.53 Recruited Spawning Biomass (RSB) at Fmax
0.37 0.38
F at RSB = 30 % 2.85 2.92 F current (from TLCA) 0.41
7.3 STOCK ASSESSMENT RESULTS AND STATUS OF THE STOCKS Different methods were employed to estimate fishing mortality (F), catchability coefficient (q) and different reference points such as F0.1 and Recruited Spawning Biomass ratios (RSB). These considered either length or age frequency distributions as inputs.
In Nicaragua, to estimate the catchability coefficient of each fleet on a monthly basis, a depletion model was used. This assumed the sharp decreases in CPUE at the beginning of each season were due to depletion of the stock, allowing recruitment and q to be estimated. Two periods were analysed (August 1993 to February 1994 and June-December 1996). Total reported catches for all fleets were converted to numbers of individuals (both sexes)

86
with average weights from the commercial categories in processing plants. Recruitment values at the beginning of each period were estimated, as was fishing mortality (F monthly) for all fleets combined and for the national industrial fleet (Table 7.6). The F values (national industrial fleet) were regressed against effort (effective fishing days) to estimate catchability (q = 2.41 10-5). For the other fleets, effort will need to be disaggregated to obtain the q values in each case.
As it was not possible to obtain initial recruitment values for the platform shared by the three countries and Pedro Bank, it was decided to use the F estimates and compare them with those obtained through an equilibrium yield-per-recruit analysis. The objective consisted in estimating and comparing preliminary Fmax and F0.1 with those previously obtained.
For Nicaragua fishing mortality was also estimated using the Length Cohort Analysis method (LCA; Jones 1984). Because of the uncertainty related to terminal F in the largest sizes, it was decided to use the Tuned Length Cohort Analysis (TLCA; Ehrhardt and Legault, 1996). M was assumed to be 0.3 year-1. Values of Z and F for each size class were estimated, as well as the overall F and Recruited Spawning Biomass ratios (RSB). In Table 7.7 results were used to compare the actual estimates of F against Target Reference Points (TRP) or Limit Reference Points (LRP). In addition, selectivity considered the actual selection curve and “knife edge” selectivity curve. Yield-per-recruit analysis (Y/R) was carried out on age instead of size assuming the growth parameters for this region.
Results in Tables 7.6 and 7.7 present F estimates from two methods (a depletion model and TLCA). Values from first method were considered for further evaluation because these reflect best the reality of the pattern of exploitation in the platform of Nicaragua. Under present conditions, it is observed that effort in 1996 was 11% below Fmax for both sexes, and more than two times F0.1 when considering either the present selectivity pattern or “knife edge selectivity” (3 years old) for both sexes. The SCUBA industrial fleet effort has increased in the last years. This is probably the reason for the increment of F from 0.365 (1993-1994) to 0.834 (1996) for this fleet and from 0.771 to 1.165 for the overall F (Table 7.6). If correct, during 1996 the estimated F was very close to reaching Fmax and almost two times the value of F0.1 for both sexes. Considering RSB, under present conditions F=1.165, which is almost 30%, the TRP (RSB=0.3) for males, but above that for females (RSB=0.4). For the “knife edge selectivity”, it was found that the TRP are RSB=0.335 (males) and RSB=0.41 (females). Figure 7.8 shows the yield-per-recruit (Y/R) and RSB plots of males and females for current selectivity estimates, including Fmax and F0.1.
The two selectivity patterns represent two different states of the fishery. The "knife edge selectivity" pattern refers to an enforced minimum legal size equivalent to 99mm CL (3 years old). The current minimum legal size is 75mm CL. The analysis suggests that no significant improvement would be obtained in RSB by increasing the minimum size to this level. In terms of Y/R under the current estimated F, the improvement with the knife edge selectivity (selectivity from 3 years old) would be 3.8% in terms of total landings. Considering an average total catch of 4418.73 tonnes (whole weight) between 1995-1997, this improvement would represent an increase in the average total landings of 167.91 tonnes to 4586.64 tonnes.

87
Figure 7.8 Y/R and RSB of Panulirus argus on the Nicaraguan platform, with the estimated values of F0.1 and Fmax for each sex
In Colombia an age-based Thompson and Bell (1934) model was used to provide F estimates for the Luna Verde fishing area. Fmax was estimated as 0.77, but further estimates of F are needed to place any interpretation on this value.
The analyses above are preliminary and refer to only two countries. Because Production is now fluctuating and the individual lobsters within the catches present similar characteristics,
Males
00.20.40.60.8
11.2
0 0.5 1 1.5
F
RSB
B
Males
0200400600800
1000
0 0.5 1 1.5
FY/
R (g
ram
s ta
il)
A
Females
00.20.40.60.8
11.2
0 0.5 1 1.5
F
RSB
D
Females
0
200
400
600
800
0 0.5 1 1.5
F
Y/R
(gra
ms
tail)
C

88
conclusions from the results of Nicaragua may, to a certain extent, be considered to represent Honduras as well.
7.4 CONCLUSIONS AND RECOMMENDATIONS The group concluded that, based on the available evidence, the Caribbean spiny lobster in each of the three fishing areas for the entire platform and Jamaica, appear to be fully exploited. After rebuilding the catch history for Honduras, Nicaragua and Colombia, it is observed that the fishery on the entire platform was fully developed by 1985. Since then, the fishery entered a stabilisation period, explaining the behaviour of catches in recent years. It is believed that effort has increased in all fleets, but mainly in the artisanal fleet, as shown in Nicaragua. The results from the preliminary analysis appear consistent and, according to them, in Nicaragua Fmax was almost reached in 1996. Although further assessments are needed, further fleet expansion should be avoided if possible. Expansion of the fleets will increase costs and may decrease the overall net revenue. Because F0.1 has already been exceeded, it is recommended that in the future, effort be decreased in each fleet in all fishing areas of Nicaragua and Honduras. For the fishing area of Colombia (Luna Verde) more assessment still needs to be done before reaching any conclusion.
Results also indicate that the three countries are probably fishing one stock, making co-operation fundamental for proper management. This involves close co-ordination between managers and scientists of the different countries involved in managing this platform. In addition, a relationship of lobster size with depth was observed (larger individuals in deeper waters). Therefore the fishery as a whole presents the characteristics of a sequential fishery, with potential interactions between the different fleets. Special attention should be paid to avoid conflicts between fleets in the future, particularly in Nicaragua. In recent years, artisanal effort has increased and the offshore industrial fleet reports declining catches. Under these circumstances, it was recommended that optimisation methods be employed to assess fleet sizes. To initiate this analysis, standardisation indices were obtained for all fleets in Nicaragua. In the absence of proper data in all countries, the standardisation indices were used for the entire platform. Best estimate indicates that total effort being applied in the platform is equivalent to 673 Nicaraguan industrial trap vessels. It is recommended that in the short term better data on all aspects of the fishery be gathered to improve estimates.
The group also concluded that scientific co-operation and data sharing among the participant countries is necessary for ensuring conservation and achieving optimal exploitation. The effects of different management regulations need to be assessed for each country's fisheries sector and for the entire platform stock. It was concluded, for example, that measures like a closed season should be analysed at platform level, because its implementation and feasibility depends on the participation of all countries.
7.4.1 Recommendations
7.4.1.1 Nicaragua • Improve the current biological data collection programmes. For the gathering of economic
data a programme should be carefully designed first and put into action as soon as possible. This would require gathering more data at different landing sites.
• Collect data on operational costs and applied effort at different industrial fleet offices to improve the standardisation indices.
• Implementation of a closed season as a management regulation should be assessed. The analysis should consider different periods and times for implementation based on biological and economic information.
• Fieldwork must continue to estimate more precise morphometric relationships, growth estimates and to increase knowledge on the biological characteristics of P. argus in this

89
area. In addition, to solve the problem of dealing only with commercial categories, mechanisms, as the one presented in section Chapter 4, should be considered.
• For optimisation purposes, details on the fishing operations in each fleet should be monitored.
7.4.1.2 Honduras • To analyse the characteristics of the fishery, it is necessary to design and implement a
sustainable routine data collection programme. This must consider both the biology of the resource and the operations and economics of each fleet.
• To obtain important information on effort, in the short term, a survey should take place to gather as much information as possible from each fleet. Especially for the artisanal fishery, there is a need to estimate effort and all the characteristics concerning this fleet.
• For the purposes above, expert consultants should carry missions to this country.
7.4.1.3 Colombia, Jamaica and Dominican Republic Colombia produces a significant amount of P argus (average of 200mt whole weight) only in the Luna Verde fishing area, covering 247km2. Under these circumstances, the present data collection programme must continue and be improved. The stock is probably shared, however, so any assessment for Luna Verde should take into account assessment results in the fishing areas of Nicaragua and Honduras.
In the case of Jamaica the data collection programme, which was started with the assistance from CFRAMP in 1996, should continue. Results in this work show that there has been an improvement in data quality since the working session of 1997. Nevertheless, data still needs to be collected from Pedro Bank as it represents an important fishing area in this country. Given the characteristics of Pedro Bank, a formal bilateral agreement between Jamaica, Nicaragua and Honduras is advisable, considering that a better insight will come with the information shared at regional level.
In the case of Dominican Republic, no data were available, therefore assessment work was not carried out. With appropriate adjustments for the much lower production, similar recommendations apply to this country as to the others in the group. It is recommended that missions take place to contribute in setting up a routine data collection programme.
7.4.1.4 Regional It is important to establish long-term data collection programmes to gather biological, catch, effort, and economic data in this region. It should be stressed that the programmes must include the spatial component of P. argus on the shared platform of Honduras, Nicaragua, Colombia and Jamaica. Data types in these monitoring programmes should be standardised.
Results from independent research work in Nicaragua, Honduras, Colombia, Jamaica and the Dominican Republic should be published and discussed amongst these countries. Additionally, management plans should be assessed at a regional level, comparing different objectives and feasibility. Considering that research funds are generally low, industry should be involved in the data collection programmes. Particularly in the cases of Nicaragua, Honduras and Colombia, the owners of vessels should be invited to participate actively, through the need to know the status of the exploited resource and the possible behaviour of catches in the future. A common characteristic in this region is that the lack of data is due to the low number of researchers and technicians. One possible way to start solving this problem is having the users participate more.
Further specific regional projects should include:

90
• Experiment with and assess the use of gear from other countries, with the aim to solve problems of decompression sickness due to SCUBA.
• Create an accessible database with information of all work done in relation to P. argus in the Caribbean Region, including important internal reports.
• Develop and implement a system of pueruli collectors and juveniles in shallow waters of Honduras, Nicaragua, Colombia and Jamaica.
• Training in the application of stock assessment models and software for the technical staff in charge of evaluating this resource.

91
8 REGION 4: BAHAMAS, BERMUDA, NORTH CUBA, ST. LUCIA, TURKS AND CAICOS ISLANDS AND THE UNITED STATES OF AMERICA
G. Bethel, R. Cruz, V. Deleveaux, D. Harper, B. Luckhurst, W. Joseph, P. Medley (Group Leader) and R. Muller
8.1 INFORMATION ON FISHERIES-DEPENDENT DATA
8.1.1 Bahamas
8.1.1.1 Catch and effort
Figure 8.1 Bahamas total spiny lobster catch (—) and spear/hook CPUE (---)
The Bahamas has landings data 1982-1998 and effort data 1990-1998 on its database. The early catch and effort data collection system was not comprehensive, however, being restricted only to the island of New Providence. There has also been an unrecorded shift in fishing methods throughout the country beginning during the late 1980s, when the use of casitas started to become the predominant fishing method, displacing both spears and traps. This shift in fishing gears would have caused a shift in the exploitation pattern of the fishery as well as an increase in the selectivity for the smaller-sized lobsters. The lobster hook, which is used to harvest spiny lobsters from casitas, was not listed as a fishing gear in the data collections system until 1993.
During this workshop it was necessary to combine the recent effort data recorded for spears and lobster hooks. This is due to the time period where the fishing effort was not properly attributed to the correct gears prior to 1993. However, while the fishing effort has indeed increased, much of the apparent increase is most likely a result of the expansion of the catch and effort data recording system.
Other changes in fishing operations have also occurred since around 1987. In the past lobster trappers and spear fishers have generally operated in different areas. This has changed as the casitas are now placed in areas traditionally used by traps. This has led to user conflicts, resulting in the further decline in the use of traps.
0
500
1000
1500
2000
2500
3000
1982
1984
1986
1988
1990
1992
1994
1996
Year
Land
ings
(mt t
ails
)
0100200300400500600700800900
CPU
E

92
Although in the past New Providence received the larger share of the landings, this is no longer true. This situation has been addressed in recent years by expanding the data recording system to cover most of the Family Islands where significant fisheries landings occur. Effort data is now becoming available for these fisheries.
The data that have been collected over the last two decades indicate that the landings weight has steadily increased (Fig. 8.1). This increase is mainly due to higher fishing effort and changes in fishing techniques. CPUE suggests no overall trend in stock size over the period 1990-1995.
8.1.1.2 Socio-economic data The total fishery industry component of the Gross Domestic Product (GDP) of the Bahamas averages between 2.3 - 2.5 percent annually. The spiny lobster fishery contributes about 95 percent of this value. Gross receipts from the spiny lobster industry have averaged about US$54.4 million since 1991. There are approximately 8 800 fishers, 98% of which are involved in the spiny lobster fishery. Remuneration to labour has averaged between US$17 200 to US$23 000 annually.
The high value of the lobster fishery has had a tremendous effect on many of the Family Islands. It has led the development in many communities. This industry has provided new sources of income for many persons through the development of associated businesses, which provide goods and services to fishers. However, there is currently no data collected monitoring these wider effects, except the overall gross revenue from the fishery based on prices and reported landings.
8.1.2 Bermuda
8.1.2.1 Catch and effort Landings and nominal effort (trap hauls) are available from 1975-89 for P. argus (Fig. 8.2) and P. guttatus. Daily landings and directed effort for P. argus from an experimental trap fishery (1990-95) and a limited entry fishery using standard traps (1996-97) provide more detailed data. In addition, landings of P. argus from licensed recreational divers have been collected since 1984. The divers are required to submit statistics and have a bag limit of two lobsters per day. Maximum landings from divers reached 5 500 lobsters in 1994 and have oscillated in a small range since this time. A planned two-year experimental fishery for P. guttatus commenced in April 1998 testing two trap types.
Systematic biological sampling commenced with the experimental fishery in 1990 and has continued until the present time. Sampling has been conducted both at sea on fishers' vessels as well as at dockside. Data collected includes size, sex and reproductive condition. The size-frequency data from the first year of the limited entry fishery indicates a marked difference between the offshore and inshore size distributions. No trapping had been permitted in the inshore area for five years and the inshore size distribution had a higher modal value than offshore as well as greater representation in the larger size classes. This suggests the accumulation of lobster biomass in this inshore area during the closure period in the absence of fishing mortality.
Catch per unit effort (trap hauls) for the fishery shows little trend until 1990 when the directed fishery began (Fig. 8.2). CPUE increased significantly during the experimental period (1990-95) with the use of lobster-specific traps of various designs. The fishery was restricted to a defined offshore area around the perimeter of the reef platform during this time. CPUE increased further when fishers were permitted to set traps in inshore areas over the last three months of the season. This area had not been fished with traps for five years.

93
Figure 8.2 Landings and catch per trap haul for the Bermuda spiny lobster fishery.
There was no separation between finfish and lobster traps prior to 1990. The increasing CPUE 1990-98 marks the introduction of experimental traps and the
recording of effort directed at lobster. For the seasons 1997 and 1998 closed inshore areas were opened to fishing for the first time, explaining the particularly high catch
rates during this period
8.1.3 Cuba (Northeast) The four shelves of the Cuban archipelago are relatively geographically isolated because of the very narrow band of shallow water separating them and appreciable differences are observed in yield per unit area among zones and coasts. Trends in catch and effort are therefore interpreted as if these supported independent stocks. The catches on the north-western shelf fluctuate around 192 tonnes (2% of the total catch), and the north-east shelf 1500 tonnes (15%).
Figure 8.3 The catch and CPUE of the north-east Cuban lobster fishery 1986-1996
From 1962 to 1988 the average annual catches increased by 1165 tonnes to 1725 tonnes. The closed season had been lengthened from 1.5 to 3 months, and the minimal legal size was strictly enforced so that landings gradually increased, rising to a peak of 2446 tonnes in 1987, then fell (Fig. 8.3). As shown by Cruz et al., (1991b), these regulatory measures caused a change in the mean size at first capture. In 1990 the fishery suffered very poor recruitment (Puga et al., 1991). Since 1991, the closed season has been lengthened to 4
05000
10000150002000025000300003500040000
1975
1977
1979
1981
1983
1985
1987
1989
1991
1993
1995
1997
Year
Land
ings
(Lob
ster
num
ber)
0
0.5
1
1.5
2
2.5
3
CPU
E (lo
bste
rs p
er h
aul)
Total landingsdiver landingsCPUE
0500
10001500200025003000
1973
1975
1977
1979
1981
1983
1985
1987
1989
1991
1993
1995
Year
Cat
ch (m
t)
050100150200250300350
Cat
ch p
er fi
shin
g da
y
CatchCPUE

94
months and there has been a further reduction of the number of fishing units to reduce fishing effort. The problem of measuring effort in the fishery is complex because the lobsters are caught by a range of gears and techniques. The unbaited trap is the main fishing gear in the north-east shelf, contributing 75-80% of the catches of that area. Lobster fishing using casitas is carried out by dropping traps around the casitas. It might therefore be possible to use the estimates of the number of traps (nasas), but not all of these are checked. A better measure seems to be the number checked by the fishers, which they record (See also Chapter 6.2.2).
8.1.4 Florida (USA) The recreational divers and commercial trappers harvest lobster in Florida. The Department of Environmental Protection (FDEP) has estimated the recreational harvest of lobsters with an annual mail survey (Bertelsen and Hunt, 1991) since 1991. Separate estimates are developed for the Special Sport Season (the last Wednesday and Thursday of July) and for the first month of the regular open season beginning on August 6. The National Marine Fisheries Service’s General Canvass has annual commercial landings and value from 1950 (Fig. 8.4), also available by month since 1978. Since October 1984, dealers in saltwater products such as fish, invertebrates, and marine life have been required by the State of Florida to report all purchases from fishers by individual trips. These trip tickets contain information including the fisher’s licence number, the dealer’s licence number, the date, gear used, trip duration, area fished, species landed, quantity landed and price paid. Both systems collected landings in 1985 for comparisons and in 1986 NMFS discontinued their dealer reporting system in favour of getting the more detailed information from the State of Florida. The actual trip tickets are confidential and can be only accessed for management purposes or by the individual license holder. For other purposes, the data are only available in aggregated form.
Figure 8.4 Landings and traps for the Florida commercial fishery.
Catches of spiny lobsters in Florida increased rapidly after the minimum size was lowered to 76.2mm CL (3 inches) in 1965. Fishers in Southeast Florida dramatically increased their harvest from Bahamian waters and fishers in the Florida Keys began to harvest lobsters from Florida Bay. The Bahamian government closed their waters to foreign fishing in 1975 and Southeast Florida’s landings dropped and have remained stable and low ever since. Over 97% of the commercial landings are captured with traps and the remainder by divers or bully nets. The expansion of the Keys fishery increased landings to levels from 2 412mt to 3 564mt with a recent average of 2 842mt.
0500
10001500200025003000350040004500
60 63 66 69 72 75 78 81 84 87 90 93 96
Year
Land
ings
(mt)
01000002000003000004000005000006000007000008000009000001000000
Num
ber t
raps
LandingsTraps

95
Figure 8.5 Number of trips made in each month by Florida commercial trap boats. There are two measures of effort available for Florida—the estimated number of traps in the fishery (since 1960) and the number of commercial trips (since 1985). The number of traps increased from 19 000 traps in 1960 to 939 000 traps in 1991. The number of traps was reduced through a trap certificate programme and the number of traps in 1996 was 582 000. The Florida Marine Fisheries Commission has continued to reduce traps by 10% every two years in even-numbered years.
The number of trips increased from 32 000 trips in the 1985-86 fishing season to a peak of 46 000 in 1991-92 fishing season and decreased to 33 000 trips after the implementation of the trap reduction programme (Fig. 8.5). Each year, there are many trips when the regular fishing season first opens on 5th August and then the number of trips per month decreases. Many fishers leave the spiny lobster fishery when the stone crab, Mennipe mercenaria, fishery opens on 15th October.
There are three measures of catch per unit effort available for Florida’s spiny lobster fishery:
• Numbers of lobsters per trap from the observer programme (August 1993 to 1997).
• Standardised commercial catch per trip in weight (August 1985 to 1997).
• Recreational number of lobsters per angler from mail surveys (1991 to 1997).
Figure 8.6 Pueruli settlement and sub-legal CPUE 22 months later Although the observer programme has only been in existence for five years, the programme has great potential for stock assessment because the observers record the size and
0100020003000400050006000700080009000
10000
8507
8604
8701
8710
8807
8904
9001
9010
9107
9204
9301
9310
9407
9504
9601
9610
9707
Month
Trip
s
-1.00
-0.75-0.50
-0.250.00
0.25
0.500.75
1.00
36 34 32 30 28 26 24 22 20 18 16 14 12 10
Lag (months)
Corr
elat
ion
coef
ficie
nt

96
composition of the total catch. In turn, from this information one can develop indices of legal and sub-legal numbers per trap or weight per trap.
There was a pattern in the cross correlations between the number of pueruli and the number of sub-legal lobsters per trap 21 and 32 months later (Fig. 8.6). The 21 month lag is consistent with growth of puerulus to sub-legal males 67 - 75mm CL. Because of the short time series, this index has not been used in the annual stock assessment. The standardised catch per effort has been calculated for the Florida commercial trip ticket data. The quantity landed per trip is adjusted with an analysis of covariance using month and location as classification variables and trip duration as a covariate. This index was used to tune an age-structured sequential population analysis (Muller et al., 1997). In the workshop, this index was calculated by month and used to estimate recruitment with a depletion model.
The monthly decline in CPUE estimated from the observer programme in weight of legal-sized lobster per trap and from the standardised trip tickets were highly correlated (r = 0.87, df = 39) in fishing seasons with both indices (Fig 8.7).
Annual recruitment was estimated as the number of August age-2 lobsters determined from commercial and recreational length frequencies and the Florida growth curves for males and females.
Although August is chosen as the time of recruitment because it follows the closed season when lobsters can moult into legal size, some recruitment occurs throughout the year. Most of the new lobsters entering the fishery in August are males. Recruitment was estimated indirectly with the depletion model discussed in Section 8.5.
Figure 8.7 Observer and ticket CPUE Years with good recruitment were 1988, 1993, 1994, and 1996. Landings tend to be higher in the next fishing season, even though age-2 lobsters sometimes comprise over half of the landings.
The State of Florida can identify participants in the commercial spiny lobster using trip tickets. By summarising the landings information by fisher’s license number (Saltwater Products License), it is possible to identify the number of fishers, the levels at which they participate in the fishery, and the share of their annual landings that is due to spiny lobster. Similarly from trip tickets, managers can identify the major wholesale dealers that purchase spiny lobster, and what proportion of their total purchases were spiny lobster. These data are confidential and can only be released in aggregated form.
As mentioned in the 1998 national report prior to the workshop, both fishery dependent and fishery independent spiny lobster information from the Florida Keys and from the rest of the Florida fishery were updated. Detailed information was obtained for the Florida Keys.
0
50
100
150
200
250
300
350
9308
9402
9408
9502
9508
9602
9608
9702
9708
9802
Month
Num
ber p
er tr
ip
0.0
0.5
1.0
1.5
2.0
2.5
3.0Nu
mbe
r per
trap
Tickets Observers

97
Commercial landings and catch per trip from trip tickets were extracted from Florida Department of Environmental Protection’s (DEP) Marine Fisheries Information System for the period July 1985 through March 1998 although the information from 1998 is incomplete should be considered preliminary.
Data covering the range of sizes captured in commercial traps were provided by the DEP on-board observer programme for 1993-94 through 1997-98 fishing seasons. The National Marine Fisheries Service's Southeast Fisheries Science Center also provided monthly length frequencies from August 1985 through December 1997.
8.1.5 St Lucia The estimated total catch for 1996 is 26mt. Monthly total catch has not been estimated, as it requires purchase records from the main buyers (hotels, restaurants and the Fish Marketing Complex).
There are two monitoring programmes, which commenced September 1996 and are being conducted at two main fishing sites. A biological data collection programme gathers data such as carapace lengths, sex, catch and effort of individual trips. A maturity data collection programme, which gathers data such as carapace length, sex, degree of ripeness of ovaries, state of spermatophores. Data are collected for the main gear only, traps, since other gears or methods are illegal. Effort information is recorded as the number of pots hauled each trip
For 1996/97 lobster season a decline in CPUE was observed as the season progressed (Table 8.1). This trend is similar to the trends observed in the USA, Bahamas and Turks and Caicos Islands. However, a longer time series is required to make meaningful comparison.
Table 8.1 CPUE by month for 96/97 season
MONTH (96) Sep Oct Nov Dec Jan Feb
CPUE (kg trip-1) 25.06 16.40 15.76 11.41 12.02 7.18
No documented socio-economic information is available for this fishery, but there is a plan to conduct a socio-economic study in the very near future. Socio-economic information is available for the other fisheries in St. Lucia. The current price of lobster is US$5.25lb-1 whole purchased directly form the fishermen and US$7.12lb-1 whole processed. This information can be used to calculate the earnings of fishers.
8.1.6 Turks and Caicos Islands Catch is monitored through processors' monthly landings forms and export forms. The landings forms record the weight landed by each fishing vessel on each day. Data exist on landings 1957-1997. Export forms record exports graded by tail weight category. Unfortunately export forms have not consistently been returned, so there are gaps over and within some years.
Effort data exists for 1966-1997 with gaps 1970-74 and 1984-85. Data prior to 1977 has not been checked against original records and is therefore unreliable.
Effort is recorded as boat days. The fishery is based on free diving which accounts for 85-90% of the catches. Fishers use fibreglass boats 3-4m long with 55-70 HP out-board engines. Each boat is crewed by 2-3 fishers who leave for the fishing ground around 0700 and return to the processing plant each day at 1500-1600.
Some attempt has been made to record the crew number of vessels to see whether man-days was a better measure of effort. There was no significant difference between vessels with either 2 or 3 crew leaving on the same day. It is likely that crew size reflects socio-economic conditions and does not necessarily increase the vessels catch rate.

98
CPUE is measured as catch landed by each vessel (weight boat-day-1). Catch weight is converted to numbers using mean weight estimated from the export records. Catch and CPUE has fluctuated widely since the fishery started towards the end of the 1950s (Fig. 8.8), creating an excellent data set with sufficient contrast to obtain good parameter estimates. After a spectacular recovery 1991-1992 probably driven by higher recruitment, but has declined 1993-1996.
Figure 8.8 Landings and catch per effort for the Caicos Bank fishery. Earnings data for fishers are available based on landings and price paid by plant. The Miami price is also monitored through a commercial service.
A socio-economic project was completed in 1994, which looked in detail at the social structure of the main fishing community (South Caicos) and identified approaches for improving management and compliance. The study identified key members of the community with whom education and information would be more effective. An important problem in previous attempts to reach the fishing community was largely due to missing women in education programmes. In terms of fishery management, the lack of women’s understanding of fisheries ecology has led to conflicting pressures for fishers in terms of compliance with regulations.
8.2 FISHERY-INDEPENDENT INFORMATION
8.2.1 Relative abundance
8.2.1.1 Cuba An index of juvenile abundance is available from 1982 monthly monitoring of 60 artificial concrete block reefs designed by Cruz (1986a) and placed in a nursery area in the SE Isla de la Juventud. Lobsters were caught by divers between 1.5 and 2.5m depth. The data collected include the number of juveniles (14 - 50mm CL) in each block structure and carapace length measurements for females and males. The annual juvenile index was calculated as the mean number caught per block per month.
Size distributions of pre-recruits, based on the number of lobster below the minimum legal size (69mm CL), were obtained from monthly monitoring of commercial catch at the artificial shelters known as pesqueros, starting in 1983. The annual index of pre-recruits to the fishery was calculated as the average number of undersized lobster per pesquero per month (Cruz et al., 1995).
There was a strong relationship between the juvenile and pre-recruits indices (r = 0.8916, p<0.005). This suggests that variation in the pre-recruits index could be explained by the estimates of juveniles. Moreover, the pre-recruit index from 1983/84 to 1988/89 was larger
0100200300400500600700
57 60 63 66 69 72 75 78 81 84 87 90 93
Year
Land
ings
(mt)
050100150200250300350400 C
atch per boat dayLandingsCPUE

99
than that obtained from 1989/90, 1990/91 and 1991/92, a period when the recruitment fell to the lowest level of the last eleven years.
8.2.2 Puerulus collectors Puerulus collectors are a cost-effective way to forecast recruitment two or three years in advance (see Chapter 4). Two basic designs of collectors are used, the Witham type (Florida) and modified Phillips type (Cuba). Both require consistent and careful checking, and a long term commitment to data gathering.
8.2.2.1 Bermuda The Bermuda puerulus collector programme commenced in August 1983 with locally designed Witham-type collectors set in inshore areas around the reef platform. Initially 10 stations were established and sampled weekly, but the number of stations was reduced to the four most productive in 1990. Weekly sampling continued until the summer of 1995 when the programme was terminated.
The period of maximum settlement of the puerulus stage from 1983-95 was from August to October with a predominant September peak. The analysis was based on the abundance of pueruli in the first lunar quarter of each month and demonstrated strong seasonality with an early autumn peak and very low settlement during the winter months. An analysis of an annual puerulus settlement index indicated a positive correlation with a recruitment index derived from fishery dependent data, however, the joint time series is not sufficiently long to permit any firm conclusion at this time.
8.2.2.2 Cuba The Cuban puerulus collector system is described in Chapter 6.2. The period of maximum recruitment of puerulus stage to the Cuban archipelago is from September to December. The monthly settlement of pueruli (1988-1994) showed a seasonal pattern that was very similar to all the locations in the archipelago.
The recent studies carried out on spiny lobster life cycles indicate that there is a close relationship between the level of pueruli settlement as measured on collectors and the abundance of recruits to the fisheries. This occurs 1.5 years (Forcucci et al., 1994) and two years (Cruz et al., 1991; Phillips et al., 1994a) after settlement in Panulirus argus in Florida and Cuba, respectively.
8.2.2.3 Florida (USA) A system of puerulus collectors is the only on-going fishery independent monitoring programme conducted by FDEP at this time. The programme began in March 1987 with three collectors at one location (Loo Key) and later expanded in May 1991 to five replicate collectors situated at each of three locations in the Florida Keys. The collectors are sampled monthly. An index of monthly puerulus settlement was estimated with an analysis of covariance as the least-squares mean number of lobsters per collector adjusted for moon phase and soak time.
Acosta et al. (1997) showed that the primary settling period occurred during the first quarter of the moon phase; thus to ensure compatibility throughout the time series, standardised catch rates were calculated using only the information from days five through ten of the moon phase.
Although puerulus settlement in Florida is variable and occurred in all months, average monthly settlement was higher from February through August with the highest monthly settlement in May. Settlement in recent years has been lower than the peak in 1993.

100
8.2.3 Tagging
8.2.3.1 Bermuda A small tagging experiment was conducted in Bermuda in 1997-98 with 200 lobsters tagged and released in April (the first month of the closed season). There have only been four recaptures to date, all by commercial trap fishers; these lobsters all demonstrated significant movements on the reef platform with movement of 10-33km from the release sites. Three of the four lobsters had moulted during their time at liberty (6-7 months) providing evidence that the tagging methodology was suitable. A more extensive tagging study is planned for the 1998-99 season.
8.2.3.2 Florida (USA) Spiny lobsters were tagged in the Key West area 1975-76 (6062 lobsters) (Gregory et al., 1982; Gregory and Labisky, 1986), in the upper and middle Keys from a study conducted by the Department of Environmental Protection in 1978 and 1979 (19180 lobsters; Lyons et al., 1981, Hunt and Lyons, 1986), and in the Everglades National Park (3570 lobsters; Davis and Dodrill, 1989). Information from tagging has been used to estimate growth and migration of spiny lobsters in Florida.
8.2.3.3 Turks and Caicos Islands A small tagging experiment was undertaken in the Turks and Caicos Islands. Of the 350 lobsters tagged there were 21 returns, which were used to estimate the moult rate for setting the season opening (Medley, 1998). However a number of fishers reported catching tagged lobsters, but did not return the tags, making estimates of mortality unreliable. If repeated, such an experiment would require better co-operation from the fishing community.
8.3 STOCK ASSESSMENTS
8.3.1 Bahamas Several methods of modelling were attempted on the available data for The Bahamas. These attempts were limited due to the non-existence of the type of data required to execute the analyses. The available data were also insufficient due to several factors, including the short time series, shifts in fishery gear types, paucity of raw data series to obtain reasonable estimates and incomplete effort information. Much of the problems with the short time series could be corrected to some extent with future data collections, and with through obtaining past data.
The data proved inadequate for fitting any depletion model with any confidence. The best depletion model used a two-stage process. Firstly recruitment index parameters were obtained through a depletion model fitted to monthly CPUE. These recruitment indices were then used in a model fitted to annual data. In both cases the total catches in numbers were used in the population model, and parameters were fitted to the spear catch and effort. Data were limited to the northern Great Bahama Bank. The results suggest a peak in recruitment in 1992-1993, which coincides with a similar recruitment pattern in the Turks and Caicos Islands. A more worrying trend is that fishing mortality has remained high despite a fall in catch rates 1994-1995. More recent data are unavailable to test whether this is only a short-term fluctuation, or an artefact of changing gear from spears to hooks.

101
Figure 8.9 Observed and expected spear CPUE and fishing mortality for the Great Bahama Bank depletion model.
Figure 8.10 Bahamas total spiny lobster catch by month 1990-1996.
Figure 8.11 Observed and expected CPUE for traps and spears within a single season. While the analysis was not reliable, due to the short time series, changes in gears and data recording methods, the results did suggest that recruitment index models similar to those used in Florida, Cuba and Turks and Caicos Islands could provide good stock assessments
0100200300400500600700800900
1000
1990 1991 1992 1993 1994 1995
Year
Cat
ch p
er m
anda
y
0
0.05
0.1
0.15
0.2
0.25
0.3
0.35
F0
100200300400500600700800900
Aug-
86
Aug-
87
Aug-
88
Aug-
89
Aug-
90
Aug-
91
Aug-
92
Aug-
93
Aug-
94
Aug-
95
Aug-
96
Aug-
97
Date
Cat
ch (m
t tai
ls)
0
10
20
30
40
50
Jul Aug Sep Oct Nov
Month
CPU
E

102
as the data set improves. The pattern in seasonal catches (Fig. 8.10) and the change in average size with the smallest lobster being landed in August support this conclusion. A within-season depletion model was applied to the data available for lobster traps during the 1993/94 season in the southern Great Bahama Bank area and for spear fishing for the northern Great Bahama Bank area during the 1991/92 season. CPUE declined during these periods (Fig. 8.11). The resulting seasonal F values were found to be 1.05 and 0.96 year-1respectively, which are significantly higher than those estimated for the annual model above (0.18-0.3 year-1) and 0.36 year-1 previously estimated for the Bahamas by Ehrhardt and Deleveaux (1996). As in other fisheries, within season estimates of F are probably too high because of emigration and decreasing catchability during the season.
8.3.1.1 Bioeconomic model The available parameters for the Bahamas catch data from casitas were entered into the Brazilian bioeconomic model that was developed at the workshop. The intention was to simulate the bioeconomics that would result from the use of casitas in varying states of nature in the spiny lobster fishery. The simulations addressed the possible relationships between catch, recruitment levels and numbers of casitas. It was found that the Brazilian bioeconomic model did not adequately describe the Bahamian fishery. It is possible that since many of the parameters entered into the model had to be estimated from little data, the quality of these data may have caused this failure.
8.3.2 Bermuda
8.3.2.1 Inshore Model A simple depletion model was fitted to weekly CPUE data from the inshore fishery for the two years of the limited entry fishery (1996-97), when standard lobster traps were used. Two different areas (W and E) were opened each year in a rotating area closure programme. The data from each area were fitted to a separate population model in a manner similar to that used in an analysis of covariance. This allowed parameters to be tested for differences in the same way as would be carried out in a designed experiment.
( ) MMttt eeCNN −
+ −= 21
E C q f Nt t( ) = The population model was used to generate the expected catches. The model was fitted by minimising the sum of square residuals between the squared-root transformed expected and
observed catches.
Natural mortality was assumed constant (0.35 year-1). The model provided an estimate of catchability (q) for these standard lobster traps as well as estimates of population sizes in these four areas.
While it seems likely that initial population sizes will vary between areas and years, it is reasonable to test whether catchability remains constant. Although trap design has been standardised, catchability can still be influenced by other factors, such as lobster behaviour and density, and local environmental conditions.
( )( )∑ −=t
tt CECRSSMinimise

103
Table 8.2 Analysis of variance tables for the inshore area depletion models.
Start week 1 df RSS MS F Different N0 3 2500.5 833.50 270.22 ** Different q 3 125.4 41.79 13.55 ** Error 59 182.0 3.11 Start week 10 df RSS MS F Different N0 3 1334.1 444.78 225.55 ** Different q 3 9.4 3.10 1.59 NS Error 37 73.0 1.97
Although catchability between areas and years was significantly different, separate catchabilities explained little of the variation in the data compared to the changing population sizes (Table 8.2). It was apparent, however, that the model did not necessarily fit the early weeks of the time series (Fig. 8.12). This may be because lobsters are still active during this period and the population is not closed. As an alternative, the model was fitted excluding data from the first 10 weeks. In this case there was no significant difference between catchability estimates among the areas and years (Table 8.2), and no apparent violation of the closed population assumption (Fig. 8.12).
Figure 8.12 Observed and expected catch per trap haul for the inshore areas over two seasons 1996 and 1997, using all data ( ), and excluding the first 10 weeks (---).
West
0123456789
6 9 12 15 18 1 4 7 10 13 16 19
Week
CPU
E (L
obst
ers
per t
rap
haul
)
East
00,5
11,5
22,5
33,5
44,5
6 8 10 12 14 16 18 2 4 6 8 10 12 14 16 18
Week
CPU
E (L
obst
ers
per t
rap
haul
)

104
8.3.2.2 Population Model A Schaefer production model was fitted to the entire data set (1975-97) using number of lobsters landed. The model did not provide a good fit to the data, as it was unable to explain the increase in catch rates from 1990-1997. There was no sign of depletion 1975-1989.
Figure 8.13 Observed and expected catch per haul for a recruitment index model fitted
using puerulus collector data. A recruitment index model was fitted using the puerulus settlement index to determine if there was a correlation between this index and catches in the fishery. The highest correlation was obtained with a 3-year time lag. The present time series is not considered long enough to use this relationship as a predictor of fishery catches, but was used to develop a preliminary recruitment index model.
CPUE prior to 1990 showed no contrast (Fig 8.13), probably because lobster trap hauls were not separated from the finfish trap hauls, so the effort measure was inappropriate. The increase from 1990-1997 covers the experimental fishery during which period lobster-specific trap designs were used in directed effort. Therefore catchability may have shown considerable changes during the period 1975-1997 although the model was not able to account for these changes.
( ) MMtttt eeCNRN −
+ −+= 21 λ
The puerulus settlement index series covers the period 1983-1995 giving, with a 3 year delay, recruitment indices for the 1986-1996 catch and effort series. Prior to this, a fixed recruitment was assumed. The series exhibits an increase in recruitment for the period 1990-1997, which partially explains the higher catch rates during this period. The years 1996-1997 also include the catch and effort from the newly opened inshore areas, which exhibited a much higher catch rate.
The model is preliminary. It will be replaced as more data becomes available under the ongoing data collection programme. However these results do suggest that the indices obtained from the inshore depletion models and the puerulus indices will lead to an accurate assessment of the Bermuda stock dynamics.
8.3.3 Northeast Cuba The assessment was restricted to the north-east shelf of Cuba, which accounts 15% of the total lobster landings. The assessment approach was first to use a depletion model based on fishing seasons to estimate a recruitment index, and then to use that recruitment index in a
0
0,5
1
1,5
2
2,5
3
1975
1977
1979
1981
1983
1985
1987
1989
1991
1993
1995
1997
Year
CPU
E (L
obst
ers
/ hau
l)

105
modified DeLury model on an annual basis (see Chapter 6.3.2 for details on the depletion model used).
Figure 8.14 Total catch and recruitment indices for north Cuban shelf The resulting recruitment indices were heavily correlated with the observed annual catches from the fishery (Fig. 8.14). The size frequency of the catch consists of predominantly small lobster. It was suggested that each year's new recruits make up almost all the catch, so that the fishery is almost exclusively driven by the index. The results suggest a small decline in recruitment over the period. However the correlation of recruitment with catch makes it difficult to assess whether the model is correct. The fishing mortality is unrealistically high, but probably reflects emigration. Unfortunately the model is unable to predict future catch rates and requires additional indices for other life stages for an effective stock assessment.
8.3.4 Florida USA
8.3.4.1 Non-Equilibrium Production Models A dynamic version of Fox’s production model was developed in a spreadsheet. Total spiny lobster catch and CPUE, catch per annual trap, for the period 1960 through 1996 were used in this analysis. U.S. landings of spiny lobster caught off the coast of other nations were excluded from the total catch, and catch per annual trap was calculated by dividing total catch by the number of traps fished on an annual basis. The parameters Fmsy, Bmsy, and MSY estimated by this model were:
F 0.164 Bmsy 12627 MSY 2072
Given that the spiny lobster harvest in Florida has averaged over 2 772mt over the last 21 years, the model results for MSY and Fmsy indicate that the spiny lobster is either severely overfished or that the model is underestimating these parameters. Due to lack of contrast in CPUE measurement, especially in recent years, the latter is the much more likely of these two possibilities.
8.3.4.2 Catch Effort Data Analysis (CEDA) Package The CEDA recruitment index model was fitted with recruitment numbers derived from the DeLury model along with total catch, mean weight data. Results from fitting this model gave low q values and therefore very high population numbers (R2 = 0.93) after the exclusion of data for 1994 and 1995. The justification for the exclusion of the 1994 and 1995 data points was that Florida’s Trap Reduction Program had altered catchability when compared to prior years. The results from this model fit attempt were considered unreliable. The estimates
0
1000
2000
3000
4000
5000
6000
7000
1987
1988
1989
1990
1991
1992
1993
1994
1995
1996
1997
Years
Rec
ruits
(100
0 lo
bste
r)
0
500
1000
1500
2000
2500
3000
Cat
ch (1
000
lobs
ter)Recruitment
Catch

106
were unrealistic and inconsistent with other model results, and the data series showed inadequate contrast (no period of increase) to inspire confidence.
8.3.4.3 DeLury Depletion Model A DeLury depletion model was developed to estimate recruitment trends from 1985 through 1997 using an MS Excel spreadsheet developed for the workshop. The depletion model was appropriate because Florida’s spiny lobster fishery has marked within season differences (Fig. 8.5). The model used monthly commercial landings in metric tonnes, estimates of recreational harvest in July and August, standardised commercial catch rates in number per trip, and average weights per month derived from sex-specific length frequencies. The length frequencies from 1985 and 1986 only came from the Lower Keys, but were applied to the entire Florida Keys fishery. The State of Florida initiated a trap reduction program beginning with the 1993-94 fishing season and consequently a separate catchability coefficient was estimated for the landings afterwards. To simplify the model, each season’s recruitment occurred in August. The model was fit to the commercial harvest expressed in numbers of lobsters using Excel’s Solver tool that varied the numbers of recruits until the squared difference between the predicted monthly commercial catch and the observed was minimised. The model tracked the seasonal pattern in landings quite well (Fig. 8.15, R2 = 0.958, df = 92). The recruitment trend from the depletion model had peaks in the 1988-89 and 1994-95 fishing season and has been approximately 10 million animals per year since (Fig. 8.16). The catchability coefficient for a commercial trip estimated for the period after traps were reduced (q2 = 1.99 10-5) from the coefficient estimated for the earlier period (q1 = 1.98 10-5).
Figure 8.15 Monthly observed ( • ) and expected ( )commercial catch in numbers per trip as estimated from the depletion model
Although the same catchability coefficient was used for all months within a fishing season, the number of traps fished per trip (calculated from the number of lobsters per trip from trip tickets and the number of lobsters per trap from observers) changes during the season with declines after December (Fig. 8.17). Thus, part of the decline in catch per trip during the season is due to fishers hauling fewer traps per trip and not solely to reduced availability of lobsters.
0
50
100
150
200
250
300
350
8507
8601
8607
8701
8707
8801
8807
8901
8907
9001
9007
9101
9107
9201
9207
9301
9307
9401
9407
9501
9507
9601
9607
9701
9707
9801
Month
Com
mer
cial
num
ber p
er tr
ip

107
Figure 8.16 Recruitment trends from depletion model and from the age-structured analyses
Figure 8.17 The average number of traps fished per trip by month
Figure 8.18 Comparison of Florida’s probabilistic model with the von Bertalanffy growth model from Northeast Cuba
0.0E+00
5.0E+06
1.0E+07
1.5E+07
2.0E+07
2.5E+07
85-8
6
86-8
7
87-8
8
88-8
9
89-9
0
90-9
1
91-9
2
92-9
3
93-9
4
94-9
5
95-9
6
96-9
7
97-9
8
Fishing year
Rec
ruitm
ent
DeluryADAPTICAADAPT (Cuba)
0
25
50
75
100
125
150
175
200
Aug Sep Oct Nov Dec Jan Feb Mar
Month
Aver
age
num
ber o
f tra
ps p
er
trip
0
2
4
6
8
10
12
14
76 105 120 76 105 120Example carapace lengths (mm)
Tim
e af
ter s
ettle
men
t (yr
)
Florida Cuban NE
Males Females

108
8.3.4.4 Growth Muller et al. (1997) modelled the growth of spiny lobsters in Florida with sex-specific probability models of moulting within a month depending upon time of the year and current carapace length and if the lobster moulted then it calculates the change in carapace length. The tagging programmes that produced these recaptures were conducted in 1974-75 and 1978-79. According to the probability models, an average male lobster recruits into the fishery at 21 months and an average female recruits into the fishery at 31 months. Since lobsters longer than 105mm are scarce in Florida’s landings, the average time in the fishery would be 2.0 years for males and 2.3 years for females. The recaptures contained very few larger lobsters and consequently, the model is very uncertain for lobsters greater than about 120mm. Therefore to check the robustness of the conclusions based on the Florida model, length frequencies were assigned ages by using Cuba’s von Bertalanffy growth equations developed for the Northeast coast of Cuba. Cuba’s model extended the range of lengths that could be aged to 150mm for females and 180mm for males. While the time from settlement to recruitment is similar for males, the Cuban model estimates that the average female recruits 10 months later.
8.3.4.5 Length-based Methods Because of the uncertainty of growth, the sex-specific length frequencies were analysed with length-based methods. To size changes within seasons, only lengths from August through October were included in these analyses. The first approach used both ELEFAN I and Bhattacharya’s methods in FiSAT; however neither method was able to reliably detect more than a single mode. This was confirmed by attempting to use LFDA (MRAG, 1992). Being unable to identify modal progressions for estimating L∞ and K parameters from the length frequencies, those parameters were used from Cuba’s Northeast coast again to calculate catch curves. The fishing mortality rates from the length-based catch curves ranged between 0.20 year-1 in 1992-93 and 0.60 year-1 in 1988-89 with a marked decline between 1990-91 and 1992-93. This analysis illustrates some of the concerns with using equilibrium catch rates because the highest mortality coincided with the highest recruitment year and the seasons with low fishing mortality rates occurred during a period in the fishery when fishers captured some larger lobsters while exploring new areas.
Figure 8.19 Comparison of fishing mortality rates from length-based catch curves and from the depletion model
0
0.1
0.2
0.3
0.4
0.5
0.6
0.7
85 86 87 88 89 90 91 92 93 94 95 96 97
Year (Aug-Oct)
Fish
ing
mor
talit
y
DeLury Length based

109
8.3.4.6 Age-Structured Assessment An alternative approach to assessing the spiny lobster fishery is to estimate the population size and fishing mortality rates by ages and gender instead of treating the stock as a single entity as is done by the depletion model. Because these models do not produce unique solutions, they use indices of abundance to produce the best fit. Two age-structured models were available at the workshop, ADAPT, version 3.0 (Restrepo, 1996), and Integrated-Catch-at-Age, version 1.2 (Patterson and Melvin, 1996). ADAPT is a sequential population analysis that estimates the population size and the fishing mortality rates from the oldest age in the cohort backwards to the youngest age. The user supplies estimates of the age-specific selectivities in the most recent year and estimates of age-specific natural mortality rates. Integrated Catch-at-Age (ICA) is a composite of a separable virtual population analysis and sequential population analysis. The separable portion partitions fishing mortality into age-specific selectivity (Sa) and into year-specific fishing mortality multipliers (F'y) that are assumed to be independent such that the fishing mortality experienced by a stock of a given age in a given year is
Fy,a = F'y Sa
The number of years for the separable model is specified by the user and the remainder of the years and ages are resolved in a manner similar to ADAPT.
After assigning ages with the stochastic growth model developed from Florida's historical tagging data (Muller et al., 1997), both of these models were applied to the Florida Keys fishery using ages one through ten and all older ages collapsed into an 11+ group. Both methods used the same tuning indices and produced similar estimates for the earlier portions of the time series but using the separability model in the five recent years, ICA produced higher numbers of lobsters and lower fishing mortality rates than ADAPT. The fishing mortality rates reflected the marked increase that the commercial catch per trip has shown since 1992-93.
When the analyses were repeated ages assigned from the Cuban growth models, The resulting catch-at-age tables contained only ages 1 to 6+ for males and 2 to 7+ for females. Using these catch-at-age tables with the same indices from the earlier analyses, ICA was unable to estimate the variability in the fishing mortality multiplier for females and, while a solution was found for males, the results were poor. For example, in the most recent fishing season the estimate was 0.18 year-1 (range of plus/minus one standard deviation of 0.04 to 0.86 year-1). However, ADAPT was able to find a solution and the trend in recruitment was very similar to that found by the depletion model (Fig. 8.16).
The age-structured analyses indicate that fishing mortality rates have been lower after traps were removed from the fishery and that the high level of landings reflects higher population sizes.
8.3.4.7 Bioeconomic modelling The bioeconomic model developed in the workshop (Chapter 9) was configured for the US fishery using data on annual landings and numbers of traps from Labisky et al. (1980) for the period of 1950 to 1974 and then NMFS General Canvass data for the later years. The model indicates that current recruitment levels would support a fishery using 540 000 traps which is slightly less than the 582 000 traps currently in the fishery and is more than the 1998-1999 level (520 000 traps). The model also indicated that with the simple cost of fishing a trap, the rent was negative when there were high numbers of traps in the fishery prior to the Trap Reduction Program. The highest rent occurred with 240 000 traps with landings of 2 200 tonnes. A Monte Carlo simulation indicated that if the cost per trap was varied by 20% and also the catchability by 20%, the probability of rent being negative was 15% in the first year and 25% after three years. Even though the model fits the historical data well, the next step in the development of this model is to critically review the input parameters.

110
8.3.5 Turks and Caicos A recruitment index model has been developed for the Turks and Caicos Islands lobster fishery (Medley and Ninnes, 1997), which used catch effort data and mean weight to convert catch weight to catch numbers. The model did not make use of the available size composition data, as there was no reliable growth model available. A method was developed in the workshop to make use of commercial size category data using a growth model based on Florida tagging data (Muller et al., 1997) with the specific aim of estimating selectivity.
The growth model was encapsulated in a transition matrix, which described the progression through the commercial size categories. The transition probabilities were based on simulations of the growth of lobsters (see Muller et al., 1997) drawn from size frequency samples taken from the beginning of the season (i.e. new recruits to the fishery).
The population model incorporates size structure as the number of lobsters in each size category. The difference model includes mortality and growth as rate of transfer between sizes over months.
where Nit = the population at month t in size category i, aji = proportion of animals moving from size category j to i during a unit of time, M = natural mortality, wi = average live weight of
an animal in size category i, qi = catchability of animals in size category i, and Ct = catch in weight of lobster during time t. In addition, at the beginning of each season in August, recruits were added to the population based on the estimates from the original recruitment index model.
The model was fitted to the observed total catch weight and the export tail weight by size category, conditional on the total reported export tail weight.
where Cit = reported export tail weight converted to live weight, Et = the estimated (approximate) effort required to obtain the reported total exports (ΣCit) based on the observed CPUE. Natural mortality is assumed constant (0.35 year-1), but selectivity (qi) was estimated from the available data. A statistical weight, W, allows for different variances between the size composition and catch observations.
While the model does fit the data (Fig. 8.20; r2=0.92), the size structure model fit is worse than the straight recruitment index model. This is not surprising as the model tries to take account of both the variations in catch rates within each season and the additional size composition observations. Catchability may well be changing through the season, making it difficult to fit the model on monthly catch and effort data. Size category data is variable, and may not be accurate over the whole time series, and there are also significant periods with
2
0
01,
MtS
jjtji
itiMi
jjtjiti ee C
Nqw
NqNaN −
=
−
=+
∑∑ −=
( ) ( )
iittiit
iiittit
t i iit
iititittt
wNEqCE
wNfqCE
CECCECCECWRSSMinimise
=
=
−−−+−=
∑
∑ ∑ ∑∑
)(
)(
)()()(2
22

111
no reports. However, despite these inaccuracies the model does suggest a selectivity pattern that predominantly takes smaller lobster (Fig. 8.21), which appears reasonable.
Fluctuations in egg production from the stock may explain changes in recruitment (Fig 8.22). However egg production in this preliminary model was only indicative. Females are not separated from males in the growth model, but grow much more slowly. This inaccuracy may explain the 6 year delay between maximum egg production in 1986 and the high recruitment in 1992, which is too long based on current understanding of spiny lobster life history. However, when testing the results to variability in growth, the selectivity pattern (Fig. 8.21) remained stable.
Figure 8.20 Observed and expected CPUE for Turks and Caicos Islands size structured DeLury model
Figure 8.21 Selectivity as a proportion of maximum catchability for the commercial export tail weight categories.
0102030405060708090
77 78 79 80 81 82 83 84 85 86 87 88 89 90 91 92 93 94 95
Year
CPUE
(Kg
/ boa
t day
)
Observed
Expected
00.10.20.30.40.50.60.70.80.9
1
5 6 7 8 9 10 11 12 14 16 20 24
Tail Weight Category (Oz)
Sele
ctiv
ity (P
ropo
rtio
n)

112
Figure 8.22 Estimated recruitment and spawning stock egg production. Egg production is based on tar spot probability and fecundity (see Chapter 5) for the
populations in size category in June. The estimated catchability was lower than that estimated with the non-size structured model (q=1.64*10-05 as opposed to q=3.82*10-05). The low catchability translates to low fishing mortality over the range of observed effort (F = 0.05 to 0.16 year-1), producing almost linear yield-per- recruit and spawners-per-recruit when plotted as a function of fishing effort, which is of little help in choosing an appropriate control. The low fishing mortality and selectivity pattern suggest the fishery is heavily dependent on new recruits for its success and the fishery should be managed to maintain profits and protect recruitment.
This approach has the potential for building size structure into recruitment index models can be applied to many stocks in the region. The method produces an alternative way to make use of both CPUE and size frequency data simultaneously, but needs further development and verification. The key issue in terms of development of the transition matrix model, is whether the currently defined states are an adequate description of the stock. The underlying assumption, that the size categories (model states) completely define the stock structure is questionable, and alternative models where states are defined not just on finer size categories, but also sex and season, need to be explored.
8.4 STOCK STATUS AND RECOMMENDATIONS
8.4.1 Bahamas The most important problem facing fisheries management in the Bahamas is handling the uncertainty of the stock status. In spite of the fact that the data collection system has been much improved in recent years, there is more that needs be done. The entire data collection and management system needs to be reviewed to ensure it will provide adequate advice for the optimal management of all fisheries in the Bahamas.
In light of the situation regarding the data available that is required for stock assessments, the status of the stock cannot be determined with any certainty. However, catch has been relatively stable since 1991, which may indicate that current fishing areas are at or near full exploitation. The stable landings are probably due to the high opportunity cost with other economic opportunities to fishers. Some indications of recent drops in catch rates may have resulted in stable catch and effort due to rent dissipation. Economic controls, such as export taxes, may be required to realise significant benefits from the fishery in the long term. An alternative possibility, which cannot be discounted with the available information, is that current catches are unsustainable, and a long term decline in the fishery is possible as recruitment drops in line with decreased spawning stock, after some delay.
2E+11
2.1E+11
2.2E+11
2.3E+11
2.4E+11
2.5E+11
2.6E+11
2.7E+11
1977
1979
1981
1983
1985
1987
1989
1991
1993
1995
Year
Egg
Prod
uctio
n
0
50
100
150
200
250
300
Recr
uitm
ent
Egg Production
Recruitment

113
It is also recommended that a special unit be established within the department to conduct and co-ordinate data collection among the Bahamian banks, and carry out stock assessments. Personnel in this unit would require specialised training.
8.4.2 Bermuda Although catch rates have risen recently after a period of decreased catch, it is not clear to what degree this is due to changes in catchability as opposed to changes in stock size. Current catches appear to be equal to long term catches observed 1970-1990, which suggests they are sustainable. The current management strategy of tight control of effort together detailed monitoring of catches and fishing activity appears to be adequate for protecting the stock and fishery in the long term. However, the spiny lobster, P. argus, is at the edge of its biological range in Bermuda, making it more vulnerable to environmental effects and overfishing, so any changes to management should be undertaken with particular care and good scientific backing.
The data collection programme in Bermuda is detailed and complete. This should result in excellent stock assessments in the long term. In the short term, there is an important opportunity for fishing experiments, which will help not just Bermuda, but also other countries in the region. Bermuda can carry out experiments to test the effect of casitas on catchability and population size, and the impact of different trap density on catchability, both important questions in stock assessment. It is also important that Bermuda re-establish its puerulus collector programme, which provides one of the best recruitment time series for the region. If possible Bermuda Division of Fisheries should continue its on-going tagging experiments to improve estimates of key population parameters, which may be very different from those populations towards the centre of P. argus range.
8.4.3 Florida The Florida fishery appears to be fully exploited. The depletion model indicates that spiny lobster in Florida experience very high cumulative fishing mortality rates (0.67 to 0.97 year-1), which is between two and three times the natural mortality rate. However, other evidence such as the stable landings and the size of lobsters landed from the trap fishery indicate that the model may not be able to explain the entire situation. An alternative explanation is that the fishing mortality includes a loss rate from the shallow waters where the fishery operates and that spiny lobsters migrate to deeper waters along the reef face and cease to be vulnerable except to divers in the upper 30m. Given this, the Trap Reduction Program appears to be an important step in the right direction, potentially reducing both fishing mortality and economic costs to the fishery. While landings have been stable for over 20 years, the number of traps had tripled until the Trap Reduction Program began in 1993 and approximately 300 000 traps have been eliminated from the fishery.
There remains considerable uncertainty regarding recruitment. The age-structured models indicated an increase in recruitment but the depletion model estimated flat recruitment in the past four seasons. The standardised numbers per trap of pre-recruit lobsters from the observer programme is increasing since 1993, supporting the age-structured models.
In developing the stock assessment models, the lack of growth information on larger lobsters is a major source of uncertainty in the fishery. As the numbers of traps are reduced in the fishery, presumably, survival will be higher and hence it will be even more critical in the future to be able to age larger lobsters. Furthermore, the tagging information used to develop the growth model is 20 years old and may not reflect current conditions. Therefore, it is recommended that fishery-independent tagging programs be established region-wide.
A second recommendation especially for the US fishery is to collect operating cost data for the spiny lobster fishers. The preliminary bioeconomic analysis presented for the US report was only able to use the total ex-vessel value in 1996-97 divided by the total number traps as a proxy for the cost of operating a trap.

114
8.4.4 Northeast Cuba Preliminary results from the stock model suggest recruitment has fallen since 1989, resulting in consistently lower catches. This may be due to exploitation, but without indices of spawning stock size or estimates of escapement, it is difficult to judge whether effort reduction would produce higher catches. Although lower, recruitment has remained stable 1992-1997, so urgent action is not required.
It may be important to review the way effort is recorded for this fishery. Traps are set around pesqueros, so it is not clear how effort should be measured. More detailed data on fishing activity, such as number of traps hauled and soak time, may be necessary. Pesqueros adapted as traps may provide stock abundance indices as well as an alternative method to catch lobster.
Indices monitoring different life stages in the north Cuban fishery need to be set up or maintained in much the same way as they have been in the Gulf of Batabanó, such as juvenile and puerulus collectors. Additional indices on the mature adults are necessary to estimate escapement. How these might be obtained is unclear, but exploratory trapping in deeper water may provide the necessary data.
One alternative option to maintaining the current management controls is to take measures to reduce fishing mortality to see whether this will result in increased catches in 3-5 years. This should primarily be considered a way to obtain important information for setting optimal controls. In all case, indices of juvenile and spawning stock abundance are required for management in the longer term.
8.4.5 Turks and Caicos Cycles evident in the CPUE since 1966 indicate fluctuations in stock size. The data is consistent with these cycles being driven by the fishery, and in particular changes in opportunity costs and profits from fishing. The economy in the Turks and Caicos Islands is driven in a similar way to the Bahamas, with sporadic large investments in the tourism industry producing fluctuations in labour opportunity costs for fishermen, as well as changing prices and catch rates for the alternative fish product, conch. The successful implementation of a total allowable catch for conch, suggests a similar measure needs to be applied to lobster to alleviate these fluctuations, as well as further economic controls, such as limited entry and export tax, to increase economic rent from the resource. The models suggest an increase in recruitment towards the end of the 1990s, although there are no data to verify this yet.
The Turks and Caicos Islands requires proper implementation of their management plan. There is an urgent need to extend the current conch quota system to lobster, as well as implement additional closed season, tax and limited entry controls to protect resource rent. These controls can be set based on current data and models.
The Turks and Caicos Islands also possess an excellent bioeconomic data set extending back to 1966. This data set has only been partially analysed and the database could easily be completed at low cost. Given the paucity of information in the remaining Bahamian islands, it is of interest to the region to see this data set updated and a bioeconomic model

115
9 BIOECONOMICS
J.C.Seijo, E.Pérez, R. Puga and R.C. de Almeida Carvalho
9.1 LOBSTER FISHERIES MANAGEMENT PLANS The development of management plans for lobster fisheries in the WECAFC region requires a systematic integration of the resource biology and ecology with the economic and social factors that determine resource and fishers' behaviour over time (Seijo et al., 1997). The use of reference points (see Part III) as objectives for resource administration represents an important step in the management process. Also, the recognition of the uncertainty, present in various parts of the fishery system, is fundamental for a precautionary approach to decision-making. To aid this process, the use of fisheries-specific mathematical models allows researchers and managers to experiment with different management options and to observe the dynamic consequences on different parts of the system and corresponding performance indices.
There are a number of steps involved in the development of an intelligent management plan for a spiny lobster fishery that recognises risks and uncertainty:
1. Undertake biological, economic and social assessment of the fishery, (i.e. estimate size and dynamics of the population structure, age structure of the harvest, costs and revenues of alternative fishing methods, direct employment and export earnings);
2. Select the appropriate performance indices for the lobster fishery based policy considerations;
3. Establish limit and target reference points for the selected performance indices;
4. Identify alternative management strategies for the fishery with the specific policy instruments;
5. Identify different states of nature for those fishery variables and parameters (e.g. puerulus recruitment, natural mortality, unit costs of effort, etc.) that involve high levels of uncertainty;
6. Determine if mathematical probabilities can be assigned for the occurrence of the identified states of nature;
7. Build decision tables with and/or without mathematical probabilities;
8. Apply different decision criteria reflecting different degrees of caution or risk aversion to select the optimum management strategy;
9. Estimate, through Monte Carlo analysis, which accounts for uncertainties in parameter estimation, the probabilities of exceeding limit reference points and achieving target reference points of performance indices for alternative management strategies under consideration; and
10. Periodically re-evaluate the fishery to establish new reference points and management strategies.
9.2 THE PRECAUTIONARY APPROACH TO LOBSTER FISHERIES MANAGEMENT
9.2.1 Dealing with risk and uncertainty Hilborn and Peterman (1996) identified a set of sources of uncertainty associated to stock assessment and management, including uncertainty in resource abundance, in model structure, in model parameters, on behaviour of resource users, in future environmental

116
conditions, and in future economic, political and social conditions. To deal with these variety of uncertainties using a precautionary approach, it was suggested in the Lysekil meeting (FAO, 1996), the use of decision theory (Bayesian and non-Bayesian), and the incorporation of limit and target reference points to manage fisheries.
9.2.2 Decision tables with and without mathematical probabilities. Decision makers in fisheries are expected to select one management strategy, d, out of a set of D alternative strategies. When selecting a strategy, the fishery manager should be aware of the corresponding consequences. These consequences are likely to be a function of the cause-effect relationships specified in the lobster fishery model, the estimated bioeconomic parameters, and the possible states of nature.
In decision theory, it is important to be able to estimate a loss of opportunities function, L(d,θ), which reflects the resulting losses of having selected strategy d when the state of nature occurring is θ.
If prior or posterior probabilities are available to fishery managers for building decision tables, the expected values (EV) and variance (VAR) should be estimated for the selected performance indices (e.g. net present value of the fishery, biomass or yield at the end of the simulation period, direct employment, export earnings), as follows:
EVd = ∑Pθ PVθd
VARd = Σ Pθ (PVθd - EVd)2
where Pθ are the probabilities associated with the different states of nature, PVθd are the
values of the performance index resulting from a management decision d when state of nature θ occurs. A risk neutral fisheries manager will select the management strategy that generates the maximum expected value with no consideration of the corresponding variance. A extreme risk averse decision-maker will tend to select the fisheries management strategy that generates the minimum variance. There are however different degrees of risk aversion, and therefore decision theory provides alternative criteria for increasing degrees of caution in decision-making. To apply these concepts to the precautionary approach to fisheries management, we will describe in the following section decision criteria with and without mathematical probabilities.
9.2.2.1 Bayesian Criterion The Bayesian criterion is a procedure that uses prior or posterior probabilities to aid the selection of a management strategy. In this case, the lobster fishery manager selects the decision that minimises the expected loss of opportunities. Decisions without experimentation use prior distributions estimated from experiences that are translated subjectively into numerical probabilities. Lobster fishery decisions that are based on additional experimentation can use posterior probabilities. Posterior probabilities are the conditional probability of state of nature θ, given the experimental data as well as the subjective prior.
9.2.3 Decision criteria without mathematical probabilities In the absence of sufficient observations to assign probabilities to possible states of nature, there are three decision criteria reflecting different degrees of precaution concerning selection of management strategies (Schmid, 1989; Seijo et al., 1997a,b).
9.2.3.1 Minimax Criterion The Minimax criterion estimates the maximum loss of opportunities of each management strategy and selects the one that provides the minimum of the maximum losses. This

117
criterion proceeds as if nature would select a state that is least favourable for the decision-maker.
9.2.3.2 Maximin Criterion This criterion uses the performance index decision table that estimates the resulting values for a set of combinations of alternative decisions and states of nature. The criterion calculates a vector of the minimum values for the performance index resulting from each alternative management decision. Then, the fishery manager proceeds to select the maximum of the minimum of those values. This is the most cautious of the decision theory approaches.
9.2.3.3 Maximax Criterion A risk-seeking fishery manager would tend to apply the Maximax decision criterion when selecting a management strategy. The criterion calculates a vector of the maximum values for the performance variable resulting from each alternative management decision. Then, the fishery manager proceeds to select the maximum of those values and the corresponding decision that generates it.
9.2.4 Monte Carlo analysis and probabilities of exceeding limit and target reference point
Given a probability density function with known parameters, Monte Carlo analysis allows the uncertainty associated with natural variations and imperfect knowledge about the system to be modelled. The process consists of an iterative calculation of the output (performance)
Figure 9.1 A probability distribution derived from a performance index frequency distribution.
variables, where in each trial a new value for the unknown parameter is generated from a specified probability density function. The number of trials are set before-hand, but in general there should be as many as reasonably possible. As a result, a frequency of performance index values is produced, which can be interpreted into a probability distribution (Fig. 9.1).
In Figure 9.1, the X-axis represents the index observed, and Y-axis the probability of occurrence for each X value. Perpendicular to the X-axis are the predetermined values for the target (right perpendicular arrow) and limit (left perpendicular arrow) reference points. The area below the curve to the left of limit reference point is the probability of a undesirable event occurring in the fishery, whereas the area below the curve to the right of the target reference point is the probability of reaching the desired state of the fishery (Pérez, 1996).
0.000.050.100.150.200.250.300.350.400.45
0 2000 4000 6000 8000 10000Observed Variable
Pro
babi
lity

118
9.3 A GENERAL BIOECONOMIC MODEL FOR THE SPINY LOBSTER FISHERY
A general behavioural model for the fishery was developed as a fully integrated fishery (i.e. a harvest sub-sector linked to a processing sub-sector, both related to the biological and economical subsystems). The Cuban fishery was taken as a system represented as a quantitative predictive model. The structural complexity in the Cuban fishery would allow the evaluation of other fishery systems as particular cases of this more general model. The Cuban model is structured with four sub-models: a biological sub-model linked to technological, processing and economics sub-models. It is a dynamic, extended version of a static bioeconomic model developed in Cuba, during a bioeconomics workshop in 1995 sponsored by FAO.
9.3.1 Biological sub-model Current stock size by sex and age is needed as an input in order to initiate this sub-model. Survivors through fishing seasons are calculated as:
)*(,,1,,
,,,,,* tgisgtis MSFtistis eNN +−
+ = (1)
where Ns,i,t is the number of individuals with sex s and age i at time t, Fs,i,t is the sex and age specific fishing mortality at time t exerted by gear g, Si represents the selectivity pattern (both generated from the technological sub-model) and Mi is the natural mortality. Biomass by sex and age is determined by:
)*(* ,,,,sb
isstisti LaNB = (2)
where, Ls,i is the length of sex s at age i, and a and b are constants from a length-weight relationship. Length at age is calculated using the von Bertalanffy growth model.
−−−= ∞
)(1 ,
,,sos
sisiik
LL e (3)
The total biomass by sex at time t is determined by:
∑=
=
=15
2,,,
i
itists BTB (4)
Recruitment to the stock (age two) for the following year was considered either a constant or dynamic using alternative recruitment functions. To illustrate, the Beverton-Holt recruitment function can be expressed as
+=
−≥
−≥
2,4
2,4*
t
tt B
BR
βα
(5)
where alpha and beta are constants, and B≥4,t-2 represents the biomass of females equal to and older than four years that existed two years ago, because current recruits (age two years) are generated in the spawning season t-2. The numbers of males and females entering the fishery are calculated by multiplying Rt by the sex proportions.
9.3.2 Technological Sub-model To initiate this sub-model, current effort (total fishing days) for the two fishing seasons, “levante” and “recalo”, is needed, as well as the length of the closed season. The first step is to calculate the seasonal fishing mortality for each fishing gear (“pesqueros” and big traps). Fishing mortality is calculated by sex and age according to:
gsisgtgtis qSfF ,,,,,, **= (6)

119
where ft,g is the fishing days for each gear in each fishing season, S is the selectivity pattern by age, subscript s is the sex and the catchability coefficient is denoted by q. The current number of “pesqueros” and big traps are required to initialise the model. The number of fishing days by gear in subsequent years are calculated using the model, as will be explained below.
The catch by gear, age and sex in fishing season t is calculated using the standard catch equation:
[ ] tisMF
tgtisgtis N
MFF
C tgtisgtis e ,,)(
,,,,,, *1* ,,,,,, +−−
+= (7)
The total catch in a year is:
∑=
=
=15
2,,,,,
i
igtisgts CC (8)
The number of vessels involved in a season's fishing is calculated by relating total fishing effort applied in a year for both gears to total fishing days per vessel:
=∑TFDV
fNV g
tg
t
,
(9)
where TFDV is the total fishing days per vessel in a year.
Number of “enviadas” is calculated by multiplying NVy by the current relationship between “enviadas” to number of vessels (in this case 0.125)
CVCENVNE tt *= (10)
Number of “lobster gathering centres at sea” was calculated according to:
CNVCCANVNCA tt *= (11)
where CCA is the current number of “lobster gathering centres at sea” and CNV is the current number of vessels (in this case this ratio is 0.117).
The total number of “pesqueros” in a year is calculated as:
CNVCNPNVNP tt *= (12)
where CNP is the current number of “pesqueros” (in this case this ratio is 820). In the same way the total number of big traps in a year is calculated using:
CNVCNBTNVNBT tt *= (13)
(in this case this ratio is 820).
To predict the new effort per gear (total fishing days) in the next season, the effort dynamic is modelled using Smith’s approach (Smith, 1969)

120
tg
t
t
ggtgt
PPdtdf
dtdf
ff
*
1
,,1
φ=
+= ∫+
+
(14)
where φ is a positive constant (Smith, 1969), and PPt is the private profit generated over time from the economics sub-model. If φ is equal to zero, then effort is constant throughout time. Furthermore, the technological sub-model must allow for the evaluation of changes during the closed season. To do this, the ratio between the number of days in each season and total fishing days within it is calculated (actually this ratio is 74 for “pesqueros” and 70 for big traps). So, if the closed season is extended, for each extra day, 70 traps day-1 is added to the effort, or subtracted if the closed season is reduced.
9.3.3 Processing Sub-model The total catch by gear, age and sex calculated from the technological sub-model is assigned to four processing lines: pre-cooked, tails, alive and “others”. In this sub-model the amount of catch allocated to each processing line is calculated according to:
lgtisgtisl TCCP γ*,,,,,,, = (15)
where TCs,i,t,g is calculated from the technological sub-model, and γl is the current ratio of the catch assigned to the processing line l. CPl,s,i,t,g is transformed into a final product using a conversion factor η, which is specific for each processing line:
lgtislgtisl CPFP η*,,,,,,,, = (16)
9.3.4 Economics sub-model The revenue per gear, and processing line is calculated as:
∑∑=l
litisgi
tg pFPTR ,,,,, * (17)
where pi,l is a vector of wholesale prices per age (size) and type of final product.
Profits generated by each gear per fishing season (used as an input in the technological sub-model) is calculated as follows:
tgtgtg TCTRPP ,,, −= (18)
where TCg,t are total costs for the gear g in the season t. The total profit per year is determined by:
∑=g
tgt PPTPP , (19)
The total costs per gear are separated into variable and fixed cost. The general formula to estimate total cost is as follows:
tgtgtgtg tcsngtcprocessitceffortTC ,,,, ++= (20)
where tceffortg,t are costs associated with units of effort of gear g in season t; tcprocessingg,t are costs related with processing the catch generated by gear g; and tcsg,t are total costs associated with support inputs (vessels, enviadas and lobster gathering centers at sea).
Quantitative relationships for above items are as follows:
( ) ( ) ( )tggtggtggtg nuocunucpufdcfdtceffort ,,,, *** ++= (21)

121
where cfdg is the cost per fishing day and fdg,t are total fishing days of gear g in season t; cpug is the cost per unit effort of gear g and nug,t are the numbers of units of gear g operating at time t; ocug is the opportunity cost per unit of gear g and nug,t are the number of units of gear g operating at time t.
∑=
=
=4
1,, ***
l
lllltgtg cpCngtcprocessi ηγ (22)
where Cg,t is the gear g catch in time t, and cpl is the cost per tonne processed.
( ) ( ) ( ) ( ) ( ) ( )tg
gtg
tttttttg tfd
tfd
acncacocanenvcoenvnvcovncafccanenvfcenvnvfcnvtcs ,
,
, *******
++++++
=
∑
(23)
where fcnv is the fixed cost of one vessel, and nvt is the number of vessels at time t; fcenv is the fixed cost of one enviada, and nenvt is the number of enviadas at time t; fcca is the fixed cost of one lobster gathering centre at sea, and ncat is the number of lobster gathering centers at sea at time t; cov, coenv and coca is the opportunity cost of one vessel, enviada and lobster gathering centre at sea at time t, respectively.
9.3.4.1 Net present value for the fishery Net present value (NPV) was calculated according to the equation:
( )∑
=
= −=
15
0 1
t
tt
tPPNPV
δ (24)
where δ is the discount rate. The time period simulated was 15 years. Different discount rates were used in the analysis to reflect different 'prices' of time.
Although this general model was developed to describe the spiny lobster fishery in the Batabanó Gulf in Cuba, the main principles and mathematical functions were used, with appropriate modifications, to represent lobster fisheries in Brazil and Isla Mujeres (Mexico). The next section presents three case studies using this approach, in alphabetic order.
9.4 CASE STUDY 1: LOBSTER FISHERIES IN NORTHEAST BRAZIL
The exploitation of the spiny lobster in Brazil began in the mid-1950s in Recife and Fortaleza. A rapid expansion of the fishery took place since 1965, after the technological and economic feasibility was demonstrated. Two fishing methods have coexisted since then: traps and gill nets. Three fleets exercise their fishing effort on this resource: two artisanal (with and without outboard engine), and an industrial fleet. The former operate in near-shore areas while the latter apply their effort in deeper and more distant waters. The fishing intensity has traditionally concentrated in northeastern Brazil. In the last few years there has been an exploration of new fishing areas, mainly in the north-western and south-western fishing banks. The highest fishing intensity is applied in north-eastern Brazil.
9.4.1 Mathematical model and bioeconomic parameters The mathematical model describing the Brazilian fishery is a simplified version of the one described for the Cuban and Mexican case studies. In the Brazilian bioeconomic model the

122
processing sector is not included. Effort was standardised to the dominant fishing method, trap days. However, as effort data by fishing method becomes available, it would be desirable to model the effort dynamics of the different fleets. It was hypothesised during the workshop that a time variant catchability function that monotonically decreases with the number of traps should be considered. This function could be included in future models of the fishery. Specified prices correspond to ex-vessel price. The unit cost of effort estimated during this workshop also should be reviewed carefully to account for the number of effective fishing days. The bioeconomic parameter set used to model the dynamics of the Brazilian P. argus fishery is presented in Table 9.1. Table 9.1 Parameters used in the dynamic bioeconomic model of the Brazilian fishery,
based on values suggested by participants.
Bioeconomic Parameters Value
Unit of Measurement
Unit cost of effort, c 161 US$ trap-1
Price of species (whole weight), p 7000 $ tonne -1
Catchability coefficient, q 0.00003 --
Effort dynamics parameter, φ 0.00015 --
Annual rate of discount, d [0, 10] %
Natural mortality coefficient, M 0.34 year-1
Maximum weight of males, (W∞) 3753 g
Maximum weight of females, (Wf∞) 2530 g
Annual recruitment (base case) 6 000 000 individuals
Growth parameter of males (K) 0.236 year-1
Growth parameter of females (k) 0.234 year-1
Adjustment parameter (t0) for males 0 --
Adjustment parameter (t0) for females 0 --
Proportion of males 0.44 Ratio
Proportion of females 0.56 Ratio
9.4.2 Dynamic bioeconomic performance With the mathematical model described and the corresponding bioeconomic parameter set, fishery performance indices were generated as the biomass, yield and rent over time (Fig. 9.2). Observed and simulated values are plotted over time for (a) Biomass, (b) Yield, (c) Profits and (d) Effort. The model was run in dynamic form after introducing one trap in time t=0. The effort trajectory that responded to Smith´s (1969) effort dynamics function was also plotted together with the observed evolution of trap-days for the period 1965-1996. It can be observed that the simulated trajectories describe the observed fishery dynamics. It was suggested that a non-parametric test could be used to test the hypothesis that the distributions of observed and simulated fishery variables are equal.
9.4.3 Decision tables Decision tables for fishery performance, Net Present Value (NPV), were built for different states of nature and management options. States of nature refer to possible states of annual recruitment.

123
Figure 9.2 Dynamics of simulated and observed performance variables for the spiny lobster fishery of Brazil.
A risk neutral decision maker would select the management option that provides the highest expected value of NPV, in this case, decision D2 (30 106 trap-days; Table 9.2a). A risk-averse fishery manager would choose decision D3 (15 106 trap-days).
The Bayesian criterion is a procedure that indicates the lobster fishery manager to select the decision that minimises the expected loss of opportunities, in this case decision D3 (Table 9.2b).
0
10000
20000
30000
40000
1 6 11 16 21 26 31 36 41 46 51 56 61
Time (years)
Bio
mas
s (to
nne)
simulated observed
a
02000400060008000
10000
1 6 11 16 21 26 31 36 41 46 51 56 61
time (years)
Yiel
d (to
nne)
simulated observed
b
0
20000000
40000000
60000000
1 6 11 16 21 26 31 36 41 46 51 56 61
time (years)
Prof
its (U
S$)
simulated observed
c
0
20000
40000
60000
80000
100000
120000
1 6 11 16 21 26 31 36 41 46 51 56 61
time (years)
Num
ber
of tr
aps
Simulated Observed
d

124
The Minimax criterion estimates the maximum loss of opportunities of each management strategy and selects the one that provides the minimum of the maximum losses, in this case D2 (Table 9.2c).
Table 9.2 Decision tables with and without mathematical probabilities
a. Net present value of the fishery (US$ millions)
R1=3000000 R2=6000000 R3=9000000 Expected VAR Decision (106 trap-days) P1=0.2 P2=0.5 P3=0.3
D1= 80 49.3 231.7 411.6 249.2 16058.0
D2= 30 134.4 316.8 499.2 335.0 16303.6
D3= 15 141.0 304.4 467.8 320.7 13084.5
b. Bayesian Criterion
Decision analysis with mathematical probabilities (Loss of opportunities matrix)
R1=3000000 R2=6000000 R3=9000000 Decision (106 trap-days) P1=0.2 P2=0.5 P3=0.3 Expected
D1= 80 91.7 85.0 87.5 87.1
D2= 30 6.6 0.0 0.0 1.3 D3= 15 8.2 0.0 0.0 2.5
c. Minimax Criterion
Decision analysis without mathematical probabilities (Loss of opportunities matrix)
State of Nature 1
State of Nature 2
State of Nature 3
Max Decision (106 trap-days) R1=3000000 R2=6000000 R3=9000000
D1= 80 91.7 85.0 87.5 91.7
D2= 30 6.6 0.0 0.0 6.6 D3= 15 0.0 12.4 31.4 31.4
d. Maximin Criteria
Decision analysis without mathematical probabilities (Loss of opportunities matrix)
State of Nature 1
State of Nature 2
State of Nature 1
Minimum
Decision (106 trap-days) R1=3000000 R2=6000000 R3=9000000
D1= 80 49.3 231.7 411.6 49.3
D2= 30 134.4 316.8 499.2 134.4
D3= 15 141.0 304.4 467.8 141.0
R= number of recruits; P=probability; D= decision

125
e. Maximax Criteria
Decision analysis without mathematical probabilities
State of Nature 1
State of Nature 2
State of Nature 3
Maximum
Decision (106 trap-days) R1=3000000 R2=6000000 R3=9000000
D1= 80 49.3 231.7 411.6 411.6
D2= 30 134.4 316.8 499.2 499.2
D3= 15 141.0 304.4 467.8 467.8
The Maximin criterion uses the performance index decision table that estimates the resulting values for a set of combinations of alternative decisions and states of nature. The criterion calculates a vector of the minimum values for the performance variable resulting from each alternative management decision. Then, the lobster fishery manager proceeds to select the maximum of the minimum of those values, in this case decision D2 (Table 9.2d). This is the most risk-averse of the decision approaches.
The Maximax criterion calculates a vector of the maximum values for the performance variable resulting from each alternative management decision. Then, the lobster fishery manager proceeds to select the maximum of the maximum of those values and the corresponding decision that generates it, in this case decision D2 (Table 9.2e).
9.4.4 Probabilities of exceeding limit and target reference points The probabilities of exceeding limit and target reference points were estimated using Monte Carlo analysis. A uniform probability density function was used to generate recruitment as a random variable within the range R=[3 000 000, 9 000 000]. Limit and target reference points were set for resource biomass and fishery yield. Risk analysis was conducted using Monte Carlo simulation software (Crystal Ball). It can be observed from Table 9.3 that with a trap-day quota of 15 106 the probability of not exceeding the limit reference point is 29% while maintaining the fishery under open access will exceed that level with 100% probability. Table 9.3 Probabilities of exceeding limit and target reference points for the Brazilian
spiny lobster fishery.
Fishery Reference Points
Probability (%) of exceeding reference points
Management Strategies (106 trap-days)
Biomass limit
10500 t
Biomass target
16000 t
Yield limit
4700 t
Yield target 7000 t
15 29 30 46 5
Open access 100 0 48 2
28 65 0 40 14

126
9.5 CASE STUDY 2: THE SPINY LOBSTER FISHERY OF THE BATABANÓ GULF (CUBA)
9.5.1 Bioeconomic parameter set The biological parameter set used to model the dynamics of the Gulf of Batabanó P. argus fishery is presented in Table 9.4, the age and sex structure in Table 9.5 and economic parameters in Table 9.6.
Table 9.4 Biological inputs for the Gulf of Batabanó lobster fishery.
Input Value Units Source
Recruitment α = 21890, β = 428.2 This workshop
Natural mortality 0.34 year-1 Puga, pers. comm.
L∞ 185 (M), 155 (F) mm LC León et al., (1995)
K 0.232 (M), 0.198 (F) year-1 León et al., (1995)
T0 0.44 (M), 0.38 (F) years León et al., (1995)
Length-weight relationship
a= 2.07 10-6, b= 2.792 (M)
a= 2.79 10-6, b=2.736 (F)
Puga, pers. comm.
Current effort “pesqueros”
8840 fishing days Puga, pers. comm.
Current effort big traps
10500 fishing days Puga, pers. comm.
Catchability pesqueros: 1.34 10-4 (M) 1.03 10-4 (F)
Recalo: 1.08 10-4 (M), 7.00 10-5 (F)
This workshop
Sex proportion 0.399 (M), 0.601 (F) Puga, pers. comm.
Duration of the close season
3 months Puga, pers. comm.
Table 9.5 Population age structure (thousands) by sex in the Gulf of Batabanó (from
this workshop)
Age Males Females Age Males Females
2 3540 7816 9 9 27
3 1184 4775 10 4 12
4 446 1983 11 1 5
5 208 681 12 1 3
6 117 277 13 0 1
7 52 110 14 0 1
8 21 56 15 0 0

127
Table 9.6 Economic inputs for the Cuban model
Input Value Units Source Dynamic fleet parameter φ
0.008 Day US$-1 Estimated
Variable cost 304 US$ FAO/DANIDA/CIP (1995) Fixed cost
Per vessel 7061.5 US$ Day-1 FAO/DANIDA/CIP (1995) Per pesquero 2 US$ Day-1 FAO/DANIDA/CIP (1995) Per big trap 19 US$ Day-1 FAO/DANIDA/CIP (1995) Per enviada 6576 US$ Day-1 FAO/DANIDA/CIP (1995) Per centro de acopio
5320 US$ Day-1 FAO/DANIDA/CIP (1995)
Administrative cost 412257 US$ FAO/DANIDA/CIP (1995) Opportunity cost
Vessel 9230 US$ FAO/DANIDA/CIP (1995) Pesquero 1 US$ FAO/DANIDA/CIP (1995) Big trap 5.5 US$ FAO/DANIDA/CIP (1995) Enviada 7000 US$ FAO/DANIDA/CIP (1995) Centro de acopio 20000 US$ FAO/DANIDA/CIP (1995) Labour 0 US$ FAO/DANIDA/CIP (1995)
Processing cost Pre-cooked 1620 US$/tonne FAO/DANIDA/CIP (1995) Tails 1512 US$/tonne FAO/DANIDA/CIP (1995) Alive 1300 US$/tonne FAO/DANIDA/CIP (1995) Others 1300 US$/tonne FAO/DANIDA/CIP (1995)
Length-price relationship per processing line
Pre-cooked Vector US$ Puga, pers. comm. Tails Vector US$ Puga, pers. comm. Alive Vector US$ Puga, pers. comm. Others Vector US$ Puga, pers. comm.
Ratio catch-processing line
Pre-cooked 0.28 Puga, pers. comm. Tails 0.26 Puga, pers. comm. Alive 0.23 Puga, pers. comm. Others 0.23 Puga, pers. comm.
Conversion factor per processing line
Pre-cooked 0.93 Estimated Tails 0.33 Estimated Alive 1 Estimated Others 1 Estimated Discount rate 10 % Estimated

128
9.5.2 Dealing with risk and uncertainty In order to deal with risk and uncertainty using decision tables three states of nature, related to recruitment pattern, were defined. These were as follows:
Hypothesis 1: Recruitment determined by a Beverton-Holt relationship
Hypothesis 2: Constant recruitment (20 447 000 lobsters year-1)
Hypothesis 3: Recruitment defined by the discontinuous function:
• If spawning biomass is ≥ 4720 tonnes, then recruitment is equal to 21 890 000 lobsters year-1
• If spawning biomass is < 4720 tonnes, then recruitment is equal to 4.6563 times spawning biomass.
Fishery performance for each state of nature was evaluated using three alternative management options:
• D1. The status quo, a three-month closed season and constant effort (see Table 9.4)
• D2. A four-month closed season with dynamic effort, and
• D3. A 10% increase in the age-at-first-capture with dynamic effort.
Using the NPV as a performance index for the fishery, results obtained are shown in Table 9.7a. The main result was that using NPV and any decision criteria (with and without probabilities) D2 option was consistently selected, i.e. an increase of one month in the close season and dynamic effort.
Mean catch (tonnes), and its coefficient of variation was used as an alternative performance index (Table 9.7b) to the economic performance based on NPV. As can be observed, highest mean catch is achieved by selecting D2. Although differences among the coefficients of variation (c.v.) from each option are small (Table 9.7c) they can be ranked as: D3>D2>D1. In general, a higher catch implies a higher C.V.
An interesting point emerging from this results is that current status of the stock seems to be close to a fully exploited status, because alternative management options produce only slight changes in the current situation. However, in economic terms an extension of one month for the closed season seems to be a good alternative to improve catches and the NPV.
A complementary analysis for the biomass can be made (Table 9.7d), comparing current biomass with the expected biomass at the end of the simulation period. These results are shown in the Table 9.7d, where a simple index was evaluated dividing the final biomass (simulated) over initial biomass (current). As can be observed all alternatives produce higher biomass at the end of simulation period when compared with current biomass. Some conclusion can be drawn:
• With D1 as a management strategy, the highest biomass is possible. However, there is a trade-off between stock biomass and mean catch. Higher stock biomass means lower catches if D1 is implemented. Indeed, with this option the target catch (6000 tonnes) defined by Cuban authority would not be reached.
• With D2 as a management strategy, the stock biomass over the time remains more or less constant, but an improvement in the mean catch is expected, with a reasonable chance of a catch equal to or greater than 6000 tonnes.
• With D3 as a management strategy an increase in the stock biomass is expected (slightly inferior to the one expected with D1), however this also produces the highest variation in catch.

129
Table 9.7 Summary tables for performance variables in Cuban spiny lobster fishery for the three recruitment hypotheses.
State of nature
Management option Hypothesis 1 Hypothesis 2 Hypothesis 3
a. Net present value (US$ thousands)
D1 300127 308276 293104
D2 331014 339968 329402
D3 284352 290351 297261
b. Mean catch
D1 5204 5575 5611
D2 5628 6151 6015
D3 5320 5793 6200
c. Coefficient of variation (%) for catch
D1 5.63 6.70 6.60
D2 8.56 9.34 9.66
D3 9.15 9.79 11.8
d. Ratio final biomass / initial biomass
D1 1.14 1.19 1.22
D2 1.05 1.09 1.03
D3 1.11 1.15 1.23
9.5.3 Probabilities of exceeding limit and target reference points To evaluate the probability to exceed a limit or target reference point a risk analysis was conducted using the Crystal Ball software. Uncertainty was incorporated in the natural mortality parameter. as a uniform probability density function, with M = [0.26, 0.42] year-1.
Two alternative management options were compared. Both include an increase from three months to four months in the duration of the closed season as suggested by results from decision tables. However, while the first management option (MO 1) assumes a constant effort, the second (MO 2) assumes a dynamic effort. Limit and target reference points for the catch and biomass are as follows: for the catch a target reference point was fixed at 6000 tonnes year-1, while for the stock biomass a limit reference point was defined as 25% of the virgin biomass.
The probability of exceeding the limit or the target reference point was evaluated at the beginning of the simulation period (1999), in the middle of the period (2005), and at the end period (2011). Results are shown in Table 9.8.

130
Table 9.8 Probabilities of exceeding limit and target reference points for the Cuban spiny lobster fishery
MO 1 MO 2 Reference Point Year Probability Probability 1999 0.144 0.165 Catch > 6000 tonnes 2005 0.375 0.473 2011 0.363 0.470 1999 0.186 0.201 Biomass < 16000 tonnes 2005 0.137 0.280 2011 0.143 0.486
The main conclusion is that there exists an inverse relationship between the probability of reaching the target and the probability of exceeding the limit reference points. So, the higher the probability of reaching a catch equal to or greater than 6000 tonnes is obtained if effort is allowed to increase (MO 2). However, in this situation, the probability of a biological undesirable event is highest. Conversely, with constant effort (MO 1) there is a smaller probability to reach the target reference point, but a lower probability the biomass will fall below the limit.
9.6 CASE STUDY 3: THE SPINY LOBSTER FISHERY OF ISLA MUJERES (MEXICO)
The model employed for the Isla Mujeres fishery has some differences with the general behaviour model described in the above sections. A major difference is the lack of a processing sub-model. So, the price vector employed in the Isla Mujeres case does not represents the FOB price, but the ex-vessel price. Private profits are calculated only for the harvesting sector. In the same way, enviadas and lobster gathering centres at sea do not exist for the Mexican lobster fishery. Therefore, all costs associated with these items are not included in the model.
Other differences are associated with the type of gears employed in Isla Mujeres. Basically, there are two gear types considered in the modelling process: divers and traps.
Recruitment was modelled using a uniform probability density function:
[ ]4200000,1800000randomRt = (25)
9.6.1 Bioeconomic parameters Table 9.9 contains the basic information used as inputs in the model. Several parameters are taken from other areas near Isla Mujeres. The current population structure of lobster is shown in Table 9.10, and economic parameters for the model are in the Table 9.11.
In the case of the Mexican model, total costs are calculated differently. Total cost are separated into three categories: variable cost (VC, associated with the trip), fixed costs associated with the number of units of effort in the fishing season (FCEg, divers and traps), and fixed costs associated with the number of vessels (FCVg). Total variable costs by gear and fishing season are calculated as:
tggggtg NTCfoodCFCBVC ,, *)( ++= (26)
where CBg is the bait cost per trip by gear, CFg is the fuel cost per trip by gear, Cfoodg is the food cost per trip by gear. Finally NTt is the number of fishing trip per gear observed in fishing season t.

131
Table 9.9 Biological inputs for the Isla Mujeres model
Input Value Units Source Natural mortality 0.34 year-1 This workshop L∞ (tail length) 379 mm This workshop K 0.28 year-1 This workshop T0 -0.16 years This workshop Length-weight relationship
a=0.031; b=3.19 This workshop
Current effort, divers 8939 fishing trips This workshop Current effort, traps 849 fishing trips This workshop Catchability by fishing method
Divers: 5.18*10-5 Traps: 4.60*10-5
Cuban model
Sex ratio 0.48 (M), 0.52 (F) This workshop Duration of closed season
4 months Observed
Table 9.10 Current number of individuals in Isla Mujeres (thousands). The population
was estimated from a stock assessment completed in the workshop
Age Males Females Age Males Females 2 259 220 9 15 1 3 564 463 10 9 0.5 4 151 124 11 7 0.2 5 174 122 12 4 0.03 6 84 37 13 2 0.02 7 26 3 14 2 0.01 8 15 1.5 15 5 0.01
Fixed costs associated with the number of effort units per gear and season is calculated using:
tgggtg NdInvFCE ,, **= (27)
where Invg is the investment in a effort unit (compressor and trap), dg is depreciation, and Ng,t is the number of units of effort per gear during season t.
Costs associated with the numbers of vessels are calculated using equations 28 and 29:
tvvvgtvg NdInvFCV ,,,, **= (28)
tveegteg NdInvFCV ,,,, **= (29)
where Invg,v is the investment in a vessel, Invg,e the investment in an engine, and depreciation for vessel and engine are denoted as dv and de, respectively. The number of engines is equal to the number of vessels in the fishing season.
Then, total fixed cost is calculated as:
tmgtvgtgtg FCVFCVFCETFC ,,,,,, ++= (30)

132
and total cost by gear and fishing season is given as:
tgtgtg TFCVCTC ,,, += (31)
To calculate private profit and other economic variables, the process is the same as described in the general model.
Table 9.11 Economic inputs for the Isla Mujeres model
Input Value Units Source Fleet dynamics (φ) 0.005 Estimated
Variable costs
Bait Diving: 0 Traps: 6
US$ trip-1 Seijo et al., (1991)
Fuel Diving: 11 Traps: 25
US$ trip-1 Seijo et al., (1991)
Food Diving: 3 Traps: 3
US$ trip-1 Seijo et al., (1991)
Investment
Gear Diving: 705 Traps: 183
US$ Observed
Engine Diving: 3400 Traps: 3400
US$ Observed
Boat Diving: 2400 Traps: 2400
US$ Observed
Depreciation
Gear Diving: 10 Traps: 10
% year-1 Observed
Engine Diving: 10 Traps: 10
% year-1 Observed
Boat Diving: 10 Traps: 10
% year-1 Observed
Maintenance Diving: 927 Traps: 1278
US$ year-1 Seijo et al., (1991)
Licences Diving: 83 Traps: 83
US$ year-1 Observed
Opportunity cost
Capital Diving: 398 Traps: 519
US$ year-1 Seijo et al., (1991)
Labour Diving: 4608 Traps: 4608
US$ year-1 Seijo et al., (1991)
Price at age Vector Observed Discount rate 10 % Observed
9.6.2 Risk analysis In order to deal with risk and uncertainty, a Monte Carlo analysis was performed. A uniform probability density function represented the uncertainty associated with the parameters presented in the Table 9.12.

133
Table 9.12 Range of values for inputs parameters using in Monte Carlo simulation
Parameter Lower limit Higher limit Units Source
M 0.24 0.53 year-1 see Chapter 3
Catchability for diving
1.53*10-6 4.69*10-6 trip-1 Ríos et al., (1998) and this workshop
Catchability for traps
1.53*10-6 1.45*10-5 trip-1 From Cuban fishery
Indices used to evaluate the fishery performance were stock biomass and total catch at 5th, 25th and 50th year of simulation. Four alternative management options were considered:
• D1: age at first capture equal to 2 years with unrestricted effort
• D2: age at first capture equal to 3 years (current) with unrestricted effort
• D3: as D1, but with constant (current) effort
• D4: as D2, but with constant (current) effort
Target and limit reference points were defined according to Table 9.13.
Table 9.13 Target and limit reference points Biomass Catch
D D Limit Target Limit Target
< 2125 tonnes >4250 tonnes < 90 tonnes > 250 tonnes
Table 9.14 Probabilities of exceeding limit and target reference points for the Isla Mujeres spiny lobster fishery
Biomass Catch D1 D1 Year Limit Success Risk Success5 0.000 0.116 0.169 0.017 25 0.727 0.009 0.008 0.986 50 0.964 0.000 0.000 0.999 Biomass Catch D2 D2 Year Risk Success Risk Success5 0.000 0.185 0.546 0.000 25 0.113 0.128 0.003 0.926 50 0.576 0.000 0.004 0.987 Biomass Catch D3 D3 Year Risk Success Risk Success5 0.000 0.152 0.452 0.000 25 0.000 0.803 0.146 0.009 50 0.000 0.807 0.146 0.010 Biomass Catch D4 D4 Year Risk Success Risk Success5 0.000 0.184 0.727 0.000 25 0.000 0.847 0.252 0.000 50 0.000 0.842 0.262 0.000

134
A stock biomass around 2125 tonnes corresponds to 25% of the virgin biomass, whereas 4250 tonnes is around 50% of virgin biomass. A catch of 90 tonnes is the current catch, and 250 tonnes is the estimated catch at MSY. Monte Carlo analysis was used to estimate the probabilities of exceeding the limit reference point and of reaching the target reference point (Table 9.14).
• and not exceeding a limit reference point was observed. In this sense, strategies D1 and D2 show a higher probability to obtain a desirable level of catch. However, this is possible through driving the stock biomass to low levels such that the probability for an undesirable biological event (low stock biomass) is increased over time.
• D3 and D4 show a lower probability of exceeding the limit reference point for stock biomass, and a high probability to revive the stock. Nevertheless, the probability of obtaining the target reference point for the catch is zero in almost all cases. Under these circumstances, the target reference point may need to be reconsidered because it was shown to have a close to zero probability of occurrence.
• These results suggest that there is a trade-off between decreasing the age at first capture and limiting effort required for a sustainable fishery in Isla Mujeres. However, the optimal solution for these management variables remains unexplored.
9.7 CONCLUSIONS AND RECOMMENDATIONS
9.7.1 Case study 1: Brazil
• Under the Bayesian and Minimax decision criteria, the decision to reduce effort to 2.8*107 trap-days results in the optimum decision with NPV as the fishery performance variable.
• With the Maximin criteria, an even more cautious approach, reduction of effort to 1.5*107 trap-days is the indicated strategy.
• Implementing a trap reduction programme from the current 6.0*107 to 1.5*107 trap-days would reduce the probability of exceeding the limit reference point for biomass (10 500 tonne, i.e. one third of maximum biomass) from 100% to 29%.
• It is recommended that systematic data collection systems be implemented concerning biological as well economic data for both fishing methods, traps and nets.
9.7.2 Case study 2: Batabanó Gulf, Cuba
• An increase in the closed season of one month (from 3 to 4 months) and a constant effort is recommended.
• In the future other combinations of biological and processing alternatives could be evaluated. For example, increasing the age at first capture to protect the spawning stock in combination with an optimisation analysis to improve the NPV for the fishery with lower values of fishing mortality, but re-arranging the portion of the catch going to different processing lines. Other alternatives are possible. Nevertheless, more appropriate suggestions would need a more specific technical consultation meeting.
• Future research efforts must be oriented to validate the model according to historical fishery performance and future observations.

135
9.7.3 Case study 3: Isla Mujeres, Mexico
• For modelling purposes only approximate parameter values were used, notably the catchability coefficients by gear and sex. Based on these parameters, a status quo is recommended.
• Nevertheless, if a reduction in the age at first capture is allowed, such as fishers are reported to have requested, then a reduction in effort must be a complementary measure. What level of effort will be needed is an issue that should be evaluated.
• A Fishery Information System to be able to record routine biological and economic information is highly recommended.

136
10 MANAGEMENT: REVIEW OF EXISTING REGULATIONS
K. Cochrane, M. Tandstad, R. Cruz, N.M. Ehrhardt, J. Gonzalez Cano, P. Medley, V.R. Restrepo and J.C. Seijo
10.1 RESPONSIBLE MANAGEMENT OF SHARED STOCKS AND THE PRECAUTIONARY APPROACH
The only tools which a fishery manager has at his/her disposal to maintain the biomass and productivity of a stock at desirable levels are the regulation of 1) the amount of fish which are caught, 2) when they are caught and 3) the size at which they are caught. There are a number of management approaches which can be used to achieve these controls and each one will have different advantages and disadvantages, different degrees of effectiveness, different impacts on the fishers, and differing requirements for monitoring, control and surveillance (FAO, 1997).
Management measures can be considered under the following three categories:
• Technical measures which attempt to regulate, usually limit, the output obtained from a given amount of potential effort. They include, for example, gear restrictions, minimum sizes, closed seasons and closed areas.
• Input controls, which directly regulate the amount of effort that can be put into a fishery through some form of limited entry.
• Output controls, which directly regulate the total catch which can be taken from a fishery. Output controls (usually in the form of a total allowable catch) attempt to overcome the problems associated with determining and enforcing suitable technical measures and input control, but require very comprehensive, and hence costly, monitoring and surveillance.
In general, a management strategy for any fishery will include components from more than one of these categories and frequently will include all three. Of particular importance is that while technical measures alone may provide sufficient protection for a stock, provided they include direct limitations on effort such as adequate closed areas or seasons, if used alone they will lead to dissipation of rent, resulting in a failure to achieve potential social and economic returns from a fishery. In recognition of this, the Code of Conduct for Responsible Fisheries (CCRF) (FAO, 1995) makes several references to the need to maintain fishing effort at levels commensurate with the productivity of the resource and to eliminate excess fishing capacity (e.g. Para. 7.1.8). It stresses the need to ensure that only authorised fishers or vessels are allowed to fish (Para 7.6.2) and that the total effort represented by authorised fishers results in economic conditions that promote economic efficiency (Para. 7.6.3). In doing so, the CCRF also recommends that ‘due recognition should be given… to the traditional practices, needs and interests of indigenous people and local communities which are highly dependent on fishery resources for their livelihood (Para. 7.6.6).
At a more general level, the CCRF calls for attention to be given to ensuring that fishing gear, methods and practices are consistent with responsible fishing (Para. 7.6.4). It also incorporates the precautionary approach to fisheries which begins from the principle that all fishing activities have environmental impacts and these must be assumed to be significant unless there is good evidence to the contrary. The precautionary approach is based on recognition that changes in fisheries systems are only slowly reversible and are only poorly understood. In fact, in many if not most cases where serious changes have been brought about through fishing or other anthropogenic activities, it is not known whether the changes are reversible. In addition, the precautionary approach emphasises a fundamental principle

137
of sustainable utilisation of renewable resources, that the needs of future generations should be considered which inter alia requires avoidance of changes that are potentially irreversible.
These axioms necessitate that before any new fishery activities are initiated or changes made to existing practices, potential undesirable outcomes need to be identified and measures that will avoid them determined. Uncertainty is a feature of fisheries management, including uncertainty in observations, uncertainty in biological and ecological processes, uncertainty in future human behaviour and environmental uncertainty. As a result, there will frequently be uncertainty as to the impacts of any action or lack of action being considered. In such cases, where the likely impact of use of the resource is uncertain, priority should be given to conserving its productive capacity. Strengthening this requirement in the precautionary approach is the acceptance that when new or modified fisheries activities are being contemplated, the burden of proof lies with the potential exploiter to demonstrate that these activities will not violate the requirements of responsible fisheries and the precautionary approach. This is a radical departure from the previous implicit situation where the onus has tended to lie with the management agency to demonstrate that such activities will be harmful before action can be taken to prevent them. However, it is also recognised that fisheries management actions can have substantial social and economic impacts, and hence the precautionary approach recommends that the nature and use of the proof to be used in making decisions should reflect the potential risk to the resource, while also taking into account the expected costs and benefits to society.
The implications of the precautionary approach for these assessment activities and for any recommendations arising from them are profound. They include the following:
• Careful and explicit consideration of the assumptions and uncertainties inherent in the assessment methods used and in interpretation of their results, to ensure that they could not lead to unexpected negative impacts or result in over-optimistic results or perceptions.
• Where reference points and risk assessments are used to determine or evaluate management actions, they need to reflect the uncertainty included in their derivation and in the stock estimates which are evaluated against them. They must be selected so as to avoid excessive risk of undesirable outcomes. Where there is doubt, the benefit of this doubt must be given to conservation of the resources, although social and economic impacts must also be recognised and appropriate means to deal with them identified.
• A fundamental assumption underlying the lobster assessments relates to the sub-regional stock structures utilised in the assessments. While it is important for effective management that these are incorporated in the assessments and in future management, the precautionary approach requires that it is also assumed that the possibility exists that each country has its own stock and, as such, is obliged to manage this ´stock´ in a sustainable manner.
• In forecasting impacts of fisheries regimes and management actions, long-term effects, covering several times the average life span of the lobster, need to be considered.
• Consideration should be given to the levels of fishing effort which are commensurate with the productivity of the resource so that recommendations can be made on desirable and sustainable fishing effort.
• Living resources and fisheries are dynamic and can change rapidly. The results and recommendations arising from the 1997 and 1998 workshops will become less appropriate and relevant with time. It is therefore essential that plans should be made to re-evaluate the status of the stock or stocks and the fisheries and management regimes regularly to ensure responsible fisheries.

138
10.2 TECHNICAL MEASURES IMPLEMENTED BY THE PARTICIPATING COUNTRIES
The countries that participated in the workshop clearly rely heavily on the use of technical measures in their attempts to control fishing mortality on P. argus (Tables 10.1 and 10.2). All of them have some form of minimum size regulation in place and most of them have a closed season.
The regulations on minimum size in the participating countries vary in the length measurement specified (carapace, total or tail) and some countries specify minimum total and/or tail weights. However, most include a specified minimum carapace length (Table 10.1). The regulated minimum carapace lengths (or the converted equivalent if carapace length is not specified in the regulations) range from 69 mm (Cuba and Guajira, Colombia) to 120mm (Venezuela). The rationale behind the minimum length in each country was not discussed in these workshops. However, the minimum sizes do not appear to have been set in an attempt to protect immature animals, particularly females, from exploitation (Figure 10.1). The range of lengths at 50% maturity estimated from the WECAFC region (Chapter 3) range from 81mm (Cuba) to 92mm (Colombia) (see Fig. 10.1). The only countries that have minimum carapace lengths that exceed the lower level of this range (81mm) are the Bahamas, Bermuda, St Lucia, Turks and Caicos Islands and Venezuela, although Colombia (San Andrés), the Dominican Republic, Honduras and Mexico (apart from Quintana Roo) are close to this level.
Figure 10.1 Minimum sizes of spiny lobster, expressed as carapace length, allowed to
be landed by fisheries in the countries represented at the workshops. Where the legislation specifies minimum size in a unit other than carapace length, that
measurement has been converted to equivalent carapace length (see Table 10.1 for details). The horizontal lines represent the maximum (Colombia) and minimum (Cuba) ages at 50% maturity estimated for spiny lobster within the WECAFC countries (see
Chapter 3).
0
20
40
60
80
100
120
Baha
mas
Bel
ize
Berm
uda
Bra
sil
Gua
jira
(Col
)
San
Andr
es (C
ol)
Cub
a
Dom
inic
an R
ep.
Hon
dura
s
Jam
aica
Cen
tral Q
-R (M
ex)
Oth
ers
(Mex
)
Nic
arag
ua
St. L
ucia
Turk
s &
Cai
cos
USA
(Flo
rida)
Vene
zuel
a
Car
apac
e le
ngth
(mm
)

139
Table 10.1 Summary of regional regulations Country Minimum lengths
(mm)
Minimum weights (g)
Closed season
Lc Ltot Ltail Wtot Wtail Bahamas 82.5 139.7 1 April - 31 July
Belize 76.2 113 113 15 Feb - 14 June
Bermuda 92 340 1 April - 31 August
Brasil 75* 130 1 January - 30 April
Colombia - Guajira
(68.9) Ltot
210 385 None, but capture, possession and sale is prohibited of berried females or females from which the eggs have been stripped
Colombia - San Andrés
(80.1) Ltail
140 “
Cuba 69 210 150 1 March - 31 May
Dominican Republic
(80.5) : Ltot
240 125 1 March - 30 June
Honduras (80.1) Ltail
140 142 (5 ozs.)
16 March - 31 July
Jamaica 76.2 1 April - 30 June
Mexico - central zone Quintana Roo
74 222 135 1 March - 30 June
Mexico - other Caribbean areas
80 241 145 1 March - 30 June
Nicaragua 75 230 135 142 1 April - 2 June (foreign vessels only)
Saint Lucia 95 340 1 May - 31 August
Turks and Caicos Islands
83 142 (5 ozs.)
1 April - 31July
USA (Florida) 76 140 1 April - 5 August
Venezuela 120 900 - 1 000
1 May - 31 October
Lc- Carapace length, measured from the anterior border to the last extreme of the carapace. Ltot- Total length [Largo total antenular] measured from the base of the antennas (Cuba, Colombia, Mexico) or from the anterior border of the cephalothorax (*Brasil) to the end of the telson. Ltail- Tail length, measured from the anterior border of the first segment to the extreme end of the last segment. Values of Lc shown in brackets were calculated for comparative purposes from the following equations (Cruz, 1998): LC= -5.44 + 0.611 Ltail LC= -11.6569 + 0.3838Ltot

140
Figure 10.2 Catch by length of male and female P. argus from different countries and areas within the WECAFC area. The x-axis gives the carapace length in mm.
Belize
00.05
0.10.15
0.20.25
0.30.35
25 45 65 85 105
125
mm
prop
ortio
n
FM
Jamaica
0
20
40
60
80
50 60 70 80 90 100
110
120
mm
prop
ortio
n
MF
Colombia
00.10.20.30.40.5
45 65 85 105
125
145
mm
prop
ortio
n
FM
Nicaragua
0
0.05
0.1
0.15
0.2
0.25
0.3
113
123
133
143
153
163
173
183
193
203
213
mm
prop
ortio
n
FM
Bermuda
0
0.1
0.2
0.3
0.4
54 74 94 114
134
154
174
mm
prop
ortio
n
FM
Florida
00.10.20.30.40.5
55 75 95 115
135
155
mm
prop
ortio
n
FM
Cuba
00.05
0.10.15
0.20.25
0.3
55 75 95 115
135
155
mm
prop
ortio
n
FM
Isla Mujeres
00.020.040.060.080.1
0.120.14
60 77 94 111
128
145
162
mm
prop
ortio
n
00.020.040.060.080.10.120.14
FM

141
The regulated minimum sizes are partially reflected in the length composition of the catches from different areas within the region, where the minimum sizes do appear to be having an effect on the sampled landings (Figure 10.2). The modal lengths in the catch are more consistent between areas, generally varying between 80 and 95mm, but Isla Mujeres (Mexico) and Nicaragua have substantially higher modal lengths suggesting either a higher percentage of larger animals in their fishing grounds or selectivity for larger animals.
While the range of minimum sizes reflected by the carapace length regulations (or equivalent) may be based on local differences in age-at-maturity which are not reflected in the biology review of Chapter 3, those countries that have minimum sizes below, or close to, the age-at-50% maturity of, especially, females, should review these regulations to ensure that they are adequate. In the absence of well-regulated and appropriate effort or catch controls, setting a high minimum size relative to age-at-maturity provides some (but rarely complete) measure of maintaining spawner biomass above a desired threshold.
The current market preferences, and hence higher prices, for smaller lobster is clearly in conflict with the need to exclude a substantial proportion of animals from capture until they have had the opportunity to reproduce. The short term gains from harvesting smaller lobster which can be sold at higher prices is certainly putting pressure on management agencies, either through pressure to decrease the existing minimum size or through increasing incidence of landing sub-legal size animals. In addition, higher prices for smaller lobster may lead to a change in fishing selectivity towards smaller and smaller animals, with the resulting yield-per-recruit effects possibly leading to an increase in fishing mortality in relation to desirable biological reference points.
Management agencies need to be aware of the potential negative consequences of this preference for smaller lobster on the impact of the fisheries on the resource. While yield-per-recruit studies were not undertaken at these workshops, in general, if there is a reduction in the mean size-at-capture of fishery resources, this needs to be compensated for by a decrease in the actual fishing mortality. In the fisheries of most of the countries represented at this workshop, the monitoring and control necessary to achieve such a reduction in fishing mortality probably does not exist. In such cases, retaining or imposing a high minimum size is one of the important control measures to assist in maintaining spawner biomass at sustainable levels.
The closed seasons range in duration from three months (Cuba, Jamaica, Nicaragua) to six months (Venezuela). Most of these closed seasons coincide with the observed months of highest reproductive activity (March to July, Chapter 3) and are apparently intended to avoid capture of berried females. While the rationale behind having a closed season to protect berried females is subject to debate (a mature female caught before the main reproductive season contributes no more to future recruitment than a berried female caught during that season), the impact on total effort, and hence fishing mortality, of closed seasons of 3 to 6 months is likely to be significant and, particularly in open access fisheries, may be invaluable. In those countries with open access fisheries, discussed later in this section, increases in the length of the closed season may be a socially more acceptable means of reducing effort than reductions in the number of people allowed to fish. However, the economic consequences for participants of reducing the time allowed for them to fish should also be considered in identifying optimal management approaches.
There are a number of other technical measures in place in many of the countries (Table 10.2 and the country reports). These include prohibition of e.g. trammel nets, hookah and SCUBA gear and nylon gill nets (Table 10.2). The regulations relating to permitted equipment for diving are frequently aimed at diver health and safety, an issue which was considered by the workshop as being important and requiring urgent attention in some countries. The country reports indicate that many countries have regulations which include prohibiting the landing, capture or both of berried females and of moulting animals, specify the size of the opening of traps and other features of the traps, and closed areas.

142
Table 10.2a Summary of fisheries and effort : northern “sub-stock”. ‘Conc devices´ refers to the use of casitas and condominiums
Average Annual Catch ´95-´97
(mt)
No. of Fisher
s
Type of Access Conc. devices
Diving (without
use conc.
devices)
Traps Nets Comments
Bahamas* 8 000 8 800 Open (to
nationals)*
fished by divers with
hookah
hookah
* Permits required for use of hookah and traps.
Bermuda 27 (´96-´97)
20 Limited: permits leased to users annually
(max. 300)
Recreational diving: divers licensed annually. Also P. guttatus fishery
Cuba* 9 200 1 300 Limited: territorial rights to 8 fisheries associations
(dominant
) fished by
divers and nets
St Lucia 20 (´96-97)
Open (domina
nt)
*
*Trammel nets prohibited since 1994 but still in use
Turks and Caicos
320 250 Open (to nationals) (experi-mental)
(dominan
t) free
Hookah and SCUBA are illegal
USA 3 321* 1100* Limited: transferable trap licenses
(domina
nt)
*216 fishers produce 73% of catch & 3022 t of catch originates from Keys. Also recreational fishery.

143
Table 10.2b Summary of fisheries and effort: eastern central “sub-stock”. ‘Conc devices´ refers to the use of casitas and condominiums
Average Annual Catch
´95-´97 (mt)
No. of Fishers
Type of Access Conc. devices
Diving (without
use conc. devices)
Traps Nets Comments
Belize 777 2 700 Open * * Trammel nets reported from Port Honduras area only.
Cuba See 10.2a Mexico* 658
(´95-´96) 3206 Limited : access rights for
co-operatives*
fished by free divers
(dominant)
hookah SCUBA
! * Since 1992 the law has made allowance for entry of private enterprise but this has not yet been exercised. !Trammel nets
Table 10.2c Summary of fisheries and effort : Brazil “sub-stock” and Venezuela. ‘Conc devices´ refers to the use of casitas and condominiums
Average
Annual Catch ´95-´97
(mt)
No. of Fishers
Type of Access Conc. devices
Diving (without
use conc. devices)
Traps Nets Comments
Brasil* 7 070 19 000 Limited access for all types of boats (by licensing)*
Prohibited * Despite a limited access system, the Ceará State fleet has grown by 31% in last 5 years
Venezuela* 629 218 divers + 71 using
traps
Limited entry through annual permits (non-transferable)*
(free)
* Permits are re-issued to the holders of the previous year

144
Table 10.2d Summary of fisheries and effort : western central “sub-stock”. ‘Conc devices´ refers to the use of casitas and condominiums
Average Annual Catch
´95-´97 (mt)
No. of Fishers
Type of Access Conc. devices
Diving (without
use conc. devices)
Traps Nets Comments
Colombia* 75 (San
Andrés) 303*
(Guajira)
San Andrés - industrial fishery 10 boats (4 companies) annual quota of 200t. Guajira - Open access
free
(Guajira only)
(San
Andrés & Guajira)
gillnets (Guajira
only)
* Mean for ´95 and ´96: no records for ´97. In San Andrés, breathing apparatus for diving and monofilament nylon gillnets are prohibited.
Republica Dominicana*
70 130 Open access free
hookah
130 fishers in Parque Nacional Jaragua, the principle lobster fishing area. Data not available for other areas,
Honduras* 3 698 2830 No. of industrial vessels is limited to 178. Open access for artisanal fishers.
SCUBA
Ministerial resolution limiting number of boats to current level and preventing entry of other fishers into the lobster fishery,
Jamaica 338 1 200 (divers +
nets) >10 000 (artisanal
)
Limited entry for industrial fleet (5 vessels only, using Florida traps). Open for artisanal fishers·
free
hookah SCUBA
(dominant
)
gillnets
* artisanal fishers account for more than 97% of the annual landings
Nicaragua* 4 000 2640 Limited entry for industrial fleet (60 vessels only).
SCUBA

145
10.3 DIRECT EFFORT AND CATCH CONTROL As discussed above, technical measures form an important part of any management strategy. However, in the absence of effective limitation of total realised effort or catch, technical measures will generally not provide for adequate protection of the stock and, without limiting entry to an appropriate number of licensed fishers or fishing units, the potential economic and/or social benefits from the stock will not be realised.
From the information received from the participants at the 1998 workshop, Bermuda, Brazil, Colombia (San Andrés), Cuba, Honduras, Jamaica, Mexico, Nicaragua, the United States of America and Venezuela have some system of limited entry in place. However, of these, Colombia (San Andrés), Honduras, Jamaica and Nicaragua have limited access only for industrial vessels, with access open to artisanal fishers (see Table 10.2).
Those countries with a significant degree of open access are likely to be faced with effort which is escalating in the medium to long term and in some cases is already above sustainable levels (see later in this Chapter). In addition to exerting increasing pressure on the resources, resulting ultimately in over-exploitation and declines in yield, the excess effort also results in a dissipation of potential benefits, whether those benefits are profits from commercial operations or the living standards of artisanal lobster fishers. Overall, limiting the number of participants in a fishery to an appropriate level is the only means of ensuring long-term protection of the resource at the same time as realising the potential social and economic benefits from it.
10.4 ENFORCEMENT AND CONTROL The degree to which the different management measures in place are actually enforced within the various countries was not discussed in detail during the workshops, although some national reports did refer to concerns about the actual implementation of regulations and legislation. It should be clear, however, that without adequate compliance or enforcement, the best designed management regulations will fail. If the different lobster producing countries hope to achieve responsible utilisation of this valuable resource, they need to ensure that they possess adequate capacity to enforce any management system. The costs of management and enforcement are frequently daunting. However, in a fishery with an estimated value of landings of US$350 million (Chapter 2), it should be possible to recover all or a high percentage of the costs necessary for fisheries management, including control, from the exploiters of the resource, particularly where there is a well developed commercial fishery or marketing operation.
10.5 THE CURRENT STATUS OF THE SPINY LOBSTER RESOURCE AND ITS IMPLICATIONS FOR MANAGEMENT.
10.5.1 Working Group 1
10.5.1.1 Brazil The Brazilian spiny lobster fishery has undergone significant structural and operational changes in its recent history. These changes have not been specifically documented, therefore, quantifying fishing efficiency, selectivity patterns, or exploitation patterns emerging from the observed changes is not possible with the existing data.
Three stock assessment methods were applied to the usable 1974-1993 landings by length and by age compositions and fishing effort out of the 1974-1997 database available at the workshop. Two of the methods (TLCA and SPA) gave abundance and fishing mortality rate estimates which are indicative of a stock undergoing significant growth in the late 1970s and again in the late 1980s with a prolonged period of low recruitment in the early and mid 1980s. It was noted that recruitment appears to be significantly influenced by environmental

146
conditions. If the estimated recruitment and parent stock abundance are proven correct, then it is possible to conclude that the protracted period of low recruitment observed in the 1980s may be a consequence of a strong environmental cue on recruitment mechanisms, which may also be observed in other downstream stocks.
The third stock assessment method (depletion model) portrays a stock that follows the historic CPUE trend, thus, it shows a conspicuous and continuous decrease in abundance since the early years of the fishery, while fishing mortality rates have continuously increased. It was noted that total fishing effort exerted on the stocks appears high, but the estimates may be biased as the CPUE index used to estimate effort is obtained from very small samples of a progressively less efficient fraction of the industrial trap vessels. Moreover, the industrial trap fleet has been replaced by much less efficient artisanal-type boats, which are not presently surveyed for catch and effort statistics. Thus, the main problem with the apparent inconsistency in some of the assessment results appears to lie more with the poor statistical quality of the single index of abundance used than on the model themselves.
Despite the differences in trends of abundance and fishing mortality obtained in the assessments, it is noted that levels of fishing mortality are in the 0.4 to 1.2 range while F0.1 was estimated at 0.64, at which level a spawning potential ratio of 0.22 was estimated. The F30%SPR was 0.45. Female fishing mortality rates estimated from SPA were higher than 0.45 in 12 out of the 20 years analysed while estimates from the depletion model show that in 17 out of the 20 years fishing mortality rates were higher than 0.45. If the stock abundance scenarios estimated by cohort analysis (length and age based) are correct, then the stock may be defined as undergoing significant changes dominated by density and environmentally driven recruitment. On the other hand, if the abundance scenario depicted by the depletion model is considered as correct, then the stock in the early 1990s was considerably depleted relative to its condition in the mid 1970s and management actions to improve this condition should implemented. In this regard, the group noted that strict enforcement of minimum size and of seasonal closures should be attempted, while capping artisanal effort should be made mandatory.
A bioeconomic analysis of the fisheries, considering constant catchability, suggested that a significant reduction in fishing effort from 60 million trap-days to 15 million trap-days will be required if economic optimisation of the fishery is desired.
Specific recommendations to improve stock assessment work includes the expansion of the biological data collection system to include more areas, fleets and gear types, and to significantly improve the existing statistical system for catch and effort to include the large artisanal fishery. There is an urgent need to revise fully the catch and effort database and to perform effort standardisation studies to improve CPUE estimates. Similarly, there is an urgent need to revise fully the large 1974-1997 size composition database to improve estimates needed for stock assessment work. It is also recommended to initiate studies on potential area closures, more specifically in closer-to-shore areas where artisanal fishing effort may be negatively impacting juveniles.
10.5.1.2 Venezuela Landing statistics, corrected according to observed trends in landings at Los Roques National Park, showed a significant increase in fishery production from about 400 tonnes to about 1000 tonnes in the 1989-1992 period and also in subsequent years. No formal statistical system is in place to record catch, effort and biological statistics. A two-season (1988/89) length frequency database corresponding to three gear types was available at the workshop for stock assessments. A limited assessment based on tuned length cohort analysis provided a preliminary fishing mortality rate of 0.68. An analysis of size at first maturity with data available at the workshop demonstrated that the fishery is capturing spiny lobsters well below that size. Yield and spawning biomass per recruit using growth parameters previously estimated for the species in Venezuela and an exploitation pattern estimated from length cohort analysis were performed to assess the most likely exploitation

147
scenario for this fishery. Because the exploitation pattern generated by the free-diver component of the fishery targets mostly juvenile lobsters, the F0.1-estimate was high (1.45). Under the exploitation pattern, juveniles form a large fraction of the landings, therefore, the impact of the F0.1 level of mortality reduced the spawning potential ratio to below 10%. The fishing mortality rate to maintain 30% of the pristine spawning biomass was estimated at 0.55. Thus, given the preliminary estimate of F=0.68 for a fishing season just prior to the large observed increase in landings, it was concluded that at present this fishery must be experiencing very high levels of exploitation. This conclusion is based on an extremely short data series and there is a need to corroborate these results.
Several recommendations for improving stock assessment work on spiny lobsters in Venezuela include the establishment of a biological sampling program to collect length frequencies by gear type. To initiate monitoring of the free-diving effort that appears to be impacting lobsters prior to reaching first maturity. To improve the official catch and effort statistical system incorporating frame survey methodologies. And, to form a stock assessment group responsible for national spiny lobster assessment and the generation of management advice.
10.5.2 Working Group 2
10.5.2.1 Honduras-Nicaragua-Colombia There is a lack of biological and economic data in this area. Nicaragua and Colombia have the longest series of catches from data collection programmes which started in early 1990s. Eight fleets fish for lobsters in different areas from shallow (artisanal) to deep waters (industrial fleet) of the entire platform. A probable catch history in the Honduras-Nicaragua-Colombia platform was estimated using data from different sources, including imports in the USA and data available at the Central Bank in Honduras. Honduras contributes to almost half the total catches in this region (average 3431 tonnes whole weight 1993-1997) therefore it was very important to count with the most reliable time series of catches for further assessments and interpretations at platform level. After generating the catch history it was concluded that the Caribbean lobster (Panulirus argus) in the platform is probably being fully exploited when compared to Fmax. The development stage was reached by 1985 and is now in the stabilisation period. This explains the behaviour of catches in recent years. It was concluded that effort has increased in all countries, but mainly for the artisanal fleet (i.e. in Nicaragua four fold for both the Foreign and National Industrial Fleet during 1987-1996 and an increasing rate of 70% per year for the SCUBA Industrial Fleet between 1993-1996). The results are consistent indicating that in Nicaragua, Fmax was reached in 1996. Thus, attention should be paid to avoid further expansion in all fleets. This might also be true for Honduras, however the lack of data does not allow confirmation of this. Data collection programmes and further assessments are necessary to provide better results for sustainable development of the fishery in the long term. In Nicaragua, present effort is nearly three times F0.1. It is recommended on biological grounds that effort should be decreased in each fleet in all fishing areas of Nicaragua and perhaps the same should be done in Honduras. For the fishing area of Colombia (Luna Verde) more assessment still needs to be done before reaching a final conclusion.
Results also indicate that the three countries are probably fishing one stock. In this case, co-operation becomes fundamental for proper management. It also requires close co-operation between managers and scientists of countries involved in this platform. In addition, a relationship of size with depth was observed (larger individuals in deeper waters). Therefore, the fishery as a whole presents the characteristics of a sequential fishery. In the future, special attention should be paid to avoid conflict between fleets, particularly in Nicaragua. In recent years the artisanal fishery effort in Nicaragua has increased and the offshore Industrial fleet reports a decrease in the catches. Under these circumstances, it was recommended that optimisation methods be employed to assess the relative efficiency of each fleet. For this purpose, preliminary standardisation indices were obtained for all fleets in

148
Nicaragua. In the absence of proper data in other two countries, the available standardisation indices were used for the entire platform. The best estimate indicates that total effort being applied in the platform is equivalent to 673 Nicaraguan industrial trap vessels. It is recommended that in the short term better data of all aspects of the fishery be gathered to improve estimates.
The group also concluded that scientific co-operation amongst the participant countries is necessary for future assessments and to provide better results to achieving conservation and optimum exploitation. The effects of different management regulations, could be assessed for each country and for the entire platform. The closed season measure, for example, should be analysed at platform level, because its implementation and feasibility depends on the participation of all countries. This approach is supported considering that the stock is being shared.
10.5.2.2 Jamaica Lobsters are mainly exploited in two areas: the Pedro Bank and the southern shelf. Assessments in both areas have been done at different times. During the two workshops, data collected from 1996 (with support of CFRAMP) was used. Several methods were considered to analyse the available data. In the southern shelf, preliminary results indicate that the fishery is above MSY and effort should be reduced to provide sustainability of this resource. Additionally, data collection and a monitoring programme of Pedro Bank should be conducted to explain drops in landings from 60 to 20%, to continue gathering catch and effort data by gear type on the southern shelf. It was also considered necessary to work more on the biological aspects of the species in this area and to establish scientific co-operation with institutions from Nicaragua-Honduras and Colombia, to understand better the dynamics of P. argus and catches on the Pedro Bank.
10.5.2.3 Dominican Republic It was not possible to conclude anything for this part of the Dominican-Haiti island, as no data was available for assessments in both workshops. The available data is sparse and has been gathered discontinuously. Two previous studies conducted in this country reached no conclusions on the state of this resource. Lobsters are exploited all around the country, but mainly upon juveniles and sub-adults. The main fishery occurs within Jaragua National Park and the need to establish a formal data collection programme for the acquisition of biological and economic information for the assessment and management in this area was discussed.
10.5.3 Working Group 3
10.5.3.1 Belize Estimates of total mortality based on catch curve analyses of recent length frequency data are very high and variable (1.3 to 2.2 year-1). It is plausible that larger lobsters migrate out of the area, which would be translated into high mortality rates when using models that assume constant selectivity for a range of ages. But, it is also plausible that total mortality rates are indeed high. The available information is insufficient to distinguish between these competing explanations. The long-term catch-per-unit-effort data available at the workshops were not deemed to be reliable for stock assessment purposes because the effort metric (number of fishers) is probably a poor measure of effective effort. If these CPUE data were taken as an adequate index of population biomass, they would indicate a continuous population decline throughout the 1970s and most of the 1980s. Catches have remained high since then, but the trend in nominal CPUE since 1987 is unknown. Thus, little can be concluded about the status of the stock. Belize may have the opportunity to collect detailed historical catch and effort data from fishing co-operatives, which could provide opportunities for improved stock assessment work if the data are adequate. It is recommended that the feasibility of compiling and analysing such data be explored.

149
10.5.3.2 S. Cuba Several assessment methods were used to analyse the data from the Gulf of Batabanó, which accounts for the majority of the landings in southern Cuba. The various methods applied led to consistent conclusions: Both recruitment and total population size have declined by about 25% relative to the 1982-1983 levels (there are signs that the declining trend in recruitment may be reversing in recent years, however). Fishing mortality levels declined through the late 1980s but have reached a higher level after 1991, stabilising around 0.5 per year. A simple equilibrium yield analysis suggests that the current level of fishing mortality may be 25% above the level that produces maximum sustainable yield. Taking these results into consideration, and recognising that the Batabanó fishery is one of the most important ones in the entire region, it is recommended that fishing mortality be reduced, at least until recruitment increases up to the levels observed during the mid-1980s. There are many options available to implement such a reduction. One possibility that was considered during the workshop’s bioeconomic modelling exercise was an increase in the duration of the closed season, coupled with a limit on effective fishing effort. Other possibilities might include changes to the selection pattern aimed at increasing the reproductive output per recruit.
10.5.3.3 Mexico During the two workshops, a number of assessments were conducted for different sub-areas in Mexico, depending on data availability. With the exception of the annual addition of recruits into each area, all of the models utilised assume that the populations are closed. This assumption may be unreasonable given the known migratory behaviour of adult lobsters and the short distances that separate some of the areas examined. With this caveat in mind, the results of these assessments should be taken as being preliminary. In the future, an effort should be made to define “unit stocks” on the basis that such definitions will (a) minimise potential biases due to violations in the closed population assumption (or, alternatively, account explicitly for migration between sub-areas in spatially-structured models), (b) encompass stocks that will behave more or less uniformly in response to exploitation, and (c) encompass stocks that could be effectively monitored and managed as separate units.
South-central Quintana Roo An analysis of the fisheries in this sub-region suggests that fishing mortality has declined by over 50% during the time period examined (1981 to 1995 fishing seasons) while stock size has been relatively stable. The most recent estimate of fishing mortality is about equal to the assumed value of natural mortality, suggesting that lobsters in the area are not very highly exploited. The decline in estimated fishing mortality levels after 1988 is consistent with the observation that as many as two-thirds of the casitas used in some fisheries, particularly in the bays of the central region, were destroyed or buried after a hurricane. The analyses performed, however, assume that the mean weight of lobsters landed has not varied over time. Because the results could be sensitive to this assumption, it is recommended that historical records of mean weight be obtained in order to verify the conclusion about low exploitation rates.
Northern Quintana Roo Analyses for this sub-region were conducted based on data from Isla Holbox and Isla Mujeres. For Holbox, the results suggest high fishing mortality rates in recent years (average F during 1994-1995 estimated at 0.8 per year) and a population decline throughout the last decade (1994-1995 levels 75% lower than 1983-1984 levels). As was the case for the south-central Q. Roo analyses, the assessment for Isla Holbox assumes that mean weights have remained stable. The historical mean weight data should be obtained in order to verify the results of this assessment. In addition, the assumption of a closed population for this fishery

150
is highly questionable, such that the high estimates of fishing mortality could be a reflection of lobster emigration.
The results for the Isla Mujeres fishery suggest overall declines in recruitment and population size during the last decade (current levels are estimated to be around 50% of the levels in the early 1980s), and high recent levels of fishing mortality for female lobsters (a 1994-1995 average around 1.0 year-1). A simple equilibrium yield analysis suggests that this high exploitation rate may be sustainable because the fishery essentially targets mature individuals (thus they would have a chance to reproduce before becoming available to the fishery). However, this conclusion should be interpreted with caution, as it depends on a number of assumptions. Two assumptions in particular should be questioned. First, that the catch at age is recorded accurately. If, for instance, the catch of small lobsters was under-reported relative to the catch of large ones, this would lead to the incorrect perception that the fishery targets primarily mature individuals. Second, that the fishery can be treated as a unit stock. For Isla Mujeres, this second assumption is almost certainly violated because lobsters migrate in and out of the area; thus, the analyses would only pertain to a “snap-shot” of the population.
Given the caveats expressed above, it is recommended that further analyses be conducted on the basis of a wider sub-region encompassing Holbox, Isla Mujeres and adjacent areas, and possibly Yucatán.
Yucatán The available data on CPUE are relatively short and contain little contrast so as to permit a precise estimation of trends in population size or fishing mortality. An analysis of the data was made assuming a closed stock with density-dependent population regulation mechanisms and based on prior beliefs about plausible ranges of productivity parameters. These results suggest that the current level of fishing mortality is probably below that level which results in maximum sustainable yield. Given the caveats expressed for northern Quintana Roo, it may be reasonable to assess the Yucatán data together with those of the former in order to provide an interpretation of stock trends over a wider region.
10.5.3.4 Regional Estimated recruitment trends from the Gulf of Batabanó in Cuba and from two areas in Quintana Roo, Mexico, suggest that there is similarity in long-term recruitment patterns over a wide region. Of course, the alternative possibility that recruitment has declined coincidentally in the three areas due to declining stock sizes cannot be dismissed. Nevertheless, considering the long duration of the larval period for spiny lobsters, it is recommended that further comparisons of recruitment trends be made over a larger spatial scale (Caribbean-wide). Ideally, the methods used to estimate recruitment in the different sub-areas should be compatible. Such an analysis could lead to the development of a regional operational model that could be used to explore alternative hypothesis about spiny lobster population regulation.
10.5.4 Working Group 4
10.5.4.1 Bahamas The most important problem facing fisheries management in the Bahamas is handling the uncertainty of the stock status. In spite of the fact that the data collection system has been much improved in recent years, there is more that needs be done. The entire data collection and management system needs to be reviewed to ensure it will provide adequate advice for the optimal management of all fisheries in the Bahamas.
In light of the situation regarding the data available that is required for stock assessments, the status of the stock cannot be determined with any certainty. However, catch has been

151
relatively stable since 1991, which may indicate that current fishing areas are at or near full exploitation. The stable landings are probably due to the high opportunity cost with other economic opportunities to fishers. Some indications of recent drops in catch rates may have resulted in the stable catch and effort due to rent dissipation. Economic controls, such as export taxes, may be required to realise significant benefits from the fishery in the long-term. An alternative possibility, which cannot be discounted with the available information, is that current catches are unsustainable, and a long term decline in the fishery is possible as recruitment drops in line with decreased spawning stock, after some delay.
10.5.4.2 Bermuda Although catch rates have risen recently after a period of decreased catch during an experimental period, it is not clear to what degree this is due to changes in catchability as opposed to changes in stock size. Current catches appear to be similar to long term catches observed from 1975-1990, which suggests that they are sustainable. The current management strategy of tight control of effort together with detailed monitoring of catches and fishing activity appears to be adequate for protecting the stock and fishery in the long term. However, the spiny lobster, P. argus, is at the edge of its biological range in Bermuda, making it potentially more vulnerable to environmental effects and overfishing, such that any changes to management should be undertaken with particular care and good scientific backing.
The data collection programme in Bermuda is detailed and complete. This should result in excellent stock assessments in the long term. In the short term, there is an important opportunity for fishery experiments, which will help not only Bermuda, but also other countries in the region. With the present lobster fishery configuration, Bermuda can carry out experiments to test the effect of casitas on catchability and population size and the impact of different trap densities on catchability, both important questions in stock assessment. It is also important that Bermuda re-establish its puerulus collector programme, which provides one of the best recruitment time series for the region. If possible, Bermuda Division of Fisheries should continue its tagging experiments to improve estimates of key population parameters, which may be very different from those populations towards the centre of the P. argus zoogeographic range.
10.5.4.3 Florida (USA) The Florida fishery appears to be fully exploited. The depletion model indicates that spiny lobster in Florida experience very high cumulative fishing mortality rates (0.67 to 0.97 year-1), which is between two and three times the natural mortality rate. However, other evidence such as the stable landings and the size of lobsters landed from the trap fishery indicate that the model may not be able to explain the entire situation. An alternative explanation is that the fishing mortality includes a loss rate from the shallow waters where the fishery operates and that spiny lobsters migrate to deeper waters along the reef face and cease to be vulnerable except to divers in the upper 30m. Given this, the Trap Reduction Program appears to be an important step in the right direction, potentially reducing both fishing mortality and economic costs to the fishery. While landings have been stable for over 20 years, the number of traps had tripled until the Trap Reduction Program began in 1993 and approximately 300 000 traps have been eliminated from the fishery.
There remains considerable uncertainty regarding recruitment. The age-structured models indicated an increase in recruitment but the DeLury depletion model estimated flat recruitment in the past four seasons. The standardised numbers per trap of pre-recruit lobsters from the observer programme is increasing since 1993, supporting the age-structured models.
The lack of growth information on larger lobsters is also a major source of uncertainty in the fishery. As the numbers of traps are reduced in the fishery, presumably, survival will be higher and hence it will be even more critical in the future to be able to age larger lobsters.

152
Furthermore, the tagging information used to develop the growth model is 20 years old and may not reflect current conditions. Therefore, it is recommended that fishery-independent tagging programmes be established region-wide.
A second recommendation especially for the US fishery is to collect operating cost data for the spiny lobster fishers. The preliminary bioeconomic analysis presented for the US report was only able to use the total ex-vessel value in 1996-97 divided by the total number traps as a proxy for the cost of operating a trap.
10.5.4.4 Northeast Cuba Preliminary results from the stock model suggest recruitment has fallen since 1989, resulting in consistently lower catches. This may be due to exploitation, but without indices of spawning stock size or estimates of escapement, it is difficult to judge whether effort reduction would produce higher catches. Although lower, recruitment has remained stable from 1992-1997, so urgent action is not required.
It is important to review the way effort is recorded for this fishery. Traps are set around pesqueros, so it is not clear how effort should be measured. More detailed data on fishing activity, such as number of traps hauled and soak time, may be necessary. Pesqueros adapted as traps may provide stock abundance indices as well as an alternative method to catch lobster.
Indices monitoring different life stages in the north Cuban fishery need to be set up or maintained in much the same way as they have been in the Gulf of Batabanó, such as juvenile and puerulus collectors. Additional indices on the mature adults are necessary to estimate escapement. How these might be obtained is unclear, but exploratory trapping in deeper water may provide the necessary data.
One alternative option to maintaining the current management controls is to take measures to reduce fishing mortality to see whether this will result in increased catches in 3-5 years. This should primarily be considered a way to obtain important information for setting optimal controls. In all case, indices of juvenile and spawning stock abundance are required for management in the longer term.
10.5.4.5 Turks and Caicos The Turks and Caicos Islands stock is fully exploited. Cycles evident in the CPUE since 1966 indicate fluctuations in stock size and lower average catches than could be consistently realised. The data is consistent with these cycles being driven by the fishery, and in particular changes in opportunity costs and profits from fishing. Economic rent is also lower than might be expected under appropriate effort controls. The stock model suggests an increase in recruitment towards the end of the 1990s, although there are no data to verify this yet.
To protect the fishery, there is an urgent need to extend the current conch quota system to lobster, as well as implement additional closed season, tax and limited entry controls to protect resource rent. These controls can be set based on current data and models.
The Turks and Caicos Islands also possess an excellent bioeconomic data set extending back to 1966. This data set has only been partially analysed, and the database could easily be completed at low cost. As for Bermuda, it is recommended that Turks and Caicos continue a vessel monitoring programme using GPS, which given adequate data, will help build a better relationship between standard effort measures and fishing mortality for these fisheries. Given the paucity of information in the remaining Bahamian islands, it is of interest to the region to see this data set updated and a bioeconomic model developed to describe the fishery dynamics.

153
10.6 REGIONAL AND SUB-REGIONAL MANAGEMENT The preceding summaries of the status of the resource and fisheries for P. argus have been done largely from a national or even local perspective, reflecting the nature of the data available, the fisheries and the management regimes. However, these reports have also highlighted the shared nature of the resource and the fact that there are strong linkages between the lobster resources of many neighbouring and even further distant countries. These linkages, through movement of settled animals, dispersal of animals in the planktonic phase, and movement of vessels across national boundaries, demonstrate the need for close cooperation between the countries fishing for spiny lobster.
Such cooperation is badly lacking at present (Table 10.3). There are some bilateral agreements, involving Colombia, Cuba, Jamaica and Mexico, but the majority of countries appear to have no formal mechanisms for cooperating in research and management, and hence are unlikely to be able to manage the unit stocks of P. argus as a whole. All the countries are members of the Western Central Atlantic Fisheries Commission (WECAFC) which does provide a forum for exchange. However, WECAFC currently has no mandate for management, and it meets infrequently and has to cover a wide variety of topics. Hence, while it serves a useful purpose for communication in the region, in its current mode of operation, it does not provide the mechanism necessary for effective regional and sub-regional cooperation on research and management of spiny lobster. This issue needs to be addressed and, in accordance with the requirements of the Code of Conduct relating to transboundary stocks, consideration needs to be given to maintaining the initiatives represented by the 1997 and 1998 regional workshops on spiny lobster, and extending the cooperation to facilitate improved utilisation and management of the stock or stocks. WECAFC is a logical and appropriate organisation to coordinate and drive these developments.

154
Table 10.3 Bilateral or Multilateral agreements on Lobster COUNTRY Bilateral Multilateral (incl. Membership
International Organizations) Comments
Bahamas No formal agreements WECAFC CBD member Belize No formal agreements • WECAFC
• CFRAMP • Member Int.Convn. on Biodiversity • Discussions with Guatemala, Mexico and Honduras on
regional co-operation in research and management Bermuda No formal agreements WECAFC (through UK) • UK Dependent Territory
• Signatory to the UN agreement on Straddling fish stocks and Highly Migratory fish stocks (through UK) ?
• ICCAT member Brazil No formal agreements WECAFC • ICCAT member Colombia • Bilateral agreement with Jamaica on Alice
Shoal WECAFC Agreement with Jamaica on all fisheries resources
Cuba • Bilateral agreement with Mexico on technical co-operation and research
• Bilateral agreement with Jamaica on research
WECAFC • NAFO member(outside region) • ICCAT member
Dominican Republic No formal agreements WECAFC COPESCAL Honduras No formal agreements • PRADEPESCA, Phase 2- An EU funded
Programme on fisheries development (Panama, Guatamala, Honduras, El Salvador, Nicaragua, Costa Rica)
• WECAFC
Boats from Honduras licensed to fish in Nicaraguan waters
Jamaica • Bilateral agreement with Colombia on Alice Shoal
• Bilateral agreement with Cuba on research • Bilateral agreement with Mexico on technical
co-operation and research
• WECAFC • CFRAMP
Agreement with Colombia on all fisheries resources
Mexico • Bilateral agreement with Cuba on technical co-operation and research (between the 2 national centres for Research) (1988)
• Bilateral agreement with Jamaica on technical co-operation and research (1995)
• Agreement between Mexico and Australia on scientific exchange (new agreement under finalisation)
WECAFC Open Commercial agreement with Cuba to establish a Cuban-Mexican Joint Venture for the sale of lobster in Cancun, Mexico
Nicaragua No formal agreements • PRADEPESCA, Phase 2- An EU funded Programme on fisheries development (Panama, Guatamala, Honduras, El Salvador, Nicaragua, Costa Rica)
• WECAFC
Boats from Honduras licensed to fish in Nicaraguan waters Vessels from any country may obtain a licence to fish in Nicaragua provided they fulfil the licence requirements
St.Lucia ? WECAFC, CFRAMP OECS
USA No formal agreements Info:gregg.waugh@ safmc.nmfs.gov Venezuela No formal agreements WECAFC

155
11 CONCLUSIONS AND RECOMMENDATIONS
11.1 RESEARCH, DATA AND METHODS 1. It has emerged from the analyses undertaken in 1998 that, despite a number of studies
undertaken over a long time period and by several countries, there is considerable uncertainty regarding growth rates of P. argus in the region. The absence of good estimates of growth adversely affects the results of length and age-based methods, both of which are otherwise feasible and important for this species. The following recommendations were therefore made:
a) There are considerable data available on growth from several countries. These data should be used to explore different growth models and, if possible, a regionally or sub-regionally applicable growth model identified. This activity could be undertaken by individual countries but the results should be circulated to all countries for both information and discussion. It was agreed that Mr P. Medley will co-ordinate an informal working group composed of these countries, which would keep in contact by e-mail and correspondence. This working group would circulate the results of their informal working sessions.
b) Time did not allow for sensitivity tests of the assumptions on growth, and such sensitivity tests should be undertaken by each country for the assessments done on its fishery and the results considered in any conclusions drawn from the assessments.
c) It is also recommended that a series of growth studies, based on tagging, be undertaken in at least three different sites distributed over the range of P. argus. Each study would require a tagging and recapture exercise extending over three to four years and would have to involve tagging sufficient numbers of lobster to ensure enough recaptures to provide a statistically valid estimate of growth rate. However, it was agreed that such studies are very expensive and time-consuming and therefore, (although fully endorsed) that any further action should be taken at the national level.
d) Assessment results are usually particularly sensitive to natural mortality rate, M, which is generally poorly estimated for lobster in the region. It was therefore recommended that where closed or previously unexploited areas existed, length frequencies from these areas should be collected to facilitate refinement of the estimates of the parameter.
2. Future working sessions should consolidate the analyses and investigate the usefulness of regional stock models (e.g., spatially explicit and incorporating migration rates) for assessing lobster stocks. Regional approaches in stock modelling should also attempt to incorporate other sources of data (e.g., oceanographic studies) to improve further the understanding of regional inter-connectivity of lobster resources.
3. The use of CPUE as an index of abundance was considered to be complicated in several cases by changes in fishing strategies and, in the case of trap fisheries, by suspected interference as trap numbers increase above a certain undefined threshold. This issue highlights the importance of establishing time series of consistent fisheries independent biomass indices (e.g. scientific fishing during closed seasons) in all countries with important lobster fisheries.
4. Notwithstanding point 3, CPUE data are an important component of rigorous stock assessment. However, in many countries, reliable catch and effort data are not available, or are available for only a portion of the fishery.
a) It is strongly recommended that all countries should initiate or improve data collection systems to ensure they are collecting accurate and consistent data on total catch and

156
effort of the important fleets or fishing methods within their lobster fisheries. These data should include information reflecting any changes in fishing efficiency, which may be occurring through e.g. acquisition of equipment improving fishing or navigational efficiency.
b) In addition to the basic effort data, all countries should wherever possible routinely record covariates, such as trip duration, area and season in which the trip took place and other variables thought to affect catchability.
c) It is recommended that consideration should be given to possible spatial influences in the collection of CPUE data to account for heterogeneity in the distribution of the stock and changes in the geographical distribution of fishing effort.
5. The apparent value of using pueruli collectors as a predictive tool was endorsed. However, it was generally agreed that countries could pursue this option further at the national level. It was also recognised that it could be useful to determine the factors regulating or influencing lobster recruitment fluctuations through a study of puerulus and juvenile stage indices.
11.2 REGIONAL AND SUB-REGIONAL CO-OPERATION 6. While some countries participating in the workshop had sufficient data for successful
application of established stock assessment methods, it was noted that several other countries did not. It was therefore recommended that additional attention needs to be given to identification of existing methods or development of new methods suitable for such data-poor situations. Further, the existence of relationships between national pools of lobster should be explored with the aim of, amongst other things, determining the potential for extrapolating estimated trends in stock abundance and productivity from the data rich countries to neighbouring data poor countries. The growth studies discussed under point 1., and the regional models discussed under point 2., will contribute to meeting these requirements.
7. The clear interactions between lobster resources of different countries reinforce the need for on-going collaboration and scientific exchange between these countries, leading to compatible management measures and effective management of the stock over its entire range, in accordance with the Code of Conduct for Responsible Fisheries. As reflected in this report, good progress has been made in data analysis, stock assessment and bioeconomic modelling. Nevertheless, this work needs to be continued in a co-operative manner and in an atmosphere which includes input of regional and international technical expertise. It was therefore recommended that the working group should meet again in one year to continue and reinforce the work that has so far been undertaken. It was suggested that, thereafter, workshops should continue at two-yearly intervals. It was noted that the meeting between Mexico and Cuba scheduled for May 1999 could provide an opportunity for a follow-up workshop next year.
8. With the ending of the FAO/DANIDA project in June 1998, new sources of funds will have to be found to replace that source of support for these activities and, in addition, it is clear that the lobster producing nations themselves should be moving towards supporting such co-operation in order to achieve optimal and sustainable utilisation of this very valuable resource.
9. It was concluded that it was necessary to promote further the sharing of data and methodologies for lobster assessment between the various management and scientific authorities in WECAFC, and this would be facilitated significantly through the continuation of regular meetings of the technical working group. The following recommendations were also made to strengthen the functioning of such an on-going activity.

157
a) Consolidate existing knowledge through the creation of a regional database with information on all work done in relation to P. argus in the Caribbean region, including important internal reports. Further, scientists should be encouraged to publish relevant studies and reports. There was no specific mechanism identified or discussed for the proposed regional database, and this issue could be explored further in electronic format (e-mail) by the participants in the working group.
b) In order to facilitate and monitor inter-sessional progress, it was suggested that WECAFC, through the FAO sub-regional office in Barbados, should establish a file-server for the working group to enable on-going discussion and scientific co-operation on regional and sub-regional spiny lobster assessment and management.
c) Continue to contribute to improvements in institutional capacity by training technical staff in data management and stock assessment, and facilitate their participation in regional and international stock assessment forums to promote exchanges and transfer of skills and technologies.
11.3 ASSESSMENT AND MANAGEMENT 10. The findings from the stock and bioeconomic assessments are summarised in Chapter
10, and the reader is referred to that chapter for information on individual countries or areas. The results summarised there reflect a resource that is being fully or over-exploited throughout much of its range. With the data that were available, this scenario was considered to apply to Brazil, southern Cuba, Florida (USA), Honduras, Jamaica, Nicaragua, Quintana Roo in Mexico, Turks and Caicos Islands and Venezuela. While there were problems related to reliability and adequacy of data from nearly all countries, there were insufficient or inadequate data from the Bahamas, Belize, Colombia, northeast Cuba and the Dominican Republic, for even preliminary assessments of the state of the resources to be undertaken at the workshops. These countries or areas need to implement adequate data collection and analysis systems without delay.
11. In general, two types of control measures were most commonly recommended as a result of the assessment results:
a) The first and most important was that, in most countries, there is an urgent need to control and reduce fishing effort in the lobster fisheries. Most of the countries have open access regimes in their lobster fisheries and effort was frequently found to be increasing. In many cases, effort was estimated to be above sustainable levels, higher than the economic optimum or both. Effort control, including reducing capacity where necessary, is a prerequisite for sustainable fisheries (see e.g. paragraphs 7.6.1, 7.6.2 and 7.6.3, of the CCRF) and countries with excess effort, as discussed in Chapter 10, should take urgent action to bring their fishing effort to levels commensurate with the productivity of the lobster resource and also to levels that ensure social and economic efficiency. The most effective approach for doing this is to restrict entry into the fishery to licensed fishers, and to ensure that the total effort represented by all the licensed fishers is commensurate with both the productivity of the resource and acceptable economic returns. A less effective alternative approach, that may be socially less disruptive at least in the short term, would be to adjust the length of the closed season to a level that, based on total potential effort, restricts annual fishing effort to the desirable level. This approach will, however, impact the income of fishers, and this needs to be considered in determining appropriate effort control measures.
b) In several countries and fisheries, including Brazil, southern Cuba, Venezuela and Florida (the last through the use of small lobster as attractants), concern was expressed that lobsters of below desirable size were being caught, with resulting negative impacts on the resource and on potential yield. The dangers of allowing fishing on lobsters that have not yet had the opportunity to reproduce and hence

158
contribute to recruitment to the stock were discussed in Chapter 10. Particularly in those countries without or with inadequate effort or total catch control, minimum sizes sufficiently above the age of maturity to provide adequate recruitment should be implemented and enforced.
12. The use of bioeconomic models in this workshop in selected case studies, to consider the biological and economic implications of alternative management strategies, clearly demonstrated their potential value for decision-makers. They allow the rigorous comparison of biological and economic performance indicators, including uncertainty, enabling decision-makers to make informed decisions using the best scientific information available. Therefore, the following recommendations were made.
a) For those countries where models have been developed, some time should be spent, as necessary, in refining the parameter estimates and undertaking further analyses to explore sensitivity and further management options. Thereafter, efforts should be made to ensure routine application of bioeconomic modelling in fisheries management with participation by resource users and managers.
b) In those countries where such analyses were not undertaken, participants should familiarise themselves with one or more of the generic models used in the workshop and introduce them to the Fisheries Departments in their own countries. Appropriately modified models should be adopted for routine analysis of the status of the stocks and review of management measures, and steps should be taken to ensure that the data necessary for application and updating of the models is collected.
13. Various assessment methods using different assumptions can lead to variation in the estimates of stock trends and status. For this reason, consistent with the precautionary approach, transparency at all levels of the process and rigorous peer review has become a feature of stock assessment in many countries and international fisheries management organisations. Some comparisons in methods and peer-review were undertaken at the workshop but these were limited by time. It is recommended that all assessments on P. argus that are to be used for management purposes should be thoroughly reviewed before final recommendations are made. Where there is a pool of independent expertise within a country this could be used. Where this does not exist, mail and the good will of experts within and outside the region could be used.
14. The potential value of closed areas as a management tool was endorsed fully, and it was recommended that countries should take advantage of this to improve protection for spawners, juveniles and important habitats. This was potentially an important insurance against a lack of information and hence high risk of failure in other management measures.
a) In order to realise the full benefits of this type of management strategy, it was recommended that there was a need to improve further the understanding of growth and migration, and quantitative linkages between lobsters, habitat and depth. It was further noted that useful data may already exist from previous tagging experiments.
b) Rotating harvest strategies should also be considered as potential management tools to increase productivity and protect spawning stocks in the lobster fishery.
15. The need for the establishment of common strategies for adequate management of the lobster fishery in the Caribbean region was emphasised. Tables 10.1 and 10.2 illustrate widely varying minimum size and closed season variations. It would be beneficial for countries to realise a greater degree of co-ordination in setting limits towards achieving sustainable yields and improved enforcement in the region.
16. It was recommended that, based on the existing data and results, several of the countries are now in the position to develop further or to implement scientifically-based management strategies. It was stressed that there will always be some level of uncertainty in scientific advice for fisheries management. However, the temptation to use

159
this uncertainty as a reason not to provide advice to management should be avoided and it is the responsibility of fisheries scientists to provide advice on the basis of the best scientific information available. This is consistent with the Code of Conduct for Responsible Fisheries and the precautionary approach.

161
PART II NATIONAL REPORTS AND REFERENCES
compiled and edited by S.C. Venema
1 NATIONAL REPORT ON THE SPINY LOBSTER FISHERY IN THE BAHAMAS1 V.K.W. Deleveaux and G. Bethel
1.1 DESCRIPTION OF THE FISHERIES The Bahamas is an archipelago that extends from south Florida of the USA to the large island of Hispaniola in the Caribbean Sea. The Bahamas covers an area greater than 259 000 sq. km and has a mean temperature around 25°C. The shallow water banks have an average depth around 9 m but water depth can exceed 1.6 km in the Tongue of the Ocean. Just west of the Tongue of the Ocean is the world's third longest barrier reef, running along the east coast of Andros, the largest island in The Bahamas. The Bahamian fishing industry has great potential for growth through the development of the necessary infrastructure and manpower to efficiently and fully utilize the natural resources available within the Exclusive Fishery Zone of The Bahamas. The Department of Fisheries is responsible for the administration of the fishing industry and for the management and development of fisheries in a sustainable manner for the benefit of all Bahamians. Therefore, a prime responsibility of the Department is the formulation and implementation of sound fisheries policies and development objectives. The commercial fishing industry of The Bahamas is based primarily on its shallow water banks, principally the Little Bahama Bank and the Great Bahama Bank. Other shallow water bank areas are also found adjacent to several of the southeastern islands. These banks cover an area of about 116 550 sq. km. and have a edge estimated at 4 000 km, along which the depths plummet to between 370 m and 3 700 m. Much of the fishing effort is concentrated on the Great Bahama Bank and the Little Bahama Bank. The principal categories of fishery resources caught in commercial quantities from the Bahamian Exclusive Fishery Zone are spiny lobster (Panulirus argus), conch (Strombus gigas), shallow and deep water scalefish (Epinephelus spp, Mycteroperca spp, Lutjanus spp, Haemulon spp, Caranx spp, Selar spp), sponges (Hippospongia lachne, Spongia spp), marine turtles (Chelonia mydas, Caretta caretta) and another marine gastropod, the queen helmet shell (Cassis madagascarienis). Most of the catch is landed in the islands of New Providence, Abaco and Eleuthera, however Grand Bahama, Long Island and Andros have lesser but still significant landings of fishery resources (Figure 1.1). The typical fishing unit in The Bahamas is a small open boat, locally called a dinghy, which is approximately 5.2 m in length with an outboard engine of about 70 hp. This boat usually carries two men and is used mainly as a platform from which a diver armed with either a spear, or now more often a spiny lobster hook, will operate. The spiny lobster diver searches the natural reefs and artificial habitats (casitas) for his targets. He may legally be supplied with air from a compressor on board the dinghy during the spiny lobster open season. This boat, along with up 1 Version presented at Workshop in Mexico, 1998 and additional figures presented in Belize

162
Figure 1.1 Main fishing grounds of the Bahamas to 7 or 8 similar boats, is often towed by a larger vessel, ranging in size from 13.7 m to 30.5 m, which acts as an operations base, providing food, sleeping quarters and catch storage. This arrangement allows the small boat to operate for up to four weeks at sea. Other fishing gear that may be carried by the larger vessel include fish traps, spiny lobster traps, hook and lines and seine nets. The larger fishing vessels usually sell the spiny lobster catch to a processing plant while the remaining catch may be sold to the processing plant or to fish vendors. The importance of the artificial habitats (casitas) to the Bahamian spiny lobster fishery is evident. These devices, which are placed on the seabed by fishermen, are used to attract lobsters by providing a shelter from predators. It was estimated that there were approximately 650 000 of these artificial habitats and about 105 000 lobster traps being used by fishermen.
1.2 MANAGEMENT REGULATIONS It has been the Government’s policy to reserve the commercial fishing industry for exploitation by Bahamians as far as possible. To this end, all commercial fishing vessels fishing within The Bahamas’ Exclusive Fishery Zone must be fully owned by Bahamian citizens who are resident in The Bahamas. Recently, shore-based seafood processing and marketing establishments have been allowed to have full foreign ownership. The harvesting of spiny lobster is legally done during the open season: August 1 through March 31. The legal minimum size limit for possession of spiny lobster is a tail length of 14 cm or a carapace length of 8.25 cm. Possession of any egg-bearing spiny lobster and the removal of eggs from an egg-bearing spiny lobster is prohibited.

163
1.3 BIOLOGY During 1995 the Food and Agriculture Organization of the United Nations (FAO) funded a project to assess the management options for the spiny lobster fishery that was conducted by the Department of Fisheries. In order to increase the employment and earnings in the sector, the Department of Fisheries has adopted policies leading to the expansion of the industry. Accordingly, it was necessary to focus on the conservation and management of the fishery resources, particularly for the spiny lobster. Therefore, a minimum size for harvesting spiny lobsters needed to be defined so that the optimum yield is maximized in a sustainable manner. Defining such a minimum size would also enable the Department of Fisheries to take steps to minimize the over-fishing and over-capitalization of the industry and the negative economic and social effects that occur with these conditions. The project was based on data from the Department of Fisheries spiny lobster export databases. The databases give information on exports in all the commercial size categories. Since about 90 percent of the landings are exported each year, the export statistics were used as a fairly accurate representation of the landings. The weights of spiny lobster tails within each commercial size category were converted to number of animals by tail length in centimeters. This conversion was done by a computer programme that takes into consideration the natural and statistical uncertainty observed in the tail length frequency distributions. Once the number of animals within specific size intervals is known, a number of length-based techniques can be used to estimate fishing mortality rates and population sizes. A tuned length cohort analysis procedure was chosen as it gave more consistent population estimates over time. The results indicated that a minimum tail size in the range of 13.5-13.7 cm (which corresponds to a tail weight of about 0.14 kg) would sustainably optimize the yield from the fishery and not endanger future harvesting of spiny lobster. The average weight of a spiny lobster tail exported from The Bahamas during calendar year 1997 was 0.22 kg.
1.4 AVAILABLE DATA AND RECENT DEVELOPMENTS Fishery-dependent data The data that has been collected over the last two decades indicate that both the weight and value of the total landings of fishery products have steadily increased. This is especially so in the case of the spiny lobster (Table 1.1 and Fig. 1.2). This increase is mainly due to the enhanced landings of spiny lobster due to increased fishing effort, changes in fishing techniques and increased resources applied to harvesting that resource. The total recorded landings of fishery products for 1997 was 10 487 tonnes with a value of B$69.5 million. Note that these recorded landings figures are known to be less than the actual landings because there are no fishery extension officers in some of the Family Islands where there are major fishing communities. Since there is no one to collect the required information, the landings data are simply lost. Recorded catch figures are available for the entire country. However, catch and effort data are only recorded for several of the main fishing islands, where a fisheries officer is posted. The effort data are not recorded in the Family Islands as there are no fishery officers available to collect these data. In the past, New Providence, being the capital and main population centre,
Table 1.1 Bahamas, recorded landings of spiny lobster Year 1982 1983 1984 1985 1986 1987 1988 1989
Weight (t) 2,427 2,599 3,455 5,543 3,579 4,591 5,103 6,192
Value 1,000$B
10,757
10,528
14,472
23,469
15,811
28,651
26,241
31,124

164
Year 1990 1991 1992 1993 1994 1995 1996 1997 Weight (t) 5,806 7,575 8,156 7,855 7,587 7,788 8,262 7,949
Value 1,000$B
32,321
51,012
54,115
45,285
57,263
59,982
54,008
59,346
Fig. 1.2 Recorded weight of spiny lobster landed in the Bahamas received most of the marine resource landings, but in recent years, as the Family Islands became more developed and as the processing and export facilities in the Family Islands expanded, this is no longer the case. The Department of Fisheries has officers in New Providence, Andros, Abaco and Grand Bahama who visit the landing sites to collect catch and effort data on a daily basis. The information is recorded on a Marine Resource Landing Form which takes note of the fishing area, gears used, the time factor, the number of men involved, the catch, its weight and value by species. Also, all processing plants are required to submit to the Department a Monthly Purchase Report that details total purchases by weight and value, the source of the resource and date of purchase on a monthly basis (see Fig. 1.3). Further, the data collectors record all marine resources shipped from the Family Islands to New Providence as Freight Landings in New Providence. The freight landings are then correctly associated with their island of origin. Note that in calculating the total recorded landings for The Bahamas those products known to have been landed in the Family Islands and shipped to New Providence as freight are not duplicated. The catch and effort data is recorded into the Bahamas Fisheries Information
0
1,000
2,000
3,000
4,000
5,000
6,000
7,000
8,000
9,000
1982 1983 1984 1985 1986 1987 1988 1989 1990 1991 1992 1993 1994 1995 1996 1997
TO
NN
ES

165

166
System (BFIS), a computer programme at the Department of Fisheries which calculates the effort figures. The final results are compiled and included in the Department's Annual Report.
One of the major problems with the catch and effort data recording system involves the lack of manpower and equipment available to collect the data. Also, the very archipelagic nature of The Bahamas makes data collection as well as the enforcement of fisheries regulations quite difficult. There are currently no fishery officers available to collect the relevant data in all of the Family Islands. However, efforts continue to be made to correct this situation. This results in the loss of very important data to the Department of Fisheries, especially in light of the recent shifts in marine resource landings to the Family Islands. Also, there certainly are not enough trained and/or motivated staff members to collect data in New Providence at all the various landing sites. Further, equipment such as vehicles and boats that would enable fishery officers to be able to effectively and efficiently collect the required data and execute their other duties are simply not available. Therefore, the total recorded landings information that is received and distributed is accepted to be incomplete.
Fishery-independent data Currently there is no fishery independent data collected by or supplied to the Department of Fisheries on a continuous basis on spiny lobsters in The Bahamas.
Socio-economic dataThe commercial fishing industry makes a significant contribution to the country’s economy.Fishing vessel owners and operators earned in excess of B$69.5 million through the harvesting of fishery resources during 1997 (B$1.00 = US$1.00). The harvesting of spiny lobster is by far the most important commercial fishing activity in The Bahamas (Table 1.2). During 1997, it contributed 75.8 percent by weight and 85.3 percent by value of the total recorded landings of fishery products in The Bahamas. These spiny lobster landings amounted to 7 949 tonnes and had a value of B$59.3 million.
Table 1.2 Summary of total recorded landings of marine products in the Bahamas
by weight (tonnes) and value (b$), 1995 - 1997 Year 1995 1996 1997 Products tonnes b$ tonnes b$ tonnes b$ Spiny lobster 7,788 59,982,048 8,262 54,008,396 7,949 59,346,784Conch (fresh) 494 2,106,925 589 2,715,510 648 2,942,065Stone crab 40 622,616 25 394,837 42 658,967Turtle (green) 1 1,615 2 3,661 2 5,923Turtle (loghd) 2 3,826 1 2,310 1 2,557Nassau grouper 358 1,613,648 331 1,699,039 514 2,477,255Other grouper 4 16,216 15 64,417 76 365,099Grouper (fillet) 61 394,817 52 349,051 68 438,563Snappers 297 658,607 341 1,001,784 751 2,303,289Jacks 72 150,188 91 226,336 103 220,602Grunts 8 12,521 14 26,129 67 121,516Sharks 0 0 4 24,471 3 14,252Others 381 875,392 385 876,422 264 644,148TOTALS 9,504 66,438,419 10,111 61,392,363 10,487 69,541,020

167
Table 1.3 Summary of fishery products exports from the Bahamas during 1997
Products Units Quantity Value (b$) Spiny lobster tonnes 2,351 59,142,969 Scalefish tonnes 143 676,754 Conch meat tonnes 165 981,961 Stone crab claws tonnes 22 394,022 Total sponges tonnes 56 858,175 Queen helmet shells pieces 3,834 120,300 Conch shells tonnes 4 4,675 Marine invertebrates tonnes 1 36,480 Total 62,215,336
About 90% of the spiny lobster landed are eventually exported by processing plants. Exports of all fishery resources and fishery products during 1997 had a value of B$62.2 million. Spiny lobster exports accounted for 95.1 percent of this total value. Spiny lobster exports for 1997 amounted to 2 351 tonnes with a declared value of B$59.1 million (Table 1.3). Most of the spiny lobster was exported as ‘individually quick-frozen’ (IQF) tails. Using data derived from the 1995 Bahamas Fisheries Census, the commercial fishing fleet consists of approximately 650 active and licenced vessels, each having a length greater than 6.1m and about 1500 smaller boats which currently are not required by law to be licenced for commercial fishing. The labour force estimates from the census indicate that there were about 9 300 persons employed on a permanent basis in the commercial fishery sector during 1995. Fishermen comprise about 93 percent of this total, numbering about 8 800. The remaining persons are employed mainly as workers in either processing plants or buying stations throughout the country. Important Developments in the Fishery During the last year the Department of Fisheries implemented its training programme for quality assurance and seafood safety. The objective of this training programme was to ensure a successful implementation of a Hazard Analysis and Critical Control Points (HACCP) based programme within the processing facilities of the country. This programme will allow the international markets to remain open to Bahamian seafood products, thereby allowing the continuation of commercial harvests of the spiny lobster. Thus far, the Department of Fisheries has agreements in place with the Food and Drug Agency (FDA) of the USA, allowing the continued entry of Bahamian fishery products into the USA.
1.5 STATUS OF THE STOCK The Department of Fisheries considers that the spiny lobster stocks in The Bahamas are still in a healthy condition and that currently the fishery is not fully exploited.

168
2 NATIONAL REPORT ON THE SPINY LOBSTER FISHERY IN BELIZE2 G. Richards
2.1 DESCRIPTION OF THE FISHERY Lobster is mostly caught within the extensive inshore reef habitats along the coast of Belize in wooden traps or by divers using hook-sticks. Some fishermen in the northern parts of Belize have utilized 'shades' successfully, and the use of trammel nets has been reported in the Port Honduras area (see Figs. 2.1 and 2.2). The traps used are rectangular palmetto traps normally un-baited (or with coconut) with a funnel entrance on one side. They are set in the sea-grass beds behind the reef crest in shallow waters (3-16 m). Two boat types are normally employed: small motor launches (5-10 m) using between 15 and 75 Hp engines, and sailing sloops averaging eight meters with auxilliary outboard motors. The launches are usually used for the fishermen who have traps, while those on the sailing sloops dive. The lobster fishery is the highest traditional export-earning fishery within the industry. It is a regulated fishery, kept open for eight months of the year. It earned approximately US$8 million on 809 mt of processed exported product in 1997. There are currently four functional fishing cooperatives (co-ops). These are the traditional landing sites for most harvested lobster, and today most of the recorded lobster landings are taken from co-op records. Although some fishers sell their produce directly to hoteliers, resorts and other businesses (see Fig. 2.3). Commercial fishing for lobster started in the early 1930s and catches have increased steadily. Lobster production peaked in the early 1980s with a record catch of 1011 mt in 1981, and has since averaged between 600-800 mt seasonally. The value of the industry has grown steadily. This is most likely a result of good market prices obtained due to value-added processing, such as ‘whole-cooked lobster’ and not really an indication that the catch is increasing.
2.2 MANAGEMENT REGULATIONS Fishing for lobster is regulated by the Fisheries Act of 1948, and its Amendments, Regulations and its Subsidiary Legislation. It is illegal to harvest :
a) lobster with carapace length less than 7.62 cm (3 in.);
b) tail-weight less than 112g (4 oz);
c) between 15 February and 14 June inclusive of any calender year;
d) 'berried' (having eggs) or with eggs forcibly removed;
e) moulting or soft shelled lobster, and
f) using scuba equipment in commercial fishing. The cooperatives, where more than 95 percent of all landed lobster goes, have a policy of not accepting illegal produce. However, this is not always upheld. The regulations are enforced by the Conservation Compliance Unit (Enforcement Unit) of the fisheries department. There is currently a mandatory licensing and registration system for 2 Version presented at Workshop in Mexico, 1998 and additional figures presented in Belize

169
Fig 2.1 Map showing the demarcation of the Belizean coastline into fishing areas. Adapted from Auil (1993)
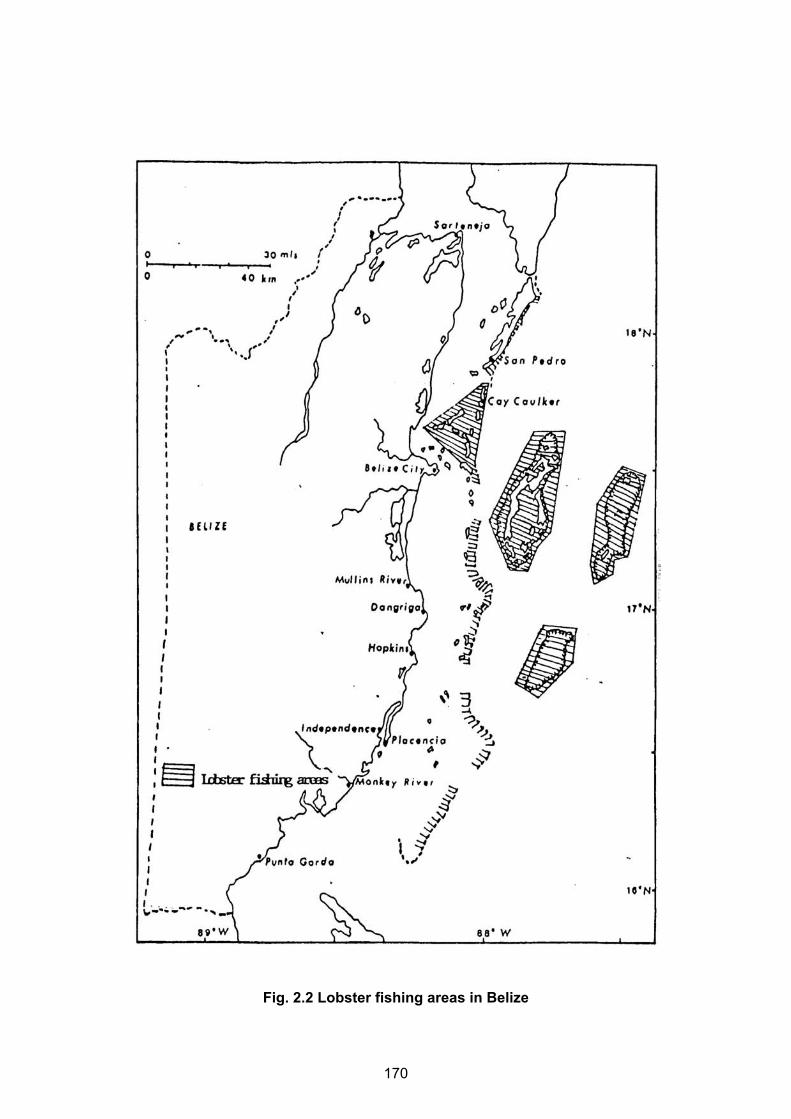
170
Fig. 2.2 Lobster fishing areas in Belize

171
Fig. 2.3 Lobster export and foreign exchange boats and fishers; with levied fines for non-compliance. However, fines are too low and do not act as disincentives. The current Fisheries Regulations are under review and effort limitation scenarios are being considered for particular areas. These include limited-entry and individual gear quotas.
2.3 BIOLOGY While some biological research data exists on the biology of spiny lobsters in Belize the information requires updating as it is older than 30 years old. Allsopp (1968) completed a study to introduce a data collection system capturing fisheries statistics and provide information on spawning seasons as indicated by the occurrence of ‘berried’ females. His work also outlined the effects of factors such as socio-economic and environmental conditions on catch; and sought to document other stock parameters, such as on fecundity (see Table 2.1).
Table 2.1 Fecundity of ‘berried’ females at different carapace lengths Size of Female
(Carapace Length in cm) Egg Count
6.9 260 000 8.4 410 000 9.6 530 000
11.9 870 000 Adapted from Allsop (1968)
Recruitment, and natural mortality were discussed in descriptive details as they relate to migration and shortening of the actual fishing season for the former, and cannibalistic

172
predation and discarding of lobster waste (removed heads etc.) for the latter. Weber (1968) conducted a tagging study to estimate growth and movement. This study also included information on morphometrics. Unfortunately the original data is not available and the report does not contain equations for length/weight or length/length relationships. These reports provided substantive basis for the formulation of the Fisheries regulations regarding the spiny lobster fishery. Wade, Auil and Fanning (1992 in press) also conducted research on the morphometric relationships for spiny lobster for use in verifying and updating the then Fisheries Regulations. The table below summarizes those relationships. Recommendations from the last mentioned report were used to make an amendment to the Fisheries Regulations in the same year.
Table 2.2 Direct and indirect morphometric relationships Sample Location Type of Relationshi Variables Equation
Caye Caulker National Cooperative. (Belize City)
Direct Indirect
CL:TW CL:TL - TL:T
CL =16.31 x TW0.311
TW =0.0012xCL2.689
CL = 11.13+13.418xTW0.333
TW0.00013x(32.08+1.375xCL)2.808
Adapted from Wade et al. (1992)
2.4 AVAILABLE DATA Fishery-dependent data Production estimates are available since 1932 (Fig 2.4) based on recorded landings from the major fishing cooperatives. The number of fishing gear units is unknown, however, two series of CPUE (catch per unit effort) data are available for the periods 1973-1981(Figs. 2.5 and 2.6) and 1993-1997 respectively. The older series of CPUE data suggest a steady decline, while the more recent series shows a stabilized trend. There is information conforming an increase in the number of active fishers and vessels in the 1980s . This increase in effort might relate to the stabilizing of the CPUE. Since prior to that time the catch was decreasing while the effort remained relatively steady, and their was an increase in both catches and effort during the same period. The more recent data series also includes monthly biological sampling taken at the major co-ops (started in 1996), which will be used to estimate the size composition of the landings. The monthly samples represents data from three important lobster fishing grounds - Areas 1,4 and 5 (Appendix 2). It is important to note that the size composition data only include legal sizes and independent sampling at sea is necessary to document pre-recruits. Fishery-independent data The biological sampling program also includes an independent component that seeks to monitor size frequency distribution of the catches from traps operated in areas 4 and 1. This was started in 1996 as a component of the biological data collection program. Monthly records on pueruli settlement have been obtained since 1996, using two sets of collectors set along the reef in Areas 4 and 5 respectively. We are using several types of collectors in these areas. In this initial period the study has two goals. • To see which type of collector performs best in the Belizean environment; and
• To determine the best placement of the collectors.

173
Lobster Production (1932-1997)
1995
19601986
1967
19461955
1981
0.00
200.00
400.00
600.00
800.00
1000.00
1200.00
Who
le W
eigh
t (m
t)
Fig. 2.4 Lobster Production for period 1932-1997 Adapted from Allsop (1968) and National Fisheries Statistics.
CPUE in Boat-days
1.0
10.0
100.0
1000.0
10000.0
wei
ght/b
oat-d
ay(lo
g sc
ale)
Fig. 2.5 CPUE trend in weight per boat-days for period September 1978 to December 1981: Collected Fishery Data (unprocessed) 1973-1981.
CPUE in man-days
0.0
20.0
40.060.0
80.0
100.0
wei
ght/m
an-d
ay
Fig. 2.6 CPUE in weight per man-days for period 1973-1981 Collected Fishery Data (unprocessed) 1973-1981.

174
The results obtained so far have shown that at least one type of collector deteriorates too quickly, and the results from all collectors have been minimal (<10 individuals per month). Indication are that the placement of the collectors need to be re-evaluated. Independent studies were conducted to determine which parameters to utilize in sampling lobster tails. The morphometric relationships so derived showed that total tail length and second segment width are the most appropriate measures to sample for size frequency analysis. The relationships are defined by the following linear equations which are taken from an unpublished fisheries report of 1996:
CL - TLt (Both) y = 0.623x - 5.43 [R2 = .90] CL - SSw (Both) y = 1.552x +.347 [R2 = .92]
Socio-economic data The fishery employs about 90% of the 3000 registered fishers, and provides employment for about 200 processing workers for at least eight months of the year. It utilizes about 80% of the 968 active vessels registered for fishing in 1997. Cooperatives are required to submit monthly reports on production and export to the Fisheries Department. These figures are later verified using copies of export sheets that must come through the department for approval. Recent annual exports have averaged US $8 million dollars. However, there is an unaccounted for portion of revenue that is lost to illegal exports.
2.5 STATUS OF THE STOCK Information (catch and effort statistics as well as biological data) on the lobster fishery has only recently been collected in a systematic manner that could facilitate the provision of management advice. Fishers do suggest that the fishery is being over-fished. However, we are only now attempting to do a comprehensive stock assessment exercise. Data on harvesting of illegal lobsters is also unaccounted for. Although it is believed that this is a significant quantity. No thorough analysis of stocks has been conducted so far and although our time series of data only spans 3-4 years we believe that this along with the local knowledge of fishers and historical data provides sufficient information on which to make management decisions for the fishery.

175
3 NATIONAL REPORT ON THE SPINY LOBSTER FISHERY IN BERMUDA3 B. E. Luckhurst
3.1 DESCRIPTION OF THE FISHERIES Commercial lobster fishing was conducted using Antillian arrowhead wire traps on the Bermuda reef platform and two offshore banks until 1990 when a fishery management decision to ban fish pots led to the implementation of an experimental lobster fishery (Ward and Luckhurst,1996). The same traps were traditionally used for both fish and lobsters but fishers baited and set their traps differently when targetting lobsters. As a consequence of the closure of the fish pot fishery in 1990, the government decided to develop and test designs for a lobster-specific trap which would reduce reef fish by-catch. In 1996, a highly regulated limited entry lobster fishery was established with a maximum of 300 government-owned standard traps available for lease by a maximum of 20 licence holders (Luckhurst, unpublished). Fishing vessels from 8-12 m in length, mostly equipped with hydraulic or electric pot haulers, are used to work traps on the reef platform in designated zones. Lobster trapping has not been permitted on the offshore banks since 1990. In addition to the commercial fishery, a recreational lobster diving fishery was established in 1984. Divers are required to be licenced annually, to adhere to a bag limit of two lobsters per day, must submit statistics and may not sell their catch.
Fig. 3.1 Reported lobster (Panulirus argus) landings from the commercial fishery and recreational divers. See text for explanation of experimental fisahery landings 1991-
1995 Reliable statistics (landings and gross effort) from the commercial fishery have been collected since 1975 with numbers of whole lobsters reported. Landings oscillated from 1975-1989 between approximately 21 000 and 35 000 lobsters (Fig. 3.1). The number of vessels potentially trapping for lobsters declined from 1986-1989 with the implementation of a limited entry trap fishery but measures of directed trapping effort are not available.
3 Presented at Workshop in Mérida, 1998
05000
10000150002000025000300003500040000
Landings of spiny lobste r (Pa nulirus a rgus ) a t Bermuda
Commercial FishersRecreational Divers

176
Landings reported during the experimental fishery (1990-1995) were significantly lower than those before the fish pot ban due, in part, to the area restriction of this fishery to the edge zone (36-65 m depth) of the reef platform and to the use of novel trap designs. The limited entry fishery established in 1996 incorporated annual rotating area closures on inshore portions of the reef platform. In the past two years, detailed catch and effort statistics have been collected using the standard lobster trap developed during the experimental fishery. Landings increased markedly during this period approaching earlier historical levels (Fig. 3.1).
3.2 MANAGEMENT REGULATIONS It is illegal to harvest or be in possession of spiny lobsters: (A) less than 92 mm (3.625 in.) carapace length, (B) between April 1 and August 31, (C) with eggs, (D) using any gear type other than that for which a fisher is licenced (commercial - standard traps only, recreational - lobster noose only). In addition, all lobsters must be landed whole; it is illegal to wring tails at sea. Area restrictions apply to both commercial and recreational fishers to minimize spatial overlap and thus reduce potential conflict between user groups. Five fisheries wardens enforce the regulations both at sea and on land. Imported lobsters are inspected for compliance with regulations. There have been no new fishing vessel licences issued since 1982. There were approximately 220 licenced vessels at that time but the implementation of a limited entry fish pot fishery starting in 1986 restricted use of fish pots to full-time fishermen only. By 1990, when the fish pot ban was implemented, the number of licensed fishing vessels had been reduced to approximately 120. Only about 70 of these vessels were permitted to use traps at that time. All licensed fishers are required to submit catch and effort statistics (on a per trip basis) in a long established self-reporting system. There is no systematic validation of the accuracy of the data provided in this program.
Fig. 3.2 Reported guinea chick (Panulirus guttatus) landings from the commercial fishery
0
10000
20000
30000
40000
50000
1975
1976
1977
1978
1979
1980
1981
1982
1983
1984
1985
1986
1987
1988
1989
1990
Landings of spotted spiny lobster (Panulirus guttatus ) at Bermuda. Trap fishing for P. guttatus ceased in 1990.
No.
of
Lobs
ters

177
3.3 BIOLOGY Sutcliffe (1952) conducted the first research on spiny lobsters (Panulirus argus) in Bermuda. He used a tag-recapture methodology to determine seasonal migration patterns on the Bermuda reef platform as well as to examine reproductive biology. Studies of the phyllosoma larvae of spiny lobsters (Farmer et al., 1989) and puerulus settlement patterns (Ward, 1989) were undertaken by the Division of Fisheries during the 1980s to better understand the early life history of spiny lobsters around the Bermuda seamount. Evans (1988) studied the population dynamics of two species of spiny lobster (P. argus and P. guttatus ) using principally tag-recapture data. A genetics study using electrophoretic techniques to investigate spiny lobster stock structure in the greater Caribbean area was conducted by Hateley and Sleeter (1993). The results of this study indicated that it was not possible to differentiate Bermuda spiny lobsters from those originating from other Caribbean locations using this analytical technique. Evans et al. (1995) studied the reproductive biology of both species of spiny lobster as well as migratory behaviour in P. argus (Evans and Lockwood, 1996) and population dynamics in P. guttatus (Evans et al., 1996). A limited tagging study conducted by the Division of Fisheries in 1997 indicated movements in excess of 32 Km around the Bermuda reef platform (Luckhurst, unpublished data) but the number of recaptures to date has been too small to conduct further analyses. The Division of Fisheries commenced a study of the fishery biology of P. guttatus in April 1998.
3.4 AVAILABLE DATA AND RECENT DEVELOPMENTS Fishery-dependent data Reported landings by the commercial fishery are available for P. argus (Fig. 3.1) and P. guttatus (Fig. 3.2) from 1975-1989 from the fisheries statistical database. A gross measure of effort (trap hauls) is available for this same period but no measures of directed effort for lobsters can be derived from the database.Landings and effort data from the experimental fishery (1990-1995) and the limited entry fishery using standard traps (1996-1997) have been collected. In addition, landings from recreational divers are available from 1984-1996 (Fig. 3.1). No regular biological sampling program was in effect until the experimental fishery started in 1990. From this time until the present, data on size, sex and reproductive condition have been collected regularly on fisher’s vessels at sea as well as at dockside. Fishery-independent data There has been no fishery-independent sampling of the lobster population. Weekly records of puerulus settlement were collected using Witham-type habitats starting in August 1983. The maximum number of 10 stations was reduced to four by 1987 and sampling was continued until the summer of 1996. Socio-economic data There has been no systematic collection of socio-economic data but market values of lobsters are recorded each season such that gross estimates of the value of landings can be estimated. The approximate value of the commercial landings from the 1997-1998 season was US$520 000. Important developments in the fishery With the initial success of the limited entry spiny lobster fishery in 1996-1997, there was a considerable increase in the number of applicants for the following season (1997-1998). As the number of licence holders was established at a maximum of 20 full-time fishers, there was a degree of dissension in the fishery regarding the mechanism of allocation of licences.

178
The government is evaluating the options for allocation but may select a form of lottery draw system as the fairest mechanism.
3.5 STATUS OF THE STOCK The only quantitative assessment of the stocks of both species of spiny lobsters was conducted by Evans (1988) and Evans et al. (1996). The expansion of the previous area restrictions in the spiny lobster fishery in the past two years has led to substantial increases in reported landings which are approaching former historical levels. This is believed to have occurred because inshore areas were not subjected to trapping effort for a period of five years and the population appears to have expanded with reduced fishing mortality.

179
4 NATIONAL REPORT ON THE SPINY LOBSTER FISHERY IN BRAZIL4 C.A. Sobreira Rocha, R.N. de Lima Conceição, R.C. de Almeida Carvalho and J.A. Negreiros Aragão
4.1 BRAZIL FISHERY OVERVIEW The industrialised Brazilian spiny lobster fishery began operations in the mid-1950s, in the north-eastern states of Ceará and Pernambuco. The early fishery consisted of local industrial processing plants that bought spiny lobsters caught by artisanal fleets. Processed lobsters were exported as frozen tails. The economic feasibility of the fishery was quickly demonstrated during the initial stages of development. Consequently, the industry grew rapidly in the following decade with the incorporation of small-scale boats, operating in shallow waters, and industrial vessels, operating in more distant and deeper fishing grounds. In the few years since it began, the fishery expanded to the states of Rio Grande do Norte and Paraiba, located between the states of Ceará and Pernambuco. These four states remain the area where most fishing effort is concentrated. Further expansions of the fishery were observed toward the coasts of the Espírito Santo and Maranhão states at the end of the 1980s. Small landings are reported from as far west as the states of Pará and Amapá. Traditionally, fishing for spiny lobsters has been carried out with traps, called ‘manzuas’, but in the mid 1970s, fishermen started using illegal bottom gillnets, called ‘caçoeiras’. These nets were made legal in 1995. The use of scuba diving equipment is not allowed in the fishery although its illegal use is observed in some areas, especially in Rio Grande do Norte since the end of the 1980s. Detailed data on catch and effort for the fishery are available for the period 1974-1997 (Table 4.1). Although fishing effort has increased continuously through time, landings have been stable except for natural inter-annual variations. These trends have resulted in a sharp decrease in catch rates in recent years. It is estimated that the present level of effort is about three times larger than that required for generating maximum yields. Since 1991, a significant increase in the number of small artisanal boats and a significant decrease in the number of industrial vessels has been observed (Table 4.2) in the fishery. These changes in fleet composition are believed to be related economically, as the larger vessels became less economically efficient with increases in fuel price and the subsequent adoption of sails as a means of propulsion. This transition from mechanised to non-mechanised crafts appears to have lowered the fishing power of the fleets. Description of the fisheries Brazil’s fishery for spiny lobsters began in the early 1950s and it occurs almost along the entire coast, between the longitude 35o to 48o West, accounting for an area of about 75 000 km
2 (Ivo, 1996). It is mainly an artisanal fishery and 84.5% of the fleet in Ceará State
consists of boats up to 12 m length (Silva, 1998). Commercial lobsters fishing is conducted using the following methods: • two types of traps (“covo” with one entrance and “cangalha” with two entrances);
• gill nets;
4 Version presented at Workshop in Mérida, 1998

180
Table 4.1 Production, fishing effort and CPUE of the P. argus fisheries in Brazil 1965-1997
Years Production (mt)
Effort (trap-days 103)
CPUE (kg trap-day-1)
1965 2567 2742 0.936 1966 2277 3339 0.682 1967 2532 4191 0.604 1968 3899 6583 0.592 1969 5642 14356 0.392 1970 6022 14779 0.407 1971 5444 17328 0.314 1972 6650 24178 0.275 1973 6412 30373 0.211 1974 7221 26450 0.273 1975 4933 23053 0.214 1976 4235 25007 0.169 1977 6024 28199 0.214 1978 6954 30959 0.225 1979 6887 30008 0.230 1980 5074 34727 0.146 1981 6401 36073 0.177 1982 6906 41047 0.168 1983 3755 33179 0.113 1984 6527 36908 0.177 1985 5940 39869 0.149 1986 3868 40524 0.095 1987 5354 35984 0.149 1988 5570 42339 0.132 1989 6143 48646 0.260 1990 6901 45258 0.152 1991 8248 39991 0.206 1992 7191 55740 0.129 1993 6585 58591 0.112 1994 6468 56818 0.114 1995 8107 79483 0.100 1996 7753 81000* - 1997 5351 80000* -
*Estimated, as it is not available The commercial lobster fishery steadily increased until the maximum catch for both species combined (P. argus and P. laevicauda)of 11 100 t in 1979 (P. argus reached its maximun catch in 1991 with 8 200 t). Around 3.500 boats of different sizes are involved in the fishery for spiny lobsters. The effort data are being standardized for the least years.

181
N % N % N % N % N % Sail boats
558 36.7 590 36.2 622 37.5 755 41.8 979 49.2
Medium boats*
914 60.0 975 59.9 975 58.8 999 55.2 962 48.2
Large boats**
50 3.3 64 3.9 61 3.7 54 3.0 53 2.7
TOTAL 1522 100 1629 100 1658 100 1808 100 1994 100* motorized boats with wood hull ** motorized boats with iron hull • diving. (Although fishering by diving is illegal, it accounts for a significant amount of the
catch.)
4.2 MANAGEMENT REGULATIONS Regulation of the lobster fishery began in 1961, during the expansion phase of the fishery. The first set of regulations included the establishment of a closed season from February 15 to May 15 and a minimum size of 19 cm total length. With the evidence of overfishing in the 1970s, the management regulations were more widely applied. The set of regulations can be summarized as follows: • Protection of juveniles – through minimum mesh size of the net of the ‘covo’, size of
the catch and prohibition of fishing in nursery areas.
• Limitation of the effort – license system vessels.
• Protection of the recruits – closure the fishery in the period of January to May and prohibition of catching spawning lobsters.
Nowadays it is illegal to harvest: a) lobsters with a tail length less than 13cm or cefalotorax length below 7.5 cm;
b) between January 01 to April 30;
c) lobsters with traps and with gill net of less than 5 cm mesh size;
d) berried lobsters;
e) using scuba equipment.
4.3 BIOLOGY Over the past thirty years the biology of the spiny lobsters of the genus Panulirus has been studied in Brazil. The growth parameters from Ivo (1966) have been utilized in the analysis. The migration pattern was studied through a tagging programme by Fonteles-Filho and Ivo (1980). With reference to puerulus stage, Conceição et al. (1993) found that the maximum relative abundance for the period 1988-1991 was in March.
4.4 AVAILABLE DATA AND RECENT DEVELOPMENTS The data collected by the Marine Science Laboratoy (LABOMAR) of the Federal University of Ceará, came from biological sampling of industry catches in Ceará State for the period of 1974 to 1996. Data from log books with information in numbers caught and weight by species. IBAMA is carrying out a comphrensive sampling programme in NE of Brazil. Catch, effort and cpue Since the 1960s catches show an increasing trend. Nowadays there is a stabilization of the catches of P. argus around 7 000 t. The effort shows a steady increase of the number of
*Estimated, as it is not available The commercial lobster fishery steadily increased until the maximum catch for both species combined (P. argus and P. laevicauda)of 11 100 t in 1979 (P. argus reached its maximun catch in 1991 with 8 200 t). Around 3.500 boats of different sizes are involved in the fishery
Table 4.2 Composition of the lobster fleet of the Ceará State 1991-1995
Fleet 1991 1992 1993 1994 1995

182
trap-days (30 million in 1973 to 79 million in 1995). The CPUE shows a decreasing trend, from 0.936 kg of tail/trap-day in 1965 to 0.10 kg tail/trap-day in 1993 (Fig. 4.1).
B R A Z I L
0
10000
20000
30000
40000
50000
60000
70000
80000
90000
1965
1968
1971
1974
1977
1980
1983
1986
1989
1992
1995
YEAR
EFFO
RT
(trap
s-da
y)C
ATC
H (k
g w
hole
)
0
0,1
0,2
0,3
0,4
0,5
0,6
0,7
0,8
0,9
1
CPU
E (k
g/tr
ap-d
ay)
Catch Effort CPUE
Fig. 4.1 Catch, effort and CPUE of lobster fisheries in Brazil, 1965-1995 Socio-economic data In Ceará State alone it is estimated that 95 000 people depend direct or indirectly on marine fisheries. They have the following characteristics: • age 27 to 47 years;
• more than 90% are illiterate;
• most of them are engaged in cooperatives because this is one of the requirements for fishermen in order to get an unemployment salary during the closed season;
• during the fishing season the average salary is US$ 195, while in the closed season the family earnings drop by 64%.
Studies of costs and rentability of the lobster fisheries were made since 1994, using yearly costs and production data. Carvalho et al. 1996 showed that, in 1995, the trap fisheries from industrial and artisanal fleet showed greater costs per unit and a lower rentability than the gill net and diver fisheries. A new study based on 1996 data with artisanal boats, showed the same results. The fishery with ‘cangalha’ in small sail boats was also studied (Table 4.3).

183
COVO 1,11 0,91 2,05 0,074 - 0,10 - 0,11 -
CANGALHA 1,23 1,16 0,28 0,25 0,18 0,19 0,14 0,23 0,22
REDE 1,26 0,94 1,32 0,18 - 0,20 - 0,26 -
Legend: B=Benefits; CVT=Total Variable Cost; CT= Total Cost; PN=Break-even point; IRB=Gross Rentability Index; IRL=Net Rentability Index; MLB= Gross Profit Margin; MLL= Net Profit Margin; TLB= Gross Profit Tax; TLL=Net Profit Tax. (Source: Research data). * without including interest. Important developments in the fishery There were no major developments in 1997 – 1998. Silvia (1998) showed that from 1991 to 1995 the lobster fleet increased by 31%
4.5 STATUS OF THE STOCKS Although the closed season of four months per year has been observed over the last years, there is still a loss of capacity of recuperation of the stock. The effort that is being applied is 2.5 times greater than that at the MSY level (Workshop Belize, 1997)
CPUE
Fig. 4.1 Catch, effort and CPUE of lobster fisheries in Brazil, 1965-1995 Socio-economic data In Ceará State alone it is estimated that 95 000 people depend direct or indirectly on marine fisheries. They have the following characteristics: • age 27 to 47 years;
• more than 90% are illiterate;
• most of them are engaged in cooperatives because this is one of the requirements for fishermen in order to get an unemployment salary during the closed season;
• during the fishing season the average salary is US$ 195, while in the closed season the family earnings drop by 64%.
Studies of costs and rentability of the lobster fisheries were made since 1994, using yearly
Table 4.3 Parameters of economic evaluation for lobsters fishery, by gear in Ceará State, 1996
Type of gear Parameters
B/CVT B/CT* PN* IRB IRL MLB MLL TLB TLL
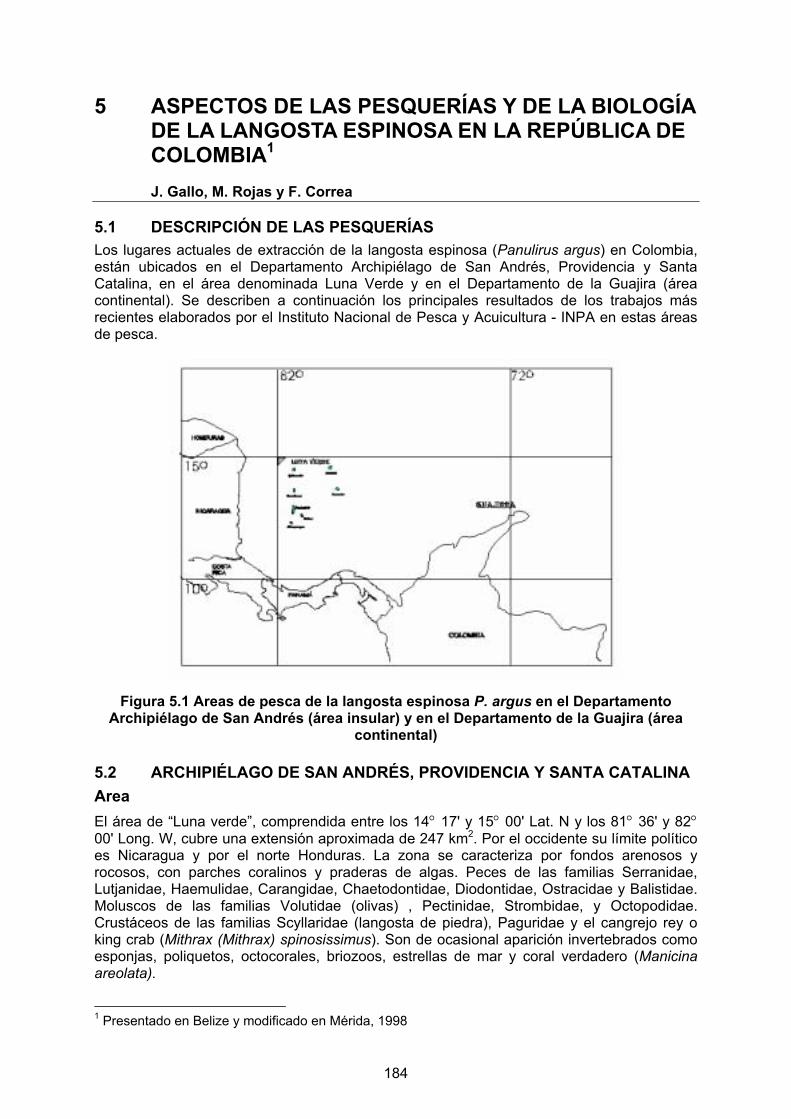
184
5 ASPECTOS DE LAS PESQUERÍAS Y DE LA BIOLOGÍA DE LA LANGOSTA ESPINOSA EN LA REPÚBLICA DE COLOMBIA1 J. Gallo, M. Rojas y F. Correa
5.1 DESCRIPCIÓN DE LAS PESQUERÍAS Los lugares actuales de extracción de la langosta espinosa (Panulirus argus) en Colombia, están ubicados en el Departamento Archipiélago de San Andrés, Providencia y Santa Catalina, en el área denominada Luna Verde y en el Departamento de la Guajira (área continental). Se describen a continuación los principales resultados de los trabajos más recientes elaborados por el Instituto Nacional de Pesca y Acuicultura - INPA en estas áreas de pesca.
Figura 5.1 Areas de pesca de la langosta espinosa P. argus en el Departamento
Archipiélago de San Andrés (área insular) y en el Departamento de la Guajira (área continental)
5.2 ARCHIPIÉLAGO DE SAN ANDRÉS, PROVIDENCIA Y SANTA CATALINA Area El área de “Luna verde”, comprendida entre los 14° 17' y 15° 00' Lat. N y los 81° 36' y 82° 00' Long. W, cubre una extensión aproximada de 247 km2. Por el occidente su límite político es Nicaragua y por el norte Honduras. La zona se caracteriza por fondos arenosos y rocosos, con parches coralinos y praderas de algas. Peces de las familias Serranidae, Lutjanidae, Haemulidae, Carangidae, Chaetodontidae, Diodontidae, Ostracidae y Balistidae. Moluscos de las familias Volutidae (olivas) , Pectinidae, Strombidae, y Octopodidae. Crustáceos de las familias Scyllaridae (langosta de piedra), Paguridae y el cangrejo rey o king crab (Mithrax (Mithrax) spinosissimus). Son de ocasional aparición invertebrados como esponjas, poliquetos, octocorales, briozoos, estrellas de mar y coral verdadero (Manicina areolata).
1 Presentado en Belize y modificado en Mérida, 1998

185
Para el área en general, las condiciones marinas y meteorológicas están influidas por dos épocas o estaciones: la de lluvias (húmeda) y la de no lluvias (seca) : febrero marzo abril: meses secos ; mayo: mes de transición ; junio: alta pluviosidad ; julio agosto: lluvias moderadas y septiembre, octubre y noviembre: máximas lluvias. Se observan mareas promedio de 0.30m (Geister, 1973), temperatura media de 27ºC (Región Latitudinal Subtropical), evapotranspiración potencial calculada en 1.375 (Bosque húmedo subtropical) (Chirivi, 1988), precipitación media anual entre 1.762 y.1.823 mm. (Parsons, 1964). Descripción de la pesquería La pesca de la langosta con nasas es considerada como industrial por los volúmenes de extracción y el arte utilizado. Se caracteriza por utilizar botes de mediano tamaño (17-25 m de eslora y 5-8 m de manga) con una autonomía de 60 a 90 días en altamar (dada por la capacidad de almacenamiento de agua). Las líneas de nasas son caladas aproximadamente 48 horas, izadas con un winche mecánico y regresadas inmediatamente al agua, permaneciendo la mayor parte del tiempo en el agua. Las nasas son de madera de pino, con dos bloques de cemento como lastre en su base y tienen las siguientes dimensiones, largo 72.3 cm, ancho 50.8 cm, alto 39 cm, boca en la parte superior de 21.4 por 20.4 cm, profundidad de la abertura de la boca 21.5 cm y un peso mojada aproximado de 23-27 kg (50 - 60 lb).
5.3 BIOLOGIA Talla media de madurez sexual La talla media de madurez sexual se estimó en aproximadamente 92 mm Lc (longitud cefalotorax), la cual coincide con el intervalo de talla modal para las hembras capturadas, lo cual da indicios que existe una porción de las hembras maduras (aproximadamente del 50%) que contribuyen con el stock larval.
Tabla 5.1 Valores de la talla media de madurez sexual para las hembras de P. argus en el área del Caribe y Brasil
Autor Localidad Longitud
cefalotorax (mm)
Munro (1974) Jamaica 90-99
Davis (1975) Dry Tortugas 86-95
Aiken (1977) Jamaica 80-89
Soares y Cavalcante (1984) Brasil 79
Hunt y Lyons (1986) Florida 75
Evans (1990) Bermuda 81-82
Cruz y León (1991) Cuba 81
Arango y Márquez (1993) Providencia (Colombia) 103
Presente estudio Luna Verde (Colombia) 92

186
0 10 20 30 40 50 60 70 80 90
100
68 73 78 83 88 93 98 103 108 113 118 123 128 133 138
INTERVALO DE CLASEmm
%
Figura 5.2 Talla media (mm Lc) de madurez sexual para hembras de P. argus en el
Archipiélago de San Andrés, 1994-95
0
5
10
15
20
25
30
35
40
-0.002
0
0.002
0.004
0.006
0.008
0.01
0.012
0.014
OVADAS
FACTOR K
Figura 5.3 Porcentaje de hembras ovadas y factor de condición de P. argus en el área
de Luna Verde en el Archipiélago de San Andrés 1994/95 Durante los 21 meses que se muestreo se encontraron dos hembras portando huevos con tallas mínimas de 72 mm Lc, lo cual se puede considerar para el área de Luna Verde como un evento excepcional si se tiene en cuenta que se muestrearon un total de 546 hembras ovígeras, que la talla modal dentro de las hembras ovígeras se encuentra en el intervalo de clase de 91-95 mm Lc y que el 86.5 % de las ovígeras se hallan entre las tallas de 86 a 105 mm Lc. Para el área del Caribe y Brasil existen discrepancias respecto de la talla de primera maduración en las hembras, dichas variaciones están dadas por la utilización de metodologías diferentes o por selectividad del arte, que puede subestimar por numero y composición de tallas las hembras, las cuales hallan mayor dificultad de entrar en las nasas (Cruz y León, 1991), también se puede dar un menor porcentaje de hembras ovadas por una disminución en la movilidad de estas como estrategia de protección y reserva de energía. Cabe añadir a dicha discusión que es posible que en poblaciones de langosta sometidas a determinada presión de pesca, se ocasione que las hembras empiecen a

187
madurar mas tempranamente, que poblaciones que soportan menor presión por pesca (Lyons et al., 1981). Estacionalidad reproductiva Lyons et al. (1981) observaron reproducción durante todo los meses muestreados en Florida. En el presente estudio se observó el mismo comportamiento pero con un pico en octubre de 1993 y 1994, otro pico en mayo de 1994 y 1995, los cuales coinciden con los reportado para Cuba por Cruz y León (1991); sin embargo el pico del segundo semestre de 1995 se presentó en el mes de diciembre, lo que se puede explicar por un calentamiento anormal de las aguas que se presentó durante el mes de octubre en el Caribe, que probablemente ocasionó un desplazamiento de la época reproductiva e insinúa la relación que existe entre época reproductiva y temperatura. Factor de condición Las hembras de P. argus presentan cuatro épocas con valores altos de factor de condición que son mayo de 1994 el cual coincide con el pico de reproducción para el mismo mes, agosto de 1994 que se presenta antes del pico de reproducción que se da entre septiembre y octubre de 1994, febrero de 1995 ubicado antes del pico de reproducción de mayo del mismo año y el último es el de octubre de 1995 que se observa antes del pico de reproducción en diciembre de 1995. El anterior comportamiento insinúa una relación directa pero retardada en un mes entre factor de condición y reproducción, es decir que las hembras de langosta aumentan el peso corporal,, bien sea en músculo o en grasa, antes de madurar sus huevos. Talla media de captura Durante los 21 meses que se muestreo a bordo de motonaves langosteras las hembras tuvieron valores promedios de captura entre 87 y 95 mm Lc y los machos entre 93 y 106 mm Lc, confirmando lo expuesto por Herrnkind y Lipcius (1989) de que los machos adultos son mas grandes que las hembras, debido a que estas invierten mas energía en la producción de huevos, lo cual se refleja en menor crecimiento con respecto a los machos. Arango y Márquez (1993) en los arrecifes de la isla de Providencia, reportan un promedio de 97 mm Lc en hembras y 108 mm Lc en machos, capturadas mediante buceo; la diferencia se debe básicamente a la selectividad del arte, ya que en las nasas, los adultos de mayor talla tendrían mayor dificultad para entrar, los juveniles aunque mas susceptibles son poco frecuentes debido a la profundidad, debido a que su hábitat es de aguas poco profundas, mientras que los individuos de talla media son los mas frecuentes, encontrándose predominio de las tallas entre 83 y 108 mm Lc para las hembras (86.5% del total capturado), y entre 83 a 113 mm Lc para los machos (82% del total capturado). Utilizando nasas como arte de pesca, Lozano-Alvarez et al. (1991b), para el Caribe mexicano reportan promedios de 95.4 y 100.3 mm Lc para hembras y machos respectivamente, Haughton y King (1992) para Jamaica reportan 92.5 y 100.5 mm Lc respectivamente, valores que están dentro del rango de promedios del la presente investigación (Tabla 5.1); lo cual se puede explicar porque el esfuerzo se realiza con nasas, que es un arte altamente selectivo (Kanciruck y Herrnkind,1976; Cruz y León, 1991); es de resaltar que la pesca con nasas generalmente tiene constante la variable de alta profundidad (mayores a los 20 m). Talla modal Las diferencias que se observan en las tallas modales reportadas para el Caribe, respecto a las encontradas en la presente investigación, se puede deber básicamente a la profundidad de pesca si se tiene en cuenta la estratificación por tallas de acuerdo a la profundidad característica de esta especie (Kanciruck, 1980; Lyons, 1986; Lozano-Alvarez et al., 1991b),

188
ya que estas están dentro de las mas altas; un segundo factor que influye en las tallas de captura es la presión por pesca, ya que la composición por tallas es un indicativo de dicha presión (Lyons et al. 1981), la cual se evidencia en la disminución de tallas que se observa en los datos históricos. Tanto las tallas medias como la moda de Lc registradas en las capturas son mayores que la talla mínima de captura reglamentada para Colombia (longitud cola: 14.0 cm equivalente a 8.0 cm de Lc).
Tabla 5.2 Valores máximo, mínimo y promedio de la longitud cefalotorax (mm) de P. argus, muestreadas a bordo de motonaves langosteras desde octubre de 1993 a enero
de 1996 en el área de Luna Verde, Archipiélago de San Andrés
Mes Hembras Machos Máxima Mínima Promedio Máxima Mínima promedio
Oct.93 125 68 93 115 72 93Nov.93 115 61 91 134 71 99Dic.93 120 75 92 139 75 100Ene.94 120 78 92 139 75 100May.94 120 71 95 138 76 106Jul.94 131 76 92 138 73 101Ago.94 112 70 87 145 74 99Sep.94 141 55 93 142 67 102Oct.94 126 65 92 146 66 105Nov.94 125 74 92 142 70 104Feb.95 120 70 94 130 81 104Abr.95 121 70 94 135 74 100May.95 115 71 90 129 76 98Jun.95 127 62 91 129 64 98Jul.95 106 59 88 117 53 96Ago.95 115 66 93 150 71 104Sep.95 120 64 93 143 76 101Oct.95 126 65 93 131 58 100Nov.95 114 71 91 137 77 99Dic.95 110 75 93 140 81 100Ene.96 106 76 91 130 81 101
Tabla 5.3 Valores de talla modal de la longitud del cefalotorax (mm) de P. argus en el área de Luna Verde en el Archipiélago de San Andrés y el Caribe
Autor Localidad Hembras Machos
Munro (1974) Port Royal (Jamaica) 70-79 80-89
Pedro Bank (Jamaica) 90-99 100-109
Lyons et al. (1981) Florida (E.U.) 73 73
Cruz y León (1991) Golfo Batabano (Cuba) 72-76
Región Suroriental (Cuba) 92-96
Presente estudio Luna Verde (Colomb.) 91-95 101-105

189
Tabla 5.4 Profundidad de calado de la línea de nasas, número de nasas por línea y número de colas por línea de P. argus, entre octubre de 1993 y enero de 1996 en el
área de Luna verde, Archipiélago de San Andrés
Mes Profundidad (m) No. Nasas No. Colas Máx. Mín. Prom. Máx. Mín. Prom. Máx. Mín. Prom.
Oct.93 42.70 21.81 34.54 146 117 131 34 10 19Nov.93 42.12 21.51 31.81 195 73 127 65 0 17Dic.93 36.36 27.27 30.60 150 124 130 40 8 27Ene.94 39.69 25.45 31.81 144 124 135 37 8 20May.94 50.00 21.21 33.33 175 125 133 22 0 9Jun.94 40.30 23.63 30.6 145 85 112 31 2 12Ago.94 33.63 16.60 28.18 175 125 142 102 0 38Sep.94 40.60 18.18 31.81 171 92 142 160 0 36Oct.94 39.09 22.12 32.42 153 117 143 108 0 34Nov.94 37.87 23.03 29.39 147 107 130 17 1 7Dic.94 145 115 127 65 14 36Ene.95 145 115 115 60 6 28Feb.95 48.70 25.75 35.15 175 125 154 80 0 28Mar.95 115 70 106 82 6 30Abr.95 39.09 26.96 32.12 150 150 150 79 9 35May.95 45.45 21.21 30.9 150 130 149 65 0 25Jun.95 37.57 23.93 28.78 121 107 114 53 0 18Jul.95 30.60 27.27 28.18 175 120 141 48 3 23Ago.95 172 130 151 183 10 52Sep.95 45.75 21.21 35.75 172 128 151 165 11 57Oct.95 42.42 30.30 34.8 125 99 116 117 6 34Nov.95 39.39 24.24 26.69 142 95 116 147 6 34Dic.95 43.63 29.39 36.06 153 112 141 86 8 35Ene.96 38.18 25.75 32.4 123 94 113 74 3 118 Captura, esfuerzo y captura por unidad de esfuerzo Las capturas del recurso langostero fue estimada con base en los datos de movilización de productos pesqueros del INDERENA, visitas a las plantas pesqueras de Cartagena y San Andrés y la información obtenida del Boletín Estadístico Pesquero del INPA. No es posible el análisis de esta pesquería desde el punto de vista de la extracción histórica del recurso, por cuanto no fue posible consolidar las cifras reales de captura a través del tiempo. Los registros de pesca de años atrás carecen de consistencia, razón por la cual se presentan como estimaciones a nivel informativo. Aparentemente las capturas han aumentado a través del tiempo y su análisis se ha llevado a cabo a nivel de CPUE. De enero de 1993 a enero de 1996 se tomaron los datos de captura (c), esfuerzo (e) y captura por unidad de esfuerzo (cpue) de todos los desembarques de este recurso. De enero de 1993 a enero de 1994 se observó un promedio de 9 embarcaciones que pescaron en Luna Verde. Las capturas se ubican en un promedio de 820 kg (1804 lb) por bote/faena (de 32 días) y 25.5 kg (56 lb) por bote/día. En el año de 1994 se presentaron fluctuaciones en las capturas probablemente por el esfuerzo pesquero realizado en 1993 hasta mayo de 1994, tiempo en donde las capturas permanecen constantes (promedio 908 kg, 1998 lb) por b/f (36.5 días) ó 25 kg (55 lb por b/d) disminuyendo la flota hasta una (1) motonave (4 en promedio).

190
Tabla 5.5 Capturas estimadas de la langosta espinosa P. argus para el Caribe colombiano (t)
Año San Andrés Guajira Total 1979 4.3 1980 5.9 1981 2.5 1982 5.7 1983 10.8 1984 75.2 1985 39.4 1986 23.8 1987 231.0 1988 127.9 1989 199.5 1990 257.0 1991 153.7 1992 110.4 1993 97.2 120.0 217.2 1994 52.9 172.9 225.8 1995 79.6 324.9 404.5 1996 1997
66.3 79.3
281.1 347.4
0
20
40
60
80
100
120
140
160
180
E93 M93 M93JL
93 S93 N93 E94 M94 M94JL
94 S94 N94 E95 M95 M95JL
95 S95 N95 E96 M96 M96JL
96 S96 N96 E97 M97 M97JL
97 S97 N97 E98 M98
Meses
CP
UE
0
2
4
6
8
10
12
14
16
No.
bot
es
Figura 5.4 Captura por unidad de esfuerzo respecto al número de embarcaciones de
P. argus entre enero de 1993 y diciembre de 1995, en el área de Luna Verde, Archipiélago de San Andrés
Posteriormente hubo ausencia de botes por dos meses (agosto y septiembre) observándose un considerable incremento en las capturas desde septiembre de 1994 a marzo de 1995 (promedio 1629 kg (3584 lb) por b/f (37 días) y 44 kg (97 lb) por b/d (4 botes en promedio)). De abril a julio de 1995 las capturas disminuyen con un promedio de 1319 (2902 lb) por b/f (47días) y 28 kg (61 lb) por b/d con 4 botes en promedio, en agosto de 1995 se ausentan los botes, ocasionando un aumento en la captura desde octubre a diciembre de 1995 con un promedio de 2635 kg (5797 lb) por b/f (47 dias) y 56 kg (123 lb) por b/d y 3 botes en promedio.

191
Tabla 5.6 Captura, esfuerzo y captura por unidad de esfuerzo de P. argus para los desembarcos realizados en San Andrés, provenientes de Luna Verde (1993 - 1997)
Mes Captura (lbs)
Esfuerzo(no. Botes)
Faena (días)
Faenas (prom.)
Cpue Lb/bote
Cpue Lb/día
Ene. 93 15685 7 258 37 2241 60.8 Feb. 93 14153 8 196 24 1769 72.2 Mar. 93 31487 12 432 36 1790 72.9 Abr. 93 20597 12 342 28 1716 60.2 May. 93 24860 15 426 28 1587 58.4 Jun. 93 8668 10 233 23 866 37.2 Jul. 93 5683 5 106 21 1133 53.6 Ago. 93 20093 8 288 36 2511 69.8 Sep. 93 11072 5 188 37 2214 58.9 Oct. 93 13943 6 224 37 2323 62.2 Nov. 93 6428 4 201 50 1607 32.0 Dic. 93 21636 11 373 33 1966 58.0 Ene. 94 16804 9 297 33 1867 56.6 Feb. 94 10828 5 171 34 2165 63.3 Mar. 94 14227 6 195 32 2371 73.0 Abr. 94 3912 3 99 33 1304 39.5 May. 94 9740 6 257 42 1623 38.0 Jun. 94 1156 1 23 23 1156 50.3 Jul. 94 4092 1 59 59 4092 69.3 Ago. 94 Sep. 94 2755 4 148 37 689 18.6 Oct. 94 11138 4 97 24 2784 114.8 Nov. 94 10681 3 88 29 3560 121.4 Dic. 94 20367 6 230 36 3361 88.5 Ene. 95 12952 3 126 42 4317 102.4 Feb. 95 9762 3 120 40 3254 81.4 Mar. 95 17535 4 187 46 4383 93.8 Abr. 95 9731 4 145 36 2432 67.1 May. 95 18228 5 271 54 3645 67.3 Jun. 95 8025 4 185 46 2006 43.4 Jul. 95 13362 4 199 49 3340 67.1 Ago. 95 Sep. 95 10283 2 86 43 5141 119.6 Oct. 95 4243 1 27 27 4243 157.1 Nov. 95 26479 4 183 45 6619 144.7 Dic. 95 28559 5 271 54 5712 105.4 Ene. 96 7000 1 60 60 7000 116.7 Feb. 96 16600 5 280 56 3320 59.3 Mar. 96 17100 5 262 52 3420 65.3 Abr. 96 9600 5 209 42 1920 45.9 May. 96 12600 7 254 36 1800 49.6 Jun. 96 2200 3 94 31 733 23.4 Jul. 96 11000 4 169 42 2750 65.1 Ago. 96 2486 4 70 18 622 35.5 Sep. 96 11850 6 229 38 1975 51.8 Oct. 96 7900 5 227 45 1580 34.8 Nov. 96 11920 6 267 45 1987 44.6 Dic. 96 16200 6 276 46 2700 58.7 Ene. 97 18600 5 298 60 3720 62.4 Feb. 97 15876 9 314 35 1764 50.6 Mar. 97 16400 5 264 53 3280 62.1 Abr. 97 16580 6 268 45 2763 61.9 May. 97 7500 10 284 28 750 26.4 Jun. 97 17050 8 387 48 2131 44.1 Jul. 97 7500 3 118 39 2500 63.6 Ago.97 7500 3 172 57 2500 43.6 Sep. 97 9000 2 81 41 4500 111.1 Oct. 97 17600 6 301 50 2933 58.5 Nov. 97 8800 2 138 69 4400 63.8 Dic. 97 16350 4 210 53 4088 77.9

192
Tabla 5.7 Parámetros de la dinámica poblacional estimados para P. argus en el área de Luna Verde, Archipiélago de San Andrés 1994/95 (M: machos, H: hembras)
M
94 M 95
M 94/95
H 94
H 95
H 94/95
M+H 94
M+H 95
M+H 94/95
L∞ 18.5 18.0 18.0 17.5 16.3 17.5 18.8 19.0 19.0 K 0.2 0.23 0.26 0.24 0.21 0.23 0.22 0.28 0.22 φ| 4.23 4.31 4.43 4.30 4.02 4.25 4.35 4.62 4.37 to -0.965 -0.841 -0.741 -0.811 -0.950 -0.848 -0.870 -0.676 -0.868 C 0.7 0.7 0.7 0.5 0.5 0.6 0.7 0.7 0.7 WP 0.7 0.7 0.7 0.5 0.5 0.6 0.7 0.7 0.7 SS 3 3 10 3 2 9 5 5 5 SL 10.05 9.175 9.800 8.675 8.800 8.550 6.675 5.550 6.675 Rn 0.0098 0.089 0.084 0.107 0.061 0.110 0.078 0.078 0.096 Tax. 14.04 12.20 10.80 11.69 13.34 12.20 12.77 10.04 12.77 Desove octubre mayo mayo octubre octubre mayo octubre mayo octubre Z 1.35 1.35 1.77 2.23 1.86 2.41 1.63 2.36 1.78 Z sin osc. 1.45 2.02 1.83 2.44 2.35 2.84 1.83 2.95 1.92 M (Pauly) 0.71 0.79 0.85 0.82 0.76 0.79 0.76 0.88 0.75 F 0.64 0.56 0.92 1.41 1.10 1.62 0.87 1.48 1.02 E 0.47 0.42 0.52 0.63 0.59 0.67 0.53 0.63 0.58 M crust. 0.48 0.54 0.59 0.56 0.51 0.53 0.51 0.62 0.51 F correg. 0.87 0.82 1.18 1.67 1.35 1.88 1.12 1.74 1.27 E real 0.65 0.60 0.67 0.75 0.73 0.78 0.69 0.74 0.71 Para el año de 1996, llama la atención que en los primeros meses del año se detectan altas capturas para esfuerzos bajos en embarcaciones, posteriormente durante el resto del año y para el siguiente, a pesar de algunas subidas en el esfuerzo pesquero las capturas no tienen un alza importante, excepto el fenómeno inverso a finales de 1997, cuando al bajar el número de motonaves, las capturas aumentan levemente. Para el área de Luna Verde y en el caso de la langosta se podría afirmar que la captura esta relacionada en forma inversa con el esfuerzo, cuando hay un buen número de botes (nueve en promedio) la producción por bote se reduce a casi la mitad (47% menos) comparada a la época en la cual solo hay un promedio de cuatro botes pescando. Además, estos nueve botes colocan un número aproximado de 19000 nasas en el agua mientras que cuatro botes colocan tan solo 9000 nasas. Si se tiene en cuenta que esta área de pesca en Luna Verde es pequeña (247 km2) se debe limitar el número de nasas/bote y/o de botes para obtener mejores capturas y asegurar la sostenibilidad del recurso en el área. Crecimiento Los valores aportados por el programa FISAT, arrojaron los valores que se observan a continuación. Para obtener un mejor conocimiento del comportamiento de la langosta en cuanto a su crecimiento, se optó por estimar los parámetros de crecimiento teniendo en cuenta, en forma prioritaria la época de desove para el año respectivo, para que la curva de la primera cohorte tuviera su inicio en este mes, de esta manera se intentó en lo posible que para el año de 1994 la curva de crecimiento de la cohorte se iniciará en el mes de octubre y para 1995 en el mes de mayo. Si bien el programa ELEFAN en FISAT insta a obtener un buen ajuste de las líneas de crecimiento que pasan por los picos “positivos”, obteniéndose un mayor valor de “Rn”, se consideró que las curvas de crecimiento era necesario ajustarlas también a otros parámetros, como el número de cohortes que entrega la aproximación al número de años de

193
vida (longevidad) y que los parámetros de L∞ y K fueran lo más reales posibles, lo que se obtuvo con la determinación de φ|. Los valores de L∞ para otras áreas del Caribe se encuentran en un rango de 13.3 cm para las hembras en Islas Vírgenes hasta 21 cm para los machos en Jamaica, los valores para Colombia se encuentran dentro de este rango. Sin embargo se destaca que los menores valores observados para este parámetro se ubican en las Islas Vírgenes, en las hembras con 13.3 cm y en Cuba también para las hembras con 13.9 cm. Se calculó el promedio de los reportes en el área del Caribe y se obtuvo para las hembras un valor de 17.16 cm, para los machos de 17.99 cm y para los dos sexos de 18.29 cm, los datos obtenidos en este estudio se encuentran muy cercanos a estos valores.
Tabla 5.8 Parámetros poblacionales estimados para el área del Caribe Autor Localidad Sexo L8 K φ Z M Dos Santos et al. (1964) Brasil hembras 14.8 0.38 4.42 machos 14.1 0.34 4.21 Buesa (1965) Cuba juntos 17.1 0.16 3.85 Munro (1974) Jamaica juntos 19.0 0.215 4.35 Olsen y Koblic (1975) Islas Vírgenes hembras 13.3 0.319 4.03 0.532 machos 15.3 0.436 4.63 0.455 juntos 15.2 0.432 4.60 0.494 Alegría (1982) Guajira
(Colombia) Juntos 16.1 0.17 3.79
Davis (1977) Florida juntos 19.0 0.34 4.81 Warmer et al. (1977) Florida juntos 19.0 0.25 4.50 Clairovin (1980) Martinica hembras 18.8 0.234 4.42 machos 19.0 0.250 4.48 Waugh (1980) Bahamas hembras 19.0 0.222 4.38 0.570 machos 19.0 0.256 4.53 0.204 Cruz et al. (1981) Cuba hembras 13.9 0.310 4.09 0.56 machos 16.9 0.220 4.14 0.56 Cano (1987) Providencia
(Colombia) juntos 16.8 0.27 4.33
Haughton y Shaul (1989) Jamaica hembras 18.4 0.480 5.09 Haughton y King (1992) Jamaica hembras 19.5 0.280 4.67 2.88 0.67 machos 21.0 0.240 4.66 2.19 0.59 juntos 20.5 0.26 40.69 2.50 0.62 Arango y Márquez (1993)
Providencia (Colombia)
juntos 19.5 0.27 4.63 1.973 0.849
Ragua y Rubio (1995) San Andrés (Colombia)
hembras 19.6 0.260 4.60 1.11 0.58
machos 20.6 0.260 4.70 1.10 0.57 Presente estudio juntos 20.7 0.260 4.71 1.17 0.57

194
H/94 H/95
H/94-95 M/94
M/95 M/94-95
M+H/94 M+H/95
M+H/94-95
Figura 5.5 Curvas de crecimiento de P. argus en el Archipiélago de San Andrés y Providencia.( M: machos, H: hembras)

195
DEPARTAMENTO DE LA GUAJIRA
Area El área de extracción se suscribe a la península de la Guajira, situada en el extremo norte del país (10° 23’ y 12° 29’ Lat. N y 71° 39’ y 73° 39’ Long. W) cubriendo una extensión aproximada de 350 km y una plataforma de 366 mn2. Por su posición geográfica, la península se encuentra indefensa a los vientos predominantes del noreste, que soplan durante 9 meses al año. Los vientos alisios al no encontrar barreras montañosas, a lo largo de la costa, llegan con toda intensidad, incidiendo en la pesca artesanal del área. Descripción de la pesquería Las faenas de pesca se llevan a cabo por pescadores artesanales (entre 1 y 8 ) en embarcaciones de madera con eslora de 9 m, manga de 1.5 m y motor interno entre 9 y 16 hp. En 1996 se registraron alrededor de 350 embarcaciones y cerca de 965 pescadores, con una producción total de 240 t. Los métodos de pesca consisten exclusivamente de buceo a pulmón y mano limpia; y con la utilización de red multifilamento de 3.5’’ de entre dos nudos, con 25 mallas de altura y 180 m (100 brazas) de longitud en promedio. Capturas Para el área comprendida entre Palomino y Puerto López, la captura total se estimó en 172.9 t, para 1994, 324.9 t para 1995 y en 281.1 t para 1996. Durante estos tres años, se podría deducir que las capturas mínimas se producen hacia comienzos del año por influencia de los vientos alisios, razonable en 1994 y 1995, que presentan capturas de 8.8 y 20.3 en el mes de enro respectivamente. En 1996 es el mes de febrero el que reporta valor un poco más bajo con 8.8 t, es de anotar que en ciertos años los alisios se retrasan en intensidad. De acuerdo al comportamiento estacional de las capturas, se pueden evidenciar picos de producción en los meses de octubre/94 con 23.6 t, (época de lluvias, marzo/95 con 36.9 t (mar de leva), enero/96 con 37.6 (alisios), contrastando este último con el mes siguiente de febrero, muy bajo en capturas .
Tabla 5.9 Estimación de las capturas de colas de langosta Panulirus argus en el departamento de la Guajira-Colombia (tonnes)
1994 1995 1996 Enero 8.8 20.3 37.6 Febrero 14.1 24.8 8.8 Marzo 13.6 36.9 24.0 Abril 11.1 26.2 19.9 Mayo 20.3 34.8 21.6 Junio 14.3 24.8 24.5 Julio 10.9 24.8 34.8 Agosto 12.2 32.5 34.7 Septiembre 17.2 27.6 29.4 Octubre 23.6 21.6 7.3 Noviembre 12.3 27.6 18.4 Diciembre 14.4 23.0 20.1 TOTAL 172.9 324.9 281.1
Referente al esfuerzo de pesca (número de faenas de pesca), la situación no es clara al compararlo con los rendimientos, debido a que no se encuentra relación con las bajas o altas capturas encontradas. En los meses de mayo de 1994 y 1995 se aprecian el máximo número de faenas de pesca, posiblemente por que los alisios ya han bajado su intensidad y

196
Tabla 5.10 Estimación del esfuerzo de pesca de la langosta Panulirus argus en el departamento de la Guajira-Colombia, (representado por el número de faenas de pesca)
1994 1995 1996 Enero 1570 3359 3433
Febrero 1354 4108 3128 Marzo 1496 3433 4294 Abril 2925 4978 3325 Mayo 8437 7217 2769 Junio 3010 3904 3602 Julio 1564 4555 4623
Agosto 4068 4435 5109 Septiembre 2990 5221 3261
Octubre 3270 4527 1858 Noviembre 2084 5000 2737 Diciembre 2441 4643 3276
TOTAL 35209 55379 41415
Tabla 5.11 Estimación de la captura por unidad de esfuerzo de la langosta Panulirus argus en el departamento de la Guajira
1994 1995 1996 Enero 5.6 6.0 11.0
Febrero 10.4 6.0 2.8 Marzo 9.1 10.7 5.6 Abril 3.8 5.3 6.0 Mayo 2.4 4.8 7.8 Junio 4.8 6.4 6.8 Julio 7.0 5.4 7.5
Agosto 3.0 7.3 6.8 Septiembre 5.8 5.3 9.0
Octubre 7.2 4.8 3.9 Noviembre 5.9 5.5 6.7 Diciembre 5.9 5.0 6.1
a la vez el agua se encuentra en mayor calma y la transparencia es mayor. La captura por unidad de esfuerzo fluctuó entre 2.4 y 10.4 t/faena para 1994; entre 4.8 y 10.7 t/faena en 1995 y finalmente entre 2.8 y 11.0 t/faena en 1996. Aparentemente la mayor cpue se centra en los primeros meses del año, época del afloramiento, que a la vez permite una mayor visibilidad en el agua.
5.4 BIOLOGIA Reproducción y talla de madurez sexual Las épocas de reproducción presentaron tres picos (cópula y desove) en los meses de mayo y julio - agosto. La talla media de madurez sexual se obtuvo en 10.5 cm Lc. Dinámica poblacional Mediante el programa FISAT se estimó el crecimiento con un valor para la longitud asintótica (L8) de 20.1 cm, el coeficiente de crecimiento (K) en 0.29 año -1 y de Phi| (φ|) de 2.07. Las estimaciones de las mortalidades fueron de mortalidad total (Z) igual a 1.02 (Curva de captura), con un intervalo de confianza del 95%, la mortalidad natural (M) se estimó en 0.42 (Fórmula de Cruz, 1979), M/K en 1.45 y la mortalidad pesquera (F) en 0.6, de donde la tasa de explotación arrojó un valor de 0.58, potencializando una ligera sobrexplotación del recurso.

197
6 NATIONAL REPORT ON THE LOBSTER FISHERIES IN CUBA2 M.E. de León, R. Puga and J. Baisre
6.1 DESCRIPTION OF THE FISHERIES Fishing areas The lobster fishery is carried out in an area that represents 64% of the total surface of the Cuban shelf. The whole Cuban shelf is morphologically divided into 4 regions, the characteristics of which are summarized in the following table:
Table 6.1 Basic data on Cuban lobster fisheries
REGION Enterprises Fishing area (km2)
Fishing
zones
Depth (m)
Pinar (South) 4 654 6 SW shelf Batabanó 10 371 5 2-10 Isla 2 465 3 Casilda 947 2 SE shelf Sta. Cruz 2 205 1 5-20 Niquero 2 550 1 Matanzas 706 1 NE shelf Villa Clara 4 317 7 1.5-10 Nuevitas 601 3 NO shelf Pinar (North) 3 629 1 1.5-10
Gears The most used fishing gears are: Artificial reef “PESQUERO” (also called “casita cubana” in other parts of the Caribbean): This gear is used mainly during May till September, the so-called open season. The technique used for fishing this artificial reef is to use a net which surrounds the device in the moment of fishing, when the device is shaken, the lobsters try to run away and then they get caught in the net. This operation is carried out by two men on a small boat in about 12 minutes. Other techniques are the use of the bully net, or else free diving. More recently a new type of pesquero has been developed, which can be lifted from the vessel with a winch. “JAULON”, is a 2-in. (5 cm) mesh chicken wire or large plastic trap used during the mass migration, between October and February. It has the peculiarity of two wings each 40 m long, one beside the entrance, producing an increase of the effective fishing area. “NASA”, is a 2-in. mesh chicken wire trap used during the whole fishing season. It is very important in the NE region. “TYRES”, old car tyres are used as artificial reefs. It has some importance in the SE region in all seasons.
2 Combination of versions of documents presented in Belize, 1997 and Mérida, 1998

198
There are 250 fishing boats, 250 000 fishing gears and about 1 300 fishers directly involved in the Cuban lobster fisheries, operating in four large management zones or sub-fisheries which are also partitioned into ten smaller fishing districts which are exploited by eight Fishing Associations. There are even smaller divisions within each Association and uneven groups of fishing boats are linked to 28 holding centers, located at sea, where lobster are kept alive until are shipped to the eight processing plants. History of the fishery Since the early years of the century, lobster was caught in Cuba for bait in the snapper fishery, but a rise took place at the end of the 1920s as a response to the demand from the United States (Fig. 6.1). In 1930, the first canning factory was built at La Coloma (Pinar, South); at this stage, the fishery was carried out using nets, harpoons, tridents, forked poles with a running knot and unbaited traps made of plant material. The first annual catch beyond 1000 t was obtained in 1948. Around the middle of the 1950s the general use of the bully net began together with several types of traps like: the Antillean “S” shaped trap, the round ones, the square ones made of metallic screens or Castilla cane knitted and the “jaulon”. It was not until 1959 that the greatest part of the investment process in the fishing industry took place, which led to a remarkable increase of the catches up to 9 000 tonnes in 1965. Between 1965 and 1977, the established regulatory measures were sometimes violated in several ways: shorter closed seasons (less than 60 days), insufficient control of the minimum legal size and also the lack of legal protection for areas.with juveniles These situations actually provoked growth overfishing. Additional strict regulatory measures were imposed in 1978, including : • 90 days of closed season;
• a strict control on landings of undersized lobster and berried females;
• limited number of vessels and territorial divisions for each enterprise.
This resulted in an increase of the yield per recruit, which together with significant rise in the number of fishing gears produced increments of catches in subsequent years, reaching in the 1980s mean catches of 11,000 t. In 1988, the hurricane “Gilbert” affected the whole Caribbean region, changing recruitment intensity, and in conjunction with a high fishing pressure produced a collapse of the fishery in 1990 (7,958 t). New regulatory measures were imposed in 1991, applying a reduction of the number of fishing gears in order to reduce the fishing mortality; a new level of the catches was obtained in the 1990s (9,400 t, mean catch 1991-1996). Catch per unit of effort (CPUE as Kg per fishing day) data are available by zone till 1983 (Figs. 6.2 and 6.3). These data suggest a catchability increase since 1991 due to the new regulatory measures and their enforcement and an improvement on the fishers incomes.

199
Fig. 6.1 Annual trend in landings for the commercial Panulirus argus fishery in Cuba.
Fig. 6.2 Annual trends in landings and CPUE for the commercial Panulirus argus fishery in the Gulf of Batabanó, Cuba
Total Cuba
0
2000
4000
6000
8000
10000
12000
14000
1600019
28
1933
1938
1943
1948
1953
1958
1963
1968
1973
1978
1983
1988
1993
Cat
ch (t
on)
Gulf of Batabanó
0
1000
2000
3000
4000
5000
6000
7000
8000
9000
10000
1973
1975
1977
1979
1981
1983
1985
1987
1989
1991
1993
1995
Cat
ch (t
on)
0
50
100
150
200
250
300
350
CP
UE
(Kg/
fishi
ng d
ay)
Catch CPUE

200
Fig. 6.3 Annual trends in landings and CPUE for the commercial Panulirus argus fishery in North Cuba
6.2 MANAGEMENT REGULATIONS A new fisheries legislation was approved by the Cuban State Council since May, 1996. The new Fisheries Act (Decree-Law No.164, “Reglamento de Pesca”) established, by the first time, a licensing system for all commercial as well as recreational fisheries. Together with this legal body, it was created the Fisheries National Inspection Office, integrated by 14 territorial (Provinces) offices and having 200 field Fisheries Inspectors. Besides the limited entry to the fisheries, the assignment of exclusive territorial rights to each of the eight Fisheries Associations and the licensing system, the main fisheries regulations for the 1998/99 lobster season are: • A legal minimum size of 69 mm carapace length.
• A closed season between March 1 and May 31 except for the southeastern zone whose fisheries will be closed between March 15 to June 15.
• A permanent prohibition to catch or land lobsters in reproductive condition (berried or with a spermatophore).
North Cuba
0
500
1000
1500
2000
2500
3000
1973
1975
1977
1979
1981
1983
1985
1987
1989
1991
1993
1995
Catch(ton)
0
50
100
150
200
250
300
350
CPUE(Kg/fishingday)
Catch CPUE

201
6.3 BIOLOGY Present research At present, the Fisheries Division of the Fishery Research Centre has five research projects related to the spiny lobster : • Management and assessment of the fishery
• Ecology and catch forecast
• Population structure
• Larval ecology
• Fishing gear improvement
Prediction of catches A system of artificial shelters for juveniles in nursery areas has been established in the SW region since 1982 to obtain an index of juvenile abundance. Since 1993, a ten-year relationship between the juvenile index and the capture one year in advance, has permitted a reasonable forecast of the catch. Another way of forecasting is being developed by the use of a number of Australian type puerulus collector also in the SW region till 1987 and the data are under analysis in order to obtain a relation with the capture two or three years in advance. Monitoring the rates of puerulus settlement and juvenile abundance have continued during 1997 as well as systematic biological sampling of size-composition, sex-ratios and reproductive activity in the four main fishing zones. Data from puerulus settlement in 1996 together with data on juvenile abundance was used to forecast a slightly improvement in the recruitent to the fishery for the 1997/1998 lobster season. Comparative studies between Cuba and other countries Different studies have been made comparing catches, growth and fecundity parameters, and a tentative forecasting of capture for the western Caribbean, based on the Cuban juvenile index, was released recently. A significant relationship was found between the production of Bahamas and the one from the NE region of Cuba.
6.4 AVAILABLE DATA AND RECENT DEVELOPMENTS Fishery-dependent data There are statistical records of annual landings since 1928. Data on monthly landings for each of the four main fishing zones are available since 1959. Reliable effort and CPUE data are only available since 1983 based on detailed records of fishing days kept by each boat captain. There are also monthly statistical records of the commercial sizes by each of the eight processing plants since 1982. Fishery-independent data The biological sampling program includes monthly surveys on size-frequencies, sex-ratios, reproductive activity and molting frequency which are representative of the whole fisheries. These data have been taken since 1963.

202
Special monthly surveys have been also carried out since 1987 to monitor puerulus settlement in Australian-type artificial collectors. Juvenile abundance in condominiums made with concrete blocks have been monitored since 1983. Socio-economic data There are about 1 300 fishers directly involved in he fisheries. Furthermore, 420 people works at 28 holding centers, 100 people are dedicated to ship the lobster from the holding centers to the processing plants and 1 100 employees works at the eight processing facilities. The Fishing Associations collect economic data from the fishery and the processing plants in a monthly base. The reported value of annual incomes is about US$ 110 million and the annual rent is about US$ 77 million. Important developments in the fishery During 1997, the enforcement of regulatory measures was improved through the Fisheries National Inspection Office. Additional studies on the optimum number of boats and fishing gears by zone are currently performed to improve the economic efficiency of the fishing operations.
6.5 STATUS OF THE STOCKS The fishery is fully exploited with strict regulations on minimum legal size of 69 mm CL, limited entrance to the fishery and delimited fishing zones per vessel, limited number of fishing gears per vessel, closed season (March-May), permanently closed nursery areas, prohibition of capture of berried females. The last stock assessment indicates a potential catch between 9,500 and 10,000 t. Since 1988 annual reports have been submitted to the managers with analysis by regions on catch, effort, recruitent, and size structure. Several methods have been used to perform the stock assessment, such as surplus production models, yield per recruit, length-based cohort analysis and virtual population analysis. More recently a bioeconomic model was developed which has been used to advise managers on the impact of alternative management strategies taking into account risk and uncertainty.

203
7 LA PESCA DE LANGOSTA EN LA REPUBLICA DOMINICANA3 J. Infante
7.1 DESCRIPCIÓN DE LA PESQUERÍA Area La pesca de langosta en la República Dominicana se concentra en la región sur oeste del país, específicamente en el Parque Nacional Jaragua. Si bien hay reportes de capturas en toda la costa, no existen al momento estadísticas confiables de las capturas comerciales o deportivas fuera del área señalada. La zona explotada tiene un área de 792 km2, aunque la mayoría de los artes de pesca se concentran en un área de unos 200 km2. Está formada por una macrolaguna con fondos areno-fangosos extendiéndose desde la orilla hasta una profundidad de 30 m con abundante vegetación, especialmente Thalasia testudinum, y está bien protegida de los vientos del E y el NE. Historia de la pesquería La explotación de la langosta en la zona de Beata se inició alrededor de 1963 con la instalación en Trudillé de los primeros pescadores artesanales, algunos de los cuales aún continúan en la zona. En la actualidad hay 130 pescadores con 60 embarcaciones activas que operan alrededor de 3,000 nasas. Los registros, sin embargo, son imprecisos tanto a nivel oficial como a nivel de las empresas pesqueras que operan en la zona. En 1988, con la implementación del programa PROPESCAR-SUR, se inició la recolección de información ordenada sobre la pesquería, aunque en todo caso, los registros no han tenido la continuidad requerida. Las primeras referencias basadas en estadísticas confiables son aportadas por Beck et al., quienes señalan aspectos socioeconómicos de la pesquería en el área, resaltando entre otros datos, la importancia de la langosta como principal fuente de ingreso y además, el hecho de que la casi totalidad de la captura corresponde a ejemplares juveniles. La primera estimación de producción anual corresponde a 1990. Técnicas y artes registradas La pesca de langosta se efectúa básicamente con nasas antillanas construidas de malla de alambre con un armazón de varas de mangle u otro árbol de la zona. El los últimos años se han introducido nasas de caña tejida construídas en Haití (tipo Z). Las nasas son operadas desde embarcaciones de madera y/o fibra de vidrio con fondo plano de piezas transversales y una o dos quillas protectoras longitudinales. Estas embarcaciones de unos 7 metros de eslora en promedio, son propulsadas por motores fuera borda de 8 a 15 HP. Los pescadores no utilizan ningún tipo de equipo de navegación, orientándose por la posición relativa de puntos en la costa. Las nasas se operan a profundidades que varían entre 4 y 30 m aunque pocas veces son caladas a más de 20 m. Algunos pescadores las encarnan con cuero de res, estrellas de mar y/o cactus asados. Otros dejan peces y langostas pequeñas. La nasas permanecen en remojo no más de 3 días, se marcan con boyas para facilitar su ubicación y leva y por lo general no se organizan en trenes. Cada embarcación opera un promedio de 50 nasas.
3 Presentado en Belize y modificado en Mérida, 1998

204
Aunque el objetivo de la pesquería es la langosta Panulirus argus, se captura una cantidad considerable de peces demersales, principalmente haemúlidos, lutjánidos y scáridos. En la zona de referencia, el Sparisoma radians es la principal especie registrada en número de individuos, como fauna acompañante junto a la langosta. Esta fauna acompañante representa el 72% del peso de captura, pero sólo el 28% del valor económico. La langosta representa más del 70% de la producción económica. Producción pesquera En la zona se estimó para 1991, una producción de 54.7 t. La producción en otras áreas es mínima, no sobrepasando las 6.0 t en la zona caribeña. Los datos de las demás zonas son puntuales y de baja calidad, aunque los reportes no permiten una estimación superior a las 70 t en todo el país. La información recogida a nivel de pescaderías que trabajan en la zona indican un declive continuo en la productividad en el transcurso de los últimos 6 años. Aunque los niveles de producción globales no muestran un descenso pronunciado, sí ha habido un aumento en el esfuerzo pesquero, expresado como nasas levadas por salida. En los momentos actuales, el levantamiento de estadísticas sigue siendo pobre y discontínuo. La presencia de instituciones como PROPESCAR-SUR y el Grupo Jaragua han disminuido casi a cero sin que exista información suficiente para estimaciones de producción y/o recomendaciones de manejo.
7.2 REGULACION PESQUERA La regulación pesquera en la República Dominicana contempla tres aspectos: • Talla mínima de captura de 12.5 cm de longitud de cola ( sin telson).
• Prohibición de captura de hembras ovígeras.
• Veda estacional de Abril a Junio.
Los controles, sin embargo, son poco efectivos, con el agravante de que la aplicación de la talla mínima legal eliminaría completamente la pesquería en el Parque Nacional Jaragua y arrastraría problemas serios para los pescadores y empresas pesqueras.
7.3 ESTUDIOS REALIZADOS Además de los ya indicados, son pocos los estudios realizados sobre el recurso. Herrera y Colom (1995), trabajando para el PROPESCAR-SUR, hicieron un estudio exploratorio sobre el estado actual de las poblaciones y señalan la zona de Beata como una importante área de cría de P. argus que se distribuye hacia profundidades mayores en el llamado Canal de Beata, donde se reportan arrecifes y corales. Así mismo, describen de manera preliminar una distribución de tallas por profundidad. Por otra parte, Herrera (1996) compara la pesquería de langosta de República Dominicana con las pesquerías de Cuba, encontrando notables diferencias en la distribución de las poblaciones langosteras con respecto a la profundidad. En Cuba, a profundidades menores de 5 m, la talla media es de 79.4 mm LC y aparece sólo un 25% de individuos menores de 69 mm. En Beata, en condiciones similares, la talla mdedia es de sólo 55.1 mm LC y el 87% de los individuos son juveniles. En profundidades de 5 a 10 m, la talla media es muy baja, 42.9 mm LC con un 99% de individuos juveniles. Aún a profundidades de 20 m en región de seibadal profundo y arrefice, el 75% de la población es juvenil, con las clases mayores poco presentes.

205
El hecho de que los niveles globales de producción de la zona no muestran cambios notables, es explicable por las condiciones excepcionales de la zona como criadero y la disminución considerable de predadores debido a la intensa captura de todo tipo de peces. En la actualidad, es clara la situación de sobre explotación del recurso convirtiendo la pesquería, antes artesanal y rentable, en una situación de pesca de subsistencia que ha obligado al cierre de varias empresas pesqueras y agravado la ya tradicionalmente pobre situación de los pescadores.
7.4 SITUACION ACTUAL DE LA PESQUERIA Actualmente hay poca información disponible sobre la pesquería de langosta debido a varios factores entre los que se destacan: • Ausencia en el Departamento de Recursos Pesqueros de la Secretaría de Estado de
Agricultura, de personal dedicado al estudio de poblaciones pesqueras y pesquerías. Esto no ha permitido la elaboración y análisis de los datos existentes.
• Ausencia de un programa de levantamiento de estadística pesquera con fines de análisis de poblaciones.
• Escasa confiabilidad en la información sobre desembarcos y esfuerzo pesquero recolectada por los inspectores de pesca. El trabajo de inspectoría y supervisión de la aplicación de regulaciones, junto a otros factores, limitan enormemente la efectividad de la recolección de información.
• A esto se agrega la virtual suspensión de los trabajos de recolección de datos por parte del PROPESCAR-SUR, de hecho única fuente confiable disponible para un trabajo a largo plazo, debido a la considerable reducción de los gastos logísticos.
La situación es tal que desde finales de 1996 no se cuenta con información oficial alguna sobre la situación de la pesquería de langostas en la zona de Beata.

206
8 LA PESQUERÍA DE LA LANGOSTA EN HONDURAS A. Irias, J. Rodriguez y M. Suazo
8.1 DESCRIPCION DE LAS PESQUERIAS Area La faja costera del Caribe de Honduras comprende 680 km de largo, estimándose el zócalo continental en 4,900 km2, en el que se suceden áreas aptas para la explotación de la langosta espinosa (Panulirus argus). Area de pesca Los bancos de langosta se localizan principalmente en la porción Este de la plataforma hondureña aproximadamente a 260 millas al SE de Roatán, isla en la que se centra la actividad pesquera industrial. Sus fondos están constituidos principalmente por praderas y formaciones arrecifales de considerable extensión. La pesca de Langosta esta determinada por dos tipos de pesca. Historia Esta pesquería se desarrolla a partir de 1968 a raíz de la identificación y caracterización de los bancos langosteros como resultado de las exploraciones efectuadas por la embarcación CANOPUS en el marco de un proyecto de investigación ejecutado por la FAO. Es importante destacar que esta áctividad a significado un importante aporte a la economía nacional aún y cuando se asume que este hecho no se refleja en toda su magnitud debido fundamentalmente a que no se ha contado con un sistema adecuado para la colecta de datos. Pesca Industrial Tiene su principal base de operación, en Roátan y Guanaja donde se capta la mayor cantidad de producto que es capturado en Nasas y Buceo, teniendo como zonas de pesca los Bancos de Misteriosa y Rosario entre el paralelo 83°50 y el meridiano 18°55. Las embarcaciones que pescan con nasas utilizan aproximadamente entre 2500 y 3000 nasas, mientras que los barcos que pescan con buzos, andan alrededor de 20 a 35 buzos por embarcación, en la actualidad la flota pesquera de langosta esta constituida por 178 embarcaciones de las cuales 75 utilizan buzos y 103 utilizan nasas. La pesca comercial de Langosta (Panulirus argus ) por buceo inicio sus actividades en la década de los 60, este tipo de actividad es la que representa las mayores capturas de langosta. La pesca industrial esta orientada a la captura de especies de alto valor comercial destinados al mercado externo lo que requiere de una alta inversión en términos de: • Barcos de gran calado
• Equipos sofisticados en detección y captura
• Métodos de conservación a bordo
• Instalaciones portuarias excelentes
• Infraestructura, servicio y apoyo naval.

207
Pesca artesanal La pesca artesanal es practicada en toda la franja costera del litoral atlántico, un numero no determinado de pescadores realizan la actividad en la que emplean nasas y algunos cuentan con equipo para buceo. Las capturas obtenidas por los pescadores artesanales estan orientadas de la siguiente forma: • Auto consumo
• Venta a intermediarios para el mercado nacional
La pesca artesanal esta caracterizada por: • Un alto porcentaje de mano de obra, pero con un capital bajo.
• Bajo desarrollo técnologico, reflejado en sus embarcaciones, los aperos de pesca y la poca producción que estos obtienen.
Flota El número de embarciones ha ascendendido a través de los años, desde 89 en 1976 a 193 en 1996. La flota langostera inició sus actividades con buceo a pulmón, introduciéndose luego compresores abordo. Posteriormente se incorporan botes naseros, operando inicialmente con 350 nasas cada uno. Paralelamente al aumento de la flota se ha incrementado el tamaño de las embarcaciones pasando de 20 m (61 pies) de eslora en 1993 a 28 m (85 pies) en 1996 elevándose evidentemente el número de nasas y buzos en operación. De las 193 embarcaciones actualmente, de 25 a 35 son naseras y solicitan permiso para operar en el extranjero particularmente en Nicaragua y Colombia. En otro sentido, existen embarcaciones que cuentan con cuartos de congelación (freon) y otras en menor número utilizan hielo como mecanismo de conservación del producto. Esfuerzo La flota industrial langostera esta costituida por 99 botes-buzo y 94 naseros que difieren en la metodología e intensidad de pesca. De estos últimos, de 65 a 75 faenan en los bancos nacionales debido a la salida de botes al extranjero. Algunas investigaciones establecen una población de 4000 personas que ejercen la práctica del buceo con equipo. Los “viajes” de los botes buzo requieren de 18 a 20 días de los que se faenan 12. Se ha estimado un promedio de 24 buzos por embarcación operando en dos jornadas por día utilzando entre cuatro y siete tanques, generalmente a profundidades de 7 a 27 m (20 a 80 pies). Según registros preliminares obtenidos abordo, la faena conlleva de 4 a 6 horas con un tiempo efectivo de pesca estimado en 22 minutos (sumergido) por tanque. Las embarcaciones naseras operan con 2600 a 3000 nasas totalizando 800 nasas levadas por día a profundidades de 90 a 250 pies con un tiempo efectivo de pesca de 75.08 horas sumergidas. Las faenas de pesca en éstas embarcaciones suelen ser continuas durante toda la temporada pesquera (siete meses), en este caso, embarcaciones “nodriza” abastecen de insumos a los naseros. Esta continuidad puede ser interrumpida unicamente por desperfectos mecánicos que obligen su retorno a puerto.

208
050
100150200
Indi
vidu
os
mue
stre
ados
110
130
150
170
190
210
230
250
270
Talla (mm)
Frecuencia de talla según sexo
HembrasMachos
020
4060
80100120
140160
Indi
vidu
os m
uest
rado
s
110
130
150
170
190
210
230
250
270
Talla (mm)
Frecuencia de tallas según estadío sexual
H. Est. 0
H. Est. 1
H. Est. 2
Machos
Honduras, Producción Anual 1979-1997
0
200
400
600
800
1000
1200
1400
1600
1979
1980
1981
1982
1983
1984
1985
1986
1987
1988
1989
1990
1991
1992
1993
1994
1995
1996
1997
Años
Prod
ucci
ón (t
m)

209
Año Producciónton
Año Producción ton
1979 1138.5 1989 746.5 1980 729.9 1990 851.6 1981 658.5 1991 1278.8 1982 562.8 1992 678.3 1983 1310.7 1993 521.5 1984 1508.3 1994 448.66 1985 1343.9 1995 760.1 1986 1113.6 1996 393.2 1987 790.8 1997 463.4 1988 1152.3
Producción Tradicionalmente los datos de producción han sido colectados por tres instituciones gubernamentales involucradas en la temática pesquera. Los volúmenes reportados difieren notablemente entre sí. Los datos emitidos por el Banco Central posiblemente estén más cercanos a los valores reales de producción. A partir de 1994 han sido notorios algunos esfuerzos orientados a mejorar el sistema de recolección de datos, sin embargo ello no ha sido suficiente para maximizar la calidad de la información.
0
10
20
30
40
50
60
70
No.
de
Indi
vidu
os
91 96 101 106 111 116 121 126 131
Profundidad (Pies)
Condición sexual de hembras según profundidad.
ESTADIO 0ESTADIO 1ESTADIO 2

210
Producción y Nº de embarcaciones por año.
Años Prod. (Kg) Prod. (Kg) Nº DIGEPESCA BC Embarcaciones
1980 852,178 78
1981 738,704 78
1982 850,622 59
1983 1,134,016 70
1984 1,648,072 72
1985 1,540,629 67
1986 1,405,920 128
1987 837,459 100
1988 1,138,313 190
1989 482,281 159
1990 621,640 1,900,500 187
1991 56,838,348 2,335,500 236
1992 196,115 1,809,300 223
1993 434,867 1,312,300 207
1994 531,414 181
1995 768,952 178
1996 182
70,019,530 Elaboración y comercialización En Islas de la Bahía operan siete plantas procesadoras en las que se elaboran mayoritariamente langosta y camarón. Cada una de estas plantas cuenta con embarcaciones nodrizas que trasladan el producto de los bancos a las plantas. Las descargas se efectúan en su totalidad en las islas de Guanaja y Roatán, donde operan 3 y 4 plantas respectivamente. El producto arriva congelado y/o fresco a la planta donde se procesa para su exportación al mercado estadounidense. A partir del año 1995, una de las plantas en Roatán dio inicio a un sistema novedoso de elaboración en el que se da un mayor valor agregado al producto. Al igual que los volúmenes de captura, los ingresos por comercialización de la langosta son imprecisos y por tanto difíciles de establecer en el orden real.

211
1991 Capt.
(Lb) Nº
BarcosDp./Mes Kg Car-
cola Nº Total
Botes/Año 1 122,785.00 67 1742 167,085.83 2 236032.01 83 2158 321,192.36 3 309366.88 73 1898 420,986.45 4 279617 90 2340 380,502.81 5 239127 102 2652 325,404.02 6 141209 76 1976 192,157.21 7 108799.6 65 1690 148,054.50 8 90378 27 702 122,986.38 9 57458 19 494 78,188.85
10 109324 82 2132 148,768.10 11 71517 52 1352 97,320.33 12 82461 36 936 112,212.93
Total 1848074.49 772 20072 2,514,859.77 236
1992 1 32664 19 494 44,449.17 2 7926 0 10,785.70 3 119764 87 2262 162,974.85 4 120301 91 2366 163,705.60 5 75617 56 1456 102,899.61 6 52248 46 1196 71,099.08 7 90303 64 1664 122,884.32 8 92946 50 1300 126,480.92 9 36207 27 702 49,270.49
10 28288 29 754 38,494.31 11 0 0 0.00 12 0 0 0.00
Total 656264 0 893,044.05 223
1993 1 0 0.00 2 16659 18 468 22,669.57 3 23672 29 754 32,212.86 4 18806 19 494 25,591.20 5 0 0.00 6 0 0.00 7 0 0.00 8 38965 26 676 53,023.57 9 31432 21 546 42,772.67
10 46502 26 676 63,279.92 11 22919 24 624 31,188.18 12 30575 25 650 41,606.46
Total 0 312,344.42 207

212
1994 Capt.
(Lb) Nº
Barcos
Dp./Mes Capt. Kg Car-
cola
Nº Total Botes/Año
1 20365 13 338 27,712.69 2 19,802 12 312 26,946.56 3 37280 17 442 50,730.62 4 0 0.00 5 0 0.00 6 0 0.00 7 0 0.00 8 20365 13 338 27,712.69 9 72311 25 650 98,400.81
10 50302 28 728 68,450.96 11 39374 25 650 53,580.14 12 0 0.00
Total 0 353,534.48 181
1995 1 0 0.00 2 0 0.00 3 0 0.00 4 0 0.00 5 0 0.00 6 0 0.00 7 0 0.00 8 308539 79 2054 419,859.87 9 360960 92 2392 491,194.37
10 267270 93 2418 363,701.02 11 256009 83 2158 348,377.05 12 193912 84 2184 263,875.45
Total 0 1,887,007.75 178
1996
1 190547 71 1846 259,296.36 2 212554 71 1846 289,243.48 3 4975 3 78 6,769.98 4 0 0.00 5 0 0.00 6 0 0.00 7 0 0.00 8 144,496 65 1690 196,630.16 9 223,411 80 2080 304,017.69
10 161,225 69 1794 219,394.98 11 139438 63 1638 189,747.23 12 157293 68 1768 214,044.31
Total 0 1,679,144.19 182
1997 1 91622 47 1222 124,679.22 2 22682 14 364 30,865.67 3 2957 2 52 4,023.89
4-12 0 0.00 Total 0 159,568.77

213
8.2 MANEJO DE REGULACIONES Marco institucional La actividad pesquera esta regulada por la Secretaría de Agricultura y Ganadería a través de la Dirección General de Pesca y Acuícultura (DIGEPESCA) creada en 1991. Bajo la cooperación de la FAO y para fortalecerla operacional e institucionalmente se conformó una misión multidisciplinaria para la ejecución del Proyecto de Modernización del Sector Público Pesquero, dando origen a un Plan de Ordenación de la Principales Pesquerías de Crustáceos, así como un Plan de Desarrollo Pesquero y Acuícola de Honduras, este ultimo bajo la asistenca técnica y Financiera de NORAD/Oldepesca. Para la implementación de sus funciones, la dirección cuenta entre otros, con un Departamento de Investigación y Tecnología Pesquera, Pesca Marítima y Control y Fiscalización y una Unidad Estadistica, encargados de dictar las medidas técnicas, de inspección, vigilancia, monitoreo y registro de la áctividad pesquera en general. El establecimiento de medidas de ordenación es atribución de la DIGEPESCA como Institución del estado entre las que destacamos: • Talla minima legal de captura de Langosta de 140.5mm o 14.5 cm de longitud de cola.
• La abertura de escape entre la regla inferior y el fondo de la nasa debe ser de 2 ¼ pulgada.
• Prohibir la captura de hembras ovigeras o con masa espermatófora
• Una veda temporal de 4 meses que inicia el 15 de marzo al 31 de julio
• Prohibir la utilización de nasas de metal forradas con plástico, solamente asas de madera con dimenciones de 50 cm(A) x 60 cm(An) x 90 cm(L)
• No se deben utilizar los tanques de buceo fabricados antes de 1992 sin la prueba hidrostática.
• Los buzos no deberan bajar a profundidades que excedan los 90 pies de profundidad.
• No conceder licencias provisionales ni temporales, para la pesca del recurso langosta.
• Exigir a los dueños de botes, mantengan en buen estado todo el equipo que utilizaran para la pesca por buceo.
Ordenación La actividad pesquera está regida por una ley emitida en 1954, la cual está notablemente desactualizada. En tal sentido, la Secretaría de Agricultura y Ganadería, a través de la DIGEPESCA, emite resoluciones tendientes a normar la explotación actual del recurso. Entre algunas medidas normativas vigentes se destacan: • Establecimiento de un período de veda de siete meses (Marzo 1 a Julio 31).
• Establecimiento de la talla mínima legal en 140 mm de longitud de cola.
• Restricción absoluta para la captura de hembras ovadas.
• Acceso cerrado a nuevos cupos en la pesquería.
• Sustituciones de las embarcaciones únicamente por otra de igual capacidad.

214
8.3 BIOLOGIA Investigaciones A partir de la información con que se cuenta se asume un nivel excesivo de esfuerzo como producto del incremento en el número de embarcaciones y nasas. Esto posiblemente derive en: • - Una tendencia decreciente de los rendimientos.
• - Una reducción de la talla promedio del stock desovante.
En 1996, bajo los acuerdos de cooperación suscritos con el Programa de Apoyo al Desarrollo de la Pesca en el Itsmo Centroamericano (PRADEPESCA), se creó un centro de investigación pesquera con sede en Roatán. En sus componentes se ha estructurado un programa de campañas biológico-pesqueras a bordo de embarcaciones industriales y de monitoreos en las plantas procesadoras. Todo esto con la asistencia técnica del Instituto Francés de Investigaciones del Mar (IFREMER) En el Caribe Hondureño se han realizado pocas investigaciones en cuanto a la población de Langosta se refiere, la información generada se han obtenido de los muestreos efectuados a bordo de embarcaciones pesqueras y alguna información obtenida de los muestreos realizados en plantas procesadoras. En el periodo 96-97 la Dirección General de Pesca y Acuicultura (DIGEPESCA) a través del Centro Regional de Investigaciones Pesqueras del Caribe Centroamericano (CRIPCCA) con sede en Roátan Islas de la Bahía, ha venido desarrollando diferentes monitoreos biológicos de langosta a nivel industrial. Irias y Cortés (1996) realizaron un muestreo biológico a bordo de la M/N Tayanne Ariel II Langosta/Nasa con el objetivo de determinar la estructura poblacional a través de la composición de tallas, determinar el esfuerzo pesquero, áreas de pesca, épocas de reproducción, desove y establecer la relación tallas-peso. Cortés (1997) realizo muestreos en plantas procesadoras, con el objetivo de obtener información sobre la estructura de peso individual de colas; así como la determinación de sexo. El Departamento de Investigación, de la DIGEPESCA realizo cuatro campañas de monitoreo biológico en la Pesca Artesanal de este recurso a bordo de cayucos en el momento del desembarque , en la Bahía de Omoa, Cortes, dichos muestreos se realizarón en épocas de Verano e Invierno. Rodriguez, Suazo y Pineda (1997) realizarón muestreos a bordo y desembarque, para determinar: distribuición, captura, tallas, sexo, épocas de reproducción; de acuerdo a los resultados se determino que la estación seca es mas productiva, encontrando que las tallas de captura no cumplen la talla minima establecida de 140.5 mm de longitud de cola.
8.4 DATOS DISPONIBLES Datos dependientes de la pesquería Los estimados de desembarques anuales, alcanzaron las producciones mas altas entre 1983 y 1986, del 87 a la actualidad se han presentado variantes en cuanto a los datos,reportados por las plantas procesadoras (Fig 1 cuadro 1). Un dato importante de mencionar es la operatividad de los embarcaiones que utilizan nasas que utilizan entre 2,500 y 3,000 nasas. Desde 1995 se han venido realizando muestreos en 7 plantas procesadoras (cuadro 2 y3) localizadas en Guanaja y Roatán.

215
Datos independientes de la pesquería Se han realizado algunos monitoreos biológicos de langosta/nasa para determinar datos sobre distribución, captura ,talla, sexo y muestreos en plantas procesadoras para conocer composición de tallas y categorias Datos socioeconómicos En la pesca comercial de Langosta participan alrededor 75 embarcaciones que utilizan buzos, pescando un numero aproximado de 1,800 buceadores que representan un promedio de 24 buzos por embarcación, mientras que las embarcaciones que utilizan nasas anda alrededor de 103 embarcaciones participando en la pesca un numero aproximado de 1,030 pescadores, representado un promedio de 10 marinos por embarcación. Importancia en el desarrollo de la pesca sobre años anteriores Desde 1994 se ha venido realizando un control mas riguroso en la plantas procesadoras, con el objetivo de obtener datos mas reales en cuanto a la comercialización del producto y mejor control de calidad.
8.5 ESTADO DEL RECURSO La tasa de impuestos es desconocida así como el estado del recurso, el dato existente es en la variación de los desembarques.

216
9 NATIONAL REPORT OF JAMAICA4 S. Grant
9.1 DESCRIPTION OF THE FISHERIES Area Jamaica is located approximately 145 km south of Cuba and 161 km west of Haiti or (18o 15' N and 77o 45' W) (see Fig. 9.1). The island is 236 km long, with a width varying from 35 to 82 km, a total area of 10,940 sq. km and a coastline of approximately 885 km. The irregular coastline is interrupted by numerous coastal features such as harbours, bays, beaches, estuaries, mangrove swamps, rocky shores, cays, coral reefs and lagoons Jamaica has a tropical maritime climate which is modified by north-east trade winds and land sea breezes. Average temperature is 27 degrees C, ranging from 23 degrees C in winter to 28 degrees C in summer. Jamaica in 1995 had a population of approximately 2.5 million and Gross Domestic Product of J$ 162,568.7 million (approximately US$ 4,339 million). The agricultural GDP (which includes fishing) in 1995 was 8.1% (Economic and Social Survey of Jamaica, 1995). The lobster fishery The fisheries of Jamaica have approximately 20,000 fishermen (10,000 registered fishers in 1996), most of these are artisanal fishers operating from open canoes or reinforced fibreglass- type (FRP) boats powered by either outboard motors or oars. There are approximately 9,000 boats (2,781 registered boats in 1996), ranging from 4 to 9 m, operating from 187 fishing beaches distributed around the Jamaican territorial waters. Vessels 12 m and above, powered by inboard engines are considered industrial vessels. The fishing areas can be divided in two main sections, the inshore fishery (this fishery takes place in the coastal waters of the island and includes nine proximal banks) and the offshore fishery (fishing operations that are based on the offshore cays, as well as deep-sea fishing) including the Jamaica/Colombia Joint Regime Area within the EEZ (Fig. 9.1). Economically, the multispecies coral reef fish resources are exploited by the largest group of fishers while, lobster and conch are the most valuable fisheries. The families of major economic importance are Lutjanidae, Serranidae, Carangidae, Mullidae, Scaridae, Haemulidae, Balistidae, Acanthuridae, Holocentridae, Chaetodontidae, Palinuridae (lobster), Strombidae (conch). Coastal pelagic fishes such as the Clupeidae, Engraulidae, Mugilidae, Scombridae and Hemiramphidae also form an important component of the fish catch. The spiny lobster, Panulirus argus, is widely distributed in the coastal waters and on the offshore banks around Jamaica. It is a highly priced resource and represents an important component of the total landings of the Jamaican commercial fisheries. The large concentrations of lobster are to be found on the Pedro Banks (Portland Rock - Fig. 9.2) which accounts for approximately 60% of the total landings from the fishery. Fishing for lobster is done mainly on the island shelf and the banks. Structure of the lobster fishery Fishing for lobster is done mainly on the island shelf and the banks. The fishery is targetted by three categories of fishers:
a) mainland artisanal fishers - using Antillean Z-traps or diving as the main method of fishing; the lobster is sold to the catering industry and housewives; some also go to small and large processors
4 Combination of documents presented in Belize, 1997 and Mérida, 1998

217
b) offshore artisanal - based mainly on Pedro and Morant Banks; mainly divers; the lobster is sold to packer boats who in turn distribute to the same market as the mainland artisanal fishers and
c) fishers based on the mainland but operating on the Pedro and Morant banks from 20-35 m length vessel; these fishermen are licensed to use Florida traps only; they are processors and sell lobster mainly to the export market.
Artisanal fishery The artisanal fishery is exploited using a variety of fishing methods; these includes the Antillean Z-traps or fish pots (3 * 1 m), diving (freelung or SCUBA), speargun (which is not encouraged) or collected by hand and various types of nets. The artisanal fishers operate from 1,947 registered 8.4 m fibreglass boats with outboard engine (40 hp), with a crew of three, and 834 registered 4 - 5.5 m dug-out canoes (non-mechanized). The main gear is fish pot but lobster is not targetted. Divers, however, target lobster on the mainland. Night diving has become a major problem in Jamaica, this has led to the destruction of the reef. Up to ten divers travel in a vessel to the fishing ground, all divers go overboard leaving the captain to keep watch and assist them back on board the vessel. Lobster is sold locally to the public either at the boatside, or through vendors. Vendors then distribute the lobster to the catering industry (Fig. 9.4). Very few processors trade with the artisanal fishers. Industrial fishery The industrial fishery is exploited using large vessels. These are in the size range of 25 - 30 m. The gear allowed on these vessels is the Florida (wooden - 7 * 5 cm) lobster pot. The industrial fishery is exploited on the offshore banks e.g. Pedro Bank. These fishers are based on the mainland but operating on the Pedro and Morant banks from 20-35 m length vessel; these fishermen are licensed to use Florida traps only; they are processors and sell lobster mainly to the export market. Five industrial licences have been issued (1996) to fish lobster on the Pedro Bank using Florida traps. These five vessels are operated from three companies. The vessels are steel hulled 20 m by 5.7 m by 3 m; inboard motor up to 500 hp. The vessel crew ranges from 8-12, which includes the captain, engineer, freezer technician and crew (multi-purpose). Vessels carry approximately 1 000 Florida pots, with 500 pots in the water at any one time; the average immersion time is three days. Fishers spend up to three months at sea before returning to the mainland. Smaller quantities of lobster are transported back to the mainland via other vessels on the way to the mainland. Lobster is exported mainly to the United States. On the Pedro Bank the artisanal and industrial fishing grounds do not overlap, thus there is no conflict. However, the industrial vessels are in constant conflict with illegally operating Honduran dive boats (6 - 8). The divers cut and destroy the industrial vessel pots. The coast guard is unable to constantly monitor activities on the Pedro Bank. There are six types of lobsters which may be caught in Jamaican waters; Panulirus argus, P. guttatus, Justitia longimanus, Palinurellus gundlachi, Scyllarides aequinoctialis and Parribacus antarcticus. Only two of these lobsters, Panulirus argus and P. guttatus, are of commercial value while the remaining are rare (Aiken, 1984).

218
Fig.9.1 Offshore fishing areas of Jamaica
Fig.9.2 Map of Pedro Bank

219
Table 9.1 Lobster species taken by fish traps in Jamaican waters
Family Scientific name Common name Occurrence Palinuridae Panulirus argus Spiny lobster Common
Panulirus guttatus Spotted spiny lobster Occasional
Justitia longimanus Long-armed spiny lobster Rare: deeper water
Palinurellus gundlachi Copper lobster Very rare: moderate to deep water
Scyllaridae Scyllarides aequinoctialis
Spanish lobster Occasional
Parribacus antarcticus Slipper lobster Rare Source: Aiken, 1984
The spiny lobster fishery is the second most important fishery (export earnings) in Jamaica. In 1995 the total production of lobster was estimated to be 350.22 t, of which 242.96 t was exported valuing US$ 6.1 million. It has been estimated that for 1996, the country harvested 394.50 t, artisanal fishers and approximately 11 t from the industrial fishers (2.7% of total landings). Since 1962, the contribution of lobster to total production varies between 3-7% (Table 9.2). Landings for lobster peaked in March and September (83 and 85 t). Lobster is being landed during the closed season, April to June (Fig. 9.3). Antillian Z-traps contribute 63% of total landings of lobster, followed by dives (34%), wooden traps (2.9%) and nets (0.1%).
Table 9.2 Lobster production and export
Year Fish production
(t)
Lobster production
(t)
Lobster produced
%
Lobster exported
(t)
Lobster exported
%
1962 10996.86 729.79 6.6 5.00 0.68
1968 6624.52 292.68 4.4 8.39 2.90
1973 7290.64 455.56 6.2 0.35 0.08
1981 7772.10 231.11 3.0 28.52 12.34
1982 7974.60 230.00 3.0 22.50 9.80
1983 8134.40 400.00 4.9 31.39 7.80
1986 8057.30 550.00 6.8 0.93 17.00
1993 150.00 133.91 89.00
1994 214.50 173.70 81.00
1995 350.22 242.96 69.40
1996 14495.12 394.50 2.7
Sources: External Trade, STATIN; Aiken, Fisheries Division Since 1962 the export of lobster has increased significantly (Table 9.2), from 0.68% in 1962 to 69% in 1995. Presently, lobster is exported as lobster rock frozen or rock live/ fresh/ dried/ salted/ brine at approximately US$ 10 per pound. There is an export market for whole lobster, however, the method of processing is inadequate and the final product is not

220
exportable. Lobster is exported to countries such as the USA, Canada, Barbados, Cayman Island, Cuba, Bahamas etc., the country also imports lobster from the USA and Guyana.
Fig. 9.3 Monthly production of lobster in 1996
9.2 PROCESSING At landing sites First the lobster is stored live in small lobster pots in the water along the shore. Once a buyer is identified, the fisher boils the lobster or sells it alive. At industrial Sites
Aboard the vessel
• The whole lobster is dipped in metabisulphite for 2 minutes
• The lobster is tailed
• It is packed in bags and frozen
• The meat is scraped from the head - sold to hotels to be used in crab backs
At the processing plant
• The tails are allowed to defrost
• Tails are sorted by grades (A - for the export market; large size with no cracks; B - for the local market)
• The main vein removed and the area washed
• Packaged and exported.

221
Processing plants are multi-operational, ie. in order to be economically viable plants are usually involved in conch, lobster and fish processing. Plant processing capacity by fish type is conch (60%), lobster (10%) and fish (5%). Presently, the plants are not being used to full capacity.
Fig. 9.4 Processing and marketing of lobster in Jamaica

222
9.3 MANAGEMENT REGULATIONS The Fishing Industry Act of 1975, recommended a minimum size for spiny lobsters (Panulirus argus) of carapace length 7.62 cm (3 ins). No lobster below that size could be landed or offered for sale. Female spiny lobster with eggs are also protected under the Act. Both provisions carry a maximum penalty of J$1 000 or six months= imprisonment for convicted offenders. The law seeks to protect immature females, and enabling spawning females to remain in the sea long enough to release their eggs, after which they may be taken. With the further decline of lobster, other management strategies were put in place, such as; closed season: April 1 to June 30 and declaration and inspection of lobster in storage during the closed season. Further restrictions were placed on the industrial vessels, limited entry and gear restriction (Florida traps only). Review of management regulations
1977 Up to 1976, Jamaica was the only country in the English-speaking Caribbean not to have lobster conservation legislation. Conservation efforts began when Aiken (1977) showed that in 1974 and 1975, fully 76% of the commercial lobster catch consisted of immature females (by comparison, Florida showed 17-21% immature females harvested), suggesting that they were in great need of protection. The information collected suggested that the minimum size for lobsters would be best set first at 70 mm (or 2 ¾ inches) carapace length (CL). This size could then be increased very slowly over a number of years. This would protect some 50% of the immature females. During the draft of the Fishing Industry Act of 1975, a minimum size for spiny lobsters of 70 mm CL was recommended under section 25 (h). No lobster below that size could be landed or offered for sale. This size was considered to be an adjustable initial minimum size. Female spiny lobster with eggs are also protected under the Act. Both provisions carry a maximum penalty of J$1,000 or six months’ imprisonment for convicted offenders. The law seeks to protect immature females, and enabling spawning females to remain in the sea long enough to release their eggs, after which they may be taken.
1977 Fishing Regulations The fishing industry Act of 1975, section 12 (1) states that, no person shall - • catch and bring ashore, or destroy, any berried lobster;
• catch and bring ashore, or destroy, any spiny lobster (Panulirus argus) of carapace length of less than 7.6 cm (3 inches).
1986 In 1986 the Fisheries Division proposed several measures for the further development and management of the lobster fishery: • As of May 1987, no additional industrial vessels should be given permits to fish spiny
lobster on the fishing ground under our national jurisdiction, each boat should operate a maximum of 1,000 traps. Each vessel should have a log book and record the data specified by the Fisheries Division. These vessels should be prohibited from engaging in diving operations.
• A 200 mile exclusive economic zone was implemented.
• The present minimum legal size was increased from 76 mm (3 inches) to 89 mm (3.5 inches) carapace length. Only 10% of the female lobster have reached maturity at 76 mm CL (the legal minimum size in 1984). The proposed minimum size of 89mm CL will guarantee at least 55% reach maturity before they become vulnerable to harvest.

223
• An annual closed season beginning April 1 to ending June 31 should be declared.
• The spearing and hooking of lobster should be prohibited.
• Stricter law enforcement should be ensured.
• Research priorities should be determined (growth, mortality and recruitent rates; estimate the maximum sustainable yield and the fishing effort needed to achieve this yield; determine the importance of lobster in the artisanal and industrial fisheries).
• Pressurized breathing gasses are not to be used in the capture of the lobster resource.
1997, present policies
Management unit The island is divided into three management units; (1) the island shelf, (2) the near shore banks and (3) the off-shore banks. This management strategy was determined to be necessary since the relative size of these areas differ. The difference in size of areas may have implications for determining the Total Allowable Catch (TAC). This will have impact on the number of vessels allowed to fish an area, number of divers allowed on a vessel etc. The biological characteristics of the lobsters in these areas may differ, e.g. lobsters may mature at a different size, breed in a different season, etc. This will affect the management strategies employed according to the area fished, etc.
Assessment summary The lobster populations in Jamaica have changed considerably since 1983 (Munro). Fishing effort has increased significantly over recent years and the present level of fishing mortality appears to be greater than the optimum recommended for the fishery. From a biological perspective, fishing mortality should be reduced to minimize the risk of over-exploitation (Aiken, 1993). It is the objectives of the Fisheries Division to assess the present status of the fishery within each management area.
Management strategy (present) Goal: Conservation of the fishery in order to ensure future earnings from the fishery. State of stock: Over-exploited. Historical data suggest that if the level of exploitation increases from the 1984 level the fishery was in danger of over-exploitation (Aiken, Munro, Haughton etc.). Present information (through data collection and investigation) is needed to determine the present status of the fishery.
9.4 SPECIFIC MANAGEMENT ACTIONS Conservation measures • Protecting critical habitats from degradation and habitat enhancement.
• Improve processing and marketing
- investigate and document status of processing system - implement HACCP - utilization of waste (eg. head) in processing
• Rehabilitation of the fishery

224
Social & economic measures • Adopt management measures to ensure a biological sustainable yield to ensure
viability of the processing plants and the fishers who depend on the fishery.
Enforcement measures • Enforcement of lobster closed season
Monitoring and control, current management strategy
Limited Entry
• A specific amount of motor fishing vessel licences shall be issued to fish the offshore banks
• No licences shall be issued for motor fishing vessels to fish for lobsters on the island shelf.
The limited entry of vessels is currently restricted to the industrial fishery. The measure will reduce the effort on the fishery and overcrowding and potential conflicts with artisanal fishermen. This will ensure that the level of exploitation does not exceed the maximum sustainable yield (MSY).
Exclusive Fishing Zone For Artisanal Fishermen Recognize an exclusive fishing zone for artisanal fishermen within the following areas of fishing space: • An area to be defined on the Pedro Bank and other nearshore and offshore banks
• The entire island shelf including that body of sea surrounding the island shelf and extends seaward from the edge of the island shelf to a distance five (5) nautical miles.
• Any other area of marine sea space
This will be done in order to protect the livelihood of the more vulnerable artisanal fishermen from unfair competition and potential marginalisation and displacement from the large artisanal fishers.
Gear Restriction The taking of lobsters using SCUBA or hoocha is prohibited. Lobsters should only be caught using lobster pots (industrial vessels) or Antillean Z-traps (fish pots).
Total Allowable Catch (TAC) The implementation of catch quotas to monitor and control the level of exploitation of lobsters so as to ensure that such exploitation is at the level of the maximum sustainable yield is being contemplated for the industrial fishery.
Closed Seasons The lobster closed season, 1 April - 30 June, regulation was passed in 1989. The regulation prohibits the fishing of lobsters during this period (peak lobster spawning period). Persons found fishing for lobster may be fined J$500 or subject to a prison term not exceeding six months. During the closed season spot checks are conducted on beaches and storage houses to ensure compliance with policy and regulations. Activities scheduled under the

225
closed season will ensure close monitoring of activities and this will eliminate the capture and trade of lobster during the close season.
Declaration Of Lobsters In Storage Persons or companies are expected to declare to the Director of Fisheries the quantity of lobsters (whole, tail), or its derivative, they have in storage. This should be submitted within a period of seven days before the annual closed season. Any commercial cold storage facilities which is storing lobsters on behalf of any person, company or fish processing establishment must, within a period of up to seven days after the commencement of the closed season for lobster declare in writing to the Director of Fisheries the quantity of lobster or its derivatives in their possession or its derivatives in their possession or being stored on behalf of a second party.
Inspection Of Lobster In Storage Fishery inspectors may enter into processing establishment, company, hotel etc. at any time of the day or night to inspect that facility for lobster meat or derivatives.
Prohibition Of Sale Of Lobsters During The Closed Season The sale of lobsters during the closed season will be prohibited except for the 21 days, where lobster caught before the closed season could be sold by hotels, restaurants, lobster processing plants and exporters.
Prohibit The Importation Of Lobsters During The Closed Season The importation of any species of lobsters will be prohibited during the closed season for lobsters.
9.5 BIOLOGY Studies conducted by Munro (1983), Aiken (1977, 1983) and Haughton (1988) confirmed a significant reduction in the mean and modal size of the lobster population in Jamaica. Haughton and King (1988), reported that the fishing effort has increased significantly and the present level of fishing mortality appears to be greater than the optimum required for the fishery. The study estimated the von Bertalanffy growth parameters. The growth parameters were then used to generate a recruitent pattern; a length converted catch-curve was constructed from which total mortality and mean selection size were estimated; population size and exploitation pattern, yield per recruit and biomass per recruit were also estimated. Kong in 1991 conducted a tagged study, recovery was small for quantitative analysis. Young (1992) did a study on puerulus settlement rates on the south coast of Jamaica and found that settlement was continuous throughout the year. Fisheries Division (1975) reported that, fully 76 percent of the commercial lobster catch consisted of immature females (by comparison, Florida showed 17-21 percent immature females harvested), suggesting that they were in great need of protection.
9.6 AVAILABLE DATA AND RECENT DEVELOPMENTS Fishery-dependent data
The Jamaica lobster data collection plan Catch & effort and biological data is collected by gear from the artisanal fishers through random stratified sampling. Data from the industrial fishers is collected by census. The data collection programme began in September, 1996 with assistance from CFRAMP. Some data

226
from the industrial fishery is available (1996 only). Biological data (carapace length) is presently being collected on three gears (SCUBA, freelung and gill net). At the processing plants, lobsters are landed tailed. The data collectors measure tail length which then needs to be converted to whole weight and carapace length. Morphometric studies (carapace length, tail length, weight, telson length and carapace depth) were done on the Pedro Bank to easily convert from one measurement to the other. Fishery-independent data Such data are not yet available
Socioeconomic data Since 1962 the export of lobster has increased significantly, from 0.68 percent in 1962 to 69 percent in 1995. Presently, lobster is exported as lobster rock frozen or rock live/ fresh/ dried/ salted/ brine at approximately US$10 per pound. In 1996 the county exported 159.78 t valuing US$3.6 million. No economic data is available at this time, however, there are indicators to show that the fishery is not economically viable as the industrial fleet has decreased by 50 percent and the number of artisanal vendors and traders have decreased. Developments in the fishery A biological data collection programme was implemented on the south shelf this includes measurement from three major gear types. The Division has not been able collect data from the Pedro Bank due logistical reasons. No data is being collected on one main gear, hookah.
9.7 STATUS OF THE STOCK The lobster populations in Jamaica have changed considerably since 1983 (Munro). Fishing effort has increased significantly over recent years and the present level of fishing mortality appears to be greater than the optimum recommended for the fishery. From a biological perspective, fishing mortality should be reduced to minimize the risk of over-exploitation (FAO, 1993). Over the years because the fishing effort has not decreased significantly, but has instead increased, over-exploitation is inevitable.

227
10 LA PESQUERIA DE LANGOSTA EN MÉXICO (YUCATÁN Y QUINTANA ROO)
E. Sosa Cordero, V. Rios Lara, A.M. Arce y M. Cabrera Vasquez
10.1 DESCRIPCION DE LAS PESQUERIAS Zonas de pesca En Yucatán, el área de los campos langosteros es de 29,530 km2 (Tabla 10.1) y está dividida en cuatro zonas de pesca: • Poniente, donde operan las embarcaciones de Celestún, Sisal y la flota menor de
Progreso,
• Arrecife Alacranes donde pesca una flotilla de 10 y l6 pies,
• Centro en donde opera la flota de Dzilam de Bravo y
• Oriente en donde operan las flotas de San Felipe, Rio Lagartos y El Cuyo.
A partir de diferencias en desarrollo, infraestructura, rasgos fisiográficos, tamaño de la plataforma y artes de pesca, en Quintana Roo se reconocen tres zonas de pesca: norte, central y sur. Las principales localidades pesqueras de la zona norte son Isla Mujeres, Isla Holbox-Cabo Catoche y Puerto Juárez. Esta zona aporta los mayores desembarques anuales y se caracteriza por la alta diversidad de artes de pesca: gancho con buceo (libre, hookah y SCUBA), trampas (nasas), redes de enmalle en la época de nortes, y hábitats artificiales. En la zona central, las principales áreas de pesca son Bahía de la Ascensión (750 km2) y Bahía del Espíritu Santo (313 km2); aquí predomina el gancho con buceo libre. Esta zona de distingue por el uso de hábitats artificiales y una singular organización espacial basada en un sistema de parcelas marinas. Se estima que en ambas bahías existen unos 31,000 hábitats artificiales o “casitas cubanas”. Le sigue a la zona norte en aportación al volumen de capturas anuales. Finalmente, en la zona sur, el banco Chinchorro, un complejo arrecifal tipo-atolón (800 km2), es la principal área de pesca. Aquí predomina el gancho con buceo libre en hábitats naturales, hasta los 15-20 m de profundidad.
Tabla 10.1 Areas de las zonas de pesca de langosta en Yucatán
Zona Area (ha) Poniente 1594 810Alacranes 285 922Centro 383 290Oriente 688 961Total 2 952 983

228
0
500
1000
1500
2000
1955 1960 1965 1970 1975 1980 1985 1990 1995
A ños
Peso
ent
ero
(ton) Quintana Roo Yucatán
Fig. 10.1 Capturas anuales (ton, peso entero) de langosta P. argus en México
10.2 IMPORTANCIA DE LA PESQUERIA El recurso langosta Panulirus argus tiene relevancia social y económica en México (Seijo et al., 1991; Arceo et al., en prensa). En su captura participan 35 cooperativas de Yucatán y Quintana Roo. En 1979 la captura regional superó las 1000 t de peso entero; en 1988 alcanzó su máximo histórico: 1661t (Fig. 10.1). Posteriormente, las capturas declinaron, menos en Yucatán que en Quintana Roo. La captura media regional de 1391 en 1985-1989, pasó a 969 t el lustro siguiente: 1990-1994. En Yucatán la pesquería de langosta es una de las más importantes debido al precio que alcanza en el mercado internacional. Esta pesquería cada día cobra mayor importancia en cuanto al número de cooperativas que participan y al número de personas no cooperativadas interesadas en su explotación y comercialización.
Captura y es fuerzo anual / Q. Roo
0
200
400
600
800
1000
1200
1400
1955 1960 1965 1970 1975 1980 1985 1990 1995
A ños
Peso
ent
ero
(ton)
0
500
1000
1500
2000
2500N
úmer
o em
b, p
esc
cap tu ra em barcaciones pes cadores
Fig. 10.2 Evolución de captura (ton, peso entero) y esfuerzo (# embarcaciones y pescadores) en Quintana Roo
En Quintana Roo, la pesquería de langosta es la de mayor importancia social y económica. De 1990 a 1994, los desembarques variaron entre 140 y 211 toneladas de colas con valor de 9.5 a 13 millones de pesos (US $1 = 7.95 pesos Mexicanos). Estas cifras representan del 3 al 5% en peso y del 24 a 34% en valor económico de los desembarques totales de recursos pesqueros en Quintana Roo (Datos de la SEMARNAP-Delegación Federal en Quintana Roo, Chetumal).

229
La pesquería de langosta es la más importante de Quintana Roo, pese a que las capturas anuales recientes están al nivel de los 70’s con una flota tres veces mayor (Fig. 10.2). De 1990 a 1994 el desembarque anual de langosta varió de 121 a 140 t de colas (Fig. 10.2), con valor de $ 9.5 a 13 millones de pesos; esto es, 24 a 34% del valor del total desembarcado en el estado (datos de SEMARNAP-Q. Roo). En Quintana Roo, durante 1993 participaron en la captura 20 cooperativas, con 2150 pescadores y 649 embarcaciones.
10.3 FLOTA Y UNIDADES DE PESCA En las costas de Yucatán se reconocen tres áreas langosteras: oriente, centro y poniente; además del arrecife Alacranes. Cada área está sometida a diferente presión de pesca, con mayor presión en la oriente. El método de captura es buceo con compresora. La unidad de esfuerzo es una embarcación de 7.6 m de eslora y motor fuera de borda 40-65 HP, compresora y un buzo que pesca a 2 nudos por 6 horas y franja de visibilidad de 10 m. En Alacranes, la unidad de esfuerzo es una embarcación (“alijo”) de 3-4.9 m, con o sin motor y dos buzos. En la costa hay autorizadas 466 embarcaciones de 7.6 m; en Alacranes, 14 barcos nodrizas y 104 alijos. La pesca se efectúa a profundidades de 5.5 a 36.6 m (Ríos et al., 1998). Esta pesquería, orientada a la producción de colas, se estableció en los años 70’s. En la última década, las capturas de Yucatán han fluctuado entre 104 y 225 t de colas. En la pesquería de langosta de Yucatán participan 16 cooperativas con alrededor de 400 embarcaciones menores (24 pies de eslora y motor fuera de borda de entre 40 a 65 hp) que operan en la costa entre las 3 y las 20 (5.5 – 36 m) brazas y una flotilla de alrededor de 104 pequeñas embarcaciones (alijos de 10 pies sin motor y embarcaciones de 16 pies con motor de 10 hp). Estos últimos dos tipos de embarcaciones son transportadas por 14 embarcaciones mayores de 35, 45 y 55 pies de eslora (10, 14 and 17 m) al Arrecife Alacranes. En Yucatán la unidad de pesca es una embarcación de 24 pies con un compresor y un buzo pescando a una velocidad de dos nudos durante seis horas. La pesquería de langosta de Quintana Roo es artesanal En 1993 participaban 20 cooperativas pesqueras con 2,150 pescadores y 649 embarcaciones menores, que signifcan el 57 y 63% de los totales estatales, respectivamente. . La unidad de pesca es una embarcación de fibra de vidrio, 7 a 7.6 m de eslora y motor fuera de borda 40-75 HP, tripulada por 2-4 pescadores. Diferencias en área de plataforma continental, ambientales y desarrollo pesquero, permiten dividir la costa de Quintana Roo en tres zonas: norte, central y sur. Según Miller (1982), la norte va del límite con Yucatán a Punta Petempich; la zona central de P. Petempich a Punta Herrero y la sur, de P. Herrero al Canal de Bacalar Chico. En la zona norte, se usa mayor diversidad de artes: gancho con buceo (libre, SCUBA, compresora), nasas, redes y casitas. En la zona central domina el gancho con buceo libre en casitas y hábitat natural. La zona sur incluye Banco Chinchorro, complejo arrecifal tipo atolón. En la zona sur, domina el buceo libre con gancho en hábitats naturales. La zona norte aporta las mayores capturas anuales de langosta, seguida de las zonas central y sur. En las capturas de las zonas norte y sur, de amplio rango de tallas, dominan langostas medianas-grandes; en la zona central dominan tallas menores, con moda cerca de la mínima legal, 74 mm LC. En Quintana Roo, la unidad de pesca típica es una embarcación o lancha de fibra de vidrio de 23 a 25 pies de eslora con motor fuera de borda de 40-75 HP. La tripulación consta de 3-4 miembros, uno conduce la embarcación y los demás son buceadores. En algunas áreas de pesca, como Cabo Catoche y bancoi Chinchorro, operan como nodrizas embarcaciones medianas con motor estacionario, que poseen bodegas con hielo para permanecer hasta 2 semanas en las áreas de pesca.

230
Un buen número de embarcaciones de la zona norte, posee una compresora y mangueras de cerca de 100 m para el sistema hookah. En años recientes ha empezado a ser común el contar con aparatos GPS.
10.4 TENDENCIAS EN LAS CAPTURAS El método de captura empleado es el buceo (hookah y libre) y se utiliza un gancho o bichero. La captura de langosta en Yucatán se inicia en los años cincuentas en el Arrecife Alacranes; mientras que la pesquería en el resto de costa yucateca empieza los primeros años de los setentas cuando se fomenta la formación de Sociedades Cooperativas de Producción. Los registros de captura disponibles abarcan de 1976 a 1996 (Tabla 10.2 y Fig. 10.1).
Tabla 10.2 Historia de las capturas (kg de cola) de langosta en el estado de Yucatán Año Capturas
(kg de cola)
Año Capturas(kg de cola)
1976 34 363 1986 123 170 1977 64 390 1987 181 553 1978 104 323 1988 161 797 1979 94 937 1989 151 097 1980 89 200 1990 104 181 1981 84 447 1991 111 549 1982 97 810 1992 120 370 1983 26 953 1993 211 035 1984 118 447 1994 169 235 1985 107 507 1995 225 500
En Quintana Roo, de 1955 a 1988 las capturas tuvieron una sostenida tendencia ascendente, con fluctuaciones y con ciertos lapsos de aparente estabilidad, en 1988 se alcanzó un máximo histórico cercano a las 400 t de cola (Fig. 10.2). De 1989 en adelante ha habido un descenso marcado en las capturas, con niveles próximos a los obtenidos en los años 1970 cuando operaba un tercio de la flota actual (Fig. 10.2) Este comportamiento de las capturas anuales varía para las diferentes zonas de pesca. En la zona norte se observan las mayores variaciones y los mayores desembarques. En la zona centro y sur las capturas son más estables pero de menor magnitud. En el desarrollo de la pesquería de Quintana Roo se distinguen varios períodos. En los años 1940 y 1950 empieza una pesquería incipiente de langosta, en gran medida con fines de trueque entre localidades costeras, con embarcaciones pesqueras y/o mercados de países vecinos: Cuba y Belice. A finales de los 1950 se crean las primeras cooperativas pesqueras en Isla Mujeres (zona norte), Cozumel (zona central) e Xcalac (zona sur). En esta época la captura se hacía con chapingorro (“bully net”) y luego con buceo libre y lazo (“snare”). Las embarcaciones eran de madera y de vela, algunas con vivero empotrado en el casco, y pequeños botes o cayucos. La langosta era comercializada viva o cocida (entera y colas). Pese a que el desarrollo de la pesquería continuó en los años 1960, sin duda su despegue definitivo ocurrió en el lapso de 1970 a 1980 cuando tuvieron lugar una serie de cambios fundamentales como: introducción de lanchas de fibra de vidrio y motores fuera de borda, reemplazo del vivero por neveras de hielo. Esto último estuvo ligado a la disponibilidad de hielo y la consolidación del gancho-buceo como arte de pesca dominante. En esta misma

231
etapa tiene la lugar la introducción y afianzamiento del uso de buceo SCUBA, hookah y con redes en la zona norte; y el uso de hábitats artificiales en la zona central. El lapso de 1980 a 1988 es uno de crecimiento y expansión de áreas de pesca, lo que se tradujo en aumentos de esfuerzo. Finalmente, en 1988 el huracán Gilberto toca las costas norte y central de Quintana Roo que trae consigo la destrucción de artes de pesca y embarcaciones; además de afectar las áreas de pesca y de crianza, lo que posiblemente desata una serie de eventos que junto con el elevado nivel del esfuerzo ocasionó una baja abrupta de las capturas durante el lapso 1989-1996. Esta crisis en la producción coincide con cambios legales y de forma de explotación impulsados por el gobierno federal, como la nueva ley de pesca de 1992 y la aprobación de una norma oficial que propone la sustitución del gancho. Sin embargo, hay que también surgen alternativas promisorias como la comercialización de langosta viva, que implica eliminar al gancho y conlleva un incremento a valor unitario de la captura.
10.5 MEDIDAS DE REGULACIÓN Tanto en Yucatán como en Quintana Roo, una forma de regulación se lleva a cabo a través de permisos y concesiones otorgados a cooperativas de producción pesquera. Las medidas de regulación son una talla mínima legal de 14.5 cm de longitud abdominal o de cola, una veda de 4 meses (marzo 1-junio 30) y la prohibición de captura y comercialización de hembras ovígeras. Además existe una Norma la cual establece un límite de 3.5 años a partir de abril de 1995, para seguir utilizando el método de captura tradicional basado en el gancho y buceo. Las medidas de regulación vigentes para langosta Panulirus argus en México son las siguientes:
a) Veda de cuatro meses, de marzo 1 a junio 30.
b) Talla mínima legal (TL) de 145 mm de longitud abdominal (LA) u 80.5 mm LC. En las bahías de la Ascensión y Espíritu Santo, Q. Roo, desde 1979 rige una TL= 135 mm LA o 74 mm LC, formalizada apenas en 1997.
c) Prohibición de capturar hembras ovígeras. Hay obligación de devolver al mar, en las mejores condiciones de supervivencia posibles, a los ejemplares que no cumplan la talla mínima o langostas hembras en estado avanzado de madurez reproductiva.
d) La captura de langosta puede efectuarse mediante buceo (libre, SCUBA o Hookah) y casitas, con auxilio del gancho. Cualquier otro equipo o método de captura requiere autorización de la SEMARNAP.
Como importante elemento regulatorio, Panulirus argus fue especie reservada a cooperativas desde los 50’s hasta 1992 cuando se reformó la ley de pesca. A fines de los 70’s las cooperativas admitían con facilidad nuevos socios (Miller, 1982). En 1985 inicia una autoregulación, las cooperativas cierran el acceso a nuevos miembros, excepto a hijos de socios, y se estabilizó el esfuerzo de pesca. La organización en cooperativas ayuda al ordenamiento y control administrativo. Algunas tienen reglas internas más severas que la regulación oficial. Este comanejo, con participación de usuarios y auto- vigilancia, es ilustrado por la cooperativa “Pescadores de Vigía Chico”, con un esquema singular de organización alrededor de parcelas marinas en Bahía de la Ascensión (Miller, 1982; Seijo, 1993). La ley actual contempla participar a diferentes sectores; aunque hasta hoy sólo las cooperativas tienen concesión o permisos anuales. La distribución de zonas de pesca ha requerido convenios de colindancia entre cooperativas y algunas trabajan en forma mancomunada (Ríos et al., 1998).

232
10.6 BIOLOGÍA En México se han investigado distintos aspectos bio-ecológicos de la langosta Panulirus argus. Reproducción La talla de primera madurez en langostas varía geográficamente y por diferencias en presión de pesca. En Quintana Roo, Ramírez Estévez (1996) reporta que: a) en hembras, la talla de primera madurez cae en el intervalo 81-91 mm longitud de cefalotórax (LC) y L50 =101 mm LC; b) la reproducción ocurre todo el año, pero es más intensa en: primavera y verano-otoño; y c) la fecundidad media es de 592,300 huevecillos para hembras de 75 a 145 mm LC. Crecimiento El crecimiento en langostas varía entre estaciones y sexos; en adultos, los machos crecen más que las hembras. En Bahía de la Ascensión, juveniles y preadultos crecen rápido con alta variación individual (Lozano-Alvarez et al., 1991a). La talla legal, 74 mm LC, la alcanzan 1.7 años después de asentarse como puerulos (∼6mm LC); esto es, crecen a una tasa media de 0.77 mm LC /semana. Se han propuesto modelos de crecimiento alternativos basados en frecuencia de, e incremento por muda (Arce et al., 1991; Zetina y Ríos, en prensa); no obstante, numerosos estudios regionales han ajustado el modelo Von Bertalanffy a datos de frecuencia de talla obtenidos del muestreo de capturas. Migración En Isla Contoy y Cabo Catoche, norte de Quintana Roo, ocurren migraciones masivas de noviembre a febrero, en época de frentes fríos o “nortes” (Fuentes 1986). Durante estos eventos de "recalón” o “corrida" se obtienen altas capturas. Al crecer, las langostas se dirigen hacia aguas más profundas. En Bahía de la Ascensión, preadultos y juveniles se desplazan de áreas internas a las externas, hacia el arrecife (Lozano-Alvarez et al., 1991a). Predadores de langosta En áreas de crianza del norte de Quintana Roo, se registró la fauna asociada a hábitats artificiales (Sosa Cordero et al., 1995). Los predadores más frecuentes fueron meros, abadejos y mulcay (Serranidae); menos frecuentes fueron morenas (Muraenidae), peces de las familias Scorpaenidae, Synodontidae, Diodontidae, Ostracidae; así como rayas (Dasyatidae) y tiburón gata (Orectolodidae). Otros estudios Se evaluó la ocupación de casitas en varios tipos de fondo y el uso de minicasitas para el muestreo de juveniles (Arce et al., 1997; Sosa-Cordero et al., en prensa). Se estudió comportamiento de langosta en presencia de predadores (Lozano-Alvarez y Spanier, 1997) y experimentos de engorda de juveniles (Lozano-Alvarez 1996; Sosa-Cordero et al., 1995). Asimismo, se han estimado las relaciones morfométricas de Panulirus argus (Lozano-Alvarez et al., 1991; Zetina et al., 1996) y sus densidades en diferentes ambientes del arrecife Alacranes reconocibles por análisis de imágenes de satélite (Liceaga-Correa et al., en rev.). En Yucatán se investigó distribución y abundancia de langosta, con prospecciones por buceo que incluyeron registros de refugios naturales y asociaciones de langosta con grupos de peces (Ríos et al., en rev.).

233
Investigaciones en proceso En Yucatán en las investigaciones sobre la pesquería de langosta participan dos instituciones, el Instituto Nacional de la Pesca/CRIP-Yucalpetén y el CINVESTAV/IPN- Unidad Mérida, y se cubren los aspectos siguientes: • Prospecciones en las cuatro zonas de pesca.
• Monitoreo esfuerzo, captura, composición de la captura por talla, peso, sexo, y variables económicas en toda la costa (1987-96). Monitoreo sobre categorías de tallas comerciales (1992-96).
• Evaluación de refugios artificiales y trampas en las zonas oriente, centro y poniente.
En Quintana Roo, en las investigaciones sobre la pesquería de langosta participan tres instituciones, el Instituto Nacional de la Pesca/CRIP-Puerto Morelos, UNAM/ICMyL-Estación de Puerto Morelos, El Colegio de la Frontera Sur-Unidad Chetumal, que cubren los temas siguientes: • Evaluación del recurso.
• Monitoreo de capturas, esfuerzo, longitudes y sexo en la zona Norte y Central (1982-96) y Sur (1990-93)de Quintana Roo.
• Diseño de hábitats artificiales
• Reclutamiento de juveniles a través de refugios artificiales
• Pronóstico: Desarrollo del Indices de Referencia Estacional.
• Asentamiento de puerulos y determinación de áreas de asentamiento.
Métodos de pronóstico Asentamiento puerulos colectores tipo GUSI (UNAM). Bahía Ascensión (1987-97). Estudios comparativos entre áreas de otros países Trabajos conjuntos Cuba-Brasil. Inicio de trabajo conjunto México-Costa Rica. Trabajos basados en las capturas y datos independientes (INP, ECOSUR, CINVESTAV y UNAM) El listado de los trabajos que a continuación se presentan no es exhaustivo; sino que trata de exponer los principales temas que han sido abordados tanto en Yucatán como en Quintana Roo. • Analisis bioeconómico de la pesquería (1991).
• Evaluación de casitas cubanas en la costa oriente de Yucatán (1994).
• Análisis del esfuerzo en la pesquería de Yucatán (1996).
• Estimación de las densidades de langosta en el área central del A. Alacranes (1997).
• Evaluación de la captura de langosta con refugios artificiales (1997).
• Parámetros de crecimiento para la curva de crecimiento de VB.
• Dinámica poblacional de juveniles de langosta en Cayos en el norte de Quintana Roo, mediante modelos de marcado-recaptura.
• Reclutamiento de juveniles de langosta en el norte de Quintana Roo.
234
• Análisis de la pesquería de langosta en RB Sian Ka’ an.
• Densidad de langostas en el medio natural (arrecife) y en hábitats artificiales.
• Introducción de hábitats artificiales en la pesquería de langosta del norte de Quintana Roo.
10.7 EVALUACIONES Y METODOS Yucatán • Estimación del tamaño de la población de langosta. Se han aplicado los siguientes
modelos: a) Decaimiento, b) Rendimiento excedente, c) Análisis de cohortes por longitudes.
• Estimación de biomasa y tasa de explotación con un modelo de estructura de edades.
• Estimación de biomasa y mortalidad por pesca. Modelo: De diferencia con retraso.
Quintana Roo • Estimaciones de Z, F y M. Métodos: Beverton and Holt (1956) y Basson (1991).
• Evaluación de la pesquería de langosta en Banco Chinchorro mediante análisis de tallas. Y’/R vs Tasa de explotación
• La pesquería de langosta en Bahía Espíritu Santo: un estudio descriptivo. Cpue y variación con meses tipos de hábitat (natural y artificial).
• Análisis de la pesquería de langosta mediante modelos de producción (Fox) captura vs esfuerzo nominal (1966-1991).
10.8 DATOS DISPONIBLES Y DESARROLLOS RECENTES Datos dependientes de la pesquería Existen registros de capturas anuales desde 1955 para Quintana Roo y desde 1975 para Yucatán. En Quintana Roo hay registros de índices gruesos de esfuerzo, número de embarcaciones y pescadores, desde 1966. En Isla Mujeres, desde 1982 hay muestreo continuo de la captura, esfuerzo y estructura por tallas-sexos de la captura (González Cano, 1991). Se cuenta con datos de esfuerzo diario en número de viajes, desde 1983, para algunas cooperativas de las tres zonas; con menos datos para el sur (Sosa Cordero et al., 1993). También hay datos de captura, esfuerzo y estructura de tallas-sexo de capturas mensuales 1990-1993 en Banco Chinchorro y Espíritu Santo (Sosa Cordero et al., 1993). En Yucatán hay datos de cpue diaria para el área oriente, de 1989 a 1997. También se dispone de datos 1987-1997 de estructura de tallas capturadas y captura por embarcación, en muestreos mensuales de las diferentes áreas de pesca. Existen datos de composición de la captura por categoría comercial 1992-1996; y composición por categoría comercial de exportación 1996-1997. Datos independientes de la pesquería De la pesca exploratoria con nasas, se tienen datos de captura, esfuerzo y composición por tallas de Puerto Morelos y Bahía de la Ascensión (Lozano-Alvarez et al., 1991b; 1993). Recientemente, el gobierno estatal y FAO, apoyaron campañas de pesca exploratoria en arrecifes selectos del Banco de Campeche (Sosa Cordero et al., no publicado).

235
En 1987 inició en Bahía de la Ascensión el monitoreo de puerulos en colectores modificados del tipo australiano (Briones-Fourzan y Gutiérrez Carbonell, 1992). Del asentamiento de puerulos, 1987-1992 en una estación selecta (Briones-Fourzán, 1994) se observa:
a) pulsos entre cuarto menguante y luna nueva;
b) un pico consistente en otoño;
c) el índice anual promedio sigue tendencia creciente de 1987 a 1992. En el norte de Quintana Roo, un índice de reclutamiento, abundancia de juveniles en minicasitas, fue mayor en primavera (marzo-junio) que en otoño-invierno (septiembre a diciembre) (Arce et al., 1997). En la costa oriente de Yucatán, se investigó el asentamiento de puerulos con colectores similares al usado en Quintana Roo, y se caracterizó la estacionalidad y efecto del hábitat (Cabrera, M. com. pers). Existen estimaciones del stock en el arrecife Alacranes y la costa, con base en prospecciones por buceo; y uso de estimadores que aplican simulación Monte Carlo e incorporan incertidumbre en las estimaciones previas al inicio de la temporada de pesca 1997-1998. Datos socio-económicos En 1987-1988 se efectuó un estudio bioeconómico comparativo en siete puertos de la península, se registraron datos de costos y retornos totales asociados a los artes principales (Seijo et al., 1991). En Yucatán se han efectuado encuestas, al momento del desembarque, para registrar datos de costos de operación. También existe análisis de rentabilidad de las unidades de producción en la pesquería. Y se tienen datos del número de accidentes de buceo en las temporadas 1992-1997.
10.9 IMPORTANTES DESARROLLOS EN LA PESQUERIA Se inició la discusión de la propuesta de modificar la norma oficial mexicana para reducir la talla mínima legal vigente, se menciona la meta de 135 mm LA o 74 mm LC para toda la región. También se propone tratar el asunto del desembarque de colas de langosta en lugar de langosta entera.
10.10 PROBLEMATICA ACTUAL DE LA PESQUERIA Yucatán • La captación de información captura-esfuerzo, tallas y datos biológicos. Estos
programas tiene un costo relativamente alto por lo que se requieren de recursos para asegurar su continuidad.
• Los costos ocasionados por accidentes de buceo (Hookah).
• Se requiere encontrar salidas consensadas al conflicto entre conservación-explotación en el Parque Marino Nacional del Arrecife Alacranes.
Quintana Roo • Llevar a cabo la evaluación del recurso con alcance estatal o por zonas de pesca.
• Es necesario revisar las medidas de regulación ante nivel actual de explotación.

236
• (Talla mínima legal, impacto de artes y nivel de esfuerzo)
• Concluir la asignación de concesiones para la captura.
• Atención a los problemas salud asociados al buceo SCUBA y Hookah en la zona norte.
• Analizar las consecuencias y alternativas frente a la inminente sustitución del gancho en la captura de langosta.
• Conviene fortalecer o implementar programas de concientización para el respeto a medidas regulatorias vigentes; así como su vigilancia y sanción.
• Es evidente que varios de los problemas actuales de la pesquería de langosta son comunes para ambos estados; de ahí que demandan atención y esfuerzo en el futuro cercano.
10.11 ESTADO DE LOS RECURSOS Yucatán Las evaluaciones bajo diferentes modelos indican que el recurso se encuentra en un nivel de explotación adecuado e incluso se podría incrementar el esfuerzo en una de las zonas de pesca. En Yucatán se aplicaron cinco modelos para obtener aproximaciones del tamaño del efectivo y estado de explotación. Estos modelos son:
a) de remoción, en la costa oriente (Zetina y Ríos, 1997);
b) dinámico, de producción;
c) análisis de cohortes por tallas;
d) de diferencia con retraso, y
e) estructura por edades (Zetina y Ríos, 1997). Los métodos de estimación, con excepción del análisis de cohortes se basan en estadística bayesiana y métodos de cómputo intensivo. Los diferentes modelos arrojan resultados heterogéneos, sin embargo, los modelos a), b) y e) hacen estimaciones coincidentes de biomasa y tasa de explotación. En conjunto, los resultados sugieren que el nivel más probable de esta pesquería está por debajo del RMS, con tasa de explotación menor al 40% de la biomasa reproductora y mortalidad por pesca actual menor a F0.1. Sin embargo, los resultados se refieren a la biomasa poblacional como un todo, sin considerar la distribución del esfuerzo y distribución espacial del stock. Según Ríos et al. (en prensa) para la temporada 1996 era posible aumentar el esfuerzo en el poniente; en cambio, la costa oriente ya está sometida a un régimen intenso de explotación. Quintana Roo Para Quintana Roo, se ajustó un modelo de producción estático de Fox, a la captura y esfuerzo anual 1966-1990. Se obtuvo Rendimiento Máximo Sostenible, RMS= 990 t peso entero y esfuerzo óptimo de 357 embarcaciones (Sosa Cordero et al., 1993). Según el modelo, el recurso entró en fase inicial de sobrexplotación entre 1980 y 1984; período con captura media de 990 t peso entero y esfuerzo creciente: pasó de 313 a 489 embarcaciones (Fig. 10.2). La caída de las capturas desde 1989, se explica por el elevado esfuerzo previo y el efecto del Gilberto. Esto se sostiene al ajustar, con el paquete CEDA, al mismo grupo de datos, un

237
modelo dinámico de Fox con retraso L=4 (Sosa Cordero, en prep.). Se estimaron puntos de referencia, parámetros críticos e intervalos de confianza 95% (bootstrap), con RMS= 878 t (849, 915), esfuerzo óptimo de 319 embarcaciones; capacidad de carga K= 3,174 t (3048, 3523) peso entero y coeficiente de capturabilidad q= 0.00236 (0.00195 , 0.00284). La explotación del recurso se encuentra a su mayor capacidad y lo recomendable sería eficientizar la pesquería. Esto último con atención al esfuerzo, la modalidad de explotación, operaciones de pesca (Bahía Espíritu Santo y Banco Chinchorro) y el impacto de las diferentes artes de pesca.

238
11 INFORME DE NICARAGUA SOBRE LA LANGOSTA DEL CARIBE1 S. Martínez
11.1 INTRODUCCION El Atlántico Centro-occidental sostiene una estructura productiva muy importante, en la que el sector pesquero es uno de los más rentables y dinámicos; esto ha quedado demostrado a través de las cifras de desembarques históricos, generación de empleos y captación de divisas de la región. Sin embargo, el conocimiento y aprovechamiento de los recursos pesqueros en los diferentes países varía considerablemente, ya que mientras en unos se puede hablar de pesquerías sobre explotadas, en otros todavía existen inventarios vírgenes que pueden permitir la diversificación pesquera de estos recursos inexplotados; Nicaragua pertenece a este último grupo de países, en que el aprovechamiento de los recursos pesqueros ha estado orientado a la extracción de camarones y langostas, siendo esta última la que representa el mayor valor de las exportaciones tradicionales, y sobre la cual recae una gran responsabilidad en cuanto a su aprovechamiento y manejo, debido a que dicha actividad está rodeada de factores adversos como la pesca ilegal, trasbordo en alta mar y otros relativos a la dificultad de conocer el verdadero esfuerzo de pesca que se ejerce sobre la pesquería.
11.2 DESCRIPCION DE LA PESQUERIA Historia Las pesquerías de langostas han sobrevivido por varias décadas, producto de la constancia de los habitantes del Caribe Nicaragüense y a los altos precios del mercado internacional. Desde siempre, las capturas de langostas se hacían por medio del buceo a pulmón, las cuales eran comercializadas localmente o para el mercado interno del país (específicamente a la capital). Con la entrada en funcionamiento de varias industrias, los métodos y artes de pesca fueron evolucionando hasta el estado actual, en el que se hace uso de equipos eléctricos y de refrigeración para el mantenimiento de las capturas. Los primeros registros de compra de producto para la exportación se dieron en los años 50, pero es a partir de los años 60 que se inicia en forma sistemática el acopio y exportación de langosta, especialmente para el mercado Americano. También a finales de los 60 se ejecuta el Proyecto de Desarrollo Pesquero PNUD/FAO, en el cual se hicieron varios cruceros de exploración en los que se determinó con mayor precisión la abundancia relativa y la distribución de la langosta del Caribe Centroamericano (Giudicelli, 1971), lo cual permitió a partir de ese momento, realizar una pesca comercial dirigida exclusivamente a la langosta, por medio de nasas y buzos. En la siguiente década (específicamente en 1973), debido al alto precio del combustible y al excesivo número de unidades camaroneras pescando en el Caribe, se tomó la decisión de sacar de la pesquería de camarones una cantidad de unidades de pesca y dedicarlas a la captura de langosta por medio de nasas. Esto inició realmente la flota langostera nacional que, para 1978 alcanzó la cifra de 100 embarcaciones. Durante ese mismo período de tiempo se crearon varias empresas procesadoras de langosta, las cuales acopiaban producto proveniente de la flota industrial y artesanal, las cuales representaban una actividad rentable que incidía bastante desde el punto de vista económico sobre la población pesquera del Caribe. A partir de 1979, debido a los problemas políticos del país, la flota se redujo en forma notable, por lo cual se vieron afectadas las capturas, habiendo decaído al extremo que en 1986 trabajaron solamente 9 embarcaciones. En la década actual, se ha mejorado el desempeño de la flota y por ende de las capturas, habiéndose logrado una recuperación en el sentido histórico y económico de la pesquería.
1 Presentado en Belize

239
Fig. 11.1 Arrecifes del Caribe Nicaragüense Descripción de la actividad pesquera: grupo de usuarios, flotas, artes, empleo, áreas de pesca, lugares de desembarques, capturas/desembarques, capacidad de procesamiento. En la Tabla 11.1 se presentan los datos de captura y esfuerzo de la pesquería de langosta para el período 1964-96, en los que se hace una separación entre las capturas industriales y las artesanales. Tal como se mencionó anteriormente, hasta 1972 la actividad puede ser considerada como modesta, después de lo cual se llegó a 2,8 millones de libras de cola (1.300t tails) en 1978, decreciendo en los años subsiguientes, y alcanzando el máximo de 3,02 millones de libras de cola (1.373t tails) en 1995. El comportamiento de los años 80 se debió fundamentalemente a los problemas políticos, lo cual redujo sensiblemanete la flota pesquera. Durante 1996 las capturas decrecierón levemente, alcanzando las cifras de 2,7 millones de libras de cola, de las cuales el 46,17% fué producto de la pesca artesanal, el 24,8% de la flota industrial extranjera y el 29,63% por la flota industrial nacional y un 4,07% de fauna acompañante del camarón. Es preciso hacer notar que, durante 1995, la actividad extractiva de los buzos de Puerto Cabezas produjo 831 mil libras de colas de langosta (378t tails), la pesca artesanal de Corn Island 895 mil libras de cola (407t tails) y en Bluefields se desembarcaron 123 mil libras de cola (56t tails), con lo cual se demuestra que la pesca de pequeña escala es más productiva que la industrial (Martínez, 1996), especialmente porque se realiza con embarcaciones de menor consumo de combustible y los promontorios y arreifes más cercanos a la costa (Fig.11.1).

240
Tabla 11.1 Capturas, esfuerzo y CPUE de langosta en Nicaragua, 1964-96 CAPTURAS, COLAS EN LBS ESFUERZO CPUE Año Pesca Industrial Artesanal Otros Total No. de Barcos Industrial nacional extranjera nac. extr. total lbs/barco1964 251,000 1965 366,000 1966 331,000 1967 405,000 1968 368,000 1969 356,000 1970 326,000 108,000 434,000 65 65 5,0151971 206,000 68,000 274,000 53 53 3,8871972 274,368 99,000 373,368 46 46 5,9651973 340,416 166,000 506,416 47 47 7,2431974 661,676 290,000 951,676 52 52 12,7251975 1,199,130 633,000 1,832,130 96 96 12,4911976 1,741,516 507,000 2,248,516 99 99 17,5911977 2,157,587 362,000 2,519,587 96 96 22,4751978 2,349,290 510,000 2,859,290 100 100 23,4931979 1,575,237 385,000 1,960,237 78 78 20,1951980 1,375,100 261,000 1,636,100 55 55 25,0021981 595,000 396,000 991,000 14 14 42,5001982 324,000 587,000 911,000 15 15 21,6001983 318,199 650,000 968,199 10 10 31,8201984 317,214 576,000 893,214 9 9 35,2461985 334,159 390,251 724,410 10 10 33,4161986 197,779 373,803 571,582 9 9 21,9751987 203,310 26,800 174,300 404,410 8 7 15 15,3411988 192,420 336,008 223,033 751,461 11 8 19 27,8121989 360,807 256,938 379,071 25,085 1,021,901 19 5 24 25,7391990 299,344 175,386 168,607 20,498 663,835 22 5 27 17,5831991 280,278 194,219 393,598 42,471 910,566 21 7 28 16,9461992 445,317 542,974 716,107 1,704,398 37 21 58 17,0401993 386,000 505,000 679,000 1,570,000 35 25 60 14,8501994 546,520 628,541 839,328 2,014,389 39 20 59 19,9161995 767,711 905,737 1,358,933 3,032,381 38 19 57 29,3591996 801,276 673,522 1,246,579 11,657 2,733,034 43 16 59 24,997Nota: de 1964 a 1969 no se dispone del desglose de pesca .industrial y pesca artesanal.

241
Durante 1996 el número promedio de barcos industriales operando fué de 59 por mes, de los cuales 43 fueron nacionales y 16 extranjeros. En términos generales, la pesca la realizan tres tipos de embarcaciones: • Pangas de fibra de vidrio o de madera de menos de 10 m con motores fuera de borda
de 45 hp, las que son operadas en áreas cercanas a los centros de acopio, y que manejan un número reducido de nasas que son revisadas diariamente para la comercialización del producto.
• Pequeños botes de motor estacionario entre 10 m y 15 m de eslora, equipadas con bodega para hielo, compresor y tanques de buceo, con autonomía de más de una semana y que actúan como nodrizas de canoas de buzos que sacan el producto y lo almacenan es sus bodegas. Normalmente cada barco atiende unos 20 cayucos (canoas hechas de troncos ahuecados), operados por dos buzos en cada uno, los que salen a pescar temprano por la mañana y regresan después del medio día. El sistema que utilizan los buzos es un gancho que permite extraer a las langostas de los sitios de refugio en que se encuentran; esto obviamente ocasiona la captura de ejemplares ilegales.
• Barcos de más de 15 m de eslora con bodegas de hielo o refrigeradas, las cuales operan entre 600 y 2.500 nasas, realizando viajes de varias semanas, en dependencia de las características propias de la embarcación; la mayoría de estas embarcaciones son de bandera extranjera. Las nasas (trampas) son construidas de listones de madera, con un matadero o embudo del mismo material y con lastre en el fondo. Una mínima cantidad de langostas es capturada por los buques camaroneros como fauna de acompañamiento, pero no representa cifras significativas dentro de las estadísticas pesqueras del recurso.
Conflictos entre usuarios: pescadores artesanales Vs. industriales; naseros Vs. buzos El principal conflicto que genera la actividad de pesca de langosta es con respecto a la metodología; mientras que los pescadores con nasas operan más en la parte sur del Caribe, los buzos operan en el Norte, en especial en las zonas aledañas a Cayos Misquitos, aunque recientemente, por medio de un financiamiento para la adquisición de medios de pesca, se registra una pequeña actividad nasera en embarcaciones artesanales en el Norte. Sin embargo, todos se culpan de la depredación de las langostas por sus propios medios de pesca, incidiendo a veces sobre las capturas en forma directa (revisando nasas) cuando se traslapan las actividades de ambos sistemas. Ocasionalmente, se presentan problemas con los barcos camaroneros que faenan muy cerca de los sitios en donde se encuentran las nasas, pues los pescadores se quejan que éstos arrastran los equipos, perdiendo así las capturas y aperos.
11.3 UNIDAD DE ORDENACION Especies La langosta común Panulirus argus (Latreille, 1804), es la única especie de langosta espinosa que se captura en las aguas Nicaragüenses. La langosta espinosa del Caribe se presenta desde Estados Unidos y Bahamas hasta Brasil, incluyendo las islas del Caribe (Cruz, 1987). Descripción del entorno El Caribe Nicaragüense representa la mayor extensión de agua del Istmo Centroamericano, con más de 500 km de costas y un área entre la costa y el talud de más de 55.000 km2, en los que sobresalen numerosos cayos, bancos e islas, producto de una variada topografía del fondo marino, compuesto en la zona adyacente a la costa por limo arcilloso, de arena y lodo, arena con esponjas, formaciones de corales y arrecifes (Giudicelli, 1971). La Figura 11.2 muestra los tipos de fondos que predominan en el Caribe Nicaragüense, destacando los accidentes geográficos antes descritos.

242
Anisimov (1986) describe que la masa de agua se encuentra bajo la influencia de los alisios, predominando vientos templados del noreste y del este, generalmente con tiempo anticiclónico, con cielo normalmente semidespejado y precipitaciones que varían entre 3.000 y 5.000 mm/año. La diferencia de la temperatura superficial entre el período de verano e invierno no excede los 2 0C, siendo de 28,5 0C y 27.0 oC respectivamente. Igualmente, la diferencia de salinidad en la superficie no supera la cifra de 0.5 0/00 (entre 35,8 y 36,0 0/00); a profundidades de 75 m no existe diferencia de salinidad durante las épocas del año, aunque a la misma profundidad los valores de temperatura varían hasta 4 oC. Carleton (1979), manifiesta que el patrón de corrientes coincide en términos generales con la Corriente del Golfo, aunque a nivel del vértice noreste de la plataforma, al tropezar con el banco de Mosquitos hace un giro hacia la costa y hacia abajo (hacia el sur del talud), produciendo con la corriente costera una circulación continua en el sentido contrario de las manecillas del reloj, con mayor fuerza durante los últimos meses del año.
Fig. 11.2 Fondos duros en la Plataforma continental Atlántica de Nicaragua
(modificata de Yesaki y Giudicelli, 1971) Hábitat y comportamiento La langosta espinosa del Caribe tiende a vivir en áreas rocosas, normalmente debajo de ellas o en pequeños accidentes de las rocas que les permite su refugio (Cruz, 1987). Se ha constatado que los juveniles tienden a agruparse en estos sitios, aunque los mayores prefieren permanecer solos. También se han encontrado en las zonas de praderas marina (Thalasia sp.), y las formas larvarias dentro de abanicos de mar (Gorgónidos) y otras formas típicas del arrecife (observación personal). En el Caribe Nicaragüense, las langostas siguen el patrón de otras áreas en cuanto a su distribución batimétrica: las juveniles se encuentran siempre en aguas someras y las adultas en aguas más profundas; esto, sumado al carácter variable de su coloración, ha dado pie a la creencia de que existen varias especies (Campos, 1987). Dentro del ecosistema, la langosta interactúa con las especies del arrecife, en especial aquellas que compiten en sus hábitos alimenticios, sirviendo de alimento a otros depredadores como pargos, tiburones, pulpos, etc. (García, 1980; Marx, 1986).

243
Fig.11.3 Rendimientos promedios por zonas de pesca de la langosta Panulirus argus
para el período Julio 89/Junio 90 Distribución, migración y estructura poblacional En Nicaragua la langosta espinoza del Caribe se encuentra distribuida en toda la plataforma continental, con mayor abundancia en la zona de Cayos Misquitos, Corn Island y los principales promontorios y fondos rocosos y arrecifes de coral, ecosistemas que se encuentran abundantemente a lo largo del Caribe Nicaragüense, y que son considerados aptos para la pesca de langostas. Aún no se han delimitado las mayores zonas de asentamiento de postlarvas, pero dadas las características geográficas del área las estadísticas de captura, se puede suponer que se distribuyan uniformemente en el sistema. Ehrhardt (1994) ha sugerido que las larvas de langostas desovadas en Nicaragua y Honduras pueden alcanzar las costas de Norte América, lo cual puede ser sustentado (pero no probado) si se correlacionan los cambios observados de los desembarques de Florida, con los desembarques combinados de Honduras y Nicaragua; esto podría implicar que la pesquería de langostas de la Florida sea significativamente dependiente de la producción de larvas de las poblaciones de langostas de Nicaragua y Honduras (Fig.11.1).

244
Fig. 11.4 Relation entre deviaciones anuales de los desembarques de Panulirus argus en Nicaragua and Honduras (1975-89) y deviaciones similares en los desembarques
de langostas en La Florida occidental un ano despues (1976-90). Las deviaciones son expresadas en toneladas relativas a los desembarques promedios de los respectivos
periodos de 15 anos También se mencionó antes que, los juveniles se presentan con mayor frecuencia en aguas someras, cercanas a los promontorios rocosos, cayos y sistemas lagunares coralinos, mientras los adultos tienden a alejarse de estas zonas prefiriendo mayores profundidades en áreas rocosas y aledañas. En Nicaragua no se han realizado estudios sobre las migraciones de las langostas, pero siendo ésta de hábitos tan marcados, no debe descartarse la idea de que sucedan con la misma frecuencia que han sido descritas por otros autores en otros países. Ehrhardt (1994), manifiesta que "los altos desembarques de langosta en Costa Rica, están precedidos de altos desembarques en Nicaragua pero un año antes", expresando también que el carácter migratorio de la langosta en Costa Rica ha sido corroborado por los pescadores, quienes afirman que las "corridas" se dan con un pico menor en septiembre y un pico mayor en diciembre y enero, por lo que consecuentemente, "la pesquería de langosta de Costa Rica parece estar basada en una población no residente (es decir, migratoria)" (Fig. 11.2).
11.4 BIOLOGÍA A pesar de que la langosta se considera comedora de carroña, se ha demostrado que prefiere alimento vivo, en especial moluscos, gusanos, pequeños peces y otros crustáceos (García, 1980), por lo que se presume que la carnada utilizada más frecuentemente (trozos de cuero salado), no ejerce una verdadera atracción sobre el animal, asumiendo que entra en la nasa más como un mecanismo de refugio que por alimentación. El ciclo vital de la langosta espinosa del caribe ha sido ampliamente descrito en todas sus fases (Riveros, 1972; Olsen, 1975; Bowen, 1980; García, 1980; Arostegui, 1982; Marx, 1986; Cruz, 1987) iniciando con el apareamiento, durante el cual el macho deposita el saco espermático en la hembra, luego el mecanismo de ésta última mediante el cual rasca la chapa y origina la

245
Fig. 11.5 Desembarques de langosta (toneladas de colas) en Costa Rica en el año t + 1 ploteados contra los desembarques de langosta (toneladas de colas) en Nicaragua en
el año t para los años 1962-69
Fig. 11.6 Ciclo vital de la langosta Panuliris argus (Cruz, 1987)

246
Fig. 11.7 Comportamiento biológico de P. argus
fecundación de los huevos desovados, los cuales se adhieren a los pleópodos abdominales de la hembra hasta su eclosión en tres o cuatro semanas. Las larvas filosomas derivan en el mar, sucediéndose cambios y transformaciones larvarias sucesivas durante seis a nueve meses, hasta el momento del asentamiento en las zonas cercanas a la costa, entre algas coralinas, gorgónidos y raíces de mangle (Marx, 1986), tal como aparecen en la Fig. 11.6 (Cruz, 1987). En su etapa juvenil, los cambios de peso y longitud por muda siguen patrones conocidos (García, 1980; Cruz, 1987), hasta llegar a la etapa productiva o talla de primera maduración, que en el caso de la langosta de Nicaragua ha resultado ser de 23,5 cm de longitud total antenular, equivalente a 5 oz. de cola, lo cual se ha establecido como talla mínima de captura (Villalobos, 1985). Se ha observado que, la reproducción de la langosta en Nicaragua tiene lugar durante todo el año, pero se ha comprobado una mayor actividad durante los meses de marzo, abril y mayo, así como otro pico en setiembre y octubre (ver Fig. 11.7). Las zonas con mayor índice de hembras en estado reproductivo se han identificado en los cuadrantes cercanos al talud continental, lo que reitera el patrón migratorio de la especie a aguas más profundas para el desove, tal como lo describe Marx (1986).
11.5 SITUACIÓN ACTUAL Y ABUNDANCIA El primer esfuerzo por valorar la pesquería de langosta en Nicaragua se realizó en 1977, concluyéndose que se encontraba subexplotada pero con una fuerte tendencia a crecer en forma muy rápida (INFONAC, 1977), al grado que durante ese mismo año se hicieron intentos por determinar el verdadero esfuerzo pesquero ejercido por las nasas, encontrándose una alta correlación entre el tamaño de la eslora del barco y el número de nasas que puede acarrear (Herrnkind, 1977). Estudios posteriores demostraron que, a pesar de las capturas de 1978 de casi 3,0 millones de libras de cola, la tendencia positiva del coeficiente de correlación no permite hablar de un máximo rendimiento sostenible del recurso en esa cifra (Arostegui, 1982). Esto había sido descrito anteriormente por Villegas & Charlier (1980), durante una misión de FAO tendiente al conocimiento de las pesquerías de camarón y langostas, quienes concluyeron

247
que el recurso aun no mostraba signos de sobre explotación, pero que era posible que la pesquería se estuviera acercando a un máximo. Por el contrario, en vista de la reducción de flota durante los años 80, se ha tomaio esa cifra (3,0 millones de libras de cola) como un parámetro de captura óptima para regular el esfuerzo de pesca óptimo en unas 65 embarcaciones naseras, que sumadas al esfuerzo de los pescadores artesanales y buzos, equivaldrían a un esfuerzo total de unas 100 embarcaciones (Martínez, 1993). Esto se ha mantenido durante los últimos años debido a la fuerte presión que ejercen los pescadores artesanales y los buzos sobre el recurso. Sumado a esto, se desconocen las verdaderas cifras totales de captura, ya que no se contabilizan la capturas ilegales de barcos piratas, ni el esfuerzo de los mismos; se presume que las capturas por pesca ilegal puede ser igual o muy cercana a los desembarques de la flota legalizada. Un estudio de la Dra. Mirna Marín (citada en Ehrhardt, 1994) manifiesta que el aumento de las capturas de 1983 a 1988 (pasando de 1.313t a 1.981t), pueden ser atribuidas a la reducción de la explotación de langostas en Nicaragua, y a una significativa pesca ilegal durante esos años; por lo tanto, una fracción significativa de los desembarques de langosta en Honduras podrían haber sido originados en Nicaragua. Se ha contemplado realizar estudios tendientes a conocer el reclutamiento de juveniles al sistema, así como las principales zonas de reproducción y criaderos. Se planean estudios para mejorar el manejo de la pesquería y se hacen intentos por conocer la suma de esfuerzo pesquero ejercido por todos los medios.
11.6 CONDICIONES PROBABLES FUTURAS Estudios reciente (Ehrhardt & Castaño, 1995) han señalado que puede haber una biomasa de langostas muy superior a la que se había propuesto en ocasiones anteriores, lo cual podría abrir una puerta a la posibilidad de expandir un poco más la pesquería. Esto en principio es aceptado por el Gobierno, pero no así por los pescadores que han mantenido su tesis de que la pesquería de langosta está al borde de la sobre explotación, a pesar que las investigaciones recientes parecen demostrar todo lo contrario (ver Fig. 5).
Fig. 11.8 Tendencia de los desembarques/mes de langostas y la biomasa existente en dichos períodos (Ehrhardt - Castaño, 1995)

248
11.7 CARACTERISTICAS ECONOMICAS DE LA PESQUERIA Sector pesquero local : valor de la captura ex-barco, estadísticas económicas de la flota comercial; ingreso bruto, inversión, costos y entradas, medidas del esfuerzo, eficiencia y productividad Las diferentes consultas realizadas al respecto indican que los valores de las capturas ex-barco varían considerablemente, variando entre US$ 9,50/lb (US$ 20,9/kg) hasta US$ 11,00/lb (US$ 24,2/kg), lo cual en todo caso sería una contradicción si tomamos como referencia el precio de exportación durante 1994 de US$ 10,10 /lb (US$ 22,22/kg). Sin embargo, el registro del precio internacional (a noviembre de 1994) presentaba un máximo de US$ 15,25/lb (US$ 33,55/kg) y un mínimo de US$ 13,75/lb (US$ 30,25/kg), para un promedio de US$ 14,50/lb (US$ 31,90/kg) (URNER BARRY). Las estadísticas económicas de la flota son bastante confidenciales y no se manejan a nivel de las instituciones del estado, ya que en la mayoría de los casos son de empresas mixtas. En relación con los nacionales, los datos son muy distorsionados, ya que las embarcaciones se encuentran en muy mal estado y la mayoría de los ingresos se usan para reparaciones y otros gastos de mantenimiento. Comercio internacional: destino del producto, arreglos de negocios internacionales propuestos y existentes que afecten al recurso En la Tabla 2 se presentan los valores de las exportaciones de langostas, los cuales en términos generales tiene que ver con las variaciones internacionales, tomando en consideración que el mercado tradicional ha sido Estados Unidos de América, con excepción del período 1983-89. Para el año 1996 se registró una exportación de 3,08 millones de libras de cola con un valor de US$ 37,57 millones. Es posible afirmar que en términos de valor, la pesquería de langosta es la más importante del país. Sin embargo, el sector pesquero no representa un porcentaje significativo dentro del PIB, habiendo alcanzado la cifra máxima de 0,96 en el año 1978, pero manteniendo un promedio de 0,60. Negocios, mercados y organizaciones relacionadas con la pesca: relación entre los sectores de recolección, compra-venta, y procesamiento; cooperativas o asociaciones pesqueras involucradas en la pesca; organizaciones laborales relacionadas con la recolección y procesamiento. El sector pesquero Nicaragüense funciona en la mayoría de los casos como empresas conjuntas que desarrollan labores de extracción, procesamiento y comercialización, todo en una sola unidad productiva y empresarial. Asimismo, existe una sola asociación de pesca industrial (CAPENIC) y una sola confederación de pescadores artesanales (FENICPESCA), que representa a sus respectivos gremios, tanto en las labores de recolección, como en las de compra-venta y procesamiento; en otras palabras, no existen empresas específicas para cada uno de los pasos intermedios desde la captura hasta la comercialización, como no sean los intermediarios de precios que no pueden considerarse empresas. Inversión extranjera en los sectores locales Existe una fuerte inversión extranjera en las pesquerías de langostas, ya que como se mencionó anteriormente, existen empresas nacionales y extranjeras que han desarrollado labores de extracción, procesamiento y comercialización bajo condiciones administrativas y financieras propias, trabajando conjuntamente en la actividad. Estructura social y cultural del pescador local y de sus comunidades La región del Caribe Nicaragüense esta conformada por diferentes étnias, entre las que sobresalen los Misquitos, Sumos, Ramas, Garífonas y Creoles, en una rica mezcla de nativos con negros y cada vez más, con ladinos del Pacífico. Sin embargo, la mayoría de los pescadores de langostas son Misquitos, los cuales componen una étnia con fuertes raíces pesqueras y una tradición ancestral de vida en el mar. De la misma forma, la mayoría de los

249
que ejercen la actividad pesquera a nivel de marinos, ayudantes y aprendices, son de extracción social muy humilde, sin escolaridad y problemas de alcoholismo, que sumado a los problemas que genera la actividad del buceo por barotraumas y otros similares, hacen de esta población una de las más sufridas del gremio.
11.8 ORDENAMIENTO DE LA PESQUERÍA Instituciones responsables: actividades específicas, personal asignado, presupuesto asignado a las actividades específicas. Por mandato del Decreto Presidencial 16-93, de Febrero del 93, se creó la Dirección de Pesca y Acuicultura del (MEDEPESCA), adscrita al Ministerio de Economía y Desarrollo (MEDE), la cual es la institución responsable de la actividad pesquera y acuícola a nivel nacional. El carácter de dicha institución es el de fomentar la actividad del sub-sector, así como de normarlo y administrar los recursos pesqueros, mediante un sistema de regulación y control que cubre todo el territorio nacional. Legislación vigente; resultados obtenidos La legislación de pesca vigente data de 1961, por lo que el Gobierno ha redactado una nueva Ley de Pesca que se encuentra en la Asamblea Nacional para una discusión plenaria en un futuro próximo. La actual legislación fue derogada en varias partes por leyes transitorias, las cuales permiten sin embargo maniobrar con dichos instrumentos para la administración de los recursos pesqueros nacionales; se espera que la nueva ley incluya también algunos cambios en las modalidades de acceso. Durante el último quinquenio, la pesca ilegal ha sido uno de los mayores problemas de las pesquerías del Caribe Nicaragüense, en especial la de langosta, en vista de la poca vigilancia que se ejerce en el mar, así como por otros factores que, como el contrabando, el trasiego de producto en el mar y el tráfico de drogas, aumenta la presencia de buques extranjeros de todos los países vecinos; una comparación rápida entre el aumento de la captura de esos países con la baja producción y exportación de Nicaragua durante los años de 1978 a 1992 indican que se pueden haber perdido más de 250 millones de dólares por la actividad de pesca ilegal de langosta del Caribe nicaragüense (Martínez, 1994). Acuerdos internacionales y/o bilaterales; situación actual Nicaragua no tiene acuerdos internacionales en materia de pesquerías, como no sean aquellos dedicados a la cooperación internacional, capacitación y apoyo a las investigaciones pesqueras. Seguimiento a acciones específicas: período de veda, determinación de zonas de reserva, monitoreo de zonas de reproducción, artes y métodos de pesca (nasas, buceo, otras). Durante 1994 y 95 se instaló una veda para los barcos industriales extranjeros, permitiéndose la pesca de los nacionales, tanto industriales como artesanales. Existe una talla mínima de captura que es de 23,5 cm de longitud total, medida desde la base de las antenas al extremo de la cola, o su equivalente a 5 onzas de peso de la cola. No se permite la captura de hembras en sus etapas reproductivas ni durante el período de muda. Por decreto de ley, solo se permite la pesca de langostas con nasas, las cuales no deben superar la 1.600 por embarcación; sin embargo esto no se aplica desde 1988 como una medida de oportunidad a los repatriados del conflicto bélico, a quienes se les permite bucear langostas durante prácticamente todo el año. El MARENA (Ministerio del Ambiente y Recursos Naturales), ha decretado una reserva biológica en la zona de Cayos Misquitos, sin embargo, la falta de alternativas y la alta productividad del ecosistema permite una actividad pesquera importante para las poblaciones Misquitas de la región. Childress y Herrnkind (1996), sugieren que, al menos para las pesquerías de langostas de Cayos Miskitos, el plan de ordenamiento óptimo no

250
debería contemplar talla mínima de captura ni vedas, aunque siempre se deben prohibir las capturas de hembras ovígeras, los arpones y ganchos para pesca, y cerrar el área central de los Cayos.
11.9 FUENTE DE DATOS Y DISPONIBILIDAD Investigación pesquera: instituciones y listado de estudios. En Nicaragua, debido fundamentalmente a problemas de presupuesto, las Universidades no llevan a cabo acciones de investigación pesquera, por lo que el Gobierno ha financiado los trabajos tendientes al conocimiento de los recursos pesqueros del país. Durante los años 60 y 70, estas actividades fueron competencia de la División de Pesca del INFONAC (Instituto de Fomento Nacional), bajo cuyo paraguas se hizo el primer diagnóstico nacional de las pesquerías de langosta. Durante los años 80 esta responsabilidad recayó en el CIP (Centro de Investigaciones Pesqueras), en donde se realizaron trabajos tendientes a mejorar los conocimientos de los recursos, introduciéndose por primera vez el trabajo de monitoreo en el mar, a fin de constatar "in situ" la problemática generada por las diferentes etapas reproductivas y el comportamiento general del crustáceo. A partir de febrero de 1993, se creó el CIRH (Centro de Investigación de Recursos Hidrobiológicos), que continúa trabajando en el seguimiento de las pesquerías nacionales y realizando investigaciones básicas y aplicadas para el conocimiento de la abundancia y distribución de los recursos pesqueros, así como de la evaluación de los mismos, con el objetivo se servir como órgano consultor de las unidades administrativas de toma de decisiones a nivel nacional e internacional.
Tabla 11.2 Centro de Investigacion de Recursos Hidrobiologicos (C.I.R.H.) exportaciones historicas de colas de langosta
AÑOS 1.000 lbs.
1.000 US$
1965/69 PROM. 1970 1971 1972 1973 1974 1975 1976 1977 1978 1979 1980 1981 1982 1983 1984 1985 1986 1987 1988 1989 1990 1991 1992 1993 1994 1995 1996
328 486 271 464 561
1.080 1.747 2.102 2.798 2.813 1.862 1.636 919 833 907 714 769 565 958 397 850 495 902
1.495 1.657 2.054 3.176 3.076
457 884 480 903
1.083 2.289 4.427 6.315 7.648 6.649 7.979
10.652 7.144 6.680 6.984 5.631 5.773 3.909 8.473 3.640 6.705 4.731 9.949
16.450 16.888 20.751 35.997 37.572

251
Estadísticas pesqueras: referentes a la extracción, procesamiento y comercialización de la langosta: descripción, fuentes, metodología, series disponibles. El MEDEPESCA es la institución rectora de la pesca a nivel Nacional, y son ellos los responsables del registro estadístico de extracción, procesamiento y comercialización. Para esto, disponen de un cuerpo de inspectores de pesca que operan en la principales plantas procesadoras en donde registran desembarques, capturas, exportaciones y ventas locales. Se dispone de datos desde los años 60, aunque hay que mencionar que en el caso de la langosta la operatividad de la flota no es representativa del esfuerzo de pesca real ejercido sobre el recurso, por lo que se están haciendo gestiones para conocer en forma más precisa el número de nasas que operan por embarcación, el cual en principio, no debería ser mayor que 1600 nasas. Programas de monitoreo: descripción, resultados y aplicación. Es preciso conocer del comportamiento de las larvas y de los juveniles dentro del sistema, así como de las principales áreas de criaderos y desove. Hasta la fecha y de acuerdo al sistema de corrientes predominante en la zona, es posible que ésta sea alimentada por larvas provenientes de sureste, motivo por el cual las poblaciones no hallan sido afectadas por la pesca legal e ilegal. A pesar de que no existe ningún trabajo conjunto dentro del marco de la COPACO, es posible pensar en varias acciones que pueden ser objeto de atención. Entre ellas cabe mencionar todas aquellas tendientes a conocer el verdadero patrón de migraciones, épocas de reclutamiento, zonas de criaderos, etc., así como el mejoramiento de las estadísticas conociendo las verdaderas cifras de esfuerzo pesquero y la probable armonización de las legislaciones al respecto.

252
12 INFORME NACIONAL DE NICARAGUA2 R. Barnutty y M. Pérez Moreno
12.1 DESCRIPCION DE LA PESQUERIA La pesca comercial se inició a fines de la década de los 60 hasta alcanzar su desarrollo durante los años 70 cuando en 1978 se obtuvo un desembarque máximo de 1 400 toneladas de colas (3 000 000 de libras). En los años 80 la pesca disminuyó debido a la guerra y a la situación política obteniéndose desembarques promedio de sólo 200 toneladas de colas. A partir de 1990 ocurre una reactivación de la pesca lográndose desde 1995 desembarques sobre las 1 200 toneladas de colas (Fig. 13.1). El aumento de los desembarques se debe a un incremento importante del esfuerzo pesquero, especialmente en la pesca artesanal. Como se desconoce el número real de nasas y buzos, el CPUE de la pesca industrial en los boletines estadísticos se registra como libras de cola por barco nominal y desde 1992 se registra además como libras de cola por día de pesca nominal. El área de pesca es de 37 000 km2 (66 por ciento de la plataforma nicaragüense) pero los bancos principales están alrededor de los cayos Miskitos entre 20 a 30 brazas de profundidad y en un radio de 40 millas náuticas alrededor de Corn Island. Existe una cantidad no determinada de captura ilegal de langosta y trasiego de producto. Hay tres flotas: (a) la industrial nacional y extranjera con nasas; (b) la industrial nacional de buzos y (c) la pesca artesanal nacional de buzos y nasas. Estas flotas se componen desde pequeños botes de madera o fibra de vidrio de menos de 10 m de eslora con motor fuera de borda a barcos de hasta 26 m de eslora con motor estacionario y bodegas.
12.2 REGULACIONES El acceso a la pesca para la flota industrial se rige por un sistema de licencias. Se recomienda una captura total anual de 900 toneladas de peso cola (2 000 000 de libras) y 60 barcos con una eslora no mayor de 26 m. Desde 1992 se estableció la veda, variable en duración, pero siempre entre abril-junio, la cual desde 1993 se aplica solamente a la flota extranjera. La talla mínima de captura es de 23 cm de largo total (largo cefalotórax de 7.5 cm) o de 13.5 cm de largo de la cola equivalente a un peso de la cola de 141.75 g (5 onzas). No se permite capturar hembras en reproducción ni en periodo de muda. Sólo se debe pescar con nasas y que no sean más de 1600 por embarcación pero por presiones sociales y políticas se ha permitido el buceo comercial. No se permiten barcos industriales en un perímetro de 25 millas náuticas (46 km) alrededor de las islas de Corn Island ni tampoco desde 1996 alrededor de la zona de Cayos Miskitos que fue declarada área protegida. Sin embargo, existen debilidades en hacer cumplir las regulaciones y controlar la pesca lo que propicia actividades ilícitas.
12.3 BIOLOGIA Se han realizado investigaciones sobre la biología de la langosta Panulirus argus desde finales de la década de los 70. Recientemente Castaño y Cadima (1993) estimaron parámetros de crecimiento, mortalidades y utilizaron el modelo de rendimiento por recluta. Ehrhardt y Castaño (1995) por medio de un modelo lineal generalizado calcularon coeficientes de capturabilidad y biomasa promedio.
2 Presentado en Mérida

253
Fig.13.1 Desembarques totales (toneladas de colas) de langosta del Caribe
12.4 DATOS DISPONIBLES Datos dependientes de la pesca Desde 1964 existen registros totales de desembarques en peso, pero sólo desde 1970 se dispone de los desembarques separados por flota industrial y artesanal. Para la flota industrial se dispone desde 1970 de datos del esfuerzo en número de barcos nominales y desde 1992 en días de pesca nominales. Toda la información se obtiene de los registros de las plantas procesadoras y los centros de acopio. Desde 1980 existe un programa de monitoreo y muestreos biológicos de las capturas comerciales de los barcos industriales para estimar la composición de tallas y por sexo, determinar estadios de madurez y obtener índices relativos de distribución y abundancia. Desde 1995 los muestreos se extendieron a los desembarques en las plantas procesadoras. Sin embargo los programas de muestreos han disminuido por escasez de personal y presupuesto. Como se desconoce el número de nasas y buzos que pescan, en 1997 se realizó un muestreo del esfuerzo pesquero. Se dispone además de datos de costos de operación por flota y se está actualizando la transformación de los datos de tallas a edad. Datos independientes de la pesca En el período 1980-1995 se realizó un programa de muestreos biológicos de las capturas de algunos cruceros de pesca exploratoria para estimar la composición de tallas por sexo, estadios de madurez y obtener índices relativos de distribución y abundancia. Existen planes de establecer un programa de colectores de puerulos y estudiar el reclutamiento. Datos socio-económicos La langosta del Caribe es el rubro más importante de las exportaciones pesqueras superando en los últimos tres años los US$ 20 000 000. El número de pescadores en 1997 se estima aproximadamente en 2 636 y existe un fuerte impacto social de la pesca, especialmente la artesanal, la que se compone en su mayoría de comunidades indígenas que han dependido tradicionalmente de la pesca de langosta. Existen ocho plantas procesadoras donde laboran un total estimado de 500 personas. Cada planta tiene relaciones de compraventa con acopios y con embarcaciones industriales que la abastecen de langosta a cambio de insumos a precios y condiciones acordadas previamente.
DE NICARAGUA. PERIODO 1964-
-
200
400
600
800
1,000
1,200
1,400
1,600
19641966196819701972197419761978198019821984198619881990199219941996
AÑOS
DESEMBARQUES(TONELA

254
Avances importantes en la pesquería Se está fortaleciendo el sistema de recolección de estadísticas y el cuerpo de inspectoría en las plantas procesadoras y centros de acopio. Se hizo un muestreo del esfuerzo pesquero para su actualización.
12.5 ESTADO DEL STOCK Las evaluaciones indican que la pesquería no se encuentra sobreexplotada, pero desde 1995 está aumentando la cantidad de buzos lo que ha resultado en un incremento de los desembarques de langosta fuera de talla. Actualmente existen controversias entre los usuarios y las autoridades pesqueras respecto al actual régimen de manejo.

255
13 SAINT LUCIA COUNTRY REPORT3 W. Joseph
13.1 PROFILE OF THE LOBSTER FISHERY OF SAINT LUCIA St. Lucia lies roughly between 13 and 14 degrees North, latitude and between 60 and 61 degrees West, longitude. It is approximately 1,300 miles southwest of Florida, in the Windward Islands. The 238 square-mile island is 21 miles from its nearest neighbour, the French island of Martinique. It is just 24 miles north of St. Vincent and 100 miles northwest of Barbados. St. Lucia is volcanic and monolithic, comprising one main island with a few mininscule nearshore satellite islets. The eastern and western coasts are quite steep; the 200m isobath lies within 2 km of shore from Vigie point to Choisuel. Particularly on the Windward (eastern) coast, the shoreline is very irregular with numerous exposed volcanic islets formed by intensive erosion. The coastal shelf (550 km2) is considerably broader to the north and south, where the 200m isobath may be as far as 8.4 km from shore (Fig. 13.1). The lobster fishery has expanded rapidly due to increasing development within the tourism sector. Lobster fishing (predominantly for Panulirus argus) is undertaken at all eleven major landing sites all engaging in the use of the Antillean fish trap, this being the main gear, used to capture this highly sought after species. Fishermen operate out of a variety of small open vessels, mostly wooden canoes or fibreglass pirogues powered by outboard motors (40-115 HP). Lobsters are caught primarily on the island shelves at depth ranging from 30-100m (100-300 feet). Traps are set for periods ranging from two to seven days and are usually hauled every two or three days depending on currents. Landings are, however concentrated on the southern and eastern coasts with major landings at Dennery, Micoud, Savannes Bay, Vieux Fort and Laborie . Landings in the northeast (Gros Islet, Castries, and Canaries) have declined significantly, largely due to habitat degradation.
Table 13.1 Lobster purchases from the Fish Marketing Corporation.
Year Quantity(lbs) Cost 1992 18,210 272,771 1993 16,021 210,443 1994 13,815 193,123 1995 9,284 125,302 1996 28,273 420,884
Note : Purchases are summed for an entire year and not by season. Lobsters are purchased at EC.$14
This fishery has been severely under-recorded by the national fisheries data collection programme since landings are often decentralized and not within the areas of operation of the data collectors. The Department of Fisheries annually samples lobsters purchased by the Fish Marketing Corporation (The Fisheries Complex) at the beginning of the open season. Data collected include carapace lengths, sex and individual weight. Data collected for 1996 has not yet been analyzed. Table 13.1 shows purchases from the Fisheries Complex, the largest buyer of lobsters. Lobster is also purchased directly from the
3 Presented in Belize

256
Fig.13.1 Distribution of coastal and marine resources, uses and facilities in St. Lucia

257
fishermen by hotels, restaurants, vendors and the general public. A preliminary estimate of lobster landings for 1996 is 25.9 t (56,990 lbs). Although present landings are thought to be lower than that experienced during the early 1980's, assessment of size frequencies of landings during the open season since the late 1980's seem to indicate that stocks are supporting the current level of fishing. This situation may now be threatened by the use of the highly efficient trammel net, a gear which is now prohibited through Fisheries Regulations (1994) but is yet to be removed from the fishery. The gear is used primarily to capture lobsters but also captures a variety of juvenile fish. The lobster fishery is currently threatened by habitat degradation due to siltation, other forms of pollution, illegal dynamiting and as mentioned previously, the use of destructive gear such as trammel nets. The trap fishery is also suffering from the prevalence of "pot theft" and fishermen are continuing to resist moving to larger mesh sizes. There continues to be considerable illegal capture and sale of lobsters, despite overwhelming support against it now received from major purchasers (the Fisheries Complex, hotels and restaurants). However, it now appears that there is a significant reduction in the local illegal market due to the decline in the occurrence of sub-legal and berried females, as appears from the landings sampled. There is need to improve the collection of relevant data on lobster. The lack of centralized landing areas restricts regular monitoring of landings, particularly for lobster and this encourages concealed landings and exports. There is serious concern for the status of the resource since an increase in effort has paralleled the increase in demand. Presently, there are insufficient data to determine the status of the stock and in an effort to determine the status of the fishery, the Department of Fisheries with funding and technical assistance from CARICOM Fisheries Resource Assessment and Management Program (CFRAMP) implemented two sub-projects for collection of data on lobsters. The first, which commenced in September 1996 involves the collection of catch and effort data a well as biological information(sex and carapace length) of landings during the open season. The second which commenced in the same year is a Lobster Maturity Study. For a period of two years, data such as sex, maturity, carapace length and status of spormatophores will be collected during the open season as well as the closed season. New regulations (1994) provide continued protection for lobster. The laws include: • Minimum legal size of 9.5 cm
• Prohibition on scrubbing off eggs
• Closed season which extends from May 1st to August 31st
• Gear restriction- minimum mesh size of 1 1/2 in
• Prohibition of landing lobsters that are moulting or berried.
These new regulations also allow for the licensing of fishing vessels and registration of fishers. This is viewed as a tool to enable further monitoring within the fishery. Management efforts within several coastal areas and for the sea urchin fishery have recently become based on the principles of co-management. It is likely that this approach will also be incorporated into aspects of lobster management. The Fisheries Act (1984) provides for formation of Local Fishery Management Areas, which may facilitate more effective management of shelf resources such as lobster.

258
14 SPINY LOBSTER FISHERIES OF THE UNITED STATES OF AMERICA1
D. Harper and R. Muller
14.1 INTRODUCTION The Caribbean spiny lobster (Panulirus argus) is a valuable, highly exploited marine crustacean inhabiting shallow shelf waters off the southern United States, Bermuda, and throughout the Caribbean. In Florida, spiny lobster are principally caught by commercial trap fishers using wooden slat traps, although some commercial harvest by SCUBA divers and bully nets occurs. The primary fishing area extends from Palm Beach on Florida’s Atlantic coast, approximately 580 kilometers south and westward beyond the Dry Tortugas in the Gulf of Mexico (Fig. 14.1) with the majority of the harvest occurring off the Florida Keys. The spiny lobster has consistently ranked as the second most economically important marine species landed in Florida being surpassed only by pink shrimp in commercial value. Based on National Marine Fisheries Service (NMFS) data, the 1986 through 1996 spiny lobster ex-vessel value in Florida ranged from $13.2 million in 1986 to a record high $31.8 million in 1995 and averaged $22.6 million or approximately 11.4% of the total value for all Florida marine species harvested by commercial fishers. In Florida, the spiny lobster is also the target of an intense recreational fishery (Davis, 1987; Davis and Dodrill, 1980; Davis and Dodrill, 1989) which includes an annual two-day sport diving harvest that precedes the commercial season (Simmons, 1980). Bertelsen and Hunt (1991), using a mail survey, recently estimated the statewide recreational harvest during the 90-91 lobster season to equal 29% of the commercial landings. The magnitude of the recreational lobster harvest had been previously estimated to be 10% of the total lobster catch (Zuboy, 1980; Moe, 1991). Spiny lobster in the Florida territorial sea are managed by the Florida Marine Fisheries Commission, while spiny lobster in the Exclusive Economic Zone (EEZ) off the Gulf of Mexico and south Atlantic coastal states are managed under the Fishery Management Plan of the Gulf of Mexico and South Atlantic (FMP) prepared by the Councils. On December 30, 1992, a rule to conform Florida and Federal regulations under Amendment 2 to the FMP became effective. This rule adopted Florida's spiny lobster trap certificate, trap reduction, and trap identification programs in the EEZ off Florida; reduced the number of undersized lobsters used as attractants in traps to 50 per vessel, or one per trap onboard, whichever is greater; specified diving and use of bully net, hoop net, and trap as the only authorized method/gear for the spiny lobster in a directed EEZ fishery; and established a catch limit of 5 percent, by weight, of all fish aboard for the incidental harvest of spiny lobster by trawls in the EEZ. Florida's spiny lobster trap certificate program became effective August 1993 and required that tags (1 certificate = 1 tag) issued by the Florida Department of Environmental Protection (FDEP) be attached to all spiny lobster traps. The total 1993 lobster season allocation of certificates was 700,000 plus an additional 125,000 certificates to be used during an appeals process to settle disputes raised by fishers concerning their initial certificate allocation (Hunt, 1994). Each fisher's allocation was based upon that individual's reported landings during one of three benchmark fishing seasons (1988-89, 1989-90, or 1990-91). Other management regulations intended to provide for resource conservation are contained within Florida statues and the FMP. These regulations include but are not limited to the following:
1 Presented in Belize

259
Fig. 14.1 Map of the fishing grounds for P. argus in Florida. The major area extends from Palm Beach on the Atlantic coast to the Dry Tortugas in the Gulf of Mexico; about 90% of the domestic catch is taken from within the 10 fathom isobath (from Labisky et
al., 1980)
1) setting a minimum size limit of 3 inches (7.6 cm) carapace length;
2) closing the fishing season April 1st through August 5th;
3) prohibiting the harvest of egg bearing females;
4) requiring that undersized lobster which will eventually be used as bait or decoys in traps be maintained in a continuously circulating live well while aboard the vessel. In addition to the management regulations described above, several large areas along the south Florida coast have been designated as lobster sanctuaries in which no harvest of spiny lobster is permitted. Due to concern caused by the intensive exploitation of the resource, the spiny lobster fishery and biological data have been periodically re-examined by the National Marine Fisheries Service (NMFS), Southeast Fisheries Science Center (Powers and

260
Bannerot, 1984; Powers, 1985; Powers and Thompson, 1986; Thompson and Powers, 1987; Newlin, 1988; Powers and Sutherland, 1989; Harper, 1991; Harper, 1992; Harper, 1993; Harper, 1994). The objectives of this report are to examine: (1) trends in commercial landings and effort;
(2) catch per unit of effort (CPUE);
(3) size of lobster in commercial and recreational catches; and
(4) recent research concerning spiny lobster life history and fishery aspects. The statistics summarized in this report are: 1) Florida commercial lobster landings summarized by coastal area (east coast - Dade and other Atlantic coast counties; west coast - Monroe and other Gulf coast counties),
2) number of fishing craft and traps in the fishery based on data obtained during an annual canvas of seafood dealers and fishers,
3) seasonal catch per trap obtained by dividing total commercial landings by number of traps in the fishery,
4) monthly and seasonal catch per fishing trip based upon MFIS data for those trips in which greater than 75% of total landings were spiny lobster,
5) mean size (carapace length) of lobster in commercial landings by area utilizing the Trip Interview Program (TIP) data collected by NMFS and FDEP personnel,
6) recreational lobster size data and CPUE collected as part of the Biscayne National Park Creel Census. The opening date for the spiny lobster fishing season has changed several times since 1960 but has usually begun during the last week in July or the first week in August. The season since 1960 has extended through the last day in March of the following year. Information contained within this report will be summarized by month or fishing season. Fishing season in the text will be referred to by the year beginning the season, hyphen, and then two digits to indicate an extension into the following calendar year (eg. 1980-81 season encompasses the period from the season opening date in 1980 and extending through March 31, 1981).
14.2 DATA SOURCES Commercial Landings Information on the quantity and value of spiny lobster caught by fishermen in the U.S. has been collected as early as the late 1890s. The data set maintained by the Southeast Fisheries Science Center (SEFSC) in the Southeast Fisheries Information Network (SEFIN) database management system is a continuous data set that begins in 1960. In addition to the quantity (which is usually recorded in pounds of whole weight) and value, information on the gear used to catch the fish, the area where the fishing occurred and the distance from shore are also recorded. From 1960 through 1986, because the quantity and value data are collected from seafood dealers, the information on gear and fishing location are estimated and added to the data by data collection specialists. Commercial landings statistics have been collected and processed by various organizations during the 1960-to-present period that the SEFIN data set covers. During the 18 years from 1960 through 1978, these data were collected by port agents employed by the Federal government and stationed at major fishing ports in the southeast. The program was run from

261
the Headquarters Office of the Bureau of Commercial Fisheries in Washington DC. Data collection procedures were established by Headquarters and the data were submitted to Washington for processing and computer storage. In 1978, the responsibility for collection and processing were transferred to the SEFSC. In the early 1980s, the NMFS and the state fishery agencies, including Florida, within the Southeast began to develop a cooperative program for the collection and processing of commercial fisheries statistics. Presently, general canvass statistics for commercial spiny lobster are collected by the fishery agency in the respective state and provided to the SEFSC under a comprehensive Cooperative Statistics Program. Beginning in 1984, a mandatory reporting program, the Marine Fisheries Information System (MFIS) by all seafood dealers was implemented by the FDEP. This program, commonly known as the Trip Ticket System, requires that a report (ticket) be completed and submitted to the FDEP for every trip. Dealers have to report the fisher’s license number, the dealer’s license number, county landed, and type of gear as well as the quantity (pounds) purchased for each species. Information on the area of catch can also be provided on the tickets for individual trips. Commercial Trip Sampling The Trip Interview Program (TIP) for collecting interview and other fishery-dependent biological and socio-economic data required for fishery management is one of the major components of the region-wide State-Federal Cooperative Statistics Program in the Southeastern United States. The purpose of the TIP is to collect fishery information by individual trip in order to obtain more detailed catch and effort data than has historically been needed or required. This kind of information has become more and more desirable and necessary simply to monitor and/or evaluate and/or understand the status of the biological stocks and the fishing industry. The data are collected by field agents who interview fishers usually at the conclusion of a fishing trip. Data collected may include trip information, landings data, and sample measurements (size and sex) of individual species landed. In some instances, hard parts are collected for aging. Observer Program The Department of Environmental Protection began an observer program on commercial lobster boats in the Florida Keys beginning August 1993 after the implementation of the Trap Certificate Program. Every month during the regular season (August through March), observers call fishermen in each area (11) and arrange to accompany fishermen on trips. Based on the number of traps that the fisherman intends to pull on that trip, the observer determines the increment so as to sample 100200 traps and then randomly selects a starting trap. For each trip, the observer records the area and sampling grid within the area, trip code consisting of the observer’s initials and the date, and the soak time. For each sampled trap, the observer records the trap number, whether the trap is wood or plastic or broken, size and sex of every lobster, and species of all other captured animals. These data provide information on the size distribution by sex of lobsters caught in lobster traps, sex ratios, and catch per trap of under-sized and legal-sized lobsters. Puerulus influx monitoring The spiny lobster pueruli monitoring program was designed to collect information on the seasonal and inter-annual variation in pueruli influx. The program was initiated in March, 1987 at one location in the Florida Keys with weekly sampling of three replicate modified Witham collectors (as part of the Looe Key Lobster Survey). The program was expanded to

262
three locations in May, 1991 with five replicate collectors at each location, but sampling was reduced to once per month to streamline effort. The data recorded include date, moon phase, location, collector, soak time, temperature, number of pigmented pueruli, number of semi-transparent pueruli, and the number of juveniles. Initial comparisons indicate that numbers of pueruli compared well with commercial landings with a four year offset.
14.3 DISCUSSION Commercial fishery
Landings and Effort Spiny lobster commercial landings in Florida increased from 2.8 million pounds in 1960-61 to a maximum of 11.9 million pounds in 1972-73. (Table 14.1, Fig.14.2). Landings decreased from 1972-73 until 1975-76, with a dramatic decline of over 3.6 million pounds occurring in 1975-76 when compared to the previous season. Seasonal total Florida spiny lobster landings since 1975 have fluctuated without trend, averaging about 6.1 million pounds through 1995 with a range of 4.3 to 7.9 million pounds. Florida west coast landings were greater than east coast landings for all seasons except 1972. Florida east coast landings increased steadily from 1960 (0.7 million pounds) through 1972 (7.2 million pounds) and then decreased rapidly to about 1.2 million pounds in 1975. Increases in Florida east coast landings from 1965 to 1975 were for the most part due to increased U.S. fishing effort in the Bahamas. An estimated 17% to 57% of total Florida spiny lobster landings from 1965 through 1975 were taken from "international waters", principally the Bahamas (Labisky, et al., 1980). Florida east coast spiny lobster landings declined during the early 1970s when the Bahamian Government began enforcing fishery laws (Johnson, 1973). In 1975 all foreign commercial fishing was prohibited on the Bahamian continental shelf. The rapid decline in Florida east coast spiny lobster landings between 1972 (7.2 million pounds) and 1978 (0.7 million pounds) reflect the closure the Bahamian waters to U.S. spiny lobster fishers. Pounds landed and landing percentages by month for the August- March periods from Florida's west coast during the 1960-1994 seasons are shown in Table 14.2. In the lobster seasons after 1980-81, an average of 78.9% of the total Florida west coast landings were harvested during the first four full months (August through November or approximately one half of the entire lobster season) suggesting that the effective fishing season is only about one half as long as the legal fishing season in Florida. During 1995-96, 82.3% of the total Florida west coast harvest was landed before December, a percentage slightly above the 1980-81 through 1994-95 seasonal average. The number of reported craft in the spiny lobster fishery increased from 221 in 1960-61 to 823 in 1975 then decreased substantially to 549 in 1976, and fluctuated between 517 and 672 during the 1976 through 1985 seasons (Table 14.1, Fig. 14.3). Since 1985, number of craft has increased rapidly from 517 to a 813 in 1992 and then declined to the present estimate of 720 craft for 1995. The primary fishing gear for lobster in the commercial fishery is the wooden slat trap. This gear has been used to harvest over 97% of Florida landings between 1962 and 1994. The number of traps in the Florida fishery has fluctuated, yet has maintained a steadily increasing trend from a low of 52,000 in 1961 to a maximum of 939,000 in 1991. Since 1991 and the initiation of Florida's trap reduction program, the number of traps in the fishery has declined to the present 1995 estimate of 582,000 traps. This decline represents a 38% decrease over four seasons from the all-time high trap estimate recorded for 1991.
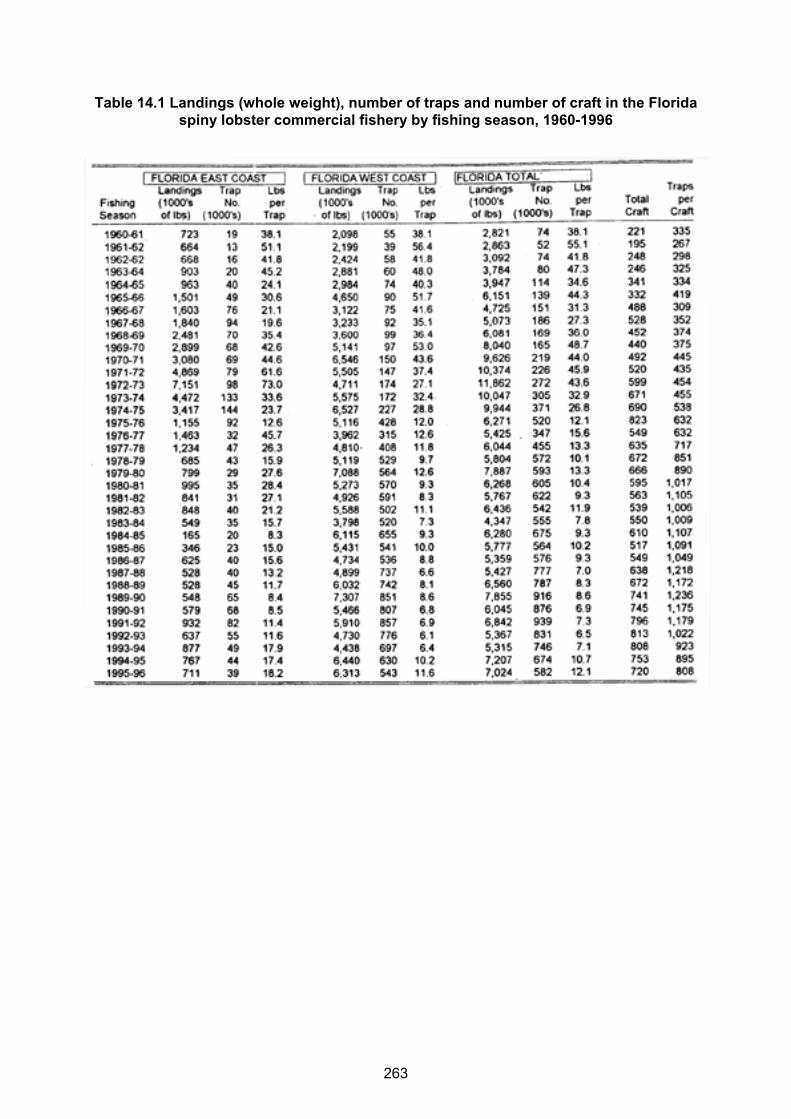
263
Table 14.1 Landings (whole weight), number of traps and number of craft in the Florida spiny lobster commercial fishery by fishing season, 1960-1996

264
Fig. 14.2 Spiny lobster commercial landings (whole weight) in Florida by fishing season and coast, 1960-1995

265
Catch Per Unit Effort There are three measures of catch per unit effort (CPUE) available for the spiny lobster fishery in Florida: commercial pounds per trip from trip tickets (1985+), observer number of legal-sized per trap or weight of legal-sized lobsters per trap (1993+), and recreational catch per trip in the Special Sport Season and in the first month of the regular season from mail surveys (1992+). The most extensive measure of CPUE is the commercial pounds per trip standardized by analysis of covariance (ANCOVA) for county, trip duration. Gear has only been recorded by trip since 1992; however, the fishery is predominantly a trap fishery and the most recent assessment (Muller et.al., in press) indicates that trips closely track fishing mortality. This measure is available statewide. Beginning in 1993, observers have accompanied some commercial trips by area and month and recorded the total catch from randomly selected traps on the trip. These data allow the development of numbers of lobsters by trap either legal-sized or sub-legal standardized by ANCOVA for area and soak time. Weights per trap are calculated from the size and sex of the captured lobsters. This measure is only available for the Florida Keys where over 90% of the lobsters are harvested. The third measure of CPUE is the average number of lobsters caught per recreational angler during the Special Sport Season (two days in late July) or the average number of lobsters caught in the first month of the regular season that opens on August 6. This information is collected with a random stratified survey of recreational crawfish (spiny lobster) stamp holders. The initial was conducted in 1991 and reviews of that survey suggested several modifications. Since 1992, the survey methodology has remained the same. Seasonal catch per trap for the Florida west coast exceeded 25 pounds, from 1960 to 1974 (Fig. 14.4). A sharp decline in pounds harvested per trap from 43.6 pounds in 1972 to 12.1 pounds in 1975. Since 1976, seasonal catch per trap has tended to decline slightly with a record low 6.5 pounds per trap estimated for 1992. The inverse relationship between catch per trap and number of traps Fig. 14.4) indicates that fishers increased the number of traps fished in the late 1970's after their landings per trap had greatly decreased, possibly in an attempt to compensate for the reduced income. Seasonal (1984 through 1995) mean lobster catch per trip as reported by 324,212 spiny lobster trip tickets in the MFIS is shown in Figure 14.5. The overall 1984 through 1994 mean catch per trip was 186.3 pounds although mean landings per trip have varied between years. Mean pounds landed per trip increased 25.5% from 140.6 pounds in 1984-85 to 176.6 pounds in 1985, although this increase may be overstated because of low numbers of trips reported during the early months (August, September, and October) of 1984 on the MFIS. Another increase occurred in 1988-89 when mean pounds landed per trip increased to 215.7 pounds from 174.1 pounds in 1987-88 (a 24.0% increase) and then maintained this increase into the 1988-89 season with 215.9 pounds. Mean pounds landed per trip then decreased to 166.3 in 1990-91 and remained relatively stable through 1991-92 (164.8 pounds) and 1992-93 (164.7 pounds). The 243.7 pounds per trip calculated for 1994-95 represents an increase of 34.3% as compared to 1993-94 and is also a highest value for this statistic since inception of the MFIS. As reported in (Harper, 1993) the number of spiny lobster trips completed during 1992-93 (31,316) was reduced due to the passage of Hurricane Andrew across southern Florida on August 24, 1992. This trend in reduced numbers of reported trips continued into 1993-94 (27,555 trips). During 1994-95, a slight reversal of this trend is noted with the number of reported trips increasing to 28,537, an increase of 882 trips or 3.5% over 1993-94 levels.

266
Table 14.2 Reported spiny lobster commercial landings (lbs whole weight) and percentage by month (August-March), from the Florida west coast, 1960-95

267
Fig 14.3 The number of commercial fishing craft by season (1960-95) in the Florida spiny lobster fishery
Fig 14.4 The number of spiny lobster traps and the average landings (lbs) per trap by fishing season (1960-95) in the west coast of Florida fishery

268
Fig 14.5 Mean catch (lbs landed) per trip by fishing season for 324,212 trips in the Florida spiny lobster fishery (1984-95). Vertical lines for the 95% confidence interval
and the number of trips is indicated for each seasonal mean
Fig. 14.6 Mean lengths (carapace in mm) for lobster sampled from commercial catches
by NMFS and FDEP (1985-95). The 95% confidence interval is indicated for each season

269
Fig 14.7 Mean catch (lbs landed) per trip by month for 324,212 trips in the Florida spiny lobster fishery (August 1984- March 1995). The number of trips is indicated for each monthly mean

270
Monthly mean lobster catch per trip and number of trips reported by month for the MFIS data is shown in Figure 14.7. Harper (1992) reported that MFIS data, when analyzed for monthly number of trips and monthly catch per trip, exhibits a general trend with mean pounds landed per trip being higher during the first half of each season (August through November), followed by sharp decreases in both the number of trips and mean catch per trip in the second half of each season (December through March). This trend continued into 1994-95. Although mean catch per trip on a monthly basis for 1994-95 demonstrated comparable trends with previous seasons, the monthly catch rates per trip were slightly elevated, more similar to the earlier seasons (1985-85 through 1989-90) than more recent seasons (1990-91 through 1993-94). Size of Lobster in Commercial Landings During Trip Interview Program (TIP) data collection, NMFS and FDEP personnel sampled 64,888 lobster (Fig. 14.6) for 1985 through 1996 lobster fishing seasons. Mean carapace lengths (mm) of lobster from TIP sampled commercial trips in the Florida Keys was 86.9 mm (std = 11.1). The trend in seasonal mean lobster size was variable, although a slight bias toward increasing sizes is noticeable in the graphic display. The seasonal peak in mean size (91.8 mm CL; std=18.0) occurred during the 1992 season. This season is noteworthy because a major tropical storm, Hurricane Andrew, passed over the south Florida area on August 24, 1992, near the beginning of that year's lobster fishing season.
14.4 RECREATIONAL FISHERY Size of Lobster and CPUE in the Recreational Harvest Mean sizes of measured lobster carapace lengths (mm) from recreational trips sampled during the creel census intercept surveys conducted by National Park Service personnel from boat ramps within and adjacent to the Biscayne National Park, south Dade County, Florida from 1976 through 1996 were examined (Fig. 14.8). Overall the mean carapace length was 84.1 mm (range = 65 to 168 mm; sd = 7.59) from a total of 34,056 lobster measurements recorded during this Biscayne National Park Creel Census. Most of these data were obtained during the special two-day sport lobster season which precedes the regular lobster season during the month of July. For most lobster seasons in this dataset, the mean carapace length from sampled recreationally harvested lobster has been variable, yet has remained within the 83 to 85 mm mean size range. The large decrease in mean lobster carapace length recorded during the 1983 season may be the result of a major El Niño event. Seasonal CPUE (lobster per man-hour) were calculated from 3,919 creel survey interviews between 1976 and 1996 (Fig. 14.9). Although the general trend was highly variable, seasonal recreation lobster catch per man-hour ranged from 0.64 in 1984 to 1.38 in 1991 with and overall average of 1.02.

271
Fig.14.8 Mean lengths (carapace mm) for spiny lobster sampled from recreational catches by National park Service personnel and volunteers during fishing intercept surveys, 1976-96. The surveys were conducted from boat launch sites within and
adjacent to the Biscayne National Park, south Dade County, Florida. The 95% confidence interval is indicated.
Fig. 14.9. Biscayne National Park spiny lobster recreational CPUE, 1976-96

272
14.5 BIOLOGICAL AND POPULATION INFORMATION Morphometrics The data for determining morphometric relationships comes from a study that was conducted in the Florida Keys from June 1985 to June 1986. Complete information on 1061 lobsters were collected including area, date, sex, size class, carapace height, carapace length, leg length, moisture, weight difference between frozen and thawed, total length, total weight, tail length, tail weight, and tail widths and weights by segment. The following relationships were obtained: (Note - All length units of measurement are millimeters; all weight units of measurement are grams) Tail length on carapace length Females Tail Length = 1.77 Carapace Length + 10.59, r2 = 0.975, df = 513 Males Tail Length = 1.56 Carapace Length + 20.07, r2 = 0.980, df = 546 Slopes significantly different F = 174.68, df = 1, 1059, P < 0.0001 Elevations significantly different F = 583.88, df = 1, 1060, P < 0.0001 Carapace length on tail length Females Carapace Length = 0.551 Tail Length - 3.96, r2 = 0.975, df = 513 Males Carapace Length = 0.626 Tail Length - 10.98, r2 = 0.980, df = 546 Slopes significantly different F = 189.73, df = 1, 1059, P < 0.0001 Elevations significantly different F = 586.63, df = 1, 1060, P < 0.0001 Tail length on total length Females Tail Length = 0.623 Total Length + 8.55, r2 = 0.944, df = 513 Males Tail Length = 0.630 Total Length + 5.19, r2 = 0.976, df = 546 Slopes NOT significantly different F = 0.76, df = 1, 1059, P = 0.385 Elevations significantly different F = 34.15, df = 1, 1060, P < 0.0001 Total length on tail length Females Total Length = 1.52 Tail Length - 0.693, r2 = 0.944, df = 513 Males Total Length = 1.55 Tail Length - 0.288, r2 = 0.976df = 546 Slopes NOT significantly different F = 3.31, df = 1, 1059, P = 0.069 Elevations significantly different F = 31.35, df = 1, 1060, P < 0.0001 Carapace length on total length Females Carapace Length = 0.349 Total Length -0.633, r2 = 0.955, df = 513 Males Carapace Length = 0.399 Total Length -8.83, r2 = 0.981, df = 546 Slopes significantly different F = 149.17, df = 1, 1059, P < 0.0001 Elevations significantly different F = 223.31, df = 1, 1060, P < 0.0001 Total length on carapace length Females Total Length = 2.73 Carapace Length + 11.62, r2 = 0.955, df = 513 Males Total Length = 2.45 Carapace Length + 25.81, r2 = 0.981, df = 546 Slopes significantly different F = 90.02, df = 1, 1059, P < 0.0001 Elevations significantly different F = 217.88, df = 1, 1060, P < 0.0001 Total weight on carapace length Females Total Weight = 0.00195 Carapace Length2.81 , r2 = 0.988, df = 513 Males Total Weight = 0.00287 Carapace Length2.71 , r2 = 0.981, df = 546

273
Total weight on carapace length Lyons et al. 1981 Females Total Weight = 0.00361 Carapace Length2.68379 , n = 258 Males Total Weight = 0.00315 Carapace Length2.69934 , n = 312 Authors noted that although the equations were different, the differences were small. Combined Total Weight = 0.00422 Carapace Length2.64091 , n = 570 Total weight on tail weight Females Total Weight = 2.97 Tail Weight + 0.327, r2 = 0.980, df = 513 Males Total Weight = 3.38 Tail Weight - 23.80, r2 = 0.972, df = 546 Slopes significantly different F = 169.52, df = 1, 1059, P < 0.0001 Elevations significantly different F = 171.68, df = 1, 1060, P < 0.0001 Fecundity In 1996, FDEP initiated a study of fecundity in the Florida Keys. In the first season of sampling, samplers collected 129 female lobsters with eggs. These lobsters ranged between 67 mm CL and 141 mm CL and the number of eggs ranged from 147,000 (72 mm CL) to 1,952,000 (141 mm CL). Cox et al. (1997) estimated the fecundity of female spiny lobsters from the Florida Keys as E = - 1,261,651 + 98.34 CL2 , r2 = 0.91, n = 129 where E is the number of eggs and CL is the carapace length in mm. Using the same data and converting the carapace length to weight using Lyons et al. (1981) conversion equation, the equation for estimating the number of eggs from weight (W) is E = 854 W - 27480, r2 = 0.90, n = 129 Natural mortality Stock assessments for spiny lobsters in Florida assumed fast growth, L∞ = 190 mm and K = 0.3 and estimated natural mortality as 0.05 per month or 0.6 per year (Powers and Bannerot 1984, Powers and Thompson 1986, Powers and Suhtherland 1989). Hunt and Lyons (1986) used a different growth model and estimated lower natural mortality of 0.42 per year. Muller et.al. (in press) used a joint probability model which produced a slower growth pattern and thus they used a natural mortality rate of 0.3 per year. Maximum ages associated with these rates are 5 years (M = 0.6 per year), 7 years (M = 0.42 per year), and 10 years (M = 0.3 per year). Growth Growth estimates for spiny lobsters were developed from early tagging programs in the Florida Keys. Information from the Key West area came from tagging work done in the 1975-76 (Gregory et al. 1982, Gregory and Labisky 1986) and from the upper and middle keys from a study conducted by the Department of Environmental Protection in 1978 and 1979 (Lyons et al. 1981, Hunt and Lyons 1986). Hunt and Lyons (1986) reviewed previous studies of growth of spiny lobsters in the Keys and rejected the von Bertalanffy model for animals with continuous growth and developed a discrete model that considered growth as two processes: intermolt period and molt increment. Restrepo and Hoenig (1988) developed a method for estimating the intermolt period by examining the cumulative proportion of recaptures sorted by time-at-large. The intermolt period was estimated as twice the time at the 50 percentile. We used Fogarty and Iodine's (1988) method of estimating molting probabilities with logistic

274
Fig 14. 10. Probabilities of molting during a month by sex, period and carapace length (Muller et al., in press, Figure 7)
Fig. 14.11 Growth increment in mm by sex, period, and carapace length (Muller et al., in press, Figure 8)

275
regressions of whether a lobster molted based on the size at tagging by period and sex. Their equation was P = 1/(a + b CL) where P is the probability of molting, a and b are fitted coefficients, and CL is the carapace length (Fig. 14.10). Fogarty and Iodine estimated the molting increment by extracting mean sizes out of over-lapping distributions. The Keys data had insufficient lobsters in a stratum to use their method; therefore, molting increment was estimated with a multiple regression using initial size, time-at-large, and dummy variables for season and sex. To minimize multiple molts by a single lobster, only lobsters at-large for five months or less were included in the regression. The equation was I = EXP(a + b CL + c t + e p + g s) where I is the growth increment in mm, a is a constant, b is the coefficient for carapace length, c is the coefficient for the number of days at-large, e is the coefficient for the season dummy variable, and g is the coefficient for the sex dummy variable (Fig. 14.11). The growth curve (Fig. 14.12) was generated with Monte Carlo simulations by following 100 spiny lobsters individually by month starting at 50 mm CL and averaging the size at each month.
Fig. 14.12 Growth curves by sex based on probabilities of molting and corresponding
growth increments (Muller et al., in press, Figure 9) Assessment section This section is based on an evaluation of Florida's Trap Certificate program (Muller et.al., in press). Fishing mortality rates and population sizes from 1987-88 season through 1995-96 season were estimated with sequential population analyses using the ADAPT framework (Gavaris, 1988). The input data include numbers of animals by age and year, an estimate of natural mortality (M = 0.3 per year in this case), indices of abundance, and age specific selectivity in the most recent year. Because this method requires an estimate of fishing mortality on the oldest age in the most recent year, indices of abundance are used to identify a

276
Fig. 14.13 Standardized catch per trip by zone after adjustment by analysis of
covariance for month and trip duration a) Upper Keys, b) Lower Keys (Muller et al., in press, Figure 10)
value for that fishing mortality that provides the best correspondence between the population size and the indices for the appropriate ages. This method is used extensively to evaluate the status of fin fish stocks. Separate analyses were run for each sex and zone (upper and lower Keys) using the standardized commercial catch rates as the tuning index (Fig. 14.13). The tuning index was pro-rated by sex based upon the numbers caught. Average fishing mortality rates by year were calculated from the sum of the resulting population sizes for all ages in a year and the associated catches using the Baranov catch equation Cy = Ny Fy (1 - exp(-Zy) / Zy Although the average fishing mortality rate since 1993 (0.50 per year) was less than the average from earlier seasons (average F = 0.62 per year), the rate is above benchmarks such as Fmax (0.46 per year) and F0.1 (0.24 per year). Average annual fishing mortality rates were strongly correlated to the number of commercial trips (Fig 14.14).

277
Figure 14.14 Annual average fishing mortality rates in the Florida Keys: a) effort
measured in commercial trips and b) effort measured as the total number of traps (Muller et al., in press, Figure 12)
Since the sequential population analyses depends heavily upon the growth pattern, the analyses were re-run using a 50% faster molting rate and a correspondingly higher natural mortality rate (0.42 per year, Powers and Sutherland 1989). The conclusion remain the same -- that the increased landings since 1993 reflected increased abundance instead of higher fishing mortality rates. Other Recent Research An additional concern to the health of the spiny lobster fishery in Florida has been the documentation of a catastrophic mortality of sponges and disappearance of seagrass habitat, along with a marked juvenile spiny lobster abundance decline in areas of Florida Bay (Anon., 1992). Sponges and seagrass provide critical habitat for juvenile spiny lobster during early development. The loss of seagrass habitat, recurring cyanobacerteria blooms, and subsequent mass mortality of sponges has resulted in juvenile lobster abundance decreases estimated at nearly 50% for formerly productive nursery areas in much of central Florida Bay (Butler, 1994). It is unclear whether this loss of juvenile lobster nursery habitat and subsequent decline in juvenile spiny lobster abundance will have lasting effects upon the Florida spiny lobster fishery.

278
14.6 ACKNOWLEDGMENTS We thank the Florida Department of Environmental Protection and Martha Norris for providing spiny lobster Florida Trip Ticket System and trap certificate data; Rick Beaver, FDEP, Marathon, Florida for additional information about TIP samples; Bill Lyons and John Hunt FDEP for their insights regarding biological information; Richard Curry and Brian Lockwood of the National Park Service, Biscayne National Park, for providing recreational lobster length data; and Ed Little, Guy Davenport, Joshua Bennett, NMFS, for their assistance in preparing this report.
14.7 PUERTO RICO AND VIRGIN ISLAND SPINY LOBSTER Spiny lobster in the Commonwealth of Puerto Rico and the territory of the U.S. Virgin Islands are caught primarily by fish traps, lobster traps, and divers. The Caribbean Fishery Management Council manages spiny lobster in the federal waters surrounding these two islands. Management is based upon a minimum carapace length size of 3.5 inches (8.9 cm). Egg bearing females are also prohibited from harvest. Annual spiny lobster landings for Puerto Rico averaged 287,200 pounds over 21 years between 1975 and 1995 (Fig. 14.15). Landings increased from 311,000 pounds in 1975 to a peak of 512,000 pounds in 1979. Since 1979 landings decreased to 144,000 pounds in 1988. The 1995 spiny lobster landings in Puerto Rico were approximately 281,000 pounds. Spiny lobster commercial landings in the U.S. Virgin Islands between 1980 and 1991 have increased slightly and averaged 58,450 pounds during this time period. Spiny lobster commercial landings were 119,000 pounds for the U.S. Virgin Islands. Growth overfishing appears to be a major problem in Puerto Rico, based upon the large number of undersized lobster being landed and the recent declines in total landings (Bohnsack, et al., 1991).
Fig 14.15 Spiny lobster commercial landings in the US Caribbean Sea, 1975-95

279
15 ADDITIONAL REPORT OF THE UNITED STATES OF AMERICA2 R. G. Muller
15.1 DESCRIPTION OF FISHERIES Florida’s fishery for spiny lobsters began in Key West area of the Florida Keys in nineteenth century (Labisky et al. 1980) and developed until by the early 1960s the fishery was producing approximately 1 250 tonnes per year (Figure 15.1). When the minimum size of lobster was reduced to 76.2 mm (3.0 in) carapace length (CL) in 1968, the fishery expanded to the Middle and Upper Keys and the resulting harvest increased to an average of 2 500 tonnes. In addition, the smaller size allowed fishers on Florida’s East Coast to land lobsters from Grand Bahamas Bank until the Bahamian government closed their waters to foreign fleets in 1977.
0
500
1,000
1,500
2,000
2,500
3,000
3,500
To
nn
es
$0.00
$1.00
$2.00
$3.00
$4.00
$5.00
$6.00
$7.00
Val
ue
(Mill
ion
s)50 55 60 65 70 75 80 85 90 95
Landings
Value
a. East Coast
0
500
1,000
1,500
2,000
2,500
3,000
3,500
To
nn
es
$0.00
$5.00
$10.00
$15.00
$20.00
$25.00
$30.00
$35.00
Val
ue
(Mill
ion
s)
50 55 60 65 70 75 80 85 90 95 Calendar year
Landings
Value
b. West Coast
Figure 15.1 Annual landings and value of spiny lobster in the US by calendar year and
coast Ninety percent of the landings in Florida come from the Florida Keys (Monroe county) and most of the following discussion will focus on that area. The commercial fishery primarily harvests spiny lobsters with traps. As the number of traps increased in the fishery, landings increased, but landings leveled off as the numbers of traps exceeded 250 000 traps. In 1993, Florida’s Legislature instituted a Trap Reduction Program. The number of traps has been reduced from 939 000 traps to 582 000 traps with another reduction of 61 000 traps scheduled for July 1998. Spiny lobsters are also captured by diving and with bully nets. Increasingly, spiny lobsters are being landed and shipped live primarily to Taiwan and Japan with a few being shipped to Europe (Antozzi 1996).
2 Presented in Mérida

280
15.2 MANAGEMENT REGULATIONS Spiny lobsters are managed by the Florida Marine Fisheries Commission under Chapter 46-24, Florida Administrative Code. The regulations include an open season from August 6 through March 31, a Special Sport Season for recreational participants occurring the last Wednesday and Thursday of July; minimum size of 76.2 mm (3.0 in) carapace length; only diving, bully nets, or lobster traps are allowable gear; traps must have a minimum throat size of 88.9 mm x 152.4 mm (3 ½ in x 6 in) and be fished such that the throat is on top of the trap; fishers using traps must have certificates for their traps; commercial traps cannot be pulled at night and recreational divers may not collect spiny lobsters at night; the recreational bag limit is 6 lobsters per day with a maximum possession limit of 12 lobsters in the Florida Keys and elsewhere in the state the daily bag limit is 12 lobsters with a maximum possession limit of 24 lobsters. Additional regulations require that fishers selling their catch have restricted species and crawfish endorsements on their Saltwater Products license (SPL).
15.3 BIOLOGY The biology of spiny lobsters in Florida has been studied extensively for more than 30 years (see last year’s report for references). More recently, Cox et al. (1997) investigated the foraging behavior of spiny lobsters and prey densities in the Florida Keys and found that lobster gut contents contained a predominance of molluscs especially in rubble areas. Butler et al. . (1997) used mesocosms and field observations to examine the spatial scales of “postalgal” juveniles. They found that aggregated juveniles had higher mortality than non-aggregated ones. Butler and Herrnkind (In press) examined the efficacy of adding artificial shelters. Acosta et al. (1997) found that puerulus settlement increases during the first quarter of the moon phase, the highest settlement during the year centered on March, and they found a correlation between puerulus settlement and winds from the Northeast. Donahue et al. (1998) gave the equation for the numbers of eggs in a batch (E) as a function of carapace length (CL) as E = 88.7 CL2 - 219 200. An on-going study is looking at the growth of spiny lobsters in the wild from settlement at 6-7 mm using micro-coded wire tags. Based on the 59 lobsters that have been recaptured, the size of lobsters a year after settlement was 37-53 mm CL.
15.4 AVAILABLE DATA Fishery-dependent data
0
50
100
150
200
Kilo
gra
ms
per
tri
p
8507 8707 8907 9107 9307 9507 9707 Month
Figure 15.2 Monthly commercial catch per trip in the Florida Keys Commercial effort and landings information is collected through trip tickets. Wholesale dealers provide the Department of Environmental Protection with copies of their landing

281
receipts that includes the dealer number, Saltwater Product license number of the fisher, date of sale, county landed, area fished, water depth, time away from the dock, gear used on the trip, soak time for traps, number or traps, species landed, size category, and ex-vessel price paid. Catch rates from trip tickets are standardized with a general linear model and show a marked decline as the season progresses (Figure 15.2). Standardized catch rates from a general linear model are used as a tuning index in the stock assessment. In the past four seasons, there have been an average of 27 800 trips in the Florida Keys and those trips landed an average of 3 000 tonnes per fishing season. Data from the 1997-98 season are not complete but the landings reported to date are 3 056 tonnes from 28 205 trips with a value of $29 300 000. Beginning in July 1991, the recreational harvest in numbers of spiny lobster for the Florida Keys and the rest of the state for the Sport have been estimated using a mail survey of persons possessing a crawfish stamp on their Saltwater Fishing license. In the past four seasons, recreational participants have caught an average of 1 100 000 lobsters in July and August. A survey estimated the landings for the entire 1994-95 season and showed that 95% of the recreational harvests occurs between the Sport Season in July and the first Monday in September.
0
5
10
15
20
Ag
e-2
lob
ster
s (m
illio
ns)
87-88 89-90 91-92 93-94 95-96Fishing year
Females Males
Figure 15.3 Recruitment expressed as number of age-2 lobsters as estimated by sex
from the age-structured population analyses
0
50
100
150
200
250
300
Nu
mb
er p
er t
rip
0.0
0.5
1.0
1.5
2.0
2.5
3.0
Nu
mb
er p
er t
rap
9308 9408 9508 9608 9708 Month
Observer Tickets
Figure 15.4 Comparison on commercial catch per trip from trip tickets with number of lobsters per trap from the observer program
The final fishery dependent program is the on-board observer program that began in August 1993 and measures the total catch from between 100 and 150 traps per commercial trip. This program produces catch per trap and an independent measure of catch per trip. The

282
catch per trap from the observer program is also used to as a check to ensure that the catch per trip from trip tickets reflects the dynamics in the fishery (Figure 15.4). Also, this program provides a recruitment index as the number of lobsters between 76 mm and 80 mm that will be incorporated into future stock assessments. Lastly, this program identifies the number of under-sized lobsters that are used as bait. Fishery-independent data Beginning in April 1987, puerulus collectors were established at two locations in the Florida Keys. In 1992, sampling frequency changed from weekly samples to monthly sampling during the first quarter of the lunar phase after analyzing the first five year’s of data. The monthly number of recruits estimated from the onboard observer program was highly correlated with the number pueruli collected 21 and 32 months earlier. These times were similar to those Muller et al. (1997) estimated using probabilistic growth simulations of the time from settlement to recruitment as 23 months for males and 30 months for females. A new program is evaluating the efficacy of Special Protection Areas (SPA) that do not allow harvesting of any marine resources including spiny lobsters. Beginning in July 1997, divers have been collecting information to compare the density, sizes, and sex ratio of lobsters inside of the spas and outside. Those data are not available at this time but they have the potential for providing an independent tuning index for future stock assessments. Socio-economic data Prior to the Trap Reduction Program an average of 1 838 fishers (identified as unique SPL numbers) reported landings of spiny lobster and after the implementation of the Trap Reduction Program landings have been reported from about 1 100 fishers, but an average of 216 fishers produce 73% of the harvest. Similarly in the Florida Keys, in the past four seasons an average of 76 wholesale dealers have reported purchasing spiny lobsters but 20 dealers account for 84% of the landings. The ex-vessel price per kilogram reached a peak at $9.88 per kg in the 1995-96 season and then declined to $8.36 in the 1996-97 season and rebounded to $9.33 in the 1997-98 season. Important developments in the fishery There were no major developments in 1997-98 fishery. The commercial fishery was slower in August than in previous years but overall this season was the third highest season and the data are not complete at this time. The estimated recreational landings were higher with 1 270 000 lobsters collected in the Florida Keys. In July 1998, there will be an important development because the number of traps in the commercial fishery will be reduced by an additional 61 000 traps.
15.5 STATUS OF THE STOCK An age-structured stock assessment was developed for spiny lobster in the Florida Keys in 1996 with a probabilistic growth model (Muller et al. 1997) and again in 1997 using the same procedures (Integrated Catch at Age, version 1.2, Patterson and Melvin 1996). Higher landings in recent seasons reflect larger population sizes rather than higher fishing mortality rates. Recruitment began increasing after the number of traps was reduced beginning in 1993 (Figure 15.4). A possible explanation lies with the use of under-sized lobsters as attractants in traps. With fewer traps in the fishery, fewer small lobsters were used for bait.

283
16 LA PESQUERÍA DE LANGOSTA EN VENEZUELA3 J.C. Fernandez
16.1 INTRODUCCIÓN La pesquería de la langosta en Venezuela es una actividad exclusivamente artesanal, que se desarrolla en zonas litorales continentales e insulares bien delimitadas y cuya producción nacional promedio supera las quinientas (500) toneladas de peso bruto al año. La mayor parte de esta producción es capturada en el Parque Nacional Archpiélago Los Roques: 98% (FAO, 1983), 90% (FCLR, 1989) y 68% (Estadísticas SARPA-MAC 1996). La Fundación Científica Los Roques es una ONG privada sin fines de lucro que maneja la Estación de Biología Marina Dos Mosquises en el Archipiélago Los Roques desde 1967 y ha tenido una activa participación en los estudios sobre biología y pesquería de la langosta que se han llevado a cabo en el Archipiélago. Hasta 1982, los trabajos realizados sobre los aspectos básicos de la biología y pesquería de Langosta en Venezuela eran muy escasos y basaban su análisis en las características de producción recopiladas por el Ministerio de Agricultura y Cría, entre ellos cabe citarse el de Cobo de Barany et al. (1972) y los de Ginéz et al. (1978). A partir de 1983, la Fundación Científica Los Roques inicia los estudios in situ de la langosta, así Hauschild y Weil (1983) analizan aspectos de la biología y pesquería, Hauschild y Laughlin (1984) realizan un trabajo descriptivo de la pesquería de todo el Archipiélago, González (1987) estudia la fauna acompañante de la captura en nasas y, entre 1985 y 1989, la Fundación Científica Los Roques lleva a cabo un exhaustivo trabajo de investigación sobre todos los aspectos (biológicos,ambientales,pesqueros y socio-económicos) del sistema pesquero del Parque, con la participación de 16 investigadores y el auspicio de la O.E.A. denominado : "Análisis del Sistema Pesquero de la Langosta (Panulirus argus) y Evaluación de los recursos pesqueros complementarios en el Parque Nacional Archipiélago Los Roques, Venezuela". El presente reporte se basa principalmente en este trabajo (Informe a la O.E.A.1989) que incluye los trabajos de Hauschild y Weil (1983) y Hauschild y Laughlin (1984) y, adicionalmente, en estimaciones suministradas por el Servicio Autónomo de los Recursos Pesqueros y acuícolas, del Ministerio de Agricultura y Cría, para los años 1990-1996. pero en todo caso, los datos estan referidos específicamente al área del Archipiélago Los Roques. Tabla 16.1 Información sobre la pesquería de langosta espinosa (Panulirus argus) en
el Parque Nacional Archipiélago Los Roques
1983-1984 1984-1985 1985-1986 1986-1987 1987-1988
MAC FCLR MAC FCLR MAC FCLR MAC FCLR MAC FCLR
Producción total en t
147.9 237.9 114.4 293.5 99.5 N?D 72.5 221.8 64.4 166.7
Artes nasas buzos nasas buzos nasas buzos nasas buzos nasas buzos
Numero 9000 72 10000 85 9000 85 11550 85 11550 85
CPUE (kg) 0.117 7.8 0,123 7.4 nd nd 0.089 6.9 0.064 6.4
3 Presentado en Belize

284
16.2 CARACTERÍSTICAS GENERALES DEL ÁREA El Parque Nacional Archipiélago Los Roques es la formación insular coralina de mayor extensión y diversidad de especies de coral existente en el Caribe y el Atlántico, se encuentra ubicado entre los 11°48' y 11°58' de latitud norte y 66°32' y 66°52' longitud oeste, a unos 160 Km de la costa central de Venezuela, con una extensión aproximada de 812 km2. El Archipiélago consta de más de 50 islas, 200 bancos de arena y arrecifes coralinos, albergando todos los ecosistemas típicos de las zonas marítimas y costeras tropicales.
16.3 LANGOSTA EN VENEZUELA Tipo ó nivel La pesquería de langosta en Venezuela es una actividad estrictamente artesanal, no existen plantas procesadoras y el producto se pesa, transporta y comercializa entero, los transportistas comercializan el producto en restaurantes y pescaderías, estas últimas se encargan de su distribución y exportación, existen actualmente algunos empresarios que compran la langosta en forma directa y la transportan via aérea a tierra firme venezolana, para proceder a su inmediata exportación, esta actividad no maneja aún fuertes volúmenes de producto. Areas de pesca y producción La actividad se lleva a cabo en las localidades del Archipiélago Los Testigos (5-15% de la producción nacional), la isla de Margarita (5-15%), estado Sucre (2-8% de la producción), y otras regiones (<15%). La producción del Archipiélago de Los Roques alcanza, por si sola, entre el 70 y 98% del total nacional, con un promedio anual de 250-450 toneladas. En el Archipiélago Los Roques, el área de pesca cubre prácticamente todo el ámbito interior, utilizando las áreas cercanas a los fondos coralinos (arrecifes de barrera o parches) y praderas de fanerógamas marinas, tanto en la laguna central, con profundidades de 0-5 mts. como en otras áreas hasta 40mt de profundidad, algunos pescadores colocan nasas al norte y este del archipiélago, capturando langostas hasta los 90 y 100 mt. de profundidad. Temporada de pesca permitida La pesca de la langosta abarca un período de 6 meses, desde el 1° de noviembre de cada año, al 31 de abril del año siguiente. Embarcaciones La pesca de la langosta en el Archipiélago Los Roques se lleva a cabo principalmente con embarcaciones de 7-9 m (20ft) de eslora denominadas"peñeros", equipadas con 1 motor fuera de borda de 48 HP y una tripulación de 4-5 personas (aprox. 110 embarcaciones activas para 1996), en cada vez menor grado es el uso de embarcaciones algo mayores denominadas "Lanchas" ó "tres puños", de 9-12 m (30-35ft) de eslora, equipadas con 1 motor Diesel de diferentes potencias y una tripulación de 5-7 personas y dedicadas exclusivamente al arte de nasas (5 embarcaciones activas para 1996). Un tercer tipo de embarcación lo constituyen las embarcaciones de 13-18 m. de eslora (40-50ft) del tipo Pargo-Mero, denominadas "lanchas hieleras", las cuales se dedican al transporte de la langosta para su venta en tierra firme y otros puertos, así como de transportar provisiones al archipiélago. Muy eventualmente, y en otras localidades, estas embarcaciones se dedican a la pesca con arte de nasa. Artes de Pesca La langosta es capturada en el archipiélago mediante el uso de nasas y buceo a pulmón libre; el tren enmallador es un arte de menor uso tradicionalmente y prohibido en el Parque desde 1994; las nasas y los trenes se colocan generalmente en fondos arenosos, franjas

285
entre formaciones coralinas y praderas de hierbas marinas, aprovechando el movimiento nocturno de la langosta de su refugio a las zonas de alimentación. Las áreas de buceo a pulmón libre son directamente las zonas de refugio de la langosta ubicadas en las barreras arrecifales cercanas a los cayos o en la laguna interna. Debido a los costos (fundamentalmente), de eficiencia de captura y razones de otro tipo, la pesca con nasas ha ido cediendo espacio en las solicitudes de permisos al arte de buceo a pulmón libre, la cual es ejercida principalmente por pescadores locales, mientras que el arte de nasa lo realizan los pescadores provenientes de la isla de Margarita, los cuales mantienen tradición pesquera en el Archipiélago desde finales de la década de 1920.
16.4 CARACTERÍSTICAS DE CONTROL DE MANEJO DEL RECURSO El control de la pesca en Venezuela es ejercido por el Servicio Autónomo de los Recursos Pesqueros y Acuícolas (SARPA) del Ministerio de Agricultura y Cría (M.A.C.). Adicionalmente, la actividad es controlada por el Instituto Nacional de Parques (Inparques), cuando la actividad se realiza dentro de Parques Nacionales. En el Parque Nacional Archipiélago Los Roques, donde se captura el 90% de la Langosta, el control se lleva a cabo mediante los siguientes instrumentos: • Temporada de veda : desde el 01 de mayo, hasta el 01 de noviembre.
• Número máximo de permisos establecido anualmente y otorgado (en Los Roques), solamente a pescadores que hayan tenido permiso anteriormente (a partir de 1994 no se otorgan permisos a nuevos pescadores)
• Permiso anual e intransferible, a nombre del "patrón" de pesca y de su embarcación, dicho permiso establece : temporada, áreas de pesca, arte utilizado (solo 1 arte por patrón), número máximo de nasas: 200 nasas/patrón desde 1972-93 y 100 nasas/patrón desde 1994 , talla mínima de captura: 100mm L.c. hasta 1993 y 120mm desde 1994.y peso mínimo de captura: 1 Kg.total
• Registro de la captura a través de funcionarios en los centros de acopio establecidos en el Archipiélago, donde los transportistas compran el producto (dos veces por semana)
• Marcaje de las nasas permitidas al inicio de la temporada y revisión de las mismas al término de la misma.
• Control del transporte mediante guías (certificados) de movilización, otorgados unicamente a los transportistas autorizados.
A pesar de estos controles, siempre existe un porcentaje del producto que escapa de la reglamentación y que se puede establecer, en forma confialble, en una cantidad no mayor del 5-7% en el Archipiélago, y no mayor del 10-12% en todo el país (ya que el Parque produce el 90% de la captura nacional).
16.5 CARACTERÍSTICAS BIOLÓGICAS Y PESQUERAS DE LA POBLACIÓN DE Panulirus argus EN EL P.N.A.L.R.
En los anexos presentamos un cuadro resumen de la información Pesquera y Biológica detallada, obtenida por FCLR entre 1983 y 1989, así como algunos reportes de producción del Ministerio de Agricultura y Cría. El procesamiento adecuado de la información oficial es una tarea que comienza a desarrollarse para obtener información necesaria para la evaluación del Stock de esta pesquería.

286
16.6 CONSIDERACIONES FINALES Si bien la pesca de langosta no tiene la importancia económica para Venezuela que tiene para otros paises del Caribe ni maneja cuotas de extracción tan importantes como éstos, no deja de tener importancia esta pesquería en la dinámica poblacional de otros Stocks de la región, por encontrarse en el límite sur del Caribe, en el paso de las principales corrientes que potencialmente transportan larvas y también por ser una pesquería poco desarrollada, lo que presuponemos que su potencial no ha sido severamente alterado. El hecho de que el 90% de la pesca de langosta en Venezuela se lleve a cabo en un area bien delimitada, protegida legalmente, con características bien definidas y una Estación de Campo para llevar a cabo investigaciones biológicas, hacen del PNALR un interesante laboratorio para aclarar la dinámica poblacional de la especie en el Caribe Sur.

287
Fig 16.1 Areas de pesca de la langosta en función de las artes utilizadas para su captura en el Parque Nacional Archipiélago de Los Roques, Venezuela

288
17 REPORTE ADICIONAL DE VENEZUELA4 G. Andrade de Pasquier
17.1 DESCRIPCIÓN DE LA PESQUERÍA La pesquería de la langosta espinosa en Venezuela es una actividad exclusivamente artesanal, que se desarrolla en zonas litorales continentales e insulares bien delimitadas, cuya producción nacional promedio supera los 400 mil kilogramos de peso entero al año (Fig. 17.1). La mayor parte de esta producción es capturada en el Parque Nacional Archipiélago Los Roques, representando entre 60 y 70%, y en las islas de Los Testigos y La Blanquilla (Dependencia Federal), las cuales aportan entre el 20 y 30% al total nacional (Estadísticas MAC-SARPA 1997).
0100000200000300000400000500000600000700000800000900000
1000000
1977
1980
1983
1986
1989
1992
1995
1998
Temporadas (6 meses/año)
Cap
tura
s (k
g)
Total Nacional Total PNALR
Fig. 17.1 Capturas en kilogramos de peso entero de langosta en Venezuela y en el Parque Nacional Archipiélago de Los Roques (PNALR).
La langosta no es procesada por lo que el producto se pesa, transporta y comercializa entero, los transportistas venden el producto en restaurantes y pescaderías, estas últimas se encargan de su distribución y exportación, existen actualmente algunos empresarios que compran la langosta en forma directa y la transportan via aérea a tierra firme venezolana, para proceder a su inmediata exportación, esta actividad no maneja aún fuertes volúmenes de producto. La langosta se pesca con tren enmallador, buceo a pulmón y nasas (trampas), esto representó el 7%, 32% y 61% de la captura respectivamente, para los años 1986-1988, el tren enmallador está prohibido desde 1994. Las embarcaciones que se utilizan son de tres tipos; los peñeros de 7 a 9 m de eslora, las lanchas o tres puños de 10 a 12 m de eslora y las lanchas hieleras de 13 a 18 m de eslora. Los registros de capturas señalan que en los últimos 6 años hay un incremento significativo de estas, posiblemente debido a la introducción de nuevas áreas de pesca, como lo son Los Testigos y La Blanquilla, aumentando de un promedio de 300 toneladas, desde 1977 hasta 1991, a 600 toneladas, desde 1992 hasta 1997 (Tabla 17.1 y Fig. 17.1).
4 Presentado en Mérida

289
0,02000,04000,06000,08000,0
10000,012000,014000,016000,0
199 3
199 4
199 5
199 6
199 7
Temporadas (6 meses/año)
CPU
E (k
g/bu
zo/te
mpo
rada
)
0,020,040,060,080,0100,0
CPU
E (k
g/na
sa/te
mpo
rada
)
kg/No. buzos kg/No. nasas
Fig. 17.2 Capturas por unidad de esfuerzo (CPUE) por arte de pesca para la langosta
en Venezuela durante los últimos cinco años.
Tabla 17.1 Capturas en kilogramos de peso entero de langosta en Venezuela y en Parque Nacional Archipiélago de Los Roques (PNALR).
Años Venezuela PNALR
(kg) (kg) 1977 125297 1978 83527 1979 137293 1980 120000 1981 156041 1982 137300 1983 156756 1984 147905 1985 202481 114366 1986 239707 99496 1987 183780 72450 1988 200629 64385 1989 273386 87734 1990 191143 184000 1991 141294 94382 1992 371424 169580 1993 940304 440980 1994 763350 272038 1995 629305 341676 1996 611455 333629 1997 646792 330367

290
Tabla 17.2 Capturas por unidad de esfuerzo (CPUE) por arte de pesca para la langosta en Venezuela durante los últimos cinco años.
Capturas Días de
pesca Días de pesca
No. Nasas/
temporada
No. Buzos/temp.
CPUE kg/nasa/
temp.
CPUE kg/buzo/
temp.
CPUE kg/nasa/
temp.
CPUEkg/buzo/
temp. kg nasas buzos nasas buzos kg kg kg kg
940304 170 119 10520 62 89,4 15166,2 5531,2 7901,7
763350 180 119 9520 148 80,2 5157,8 4240,8 6414,7 629305 180 119 9520 148 66,1 4252,1 3496,1 5288,3 611455 181 120 6560 195 93,2 3135,7 3378,2 5095,5 646792 181 120 7120 218 90,8 2966,9 3573,4 5389,9
17.2 MEDIDAS DE REGULACIÓN La pesca de la langosta abarca un período de 6 meses, desde el 01 de noviembre al 30 de abril del año siguiente. El control de la pesca en Venezuela es ejercido por el Servicio Autónomo de los Recursos Pesqueros y Acuícolas (SARPA), del Ministerio de Agricultura y Cría (M.A.C.). Adicionalmente, la actividad es controlada por el Instituto Nacional de Parques (Inparques), cuando ésta se realiza dentro de Parques Nacionales. Las medidas de regulación abarcan: • Temporada de veda: desde el 01 de mayo hasta el 30 de octubre.
• Número máximo de permisos establecidos anualmente y otorgados solamente a pescadores que hayan tenido permiso anteriormente, a partir de 1994 no se otorgan permisos a nuevos pescadores.
• Permiso anual e intransferible, a nombre del "patrón" de pesca y de su embarcación, dicho permiso establece la temporada, áreas de pesca, arte utilizado (solo 1 arte por patrón).
• Número máximo de nasas permitido 200 nasas/patrón desde 1972-93 y 100 nasas/patrón desde 1994.
• Talla mínima de captura: 100 mm de longitud cefalotorácica hasta 1993 y 120 mm desde 1994.
• Peso mínimo de captura: 1 kg total por individuo.
• Registro de la captura a través de funcionarios en los centros de acopio establecidos, donde los transportistas compran el producto.
• Marcaje de las nasas permitidas al inicio de la temporada y revisión de las mismas al término de la misma.
• Control del transporte mediante guías (certificados) de movilización, otorgados únicamente a los transportistas autorizados.
A pesar de estos controles, siempre existe un porcentaje del producto que escapa de la reglamentación y que se puede establecer, en forma confiable, en una cantidad no mayor del 5 al 7% en el Archipiélago, y no mayor del 10 al 12% en todo el país.

291
17.3 BIOLOGÍA Las primeros trabajos sobre la langosta espinosa tratan sobre las características de la producción pesquera (Cobo de Barany et al. 1975 y Ginéz et al. 1978). Hauschild y Weil (1983) analizan aspectos de la biología y pesquería. Hauschild y Laughlin (1985) realizan un trabajo descriptivo de la pesquería. González (1987) estudia la fauna acompañante de la captura en nasas, por último la Fundación Científica Los Roques (1989) reporta algunos aspectos biológicos, ambientales, pesqueros y socio-económicos. Estos trabajos se refieren a la langosta capturada en el Parque Nacional Archipiélago Los Roques (PNALR) y tratan básicamente sobre las características generales del archipiélago, aspectos demográficos y socio-educativos, aspectos pesqueros como tipo de embarcaciones, áreas y artes de pesca, la información biológica se refiere a la distribución geográfica, diferenciación y proporción sexual, tallas de madurez sexual, épocas de reproducción, alimentación y cultivo.
17.4 DATOS DISPONIBLES Datos dependientes de la pesquería Las capturas anuales de la pesquería comercial están disponibles a partir del año 1977 para el PNALR y desde el año 1985 para éste y el total nacional (Fig. 17.1). Se dispone de algunos índices pesqueros como número de trampas y número de buzos, que pescaron durante la temporada permitida para los últimos 5 años, sin embargo, existen algunos datos sobre CPUE, por arte de pesca para las temporadas correspondientes al período 1983-1988 en el PNALR. Las CPUE discriminada por arte de pesca (nasas y buceo) indica una ligera tendencia a la disminución de las CPUE en el caso de los buzos debido al incremento en el número de estos mientras que las CPUE para las nasas muestra un leve aumento (Tabla 17.2, Fig. 17.2). La información sobre las capturas de langostas correspondiente a la temporada 1996-1997 aún no ha sido recolectada y procesada completamente, sin embargo, se ha estimado una captura de 646792 kg para esta temporada (División de Estadísticas e Informática, datos no publicados), manteniéndose estables las capturas en los últimos 3 años, con un promedio de 629184 kg (Tabla 17.1, Fig. 17.1). Datos socioeconómicos No hay suficientes datos económicos para un análisis de rentabilidad del recurso, se dispone de información para el PNALR sobre ingreso bruto, costos de producción y utilidad neta estimados por arte para 1987, también se dispone de balances de costos de operación e ingresos durante 1996 y 1997 sólo para una pequeña zona de pesca, correspondiente al estado Falcón, el cual apenas aporta 0,2% a la producción nacional. Para 1987 se estimó una población dependiente de esta actividad de 767 personas, de las cuales el 79,5 % son pescadores, el resto se dedica a trabajos complementarios. Desarrollo importante en la pesquería Se obtuvo información sobre las capturas anuales para todas las áreas de pesca en Venezuela desde 1985 y sobre el número de nasas y de buzos que pescaron durante la temporada permitida a partir de 1993.
17.5 ESTADO DEL RECURSO No se ha realizado una evaluación cuantitativa del stock por lo que el estado de explotación del mismo se desconoce. El incremento sustancial de las capturas desde 1993 probablemente se debe a la explotación de nuevas áreas de pesca y al aumento del número de buzos.

292
18 REFERENCES Compiled by M. E. de León, J. Schofield and S. C. Venema
Acosta, C.A., Matthews, T.R. and Butler, M.J. IV. (1997). Temporal pattern and transport
processes in recruitment of spiny lobster, Panulirus argus, postlarvae to south Florida. Marine Biology 129:79-85.
Aiken, D.E. (1980). Molting and growth. pp. 91-163. In: Cobb, J.S. and Phillips, B.F. (eds). The Biology and Management of Lobsters, New York, Academic Press, Vol. 1: Physiology and behavior.
Aiken, D.E. and Waddy, S.L. (1980). Reproductive biology. pp. 215-276 In: Cobb, J.S. and Phillips, B.F. (eds). The Biology and Management of Lobsters, New York, Academic Press, Vol. I: Physiology and Behavior.
Aiken, K. (1977). Jamaica spiny lobster investigations. In: Stewart Jr., H.B. (ed). CICAR II Symposium on progress in marine research in the Caribbean and adjacent regions, Caracas, Venezuela, 12-14 julio 1976. FAO Fish. Rep. 200: 11-22.
Aiken, K. (1983). Further investigation of spiny lobster fishery, Jamaica. FAO Fish. Rep. 278, Suppl. 1:177-191.
Aiken, K. (1984). Lobsters - their biology and conservation in Jamaica. Jamaica Journal 17 (4): 44-47
Alegría, J.R. (1973). Aspectos biológicos pesqueros de la langosta espinosa Panulirus argus (Latreille), en la Guajira Colombia. INDERENA.
Alegría, J.R. (1982). Algunos aspectos biológicos pesqueros de la langosta Panulirus argus (Latreille) en la Guajira colombiana. INDERENA Divulgación Pesquera. Bogotá. XVIII (1 y 2): 1-27.
Alfonso, A., Sotomayor, R., Cruz, R., Puga, R. y León, M.E. de (1995). Software para la evaluación de la biología y la pesquería de la langosta (P. argus) en Cuba. Rev. Cub. Invest. Pesq. 19 (2): 77-81.
Alfonso, I., Frías, M.P., Baisre, J.A. y Campos, A. (1991). Distribución y abundancia de larvas de la langosta Panulirus argus en aguas alrededor de Cuba. Rev. Invest. Mar. 12 (1-3):5-19.
Alfonso, I., Frías, M.P., Baisre, J.A. y Hernández, B. (1995). Distribución vertical de filosomas de Panulirus argus y su relación con algunos factores hidroclimáticos al S del Golfo de Batabanó. Rev. Cub. Inv. Pesq. 19 (1): 3-9.
Alvarado, M. (1992a). Crucero de inspección de la langosta Panulirus argus del océano Atlántico nicaragüense a bordo de la M/N "PROMAR 54" durante el mes de diciembre 1991. Informe técnico CIP 141:17 p.
Alvarado, M. (1992b). Crucero de inspección de la langosta Panulirus argus del océano Atlántico nicaragüense a bordo de la M/N "SEA FALCON" durante el mes de febrero de 1992. Informe técnico CIP 144:24 p.
Alvarez, E., Briones-Fourzán, P. and Negrete-Soto, F. (1993). Occurrence and seasonal variations of spiny lobster, Panulirus argus (Latreille), on the shelf outside of Bahía de la Ascensión, Mexico. U.S. Fish Bull. 91:808-815.
Andree, S.W. (1981). Locomotory activity patterns and food items of benthic post-larval spiny lobsters, Panulirus argus. MS thesis, Florida State University.
Anisimov, V.P. et al. (1986). Informe de los resultados de las investigaciones cooperativas nicaragüense-soviéticas de los recursos biológicos en las áreas marítimas de la república de Nicaragua, realizadas en 1984-85., Min. de la Indust. Pesq. de la U.R.S.S./AtlantNIRO: 265 p.

293
Anonymous. (1992). Catastrophic mortality of sponges affects juvenile spiny lobster populations. The Lobster Newsletter 5(2):1-2.
Antozzi, W.O. (1996). The developing live spiny lobster industry. NOAA Technical Memorandum NMFS-SEFSC-395. 8 p.
Arango, J.A. y López, H.A. (1992). Contribución al conocimiento biológico pesquero de los camarones de profundidad rojo real Pleoticus robustus. SMITH. 1885 y la gamba Aritha emorpha. RISSO. 1828. Zona norte del caribe colombiano. Universidad Jorge Tadeo Lozano Fac. de Biol. Mar. Tesis profesional. 81 p.
Arango, L.L. y Jadid, A. (1992). Evaluación de la población de la langosta espinosa Panulirus argus en las islas del Rosario. Universidad Jorge Tadeo Lozano. Fac. de Biol. Mar. Tesis profesional.
Arango, L. y Márquez, E. (1993). Evaluación de la población de caracol pala Strombus gigas y de la langosta espinosa Panulirus argus en las Islas de la Providencia y Santa Catalina. Caribe colombiano. INPA Santafé Bogotá. Inf. Téc. 83 p.
Arauz, H. (1992). Crucero de inspección de langosta Panulirus argus del océano Atlántico nicaragüense a bordo de la M/N "CAPITAN RONNIE" durante el periodo de junio 09 -julio 10 de 1992. Informe técnico CIP 154:56 p.
Arauz, H. y Alvarado, M. (1992). Crucero de inspección de la langosta Panulirus argus del océano Atlántico nicaragüense a bordo de la motonave "CAPITAN DAVID". Informe técnico CIP 150:14 p.
Arce A.M. (1990). Estimación del crecimiento de langosta Panulirus argus (Latreille) con metodologías convencionales y a través de funciones de singularidad. Tesis de Maestría en Ciencias. CINVESTAV, Unidad Mérida. 94 pp.
Arce A.M., Aguilar-Dávila, W., Sosa-Cordero, E. and Caddy, J.F. (1997). Artificial shelters (casitas) as habitats for juvenile spiny lobster Panulirus argus in the Mexican Caribbean. Mar. Ecol. Prog. Ser. 158: 217-224.
Arce, A.M., Seijo, J.C. y Salas, S. (1991). Estimación del crecimiento de la langosta Panulirus argus (Latreille) mediante funciones de singularidad. Rev. Inv. Mar. 12(1-3): 184-192.
Arceo, P., Arce, A.M., Briones, P., Lozano, E., Salas, S., Seijo, J.C. y Sosa-Cordero, E. (en prensa). La pesquería de langosta Panulirus argus en la plataforma de Yucatán y Caribe mexicano, pp. 81-106. En: Flores-Hernández, D., Sánchez-Gil, P., Seijo, J.C. y Arreguín-Sánchez, F. (eds.) Análisis y Diagnóstico de los Recursos Pesqueros Críticos del Golfo de México. Universidad Autónoma de Campeche. EPOMEX Serie Científica, 7.
Arosemena, D.H. (1982). La pesquería de langostas en la región Atlántica de Panamá. Contribución No. 10, Memorias del Grupo de Trabajo Sobre la Langosta, FAO/WECAF/PNUD, INFORMES WECAF No. 36 (Es): p. 221-233.
Arostegui, A. (1982). Descripción de la pesquería de la langosta en el Océano Atlántico de Nicaragua. Contribución No 9, Memorias del Grupo de Trabajo Sobre la Langosta, FAO/WECAF/PNUD, Informes WECAF No. 36 (Es): 199-220
Arostegui, A. y L. Villegas (1980). Descripción de a pesquería de la langosta en el océano Atlántico de Nicaragua. Memorias del Grupo de Trabajo sobre la langosta llevado a cabo en San José, Costa Rica. Noviembre 1980. WECAF Reports No. 36(Es). PNUD/FAO 23 p.

294
Arreguín-Sánchez, F. y González-Cano, J. (1994). Uso de hábitats artificiales en la pesquería de langosta y su relación con la producción y eficiencia de pesca. In: Gónzalez-Cano, J. y Cruz, R. (eds). Primer Taller Binacional México-Cuba: La utilización de refugios artificiales en las pesquerías de langosta: sus implicaciones en la dinámica y manejo del recurso. pp. 150-160. Islas Mujeres, Mayo 1993. ISBN 968-817-30 SEPESCA-INP-CIP.
Auil, S. (1993). An analysis of the Belize coral reef finfish fishery. M.phil thesis for the University of the West Indies. Mona Campus, Jamaica. 141p.
Báez, M., Carmenati, E. y Coyula, R. (1994). Edad y crecimiento de la langosta Panulirus argus a partir del análisis de frecuencias de tallas en la plataforma suroccidental de Cuba. Rev. Invest. Mar. Vol. 15.
Báez, M., Díaz, E., Brito, R. y Cruz, R. (1991). Edad y crecimiento de la langosta Panulirus argus (Latreille) en la plataforma suroccidental de Cuba Rev. Invest. Mar. 12 (1-3):193-201.
Bahamas Government (1977). The fisheries resources (jurisdiction and conservation) act, 1977.
Bahamas Government (1986). The fisheries resources (jurisdiction and conservation) regulations, 1986.
Bahamas, Department of Fisheries (1997). The commercial fishing industry. Bahamas, Department of Fisheries (1998). Department of fisheries annual report, 1997. Baisre, J.A. (1964). Sobre los estadíos larvales de la langosta común Panulirus argus.
Contrib. 19, Centro de Investigaciones Pesqueras. Baisre, J.A. (1976). Distribución de las larvas de Panulirus argus y Scyllarus americanus
(Crustacea, Decapoda) en aguas alrededor de Cuba. Rev. Inv. Inst. nac. Pesca, 2(3): 277-97.
Baisre, J.A. (1993). Marine fishery resources of the Antilles: Part 4. Cuba. FAO Fish. Tech. Pap. 236: 181-235.
Baisre, J.A and Alfonso, I. (1994). Later stage larvae of Panulirus guttatus (Latreille, 1804) (Decapoda, Palinuridae) with notes on the identification of phyllosomata of Panulirus in the Caribbean Sea. Crustaceana 66(1): 32-44.
Baisre, J.A. and Cruz, R. (1994). The Cuban spiny lobster fishery pp. 119-132 In: Phillips, B.F. Cobb, J.S. and Kittaka, J. (eds). Spiny Lobster Management, London, Blackwell Scientific Publications. Oxford, Fishing New Books.
Bannerot, S.P., Ryther, J.H. and Clark, M. (1992). Large-scale assessment of recruitment of postlarval spiny lobsters, Panulirus argus, to Antigua, West Indies. Proc. Gulf Caribb. Fish. Inst., 41: 471-486.
Barber, S.M. (1982). The relationship between ovarian development and length of pleopodal setae in the Florida Spiny Lobster. Proc. Workshop Fla. Spiny Lobster Res. & Management, p.9.
Barnutty, R. (1994). Crucero de monitoreo al recurso langosta (Panulirus argus) realizado a bordo de la M/N “PROMAR 64” en el océano Atlántico nicaragüense en el periodo que va del 03 al 23 de noviembre de 1994. Diciembre. Inf. Téc. CIRH. 180. 29 p.
Barnutty, R. (1996a). Análisis de la composición porcentual de tallas de langosta P. argus capturadas en 1995-1996.
Barnutty, R. (1996b). Comparación del comportamiento de las categorías de langosta P. argus capturada por medio de buceo artesanal, buceo industrial y por artesanales que utilizan nasas y que laboran en el área de los Cayos Miskitos en la RAAN. Octubre. CIRH. 9 p.

295
Barnutty, R. (1996c). Información sobre la biología, ecología, distribución y pesquería de la langosta verde del Pacifico de Nicaragua Panulirus gracilis Streets (1871). CIRH. 8 p.
Barnutty, R. y Moraga, E. (1995a). Crucero de monitoreo al recurso langosta (P. argus) realizado a bordo de la M/N “PROMAR 41” en el océano Atlántico de Nicaragua en el periodo que va del 12 de junio al 2 de julio de 1995. Inf.Téc. CIRH. 183. 24 p.
Barnutty, R. y Moraga, E. (1995b). Crucero de monitoreo al recurso langosta (P. argus) realizado a bordo de la M/N “PROMAR 41” en el océano Atlántico de Nicaragua en noviembre-diciembre de 1995. Inf.Téc. CIRH. 186. 17 p.
Barnutty, R. y Moraga, E. (1996). Resumen de monitoreos al recurso langosta P. argus realizados con financiamiento directo del proyecto NORAD, NIC-011 a partir de diciembre 93 a diciembre del 95. Enero. Inf.Téc. CIRH. 185. 8 p.
Beck, U., Infante, J., Aquino, C. y Reyes, Z. (1994). Algunos problemas en la gestión de los recursos costeros en las provincias de Barahona y Pedernales. En: Reportes del PROPESCAR-SUR: Contribuciones al conocimiento de las pesquerías en la República Dominicana/PROPESCAR-SUR. Vol. 1. Barahona, R:D.
Berrill, M. (1975). Gregarious behavior of juvenile spiny lobsters, Panulirus argus (Crustacea: Decapoda). Bull. Mar. Sci. 25: 1-16.
Berry, P.F. (1971a). The spiny lobster (Palinuridae) of the east coast of Southern Africa. Distribution and ecological notes. Invest. Rep.Oceanogr. Res. Inst. 27:1-23.
Berry, P.F. (1971b). The biology of the spiny lobster Panulirus homarus (Linnaeus) off east coast of Southern Africa. Invest. Rep.Oceanogr. Res. Inst. 28: 1-75.
Berry, P.F. and Smale, M.J. (1980). An estimate of production and consumption rates in the spiny lobster Panulirus homarus on a shallow littoral reef off the Natal coast, South Africa. Mar. Ecol. Prog. Ser. 2: 237-243.
Bertalanffy, L. von (1938). A quantitative theory of organic growth laws (Inquiries on growth laws. II). Hum. Biol., 10(2):181-213.
Bertelsen, R.D. and Hunt, J.H. (1991). Results of the 1991 mail surveys of recreational lobster fishermen (special sport season and regular season surveys). Report to the Florida Marine Fisheries Commission. December 1991. 27 p.
Berthou, P. et l´Espagnol, P. (1997). Rapport de missions. Appui scientifique et technique au centre regional de recherches halieutiques de la Caribe centramericane. IFREMER-PRADEPESCA (février - avril, 1997).
Beverton, R.J.H. and Holt, S.J. (1957). On the dynamics of exploited fish populations. Fish. Invest., Minist. Agric. Fish. Food London, G. B. (2 Sea Fish), ser. 2, 19, 533 pp.
Bohnsack, J., Meyers, S., Appeldoorn, R., Beets, J., Matos, D. and Sadovy, Y. (1991). Stock Assessment of Spiny Lobster, Panulirus argus, in the U.S. Caribbean. Final stock assessment and fishery evaluation (SAFE) report for the workshop on spiny lobster resources in the U.S. Caribbean, San Juan, Puerto Rico, September 11-13, 1990. 50 pp.
Booth, J.D. and Breen, J.A. (1994). The New Zealand fishery for Jasus edwardsii and J. verreauxi. pp. 64-75, In: Phillips, B.F., Cobb, J.S. and Kittaka, J. (1994). Spiny lobster management. Oxford Fishing News Books (Blackwell Scientific Publications), 550 pp.
Borges, G.A. (1964). Determinação de parâmetros biométricos em Panulirus argus (Latreille). Bol. Est. Pesca, 4(1):3-10,.
Borges, G.A. (1965). Parâmetros biométricos em Panulirus laevicauda (Latreille). Bol. Est. Pesca, 5(6):7-16.
Bowen, B.K. (1980). Spiny lobsters fisheries management, pp. 243-217. In: Cobb, J.S. and Phillips, B.F. (eds). The Biology and Management of Lobsters, New York, Academic Press, Vol. 2.

296
Bowmen, T.E. and Abele, L.G. (1982). Classification of the recent crustacea. pp. 1-27 In: Abele, L.G. (ed). The Biology of Crustacea. New York: Academic Press, Vol 1: Systematics, the fossil record and Biogeography.
Breen, P.A. and Booth, J.D. (1989). Puerulus and juvenile abundance in the rock lobster Jasus edwardsii at Stewart Island, New Zealand. N.Z. J. Mar. Freswat. Res. 23 (4): 519-523.
Briones-Fourzán, P. (1994). Variability in postlarval recruitment of the spiny lobster Panulirus argus (Latreille, 1804) to the Mexican Caribbean coast. Proceedings of the Fourth International Workshop on Lobster Biology and Management, 1993. Crustaceana 66 (3): 326-340.
Briones, P. and Lozano, E. (1994). The spiny lobster fisheries in Mexico. pp. 144-157. In: Phillips, B.F., Cobb, J.S. and Kittaka, J. (eds). Spiny Lobster Management, Oxford, Fishing News Books, Blackwell Sci. Pub. 550 p.
Briones-Fourzán, P. and Gutiérrez-Carbonell, D. (1992). Postlarval recruitment of the spiny lobster, Panulirus argus (Latreille 1804), in Bahía de la Ascensión, Q.Roo, Mexico. Proc. Gulf Caribb. Fish. Inst. 41:492-507.
Brito, M. y Suarez, A.M. (1994). Algas asociadas a Laurencia implicata (Ceramiales, Rhodophyta) en la cayeria de Bocas de Alonzo, Cuba. Rev. Invest. Mar. 15 (2): 93-98
Brown, R.S. and Phillips, B.F. (1994). The current status of Australia’s rock lobster fisheries, pp. 33-63. In: Phillips, B.F., Cobb, J.S. and Kittaka, J. (1994). Spiny lobster management. Oxford Fishing News Books (Blackwell Scientific Publications), 550 pp.
Buesa, J.R. (1965a), Biología de la langosta Panulirus argus Latreille (Crustácea, Decápoda, Reptantia) en Cuba. Instituto Nacional de la Pesca; 230 p.
Buesa, R.J. (1965b). Aspecto biológico pesquero. pp. 108-230 In: Buesa, R.J. (ed). Biología de la langosta Panulirus argus Latreille (Crustacea, Decapoda, Reptantia) en Cuba. Instituto Nacional de la Pesca, Havana, 230 p.
Buesa, R.J. (1972). La langosta espinosa P. argus: su pesca y biología en aguas cubanas. INP/CIP, Cuba, Reun. Balance Trab., 3(1):29-78.
Buesa, R.J. y Mota-Alves, M.I. (1970). Escala de colores para el estudio del ciclo reproductor de la langosta Panulirus argus (Latr.) en el área del Mar Caribe. Arq. Ciên. Mar 10 (1): 107-109.
Buesa, R.J. y Mota-Alves, M.I. (1971). Escala de colores para el estudio del ciclo reproductor de la langosta Panulirus argus (Latr.) en el área del Mar Caribe. FAO Fish. Rep. 71 (2): 9-12.
Buesa, R.J. y Paiva, M.P. (1971). Pesquerias de la langosta Panulirus argus (Latreille) en el Brasil y en Cuba. Arq. Ciên. Mar, 9 (1): 77-81
Butler, M.J. IV (1994). Lobster recruitment modeling and research services. Final report to Florida Department of Environmental Protection, Florida Marine Research Institute, St. Petersburg, FL. Contract No. 37202050300EO11, 45 p.
Butler, M.J. IV and Herrnkind, W.F. (1997). A test of recruitment limitation and the potential for artificial enhancement of spiny lobster (Panulirus argus) populations in Florida. Can. J. Fish. Aquat. Sci. 54: 452-463.
Butler, M.J. IV, Herrnkind, W.F. and Hunt, J.H. (1997). Factors affecting the recruitment of juvenile Caribbean spiny lobsters dwelling in macroalgae. Bull. Mar. Sci. 61:3-19.
Caddy, J.F. (1977). Approaches to a simplified yield-per-recruit model for Crustacea, with particular reference to the American lobster Homarus americanus. Fish. Mar Serv. MS.
Caddy, J.F. (1989). A personal perspective on future cooperative research on lobsters. Proc. Gulf & Caribb. Fish. Inst., 39:302-317.

297
Calero, O. (1989). Crucero de inspección y monitoreo de la langosta Panulirus argus del océano Atlántico nicaragüense a bordo de la Moto Nave hondureña "LUCKY DAME" durante el periodo comprendido de julio a agosto de 1989. Informe técnico CIP 25:15 p.
Calero, O. (1990a). Crucero de inspectoria y monitoreo de langosta Panulirus argus del océano Atlántico nicaragüense a bordo de la M/N “DAVE.E.Mc.” durante el periodo comprendido de septiembre a octubre de 1989. Informe técnico CIP 50:20 p.
Calero, O. (1990b). Crucero de inspección y monitoreo de la langosta Panulirus argus del océano Atlántico nicaragüense a bordo de la M/N hondureña "LIBERTY BELLE" durante el periodo comprendido de noviembre a diciembre 1989. Informe técnico CIP 47:15 p.
Calinski, M.D. and Lyons, W.G. (1983). Swimming behavior of the puerulus of the spiny lobster Panulirus argus (Latreille, 1804) (Crustacea : Palinuridae). Journal of Crustacean Biology (3):329-335.
Cano, M. (1987). Estudio biológico pesquero de la langosta espinosa Panulirus argus (Ltr.) en la isla de Providencia. Tesis M. Sc. (Biólogo marino). Universidad Nacional. Santa Marta, 141 pp.
Caputi, N. and Brown, R.S. (1986). Relationship between indices of juvenile abundance and recruitment in the western rock lobster (Panulirus argus) fishery. Can. J. Fish. Aquat. Sci., 43: 2131-2139
Caputi, N. and Brown, R.S. (1993). The effect of the environment on puerulus settlement of the western rock lobster (Panulirus cygnus) in Western Australia. Fish. Oceanogr. 2 (1); 1-10.
Caputi, N., Brown, R.S. and Phillips, B.F. (1991). Prediction of the catches of the western rock lobster (Panulirus cygnus) based on indices of puerulus and juvenile abundance. Rev. Inv. Mar. 12: 57-65.
Carleton, R. et al. (1979). Critical marine habitats of the wider Caribbean area., IUCN Project Number 1037, Intercontinental Maps & Charts Ltd: 50 p.
Carvalho, R.C. de A., Ferreira, C.R. de C., Vasconcelos, J.A. de, Oliveira, M.Y.S. de and Campos, L.M. de A. (1996). Custos e rentabilidade de embarções envolvidas na pesca da lagosta no nordeste do Brasil, 1995. Bol. Tec. Ciênt. CEPENE, Tamandaré 4(1): 233-261.
Castaño, O. (?) Criterios para la implementación de la veda de langosta (Panulirus argus) en el Atlántico de Nicaragua. CIRH. 18 p.
Castaño, O. (1989). II monitoreo de langosta Panulirus argus realizado en el océano Atlántico (Corn Island) 15 septiembre - 5 octubre de 1989. Informe técnico CIP 37:19 p.
Castaño, O. (1992). Informe sobre la veda de langosta (P. argus) en el océano Atlántico. Informe técnico CIP. 162. 12 p.
Castaño, O. y Cadima, E. (1993). Biología y evaluación de la langosta espinosa. Simposium sobre Evaluación y Manejo de las Pesquerías de Crustáceos en Nicaragua, Managua, Nicaragua, 6-7 diciembre 1993. Centro de Investigación de Recursos Hidrobiológicos (CIRH)/NORAD: 53p
Castaño, O. y Flores, C.O. (1990). IV monitoreo de langosta (Panulirus argus) realizado en el océano Atlántico (Corn Island) 11-27/01/90. Informe técnico CIP 62:26 p.
Castaño, O. y Molina, F. (1989). III monitoreo de langosta (Panulirus argus) realizado en el océano Atlántico (Corn Island). 08 Nov. - 29 Nov. 1989. Informe técnico CIP 45:17 p.
Castaño, O. y Ubeda, F. (1989). Crucero de monitoreo para langosta del Atlántico nicaragüense correspondiente al mes de agosto de 1989. M/N PROMAR-54. Informe técnico CIP 32:17 p.
Cavalcante, P.P.L. (1982). A pesca de lagostas no litoral sul do Estado da Bahia. Pesc. Aquacul. 12: 2-4

298
Cervigón, F. et al. (1993). FAO species indentification sheets for fishery purposes. Field guide to the commercial marine and brackish-water resources of the northern coast of South America. Rome, FAO, 513 p.
Childress, M. and Herrnkind, W.F. (1996). Draft Recommendations In: EIA/FISHERIES SEATTLE WORKSHOP; August 26-30 1996: 50 p.
Chirivi, H. (1988). Fauna tetrápoda y algunos aspectos ecologicos de los Cayos del Archipielago de San Andres y Providencia. INDERENA Trianea (2): 277-377.
Chittleborough, R.G. (1976). Breeding of Panulirus cygnus George under natural and controlled conditions. Aust. J. Mar. Freshwat. Res. 27: 499-516.
Chittleborough, R.G. and Phillips, B.F. (1975). Fluctuations of year-class strength and recruitment in the western rock lobster Panulirus longipes (Milne-Edwards). Aust. J. Mar. Freshwat. Res., 26 (2): 317-328
Chubb, C.F. (1994). Reproductive biology. Issues for management, pp. 181-212. In: Phillips, B.F., Cobb, J.S. and Kittaka, J. (eds). Spiny Lobster Management, Blackwell Sci. Pub., Oxford
CIDEP (1980). Análisis del comportamiento de la pesquería del camarón y la langosta durante 1980. CIDEP. 10 p.
Clairovin, N. (1980). Contribution à l´étude du stock de langouste Panulirus argus en Martinique. Science et Pêche Bull. Pêches Marit. 300:7-18.
Clayton, D.A. and Snowden, J.R. (1991). Allometric growth in Iloplax stevensi (Decapoda, Brachyura, Ocipodidae). Crustaceana, 61 (1):1-10.
Coba-Cetina, L. (1990). Características poblacionales de la langosta Panulirus argus (Latreille), capturas en Bahía de la Ascensión, Quintana Roo, al levante de la veda durante tres temporadas, 1987 a 1989. Tesis de Licenciatura Univ. De Colima. Fac. Ciencias del Mar. Manzanillo, Colima. Mex. 65 pp.
Cobb, J.S. (1981). Behaviour of the Eastern Australian spiny lobster, Panulirus cygnus George, in the field and laboratory. Aust. J. Mar. Freshwat. Res., 23: 399-409.
Cobb, J.S. and Caddy, J.F. (1989). The population biology of Decapods, pp. 327-374. In: Caddy, J.F. (ed). Marine Invertebrates Fisheries and their Assessment. John Wiley and Sons, New York.
Cobb, J.S. and Wang, D. (1985). Fisheries biology of lobsters and crayfishes. pp. 167-247 In: Provenzano, Jr., A.J., The Biology of Crustacea. New York: Academic Press, Vol.10.
Cobo de Barany, T., Ewald, J. y Cadima, E. (1975). La pesca de la langosta en el Archipiélago de Los Roques, Venezuela. Ministerio de Agricultura y Cría, Informe Técnico 43, 34 pp.
Coelho, A.M.G., Dias, A.F., Ferreira, C.R. de C., Vasconcelos, J.A. de, Raposo, L.L. and Oliveira, M.Y.S. de (1996). Caracterização sociocultural dos productores de lagostas no nordeste Brasileiro. Bol. Tec. Ciênt. CEPENE. Tamandaré. 4(1): 197-232.
Coelho, P.A. (1962a). Súmula de observações sôbre a lagosta comum Panulirus argus (Latreille). Bol. Est. Pesca, 2 (5): 3-11.
Coelho, P.A. (1962b). Sobre a biologia da pesca da lagosta cabo-verde Panulirus laevicauda (Latreille). Bol. Est. Pesca, 2 (7): 3-8.
Coelho, P.A. (1962c). Bases para a regulamentação da pesca de lagosta. Bol. Est. Pesca, 2 (10): 3-6.
Coelho, P.A., Dias, A.F., Oliveira G.M. de e Pontes, A.C. de P. (1996). Estudo comparativo da pesca de langostas con cavos, redes-de-espera e mergalho no estado de Pernambuco. Bol.Tec.Ciênt. CEPENE, Tamandaré, 4(1): 173-196.

299
Coelho, P.A., Moura, S.J.C. e Silva, V.R.G. (1963). Nota sobre a reprodução das lagostas Panulirus argus (Latreille) (DECAPODA: PALINURIDAE) no litoral do Estado de Pernambuco. Trabs. Inst. Ocean. Univ. Recife 3 (1): 61-67.
Coelho, R.R., Santos, E.P., Nascimento, I.V., Travassos, I.B. e Ivo, C.T.C. (1974). Curvas de rendimento das lagostas Panulirus argus (Latr.) e Panulirus laevicauda (Latr.) do Nordeste brasileiro. B. Rec. Nat., Recife, 12 (1): 5-13.
Conceição, R.N.L. (1987). Ocorrência de puerulus de Panulirus laevicauda (Latreille) nas capturas de arrastão-de-praia, no município de Fortaleza (Ceará-Brasil). Arq. Ciên. Mar, 26: 83-85.
Conceição, R.N.L., Gesteira, T.C.V. and Mesquita, R.R. (1993). Um coletor para a captura de indivíduos no estágio puerulus da lagosta Panulirus White. VIII Congresso Brasileiro de Engenharia de Pesca, Aracajú, SE, agosto de 1993.
Conklin, D.E. (1980). Nutrition. p. 277-300 In: Cobb, J.S. and Phillips, B.F. (eds). The biology and management of lobsters. London, Academic Press, Vol. 1.
Cooper, R.A. et al. (1975). Population dynamics, ecology and behavior of spiny lobsters Panulirus argus, of St. John, U.S.V.I. (III) Population estimation and turnover; Results of the Tektite Program. Bull. of the Nat. Hist. Museum of Los Angeles County; 20: 23-30.
Cortés, (1997). Muestreos en plantas procesadoras, del recurso langosta, Roatán, Islas de la Bahía. 9 pp.
Costa, A.F., Moura, S.J.C. e Burgos, P.F.O. (1968). Notas sobre a ecologia e pesca dos estágios post-larval e sub-adulto das lagostas de importância comercial no Nordeste do Brasil. Bol. Est. Pesca, Recife, 8 (1):49-72.
Costa, R.S. (1966). Dados sôbre a frota lagosteira do Estado do Ceará. Bol. Est. Biol. Mar. Univ. Fed. Ceará, 13: 1-14.
Costa, R. S. (1969). Dados sobre a frota lagosteira, nos anos de 1966 a 1968. Arq. Ciên. Mar, 9 (2): 119-126.
Costa, R.S. e Albuquerque, J.J.L. (1966). Experimentação de covos para a captura de lagosta no Ceará. Bol. Est. biol. Mar. Univ. fed. Ceará 14:1-7.
Costa, R.S. e Bezerra, R.C.F. (1970). Influência dos métodos de pesca sobre a eficiência dos covos, na captura de lagostas no Ceará. Arq. Ciên. Mar 10 (2): 127-130.
Costa, R.S. e Paiva-Filho, D.L. (1974). Estudos de biologia da pesca de lagostas no Ceará - Dados de 1971 a 1973. Arq. Ciên. Mar, 14 (2): 95-114.
Coutinho, P.N. y Morais, J.O. (1970). Distribución de los sedimentos en la Plataforma Continental Norte y Nordeste del Brasil. Arq. Ciên. Mar. 10 (1): 79-90.
Cox, C. and Bertelsen, R.D. (1997). Fecundity of the Caribbean spiny lobster, Panulirus argus, from fished and unfished regions in the Florida Keys, USA. Abstract. Paper presented at The Fifth International Conference and Workshop on lobster biology and management, Queenstown, New Zealand.
Cox, C., Hunt, J.H. Lyons, W.G. and Davis, G.E. (1997). Nocturnal foraging of the Caribbean spiny lobster (Panulirus argus) on offshore reefs of Florida, USA. Mar. Freshwater Res. 48: 671-679.
Creaser, E.P. (1950). Repetition of egg laying and number of eggs of the Bermuda spiny lobster. Proc. Gulf & Caribb. Inst., 2:30-31.
Cruz, R. (1980a). Atlas biológico pesquero de la langosta en el Archipielago Cubano. Cent. Invest. Pesq. MIP: 125 p.
Cruz, R. (1982). Los recursos langosteros en el archipiélago Cubano. Contribución No. 6, Memorias del Grupo de Trabajo Sobre la Langosta, FAO/WECAFC/PNUD, INFORMES WECAFC 36 (Es): 125-150.

300
Cruz, R. and Auil Marshalleck, S. (1995). Spiny lobster larval and juvenile monitoring program for the CARICOM region. CFRAMP Lobster and Conch Subproject Specification and Training Workshop Proceedings, 9-12 October, Kingston, Jamaica. CARICOM Fisheries Resources Assessment and Management Program. CARICOM Fishery Research Document 19: 290 p.
Cruz, R., Baisre, J.A., Díaz, E., Brito, R. García, C. y Carrodeguas, C. (1990). Atlas Biológico-Pesquero de la Langosta en el archipiélago Cubano. Pub. Esp. Rev. Cub. Inv. Pesq. y Rev. Mar y Pesca.125 pp.
Cruz, R., Brito, R., Díaz, E. y Lalana, R. (1986a). Ecología de la langosta (Panulirus argus) al SE de la Isla de la Juventud. I. Colonización de arrecifes artificiales. Rev. Inv. Mar. 7 (3): 3-17.
Cruz, R., Brito, R., Díaz, E. y Lalana, R. (1986b) Ecología de la langosta (Panulirus argus) al SE de la Isla de la Juventud. II. Patrones de movimiento. Rev. Inv. Mar. 7 (3): 19-35.
Cruz, R., Coyula, R. y Ramírez, A.T. (1981). Crecimiento y mortalidad de la langosta espinosa (Panulirus argus) en la plataforma suroccidental de Cuba. Rev. Cub. Inv. Pesq. 6(4): 89-119.
Cruz, R., González, J., León, M.E. de y Puga, R. (1995). La pesquería de la langosta espinosa (Panulirus argus) en el Gran Caribe. Evaluación y pronóstico. Rev. Cub. Inv. Pesq.19 (2): 63-76.
Cruz, R. y León, M.E. de (1991). Dinámica reproductiva de la langosta (Panulirus argus) en el archipiélago cubano. Rev. Cub. Invest. Mar. 12(1-3):234-245.
Cruz, R., León, M.E. de, Díaz, E., Brito, R. y Puga, R. (1991). Reclutamiento de puerulus de langosta (Panulirus argus) a la plataforma cubana. Rev. Invest. Mar. 12(1-3):66-75
Cruz, R., León, M.E. de y Puga, R. (1992a). La utilización de los refugios artificiales, como alternativa para el mejoramiento de las pesqueras cubanas de langosta. Memorias. I Reunión Internacional sobre mejoramiento de hábitats acuáticos para pesqueras. 29-30 Octubre 1992. Manzanillo, Colima. México.
Cruz, R., León, M.E. de and Puga, R. (1992b). The Cuban spiny lobster fishery The Lobster Newsletter. 5(1).
Cruz, R., León, M.E. de y Puga, R. (1993). Desarrollo, utilización y manejo de los refugios artificiales en las pesqueras cubanas de langosta. En: González, J.M. y Cruz, R. (eds), Memorias del Taller Binacional México-Cuba sobre la utilización de refugios artificiales en las pesquerías de langosta: sus implicaciones en la dinámica y manejo del recurso, 17-21 mayo de 1993 Isla Mujeres, Q.R., México.
Cruz, R., León, M.E. de y Puga, R. (1994). Tendencias de las pesquerías de langosta en el Caribe y regiones adyacentes. Rev. Cub. Inv. Pesq. 18(1): 1-5.
Cruz, R., León, M.E. de and Puga, R. (1995a). Prediction of commercial catches of the spiny lobster Panulirus argus in the Gulf of Batabano. Fourth International Workshop on Lobster Biology and Management, 1993. Crustaceana 68 (2): 238-244.
Cruz, R., León, M.E. de y Puga, R. (1995b). Las pesquerías cubanas. Una visión general. Mar y Pesca No 300:35-36.
Cruz, R., León, M.E. de y Puga, R. (en prensa). Relaciones entre los indices de abundancia de puérulos, juveniles y reclutas en la langosta espinosa Panulirus argus. Memorias MARCUBA ‘94, La Habana, 1994.
Cruz, R. and Phillips, B.F. (1994). The artificial shelters (pesqueros) for the spiny lobster (Panulirus argus) fisheries in Cuba. Chapter 21. In: Phillips, B.F., Cobb, J.S. and Kittaka, J. (eds). Spiny Lobster Management, Oxford, Fishing New Books.

301
Cruz, R., Puga, R. y León, M.E. de (1993). Fluctuaciones de las capturas de langosta (Panulirus argus) en los refugios artificiales. Región del Golfo de Abatanó, Cuba. En: González, J.M. y Cruz, R. (eds), Memorias del Taller Binacional Mexico-Cuba. La utilización de refugios artificiales en las pesqueras de langosta: sus implicaciones en la dinámica y manejo del recurso, 17-21 mayo de 1993 Isla Mujeres, Q.R., México.
Cruz, R., Puga, R. y León, M.E. de (1994). Aspectos de la dinámica de poblaciones de la langosta espinosa (Panulirus argus) en Cuba. Cambios en el coeficiente de capturabilidad. Rev. Cub. Inv. Pesq. 18(1):6-9.
Cruz, R., Puga, R. y León, M.E. de (1995). Pronóstico de la captura de langosta (Panulirus argus) por regiones de pesca, Cuba. Rev. Cub. Inv. Pesq. 19 (1): 51-58.
Cruz, R., Sotomayor, R., León, M.E. de y Puga, R. (1991). Impacto en el manejo de la pesquería de langosta (Panulirus argus) en el Archipiélago cubano. Rev. Invest. Mar. 12(1-3):246-253.
Dalmendray, J. and Gonzalez, A. (1995a). Traditional and lifting artificial shelters (pesqueros) used for lobsters (Panulirus argus) fisheries in Cuba. Preliminary results about their fishing efficiency and selectivity. Proceedings ECOSET '95 International Conference. Vol II, pag 774, Tokyo, Japan.
Dalmendray, J. y Gonzalez, A. (1995b). Selectividad de la malla en las trampas o jaulones para la pesca de la langosta (Panulirus argus) en Cuba. Rev. Cub. Inv. Pesq. 19 (2): 57- 62.
Davis, G.E. (1975). Minimum size of mature spiny lobsters, Panulirus argus, at Dry Tortugas, Florida. Trans. Am. Fish. Soc. 104 (4): 675-676.
Davis, G.E. (1976). "U.S. National Park Service Spiny Lobster Study" Interim Rep. U.S. Natl. Park. Serv., Washington, D.C.
Davis, G.E. (1977). Effects of recreational harvest on spiny lobster, Panulirus argus, population. Bull. Mar. Sci. 27: 23-27.
Davis, G.E. (1978a). Field evaluation of a tag for juvenile spiny lobster, Panulirus argus. Trans. Am. Fish. Soc. 107 (1) : 100-103.
Davis, G.E. (1978b). Management recommendations for juvenile spiny lobsters, Panulirus argus, in Biscayne National Monument, Fla. U.S. Natl. Park. Serv. S. Fla. Res. Center Rep. M-530: 32 pp.
Davis, G.E. and Dodrill, J.W. (1980). Marine parks and sanctuaries for spiny lobster fisheries management. Fish. Bull. 78: 979-984.
Davis, G.E. and Dodrill, J.W. (1989). Recreational fishery and population dynamics of spiny lobsters, Panulirus argus, in Florida Bay, Everglades National Park, 1977-1980. Bull. Mar. Sci. 44:78-88.
Dawson, C. and Idyll, C.P. (1951). Investigations on the Florida spiny lobster, Panulirus argus. Fla. Bd. Conserv. Tech. Ser. 2:37 p.
Donahue, S., Bertelsen, R.D. and Hunt, J.H. (1998). Addendum: 1997 Results of egg mass collection. Final report: second year. MARFIN Grant 0518. National Marine Fisheries Service. Southeast Fisheries Science Center. Miami, Florida.
Donaldson, W.E., Cooney, R.T. and Hilsinger, J.R. (1981). Growth, age and size at maturity of tanner crab, Chionoecetes bairdi M.J. Rathbun, in the northern gulf of Alaska (Decapoda, Brachyura). Crustaceana, 40 (3):286-302.
Dos Santos, E.D., Costa, R.S. and Moura, S.J.C. (1964). Growth of the spiny lobster Panulirus argus (Latr.) Quantitative aspect. Arq. Estad. Biol. Mar. Univ. Ceara, Fortaleza 4 (2): 41-44.

302
Edgar, G.J. (1990). Predator-prey interactions in seagrass beds. III. Impacts of the western rock lobsters Panulirus cygnus George on epifaunal gastropod populations. J. Exp. Mar. Biol. Ecol., 139: 33-42.
Eggleston, D.B. (1991). Stock enhancement of Caribbean spiny lobster, Panulirus argus Latreille, using artificial shelters: patterns of survival and dynamics of shelter selection. PhD. Dissertation, College of William and Mary, Virginia, 143 pp
Eggleston, D.B., Lipcius, R.N., Coba-Cetina, L.R. and Miller, D. (1990). Shelter scaling regulates survival of juvenile Caribbean spiny lobster Panulirus argus. Mar. Ecol. Prog. Ser. 62: 79-88.
Eggleston, D.B., Lipcius, R.N. and Miller, D. (1992). Artificial shelters and survival of juvenile Caribbean spiny lobster Panulirus argus: spatial, habitat, and lobster size effects. Fish. Bull.Nat.Fish. Serv. U.S., 90: 691-702.
Ehrhardt, N.M. (1994). The lobster fisheries off the Caribbean coast of Central America., pp.133-143 In: Phillips, B.F. Cobb, J.S. and Kittaka, J. (eds). Spiny Lobster Management, Oxford, Fishing News Books, 550 pp.
Ehrhardt, N.M. y Castaño, O. (1995). Evaluación del estado de explotación de la langosta espinosa Panulirus argus en Nicaragua, Centro de Investigación de Recursos Hidrobiológicos (CIRH). Ministerio de Economía y Desarrollo/NORAD 22 pp.
Ehrhardt, N. and Deleveaux, V. (1996). Report on the management options for the Bahamian spiny lobster fishery. (In press).
Ehrhardt, N.M. and Legault, C.M. (1996). Crustacean stock assessment techniques incorporating uncertainty. Pages 111-131. In: Report of the WECAFC Ad Hoc Shrimp and Groundfish Working Group of the Guianas-Brazil Continental Shelf and CFRAMP Shrimp and Groundfish Subproject Specification Workshop. Port of Spain, Trinidad and Tobago. 8-12 January 1996. FAO Fisheries Report No. 544, Supplement.
Evans, C.R. (1988). Population dynamics of spiny lobster Panulirus argus and P. guttatus at Bermuda 1986/87. Final Report to Overseas Development Administration, UK, 98 pp+ appendix.
Evans, C. R. (1990). A study of the population dynamic and biology of spiny lobster Panulirus argus and P. guttatus on the Bermuda platform. Taller internacional de langosta, La Habana, Cuba. 12-16 de junio.
Evans, C.R., Evans, A.J. and Lockwood, A.P.M. (1991). Scaled-down shelters (casitas) with predator-barriers having potential for spiny lobster, Panulirus argus, nursery habitat enhancement. Rev. Cub. Inv. Pesq.
Evans, C.R. and A.P.M. Lockwood (1996). Long-term migratory behaviour of undersized spiny lobsters Panulirus argus (Latreille) on the Bermuda island shelf. Gulf of Mexico Science 14: 35-39.
Evans, C.R., A.P.M. Lockwood and A.J. Evans (1996). Field studies of the population dynamics of the spotted spiny lobster Panulirus guttatus (Latreille) at Bermuda. Gulf of Mexico Science 14: 55-65.
Evans, C.R., A.P.M.Lockwood, A.J. Evans and E. Free. (1995). Field studies of the reproductive biology of the spiny lobsters Panulirus argus (Latreille) and P. guttatus (Latreille) at Bermuda. J. Shellfish Res. 14: 371-381.
FAO (1968a). Report to the Government of British Honduras (Belize) on investigations into marine fisheries management, research and development policy for spiny lobster fisheries. Based on the work of Allsop, W.H.L., FAO/TA Marine Fishery Biologist. FAO Technical Assistant Report No. 2481. Rome. 95pp.

303
FAO (1968b). Report to the Government of British Honduras (Belize) on Investigations into Marine Fisheries, particularly Spiny Lobster and Shrimp Resources. Based on the work of Weber, D., FAO/TA Marine Fishery Biologist. FAO Technical Assistant Report No. 2541. Rome. 28pp.
FAO (1993 and other years).Yearbook of Fishery Statistics, Catches and Landings. Rome, FAO, Vol. 72, 654 pp.
FAO (1993a). Yearbook of fishery statistics, catches and landings, Rome, FAO, Vol. 654 pp. FAO (1993b). Marine fishery resources of the Antilles: Lesser Antilles, Puerto Rico and
Hispaniola, FAO Fish. Tech. Pap. 326 FAO (1996) Precautionary approach to fisheries. FAO Fisheries Technical Paper 350, Part 1.
Rome, FAO. FAO/PNUD, 1982. Memorias del grupo de trabajo sobre langostas; San José, Costa Rica, Nov.
1980., INFORMES WECAF/FAO No 36 (Es): 277 pp. Faria, A. e Silva, D. (1937). Os palinurideos do Brasil. (Crustacea - Macrura). Rev. Dep. Nac.
Prod. Anim., 4 (4/6): 1-45. Farmer, N.W., Ward, J.A. and Luckhurst, B.E. (1989). Development of spiny lobster
(Panulirus argus) phyllosoma larvae in the plankton near Bermuda. Proc. Gulf & Caribb. Fish. Inst. 39:289-301.
Fausto-Filho, J. (1966). Primeira contribuição ao inventário dos crustáceos decápodos marinhos do nordeste brasileiro. Arq. Est. Biol. Mar. Univ. Fed. Ceará, 6 (1): 31-37.
Fausto-Filho, J. (1967). Segunda contribuição ao inventário dos crustáceos decápodos marinhos do nordeste brasileiro. Arq. Est. Biol. Mar. Uni. Fed. Ceará, 7 (1): 11-14.
Fausto-Filho, J. (1977). Sôbre a ocorrência de Palinustus truncatus (Milne-Edwards, H., 1880), no litoral brasileiro e de Panulirus echinatus Smith, 1869, no litoral do Estado do Ceará, Brasil (Crustacea, Decapoda, Palinuridae). Arq. Ciên. Mar 17 (1): 75-76.
Fausto-Filho, J. e Costa, A.F. (1969). Notas sobre a família Palinuridae no Nordeste brasileiro (Crustacea, Decapoda, Macrura). Arq. Ciên. Mar 9 (2):103-110.
Fausto-Filho, J., Matthews, H.R. e Lima, H.H. (1966). Nota preliminar sobre a fauna dos bancos de lagostas no Ceará. Arq. Est. Biol. Mar. Univ. Fed. Ceará 6 (2): 127-130.
FCLR (1989). Análisis del sistema pesquero de la langosta Panulirus argus y evaluación de los recursos pesqueros complementarios en el Parque Nacional Archipiélago Los Roques, Venezuela. Informe Final del Proyecto OEA. 290 pp.
Fernandes, L.M.B. (1969). Sobre a alimentação de lagosta Panulirus argus (Latr.) 1804. I - Estágio juvenil. Bol. Est. Pesca, Recife, 9 (1): 23-33.
Fernandes, L.M.B. (1985). Sobre a alimentação de lagosta Panulirus argus (Latr.) 1804. II - Estágios pós-puerulus e adulto. SUDENE, Divisão de Recursos Pesqueiros, Série Estudos de Pesca, Recife, n. 1, não paginado,.
Ferreira, M.G.N. (1994). Avaliação e distribuição geográfica dos estoques de lagosta (Crustacea: Palinuridae) e sua capturabilidade nas regiões Norte e Nordeste do Brasil. Dissertação de Graduação, Departamento de Engenharia de Pesca, UFC, Fortaleza, 25 p.
Fielder, D.R. (1965). The spiny lobster, Jasus lalandii (Milne-Edwards, H.), in South Australia. III. food, feeding, and locomotory activity. Aust. J. Mar. Freshwat. Res., 16: 351-367.
Fischer, W., (1978). FAO Species identification sheets for fishery purposes. Western Central Atlantic (Fishing Area 31). Vols. 1-7.
Fisheries Division. (1975). Jamaican spiny lobster investigations. Investigations 1975. Ministry of Agriculture, Jamaica. 65: 202-212.

304
Flores, C.O. (1990). Inspectoria y monitoreo de langosta (P. argus) océano Atlántico nicaragüense, M/N hondureña "SONIA Mc II" del 07 de abril al 09 de mayo 1990. Informe técnico CIP 93:22 pp.
Flores, C.O. (1991). Inspección de langosta en sala de proceso planta PROMAR, S.A. Informe técnico CIP 125:25 pp.
Fogarty, M.J. and Iodine, J.S. (1988). Application of a yield and egg production model based upon size to an offshore American lobster population. Trans. Am. Fish. Soc. 117:350-362.
Fonteles-Filho, A.A. (in press). Spatial distribution of the lobster species Panulirus argus and P. laevicauda in relation to the distribution of fishing effort, in north and northeastern Brazil. Ciên. Cult.
Fonteles-Filho, A.A. (1979). Análise da biologia pesqueira e dinâmica populacional da lagosta Panulirus laevicauda (Latreille), no Nordeste setentrional do Brasil. Arq. Ciên. Mar 19 (1/2): 1-43.
Fonteles-Filho, A.A. (1986). Influência do recrutamento e da pluviosidade sobre a abundância das lagostas Panulirus argus (Latreille) e Panulirus laevicauda (Latreille) (Crustacea: Palinuridae), no Nordeste do Brasil. Arq. Ciên. Mar 25: 13-31.
Fonteles-Filho, A.A. (1989). Recursos Pesqueiros - Biologia e Dinâmica Populacional. Imprensa Oficial do Ceará, Fortaleza, 296 pp.
Fonteles-Filho, A.A. (1992). Population dynamics of spiny lobsters (Crustacea: Palinuridae) in Northeast Brazil. Ciên. Cult. 44 (2/3): 192-196.
Fonteles-Filho, A.A. (1994). State of the lobster fishery in north-east Brazil. pp 108-118. In: Phillips, B.F., Cobb, J.S. and Kittaka, J. (eds). Spiny Lobster Management, Oxford, Fishing News Books.
Fonteles-Filho, A.A. and Ivo, C.T.C. (1980). Migratory behavior of the spiny lobster Panulirus argus (Latreille), off Ceará State, Brazil. Arq. Ciên. Mar 20 (1/2): 25-32.
Fonteles-Filho, A.A., Souza, A.R., Coêlho, A.S. e Ximenes, M.O.C. (1985). Parâmetros técnicos e índices de rendimento da frota lagosteira do Estado do Ceará, Brasil. Arq. Ciên. Mar 24: 89-100.
Fonteles-Filho, A.A., Ximenes, M.O.C. e Monteiro, P.H.M. (1988). Sinopse de informações sobre as lagostas Panulirus argus (Latreille) e Panulirus laevicauda (Latreille) (Crustacea : Palinuridae), no Nordeste do Brasil. Arq. Ciên. Mar 27 (1/2): 1-19.
Forcucci, D., Butler, M.J. and Hunt, J.H. (1994). Populations of juvenile Caribbean spiny lobster, Panulirus argus, in Florida Bay, Florida. Bull. Mar. Sci. 54 (3):805-818.
Fuentes, C.D. (1986). Estado del conocimiento biológico-pesquero de la langosta, Panulirus argus (Latreille, 1804), en el Caribe mexicano. Ejercicio predoctoral. Inst. Politécnico Nal. Esc. Nal. de Cienc. Biol. 88 pp.
Gallo, J., Rojas, M. y Correa, F. (1998). Aspectos sobre la biología y pesquerías de la langosta espinosa (Panulirus argus) en la República de Colombia. Workshop on the Spiny Lobster Panulirus argus in the WECAFC area. Reporte Nacional de Colombia. 18 p.
Garcia, A. (1980). Langostas de México: su biología y pesquería. Anales Centro Ciencias del Mar y Limnología. Univ. Nac. Autón. México; 7(2): 111-128 p.
García, C., Betanzos, A. y Gómez, J.A. (1995). Oceanografía del área de Punta del Este, Golfo de Batabanó, Cuba. Rev. Cub. Inv. Pesq. 19 (1): 10- 17.
Garcia, C., Chirino, A.L. y Rodríguez, J.P. (1991). Corrientes geostróficas en la ZEE al Sur de Cuba. Rev. Inv. Mar 12(1-3): 29-38.
García, C., Hernández, B., Baisre, J. y Cruz, R. (1991). Factores climáticos en las pesquerías cubanas de langosta (Panulirus argus): su relación con las migraciones masivas. Rev. Invest. Mar. 12(13): 131-139.
305
Gaugé, G. (1982). Cuantificación y confiabilidad de la producción langostera de la República Dominicana. Contribución No. 7: 151-177.
Gavaris, S. (1988). An adaptive framework for the estimation of population size. Canadian Atlantic Fisheries Scientific Advisory Commission. Research Document. 88/29. 12 p.
Geister, J. (1973). Los arrecifes de la isla de San Andres (Mar Caribe, Colombia). Mitt. Inst. Colombo-Alemán Invest. Cient. 7: 211-228.
George, R.W. and Morgan, G.R. (1979). Linear growth stages in the rock lobster (Panulirus versicolor) as a method for determinating size at first physical maturity. Rapp. P. V. Réun. CIEM. 175:182-185.
George, W.E. and Main, A.R. (1967). The evolution of spiny lobster (Palinuridae): a study of evolution in marine environment. Evolution, 21: 803-820.
Gibson, J. (1982). Estado de la pesquería de langostas en Belice. Contribución No 5, Memorias del Grupo de Trabajo Sobre la Langosta, FAO/WECAF/PNUD, INFORMES WECAF No. 36 (Es): 114-124.
Ginéz, A., D. Rodríguez y H. Salazar. (1978). Evaluación de la captura comercial de langosta en el Archipiélago de Los Roques, Venezuela, durante los períodos de 1975 y 1977. Ministerio de Agricultura y Cría. Mimeo.
Giudicelli, M. (1971). Exploraciones pesqueras en el Mar Caribe de Centro América con enfasis en aguas profundas, R/V "CANOPUS" abr.-oct.1971., Proy. Reg. de Des. Pesq. en Centroamérica. CCDP-FAO-PNUD. Bol. Téc. 5(5): 90 p.
González, A. (1992). Puertas de escape con material biodegradable para jaulones y nasas langosteras. Rev. Cub. Inv. Pesq. 17(2): 56-63.
González, F. (1990). Crucero de inspectoria y monitoreo de la langosta (P. argus) en el océano Atlántico nicaragüense, a bordo de la M/N "DAVINA DEI" de nacionalidad hondureña del 05 al 19 de febrero de 1990. Informe técnico CIP 76. 26 p.
González, F. J. (1987). Evaluación de la fauna acompañante de la pesquería de la langosta en el Parque Nacional Archipiélago de los Roques. Trabajo Especial de Grado. Universidad Central de Venezuela. Escuela de Biología. 44 pp.
González-Cano, J.M. (1991). Migration and refuge in the assessment and management of the spiny lobster Panulirus argus in the Mexican Caribbean. Ph.D. Thesis. Imperial College, London SW7. 478 pp.
González-Cano, J.M. (1994). Similitudes y diferencias entre refugios artificiales y artes de pesca. pp. 10-15. In: González-Cano, J. y Cruz, R. (eds). Primer Taller Binacional México-Cuba: La utilización de refugios artificiales en las pesquerías de langosta: sus implicaziones en la dinámica y manejo del recuso. Islas Mujeres, mayo 1993. ISBN 968-817-30 SEPESCA-INP-CIP.
González-Cano, J.M. y Aguilar-Cardoso, C. (1994). Análisis global sobre la introducción de los refugios artificiales en la pesquería de langosta en la Peninsula de Yucatán. pp. 161-167. In: González-Cano, J. Cruz, R. (eds). Primer Taller Binacional México-Cuba: La utilización de refugios artificiales en las pesquerias de langosta: sus implicaciones en la dinámica y manejo del recurso. Isla Mujeres, Mayo 1993. ISBN 968-817-30 SEPESCA-INP-CIP.
González-Cano, J.M. and Rocha, C.A.S. (1995). Problems on the estimation of growth parameters for the spiny lobster Panulirus argus in the Caribbean and Northeast Brazil. Proceedings of the World Fisheries Congress. Theme 5: Assessment, methodologies and management.
González, R.P., Flores, L.M. y Nuñez, A. (1992). Análisis de la distribución de tallas, captura y esfuerzo en la pesquería de las langostas Panulirus inflatus (Bouvier, 1895) y P. gracilis (Streets, 1871) (Decapoda; Palinuridae) en las costas de Sinaloa, México. Proceedings of the San Diego Society of Natural History (15): 5 p.

306
Gregory, Jr., D.R.. and Labisky, R.F. (1986). Movements of the spiny lobster Panulirus argus in South Florida. Can. J. Fish. Aqua. Sci. 43:2228-2234.
Gregory, Jr., D.R., Labisky, R.F. and Combs, C.L. (1982). Reproductive dynamics of the spiny lobster Panulirus argus in South Florida. Trans. Am. Fish. Soc. 111: 575-584
Gutierrez-Carbonell, D., Simonin-Díaz, J. and Briones, P. (1992). A simple collector for postlarvae of the spiny lobster Panulirus argus. Proc. Gulf Caribb. Fish. Inst. 41:516-527.
Gutiérrez, R. (1989). Crucero de inspección y monitoreo de la langosta P. argus del océano Atlántico nicaragüense a bordo de la M/N hondureña "MISS COLLEEN" durante el periodo comprendido de agosto a septiembre 1989. Informe técnico CIP 38: 15 p.
Gutiérrez, R. (1990). Inspectoria y muestreo biológico de la langosta Panulirus argus realizado en el océano Atlántico. 13 al 31 de enero de 1990. Informe técnico CIP 60: 22 p.
Gutiérrez, R. y Alvarez, E. (1993). Resultados biológicos-pesqueros obtenidos en el crucero de investigación del recurso langosta P. argus en el océano Atlántico, noviembre 1992. CIP/UNAN. 33 p.
Gutiérrez, R. y Mercado, C. (1990). V monitoreo de langosta Panulirus argus realizado en el océano Atlántico (Corn Island) 08 - 23/junio/1990. Informe técnico CIP 88: 23 p.
Harper, D.E. (1991). Trends in the spiny lobster commercial fishery of Florida, 1960 - 1990. National Marine Fisheries Service, Southeast Fisheries Center MIA-91/92-01. 29 p.
Harper, D.E. (1992). Spiny lobster monitoring report on trends in landings, CPUE, and size of harvested lobster. National Marine Fisheries Service, Southeast Fisheries Science Center MIA-91/92-85. 32 p.
Harper, D.E. (1993). The 1993 spiny lobster monitoring report on trends in landings, CPUE, and size of harvested lobster. National Marine Fisheries Service, Southeast Fisheries Science Center MIA-92/93-92. 36 p.
Harper, D.E. (1994). The 1994 spiny lobster update of trends in landings, CPUE, and size of harvested lobster. National Marine Fisheries Service, Southeast Fisheries Science Center, MIA-93/94-82. 20 p.
Hateley, J.G. and T. D. Sleeter. (1993). A biochemical genetic investigation of spiny lobster (Panulirus argus) stock replenishment in Bermuda. Bull. Mar. Sci. 52: 993-1006.
Haughton, M.O. (1988). Population biology of Panulirus argus in Jamaican waters. M.Sc. thesis. University of Buckingham. 148 pp.
Haughton, M.O. and King, D.P.F. (1990). Population biology of the spiny lobster (Panulirus argus) in Jamaican waters. Proc. Gulf Carib. Fish. Inst. 41: 528-542.
Haughton, M.O. and King, D.P.F. (1992). Stock assessment of the spiny lobster (Panulirus argus) in Jamaica. Proc. Gulf Carib. Fish. Inst. 42: 119-126.
Haughton, M.O. and Shaul, W. (1989). Estimation of the growth parameters for the spiny lobster (Panulirus argus) in Jamaican waters. Proc. Gulf Carib. Fish. Inst. (39): 279-289
Haughton, M.O. et al. (1986). Proposals for the development and management of the lobster fishery in Jamaica. Presented to the Honourable Minister Anthony Johnson.
Hauschild, M. y R. Laughlin (1985). Análisis de la pesquería de la langosta, Panulirus argus, en el Parque Nacional Archipiélago de Los Roques, durante la temporada 1983-84. Fundación Científica Los Roques. Informe Técnico No. 14. 31 pp.
Hauschild, M. y E. Weil. (1983). La pesca de la langosta en el sur-occidente del Archipiélago de Los Roques durante la temporada 1982-83. Fundación Científica Los Roques. Informe Técnico No. 12. 17 pp.
Heatwole, D.W., Hunt, J.H. and Kennedy, F.S. (1988). Catch efficiencies of live lobster decoys and other attractions in the Florida spiny lobster fishery. Fla. Mar. Res. Publ. 44:15 pp.

307
Herazo, B. (1971). Reproducción de Panulirus argus en la costa de la Guajira colombiana. Universidad Jorge Tadeo Lozano Fac. de Ciencias del Mar. Tesis profesional. 61 p.
Hernández, A. (1990). Informe de resultados obtenidos de los muestreos de langosta Panulirus gracilis realizado en “Cesares”, Océano Pacifico, Informe técnico. CIP 61:10 p.
Hernández, A., Castaño, O. y Aburto, G. (1988). Informe del crucero de monitoreo de la langosta Panulirus argus realizado en el océano Atlántico (Corn Island) durante el periodo del 12 de agosto al 20 de septiembre de 1988. Informe técnico. CIP:22 p.
Hernández, B. y Puga, R. (1995). Influencia del fenómeno El Niño en la región occidental de Cuba y su impacto en la pesquería de langosta (Panulirus argus) del Golfo de Batabanó. Invest. Mar., Valparaíso., 23:3-24.
Hernández, B. y Puga, R. (1996) Influencia del fenómeno ENOS en las pesquerías de langosta (Panulirus argus) de la región suroccidental cubana. Oceanología, 4(12):15-46.
Hernández, B., Puga, R., Piñeiro, R., Peñate, A., Alfonso, I. and Baisre, J. (1995) Transport, turbulence and hipothetical ocean-shelf coupling mechanism in Punta del Este, Southwestern, Cuba. Rev. Cub. Inv. Pesq., 19(1):67-72.
Herrera, A. y Colom, R. (1995). Análisis de la estructura poblacional de la langosta Panulirus argus en datos de las pesquerías de la región de Beata, con recomendaciones sobre el muestreo biológico. En: Reportes del PROPESCAR-SUR: Contribuciones al conocimiento de las pesquerías en la República Dominicana./PROPESCAR-SUR.- Vol. 3.- Barahona, R.D.
Herrera, A., Ibarzábal, D., Foyo, J., Espinosa, J., Brito, R., González, G., Díaz, E., Gotera, G. y Arrinda, C. (1991). Alimentación natural de la langosta Panulirus argus en la región de Los Indios (Plataforma SW de Cuba) y su relación con el bentos. Rev. Inv. Mar., 12: 172-182.
Herrera, A., Ibarzábal, D., Foyo, J., Gotera, G., González, G., Brito, R., Díaz, E. y Arrinda, C. (1991). Caracterización ecológica de la ensenada de Bocas de Alonso: un área de juveniles de la langosta Panulirus argus. Rev. Inv. Mar. 12 (1-3) : 154-162.
Herrera, A., Ibarzábal, D., Gotera, G., González, G., Brito, R., Díaz, E. y Arrinda, C. (1991). Ecológica de los arrecifes del borde de la plataforma SW de Cuba y su relación con la langosta Panulirus argus. Rev. Inv. Mar. 12 (1-3) : 163-171.
Herrnkind, W.F. (1977). Report on the spiny lobster fishery of Nicaragua., Cámara de la Industria Pesquera Nicaragüense, Managua, Nicaragua. (ms) 42 p.
Herrnkind, W.F. (1980). Movement patterns in Palinurid lobsters. pp: 349-407 In: Cobb, S.J. and Phillips, B.F. (eds). The biology and management of lobster. Vol. I; Physiology and behavior. New York Academic Press. 462 p.
Herrnkind, W.F. and Butler IV, M.J. (1986). Factors regulating postlarval settlement and juvenile micro-habitat use by spiny lobsters, Panulirus argus. Mar. Ecol. Prog. Ser., 34: 23-30.
Herrnkind, W.F. and Butler IV, M.J. (1994). Settlement of spiny lobster Panulirus argos (Latreille, 1804), in Florida: pattern without predictability? Crustaceana 67(1): 46-64.
Herrnkind, W.F., Jernakoff, P. and Butler IV, M.J. (1994). Puerulus and post-puerulus ecology pp. 213-229 In: Phillips, B.F., Cobb, J.S. and Kittaka, J. (1994). Spiny lobster management. Oxford Fishing News Books (Blackwell Scientific Publications), 550 pp.
Herrnkind, W.F. and Kanciruk, P. (1978). Mass migration of spiny lobster, Panulirus argus, (Crustacea: Palinuridae): Synopsis and Orientation. p 430-439 In: Schmidt S.K. and Keeton, W.T. Animal migration, Navigation and Homing, New York.
Herrnkind, W.F. and Lipcius, R. (1989). Habitat use and population biology of Bahamian spiny lobster. Proc.Gulf. Carib. Fish. Inst. (39): 265-278.

308
Herrnkind, W.F., Vandervalker, J. and Barr, L. (1975). Population dynamics, ecology and behavior of spiny lobster, Panulirus argus, of St. John, U.S. Virgin Islands: habitation and pattern of movement. Sci. Bull. Nat. Hist. Mus. Los Angeles Cty., 20: 31-34.
Heydorn, A.E.F. (1965). The rock lobster of the South Africa west coast Jasus lalandii (H. MILNE-EDWARDS) 2. Population studies, behaviour, reproduction, molting, growth and migration. S. Afr. Div. Sea Fish., Invest. Rep., 71?: 1-52.
Heydorn, A.E.F. (1969). Notes on the biology of Panulirus homarus and on length-weight relationship of Jasus lalandii. S. Afr., Div. Sea. Fish., Invest. Rep., 69?: 1-22.
Hilborn, R.M. and Peterman, R.M. (1996). The development of scientific advice with incomplete information in the context of the precautionary approach. p.77-101. In: FAO Fish. Tech. Pap. 350, Part 2. Rome, FAO. 210p.
Hoenig, J.M. (1983). Empirical use of longevity data to estimate mortality rates. Fish Bull. NOAA/NMFS 81(4): 898-903
Howard, R.K. (1988). Fish predators of the western rock lobster (Panulirus cygnus George) in a nearshore nursery habitat. Aust. J. Mar. Freshwat. Res., 39: 307-316.
Hunt, J.H. (1994). Status of the fishery for Panulirus argus in Florida. pp. 158-168. In: Phillips, D.B.F., Cobb, J.S. and Kittaka, J. (eds). Spiny lobster management. Fishing News Books, Oxford.
Hunt, J.H. and Lyons, W.G. (1986). Factors affecting growth and maturation of spiny lobsters, Panulirus argus, in the Florida Keys. Can. J. Fish. Aquat. Sci. 43:2243-2247.
IBAMA (1993). Relatório da Reunião do Grupo Permanente de Estudos (GPE) da Lagosta. Ministério do Meio Ambiente e da Amazônia Legal, Rio Formoso - Tamandaré, 73 p.
IBAMA (1994). Relatório da Reunião do Grupo Permanente de Estudos (GPE) da Lagosta. Ministério do Meio Ambiente e da Amazônia Legal, Rio Formoso - Tamandaré, 232 p.
Idyll, C.P. (1971). Spiny lobster fishery of the Caribbean. FAO Fish. Rep. (71), Vol.2.:133-148.
Infante, J. y Silva, M. (1992). Producción pesquera en las provincias de Barahona y Pedernales. En: Reportes del PROPESCAR-SUR: Contribuciones al conocimiento de las pesquerías en la República Dominicana/PROPESCAR-SUR. Vol. 1. Barahona, R:D.
INFONAC, (1977). El recurso langostero de la costa Atlántica de Nicaragua y su explotación. Div. de Pesca INFONAC, Volumen Especial.
IRENA, (Instituto Nicaragüense de Recursos Naturales y del Ambiente) (1980). Descripción de la pesquería de la langosta en el Océano Atlántico de Nicaragua. Depto. Ecosist. Acuát. Informe Circulación Restringida. IRENA: 22 p.
IRENA (1982). Descripción de la pesquería de la langosta en el océano Atlántico de Nicaragua. Contribución No 9, Memorias del Grupo de Trabajo Sobre la Langosta, FAO/WECAF/PNUD, INFORMES WECAF No. 36 (Es): 199-220
Irias y Cortés, (1996). Campaña biologica pesquera/langosta, a bordo del M/N TAYANNE ARIEL, en bancos de pesca, Misteriosa y Rosario. 16 pp.
Ivo, C.T.C. (1975). Novo estudo sobre o crescimento e a idade da lagosta Panulirus laevicauda (Latreille), em águas costeiras do Estado do Ceará (Brasil). Arq. Ciên. Mar 15, (1): 29-32.
Ivo, C.T.C. (1981). Dynamics of an exploited population of the Caribbean Red Snapper, Lutjanus purpureus Poey, on the North and Northeast Brazilian coastal waters. Tese de Mestrado, Biology Department, Dalhausie University, Halifax.

309
Ivo, C.T.C. (1996). Biologia, pesca e dinâmica populacional das lagostas Panulirus argus (Latreille) e Panulirus laevicauda (Latreille) (Crustacea: Palinuridae), capturadas ao longo da plataforma continental do Brasil, entre os estados do Amapá e do Espírito Santo. Tese de Doutorado, Departamento de Hidrobiologia, Universidade Federal de São Carlos, São Carlos, xiii + 277 p.
Ivo, C.T.C., Coelho, C.G.N. e Silva, C.D.V. (1984). Análise bioeconômica da pesca de lagosta no Nordeste do Brasil. Arq. Ciên. Mar, 23: 65-73.
Ivo, C.T.C. e Gesteira, T.C.V. (1986). Potencial reprodutivo das lagostas Panulirus argus (Latreille) e Panulirus laevicauda (Latreille) (Crustacea: Palinuridae), no Nordeste do Brasil. Arq. Ciên. Mar, 25:1-12.
Ivo, C.T.C. e Gesteira, T.C.V. (1996). Avaliação da fecundidade individual das lagostas Panulirus argus (Latreille) e Panulirus laevicauda (Latreille). Trabalho a ser publicado no Bol. Téc. Ciênt. CEPENE.
Ivo, C.T.C. e Limaverde, M.E.S. (1996). Estrutura da fauna acompanhante na pesca das lagostas Panulirus argus (Latreille) e Panulirus laevicauda (Latreille), no Estado do Ceará. Trabalho a ser publicado nos Arq. Ciên. Mar.
Ivo, C.T.C. e Neto, J.R. (1996). Estudo comparativo sobre a pesca de lagostas con cavu e rede de espera no estado do Ceará. Bol. Ciên. CEPENE, Tamandaré, 4(1): 95-134.
Ivo, C.T.C. e Pereira, J.A. (1996). Sinopse das principais observações sobre as lagostas Panulirus argus (Latreille) e Panuliras laevicauda (Latreille), capturadas em águas costeiras do Brasil, entre os estados do Amapá e do Espírito Santo. Bol. Tec. Ciên. CEPENE.
Ivo, CTC and Pereira, J.A. (1996): Crescimento e idade das lagostas Panulirus argus (Latreille) e Panuliras laevicauda (Latreille), no norte e nordeste do Brasil. Arg. Ciên. Mar. 30 (1-2): 33-39
Ivo, C.T.C., Vasconcelos, E.M.S. e Magalhães, J.A.D. (1996). Avaliação dos parâmetros biométricos das lagostas Panulirus argus (Latreille) e Panulirus laevicauda (Latreille) na plataforma continental das regiões Nordeste/Sudeste do Brasil. Trabalho a ser publicado no Boletim Técnico Ciêntífico do CEPENE, 1996.
Jamaica Fisheries Division and The Lobster and Conch Assessment Unit (CFRAMP). (1996). Lobster Assessment Workplan. 16p.
James, W.M. (1979). Working diving procedures en: NOAA Diving Manual second edition, United States Department of Commerce capt. 7:31 pp.
Johannes, R.W. (1978). Reproductive strategies of coastal marine fishes in the tropics. Env. Biol. Fish., 3, (1): 65-84.
Johnson, L.E. (1973). Florida landings. U.S. Department of Interior, C.F.S. No. 6419:1-19. Joll, L.M. and Crossland, C.J. (1983). Calcium uptake by juvenile western rock lobster,
Panulirus cygnus George, from dietary coraline algae. J. Exp. Mar. Biol. Ecol. 66: 69-80. Joll, L.M. and Phillips, B.F. (1984). Natural diet and growth of juvenile western rock lobsters
Panulirus cygnus George. J. Exp. Mar. Biol. Ecol., 75: 145-149. Jones, R. (1984). Assessing the effects of changes in exploitation pattern using length
composition data (with notes on VPA and cohort analysis). FAO Fish.Tech.Pap. (256):118 p.
Kanciruk, P. (1980). Ecology of juvenile and adult Palinuridae (spiny lobsters). pp. 59-96 In: Cobb, J.S. and Phillips, B.F. (eds). The biology and management of lobsters. London, Academic Press , Vol. II Ecology and Management.
Kanciruk, P. and Herrnkind, W.F. (1976). Autumnal reproduction in the spiny lobster Panulirus argus at Bimini, Bahamas. Bull. Mar. Sci.,26 (4):417-432.

310
Kanciruk, P. and Herrnkind, W.F. (1978). Mass migration of spiny lobster, Panulirus argus (Crustacea: Palinuridae): Population dynamics, environmental correlates and triggering stimuli. Bull. Mar. Sci., 28:601-623.
Kempf, M. (1979). Bionomia bentônica da la costa del Brasil. Memórias del Seminario sobre Ecologia y Sedimentación de la Plataforma Continental del Atlantico Sur, UNESCO, Montevideo, p. 171-184.
Khandker, N.A. (1964). Sponge as shelter for young spiny lobster. Trans. Am. Fish. Soc. 93:204.
Krouse, J.S. (1973). Maturity, sex ratio, and size composition of the American lobster, Homarus americanus, along the Maine coast. Fish. Bull., 71 (1): 165-173.
Kucharski, K.M. (1982). La pesquería de langostas en las islas del Turco y Caicos: Informe de su estado y desembarques recientes. Contribución No. 11. 234-245.
Labisky, R.F., Gregory, Jr., D.R., and Conti, J.A. (1980). Florida's spiny lobster fishery: a historical perspective. Fisheries 5:28-37. In Davis, G.E. (ed). Spiny lobster series, American Fisheries Society, 5410 Grosvenor Lane, Bethesda, MD 20014.
Lalana, R. (1989). Zoobentos de dos lagunas costeras en la región de Tunas de Zaza, Cuba. Rev. Invest. Mar. 10 (3): 223-232.
Larkin, P.A.A. (1977). Epitaph for the Concept of Maximum Sustainable Yield. Trans. Am. Fish. Soc., 106 (1): 1-11.
León, M.E. de, Cruz, R., Díaz, E., Brito, R., Puga, R. y Castillo, J. del (1991). Distribución y estacionalidad de juveniles de Panulirus argus en la plataforma cubana. Rev. Invest. Mar. 12(1-3): 117-123.
León, M.E. de, Cruz, R. y Puga, R. (1993a). Intensidad de pesca sobre el recurso langosta en el Golfo de Batabanó, Cuba. En: González, J. M. y Cruz, R. (eds), Memorias del Taller Binacional México Cuba. La utilización de refugios artificiales en las pesqueras de langosta: sus implicaciones en la dinámica y manejo del recurso, 17-21 mayo de 1993 Isla Mujeres, Q.R., México.
León, M.E. de, Cruz, R. and Puga, R. (1993b). The development of Cuban lobster fisheries. Conference on Regional Natural Resource Management, May 1993, Belize.
León, M. E. de, Cruz, R. & Puga, R. (1994). Nivel de explotación y productividad del recurso langosta en la plataforma suroccidental de Cuba. Memorias MARCUBA’94. Ciudad de la Habana.1994
León, M.E. de, Cruz, R. y Puga, R. (1995a). Actualización de la edad y el crecimiento de la langosta espinosa (Panulirus argus). Rev. Cub. Inv. Pesq. 19 (2): 3-8.
León, M.E. de, Cruz, R. y Puga, R. (1995b). Actualización de la edad y el crecimiento de la langosta espinosa (Panulirus argus) Rev. Cub. Inv. Pesq. 19 (2): 10-15.
León, M.E. de, Cruz, R. y Puga, R. (en prensa): Nivel de explotación y productividad del recurso langosta en la plataforma suroccidental de Cuba. Memorias MARCUBA ’94. La Habana. 1994.
León, M.E. de, Cruz, R., Diaz, E., Brito, R., Puga, R. y Castillo, J. del (1991). Distribución y estacionalidad de juveniles de Panulirus argus en la plataforma cubana. Rev. Invest. Mar. 12 (1-3): 117-124.
León, M.E. de y Hernández, R. (1992). Informe al Gobierno de Belize sobre la situación de la pesquería de langosta en el país. Asesoría al Fishery Department y la BFCA. Octubre-noviembre de 1992.
León M.E. de, Puga, R. y Cruz, R. (1991). Panorama de la pesquería cubana de langosta durante 1989. Rev. Cub. Inv. Pesq. 16(3-4):21-29.
León, M.E. de, Puga, R. y Cruz, R. (1994). Estimación de los parámetros de crecimiento de Panulirus argus en el Golfo de Batabanó, Cuba. Rev. Cub. Inv. Pesq. 18(1):9-12.

311
León, M.E. de, Puga, R. y Cruz, R. (1995). Intensidad de pesca con refugios artificiales (pesqueros) y trampas (jaulones) sobre el recurso langosta (Panulirus argus) en el sur de Cuba. Rev. Cub. Inv. Pesq. 19(2):22- 26.
León, M. E. de, Puga, R. & Cruz, R. (1997a). Estructura poblacional de la langosta en Cuba. Proyección de las capturas por talla. III Taller Binacional México-Cuba. Mazatlán, México. 1997.
León, M. E. de, Puga, R. & Cruz, R. (1997b). Situación de la estructura poblacional de la langosta (Panulirus argus) en la década del 90 en aguas cubanas. Taller Internacional Evaluación y Manejo de Recursos Pesqueros PESCA'97, Ciudad de la Habana. 1997.
Lewis, J.B., Moore, H.B. and Babis, W. (1952). The post-larval stages of the spiny lobster Panulirus argus. Bull. Mar. Sci. Gulf. Caribb. 2 : 324-337.
Liceaga-Correa, M.A., Ríos-Lara, G.V. Zetina-Moguel, C. y Hernández-Nuñez, H. (en revisión). Clasificación rápida del ambiente arrecifal para la evaluación de los recursos pesqueros. 50th Annual Meeting Gulf and Caribbean Fisheries Institute. Mérida, Yucatán. Noviembre 1997.
Lipcius, R. (1985). Size dependent reproduction and molting in spiny lobsters and other long-lived decapods. In: Wenner, A. Crustacean Issues 3: Factors in adults growth. A.A. Balkema/ Rotterdam/Boston.
Lipcius, R.N. and Cobb, J.S. (1994). Introduction: Ecology and fishery biology of spiny lobsters pp. 1-30 In: Phillips, B.F., Cobb, J.S. and Kittaka, J. (1994). Spiny lobster management. Oxford, Fishing News Books (Blackwell Scientific Publications), 550 pp.
Lipcius, R.N., Edwards, M.L. and Herrnkind, W.F. (1983). In situ mating behavior of the spiny lobster Panulirus argus. J. Crust. Biol., 3 (2): 217-222.
Little, Jr., E.J. (1977). Observations on recruitment of postlarval spiny lobsters, Panulirus argus, to the south Florida coast. Fla. Mar. Res. Publ. 29: 35pp.
Loesch, H. y Lopez, E. (1966). Observaciones sobre la langosta de la costa continental del Equador. Boletim Ciêntifico y Tecnico, Guayaquil, 1 (5): 1-29.
Lozano-Alvarez, E. (1996). On growing of juvenile spiny lobsters, Panulirus argus (Latreille, 1804) (Decapoda, Palinuridae), in portable sea enclosures. Crustaceana 69(8): 958-973.
Lozano-Alvarez, E., Briones-Fourzán, P. y González-Cano, J. (1991). Pesca exploratoria de langostas con nasas en la plataforma continental del área de Puerto Morelos, Q. Roo. México. An. Inst. Cienc. del Mar y Limnol. Univ. Nal. Autón. México 18(1): 49-58.
Lozano-Alvarez, E., Briones-Fourzán, P. and Negrete-Soto, F. (1993). Occurrence and seasonal variations of spiny lobster, Panulirus argus (Latreille), on the shelf outside of Bahía de la Ascención, México. Fish Bull. U.S. 91:808-815.
Lozano-Alvarez, E., Briones-Fourzán, P. and Phillips, B.F. (1991). Fishery characteristics, growth, and movements of the spiny lobster Panulirus argus in Bahía de la Ascensión, México. Fish. Bull. U.S. 89: 79-89.
Lozano-Alvarez, E. and Spanier, E. (1997). Behaviour and growth of captive spiny lobster (Panulirus argus) under the risk of predation. Mar. Freshwat. Res., 48: 707-713.
Lyons, W.G., Barber, D.G. Foster, S.M., Kennedy Jr., F.S., and Milano, G.R. (1981). The spiny lobster, Panulirus argus, in the middle and upper Florida Keys: Population structure, seasonal dynamics, and reproduction. Fla. Mar. Res. Publ. 38:1-38.
Lyons, W.G., Barber, D.G., Foster, S.M., Kennedy Jr., F.S., and Milano, G.R. (1986). Problems and perspectives regarding recruitment of spiny lobster, Panulirus argus, to the South Florida fishery. Can. J. Fish. Aquat. Sci. 43: 2099-2106.

312
Macdiarmid, A.B. (1991). Seasonal change in depth distribution, sex ratio and size frequency of spiny lobster Jasus edwardsii on a coastal reef in northern New Zealand. Mar. Ecol. Prog. Ser., Halstenbek, 70:129-141.
MacDonald, C.D. (1986). Recruitment of spiny lobster, Panulirus argus, pueruli in south Florida: an evaluation from two perspectives. Can. J. Fish. Aq. Sci. 43(11) : 2221-2227.
MacDonald, C.D., Jazwinski, S,C. and Prescott, J.H. (1984). Queuing behavior of the Hawaiian spiny lobster Panulirus marginatus. Bull. Mar. Sci., 35: 111-114.
Martínez, L. (1987a). Contenido alimenticio de la langosta del Pacífico Panulirus gracilis. Agosto 1987. CIP:7 p.
Martínez, L. (1987b). Información sobre la langosta del océano Pacífico de Nicaragua Panulirus gracilis. Agosto 1987. CIP:21p.
Martínez, S. (1993a). Aspectos sobre el manejo de las pesquerías de crustáceos en Nicaragua. Simposio sobre evaluación y manejo de las pesquerías de crustáceos en Nicaragua 6-7 diciembre, 1993. CIP/NORAD. 16 p.
Martínez, S. (1993b). Pesquerías de camarón y langosta en Nicaragua. Simposio sobre y manejo de las pesquerías de crustáceos en Nicaragua 6-7 diciembre, 1993. CIP/NORAD 23 p.
Martinez, S. (1994). Piratería de los recursos pesqueros en Nicaragua: caso de la langosta del Caribe (Panulirus argus), Post-Grado en Economía/Introducción a la Economía Ambiental;
Martínez, S. (1995). Informe de Nicaragua sobre la langosta del Caribe. Encuentro Sub-regional sobre la langosta del Caribe. Julio. CIRH/NORAD/OLDEPESCA. 31 p.
Martinez, S. (1996). Pesquerías de arrecife en las aguas nicaragüenses, 8th International Coral Reef Symposium; June 24-29,1996; 10 p.
Marx, J.M. and Herrnkind, W.F. (1985). Macroalgae (Rhodophyta: Laurencia spp.) as habitat for young juvenile spiny lobster Panulirus argus. Bull. Mar. Sci. 36: 423-431.
Marx, J.M. and Herrnkind, W.F. (1986). Spiny lobster, species profiles: life histories and environmental requirements of coastal fishes and invertebrates (South Florida). Biological Report 82 (11-61), U.S. Departm. of the Interior/U.S. Army Corps. of Engineers: 21 p.
Matthews, J.P. (1962). The rock lobster of South West Africa, Jasus lalandii (Milne-Edwards). Size frequency, reproduction, distribution and availability. S.W. Afr., Mar. Res. Lab., Invest. Rep., 7: 1-66.
Medley, P.A.H. (1998). A decision theory case study: Choosing a season opening for a spiny lobster (Panulirus argus L.) fishery. Fish. Res. 36: 159-170
Medley, P.A.H. and Ninnes, C.H. (1997). A recruitment index and population model for spiny lobster (Panulirus argus) using catch and effort data. Can. J. Fish. Aquat. Sci., 54: 1414-1421.
Menezes, J.T.B. (1992). Distribuição espacial da abundância de lagostas do gênero Panulirus, no Nordeste do Brasil. Dissertação de Graduação, Departamento de Engenharia de Pesca, UFC, Fortaleza, 38 p.
Menezes, M.F. (1991). Alimentação de lagostas do gênero Panulirus White, na plataforma continental do Estado do ceará, Brasil. pp. 67-80 In: Congresso Brasileiro de Engenharia de Pesca, VI, 1989, Teresina. Anais. Teresina: Associação dos Engenheiros de Pesca do Estado do Piauí, Terezina.
Mesquita, A.L.L. e Gesteira, T.C.V. (1975). Época de reprodução, tamanho e idade na primeira desova da lagosta Panulirus laevicauda (Latreille), na costa do Estado do Ceará (Brasil). Arq. Ciên. Mar. Fortaleza, 15 (2): 93-96.
Miller, D.L. (1982). Mexico´s Caribbean fishery: Recent change and current issues. Ph.D. Thesis. University of Wisconsin. Milwaukee, WI. USA. 251 pp.

313
Moe, Jr. M.M., (1991). Lobsters: Florida - Bahamas - the Caribbean. Green Turtle Publications, Plantation, FL 510 pp.
Montoya, R. (1990). Inspectoría y monitoreo biológico de la langosta Panulirus argus realizado en el océano Atlántico del 10 al 26 de julio de 1990. Informe técnico CIP 98:16 p.
Montoya, R. (1991a). Inspectoría de langosta en la planta de proceso PROMAR, S.A. Corn Island, océano Atlántico. Marzo 1991. Informe técnico CIP 119:12 p.
Montoya, R. (1991b). Inspectoria de langosta en la planta de proceso PROMAR, S.A. Corn Island, océano Atlántico. 23/05/91 - 07/06/91. Informe técnico CIP 124:13 p.
Moraga, E. (1992a). Crucero de inspección de la langosta Panulirus argus del océano Atlántico nicaragüense a bordo de la M/N “LYNN & BROTHERS” durante el mes de junio-julio de 1992. Informe técnico CIP 152:29 p.
Moraga, E. (1992b). Crucero de inspección de la langosta Panulirus argus del océano Atlántico nicaragüense a bordo de la M/N "LYNN & BROTHERS" durante el mes de noviembre de 1992. Informe técnico CIP 160: 22 p.
Morgan, G.R. (1974). Aspects of the population dynamics of the western rock lobster Panulirus cygnus, George, I. Estimation of population density. Aust. J. Mar. Freshwat. Res. 25: 235-248.
Morgan, G.R. (1980). Population dynamics of spiny lobster. pp.189-217 In: Cobb, J.S. and Phillips, B.F. (eds.) The biology and management of lobsters. vol. 2:. New York, Academic Press. 463 pp.
Mota-Alves, M.I. e Paiva, M.P. (1976). Frequência de acasalamentos em lagostas do gênero Panulirus White (Decapoda, Palinuridae). Arq. Ciên. Mar. Fortaleza, 16, (2): 61-63.
Mota-Alves, M.I. e Tomé, G.S. (1966a). Estudo sobre as gônadas da lagosta Panulirus laevicauda (Latr.). Arq. Est. Biol. Mar. Univ. Fed. Ceará, Fortaleza, 6, (1) 1- 9.
Mota-Alves, M.I. e Tomé, G.S. (1966b). Observações sobre a origem e desenvolvimento da massa espermatofórica de Panulirus laevicauda (Latr.). Arq. Est. Biol. Mar. Univ. Fed. Ceará, Fortaleza, 6, (1): 99-102.
Moura, S.J.C. (1962). Pesca de lagosta na costa nordestina: I - tipos de covos. Bol. Est. Pesca, Recife, 2, (4): 10-11.
Moura, S.J.C. (1965). Indícios de sobre-pesca de lagostas na área do Pina, Pernambuco. Bol. Est. Pesca, Recife, 6, (2): 7-21.
Moura, S.J.C. e Costa, A.F. (1966). Considerações sobre a ação predatória das redes de arrasto manual em Pontas de Pedra - Pe. Bol. Est. Pesca, Recife, 6, (4): 17-19.
MRAG, (1992). Catch and Effort Data Analysis. Version 1.0. Overseas Development Administration/ Marine Resources Assessment Group, 27 Campden Street, London W8 7EP, UK.
Muller, R.G. J.H. Hunt. And T.R. Mathews. (in press). Evaluation of effort reduction in the Florida Keys spiny lobster, Panulirus argus, fishery using sequential population analysis. Submitted to Australian Journal of Marine and Freshwater Research.
Muller, R.G., Hunt, J.H., Matthews, T.R. and Sharp, W.C. (1997). Evaluation of effort reduction in the Florida Keys spiny lobster, Panulirus argus, fishery using an age-structured population analysis. Mar. and Freshwat. Res. 48: 1045-1058.
Munro, J.L. (1974). The biology, ecology, exploitation and management of Caribbean reef fishes. Crustaceans (spiny lobsters and crabs). Res. Rep. Zool. Dept. Univ. West Indies (3), part 6, 57 p.
Munro, J.L. (1983). Caribbean coral reef fishery resources. ICLARM Studies and Reviews 7, Manila, Phillippines.

314
Nascimento, I.V. (1970). Fecundidade da lagosta Panulirus argus (Latr.), 1804 na praia de Muriú, costa do Rio Grande do Norte. Bol. Est. Pesca, Recife, 10(1):21-28.
Nascimento, I.V. (1984). Reprodução das lagostas Panulirus argus e Panulirus laevicauda (Latr.) provenientes de desembarques comercias em Natal, Estado do Rio Grande do Norte, Série: Brasil. SUDENE. Estudos de Pesca, Recife, n. 11, p. 25-34,.
Nascimento, I.V. (1985a). Sobre a reprodução da lagosta Panulirus laevicauda (Latr.). Parte III. SUDENE, Divisão de Recursos Pesqueiros, Série Estudos de Pesca, Recife, n. 1, não paginado.
Nascimento, I.V. (1985b). Fecundidade da lagosta Panulirus laevicauda (Latr.) e sua relação com a P. argus (Latr.). SUDENE, Divisão de Recursos Pesqueiros, Série Estudos de Pesca, Recife, n. 1, não paginado.
Nascimento, I.V. e Araújo, M.E. (1984). Fecundidade das lagostas Panulirus argus e Panulirus laevicauda (Latr.), capturadas no litoral do Rio Grande do Norte. Série: Brasil. SUDENE. Estudos de Pesca, Recife, 11: 35-43.
Nascimento, I.V., Travassos, I.B., Borges, G.A., Borba, Z.R. e Araújo, M.E. (1984). Determinação dos parâmetros biométricos das lagostas Panulirus argus e Panulirus laevicauda (Latr.), capturadas no litoral do Estado do Rio Grande do Norte. Série: Brasil. SUDENE. Estudos de pesca, Recife, 11: 12-23.
Neiva, G.S. e Moura, S.J.C. (1977). Sumário sobre a exploração de recursos marinhos do litoral brasileiro: situação atual e perspectivas. P.D.P., ser. Doc. Tec. Ocas., Brasília, 27: 1-48.
Newlin, K. (1988). Status of the U.S. fisheries report: spiny lobster of the south Atlantic and the Gulf of Mexico. National Marine Fisheries Service, Southeast Fisheries Center. 15 p.
Oliveira, G.M. de and Pereira, H.L. (1982). La pesquería de langosta en el Nordeste de Brazil. Contribución No. 4. Memorias del Grupo de Trabajo Sobre la Langosta, FAO/WECAF/PNUD, INFORMES WECAF No. 36 (Es):79-113.
Olsen, D. A. and I. G. Koblic. (1975a). Population dynamics, ecology and behavior of spiny lobsters. Panulirus argus, of St. John. U. S. V. I. Growth and mortality. Results of the Tektite Program. Bull. Nat. Hist. Mus. L. A. County, (20):17-22.
Orellana, F. et al. (1985). Primer informe técnico del proyecto ordenamiento de las pesquerías de camarón y langosta. Marzo 1985. INPESCA. 248 p.
Páez, J., Revilla, N. y Baisre, J.A. (1991): Relación entre la captura por unidad de área de la langosta (Panulirus argus) y los diferentes biotopos en el Golfo de Batabanó. Rev. Invest. Mar. 12(1-3):269-279.
Paiva, M.P. (1958). On the spiny lobster fishing in Ceará. Bol. Antropologia, Fortaleza, (2): 63-70.
Paiva, M.P. (1961). Recursos básicos da pesca marítima no nordeste brasileiro. Bol. Est. Biol. Mar. Univ. Ceará, Fortaleza, 3: 1-10.
Paiva, M.P. (1967). Algunos problemas de la industria langostera en el Brasil. Arq. Est. Biol. Mar. Univ. Fed. Ceará, Fortaleza, 7, (2): 105-112.
Paiva, M.P. (1968). Estudo sobre a pesca de lagostas no Ceará, durante o ano de 1967. Arq. Est. Biol. Mar. Univ. Fed. Ceará, Fortaleza, 8 (1): 47-64.
Paiva, M.P. (1969). Estudo sobre a pesca de lagostas no Ceará, durante o ano de 1968. Arq. Ciên. Mar, Fortaleza. 9 (1): 41-55.
Paiva, M.P. (1974). Distribuição do esforço e variação da abundância na pesca de lagosta no Estado de Ceará. Ciência e Cultura, Rio de Janeiro, 26: 365-369.
Paiva, M.P. (1976). Estudo sobre a pesca de lagostas no Ceará, durante o ano de 1975. Arq. Ciên. Mar, Fortaleza, 16, (1): 27-30.

315
Paiva, M.P., Bezerra, R.C.F. e Fonteles-Filho, A.A. (1971). Tentativa de avaliação dos recursos pesqueiros do nordeste brasileiro. Arq. Ciên. Mar, Fortaleza, 11, (1): 1-43.
Paiva, M.P. e Costa, R.S. da (1963a). Informações sobre as pescas marítimas no Estado do Rio Grande do Norte. Bol. Soc. Cear. Agron., Fortaleza, 4: 25-37.
Paiva, M.P. e Costa, R.S. da (1963b). Tamanho de fêmeas de lagosta em reprodução nas águas costeiras do Ceará. Arq. Est. Biol. Mar. Univ. Ceará, Fortaleza, 3, (2): 53-56.
Paiva, M.P. e Costa, R.S. da (1965). Estudos de biologia da pesca de lagostas no Ceará - Dados de 1964. Arq. Est. Biol. Mar. Univ. Ceará, 7 (2): 147-171.
Paiva, M.P. e Costa, R.S. da (1968). Comportamento biológico da lagosta Panulirus laevicauda (Latreille). Est. Biol. Mar. Univ. Ceará, Fortaleza, 8, (1): 1-6.
Paiva, M.P. et al. (1973). Pescarias experimentais de lagosta com redes de espera, no Estado do Ceará (Brasil). Arq. Ciên. Mar., Fortaleza, 13, (2): 121-134,.
Paiva, M.P. e Fonteles-Filho, A.A. (1968). Sôbre as migrações e índices de exploração da Panulirus laevicauda (Latreille). Arq. Est. Biol. Mar. Univ. Ceará, Fortaleza, 8, (1): 15-23.
Paiva, M.P. e Moura, S.J.C. (1965). Considerações sobre a exportação de caudas congeladas de lagostas. Bol. Est. Biol. Mar. Univ. Ceará, Fortaleza, 8: 1-17.
Paiva-Filho, D.L. e Alcantara-Filho, P. (1975). Pescarias comercias de lagostas com redes de espera, no Estado de Ceará (Brasil). Arq. Ciên. Mar, Fortaleza, 15, (1): 41-44.
Palz, J.N., Revilla, N. y Baisre, J.A. (1991). Relación entre la captura por unidad de área de la langosta (Panulirus argus) y los diferentes biotopos en el Golfo de Batanan. Rev. Inv. Mar. 12(1-3): 269-279.
Parsons, J.J. (1964). San Andrés y Providencia, una geografía historica de las islas colombianas del mar Caribe occidental. Publ. Banco República, Bogotá, 152 pp.
Patterson, K.R. and Melvin, G.D. (1996). Integrated catch at age analysis, version 1.2. Scottish Fisheries Research Report No. 58. 60 pp.
Pauly, D. (1980). On the relationships between natural mortality, growth parameter, and mean environmental temperature in 175 fish stocks. J.Cons.Int.Explor.Mer, 39 (8): 179-192.
Pauly, D. (1985). On improving operation and use of ELEFAN programs. Part I: Avoiding drift of K towards low values. Fishbyte, 3:13-14.
Peacock, N.A. (1974). A study of the spiny lobster fishery of Antigua and Bermuda. Proc. Gulf. Carib. Fish. Inst. 26:117-130.
Pearce, A.F. and Phillips, B.F. (1988). ENSO events, the Leeuwin Current, and larval recruitment of the western rock lobster. J.Cons.Int.Explor.Mer, 45: 13-21.
Pérez, E. (1996). Análisis de riesgo e incertidumbre en la pesquería de Mesodesma donacium en Bahía de Coquimbo (Chile, IV región). M. Sc. Dissertation. CINVESTAV-IPN, México. 82 pp.
Peréz, M. (1994). Algunas especies de crustáceos con potencial pesquero en Nicaragua. Simposio sobre evaluación y manejo de las pesquerías de crustáceos en Nicaragua 6-7 diciembre, 1993. CIP/NORAD. 35 p. 1994
PETROBRÁS (1997). Caracterização ambiental do meio marinho da área de Caraúnam. Fortaleza, 202 pp.
Phillips, B.F. (1972). A semi-quantitative collector of the puerulus larvae of the western rock lobster Panulirus longipes cygnus George (Decapoda: Palinuridae) Crustaceana 22: 147-154.
Phillips, B.F. (1995). Collectors for catching the puerulus stage of spiny lobsters: a summary . Rev. Cub. Invest Pesq. 19 (1) : 33-41.

316
Phillips, B.F. and Booth, J. (1994). Design, use and effectivness of collectors for catching the puerulus stage of spiny lobsters. Reviews in Fisheries Science 2(3): 181-215.
Phillips, B.F., Cobb, J.S. and George, R.W. (1980). General biology. pp. 1-82 In: Cobb, J.S. and Phillips, B.F. (eds). The Biology and Management of Lobsters. New York, Academic Press, Vol. 1, Physiology and Behavior.
Phillips, B.F., Cobb, J.S. and Kittaka, J. (1994). Spiny lobster management. Oxford, Fishing News Books (Blackwell Scientific Publications), 550 pp.
Phillips, B.F., Cruz, R., Brown, R. and Caputi, N. (1994). Predicting the catch of spiny lobster fisheries. In: Phillips, B.F., Cobb, J.S. and Kittaka, J. (eds). Spiny Lobster Management, Oxford, Fishing New Books.
Phillips, B.F. and Hall, N.G. (1978). Catches of puerulus larvae on collectors as a measure of natural settlement of the western rock lobster Panulirus cygnus George. CSIRO Div. Fish. Oceanogr. Rep. 98, 18 pp.
Phillips, B.F. and Macmillan, D.L. (1987). Antenal receptors in puerulus and postpuerulus stages of the rock lobster Panulirus cygnus (Decapoda: Palinuridae) and their potential role in puerulus navigation. J. Crust. Biol. 7:122-135.
Phillips, B.F. and Olsen, L. (1975). The swimming behavior of the puerulus stage of the western rock lobster. Aust. J. Mar. Freshw. Res. 26: 415-7.
Phillips, B.F., Palmer, M.J., Cruz, R. and Trendall, J.T. (1992). Estimating growth of the spiny lobsters Panulirus cygnus, Panulirus argus, and Panulirus ornatus. Aust. J. Sci. Res. 45(5).
Phillips, B.F., Pearce, A.F. and Litchfield, R.T. (1991). The Leeuwin current and larval recruitment to the rock (spiny) lobster fishery off Western Australia. Journal of the Royal Society of Western Australia 74: 93-100.
Phillips, B.F., Pearce, A.F., Litchfield, R. and Guzman, S.A. del Proo. (1994b). Spiny lobster catches and the ocean environment. In: Phillips, B.F., Cobb, J.S. and Kittaka, J. (eds). Spiny lobster management, Chapter 16, Oxford, Fishing News Books.
Piñeiro, R. y García, C. (1995). Plan de instalación de estaciones hidrometerológicas en la plataforma cubana. Rev. Cub. Inv. Pesq. 19(1): 47- 50.
Pollock, D.E. (1992). Paleoceanography and specialization in the spiny lobster genus Panulirus, in the Indo-Pacific. Bull. Mar. Sci., Coral Gables, 51, p. 135-146.
Polovina, J.J. and Mitchum, G.T. (1992). Variability in spiny lobster Panulirus marginatus recruitment and sea level in the North western Hawaiian Islands, Fish. Bull. 90: 483-493.
Porto, V.R. (1992). Alguns aspectos reprodutivos em gônadas de lagosta do gênero Panulirus laevicauda (Latreille). Dissertação de Graduação, Departamento de Engenharia de Pesca, UFC, Fortaleza, 20 p.
Powers, J.E. (1985). An update of spiny lobster assessment data. National Marine Fisheries Service, Southeast Fisheries Center ML1-85-28. 10 p.
Powers, J.E. and Bannerot, S.P. (1984). Assessment of spiny lobster resources of the Gulf of Mexico and southeastern United States. National Marine Fisheries Service, Southeast Fisheries Center, Miami, Fl. 25 p.
Powers, J.E. and Sutherland, D.L. (1989). Spiny lobster assessment, cpue, size frequency, yield per recruit and escape gap analyses. National Marine Fisheries Service. Southeast Fisheries Center. CRD-88/89-24. 75 p.
Powers, J.E. and Thompson, N.B. (1986). Spiny lobster assessment update and preliminary examination of management options. National Marine Fisheries Service. Southeast Fisheries Center. CRD-86/87-1. 21 p.
Pringle, J.D. (1986). California spiny lobster (Panulirus interruptus) larval retention and recruitment: A review and synthesis. Can. J. Fish. Aquat. Sci. 43: 2142-2152.

317
Puga, R. (1996). Análisis bioeconómico de la pesquería de la langosta Panulirus argus en el Golfo de Batabanó, Cuba. Tesis presentada en opción al grado académico de Maestro en Ciencias en Biología Marina. Centro de Investigaciones Pesqueras, Cuba. 46 pp.
Puga, R. (1997). Informe sobre la visita a Colombia para el fomento de la pesquería y las investigaciones sobre la langosta en la Guajira colombiana. Santa Fé de Bogotá, abril de1997.
Puga, R., Alfonso, A., Cruz, R. y León, M.E. de (1995). Un modelo para la evaluación de variantes en le manejo de la pesquería de langosta en Cuba. Rev. Cub. Inv. Pesq. 19(2): 83-87.
Puga, R., Cortes, I., León, M.E. de, Cruz, R. y Otero, R. (1992). Evaluación de la pesquería de langosta (P. argus) de la Región Noroccidental de Cuba. Rev. Cub. Inv. Pesq. 17(1):1-8.
Puga, R., Cruz, R. y León, M.E. de (1994). Tendencias del reclutamiento a la pesquería de la langosta Panulirus argus en el Golfo de Batabanó. Rev. Cub. Inv. Pesq. 18(1):12-15.
Puga, R., León, M.E. de y Cruz, R. (1991). Evaluación de la pesquería de langosta espinosa Panulirus argus en Cuba. Rev. Invest. Mar. 12 (1-3): 286-292.
Puga, R., León, M.E. de y Cruz, R. (1992). Evolución de la pesquería de langosta en Cuba hasta 1990. Rev. Cub. Inv. Pesq., 17(2): 50-55.
Puga, R., León, M.E. de y Cruz, R. (1993). Estacionalidad de la mortalidad por pesca asociada con las técnicas de captura de langosta en el Golfo de Batabanó, Cuba. pp. 38-46. En: González, J.M. y Cruz, R. (eds), Memorias del Taller Binacional México-Cuba. La utilización de refugios artificiales en las pesquerías de langosta: sus implicaciones en la dinámica y manejo del recurso, 17-21 mayo de 1993 Isla Mujeres, Q.R., México.
Puga, R., León, M.E. de y Cruz, R. (1994). (en prensa): Variaciones de la mortalidad por pesca por estaciones en la pesquería de langosta cubana. Memorias MARCUBA '94, La Habana.
Puga, R., León, M.E. de y Cruz, R. (1995). Estado de explotación y estructura poblacional de la langosta Panulirus argus en Cuba. Rev. Cub. Inv. Pesq. 19(2):41-49.
Puga, R., León, M.E. de and Cruz, R. (1996). Catchability of the main fishing methods in the Cuban fishery of the spiny lobster Panulirus argus Latreille, 1804, and implications for management. (Decapoda, Palinuridae). Crustaceana 69(6): 703-718.
Puga, R., León, M. E. de & Cruz, R. (1997). Modelación bioeconómica para el manejo de la pesquería de langosta en Cuba. Estado actual y perspectiva. Taller Internacional Evaluación y Manejo de Recursos Pesqueros PESCA'97, Ciudad de la Habana. 1997.
Punt, A.E. and Hilborn, R. (1996). BIODYN Biomass dynamic models. User´s manual. FAO. Computerized Information Series (Fisheries). No. 10 Rome, FAO: 62 p.
Quesada, A., Prieto, A., Silveira, R. y García, E. (1995). Variación de la microecología de los juveniles de langosta espinosa (Panulirus argus) cuando son transferidos del medio natural a condiciones controladas. Rev. Cub. Inv. Pesq. 19(1): 64- 66.
Ragua J.M. y Rubio, E. (1995). Evaluación de la pesquería industrial de la langosta espinosa (Panulirus argus) en el Archipielago de San Andres y Providencia, Caribe colombiano. Tesis de pregrado. Biólogo marino. Universidad Jorge Tadeo Lozano. Fac. Biología Marina. Santafé de Bogotá. 159 pp.
Ramírez Estévez, A.E. (1996). Reproducción de la langosta espinosa Panulirus argus (Latreille, 1804) en la costa noreste de Quintana Roo. Tesis Maestría. UNAM. Facultad de Ciencias. 85 pp.
Ramírez Estévez, A.E., Sandoval, M. y González-Cano, J. (1995). Comparación de dos métodos para la estimación de la fecundidad de la langosta Panulirus argus, Rev. Cub. Inv. Pesq. 19(1): 42-46.

318
Restrepo, V.R. (1996). FADAPT Version 3.0: a guide. Unpublished manuscript. University of Miami, RSMAS, 4600 Rickenbacker Causeway, Miami, Florida 33149, USA.
Rios, G.J. (1991). Análises dos caracteres biométricos das lagosta Panulirus argus (Latreille) e Panulirus laevicauda (Latreille), no Estado do Ceará, Brasil. Dissertação de Graduação, Departamento de Engenharia de Pesca, UFC, Fortaleza, 26 p.
Ríos, G.V., Cervera, K., Espinosa, J.C., Pérez, M., Zetina, C.E. y Chablé, F. (en revisión). Estimaciones de la densidad de langosta Panulirus argus y el caracol rosado Strombus gigas en el área central del arrecife Alacranes. Ciencia Pesquera Nueva Epoca. Ins. Nal. De la Pesca. Sría. De Medio Amb. Rec. Nat. y Pesca. México.
Ríos, G.V., Zetina, C.E. y Cervera, K. (en prensa). Análisis del esfuerzo en la pesquería de langosta espinosa Panulirus argus en el estado de Yucatán, México. Revista Oceanides. CICIMAR.
Ríos, G.V., Zetina, C.E., Cervera, K., Mena, R.W. y Chablé, F. (1998). La pesquería de langosta espinosa Panulirus argus en las costas del Estado de Yucatán. Contribuciones de Investigación Pesquera. Doc. Téc. 6. CRIP Yucalpetén. INP. SEMARNAP. 55 p.
Riveros, G., (1972). Ganancia hipotética de los pesos de Panulirus argus durante las mudas frente La Guaira. Bol. Inf. Bogotá 2(3): 29-45
Rocha, C.A.S. e Mesquita, A.L.L. (1974). Estudo da concentração do esforço empregado na pesca de lagostas, no Estado de Ceará (Brasil). Arq. Ciên. Mar 14 (2): 131-133.
Rodriguez, Suazo y Pineda (1997). Monitoreos biológicos de pesca artesanal de langosta/nasa, en la Bahía de Omoa, Cortés
Rolim, A.E. e Rocha, C.A.S. (1972). Biometria de lagostas jovens de gênero Panulirus Gray. Arq. Ciên. Mar. 12 (2): 91-97.
Sahney, A.K. (1983). Sample survey of the fishing industry in Jamaica, 1981. Kingston, Ministry of Agriculture.
Sanchéz, R. y Hernández, A. (1991). Relaciones morfométricas y aspectos biológicos-pesqueros de la langosta verde del Pacífico Panulirus gracilis (Streets, 1871). CIP-INPESCA 44 p.
Santos, E.P., Alcantara-Filho, P.A. e Rocha, C.A.S. (1973). Curvas de rendimento de lagosta no Estado do Ceará (Brasil). Arq. Ciên. Mar.13 (1): 9-12.
Santos, E.P., Costa, R.S. and Moura, S.C.M. (1964). Growth of the spiny lobster Panulirus argus (Latr.): quantitative aspect. Arq. Est. Biol. Mar. Univ. Ceará 4 (2): 42-44.
Santos, E.P. e Ivo, C.T.C. (1973). Crescimento e idade da lagosta Panulirus laevicauda (Latreille), em águas costeiras do Estado de Ceará (Brasil). Arq. Ciên. Mar.13 (1): 19-23.
Schirm, B. (1995a). Estimaciones sobre la situación de los recursos pesqueros en la costa sur de la República Dominicana. En: Reportes del PROPESCAR-SUR: Contribuciones al conocimiento de las pesquerías en la República Dominicana/PROPESCAR-SUR. Vol. 2. Barahona, R.D.
Schirm, B. (1995b). Estimaciones sobre la situación de los recursos pesqueros en la costa sur de la República Dominicana. En: Reportes del PROPESCAR-SUR: Contribuciones al conocimiento de las pesquerías en la República Dominicana/PROPESCAR-SUR.- Vol. 2.- Barahona, R.D.
Seijo, J.C. (1993). Individual transferable grounds in a community managed artisanal fishery. Marine Resource Economics 8(1):78-81.
Seijo, J.C., Pérez, E., Cabrera, M. y Hernández, D. (1997). Riesgo e incertidumbre en el manejo de recursos vivos: Un enfoque bioeconómico precautorio. In: Gestión de Sistemas Oceanográficos del Pacífico Oriental. Comisión Oceanográfica Intergubernamental de la UNESCO. Eduardo Tarifeño (Ed.). IOC/INF - 1046:203-212

319
Seijo, J.C., Salas, S., Arceo, P. y Fuentes, D. (1991). Análisis bioeconómico comparativo de la pesquería de langosta Panulirus argus de la plataforma continental de Yucatán. FAO Fish. Rep.(431) Suppl.:39-58.
Seijo, J.C., Salas, S., Arceo, P. y Fuentes, D. (1991). Análisis bioeconómico de métodos alternativos de captura de langosta (Panulirus argus) de la plataforma continental de Yucatán. Rev. Invest. Mar. 12 (1-3): 300-308.
Sequeira, R. (1980). Existencia y potencial de los recursos pesqueros en Nicaragua. INPESCA. 17 p.
Silva, J.R.F., Gesteira, T.C.V. e Rocha, C.A.S. (1994). Relações morfométricas ligadas à reprodução da lagosta espinhosa, Panulirus laevicauda (Latreille) (Crustácea Decápoda Palinuridae) do Estado do Ceará - Brasil. Bol. Téc. Ciênt.2 (1): 59-88.
Silva, S.M.M.C. (1998). Pescarias de lagosta no Estado do Ceará: Caracteristicas e rendimentos. Tese de Mestrado, Departamento de Engenharia de Pesca da Universidade Federal do Ceará.
Silva, S.M.M. e Cavalcante, P.P.L. (1994). Perfil do setor lagosteiro nacional. IBAMA, ser. Est. Pesca 12: 1-80.
Silva, V.R.C. (1965). Eficiência de armadilhas na captura de lagosta. Bol. Est. Pesca 5 (4): 7-27.
Simmons, D.C. (1980). Review of the Florida spiny lobster resource. Fisheries 5(4):37-42. Smith, K.N. and Herrnkind, W.F. (1992). Predation on early juvenile spiny lobsters Panulirus
argus (Latreille): influence of size and shelter. J. Exp. Mar. Biol. Ecol.157: 3-18. Smith, V.L. (1969). On models of commercial fishing. J. Polit. Econ. 77: 181-198. Soares, C.N.C. (1990). Reproductive season of the Caribbean spiny lobster Panulirus argus
in the coast of Northern Brazil. Fishbyte, Manila, ICLARM 8 (3): 27-28. Soares, C.N.C. (1994). Época de reprodução da lagosta Panulirus argus (Latreille), no litoral
do Estado do Ceará, Brasil. Dissertação de Mestrado. Departamento de Engenharia de Pesca, UFC, Fortaleza, 119 pp.
Soares, C.N.C. y P.P.L. Cavalcante. (1984). Dinámica reproductiva de las langostas P. argus y P. laevicauda del litoral de la región nororiental del Brasil. COPACO. Grupo de trabajo sobre evaluación de recursos pesqueros marinos. 4ta Reunión, Bogotá, Colombia. 29 octubre al 2 de noviembre.
Soares, C.N.C. and Cavalcante, P.P.L. (1985). Caribbean spiny lobster (Panulirus argus) and smoothtail spiny lobster (Panulirus laevicauda) reproductive dynamics on the Brazilian Northeastern coast. WECAFC. National reports and selected papers presented at the fourth session of the working party on assessment of marine fishery resources. Paipa, Department of Boyacá, Colombia, 29 October-2 November 1984. FAO Fish Rep. (327) Suppl: 200-217.
Sosa Cordero, E. (en preparación). Aplicación de modelos de producción dinámicos en la pesquería de langosta Panulirus argus de Quintana Roo. ECOSUR-Chetumal.
Sosa Cordero, E., Arce, A.M., Aguilar-Dávila, W. y Ramírez-González, A. (1995). Introducción de hábitats artificiales en la pesquería de langosta (Panulirus argus) de Cayos Contoy, Quintana Roo, México. Rev. Cubana de Inv. Pesq. 19(2):95-103.
Sosa Cordero, E., Arce, A.M., Aguilar-Dávila, W. and Ramírez-González, A. (in press). Artificial shelters for spiny lobster Panulirus argus (Latreille): an evaluation of occupancy in different benthic habitats. J. Exp. Mar. Biol. Ecol. 18 p.
Sosa Cordero, E., Ramírez González, A., Domínguez Viveros, M. y Medina Quej, A. (1993). Análisis de la pesquería de langosta Panulirus argus de Quintana Roo mediante modelos globales. Reporte Final. Proyecto CIQRO/CONACYT. 121 pp.

320
Sotomayor, R. y Cruz, R. (1990). Sistema automatizado de dirección para la investigación y el manejo de la pesquería de langosta en Cuba. Resumen International Workshop on Lobster Ecology and Fisheries. La Habana , Cuba, 16-12 junio de 1990.
Squires, H., Herazo, B., Buchelli, L., Testaverde, S. y Riveros, G. (1974). Cruceros para camarones y langostas en las costas del Caribe colombiano por el B/I Chocó en 1970. Rev. Div. Pesq. INDERENA Bogotá II (2-3): 1-10.
Squires, H.J. and Riveros, G. (1978). Fishery biology of spiny lobster (Panulirus argus) of the Guajira península of Colombia, South América, 1969-1970. Proc. Nat. Shell Fish Assoc., 68:63-74.
Sutcliffe, W.E. (1952). Some observations on the breeding and migration of the Bermuda spiny lobster, Panulirus argus. Proc. Gulf. & Caribb. Fish. Inst. 4:64-69.
Sweat, D.E. (1968). Growth and tagging studies on Panulirus argus (Latr.) in the Florida Keys. Fla. Sta. Bd. Conserv. Tech. Ser., 57: 1-30.
TECNOPESCA (1985). Primer Informe Técnico del Proyecto Ordenamiento de las Pesquerías de Camarón y Langosta, Proyecto POPCAL.TECNOPESCA/INPESCA: 248 p.
Templeman, W. (1936). Local differences in the life history of the lobster (Homarus americanus) on the coast of the Maritime Provinces of Canada. J. Biol. Board. Can. 2: 41-88.
Thompson, N.B. and Powers, J.E. (1987). Spiny lobster assessment update. National Marine Fisheries Service. Southeast Fisheries Center. CRD-86/87-30. 10 p.
Thompson, R.W. (1982). La industria langostera en las Bahamas. Contribución No. 3, Memorias del Grupo de Trabajo Sobre la Langosta, FAO/WECAF/PNUD, INFORMES WECAF No. 36 (Es):50-78.
Thompson, W.F. and Bell, F.H. (1934). Biological statistics of the Pacific halibut fishery. 2. Effect of changes in intensity upon total yield and yield per unit of gear. Rep.Int.Fish. (Pacific Halibut) Comm., (8):49 p.
Torres, W. (1992). Informe sobre el trabajo de inspectoría de la langosta en las plantas pesqueras. Corn Island, del 09 al 19 de marzo, 1992. Informe técnico CIP 147:8 p.
Torres, W. y Moraga, E. (1992). Informe sobre el trabajo de inspectoría de la langosta en las plantas de acopio en Corn Island del 01 al 19 de mayo de 1992. Informe técnico CIP 161:8 p.
Vanegas, F. y Blanco, C.D. (1982). Crucero de pesca exploratoria para langosta en la costa del Pacífico de Nicaragua: Barco "ANTIYA". Enero 1982. INPESCA. 14 p.
Vasconcelos, J.A. e Vasconcelos, E.M.S. (1994). Determinação de novos parâmetros biométricos das lagostas Panulirus argus (Latreille) e Panulirus laevicauda capturadas no litoral do Rio Grande do Norte. Bol. Téc. Ciênt.2, (1): 51-58.
Vasconcelos, J.A. de e Oliveira, J.E.L. (1996). Estudo comparativo sobre a pesca de lagostas con rede-de-espera e mergulho no estado de Rio Grande do Norte. Bol. Tec. Ciênt. CEPENE, Tamandaré, 4(1): 135-172.
Velásquez, L.E. (1993). Crucero de inspectoria al recurso langosta (P. argus) realizado a bordo de la M/N “CARIBBEAN III” en el océano Atlántico nicaragüense en el periodo que va del 09 de nov. al 07 de dic. 1992. Informe técnico CIP. 163: 22p.
Villalobos, J. (1985). Informe de la langosta Panulirus argus en período de reproducción en el Océano Atlántico de Nicaragua (Corn Island) durante 1984-85 hasta mayo 1986 (Sin Publicar). Cen. Invest. Pesq. CIP/INPESCA: 8 p.
Villalobos, J. (1986). Informe de la langosta Panulirus argus en el período de reproducción en el océano Atlántico de Nicaragua, Corn Island de los años 1984, 1985 hasta mayo 1986. CIP/ INPESCA. 8 p.
321
Villalobos, J. y García, C. (1988). Informe correspondiente al I crucero de investigación de la especie Panulirus argus realizado en el océano Atlántico (Corn Island) Enero 1988. CIP/INPESCA, 15 p.
Villegas, L. y P. Charlier, (1980). La pesquería de langosta de la región Atlántica de Nicaragua., Proyecto WECAF/FAO/PNUD, Panamá, Panamá. (Ms).
Villegas, L., Charlier, P. y Arosemena, D.H. (1982). Las pesquerías de langostas en el Atlántico Centro-Occidental. Contribucon No. 2, Memorias del Grupo de Trabajo sobre la langosta. FAO/WECAFC/PNUD, INFORMES WECAFC No. 36 (Es): 30-49.
Wade, B., Fanning, L.P. and Auil, S.A. (1992). Morphometric relationships for the Spiny Lobster (Panulirus argus) in Belize. Belize City. Belize. unpublished. 9pp.
Ward, J.A. (1989). Patterns of settlement of spiny lobster Panulirus argus post larvae at Bermuda. Proc. Gulf & Caribb. Fish. Inst. 39: 255-264.
Ward, J.A. and Luckhurst, B.E. (1996). Development of a lobster specific trap in Bermuda and fisheries management considerations for the re-establishment of a commercial lobster fishery. Proc. Gulf & Caribb. Fish. Inst. 44: 566-578.
Warner, E.E., Combs, C.L. and Gregory, Jr., D.R., (1977). Biological studies of the spiny lobster Panulirus argus (Decapoda: Paniluridae) in South Florida. Proc. Gulf Caribb. Fish. Inst. 29:166-183.
Waugh, G.T. (1981). Management of juvenile spiny lobster (Panulirus argus) based on estimated biological parameters from Grand Bahama Island, Bahamas. Proc. Gulf Caribb. Fish. Inst., 33: 271-289.
Williams, A.B. (1986). Lobsters - Identification, World Distribution, and U.S. Trade. Marine Fisheries Review 48 (2):1-36.
Witham, R., Ingle, R.M. and Joyce, E.A. (1968). Physiological and ecological studies of Panulirus argus from the St. Lucy Estuary. Fla. Board Conserv. Mar. Lab. Tech. Ser. 53:31pp.
Witham, R., Ingle, R.M. and Sims, H.W. (1964). Notes on postlarvae of Panulirus argus. Q.J. Fla. Acad. Sci. 27 : 289-97.
Yesaki, M. y Giudicelli, M. (1971). Resumen de las operaciones de la pesca exploratoria del R/V “CANOPUS” en el Mar Caribe Occidental; diciembre 1968 a julio 1970, Proyecto Regional de Desarrollo Pesquero en Centro América., Bol.Téc. (4):5.
Yeung, C. (1993). Lobster larval retention regions in the Florida keys are defined by prevailing coastal oceanography: test of hypothesis. Abstract Fourth International Workshop on Lobster Biology and Management, July 25-31, 1993, Sanriku, Iwate, Japan.
Yeung, C. and McGowan, M.F. (1991). Differences in inshore-offshore and vertical distribution of phyllosoma larvae of Panulirus, Scyllarus and Scyllarides in the Florida Keys in May and June, 1989. Bull. Mar. Sci. 49: 699-714.
Young, G.R. (1992). Studies on settlement and growth of postlarval, spiny lobster (Panulirus argus) from Bowden Harbour, Jamaica. M.Phil. thesis. UWI.
Young, G.R. (1991). A preliminary study of spiny lobster postlarval settlement in a Jamaican south coast bay. Rev. Inv. Mar. 12 (1-3): 83-88.
Zetina, M.C. y Ríos, G.V. (1997). Estimación del tamaño de la población, la tasa de explotación y mortalidad por pesca de la langosta Panulirus argus en las costas de Yucatán con diferentes modelos de evaluación. 50 Annual Meeting Gulf and Caribbean Fisheries Institute. Mérida, Yucatán. Noviembre 1997. En revisión.
Zetina, M.C. y Ríos, G.V. (en prensa). Modelos de crecimiento de la langosta espinosa (Panulirus argus) y un método para la determinación de la edad. Ciencia Pesquera 17.

322
Zetina C., Ríos, G.V. y Cervera,K. (1996). Relaciones morfométricas de la langosta (Panulirus argus) de las costas de Yucatán, México. Ciencia Pesquera (12): 41-45.
Zimmer-Faust, R.K. and Spanier, E. (1987). Gregariousness and sociality in spiny lobster: implications for den habitation. J. Exp. Mar. Biol. Eco. 105: 57-71.
Zuboy, J.R. (1980). The Delphi technique: a potential methodology for evaluating recreational fisheries. U.S. Dept. Comm, NOAA Tech. Memo NMFS-SEFC-19 25 pp.

323
PART III STOCK ASSESSMENT METHODS J. Gonzalez Cano and V. R Restrepo
PREFACE
This document presents an overview of some stock assessment methods that can be useful for assessing spiny lobster and other stocks. For each method, an overview is presented of the products that can be obtained, the main assumptions and the basic theory. In addition, fully-worked examples are provided for some methods. The document is only an introduction to these important topics and readers are encouraged to refer to the cited literature for additional details. The first section deals with standardization of fishing effort, catch rates or scientific survey data. The end point of this type of analysis is not an assessment per se, but rather the computation of an important element needed for most modern assessment methods: time series of relative abundance or of standardized fishing effort. The second section reviews a method to compute mortality from mean sizes. This method has been used for decades in fisheries and can be quite useful. However, the estimates of mortality can be biased by changes in selectivity over time and departures from equilibrium. Catch curves are discussed in the third section. This is perhaps the most widely-applied method for estimating mortality in Caribbean spiny lobsters, due to the widespread availability of packages for length-frequency analysis such as ELEFAN, FISAT and LFDA, and to the simple nature of the data that are required. Catch curves also assume equilibrium conditions, and the estimates of mortality are largely conditioned on estimates of growth. Section four describes length cohort analysis. This method is also used to estimate mortality rates and assumes equilibrium. However, unlike catch curves, length cohort analyses do not assume that all animals are equally vulnerable to fishing in the range of sizes (ages) being considered. As a result, natural by-products of length cohort analyses are estimates of selectivity at length (age). The fifth section reviews depletion models. These do not assume equilibrium and are used to estimate fishing mortality rates and stock size over time. In their simplest form, depletion models are very sensitive to an assumption made about the population being closed to immigration and emigration. However, this assumption can be relaxed in many instances, as shown in the document. Dynamic biomass production models are dealt with in section six. They can be used to estimate time series of mortality and biomass, as well as MSY-related statistics. We have emphasized the use of dynamic models rather than the more widely-applied models that assume equilibrium. This is because the latter can give rather biased estimates of MSY. Also, equilibrium production models are so easy to fit to any set of data that they can give an unjustifiable sense of confidence in the results. Dynamic models are not so easy to fit, and therefore, departures from the basic assumptions can be more easily be checked. In section seven dynamic age-structured production models are discussed. They are similar in concept to traditional production models, except that they take explicitly into account age-structured effects. As such, they are more realistic than biomass-based models. Age-structured data such as catch and catch rates by age can be used directly.

324
The final section eight describes biological reference points. These are benchmarks against which the results of a stock assessment should be measured in order to decide whether the stock is being overfished according to some criteria.

325
1 RELATIVE ABUNDANCE AND STANDARDIZED EFFORT V.R. Restrepo
Estimate: Relative abundance over time in numbers or biomass, standardized fishing effort. Inputs: CPUE or from scientific surveys (e.g. pueruli collectors). Assumptions: Closed population. References: Gavaris, S. (1980) Use of a multiplicative model to estimate catch rate and effort from
commercial data. Can. J. Fish. Aquat. Sci. 37: 2272-2275. Harper, D and Muller, R. (1998) Spiny Lobster Fisheries of the United States of America.
Spiny Lobster Workshop Activity Report. Part 2. FAO GCP/INT/575/DEN. McCullagh, P., and J.A. Nelder (1989). Generalized linear models, 2nd ed. London:
Chapman and Hall. Pennington, M. (1996) Estimating the mean and variance from highly skewed marine data.
Fish. Bull. 94: 498-505. Robson, D.S. (1966) Estimation of the relative fishing power of individual ships. ICNAF Res.
Bull. 3:5-14.
Explanation Indices of abundance play a vital role in monitoring how a stock fluctuates through time. They are often used to calibrate some production models, depletion models, and Virtual Population Analyses (VPAs), but are useful by themselves as estimates of the percentage change in population size from year to year. These indices can be subdivided into two main categories: fisheries-independent and fisheries-dependent. Fisheries-independent indices are obtained from scientifically-designed surveys. Examples are larval surveys to estimate relative spawning biomass, pueruli collector surveys to measure trends in settlement rates, and diver surveys. It is widely recognized that fisheries-independent surveys possess a particularly important advantage over fishery-dependent ones. If properly designed, a fishery-independent survey should be free of systematic biases that may alter the perceived changes in abundance through time. The same cannot be said of fishery-dependent ones, as fleets are constantly seeking ways to improve their catches. However, the advantage of reduced bias for fishery-independent surveys comes at the price of a higher cost and lower precision, as a consequence of smaller sample sizes. Catch per unit effort (CPUE) forms the basis for fishery-dependent indices of abundance. There are at least two important considerations that should be given to CPUE data when evaluating its usefulness as a measure of abundance: how effort is measured and changes in fishing power. Effort from lobster traps can be quantified in many ways: by the number of traps, the number of trap-pulls, the number of trap-pulls multiplied by the soak time etc. Similarly, effort from diving operations can be measured by the number of divers, the number of dives, the

326
number of dive-hours, etc. The definition one uses should help develop the underlying relationship: F = q E i.e. that fishing mortality is linearly related to fishing effort. The “raw” effort measurements are typically termed nominal effort and they are not necessarily related linearly to fishing mortality. An important role of the assessment scientist developing a fishery-dependent measure of relative abundance is to estimate effective effort, i.e. that which is linearly related to fishing mortality. This role may involve the estimation of fishing power. Fishing power affects the coefficient q (catchability) in the relationship above. That is, for a given amount of effort (however defined) exerted, different fishing operations can extract a different portion of the resource. This is typically due to characteristics of the vessels, to the experience and tactics of the crew or divers, and also to variables not normally included in the definition of effort such as the use of specialized positioning equipment. These concepts introduced the need for standardization, which is intended to put the different observations on an equal footing as they may relate to abundance. Fishing power standardization involves correcting for the differences in q between types of vessels, gears, and area strata, within and between years, so that standardized CPUE changes over time can confidently be taken as a measure of relative changes in abundance. The terminology used historically by fishery scientists in this respect is not very explicit. For many “standardized CPUE” means that the effort units have gone through a correction for fishing power between vessel categories, within years. Several statistical tools have been used for CPUE standardization and perhaps the most popular one is linear models (Robson, 1966; Gavaris, 1980). These are simply a multiple regression that can use categorical independent variables. For instance, ln( ) ..., , , , , , , ,CPUE C Y Q G A Ey q g a e y q g a d= + + + + + + +β β β β β ε1 2 3 4 5 where the independent variables are year, quarter, gear type, area-depth, an environmental index, and the error term is assumed to be distributed normally. The overall estimate of annual relative abundance is then taken to be the coefficient associated with the year effect (exponentiated in this example). A fairly recent modification to this class of models has been to use an error type other than the normal distribution (generalized linear models, see McCullagh and Nelder 1989) which may be more realistic, but requires more specialized software. Care should be taken in using standard statistical methods and checks in fitting these linear models. It is tempting to fit a large number of vessel statistics on the basis that they may affect fishing power when there is little evidence from the data that they do. So avoid overfitting as each additional parameter reduces the degrees of freedom of the dataset. Finally be aware that independent variables may also be correlated with stock size. It would not be unusual to find fleet engine power increasing over time as CPUE actually decreased due to depletion, for instance. Standardising CPUE under these circumstances could remove useful information from the index. Such problems typically occur where there is inadequate coverage (e.g. a set of years where data is missing) and their effect may be hidden in sequential analyses (e.g. a standardized CPUE index is first generated, then used in a depletion model), where it is not possible to look at the correlation between parameter estimates. The problems in obtaining meaningful standardized CPUE for lobster fisheries are many, but not insurmountable. Part of the problem can be categorized as logistical, in that some types of valuable information are not collected for a variety of reasons. For instance, although it seems reasonable that the number of dive-hours would be better related to effective effort

327
than the number of boats with divers, such types of data are not routinely collected in many fisheries. The other part of the problem has to do with analysis and interpretation of the data. We should be clear about what it is we are trying to achieve. What does an annual nominal CPUE estimate measure in fisheries where many things change throughout the year, such as the age-specific availability of the resource due to recruitment and migration? It is hard to tell. This statistic may well turn out to be a gross measure of overall abundance. But, more likely, it will just be a measure of fishing success. If changes in the availability of the resource to the fishing gear are thought to be substantial then it is more productive to focus on a narrower question. For example, trends in CPUE of small lobsters at the start of the fishing season, if it coincides with the annual peak in recruitment to the fishery, can be a useful measure of relative recruit abundance. Requirements for use Whether using fishery-dependent or fishery-independent data, the main assumption is that they reflect the abundance of the stock or of a part of it. For this reason, the use of extremely localized data for one area only should be avoided. On the other hand, as explained in the discussion above, the use of data aggregated over time and spatial scales which are too large may not be very useful either. For fishery-independent data such as pueruli collectors with multiple observations, the Pennington (1996) method to estimate the means could be used. Alternatively, relative abundance could be estimated from the medians of the observations. Unweighted arithmetic means should be used with caution, as large values can unduly influence the estimates. For fishery-dependent data, the method of Gavaris (1980) could be applied to standardize observations collected by different gears in different areas and at different times. For cases involving different gears in the same area and time, a DeLury-type estimator (see the Depletion Model Section) could be used to standardize between gears. Example application We have not prepared a data set for an example. However, several useful lobster examples already exist. In the USA, Harper and Muller (1998) used a linear model to obtain an annual index of relative abundance. The basic data were catch-per-trip records and the analyses proceeded to estimate the regression coefficients associated with Year as the index of abundance, while using Area and Month as covariates. Gear was not a major consideration because all vessels use similar traps. They also used linear models but their focus was not on estimating the Year coefficients but rather the coefficients associated with Vessel type and Area. In this case, instead of an annual index of relative abundance, the main products are the relative fishing power of different vessel types (i.e. their relative catchability) and the relative lobster density in different areas. The usefulness of the first product is that the relative catchabilities can be used to scale different nominal measures of effort up or down, to obtain an overall measure of effective effort for the fishery. This is particularly useful in stock assessments when the number of boats of different characteristics is changing through time. Other examples of standardization undoubtedly exist for Caribbean spiny lobster. Possible applications (a) Use simply as a measure of relative abundance to monitor changes through time.
Maybe by size (age) class if the analyses are stratified accordingly;

328
(b) Use relative abundance measures as inputs to other models such as depletion or production models;
(c) Use pueruli series as an index of recruitment to establish a stock-recruitment relationship.

329
2 MORTALITY FROM MEAN LENGTHS J. Gonzalez Cano
Estimate: Mortality (Z). Inputs: Mean length, maximum length, von Bertalanffy parameters, size at full recruitment. Assumptions: Closed population, equilibrium conditions, constant selectivity. References: Beverton, R.J.H., and S.J. Holt (1956) A review of methods for estimating mortality rates in
exploited fish populations, with special reference to sources of bias in catch sampling. Rapp. P.-V. Réun. CIEM 140: 67-83.
Ehrhardt, N.M. and J.S. Ault (1992) Analysis of two length-based mortality models applied to
bounded catch length frequencies. Trans. Amer. Fish. Soc. 121: 115-122. Gulland, J.A. and Rosenberg, A.A. (1992) A review of length-based approaches to assessing
fish stocks. FAO Fisheries Technical Paper No. 323. FAO, Rome. 100p. Notes: The method of Beverton and Holt assumes that fish live to reach L∞ while that of Ehrhardt and Ault assumes that fish can only reach a smaller length, Lmax. Explanation There are two types of methods to estimate the ratio Z/K and both require fish length frequency data. Firstly, estimators based on an assumed probability distribution of lengths (distributional methods) and secondly, those estimators based on regression methods such as those described in the catch curve section (Regression Methods). The important assumptions of the method are that mortality does not change with size (non-size selective gear, a constant natural mortality etc.), and the fishery has been in a steady state for the life-span of the fish being studied before the sample is taken. Beverton and Holt Method Beverton and Holt (1956) method derived deterministically an estimator of Z based on mean length as follows : lprom = Loo [ 1 - Z / Z + K (1 - lc / Loo ) ] Z = K (Loo - lprom) / (lprom - lc ) where lprom is mean length in the sample, and lc the mean length at first capture. Re-arranging the last equation yields an estimator of θ = Z / K : θ BH = (Loo - l) /( l - lc) It represents a particular class of methods for computing analytical estimates of mortality on the basis of length frequency data. Although it requires strong assumptions, its use is

330
justified by its simplicity and robustness under variable recruitment. However, this model assumes an infinite life span and thus the method by Ehrhardt and Ault (1991) will be used instead. Ehrhardt & Ault method Unlike the previous method, this model does not assume an infinite life span for the individuals of the stock being analyzed and thus, it can be applied to both long- and short-lived species. The model is computed as : [ Loo - Lmax / Lprom - L´ ]Z/K = [ A(L´) / A(Lmax) ] where, A(L´) = Z (L´- Lprom) + K ( Loo - Lprom ) and A(Lmax) = Z (Lmax - Lprom ) + K (Loo - Lprom) In this cases the function is solved iteratively to compute Z. The value of Lmax required for the analysis may be the largest specimen in a set of samples, or Lmax´, as estimated via the extreme value theorem. Lprom is the average length and L´ is the mean length at first capture. Example application The information used to estimate Z using the Catch Curve and Jones and van Zalinge methods was also considered here to estimating Z by Beverton and Holt and Ehrhardt and Ault methods. The results obtained considered in both cases 13.5 cm of tail length as L´ and Lmax´ = 29.5 cm TL, Lprom = 18.0 cm TL and growth parameters similar to those of the Catch Curves section. Results Estimates of Z were as follows : 1982-1988 1988-1995 Beverton & Holt 0.693 0.81 Ehrhardt & Ault 0.683 0.80 Interpretation Considering a value of M = 0.35 it is observed that in both periods F is around 0.33 - 0.35, which, compared to F reported for other lobster fisheries, is very low. Estimates differ to those obtained using catch curve analysis - estimates of Z by mean length methods were considerbly smaller. This can be explained bydifferences in the estimation procedures. Catch Curve methods estimate Z values taking into consideration only the size at which the stock is fully recruited to the fishery perhaps overestimatingZ. In contrast, the effect of smaller fish being under-represented in the sample will lead to under-estimates of Z for methods based on mean length. To test model assumptions are valid we can plot lx´- lx against lx (lx = chosen minimum size replacing lc in the models, lx´ is the mean length of fish greater than lx ), which should produce a straight line (FAO, 1992).

331
Male P. argus Northeastern Mexican Caribbean
0
50000
100000
150000
200000
250000
10.5
12.5
14.5
16.5
18.5
20.5
22.5
24.5
26.5
28.5
Tail length (cm)
Freq
uenc
yS. 82-88
Figure 1a. Length frequency distribution of male P. argus in the Northeastern Mexican Caribbean between 1982 and 1988.
Male P. argus Northeastern Mexican Caribbean
0
10000
20000
30000
40000
50000
60000
10.5
12.5
14.5
16.5
18.5
20.5
22.5
24.5
26.5
28.5
Tail length (cm)
Freq
uenc
y
S. 88-95
Figure 1b. Length frequency distribution of male P. argus in the Northeastern Mexican Caribbean between 1988 and 1995. In the case of male P. argus in the Northeastern Mexican Caribbean the frequency distributions in Figure 1a. agreeswith Galluci et al. (1996) that Z/K must lie within interval (2< Z/K<3). For the Ehrhardt and Ault Method with K = 0.24/year Z/K for period 1982-1988 Z/K=2.845 and for period 1988-1995 (Figure 1b) considering the same growth rate, Z/K=3.3. The difference is probably attributable to the catastrophic effect of the hurricane in 1988 which influenced the length structure of the stock. It should be noted that mean lengths can also vary due to fishing regulations such as minimum size limits. This should be borne in mind when interpreting changes in estimates of Z for time periods when fishing regulations or tactics may have changed. Possible applications: Estimate M or F from Z = F + M given estimates of F or M. Use Z values to examine the situation of the stock with respect to yield per recruit analyses.

332
3 CATCH CURVES J. Gonzalez Cano
Estimate: Mortality (Z). Inputs: Abundance (relative) in numbers by size class, growth rates, age (size) at full recruitment. Assumptions: Closed population, equilibrium conditions. References: Jones, R. and N. P. van Zalinge (1981) Estimations of mortality rate and population size for
shrimp in Kuwait waters. Kuwait Bull. Mar. Sci. 2: 273-288. Pauly, D. (1984) Fish population dynamics in tropical waters: a manual for use with
programmable calculators. ICLARM Stud. Rev. (8): 325 p. Wetherall, J.A., and J.J. Polovina and S. Ralston (1987) Estimating growth and mortality in
steady state fish stocks from length frequency data, pp. 53-74 In: D. Pauly and G.R. Morgan (eds.) Length Based Methods in Fisheries Research. ICLARM Conference Proceedings 13, Manila, Philippines.
Notes: The methods assume steady state. Since this is typically not the case, analyses are sometimes carried out pooling length frequency samples from several years with the hope of approximating average conditions. Most methods, like that of Pauly, require knowledge about the (von Bertalanffy) growth parameters, while others like that of Wetherall et al. (1987) estimate the growth parameters together with Z. Explanation It has been observed that, as fish get older, more of them will die either by natural causes or by fishing. In a fishery, this means that there are usually more smaller (and therefore younger) fish in commercial catches than there are large or old individuals. Assuming that fish could be aged, it is possible to plot the number of individuals caught at each age in a given year. Typically, it would be observed that few young fish will be caught, that catches peak for a certain age, and then the catch of older fish will drop. The above observation is due to different processes: (1) younger fish are less vulnerable to the fishing gear, but as they age, they become more vulnerable, until they are said to be fully recruited at certain age (assuming constant selectivity). (2) catches of older (fully recruited) ages decline simply because there are fewer of them due to fishing and natural mortality; however, older fish may also become less vulnerable to the fishing gear for various reasons. In most situations, data are generated from sampling the catch and these data could be incorporated into a catch curve” analysis to estimate Z. Early work on catch curve analysis assumed the ability to estimate the ages of the sampled fish. More recently, given the difficulties in aging, equations for catch curve abundance as a function of length have been developed (length-converted catch curves). However, the slope representing total mortality (Z) is not a constant but is a function of the growth and mortality parameters and the changing value of fish length. Total mortality (Z = M + F) in the catch curve analysis in terms of size is computed as

333
N(l) = Nc [ (Loo - l / Loo - lc )]Z/K
by transforming to natural logarithm both sides yields: loge N (l) = a + ( Z / K ) loge ( Loo - l ) which is a straight line with a positive slope Z / K and intercept a, when log N (l) is plotted versus log ( Loo - l ) with an intercept a. Jones and van Zalinge plot The cumulative plot of Jones and van Zalinge is an early form of length-converted catch curve and thus both these two methods share many common assumptions. The analysis in these cases is computed as: loge(CLi, oo) = a + b loge (Loo - Li ) where, CLi,oo is the cumulative catch (computed from the highest length class with non-zero catch) corresponding to length class i, and Li is the lower limit of length class i. The slope b is an estimate of Z/K. Outputs of this method are Z or Z/K if 1 is entered instead of K. Estimation Procedures Estimates of Z through length-converted catch curves can be estimated using the FAO-ICLARM Stock Assessment Tool (FiSAT) which incorporates the two methods above. The first method provides two options: (1) length-converted catch curve for cases where growth does not exhibit annual oscillations and (2) for cases where it exhibits annual oscillations. The second method is the Jones/van Zalinge plot method. In both methods Loo and K must be known or obtained by growth methodologies. Outputs of the first method (with no annual oscillation growth) are: Z, F, M, E, L´ and probabilities of capture, where E = F/Z and L´ is the smallest length class fully selected or recruited. For those cases where annual growth oscillates only Z is estimated. Requirements for use It is considered that the catch of fully-selected age groups (Ct) is related to abundance. Example application For this example we used the FiSAT (Gayanilo et al., 1996) package to calculate Z for the methods mentioned above. Data is from the estimated total number of male lobsters in two periods. Since the methods assume steady state, length frequency samples of male P. argus in the northeast Mexican Caribbean were pooled for the periods 1982-1988 and 1988-1995 (Table 1). This was done to separate the different conditions before and after Hurricane Gilbert in September of 1988.

334
Table 1. Pooled length frecuency samples of male P. argus during two catching periods
Size Season Tail length
(cm) 1982-1988 1988-1995
10.5 1376 25211.5 9191 226312.5 69052 1864013.5 164083 4217014.5 187464 5411815.5 173772 5009216.5 181321 5007117.5 199557 5679418.5 230546 5683619.5 197854 3878220.5 171465 3333521.5 146675 3164322.5 102364 2301323.5 70775 1788524.5 35733 845625.5 21707 301326.5 13603 248627.5 5212 74728.5 1572 12929.5 243 16
In both cases the following parameters were considered: L∞ = 31.0 cm, K = 0.24 and t0 = -0.86 Results For the period 1982-1988 Catch Curve Method ZCC estimate was: 1.08 (0.96 < Z < 1.08), and for the period 1988-1995 it increased to 1.11 (0.97 < Z < 1.25). Jones and van Zalinge’s method gave very similar results. For first period ZJZ = 0.98 and for the second period ZJZ = 1.08, both within the intervals provided by ZCC and considering that K = 0.24 in both cases. Considering a value of M = 0.35 it is observed that in both periods F is around 0.73 - 0.76, which, compared to F reported for other lobster fisheries, is not very high.
Catch Curve
0
2
4
6
8
10
12
14
16
0 2 4 6 8 10 12
Absolute age (years)
Ln (N
/dt)

335
Possible applications: Estimate M or F from Z = F + M given estimates of F or M. Estimate selectivity at length for the size groups that are not assumed to be fully vulnerable to fishing (see FiSAT). Use Z values to examine the situation of the stock with respect to yield per recruit analyses.

336
4 LENGTH-BASED COHORT ANALYSIS J. Gonzalez Cano
Estimate: Fishing mortality (F) and population size by length interval. Inputs: Catch by size interval, L8, M/K, F/Z for the largest size interval. Assumptions: Equilibrium conditions, closed population. References:
Fry, F. E. J. (1957). Assessment of mortalities by the use of the virtual population . Paper
presented to the ICNAF/ICES/FAO Special Meeting, Lisbon, May 1957, Paper P15 (mimeo).
Gayanilo, F.C. Jr., Sparre, P. and Pauly, D. (1995) The FAO-ICLARM Stock Assessment
Tools (FiSAT) User’s Guide. FAO Computerized Information Series (Fisheries) No. 8 FAO, Rome. 126p..
Gulland, J.A. (1983). A manual of basic methods. Chichester, John Wiley, FAO/Wiley
Ser.Food Agric., 1:223 p. Jones, R. (1984). The use of length composition data in fish stock assesment (with notes on
VPA and Cohort analysis). FAO Fish Tech.Pap. (256) : 118p. Pope, J.G. (1972). An investigation of the accurancy of virtual Population analysis using
cohort analysis. ICNAF Res.Bull., (9) :65-74.
Explanation Length Cohort Analysis (LCA) is the equivalent of age-based Virtual Population Analysis (VPA) and Cohort Analysis (CA). In general, VPA is a powerful procedure for determining how many individuals there must have been in the sea to account for a known catch and natural losses. It also allows one to estimate the instantaneous fishing mortality (Ft) for each age interval and the average number of individuals in the sea. The term “virtual population” was introduced by Fry (1957) to describe the sum of fish belonging to a given year class that must have been present in past years by projecting backwards through a time series of catch-at-age to recruitment.. Cohort Analysis (Pope 1972) is a good aproximation to VPA and much easier to perform. The difference between these two methods is the way the individual numbers decline. For VPA the decline in number with age follows an exponential curve, while in CA, the exponential curve within any age group is replaced by a “step function”. It also assumes the following: (a) the whole of the catch for an age group is taken at exactly the middle of the age interval and (b) only natural losses occur continuously on an exponential basis. Thus, Pope´s cohort formula can then be derived quite simply by proceeding backwards in time from the oldest to the youngest ages. In the case of VPA: The numbers of fish in a cohort are assumed to decline exponentially over time according to: Nt+1 = Nt e -(Ft + M) (1)

337
where Nt, Nt+1 = numbers of individuals (fish, lobsters) at the beginning of times t and t+1. Ft = instantaneous fishing mortality rate for time t. M = instantaneous natural mortality rate (assumed constant). e -(Ft + M) = proportion removed by total mortality. The catch for time t is the product of the numbers at the beginning of time t, the ratio of fishing to total mortality and the proportion remaining at the end of the year: Ct = Nt * (Ft / (Ft + M)) [1- e - (Ft + M) ] (2) If there are n age classes, there will be n equations of the type of equation (2). By substituting (1) into (2) by rearranging eq. (1) in the following manner: Nt = Nt+1 / e - (Ft + M) (3) results in: Nt+1 / Ct = (Ft + M) e - (Ft + M) / ( Ft [1- e - (Ft + M) ]) (4) In order to reduce the number of variables that must be estimated, assumptions are usually made about M and either initial F (F for the youngest age class in the catch) or terminal F (F for the oldest age class) allowing a solution to be found for Nt and Ft. If t+1 refers to the oldest age class, eq. (4) can be solved for Nt+1 by using a value for Ft (F terminal). Then eq. (1) can be used to estimate Nt. With Nt known, the catch equation can be solved iteratively for Ft and so on. This process can proceed backward in time in this manner until all values for Nt and Ft are estimated. Although it is possible to start with the youngest age class and by using initial F, proceed forward, both Pope (1972) and Gulland (1983) considered that the backwards procedure is superior. In the case of the Cohort Analysis: Pope´s formula considered : Nt+1 eM = Nt e -Ft (5) which is equivalent to: Nt+1 eM = Nt - Nt (1 - e -Ft) (6) From eq. (2) it can be seen that, Nt = [Ct (Ft + M) ] / [ Ft (1 - e - (Ft + M) ) ] (7) Replacing the second Nt in eq. (6) by eq. (7) we get: Nt+1 eM = Nt - Ct [ (Ft + M) (1 - e - Ft ) / Ft (1 - e - (Ft + M) ) ] (8) For M < 0.3 and Ft < 1.2, the term to the right of Ct can be approximated by e M/2 with an error of less than 4%: Nt = Nt+1 eM + Ct eM/2 (9) As in classical VPA, assumptions concerning M and terminal F must be made and the sets of equations are solved for Nt and Ft progressively backwards in time.

338
Length-based Cohort Analysis Jones (1974, 1984) modified Pope´s cohort analysis to make use of catch-at-length data rather than catch-at-age and named it appropriately: Length-based cohort analysis (LCA). An important assumption for this technique is that differences in length are largely determined by age (Jones, 1974). In other words, variability in the time required to grow from one size to another is relatively less than the variability of length-at-age. In an analogous manner to age-based VPA and cohort analysis, LCA is used to provide information in numbers of fish and mortality rates by size. LCA, unlike age-based Cohort Analysis and VPA, requires a length composition representative of the catch under steady-state conditions (a stable length-structure). Also, considering that for both CA and VPA, computational steps do not necessarily have to apply to exactly one year, or indeed to remain the same from one step to the next, for greater generality, the basic cohort equation (9) may be replaced by: Nt = (Nt+1e M∆t/2 + Ct ) e M∆t/2 (10) where ∆t refers to the time required to grow from the beginning to the end of a length interval. An expression for e M∆t/2 can be derived from the von Bertalanffy growth model, so equation (10) can be expressed in terms of length intervals: Xt = e M∆t/2 = [(Loo - Lt)/( Loo - Lt+1)]M/2K (11) where Lt is the lower length boundary for the length interval t. Then Xt can be substituted in equation (10) to obtain: Nt = (Nt+1 Xt + Ct ) Xt (12) In this form, the equation can be adapted for application to length composition data, providing there is some way of estimating the time required to grow from the beginning of a length interval to the end. Requirements for use 1. Known value of Natural Mortality (M) for the entire range of lengths. 2. Length-structure should be stable. Example Applications For this example, we used the FiSAT (Gayanilo et al., 1995) package and an EXCEL table built according to Jones (1984) to calculate the number of male lobsters attaining each interval length, average number of lobsters at sea and FL for each interval of length. Data is from the estimated total number of male lobsters caught during 1986-1987 fishing season in the northeast of Quintana Roo, Mexico. From the monitoring program Table 1. shows the estimated total number of male lobsters caught during 1986-87 season. Using the same parameters, results obtained from FISAT are shown in Table 2.

339
Table 1. Number of male lobsters caught on the Northeast coast of Quintana Roo during 1986/87
Size (tail length) Numbers
10 29511 200712 1362813 2994614 2923715 2637816 2662817 2848518 2778619 2264720 1974821 2006722 1435423 871924 555525 254526 147327 38328 186
Table 2. Results of Length-structured-VPA in FiSAT for male P. argus in
the Northeast Mexican Caribbean Tail length Numbers Number Average Number
(cm) caught FiSAT FiSAT 10.5 295.44 413407.47 74332.4811.5 2006.89 398245.5 74954.9212.5 13628.03 381247.59 74272.4913.5 29946.03 352765.03 7058314.5 29236.52 308702.38 64966.5715.5 26378.04 266476.5 59359.0516.5 26628.63 228222.6 53607.3117.5 28485.32 190872.5 47059.8118.5 27785.87 152975.2 39757.6419.5 22646.94 117237.8 32694.8920.5 19748.34 88051.8 26149.321.5 20067.36 63064.6 19305.422.5 14354.61 39136.2 12785.2723.5 8719.48 22224.5 7960.3724.5 5554.87 11912.9 4547.9825.5 2544.69 5448.5 2399.1726.5 1472.81 2423.9 1090.9927.5 383.35 732.9 441.7428.5 186.45 261 372.9

340
Table 3. Results of the EXCEL table according to Jones (1984) For Male Panulirus argus in the Northeast Mexican Caribbean during season 1986-1987
Column 1 2 3 4 5 6 7 8 9
10
Numbers Numbers Average Nos
Length Caught attaining St = e -Z∆t Z∆t F/Z F∆t Z F in the sea
Group XL ( CL ) each length
10 11 1.019 295.44 421063.38 0.962 0.038 0.02 0.0007 0.2038 0.0038 77522.60
11 12 1.020 2006.89 405263.42 0.956 0.045 0.11 0.0051 0.2257 0.0257 78198.37 12 13 1.021 13628.03 387616.85 0.925 0.078 0.47 0.0366 0.3757 0.1757 77549.71
13 14 1.022 29946.03 358478.88 0.875 0.133 0.67 0.0892 0.6055 0.4055 73844.87 14 15 1.024 29236.52 313763.88 0.863 0.147 0.68 0.1002 0.6292 0.4292 68112.01
15 16 1.025 26378.04 270904.96 0.857 0.155 0.68 0.1051 0.6229 0.4229 62369.94 16 17 1.027 26628.63 232052.93 0.837 0.178 0.70 0.1253 0.6714 0.4714 56484.87
17 18 1.029 28485.32 194127.33 0.802 0.221 0.74 0.1635 0.7722 0.5722 49782.36 18 19 1.031 27785.87 155685.54 0.767 0.265 0.77 0.2032 0.8573 0.6573 42271.25 19 20 1.034 22646.94 119445.41 0.752 0.285 0.76 0.2179 0.8482 0.6482 34938.31 20 21 1.037 19748.34 89810.81 0.717 0.332 0.78 0.2584 0.9005 0.7005 28190.62 21 22 1.041 20067.36 64424.35 0.623 0.473 0.83 0.3910 1.1514 0.9514 21092.24
22 23 1.046 14354.61 40138.54 0.572 0.559 0.83 0.4669 1.2105 1.0105 14204.97 23 24 1.053 8719.48 22942.94 0.541 0.614 0.83 0.5085 1.1672 0.9672 9015.57
24 25 1.061 5554.87 12420.35 0.467 0.762 0.84 0.6391 1.2392 1.0392 5345.19 25 26 1.073 2544.69 5796.44 0.460 0.777 0.81 0.6314 1.0682 0.8682 2930.87 26 27 1.090 1472.81 2665.58 0.335 1.093 0.83 0.9085 1.1842 0.9842 1496.49 27 28 1.117 383.35 893.47 0.417 0.874 0.74 0.6435 0.7588 0.5588 686.08
28 29 1.169 186.45 372.90 0.5
For the estimation of the population in Excel (Table 3) the following formulas and data were used: Column 1 ( Xt ) : Xt = [(Loo - Lt) / (Loo - Lt+1)] M/2K
where Lt lower boundary of the tail length class t as in Table 1. Column 2 (Numbers caught Ct): These numbers referred only to MALE lobsters caught on the fishing grounds of the Isla Mujeres Island during the 1986-1987 fishing season. The catch number had to be estimated from total catch weight and the average size which was based on samples at landing sites and packing plants which recorded sex, abdominal length and sexual phase (if female). Column 3 (Numbers attaining each length Nt) : For last length interval (30+) : As an initial input parameter we need to know or assume F/Z for this length group. Here 0.5 is used. Thus (186.45/0.5 = 372.90 lobsters). Further computations proceed using the following equations: Nt = (Nt+1 Xt + C1,2 ) Xt Column 4 (St ) : Survival of each length interval t St = Nt+1 / Nt
Column 5 (Z ∆t ) : For each length interval t Zt∆t = - Loge(St)

341
Column 6 (F/Z): For each length interval t Ft/Zt = [ Ct / (Nt-Nt+1) Column 7 (F ∆t): For each length interval t Ft∆t = (F/Z) (Z ∆t) Column 8 (Zt): For each length interval t Zt = M / (1 - Ft/Zt ) Column 9 (Ft ): For each length interval t Ft = Zt - M Column 10 (Avg. no. in the sea): For each length interval, Avg. no. = ( Nt - Nt+1 ) / Zt
Male Lobsters of P. argus
050000
100000150000200000250000300000350000400000450000
11.5
13.5
15.5
17.5
19.5
21.5
23.5
25.5
27.5
29.5
Abdominal length size
Nos
. of L
obst
ers
Nos. att. each Length.
Numbers Caught
Average Nos in the sea
Results of the number reaching each length, the average number and the individuals caught using FISAT and Excel are plotted in the following graph. It can be observed that although differences exist these are not significant.
0
50000
100000
150000
200000
250000
300000
350000
400000
450000
10.5
12.5
14.5
16.5
18.5
20.5
22.5
24.5
26.5
28.5
Tail length (cm)
#'s
mal
e lo
bste
rs
# 's caughtNum. FISATAvg. Num. FISATNum. ExcelAvg. num Excel

342
The average number is not the population size, but includes both the size and the time a cohort will remain in a length class. The narrower the length class, the fewer fish will be found in it over time, hence the values may be quite small. It is useful for yield-per-recruit calculations (see Section 8). Assuming steady state, fixed, continuous recruitment the sum of average numbers is the standing stock (in this case the numbers attaining the first length class [421063.38 year-1] would be interpreted as a recruitment rate)1. Possible applications: To develop selectivity curves using the F values. Construction of indirect indices to measure the strength of different cohorts. The indices could be used for forecasting yields. The average standing stock under equilibrium conditions. Application 1. Selectivity at length Selectivity is simply computed by dividing each F by the maximum value in the vector. From Table 3, the selectivity pattern in the figure below is obtained. Selectivities can then be used in other analyses (e.g. yield-per-recruit) as in the second application below.
0
0 .2 5
0 .5
0 .7 5
1
5 1 0 1 5 2 0 2 5 3 0
T a il le n g t h ( c m )
Sele
ctiv
ity
1 Notes from the editor:
1) It should be noticed that this example assumes that individuals caught are from one substock. This is distributed along the coast of the whole state and the north and northeast coasts of Quintana Roo. Thus, the total numbers of male lobsters would be much higher than those being obtained
2) It may also be noticed that, for example, the number of individuals (194127 male lobsters) attaining a length of 17 cm of tail length in Table 3, implies that some individuals may attain 17 cm at the beginning of the year whereas other individuals may not do so until the end of the year. The number 194,127 is that between 17 to 18 cm of tail length irrespective of the time of year during which this occurs.

343
Table 4. New long-term landings (in tail - weight) compared to initial or previous conditions in the Northeast Mexican Caribbean. Comparison is presented as percentage of previous conditions.
weights New
Length landed Fdt S1 S2 F2 dt Sum F1dt SumF2dt
Exp (7-8) CF Landings
Group Kg. Kg.
10 11 17.73 0.0007 0.00 0.00 0.0000 0.0004 0.0000 1.000357644 0 011 12 138.07 0.0051 0.15 0.00 0.0000 0.0032 0.0000 1.003251992 0 012 13 1,176.10 0.0366 0.30 0.00 0.0000 0.0241 0.0000 1.024344977 0 013 14 3,698.33 0.0892 0.50 0.00 0.0000 0.0869 0.0000 1.090832066 0 014 15 4,502.42 0.1002 1.00 1.00 0.1002 0.1816 0.0501 1.140598455 1.140598455 5135.45824915 16 5,573.68 0.1051 1.00 1.00 0.1051 0.2843 0.1527 1.140598455 1.140598455 6357.33122416 17 6,606.56 0.1253 1.00 1.00 0.1253 0.3995 0.2679 1.140598455 1.140598455 7535.43486617 18 8,212.32 0.1635 1.00 1.00 0.1635 0.5439 0.4123 1.140598455 1.140598455 9366.95658818 19 10,011.25 0.2032 1.00 1.00 0.2032 0.7272 0.5957 1.140598455 1.140598455 11418.8159519 20 9,224.10 0.2179 1.00 1.00 0.2179 0.9378 0.8062 1.140598455 1.140598455 10520.9921920 21 9,094.11 0.2584 1.00 1.00 0.2584 1.1760 1.0444 1.140598455 1.140598455 10372.7295621 22 10,736.04 0.3910 1.00 1.00 0.3910 1.5007 1.3691 1.140598455 1.140598455 12245.5095222 23 8,410.36 0.4669 1.00 1.00 0.4669 1.9296 1.7980 1.140598455 1.140598455 9592.84768123 24 5,864.72 0.5085 1.00 1.00 0.5085 2.4173 2.2858 1.140598455 1.140598455 6689.29053424 25 3,711.21 0.6391 1.00 1.00 0.6391 2.9911 2.8596 1.140598455 1.140598455 4232.99901625 26 2,017.94 0.6314 1.00 1.00 0.6314 3.6264 3.4948 1.140598455 1.140598455 2301.65810626 27 1,318.60 0.9085 1.00 1.00 0.9103 4.3963 4.2657 1.139542743 1.14186587 1505.66999427 28 383.35 0.6435 1.00 1.00 0.6439 5.1722 5.0428 1.13824402 1.139002293 436.636311928 29 205.10 0.6435 1.00 1.00 0.6435 5.8157 5.6864 1.138000084 1.138000084 233.400557129 + 0.00 0.6435 1.00 1.00 0.6435 6.4592 6.3299 1.138000084 1.138000084 0
90,902.00 97945.73
Net increment due to compliance and enforcement of legal size at 14.5 cm of tail = 7.74871 %

344
Application 2. Assessing the effect of changing the fishing effort or minimum legal size. It is possible to assess the effect of a particular change in the exploitation pattern as follows: The method assums that there is a relationship between the steady state numbers-at-length in the catch and steady state numbers-at-length in the sea for a given fishing effort. Given this assumption, the first step is to choose the initial number of recruits (R) at the starting length class (cell column 3 length class 10), L1, using Nt from Table 3. Then, we work forward in time, taking into account the new set of conditions (different fishing mortalities and legal sizes - for sizes below the minimum F=0).This will lead to a new steady state length composition of the catch. Considering the numbers in Table 3, changes in minimum legal size (for example a knife-edge from 14.5 cm of tail) but otherwise similar fishing mortalities would result, as shown in Table 4, in an increase of 7.75% landed weight in the long term. Note: For more information on the calculations consult Jones (1984).

345
5 DYNAMIC DEPLETION MODELS V.R. Restrepo
Estimate: Population size (local abundance), F, q. Inputs: Catch in numbers, effort (CPUE) or other index of abundance. Assumptions: CPUE proportional to population size; closed population or recruitment and
immigration/emigration explicitly modelled. NO equilibrium or steady state is assumed.
References and further reading:: Basson, M., J.R. Beddington, J.A. Crombie, S.J. Holden, L.V. Purchase, and G.A. Tingley (1996).
Assessment and management techniques for migratory annual squid stocks: the Illex argentinus fishery in the Southwest Atlantic as an example. Fish. Res. 28: 3-27.
Chien, Y., and R.E. Condrey (1985). A modification of the DeLury method for use when natural
mortality is not negligible. Fish. Res. 3: 23-28. Collie, J.S., and M.P. Sissenwine (1983) Estimating population size from relative abundance data
measured with error. Can. J. Fish. Aquat. Sci. 40: 1871-1879. Conser, R. (1991) A DeLury model for scallops incorporating length-based selectivity of the
recruiting year-class to the survey gear and partial recruitment to the commercial fishery. Doc. SAW/12/SARC/9, 12th NEFC Stock Assessment Workshop, NMFS, Woods Hole, MA, USA.
Delury, D.B. (1947) On the estimation of biological populations. Biometrics 3: 145-167. Leslie, P.H., and D.H.S. Davis (1939). An attempt to determine the absolute number of rats on a
given area. J. Anim. Ecol. 8: 94-113. Medley, P.A.H. and Ninnes, C.H. (1997). A recruitment index and population model for spiny
lobster (Panulirus argus) using catch and effort data. Can. J. Fish. Aquat. Sci. 54:1414-1421.
MRAG (1995) Catch effort data analysis: The CEDA package, v. 2.01. User Manual. London:
MRAG Ltd. Pope, J.G. (1972). An investigation of the accuracy of virtual population analysis using cohort
analysis. ICNAF Res. Bull. 9: 65-74. Rosenberg, A.A., G.P. Kirkwood, J.A. Crombie, and J.R. Beddington (1990). The assessment of
stocks of annual squid species. Fish. Res. 8: 335-350. Sanders, M.J. (1988). Mean population number and the DeLury and Leslie methods. Fish. Res.
6:153-165.

346
Explanation (1) Simple depletion (no recruitment or constant recruitment) The classical Leslie-Delury type of analyses assume that fish die only from capture. If this is the case then the population size at any time (t) depends only on the initial population size at the start of the season and the cumulative catch (K) since the beginning of the season: Nt = No - Kt . If we assume that catch per unit of effort is proportional to abundance, CPUEt = Ct/Et = q Nt then we have CPUEt = q No - q Kt . This model simply shows that, in a closed population, we can estimate the initial population size by monitoring how its relative abundance decreases as we take catches from it. Thus, No is estimated by regressing CPUE against cumulative catch. A by-product of this regression is also an estimate of q, the constant of proportionality between CPUE and abundance, or “catchability coefficient”. Chien and Condrey (1985), among others, modified the simple model to allow for natural mortality, in cases where fishing effort (or the depletion rate) remains constant between successive sampling periods. Sanders (1988) provided further modifications to allow for varying effort. Rosenberg et al. (1990) presented an even more versatile model, and this is the method we have adopted for use here. A brief explanation is given below and the reader should consult Rosenberg et al. (1990) or Basson et al. (1996) for details. The method of Rosenberg et al. (1990) uses Pope’s (1972) approximation to the “catch equation”, which is to assume that all the catch (C) taken during a time period is taken exactly in the middle of the period:
N N e C et tM
tM
+− −= −1
2 2( )/ / (1)
where M is the natural mortality rate (assumed here to be constant between time periods). Under this assumption, the catch by a given fleet (j) that is produced by a given effort (E) in time period t is: cjt = qj Ejt Nt e -M/2 (2). The statistical basis for the estimation of the parameters is the method of Maximum Likelihood. The estimation is based on a population depletion model (equation 1), an observation model (equation 2, i.e. how fleet-specific observations are generated), and an assumption about the nature of the variability in the observations. The latter is to say whether the fleet-specific catch estimates have a constant variance, or a variance proportional to the estimates themselves etc. This powerful method, separating the population dynamics model, which is deterministic, from the observation model, which is stochastic (includes observation error) makes it easier to adapt the models to particular circumstances (e.g. see also production models in Section 6). The model advocated in Rosenberg et al. (1990) assumes that the fleet-specific catch estimates are normally-distributed and that the fleet-specific fishing efforts are known without error. The CEDA (MRAG, 1995) implementation of a very similar model has made it somewhat more flexible by allowing for normal errors, lognormal errors or errors proportional to the expected value, with either catch or CPUE.

347
The CEDA package also allows for a modification of the simple model to allow for constant recruitment taking place in each time period. In this case, the population equation is N N e C et t
Mt
M+
− −= + −12 2( )/ /θ
where θ is the constant number of recruits added each time period, which may also have to be estimated as a parameter in the fit. To avoid the additional parameter, it can be assumed, as in CEDA, that the population is at equilibrium prior to fishing, i.e. Π = N0(1-e-M) eM/2 . This variant is useful for many tropical species in which recruitment takes place throughout the year or throughout the time period being examined. It is a way to relax the assumption of no immigration taking place. Note that this assumption, and the assumption of no emigration, could also be relaxed by altering the value of the natural mortality rate (lower for immigration, higher for emigration). However, such fiddling with the parameter values will usually be difficult to support unless based on solid evidence. (2) Depletion with non-constant recruitment In many cases, recruitment (immigration) takes place in pulses of varying magnitudes, e.g. when the data are analyzed on an annual basis. The basic depletion model can be modified as in the previous equation, but now letting the recruitment change with time: N N e R C et t
Mt t
M+
− −= + −12 2( )/ / .
In general, one could not estimate all the parameters in such a model (No, Rt for every t, and q) with only catch and one series CPUE data. What is needed is two series of relative abundance: One that tracks the trends in recruitment, R, and another that tracks trends in the overall population (N + R). There are several ways to implement such a model for estimation purposes. The approach of Collie and Sissenwine (1983), modified by Conser (1991), assumes that there are three sources of error: Observation error in the index of recruitment, observation error in the index of total (N+R) stock size, and process error in the population equation (the last equation, above). This approach requires the estimation of many parameters. A much simpler, but perhaps less flexible, approach is that of MRAG (1995). This method assumes that there is only error in the indices of abundance; the population equation is assumed to be deterministic. In this case, the recruitment index is scaled to absolute population magnitude by the parameter λ (much like a catchability coefficient): N N e R C et t
Mt t
M+
− −= + −12 2( )/ /λ
The parameters that are estimated are: The initial stock size (No), a constant of proportionality (λ) between the recruitment index and absolute recruitment, and the catchability coefficient (q) associated with the index of fishable stock abundance. The latter index is usually from CPUE for a given fleet, whose catch is not necessarily the total catch in the fishery. As in the simple depletion methods, this catch is described as
c qE N qE N R eC
t t t t t tM t= = + −
+
−1 2
2
2//( ) .
Medley and Ninnes (1997) provide an example of how depletion models might be used to describe spiny lobster population dynamics. Their population model was fitted using Turks and Caicos Islands yearly catch and effort data and a recruitment index. The recruitment index was also generated from a depletion model using daily catch and effort data from beginning of the season

348
when only new recruits were caught. This model combination allowed them to explain large and unusual fluctuations in the catches which other methods, such as production models (see Section 6), could not. Requirements for use Perhaps the most critical assumption in simple depletion estimators is that of a closed population. That means that no substantial immigration or emigration should occur during the time periods being analyzed. As we have seen, however, this assumption of a closed population can be altered by allowing for constant recruitment, or by including an index of recruit abundance. Which model is appropriate depends largely on the available data: Are there data for within- or between seasons? Is an index of recruitment available? Naturally, knowledge of the stock in question will play an important role in choosing an appropriate model. A sensible approach is to examine trends in CPUE. For the simple depletion model (no recruitment), CPUE should decline more or less continuously during the time period to be analyzed. Another critical assumption is that CPUE be linearly related to abundance (or some other known functional relationship with abundance). Actually, we should refer to relative abundance more generally, CPUE being one measure of relative abundance (if effort is linearly related to fishing mortality). In the discussion above, we mentioned fleet-specific CPUE series. In reality one does not need the CPUE for an entire fleet to apply this method. In fact, it would be preferable to restrict analyses to one or several sets of boats of similar operational characteristics and to monitor their catches and efforts through time. One could also use relative abundance information from fishery-independent surveys instead of, or in addition to, CPUE. In short, the model requires: • a complete series of total catch,
• one or more series of catch and effort or relative abundance (which may have missing values),
• an estimate of M by time period Example Applications (1) Single season (no recruitment) For this example, we used the package CEDA (MRAG, 1995) and data from the 1986-1987 fishing season in the northeast of Quintana Roo, Mexico (source: J. Gonzales). The available data (see figures below) consisted of total landings in weight for the region, mean weight of individuals landed, and detailed landings and effort data from one local fisheries cooperative that records data for traps, scuba and hookah. Some of these data (catch and CPUE in numbers) are summarized in Figure 1, on a weekly basis. It can be observed from the CPUE figures that the three gears suggest a population decline to week 35. Thereafter, CPUE tends to increase for all gears, most likely as a result of seasonal lobster immigration. Therefore, we restricted analyses to the data from weeks 27 to 35 so as to conform to the main assumptions in the simple depletion model. As inputs to CEDA we used total landings, mean weight, and the landings and effort for the scuba data. We restricted CPUE analyses to this gear because it is thought to have the most representative measure of effective effort of the three. The trap effort data did not contain any information on number of trap pulls or soak time.

349
Total
0
5000
10000
15000
20000
25000
25 30 35 40 45 50 55 60
Week
Cat
ch
Scuba
0
10
20
30
40
50
25 30 35 40 45 50 55 60
Week
CPU
E
Trap
01020304050607080
25 30 35 40 45 50 55 60
Week
CPU
E
Hookah
0
50
100
150
200
250
25 30 35 40 45 50 55 60
Week
CPU
E
Figure 1

350
The input data used were:
Total SCUBA SCUBA MeanWeek Catch
(wt) Catch (wt)
Effort Weight
27 5633 848 64 0.361828 6859 1000 109 0.361829 3581 381 59 0.343230 3466 316 39 0.343231 2538 379 49 0.343232 2878 339 66 0.343233 1907 261 46 0.370134 1749 195 38 0.370135 1863 218 50 0.3701
Setting M = 0.01 per week and assuming lognormal errors, we obtain No = 140,800 individuals and q[scuba] = 2.44E-4. Ninety percent confidence intervals for these quantities are [123,400 - 163,000] and [1.86E-4 - 3.13E-4]. The fit to the data is reasonably good as suggested by the following figures (Fig.2) for the SCUBA data:
0500
100015002000250030003500
26 28 30 32 34 36Week
Cat
ch
05
10152025303540
26 28 30 32 34 36Week
CPU
E
Figure 2
These results by themselves are not extremely useful in terms of stock assessment. They tell us that in this area, in the middle of 1986, the local lobster population was about 140,000 individuals and that exploitation rates were high (in the order of F = 0.1 per week as computed by F = C/N). A more complete and useful exercise would be to carry out similar analyses for as many years as are available (as in the following example). One could then examine trends in abundance and F over time.

351
(2) Multiple seasons with recruitment For this example, we used data from the Florida (USA, - preliminary data; source: D. Harper) fishery between the 1985/6 and 1994/5 fishing seasons (August-March). The available data were monthly landings (total catch; does not include recreational take) as well as “directed” CPUE, measured by the catch by trips reporting more than 75% lobsters, and the number of such trips each month. Also available were mean weights of lobsters. An example of data, for the 1985/6 season, is
Date Total Directed Directed Mean CPUE
Catch (kg)
Effort Catch (kg)
Weight
Aug-85 600645 6332 593786 0.548 171
Sep-85 500097 5274 494688 0.522 180
Oct-85 326581 4150 305935 0.533 138
Nov-85 274176 3367 263032 0.523 149
Dec-85 225531 2643 212858 0.548 147
Jan-86 173051 2319 163245 0.528 133
Feb-86 106665 1849 86856 0.601 78
Mar-86 74408 1564 60813 0.564 69 The data from most seasons looks similar in that CPUE tends to decline more or less continuously (refer to the figures below). One could analyze these data as in the previous example, using CEDA to estimate an initial stock size and a q for each season. The disadvantage in doing so is that both No and q are negatively correlated partly because they are estimated simultaneously: Thus, when one is overestimated, the other is underestimated. As a result, one will usually end up estimating q values that vary wildly between years, when in reality there may be no reason to expect these fluctuations. An alternative, then, is to estimate one No for each season and a single q assumed constant for all seasons. Unfortunately, CEDA is not set up to handle multiple successive series in this fashion. For this example, we programmed the analysis in an Excel spreadsheet (made available at the workshop).
The spreadsheet was set up to estimate an initial stock size (as of August 1985), a recruitment value for each August between 1986 and 1994, and one value of q. The population equations were similar to those in CEDA: The stock size at time t+1 is given by N N R e C et t t
Mt
M+
− −= + −12( ) /
where Rt = zero for all months except August, when it is estimated. Similarly, the stock size in the middle of each month is given by N N R e Ct t t
Mt+
−= + −1 22 2//( ) / .
The sample catch (from directed effort) is modelled by c qE Nt t t= +1 2/ ,

352
assuming a lognormal distribution. The analysis resulted in the following fit to the directed catch data:
Obs and Pred sample catch
0
200000
400000
600000
800000
1000000
1200000
1400000
1600000
1800000
2000000
Aug-
85
Dec
-85
Apr
-86
Aug-
86
Dec
-86
Apr
-87
Aug-
87
Dec
-87
Apr
-88
Aug-
88
Dec
-88
Apr
-89
Aug-
89
Dec
-89
Apr
-90
Aug-
90
Dec
-90
Apr
-91
Aug-
91
Dec
-91
Apr
-92
Aug-
92
Dec
-92
Apr
-93
Aug-
93
Dec
-93
Apr
-94
Aug-
94
Dec
-94
This fit seems reasonably good. The fit below (CPUE), however, shows that the model does not fully capture the Florida lobster fishery dynamics consistently each year:
Obs and Pred sample CPUE
0
50
100
150
200
250
300
Aug-
85
Dec
-85
Apr
-86
Aug-
86
Dec
-86
Apr
-87
Aug-
87
Dec
-87
Apr
-88
Aug-
88
Dec
-88
Apr
-89
Aug-
89
Dec
-89
Apr
-90
Aug-
90
Dec
-90
Apr
-91
Aug-
91
Dec
-91
Apr
-92
Aug-
92
Dec
-92
Apr
-93
Aug-
93
Dec
-93
Apr
-94
Aug-
94
Dec
-94
It may be noticed that the peak in observed CPUE does not always take place in August, as the model assumes. There are two possible explanations for this: One, that recruitment takes place over a period of several months, and its peak is not timed consistently between years. The other is that CPUE may increase during the first few months of the season because the fishery expands to ‘new’ grounds as local areas close to the ports are exhausted. Both probably play a role, and

353
additional information is required before further year-specific adjustments can be made. For instance, if the increase in CPUE observed early on in many seasons is due to fishery expansion, then it would be best to exclude these CPUE data points from the analyses (keeping the total catch in the computations). If, on the other hand, the increase is mostly due to prolonged recruitment, then the model should be modified to allow recruitment to take place in months other than August. An additional feature in the figure above is that predicted CPUE does not seem to fall as rapidly as the observed CPUE does after the middle of each season. For this example, we used an annual M of 0.4 per year (0.033 per month). A much higher M (>1.0) would provide a better fit to these data (a faster drop in predicted CPUE). However, as 0.4 per year seems reasonable, the mismatch between observed and predicted CPUE indicates that the total catch may be an underestimate. This seems likely part of the explanation in this case, as the recreational catch (15-20% or more of the commercial catch) is not included. Despite the concerns raised above, the model fitted to these data can be very useful. It provides estimates of annual recruitment and stock sizes through time. The F values can also be computed as Ft = Ct/Nt+1/2 on a monthly basis; these can in turn be summed up to give an F by season:
F
0
0.05
0.1
0.15
0.2
Aug-
85
Dec
-85
Apr
-86
Aug-
86
Dec
-86
Apr
-87
Aug-
87
Dec
-87
Apr
-88
Aug-
88
Dec
-88
Apr
-89
Aug-
89
Dec
-89
Apr
-90
Aug-
90
Dec
-90
Apr
-91
Aug-
91
Dec
-91
Apr
-92
Aug-
92
Dec
-92
Apr
-93
Aug-
93
Dec
-93
Apr
-94
Aug-
94
Dec
-94
By
Mon
th
0
0.1
0.2
0.3
0.4
0.5
0.6
0.7
0.8
0.9
1
By
Seas
on
It may be noted that the seasonal trend in F is consistent between seasons. Such details cannot be discerned easily by analyses made with data grouped on a seasonal (annual) basis. They are useful because they allow one to model the fishery more realistically. For example, a yield-per-recruit analysis can be performed on monthly computations (as opposed to annual) so that one can address directly issues of closed fishing seasons, protection of berried females, etc. These seasonal trends in F could then be used to specify the proportion of the annual F corresponding to each month in the yield-per-recruit analysis. (3) By season, with recruitment index This example is also based on the Florida lobster data set analyzed in the preceding example. The data consist of total catch as well as catch and effort (number of trips) in the directed fishery. M was assumed to be 0.4. In addition, an index of annual recruitment is necessary. We used two indices: In one case, we used the No values estimated in the preceding section (entries labelled

354
Index 1, below). In the other case, we simply approximated the recruitment index by the aggregated CPUE during the first two months of every season (see Index 2, below).
Total Direct Effort Recruit Recruit Mean
Year Catch kg
Catch kg
Trips Index1 Index2 weight
1985 2281154 2181214 27498 8.803 94 0.539
1986 2356933 2263774 26664 9.324 86 0.562
1987 2383256 2272461 28098 8.907 84 0.521
1988 3252088 3134093 31968 11.072 133 0.527
1989 3569807 3405379 34721 11.071 115 0.565
1990 2746086 2623303 34660 8.697 84 0.566
1991 3108843 2958301 40032 8.413 86 0.582
1992 2437644 2302148 31295 7.695 83 0.621
1993 2414062 2272197 27555 8.325 91 0.593
1994 3275813 3161382 28537 11.142 124 0.592 The model fitted to catch and CPUE data is shown below, with solid lines representing the data with recruitment Index 1, and the broken lines representing the data with Index 2.
Obs. and Predicted Catch
0
1000000
2000000
3000000
4000000
5000000
6000000
7000000
1985 1986 1987 1988 1989 1990 1991 1992 1993 1994

355
Obs. and Predicted CPUE
0
20
40
60
80
100
120
140
160
180
200
1985 1986 1987 1988 1989 1990 1991 1992 1993 1994
The two fits are similar in quality. Interestingly, the recruitment index approximated from the beginning-season CPUE seems to be a good-enough indicator of relative recruitment for this stock. This has considerable practical implications because it is much easier to compute the Aug-Sep CPUE than it is to estimate initial stock sizes each season as was done in the second example, above. Parameter estimates and 80% confidence limits from the recruitment-index model are as follows:
Index1 Range Index2 Range
No (106) 1.64 [0.88-2.83] 3.06 [2.23-4.07]
q(10-5) 2.87 [2.31-3.35] 2.37 [2.05-2.74]
Lambda (105) 7.76 [7.45-8.27] 0.786 [0.75-0.83] In terms of fishing mortality estimates, the two fits give similar trends but slightly different magnitudes. The fit to the recruitment Index 2 data (broken line) compares favourably to the total-season F values computed in the simple depletion model section (shown here as squares):
F
0
0.2
0.4
0.6
0.8
1
1.2
1985 1986 1987 1988 1989 1990 1991 1992 1993 1994

356
Possible applications (a) Analysis of changes in q over time or with population size. This requires analyses of multiple
series of data. Each data set would give an estimate of q for each fleet, which could then be plotted against each other or against other variables of interest such as time, population size, etc.
(b) Estimates of stock size at the beginning of each season to be compared between different
regions or against indices of pueruli abundance. Again, this requires analyses of multiple data sets.
(c) Use estimates to obtain F values for use as input in other methods. For instance, length-based
cohort analyses (LCA) require an estimate of (terminal) F which could be obtained from the Leslie-Delury models as shown in the examples above, bearing in mind that LCA assumes a steady state, Leslie-Delury models do not.

357
6 PRODUCTION MODELS J. Gonzalez Cano
Estimate: Population size in biomass, and F over time, MSY-related reference points. Inputs: Catch (biomass weight) and indices of population size (biomass) (e.g. CPUE). Assumptions: Closed population, density-dependent population growth that is independent of age-structure. Some poorer approaches assume equilibrium conditions. References: Schaefer, M.B. (1957). A study of the dynamics of the fishery for yellowfin tuna in the eastern
tropical Pacific Ocean. IATTC Bull. 2: 247-285. Prager, M.H. (1994). A suite of extensions to a nonequilibrium surplus-production model. Fish.Bull.
92: 374-389. Fox, W.W, Jr. (1975). Fitting the generalized stock production model by least-squares and
equilibrium approximation. Fish.Bull. 73: 23-36. Die, D.J., V.R. Restrepo, and W.W. Fox, Jr. (1990). Equilibrium production models that incorporate
fished area. Trans.Amer.Fish Soc. 119: 445-454. Laloe, F. (1988). Un modele global avec quantité de biomasse inaccessible liée aux conditions
environmentales: applications aux données de la pêche ivoiro-ghanëenne de Sardinella aurita. Aquat. Living Res. 1: 289-298.
MRAG (1995) Catch effort data analysis: The CEDA package, v. 2.01. User Manual. London:
MRAG Ltd. Punt, A. E. and R. Hilborn (1996) BIODYN Biomass dynamic models. User’s manual. FAO
Computerized Information Series (Fisheries). No. 10. Rome, FAO: 62 p.
Explanation
There are two ways to study an exploited fishing stock :
1. Study all the different factors that contribute to biomass changes, such as growth and moratlity, and integrate them in the end to obtain a population model, or
2. A simpler approach is to model only the net changes in Bt (Biomass).
Models that describe the dynamics of the stock in terms of biomass, rather than numbers at age are referred in literature in three different ways: production models, surplus production models or biomass dynamics models. For purposes of this explanation, these will be referred only as production models (PM). These models are used to study the behaviour of the exploited biomass. In order to do so, they assume that changes in the size of a fish population are caused by the interaction among four competing factors: tissue growth, recruitment to the fishery (individuals selected by the fishing gear which migrate to the fishing grounds) and natural and fishing mortalities (M & F). Thus changes in biomass (dB) may be represented as follows :

358
dBt = Rt + Gt - Dt (1) where: dBt = Change in biomass at time t Rt = recruits at t
Gt = growth in weight at t
Dt = deaths at t. It is important to notice that it is hard to separate fully the change in biomass into all these elements because they are interdependent and are all functions of the biomass at the beginning of time t. In addition, the fishing activity does not show up as an explicit factor. Therefore, the fundamental assumption of Production Models is that the effects of three of these factors - tissue growth, natural mortality and reproduction - can be incorporated into a single function and that this is dependent on a single quantity or state (stock size) only. This is despite the fact that the magnitude of these effects depends on factors such as the age- and size-structure of the population, environmental variation, spatial density patterns across the fishing grounds, as well as and current and historical biomasses. Use of production models therefore requires careful consideration of factors which may lead to erooneous results. Production models consider that the change in stock biomass from one year to the next is thus assumed to be the difference between the biomass-dynamic (dBt) and the catch by the fishery. If the biomass-dynamic exceeds the catch, the population will grow and conversely fall if it is smaller than the catch. As with most other depletion models (see Section 5) PMs assume that species interactions, spatial and environmental variation, can be either be modelled explicitly (rarely the case) or accounted for in the observation error term. The population model is itself deterministic. A production model function must satisfy the following three constraints:
1. it must pass through the origin (i.e. no adults, no production). 2. it must be zero at the unexploited equilibrium biomass; the existence of such a biomass
follows from the fact that there must be natural limits to the growth of a population (in the absence of exploitation), and
3. it must be positive for at least some stock size range below the unexploited equilibrium
biomass.
6.1 PRODUCTION MODEL FORMS Models of this type are either discrete or continuous. Traditionally, PMs have been based on the (continuous) differential equations of the form:
dBt / dt = g (Bt) - q f t Bt (2)
where: q is the catchability coefficient, and f t is the effort for year t. More recently, however, attention has been given to (discrete) difference equation models which are usually easier to fit to fisheries data and may more accurately describe population processes. This is because differential equations assume the entire population instantaneously reacts to any fishing, whereas difference equations implicitly model some delay, which seems more reasonable. The predictions obtained by the two types of models are seldom markedly different. Discrete PM models are of the form:

359
By +1 = By + g (By) - Cy (3) where: By is the (exploitable) biomass at the start of year y, g(By) is the biomass-dynamic as a function of (current) biomass, and Cy is the catch during year y. The three most common forms for the biomass-dynamic function g (By) in equation (1) are: g (By) = (a) rBy ( 1 - By / B∞) Schaefer (1954)
(b) rBy ( 1 - Ln By / Ln B∞ ) Fox(1970)
(c) r/p By [1 - (By / B∞)p ] Pella & Tomlinson (1969) where: B : is the current biomass,
r : is the intrinsic growth rate parameter (although for some of the forms
g (B)/B does not tend to r as By tends to 0),
B∞ : is the average unexploited equilibrium biomass (carrying capacity), and
p : is the shape parameter.
6.2 DESCRIPTION OF THE PRODUCTION MODELS BEING CONSIDERED Schaefer production model The Schaefer production model (Schaefer, 1954) assumes that there is a symmetric production function (relationship between stock size and production), and that production depends on the unexploited population size (or carrying capacity) B∞, and the intrinsic growth rate r. B∞ determines the population range, while r only determines the production. The maximum production is attained at MSY (Maximum Sustainable Yield) which, for this model, always occurs at a biomass of B∞/2. The logistic equation, on which the Schaefer model is based, has been shown to fit a number of biological populations besides fish. Fox production model The Fox production model (Fox, 1970) is essentially similar to the Schaefer model, in that production is again related to r and B∞. However, the relationship between stock size and production has a somewhat different form, being much flatter to the right, rather than symmetric. The position and height of the peak in production are again determined by r and B∞, and the data requirements for reliable estimation parameters are similar to those for the Schaefer one. Pella-Tomlinson Production Model Pella and Tomlinson (1969) generalized production model (P-T) (Pella and Tomlinson, 1969) specifies a relationship between stock size and production. It is similar in mathematical form to the Schaefer model, but it has an extra parameter (p), which allows the symmetry of the Schaefer model to be disorted. When p=1, the P-T model and the Schaefer models are identical, with the peak ocurring at B∞/2 ; when p<1, the peak occurs to the left of B∞/2, and, as p tends to zero, the shape (but not the height) of the function approaches that of the Fox model. When p>1, the peak occurs to the right of B∞/2. This flexibility can model a wider array of population growth behaviour,

360
but the introduction of the extra parameter p causes problems. Rather than trying to estimate p from the data, as did Pella and Tomlinson in their original work, the package that has been suggested for the use of these models (Catch and Effort Data Analysis: CEDA [MRAG, 1995]) requires values of p to be specified by the user. This is because p cannot be estimated with any precision, which can lead to very poor estimates of the other parameters. In this case, the user should be able to decide, based on biological grounds, whether the production function is left or right-skewed; apart from this, it would be necessary to carry out some sensitivity analysis for p, as described in the manual of CEDA. Estimation Procedures The estimation of parameters in production models is not straightforward. There are three basic approaches used to estimate the PM parameters: (1) the assumption of equilibrium conditions, (2) transformation of the equations into linear form, and (3) time series or dynamic fitting (see Section 5).
Equilibrium methods The first approach assumes equilibrium conditions. For this to be a reasonable assumption, the fishery must very rapidly move to a stable state whenever there is a change in fishing activity and then remain there until the next change. This not only is unrealistic, but leads to a significant and very dangerous bias in results. The problem is that equilibrium methods usually overestimate surplus production (and optimum fishing effort) whenever they are applied to data gathered during a stock decline (e.g.,during fishery development). In this case, they assume that every catch observed was in fact sustainable, which of course cannot be true if the stock was actually declining. So never fit these models assuming equilibrium. Regression Methods This approach is described more thoroughly in Hilborn and Walters (1992). It involves transforming the equations into a linear form and then fitting by linear regression. These approaches recognize the dynamics, but often make rather odd assumptions about the error structure. Compared to the time series methods, these are computationally much faster, and may be useful for illustrative purposes, but have largely been replaced by the dynamic fitting method. Observation error/time-series fitting Methods These are now considered the best methods for estimating PM parameters. The method is the same as that for other depletion models, but the population model is in production model form. These were first proposed and used by Pella and Tomlinson (1969). Despite its similarity in name to the time-series analysis methods of Box and Jenkins (1976), both methods are unrelated. The basic idea in a time-series fitting is: 1) generate estimates of the initial stock and other model parameters
2) using the catch data and the population model to predict the whole biomass time series
3) generate a measure of difference between the observed catches (or effort) against predicted catches (or effort) time series
4) continue to adjust parameter values to minimise some measure of difference between the predicted and observed time series of abundance index or catch data
In the most general case, this involves estimating the parameters of the Schaefer model, r, B∞ and q, plus one additional parameter, the starting biomasss (Bo). For this method to be effective,

361
adequate contrast is needed in the time series data, so that significant depletion and preferably recovery has been observed in the time series of relative abundance. Techniques being used Non-linear parameter estimation techniques are necessary to find the best fit of the predicted biomass, given the observed catches. The normal fitting criterion is minimization of the squared deviation between observed and predicted CPUE or relative abundance. Using the discrete form of the Schaefer Model to remove the need for too much algebra and calculus, the equations can be written as follows : By = By-1 + r By -1 ( 1 - By-1 / B∞ ) - Cy-1 Uexp = qBy
Model deviance = ∑ (Uobs -Uexp) 2 where the Cy´s are the observed catches and Uobs´s are the observed cpue data and Bo is a parameter to be estimated. An alternative approach is to predict the catches, given the known efforts and the predicted biomasses as follows: Cy = q fy By One then minimizes the deviance between observed and predicted catches. One can also try alternative error models other than least-squares or choose an appropriate transformation of the catch or cpue data to improve the model. Additional options in time-series fitting have to do with how the starting population size Bo is estimated. In practice, there is usually very severe parameter confounding between the three parameters of the Schaefer model, r, B∞ and q. The additional parameter Bo makes matters even worse. In practice, therefore, we normally do not attempt to estimate Bo as a separate parameter, but we assume that B0 = C0/(f0 q), so that for a given estimate of q we have an estimate of the starting population size. One could use a running average of the first few C/f ´s if they show high variability, or if the assumption that the first data point is representative seems dubious. For situations where catch data isavailable right from the start of the fishery, it is probably more reasonable to assume that Bo = B∞, which eliminates Bo from the estimation. There is no standard method for fitting time series models. Any stock assessment biologist dealing with a fishery should take the time and care to try a wide range of time-series fitting options, using both his own observed data and simulated data. Catch and Effort Data Analysis (CEDA) MRAG (1995) For the purpose of the workshop time-series fitting methods will be used. These are incorporated into the CEDA package (version 2.01) of MRAG (1995). In this package, only non-equilibrium fitting methods are used for stock production models parameter estimates. For each type of model and each error model, the likelihoods are maximized numerically using the simplex method. In this case, three different starting values for the parameter r are used (0.1, 0.5 and 1.0) with the initial population size set at values just large enough that population underflows do not occur.

362
Once the data, population dynamics models, and error model are fitted, a joint partial likelihood for the estimated parameters is found using 1000 simulations from a simple non-parametric bootstrap. Uncorrected confidence interval percentiles are then determined from the partial likelihood to give approximate, but robust, parameter confidence intervals. Parameter estimates are constrained to take positive values only; if, for example, a resample gives rise to a negative estimate of catchability, then catchability is set to zero and initial population size to infinity for that sample. A population projection is made by applying the population model and its estimated parameters to a user-supplied scenario of future catch and effort levels. Each projection is deterministic; however, by running 1000 projections using each set of parameter estimates from the bootstrap re-samples, a distribution of (and hence confidence intervals for) population size at each point in future can also be obtained. Production Models considered in CEDA: Bt+1 = Bt + g(Bt-1) - Ct where g(B) is given by g(B) = rB ( 1 - B/ B∞) (Schaefer)
g(B) = rB ( Ln B∞ - Ln B) (Fox)
g(B) = rB ( 1 - (B/ B∞)p ) (Pella-Tomlinson) and MSY is given by MSY = r B∞/4 (Schaefer)
MSY = r B∞e-1 (Fox)
MSY = r B∞ (1+p)-1/p (1-(1+p)-1/p) (Pella-Tomlinson)
obtained at a biomass B* given by [ B∞/2 (Schaefer) B*= [ B∞e-1 (Fox) [ B∞(1+p)-1/p (Pella-Tomlinson) The replacement yield (the catch that maintains the biomass constant) for time interval t+1 is given by [ r Bt+1 (1 - Bt+1-L/ B∞) (Schaefer) RYt+1 = [ r Bt+1 (Ln (B∞) - Ln (Bt+1-L)) (Fox) [ r Bt+1 (1-(Bt+1-L/ B∞)p) (Pella-Tomlinson). It is possible to build lags into a difference model, based on delays between spawning and recruitment, for instance, but is not advisable. Lags can lead to strange behaviour in difference models and should be used with caution. Also lags also attempt to separate growth and recruitment which violates a basic assumption in production models and makes little biological sense. If you think recruitment and growth need to separate, you should choose other forms of depletion models that allow this (see Section 5).

363
Requirements for use PMs assume a closed population and that a stock-recruitment relationship exists (although the relationship is not defined explicitly as in age-structured production models). Therefore the data to which any of these methods is being applied must come from a single biological stock so that immigration and emigration are considered to be negligible compared with rates of growth and natural mortality. It also requires reliable series of catch and effort data with adequate contrast. Note : Unmodified classical surplus production models should be employed only with great caution on fishery management. Example application This example considers problems that might be found in different lobster fisheries in the Caribbean Region. Even when some months or years are missing effort data but reliable catch data exists, a depletion model can still be fitted. The case presented here refers to only one zone of the stock under consideration, thus results are for example only and not to be used until catch data from the other zones are incorporated. Data are from the lobster fishery on the northeast coast of the Mexican Caribbean. Reliable catches consider capture seasons between 1955/56 and 1989/90. Standarized effort (considered as SCUBA effort) is available for this example only for seasons 1982/83 to 1987/88. For these data the best fit was obtained for the Schaefer model. Results of the parameters are presented below. DATASET: Northeast coast of the Mexican Caribbean period 1956-1990 INPUT PARAMETERS: In. Proportion: 0.500 Time Lag: 3 MODEL: PROD. MODEL (SCHAEFER) Fit: Gamma B∞ = 2443862 q = 8.9709 E-06 r = 0.588 MSY = 358963 R.Yield = 341352 Final Biomass = 1783819 Confidence Intervals: 0.025..0.975 B∞: 1.43698 E+06 - 3.81579 E+06 q: 6.45111 E-06 - 1.34318 E-05 r: 1.77638 E-01 - 6.16709 E-01 MSY: 1.03006 E+05 - 5.28832 E+05 Rep Yield: 1.02388 E+05 - 5.23986 E+05 A graph showing the fitting between observed and estimated catches using the Schaefer model is shown below.

364
0
50000
100000
150000
200000
250000
56 58 60 62 64 66 68 70 72 74 76 78 80 82 84 86 88 90
Year
Kg.
of t
ails
observed Ct
Expected Ct
Intervals for B∞, r, q, MSY and replacement yield are plotted and shown in the following graph. As can be observed, some problems arise due to the small amount of effort data which influences the procedure estimating the intervals for these parameters. This problem would be corrected with more effort data.
One other useful result that can be obtained is the biomass projection based on given future time series of effort or catch. An example of this is shown in the following graph where catches are managed by a quota over the following 5 years for (1) 150,000 and (2) 200,000 Kg.

365
6.3 SUMMARY The application of non-equilibrium production models is much more preferable than assuming equilibrium, although fitting the data is more difficult. It is also possible to develop and fit variations of the model. For instance multiple CPUE series (multiple q´s) could be fitted to the same population i.e. the exploitable stock (e.g. Prager, 1994). In summary, the PM approach can be used to (a) Estimate the historical and current status of a stock in terms of F and biomass; (b) Estimate MSY, biomass at MSY and F at MSY and determine the status of the stock relative to these benchmarks.

366
7 AGE-STRUCTURED PRODUCTION MODELS V.R. Restrepo
Estimate: Population size in biomass and numbers by age, and F by age over time, MSY-related statistics. Inputs: Yield, indices of population size (biomass) or CPUE, M, growth parameters, and selectivity by fishery. Assumptions: Closed population, explicit stock-recruitment relationship. References: Hilborn, R. (1990). Estimating the parameters of full age structured models from catch and
abundance data. Bull. Int. N. Pacific Fish. Comm. 50: 207-213. Punt, A.E., D.S. Butterworth, and A.J. Penney. 1995. Stock assessment and risk analysis for the
South Atlantic population of albacore Thunnus alalunga using an age-structured production model. S. Afr. J. Mar. Sci. 16: 287-310.
Restrepo, V.R. (1996) An implementation of the age-structured production model with application
to west Atlantic bluefin tuna fisheries. Coll. Vol. Sci. Pap. Int Comm. Cons. Atl. Tunas SCRS/96/130.
Explanation Production models are frequently applied in stock assessments, partly because they make use of relatively simple data, which are often the only kind available for some stocks: time series of catches, and series of either fishing effort or relative abundance. The most commonly used type of production models are the “lumped biomass” models which can be fitted to yield and effort data assuming equilibrium or making an equilibrium approximation (see Production Model section). An important criticism of lumped biomass production models is that they may be unable to account for lags in the rate of population change due to changes in the age structure of the stock. Hilborn (1990) proposed a model that can be used to address this criticism, an age-structured model that estimates a stock-recruitment relationship instead of the age- and year-specific stock sizes that other highly parameterized age-structured models estimate. Punt and colleagues (e.g. Punt et al., 1995) built upon this idea with some modifications and presented what is known as ASPM (age-structured production model). The basic population model is a basic age-structured projection:
N
R a
N e a A
N e N e a Aa t
t
a tZ
A tZ
A tZ
a t
A t A t
, ,
, ,
,
,
,
,
, ,
=
=
< <
+ =
− −−
− −−
−−
− −
− − −
1
11 1
1 1 1
1 1
1 1 1
where A denotes the “plus” group where all fish ages that age and older are grouped together. Recruitment is given deterministically from a stock-recruitment relationship such as the Beverton and Holt one:

367
RSStt
t=
+−
−
αβ
1
1
where S is the spawning biomass or egg production, obtained by summing over all ages that are mature. For simplicity, many ASPM implementations assume that the population is in equilibrium at the start of the time series being analyzed, with a level of recruitment equal to the virgin (unexploited) one. The observation error component of the model is in indices of relative abundance (e.g. from CPUE or scientific surveys). The indices can be age-specific, or specific to a range of ages, and multiple series can and should be analyzed together. Thus, one could have a recruitment index, an index for spawners, etc. What the model does then is to:
1. Make a guess of the parameters � and �. 2. Project the population forward given the stock-recruitment relationship and the known
yields. 3. See how well the predicted stock sizes for given ages or ranges of ages match with the
observed indices of abundance, appropriately scaled. 4. Repeat steps 1 to 3 until no further improvement in the match between observed and
predicted relative abundance is possible. The main advantage of this ASPM approach to a simpler production model is that the indices of abundance can be age-specific. This is particularly advantageous when various fisheries with different selectivities exploit the population in unison (thus, one would not expect the relative abundance trends by age to be very similar). The disadvantage is, of course, that more detailed data are necessary to fit an ASPM. Requirements for use A closed population is assumed, particularly one in which a stock-recruitment relationship would be expected. Note that this assumption is essentially the same one would normally make in using a biomass-based production model. Because the initial population is assumed to be in equilibrium, it is useful to use as long a time series of data as possible. Most useful ASPM applications include the entire history of landings for the stock (many decades, usually) even if relative abundance data are only available for the latter part of the time series. The required data are: • Complete time series of landings (yield) by fishery.
• Series of relative abundance for various age groups (may have missing values).
• M, growth and fecundity by age.
• Selectivity at age by fishery.
• Assumed form of the stock-recruitment relationship. Example application We have not yet identified a lobster data set that would be amenable to analyses by an age-structured production model. However, we present the idea here because it is a potentially useful tool for spiny lobster stock assessment. In particular, consider the main feature that several indices of abundance can be used representing one or more age groups: One index could be for pueruli (from pueruli collector data, suitably standardized) and this could be defined as “recruitment” to the population at age 0, say. Another index could be on pre-recruits to the fishery, e.g. from CPUE analyses of sub-legal size lobsters where adequate data exist. Yet another index could be for

368
older, legal-size individuals, possibly by sex. Essentially, then, the age-structured production model would be a means to integrate these data under the constraint that, on average, there is some form of stock recruitment function. The latter is not necessarily a worrisome constraint to make, as the explicit stock-recruitment relationships can be parameterized to be nearly flat (average constant recruitment) or very steep (no compensation on average). Possible applications: (a) Estimate the historical and current status of a stock in terms of F and biomass or numbers. (b) Estimate MSY, biomass at MSY and F at MSY and determine the status of the stock relative to
these benchmarks (see section on Reference Points).

369
8 REFERENCE POINTS V.R. Restrepo
Estimate: Reference points to address issues of conservation and productivity, e.g. MSY-related statistics, yield-per recruit, and spawners per recruit as a percentage of the maximum. Inputs: Life history characteristics (growth, reproduction, mortality) and those used for production models in the case of MSY-related statistics. Assumptions: Closed population, various others depending on the approach. References: Beverton, R.J.H., and S.J. Holt (1957). On the dynamics of exploited fish populations. Fish. Invest.
Minist. Agric. Fish. Food U.K. 19: 533 p. Caddy, J.F. and R. Mahon (1995) Reference points for fishery management. FAO Fish. Tech. Pap.
(347): 82 p. Die, D.J., V.R. Restrepo, and J.M. Hoenig (1988). Utility-per-recruit modeling: A neglected concept.
Trans. Amer. Fish. Soc. 117: 274-281. Mace, P.M., and M.P. Sissenwine (1993) How much spawning per recruit is enough? pp. 101-118
in S.J. Smith, J.J. Hunt, and D. Rivard (eds.). Risk evaluation and biological reference points for fisheries management. Can. Spec. Publ. Fish. Aquat. Sci. 120.
Shepherd, J.G. (1982) A versatile new stock recruitment relationship for fisheries, and the
construction of sustainable yield curves. J. Cons. CIEM 40: 67-75. Thompson, W.F., and F.H. Bell (1934). Biological statistics of the Pacific halibut fishery. 2. Effects
of changes in intensity upon total yield and yield per unit gear. Rep. Int. Fish. Pac. Halibut Comm. 8: 49 p.
Explanation Caddy and Mahon (1995) provided a review of “reference points” which they defined as
“...a conventional value, derived from technical analysis, which represents a state of the fishery or population, and whose characteristics are believed to be useful for the management of the unit stock.”
That is, reference points (RPs) are used to give us, depending on an assessment’s results, an indication of where the stock is with respect to where it should (or should not) be. It is clearly not very useful to simply know that the current F for a stock is, say F=1.0 per year. What we need to know is whether 1.0 is too high, too low, or just about adequate? The answer of course depends on a number of things, particularly the population dynamics of the species in question. Some reference points are often used as targets (TRP). These should ideally be defined by managers with help from scientists, although that is not always the case. Common examples of TRPs are Bmsy and Fmsy, the biomass corresponding to maximum sustainable yield (MSY) levels, or the fishing mortality rate that results in MSY. Other reference points are treated as thresholds or limits (LRPs), and these are points beyond which the fishery should not operate. LRPs define states in which the stock cannot replace itself (e.g. recruitment overfishing) or the fishing industry

370
would require external economic support (e.g. subsidies). Essentially they are used to define sustainable management and should ideally be defined by managers and scientists working together. TRPs are more complex and may vary from fishery to fishery and over time. They are should be based on socioeconomics as well as population dynamics and aim to optimize a combination of variables to benefit people. For instance, we may want to address issues of maximizing yield, profits or employment, or minimizing inter-annual variability in landings or some combination of these factors. Reaching consensus on what benchmarks should be is a relatively simple task compared to that of actually defining a point at which recruitment overfishing will occur, for example. The latter is problematic because we cannot be certain about when recruitment overfishing will occur unless we have observed it. And even then, due to natural variability, we cannot be certain that recruitment overfishing would occur again at that point if similar conditions applied some time in the future. Clearly, one could gain much scientific insight into defining LRPs if one could experiment with the fishery, but the socio-economic consequences of this type of learning could be disastrous. For this reason, LRPs are often set based on the precautionary principle that, if one is to err at all in the face of uncertainty, then it is better to err conservatively from the point of view of stock preservation and fishery sustainability. Per-recruit computations Many reference points used today are based on per-recruit computations. Yield per recruit analysis is the calculation of the yield that a cohort of fish will produce under certain exploitation conditions (minimum size, fishing mortality rate, closed seasons/areas, etc.), expressed on a “per-recruit” basis. Most analyses assume equilibrium and address the question of how much yield will be produced by a typical recruit during its lifetime. Beverton and Holt (1957) developed yield per recruit computations to aid fisheries management through using analytical solutions. With the computers available today, the computationally more intense, but also more flexible methods of Thompson and Bell (1934). Yield per recruit is computed as
Y R F N wt t tt tc
t
/ ==∑
λ
where tc and t� are the age at recruitment and oldest ages considered, respectively, Ft is the age-specific fishing mortality rate (selectivity times overall fishing mortality),
is the average weight in age group t, and
is the average numbers. The average numbers are computed from the catch equation
)/()1( )( MFeNN tMF
tt +−= ∆+− where ∆t is the time step for the age group t. So that everything is on a per recruit basis, Ntc is 1 recruit. This formulation offers particular advantages for fisheries like those of lobster. The time steps do not have to correspond to distinct ages (say one-year intervals) but can be defined arbitrarily, so
wt
N t

371
that one could investigate the impact of closed fishing seasons by setting F=0 during the closure and “turning” F on during the open season, for example. Second, the average weights do not need to conform to a particular growth form (e.g. the von Bertalanffy equation) so that one can model discontinuous growth functions such as those of crustacea. Two yield-per-recruit based reference points widely used are F0.1 and Fmax. The first is the F at which the slope of the Y/R-F function equals one-tenth of the slope at the origin; the second is the F that maximizes Y/R or, equivalently, the F at which the slope of the Y/R-F function equals zero. These are shown for a spiny lobster example in the figure below:
0
20
40
60
80
100
120
140
160
180
200
0 0.05 0.1 0.15 0.2 0.25 0.3 0.35 0.4 0.45 0.5
Fishing m ortality rate
Gra
ms
per r
ecru
it
F0.1 Fmax
As can be seen from the figure, in this example F0.1 is 53% lower than Fmax and yet it results in a yield per recruit only 8% smaller than that at Fmax. It is usually the case that F0.1 gives almost as much yield per recruit as Fmax but at considerably lower effort levels. Because of this, F0.1 has been used in many fisheries as a target reference point, being a more conservative benchmark than Fmax. Furthermore, in the presence of a “flat-topped” compensatory stock-recruitment relationship such as a Beverton-Holt type that are advocated for many crustacean stocks, recruitment would be expected to decline with high fishing mortality. In many such cases, F0.1 would be expected to be closer to Fmsy than Fmax would, although not necessarily lower than Fmsy. Thus, it is generally agreed that Fmax should not be treated as a target (TRP) and whether F0.1 should be a a target or a limit (LRP) is debatable, depending on the stock in question. Another important class of reference points derived from per recruit computations are those having to do with reproduction. For instance, measures of spawning biomass per recruit or eggs per recruit, expressed relative to the maximum possible (under no exploitation), are often used to define LRPs (see, Mace and Sissenwine 1993). This measure is known as the spawning potential ratio (SPR). Many fisheries define recruitment overfishing by levels of F that bring the SPR below 0.2 to 0.3, depending on the species. For spiny lobster, LRPs based on SPR set for U.S. fisheries range from 0.05 to 0.2. What the “real” threshold level should be is probably not worth debating too long, considering that how SPR is calculated can substantially affect the values. (For instance, SPR computations based on egg production taking into account multiple egg masses during the year are likely to be very different from SPR computations based on average annual measures of spawning biomass. In general, the computations should make use of the most complete data available taking into account the sex ratio, proportion berried, maturity ogive, and fecundity, including seasonal fluctuations, if any). The more important thing to do is to define a reasonable limit, to set up in advance a set of management procedures that must be followed should the stock fall below that limit, and to adhere to those procedures as closely as possible. Overfished stocks

372
abound with examples in which the limits keep getting redefined, or the rules for recovery are not followed, and as a consequence the stocks remain overfished. A final type of per-recruit based reference points, are computations based on utility (Die et al. 1988) which can be defined as any measure of value. These are easily computed with available software: all one needs is to enter a measure of utility at age instead of weights at age in the model. This may be particularly relevant to setting TRPs for lobsters intended for export markets, as there are consumer preferences for the size of individual lobsters. That is, the export price per kilogram of lobster is not uniform for all tail sizes. From other models Production models (see Section 6) provide the most direct means of estimating MSY-related reference points. Fmsy has been widely used as a TRP in the past even though it is evident from theoretical grounds that the F that maximizes economic rent should usually (depending on the discount rate) be lower. Perhaps a reason for this is that the economic data needed to parameterize the models are not as readily available as the life history data are, at least in stock assessment circles. Caddy and Mahon (1995) also warn that, because of the nature of the data used in production models, Fmsy estimates are often biased high, rendering them less conservative than would be desired. A useful alternative is to compute an analog of F0.1 on the production model curve as a more conservative target. Production models are not the only means for estimating MSY-related statistics, despite popular belief to the contrary. Several authors have shown that yield-per-recruit, spawner-per-recruit and stock-recruitment analyses can be put together for this purpose (see Shepherd 1982). Consider for example a Beverton-Holt type spawner-recruit relationship:
RSS
=+
αβ
.
Rearranging,
SSR
=
−α β . (1)
From per-recruit analyses, one could compute (Y/R)F and (S/R)F, that is the yield per recruit and spawners per recruit at a given F. Inserting (S/R)F in the right hand side of equation (1) would give the equilibrium spawning stock expected at that F, SF. Then, the equilibrium recruitment level would be
RSS RF
F
F=( / )
and the equilibrium yield would be given by Y Y R RF F F= ( / ) . Thus, one could follow this approach to construct equilibrium yield curves. A disadvantage of the method is that it requires knowledge of the stock-recruitment parameters, � and �. The advantage is that it allows for information on size and age structure to enter the computations through the per-recruit analyses. For instance, if Y/R can be increased by an increase in the minimum size, maintaining F constant results in a concurrent increase in S/R. Both the increases in S/R and Y/R

373
combine to give an increase in equilibrium yield which would be very difficult to model with a traditional production model. Requirements for use The per-recruit-based approaches require information on growth, selectivity at age and reproductive output at age. Measures of utility or economic value can also be included if these are available by age. Some computer programs can accommodate detailed information on discard mortality and other technical considerations that may affect the computations. Example application This example uses data for female lobsters from Quintana Roo, Mexico (source: J. Gonzalez). Length (cm) at age (years) is given by l aa = − − −29 1 0 22 086( exp( . ( . )) and conversion to weight in grams is by w l= 0 44841 3 0294. . . Natural Mortality (M) is assumed to be 0.2 per year in this example. For lack of more information at this time, selectivity is assumed to be knife-edge at age 4. A maturity-at-age ogive is given by the relationship
P berriede l( ) . ( . )=
+ − −
11 0 586 18 9
and the fecundity (number of eggs) is given by fec l= +exp( . ln( ) . )2 72 0812 .

374
The table below summarizes the data up to age 20 (a younger age could be used).
Length Weight Fraction Fecundit
y Selectivit
y Age (cm) (gr) Berried (eggs)
3 12.8 100.8 0.027 1108 0 4 16.0 198.5 0.153 2037 1 5 18.6 312.0 0.449 3057 1 6 20.6 429.4 0.732 4072 1 7 22.3 542.7 0.878 5024 1 8 23.6 646.8 0.940 5882 1 9 24.7 739.5 0.967 6634 1
10 25.5 820.0 0.980 7279 1 11 26.2 888.7 0.986 7824 1 12 26.8 946.5 0.990 8280 1 13 27.2 994.7 0.992 8658 1 14 27.6 1034.6 0.994 8968 1 15 27.8 1067.3 0.995 9223 1 16 28.1 1094.1 0.995 9430 1 17 28.3 1115.9 0.996 9599 1 18 28.4 1133.6 0.996 9735 1 19 28.5 1148.0 0.996 9846 1 20 28.6 1159.6 0.997 9935 1
A yield per recruit exercise conducted in a spreadsheet results in the Y/R-F relationship shown in the figure in the previous section. The values of yield-per recruit and spawning potential ratio estimated for different fishing mortality rates are:
F Yield/ SPR Recruit 0.00 0.0 1.0000.10 129.1 0.5320.19 166.2 0.331 <---F0.1
0.20 168.0 0.3180.30 179.5 0.2080.40 181.8 0.144 <---Fmax
0.50 180.6 0.105 Possible applications: (a) Compare the current status of a stock as measured from assessment estimates against various biological reference points in order to determine if further conservation or technical measures are warranted.

375
9 TUNED AGE-STRUCTURED ASSESSMENTS V. R. Restrepo
Estimate: Numbers at age, fishing mortality at age. Inputs: Catch-at-age matrix (by year), natural mortality, age-specific indices of relative abundance. Other auxiliary inputs are possible. Assumptions: Closed population. Other assumptions depending on the model used and available data. For example, the ratio of fishing mortality of the oldest age group to that of the previous age. References:
Darby, C.D., and S. Flatman. 1994. Virtual population analysis: Version 3.1 (Windows/DOS) user guide. Min. Agric. Fish., and Food (MAFF), Dir. Fish. Res. Info. Tech. Ser. No. 1. Lowestoft, U.K.
Deriso, R.B., T.J. Quinn II, and P.R. Neal. 1985. Catch-age analysis with auxiliary information. Can. J. Fish. Aquat. Sci. 42: 815-824.
Fournier, D., and C.P. Archibald. 1982. A general theory for analyzing catch at age data. Can. J. Fish. Aquat. Sci. 39: 1195-1207.
Gavaris, S. 1988. An adaptive framework for the estimation of population size. Can. Atl. Fish. Sci. Advisory Comm. (CAFSAC) Res. Doc. 88/29.
Methot, R.D. 1990. Synthesis Model: An adaptable framework for analysis of diverse stock assessment data. Int. N. Pac. Fish. Comm. Bull. 50: 259-277.
Mohn, R.K., and R. Cook. 1993. Introduction to sequential population analysis. NAFO Sci. Coun. Studies No. 17, 110 p.
Pope, J.G., and J.G. Shepherd. 1982. A simple method for the consistent interpretation of catch-at-age data. J. Cons. int. Explor. Mer. 40: 176-184.
Restrepo, V.R.. 1996. FADAPT Version 3.0: A Guide. Unpubl. Ms. University of Miami, RSMAS, 4600 Rickenbacker Causeway, Miami, Florida 33149, USA.
Explanation. “Tuned” or “calibrated” age-structured analyses are similar in concept to cohort analyses: They use catch-at-age data to reconstruct the history of cohorts in terms of fishing mortality and population sizes. The key difference from typical cohort analyses is that these methods take out the “guess work” involved in specifying terminal fishing mortality rates. This is done by “tuning” the analyses to indices of relative abundance (or effective fishing effort). In essence, the methods seek to estimate parameters (fishing mortalities, catchability coefficients) that best explain the catch at age and relative abundance data. In broad terms, there are two “families” of tuned age-structured methods: Forward-computation procedures, and backward-computation procedures. The forward ones make the “separability assumption”, i.e., that fishing mortality at age can be partitioned into an age-specific component (a selectivity vector) and a year component (a vector of annual fishing mortality multipliers). Examples of this family are the approaches of Fournier and Archibald (1982), Deriso et al. (1985), and Methot

376
(1990). The backward-computation methods, also known as VPA-based (for Virtual Population Analysis), do not make the separability assumption. An example of this approach is the method of Gavaris (1989), as implemented in Restrepo (1996). The choice between backwards and forward approaches can be an important one. In the forward-computation models, a very large number of parameters must be estimated: Initial population sizes, recruitment each year, the selectivity vector, the annual fishing mortality multiplier vector, and catchability coefficients (relating the indices of relative abundance to the total abundance). The forward models seek to minimize differences between observed and predicted data of two types: the catch at age, and the relative abundance data. The backward-computation procedures are quite different. They seek to minimize the differences between observed and predicted values for only one type of data: the indices of relative abundance. They do this by assuming that the catch-at-age data are known exactly, which essentially boils down to not having to estimate a selectivity vector. Thus, the number of parameters that need to be estimated for VPA-based methods tends to be smaller than for the forward ones, at the expense of making the assumption that the catch at age data are exact. In choosing between backwards or forward approaches, the user should be cognizant of these differences. An important question to ask is: Does the separability assumption make sense for this fishery, meaning that the selection pattern remains relatively constant year after year? If so, forward methods are advisable, particularly because they have a more solid statistical foundation in terms of not assuming that the catch-at-age data are known without error. Alternatively, is the mix of gears such that the overall selection pattern could vary a lot inter-annually as a result of relative changes in the effort exerted by the various gears? If so, backward methods may be preferable. (Although, note that forward approaches could accommodate gear-specific computations, at the expense of more parameters to estimate). An explanation of a VPA-based procedure, known as ADAPT (for “adaptive” framework) is provided in the accompanying copy of the Restrepo (1996) manuscript. For a detailed explanation of forward-based methods, the reader is referred to Deriso et al. (1985). Example. For this example, data from the lobster fishery in Isla Mujeres, Mexico, were used (provided by J. Gonzalez Cano). It should be noted that these analyses are presented here for illustrative purposes only, as a number of refinements could be made to the input data. The data used consists of catch at age for both sexes combined (Table 1) and age-specific indices of abundance. Three series of CPUE data were available, from traps, hookah, and scuba. As an example, only the scuba data were used (Note: these data have not been standardized; the analyses here assume that the CPUE values are linearly related to abundance.) For the purpose of obtaining age-specific indices, the catch at age (all gears combined) was divided by the scuba CPUE, and multiplied by the annual ratio of scuba catch to total catch (Table 2).

377
Table 1. Catch-at-age data.
Age 1983 1984 1985 1986 1987 1988 1989
2 10367 5899 8175 7597 11304 21873 28608
3 67504 88199 93715 76898 74465 102328 133212
4 73256 100543 105575 95577 67612 90983 81497
5 87474 90677 103589 110043 62658 84073 63954
6 60067 60452 60540 75338 40640 63135 52770
7 34152 32738 28510 47615 27240 46702 45865
8 16723 14621 12742 30162 17452 32446 34052
9 4891 3179 2936 9646 5289 10241 11604
10 3057 2021 1741 6401 3936 6734 7848
11 2832 1884 1560 6086 3532 6273 7101
12 767 533 646 2372 1151 2092 1842
13 788 627 784 2900 1304 2553 2247
14 496 393 406 1502 785 1270 1115
15+ 558 485 585 2313 934 1292 875
Age 1990 1991 1992 1993 1994 19952 13303 6069 2781 3461 467 985
3 79891 53808 42352 31171 27408 22003
4 72827 60058 48855 43469 42664 46920
5 48965 43096 48839 42381 43059 62303
6 28598 21559 21588 22899 26846 39664
7 22144 13055 11247 12349 18371 29027
8 15259 7598 7538 8056 13578 20573
9 4425 2325 2322 2620 4180 7148
10 3236 1536 1622 2049 3610 4894
11 2795 1208 1370 1772 3226 4430
12 878 221 389 671 1017 1238
13 1022 231 400 755 1110 1335
14 609 190 316 535 749 792
15+ 529 161 175 338 600 704

378
Table 2. Scuba catch and effort data used for input indices of abundance.
Scuba Scuba Scuba Total ScubaYear catch effort CPUE Catch Ratio1983 97051 5165 18.79 120266 0.807
1984 85120 5670 15.01 124831 0.682
1985 52866 4211 12.55 127434 0.415
1986 30703 2378 12.91 168936 0.182
1987 46020 6022 7.64 102389 0.449
1988 48617 5807 8.37 159136 0.306
1990 6437 1266 5.08 88466 0.073
1991 2818 787 3.58 60498 0.047
1992 5788 808 7.16 57436 0.101
1993 6621 1184 5.59 55916 0.118
1994 6780 880 7.70 67467 0.100
1995 5583 784 7.12 93551 0.060 As noted in the Restrepo (1996) document, not all terminal-year fishing mortality values can always be estimated. For this example, five F values were estimated and the remaining 9 values were determined relative to these and assumed relative selectivities. The selectivities were approximated from the catch curve analyses (elsewhere in this manual), and are as follows for ages 2 to 15: 0.5, 0.75,1.0, 0.90, 0.86, 0.82, 0.79, 0.75, 0.71, 0.68, 0.64, 0.60, 0.56, 0.53. F values were estimated as parameters by the model for ages 2, 3, 4, 6 and 8. For the remaining ages, the relative selectivities were used as follows: F5 = F4 S5/S4,
F7 = F6 S7/S6,
Fi = F8 Si/S8, i = 9 to 15. The value of natural mortality, M, was assumed to be 0.35 per year. All age-specific indices (ages 2 to 15) were subjected to logarithmic transformation and given equal weighting. The ratio of fishing mortality at age 15+ relative to age 14 was fixed at 0.95 for all years. The estimates of fishing mortality values in 1995 and their associated estimates of uncertainty were:
Parameter Estimate S.E. % C.V.
F age 2 0.0087 0.00355 40.56
F age 3 0.2078 0.06162 29.66
F age 4 0.2730 0.05065 18.56
F age 6 0.3339 0.05987 17.93
F age 8 0.4945 0.07672 15.51

379
Figure 1. Estimated stock size trajectories and average fishing mortality (last panel). Figure 1 shows the estimated stock size trajectories for all ages. The last panel in Figure 1 shows the estimated trajectory of the mean fishing mortality rate for ages 4 to 15+. The large recruitment decline estimated after 1992 may be spurious. Recent estimates for the young age classes are usually associated with much uncertainty because the cohorts are very recent and do not contain a lot of information about potential magnitude. Note, for example, that the variance of the F estimates for ages 2 and 3 are much higher than those for older age groups. An important diagnostic to examine is the model’s fit to the individual indices. These are shown in Figure 2 (in logarithmic units). Two features are worth noting from this figure: First, the input indices lack obvious information about cohorts that would be reflected, for example, in successive peaks between adjacent age groups in consecutive years. For example, note that a low value is observed in 1991 for ages 5 and up. If this low were to provide useful information by cohort, it should occur, for example, in 1991 for age 5, in 1992 for age 6, and so on. This problem may reflect the fact that scuba-specific catch at age values were not used to derive the input indices in the first place. Instead, total catch at age (all gears combined) was essentially divided by a single measure of (scuba) effort.
0
0.1
0.2
0.3
0.4
0.5
0.6
82 84 86 88 90 92 94 96
Year
Ave
rage
F a
ges
4+
Age 2
0
500000
1000000
1500000
2000000
2500000
80 85 90 95 100
Year
Num
ber
Age 3
0
500000
1000000
1500000
2000000
80 85 90 95 100
Year
Num
ber
Age 4
0200000400000600000800000
10000001200000
80 85 90 95 100
Year
Num
ber
Age 5
0100000200000300000400000500000600000700000
80 85 90 95 100
Year
Num
ber
Age 6
0
100000
200000
300000
400000
80 85 90 95 100
Year
Num
ber
Age 7
0
50000
100000
150000
200000
80 85 90 95 100
Year
Num
ber
Age 8
020000400006000080000
100000120000
80 85 90 95 100
Year
Num
ber
Age 9
0100002000030000400005000060000
80 85 90 95 100
Year
Num
ber
Age 10
05000
100001500020000250003000035000
80 85 90 95 100
Year
Num
ber
Age 11
0
5000
10000
15000
20000
25000
80 85 90 95 100
Year
Num
ber
Age 12
02000400060008000
1000012000
80 85 90 95 100
Year
Num
ber
Age 13
0
2000
4000
6000
8000
80 85 90 95 100
Year
Num
ber
Age 14
0
1000
2000
3000
4000
5000
80 85 90 95 100
Year
Num
ber
Ages 15+
0100020003000400050006000
80 85 90 95 100
Year
Num
ber

380
Figure 2. Observed (symbols) and predicted (lines) indices of abundance.
A second feature apparent from Figure 2 is that the model seemed to have difficulties in explaining the input index values at the start and at the end of the time series. For ages 4 to 8, the predicted values tend to be lower than the observed ones in the earlier years; for ages 7 to 10+, the predicted values also tend to be lower than the observed ones during the most recent years. Residual “patterns” as these, can be used to identify possible problems with the data set. “Sensitivity analyses” also provide useful diagnostics. Such analyses consist of making additional runs changing some of the inputs or assumptions. Examples include: Estimating different terminal-year fishing mortality values; using other indices of abundance (e.g. from hookah); assigning different weights to the various indices; using different relative selectivities, etc. A number of these sensitivity runs were conducted and indicated that the perception of stock status could change substantially depending on a number of these choices, particularly for recent years. As these
Age 2
-3-2.5
-2-1.5
-1-0.5
00.5
11.5
82 84 86 88 90 92 94 96
Year
log(
inde
x)
Age 3
-2.5-2
-1.5-1
-0.50
0.51
82 84 86 88 90 92 94 96
Year
log(
inde
x)
Age 4
-1.5
-1
-0.5
0
0.5
1
82 84 86 88 90 92 94 96
Year
log(
inde
x)
Age 5
-1.5
-1
-0.5
0
0.5
1
82 84 86 88 90 92 94 96
Year
log(
inde
x)
Age 6
-1.5
-1
-0.5
0
0.5
1
82 84 86 88 90 92 94 96Year
log(
inde
x)
Age 7
-1.5
-1
-0.5
0
0.5
1
82 84 86 88 90 92 94 96
Year
log(
inde
x)Age 8
-1.5
-1
-0.5
0
0.5
1
82 84 86 88 90 92 94 96
Year
log(
inde
x)
Age 9
-1.5
-1
-0.5
0
0.5
1
82 84 86 88 90 92 94 96
Year
log(
inde
x)
Ages 10+
-2-1.5
-1-0.5
00.5
1
82 84 86 88 90 92 94 96
Year
log(
inde
x)

381
analyses are presented here only for illustration, the sensitivity runs are not shown in any detail. However, in an actual assessment, it is important to understand how the results may be affected by the various choices made by the analysts.
9.1 POSSIBLE APPLICATIONS Estimate fishing mortality and population size matrices. Estimate selectivity vectors for per-recruit analyses. Estimate a stock-recruitment relationship based on the stock size estimates.

This document consists of three parts.
Part I contains the proceedings of the two workshops, including lists of
participants and the results of stock assessments by country and/or subregion made during the two workshops.
Part II contains a combination of edited national reports in the original language, as presented at the two workshops on the spiny lobster fisheries in the Bahamas,
Belize, Bermuda, Brazil, Colombia, Cuba, the Dominican Republic, Honduras, Jamaica, Mexico, Nicaragua, Saint Lucia, the USA and Venezuela,. It also
contains a combined list of all references of Parts I and II. Part III contains nine notes on stock assessment methods applicable to spiny lobsters
resources .