westerly wetland lead mobility studies final report · laboratory lead mobility studies of the ......
TRANSCRIPT


400002

LABORATORY LEAD MOBILITY
STUDIES
OF THE
THE BURNT FLY BOG SITE
PREPARED FOR
THE NEW JERSEY DEPARTMENT
. '• OF
ENVIRONMENTAL PROTECTION
PREPARED BY
EBASCO
FEBRUARY 1988
6866b . '400003

ABSTRACT
The results of laboratory mobility study investigations indicate that undercertain conditions lea.d in contaminated surfa.ce soils at the Burnt Fly BogSite may be subject to off-site migration. The release of lead fromcontaminated surface soils to site surface waters and subsequent off-sitetransport is the principle pathway of concern. Evidence Indicates that sitesurface water dissolved leac1 concentrations are currently being controlled bylead releases from surface soils. Experimental results and empiricalcalculations indicate that the reservoir of available lead in site soils issufficiently large so as to potentially maintain surface water leadconcentrations of 0.1 ppm to 1.0 ppm for time periods of ten years or more.
Available evidence suggests that relatively little downward or off-sitemigration of lead in site groundwaters is currently occurring. Resultssuggest that subsurface soils effectively attenuate the downward migration oflead containing surface water leachates'.. The adsorption and/or precipitationof aqueous phase lead in subsurface soils appear to be the principalattenuation processes. These processes may be enhanced by the somewhat highersite groundwater pH levels (pH 5-pH 6) as compared to site surface water pHlevels (pH-3.to pH-4). Limited groundwater dissolved lead analyses frompieziometers at several site locations are uniformly low (<0.04 ppm) andsupport the laboratory study conclusions.
Preliminary treatability studies -indicate that lead concentrations can besignificantly reduced through soil washing with EDTA solutions. The high ironconcentrations in some site soils may, however, reduce the effectiveness ofthis technique..
400004
6866b '

TABLE OF CONTENTS
Page
•EXECUTIVE SUMMARY . xii
1.0 INTRODUCTION 1
1.1 Purpose . . 21.2 Scope 21.3 Methodology 3
2.0 EXPERIMENTAL STUDY METHODOLOGIES - 5
2.1 - F i e l d Sampling Program 62.1.1 Soil Sampling Procedures ' ' 62.1.2 Groundwater Sampling Procedures ' • 72.1.3 Surface Water Sampling Procedures ' '' .8
2 . 2 Laboratory Study Methodologies . . . - • • ' . . 82.2.1 Preliminary Soil and Water Analyses , . . '82.2.2 Single E q u i l i b r i u m Batch Extraction Studies . 9
2.2.3 Consecutive Batch Desorption Tests .. . . 102.2.4 Adsorption Equilibrium Te.sts • 102.2.5 Serial Batch Extraction Study . 11
2.2.6 Soil Column Studies • . ' . 122.2.7 Preliminary Treatabillty Studies 132.2.8' Selective Extraction and Speciation Studies 14
3.0 RESULTS ' . 23
3.1 Site Soil and Water Chemical Characterization ^ 24, 3.1.1 Soil Total Lead Analysis 24: 3.1.2 Soil Chemical Characteristics 24
3.1.3 Surface Water Analysis Results . * 263.1.4 Groundwater Analysis Results . •. 26
... ' . . 400005

TABLE OF CONTENTS , (Cont'd)I
Page
3.2 ASTM Shake Test and RCRA-EP Toxicity Test Results' 273.2.1 ASTM Test Results 27
3.2.2 RCRA-EP Toxicitv Test Results • 28
3.3 Lead Adsorption Isotherm Study Results • . -28
3.4 Consecutive Batch Desorption Studies . 293.4.1 Test-1 Surface Soil SSVI-T-1 29
3.4.2 Test-2 Soil SSV-T-4 31
3.5 Serial Batch Extraction Studies ' 32
3.6 Soil Column Studies . 34 .
3.6.1 Soil Column Experitnent-A ' 34
3.6.2 Soil Column Experiment-B . • 37
• . Soils PVC II-T-1 •
3.6.3 Soil Column Experiment-C 38
Soil SSV-T-4 ' '
3.6.4 Soil Column Experiment-D . 39
. Soil PVC-T-2
3.7 Total Soil Lead Concentrations and Particle Size • 41
3.8 Lead Speciation and pH Extraction Studies 42
3.8.1 Lead Speciation Studies ' 423.8.2 pH and Lead Leaching From Soils. 47
3.9 Soil Extraction Studies . 493.9.1 -Extracting Agents and Lead Removal From Soils ' 49
3.9.2 Variations 1n Lead Extractabiltv from Site Soils 50
3.9.3 Effects of Re-extraction on Lead Removal . 51
•iv: . . . 400006
6866b " •

TABLE OF CONTENTS .(Cont'd)
Page
4.0 DISCUSSION . 113
4.1 Soil Lead Concentrations •. 1144.1.1 Soil Sampling Depth and Total Lead Concentration ' 1154.1.2 Total Lead Concentration and-Soil Particle Size -116
* •
4.2 Soil Lead Speciation and Availability 1174.2.1 Implications for Lead Mobility 119
4.3 Surface Soil-Surface Water Interactions and Lead Transport ' 1204.3.1 Field Surface Hater Lead Concentrations 1204.3.2 Soil-Surface Wa^er Chemical Interactions . 1214.3.3 Implications of Laboratory and Field Results . 123
1 . *.
4.4 Lead Contaminated Soils arid Groundwater . • • 125' £
4.4.1 Laboratory Column and Batch Test Results . 1.254.4.2 Field Groundwater Measurements \ - 127
4 . 5 Preliminary Treatability Studies ' . . 1 2 7
4.6 Geochemical Mechanisms . . 129
4.6.1 Surface Interactions Soil-Surface Water 1294.6.2 Subsurface Soil and Groundwater . .130
5.0 FUTURE SOIL LEAD MOBILITY ' . ' ' 142
5.1 Surface Water Runoff ' 1435.1.1 Estimation of the Volume of Available Soil Lead '. 143
..5.1.2 Lead Availability ' '1445.1.3 Surface Water Hydrology .. . 145
5.1.4 Predicted Soil Lead Depletion Times 145*
5.2 Subsurface Lead Migration . 145
' • • - • - ' ' . ' ' . , • 4000076866b ' • • - • ' •

TABLE OF CONTENTS (Cont'd)
6.0 OVERVIEW OF LEAD MOBILITY AT THE BURNT FLY BOG SITE
6.1 Site Surface Soils and Surface Kater6.2 Site Groundwater •
6.3 Potential Treatment Options
7.0 CONCLUSIONS AND RECOMMENDATIONS
7.1 Recommendations
8.0 REFERENCES * • '
APPENDIX - A LABORATORY METHODS
•Page
154
155
157
159
161
. 161
164
VI
6866b
400008

LIST OF FIGURES
NUMBER
2-1
2-2
2-3
2-4
2-5
3-1 '
3-2
.3-3
3-4
3-5
3-6 '
3-7
3-8 :
3-9
3-10
3-11
3-12
TITLE • . . .
. BURNT FLY BOG SITE MAP . .
CONSECUTIVE DESORPTION EXTRACTION TEST
" SERIAL BATCH EXTRACTION TEST
*
MULTISTAGE DISTILLED WATER COLUMN TEST
SOIL COLUMN STUDY CONFIGURATION
CONSECUTIVE BATCH DESORPTION STUDY SOIL SSVI-T-1
CONSECUTIVE BATCH DESORPTION STUDY SOIL SSV-T-4
.CONSECUTIVE BATCH DESORPTION STUDY SOIL SSV-T-4
SERIAL BATCH EXTRACTION STUDY
.SERIAL BATCH EXTRACTION STUDY
SERIAL BATCH EXTRACTION STUDY
SERIAL BAT'CH EXTRACTION STUDY
SERIAL BATCH EXTRACTION STUDY
SOIL COLUMN EXPERIMENT - A •
SOIL COLUMN EXPERIMENT - A
SOIL COLUMN EXPERIMENT - B
SOIL COLUMN EXPERIMENT - B
Page
18
19
' 20
21
22
87
88
89
SO '
91
92
93
94
.95
.96
97
98
vii. - . . - • 400009
6866b

LIST OF FIGURES (Cont'd)
NUMBER TITLE ; ' Page
3-13 SOIL COLUMN EXPERIMENT - C . '99
3-14 SOIL COLUMN EXPERIMENT - C ' 100
3-15 SOIL COLUMN EXPERIMENT - D . . 1 0 1
3-16 SOIL COLUMN EXPERIMENT - D 102
3-17 SOIL LEAD FRACTION REMOVED BY HOT WATER 103
3-18 SOIL LEAD FRACTION REMOVED BY AMMONIUM CHLORIDE ' 104
3-19 SOIL LEAD FRACTION REMOVED BY CITRATE-DITHIONATE AND 6N HC1 105
3-20 SOIL LEAD FRACTION REMOVED BY AQUA REGIA . '106
3-21 EFFECT OF pH ON SOIL LEAD LEACHING . . ' . ' ' 107
3-22 KINETICS OF SOIL LEAD RELEASE ' 1 0 8
3-23 COMPARISON OF EXTRACTING AGENTS AND LEAD REMOVAL FROM SOIL 109•
3-24 EFFECT OF PH ON EDTA EXTRACTION OF LEAD 110
3-25 VARIATIONS IN LEAD EXTRACTABILITY FROM SITE SOILS 111i .
3-26 EFFECT OF RE-EXTRACTION ON LEAD REMOVAL . 1 1 2
4-1 SOLUBILITY PREDICTED EQUILIBRIUM LEAD CONCENTRATIONS 140
4-2 VARIATIONS IN SOIL Kd VALUES WITH EXTRACTION 141
5-T PREDICTED SITE SOIL-SURFACE WATER LEAD RELATIONSHIP ' 152
5-2 - ESTIMATION OF SUBSURFACE SOIL. LEAD ADSORPTION CAPACITY . 153
• . 400010v i i 1

LIST OF TABLES
NUMBER TITLE ; l_ : Page
2-1 " ANALYTICAL METHODOLOGIES FOR SOIL SAMPLES 16
2-2 ANALYTICAL METHODOLOGIES FOR HATER SAMPLES ' . 17
3-1 TOTAL LEAD CONTENT OF BURNT FLY BOG SOIL SAMPLES . . ' 52
3-2 CHEMICAL PROPERTIES OF SOIL SAMPLES . 53
3-3 PHYSICAL PROPERTIES OF SELECTED BURNT FLY BOG SOILS 54
3-4 CHEMICAL PROPERTIES OF BURNT FLY BOG SURFACE WATER SAMPLES 55
3-5 ' CHEMICAL PROPERTIES OF BURNT'FLY BOG GROUNDWATER' ' • 56
3-6 • ASTM SHAKE TEST RESULTS • ' . .' • 57
3_7 ' RCRA-EP TOXICITY TEST RESULTS , . ' 58
3-8 LEAD ADSORPTION ISOTHERM STUDY SUBSURFACE SOIL SSSI^55N ' 59
3-9 '. CONSECUTIVE BATCH DESORPTION SURFACE SOIL SSVI-T-T 60
3-10 CONSECUTIVE BATCH DESORPTION STUDY SURFACE SOIL SSV-T-4 61
3-11 SERIAL BATCH EXTRACTION DISSOLVED LEAD RESULTS • -62
3-12 SERIAL BATCH EXTRACTION TOTAL LEAD RESULTS ' V 63
3-13 . SOIL COLUMN STUDIES - EXPERIMENT-A CONTAMINATED SOIL LEACHATE 64
( ".; ' ' • , ' . 'ix ' .' .'• ••• ' . . ' • ' . . 400011
! . . ' ' • ' 6866b • ' . . • " - ' .

LIST OF TABLES (Cont'd)
NUMBER TITLE \ ' Page
3-14 SOIL COLUMN STUDIES SOIL LEACHATE PH OF EXPERIMENT-A 65
3-15 SOIL COLUMN STUDIES - EXPERIMENT-A UNCONTAMINATED SOIL
LEACHATE ' - 66
.3-16 EXPERIMENT-A UNCONTAMINATED LEACHATE CHEMICAL ANALYSIS 67
3-17 LEACHATE TOTAL ORGANIC CARBON CONCENTRATIONS 68
3-18 SOIL COLUMN STUDIES - EXPERIMENT-B CONTAMINATED SOIL LEACHATE 69
3-19 SOIL COLUMN STUDIES - SOIL LEACHATE PH OF EXPERIMENT-B 70
3-20 SOIL COLUMN STUDIES - EXPERIMENT-B UNCONTAMINATED SOIL LEACHATE 71
•3-21. • SOIL COLUMN STUDIES'- EXPERIMENT-C-CONTAMINATED SOIL LEACHATE 72
3-22 SOIL COLUMN STUDIES - SOIL LEACHATE PH OF EXP'ERIMENT-C 73
3-23 SOIL COLUMN STUDIES - EXPERIMENT-C UNCONTAMINATED SOIL LEACHATE 74
3-24 SOIL COLUMN STUDIES - EXPERIMENT-D CONTAMINATED SOIL LEACHATE 75
3-25 SOIL COLUMN STUDIES SOIL LEACHATE PH.OF EXPERIMENT-D 76
3-26 SOIL COLUMN STUDIES - EXPERIMENT-D UNCONTAMINATED SOIL LEACHATE 77
3-27 EXPERIMENT-D - UNCONTAMINATED LEACHATE CHEMICAL ANALYSIS 78
, 3-28 DISTRIBUTION OF TOTAL LEAD ACCORDING TO PARTICLE SIZE . 79
3-29 LEAD CONCENTRATIONS EXTRACTED FROM SITE SOILS 80
. 4000126866b ' ' • ' . . .

LIST OF TABLES (Cont'd)
NUMBER TITLE • ^ Page
3-30 - LEAD CONCENTRATIONS EXTRACTED FROM SITE SOILS 81
3-31 PH AND SOIL LEAD EXTRACTION . .82
3-32 KINETICS OF LEAD RELEASE FROM-SOILS • . 83.t> •
3-33 COMPARISON OF EXTRACTING SOLUTIONS AND LEAD REMOVAL FROM SOILS 84
3-34 VARIATIONS IN EXTRACTABILITY FROM SITE" SOILS ' 85
3-35 EFFECT OF REEXTRACTION ON LEAD REMOVAL FROM SOIL SSVI-T-1 86
4-1 VERTICAL DISTRIBUTION OF TOTAL LEAD IN THE SURFACE • 132
SOILS OF THE WESTERLY WETLAND ' ••
4-2 DISTRIBUTION OF LEAD IN SOIL FRACTIONS . ' ' 133
'4-3 COMPARISON OF SELECTED SURFACE WATER LEAD DATA 134
4-4 INFFLUENCE OF LEACHATE-SCIL LS RATIO LEAD REMOVAL 135
4-5 EXTRACTING SOLUTIONS AND SOIL LEAD TREATABI.LITY 136•»
4-6 VARIATIONS IN SOIL LEAD EXTRACTION BY EDTA 137
4-7 CALCULATED DESORPTION PARTITION COEFFICIENTS . 138
4-8 • ESTIMATED CONSECUTIVE DESORPTION KD VALUES^ - - • . 139. ' ' ' • ' • .
5-1 ESTIMATION OF LEAD IN CONTAMINATED SITE SOILS . 149
5-2 ESTIMATED TIME FRAMES OF FUTURE OFF-SITE SURFACE ' * .
WATER LEAD MIGRATION .. " 150
5-3 ESTIMATION OF SUBSURFACE LEAD MIGRATION IN'GROUNDWATER 151 '
. , 400013
•'.-'.'..''• • • ' . xi • • -

EXECUTIVE SUMMARY
A laboratory investigation has been undertaken to assess the'mobility of leadin contaminated soils at the Burnt Fly Bog site. The purpose of thisinvestigation has been to determine the mobility of soil lead.and itspotential for off-site transport via site surface and/or groundwatermigration. The goal of this investigation was to assist in focusing thedirection of site remediation efforts toward the contaminant transportpathway(s) of greatest environmental concern. The overall laboratory programwhich was conducted consisted of a series of experimental studies designed tosimulate lead behavior *n site soil-water systems.
Initially a field sampling program was conducted in which samples of leadcontaminated site surface soils from various site locations were 'collected.These samples as well as field collected groundwater samples were utilized inthe laboratory simulation studies. The specific laboratory experiments whichwere performed included: • '
o Simple batch extraction studies such as, ' .
.• ASTM Shake Tests, arid '
. RCRA-EP Shake Tests,V
o Consecutive batch extraction tests involving sequential leaching oflead contaminated soils, ' . . .
o Serial batch extraction tests involving the assessment ofinteractions between lead contaminated soil leachates anduncontaminated site soils, ,
o Soil column tests Intended to simulate soil-water interactions duringleachate infiltration into subsurface soils, and
o Batch extraction studies designed to provide preliminary treatabilitydata.
Xii ' 400014
68665

In addition, a series of detailed experimental soil-lead speciation studies 'were conducted to characterize the chemical forms of-lead in contaminated site
' surface soils in order to better understand potential site soil-water leadinteractions. .
The results of i n i t i a l soil chemical characterizations indicated that soillead concentrations in field collected samples vary widely. Concentrations incontaminated areas generally ranged from several hundred to three thousand ppmwith significant variations even in the same immediate sampling area.Evidence, indicated that the variability in measured soil lead concentrationswas due in part to abrupt decreases in lead concentrations with depth at somelocations. In addition, experimental results suggested that leadconcentrations in the fine particle fractions G<74 microns.)-of site soils are
*
a factor of three to ten times higher than in the overall bulk soil -samples.Therefore., at locations where fine sediments have accumulated leadconcentrations can increase significantly. • •
The results of batch extraction studies indicated that a significant fractionof the lead bound to the contaminated si.te surface soils was potentially,available for leaching to site surface waters. Dissolved lead concentrations
. in leachates exposed to these soils typically ranged from approximately 0.2ppm to 1.5 ppm depending upon the soil sample. This-range'of aqueous leadconcentrations was generated under mild (distilled water) leaching conditionsindicating the lead to be relatively, available. The lead concentration rangesfound in these batch extraction test leachates correlated closely with theranges of surface water lead concentrations which have been measured in sitesurface waters during 1985 and 1987 sampling programs. This suggests that.Tead in contaminated surface waters is in fact being mobilized from sitesurface soils. • . .
»
Consecutive batch extraction study results indicate that lead release fromcontaminated surface soils, is not a rapid one step process. Rather releaseappears to be a slow process in which contaminated soils continuously releaselead to fresh uncontaminated surface waters to re-establish equilibrium.
The results of lead speciation studies suggest that up to twenty percent or. 'more of the total lead concentration in many contaminated site surface.soilsmay be available for release to site surface waters under appropriate, mixing'
' ' - . . - • ' . ..x111- • ' • • • " ; 400015

conditions. Empirical calculations based on -these results suggest that thereservoir of lead remaining in site soils may be sufficient to maintainsurface water lead concentrations in the range of 0.1.ppm to 1.0 ppm for timeperiods in excess of ten years.
The lead released Into site surface water.appears to be largely present in adissolved form (<0.45 microns) and is, therefore, Vikely to be relativelymobile. During subsequent downstream transport processes, surface water leadconcentrations are likely to be gradually reduced through a combination offactors including adsorption to uncontaminated sediments, and dilution withuncontaminated surface water.
The results of batch extraction and column studies indicate that lead fromcontaminated surface soils does not appear to be undergoing rapid downwardmigration into or through the groundwater aquifer. AvaiTable 'evidenceindicates that lead concentrations in leachates from contaminated surfacesoils are significantly attenuated by site subsurface, soi.ls. Soil columnstudy results indicated uncontaminated subsurface soils to readily reduce 1.0ppm leachate lead concentrations from equal weights of contaminated soils towell telow 0.05 ppm. •
Lead speciation and batch extraction study results suggest that several • .physical/chemical factors may be responsible for lead attenuation insubsurface soils. In particular, lead speciation experiments indicate leadrelease from contaminated soils to be very sensitive to solution pH.Increases in solution pH levels from pH 3 to pH 5 or greater were found todramatically reduce leachate lead concentrations. Therefore, it is possiblethat increased pH levels in site groundwaters may enhance lead adsorptionand/or precipitation to subsurface soils.
» •
Empirical calculations suggest that any downward migration of leadcontaminated surface waters (>0.05 ppm) 1s likely to.be quite slow (<0.5ft/year). Results from one groundwater sampling event support theseconclusions. Groundwater samples collected from various site locationsIndicated dissolved lead concentrations to be low (<0.04 ppm) even atrelatively shallow depths (10-15 ft).
400016xiv
6866b

Preliminary treatability studies conducted on contaminated surface soilsindicated that soil washing with EDTA solutions can signficantly reduce soillead concentrations. Evidence does, however, indicate that the high ironconcentrations present in many site soils may reduce the effectiveness 'of thistreatment process. Results also suggest that the sieving contaminated soilsto separate the more highly contaminated fine parti.cle fraction might provideone means of reducing the volume of soils requiring treatment.
Based on these results, it is recommended that any site remediation effortsinclude consideration of the surface water transport pathway. It is alsorecommended that additional periodic groundwater sampling be performed tomonitor groundwater quality.
XV 400017
' 6866b - • . ' • ' • ' - ' ' . ' •

SECTION 1.0
INTRODUCTION
v , 400018
' • . ' • *
621-7b ' . . ' • • . ' / . • .

1.0 INTRODUCTION
1.1 Purpose . •
Remedial investigations at the Burnt Fly Bog Site have revealed the presenceof high concentrations of lead in site surface soils. Soil lead concentrationsin excess of 1000 ppm were reported at many locations in the Hesterly WetlandArea with concentrations in excess of 3,000 ppm previously'detected in certainareas. •
*
Risk .assessment evaluations of the Burnt Fly Bog Site have identified the highsoil lead concentrations as possible human health and environmental concern.Of particular conce-n, with respect to exposure pathways, is the possibilityof off-site surface and groundwater lead migration.
The large volumes lead contaminated soil at the site may limit potentialengineering remediation options. In particular, complete excavation andremoval of all lead contaminated soil, while technically possible, may beeconomically impractical. In order to thoroughly:evaluate .alternativeremediation options, it is therefore desirable to have a clearer understandingof the environmental chemistry and mobility of the lead in the site soilenvironment. Therefore, a detailed laboratory program was conducted in orderto-characterize the mobility of lead in Burnt Fly Bog Site soils.
1.2 Scope
The principal technical focus of this investigation has been to determinewhether the lead in surface soils at the Burnt Fly Bog Site.is mobile in. sitesoil-water systems. In conjunction with this question, the chemicalcharacteristics of the lead in these soils has -been evaluated.
Among the specific technical questions which have been evaluated In the courseof this investigation are the following:
o To what extent do lead contaminated site soils pose a threat to sitegroundwaters. . ; •
400019... • - 2 • . .
6217b

o Do lead contaminated soils pose a threat to -site surface waters?o How strongly is lead bound to site soils, ando What is the chemical speciation of the soil lead.
An overview of the technical approach to these issues is presented in thefollowing section.
1.3 Methodology
*
To evaluate the mobility of soil lead, a'series of laboratory Investigationswere developed in order to better characterize the behavior of lead in sitesoil-water systems. The focus of these investigations was a series of columnand batch studies designed to answer several key questions related to leadmobility. The studies which were conducted included:
o batch extraction studies,o • sequential batch extraction studies, • .o multiphase soil column studies, •o soil lead speciation studies. • ' .
The sequential batch and consecutive desorption batch, tests were conducted toevaluate lead mobility in site soils. The experimental conditions under whichthese experiments are run were significantly different than those of thecolumn tests. These differences included more aerobic reaction conditions and
•
higher solution/soil ratios. By altering the experimental conditions underwhich lead mobility tests are run, it was possible to better characterizethose chemical variables which will control lead mobility under fieldconditions. •
/
Column studies were performed to assess the ease with which lead may desorbfrom, site soils and migrate into site groundwaters. These column studiesinvolved the passage of both distilled water and site groundwater through leadcontaminated site soils. Measurements were made to determine the extent towhich lead desorbs from site soils and dissolves into the respective aqueousphases. . • . •
400020. . . • 3 "
6217b .

These experiments provided an indication of the magnitudes of aqueous phaselead concentrations, which may be expected from contact of site 'groundwater,with lead contaminated soils. These experiments also provided an indicationof the extent of lead removal from contaminated soils which would be requiredto reduce ground water lead concentrations to acceptable levels.
A series of chemical fractionation studies were also conducted inorder tocharacterize the lead speciafion and availability'|n the Burnt Fly Bog soils.The purpose of these studies was to identify the soil chemical fractions withwhich lead was associated in order to assist 1n the evaluation of future leadbehavior. Included in these studies were a number of selective extractionexperiments.which were conducted to provide information on both leadspeciation and soil treatability. .
•62m • \ 400021

SECTION 2.0
EXPERIMENTAL STUDY
METHODOLOGIES
5 400022
6217b • . . ' ' ' '

2.0 EXPERIMENTAL STUDY METHODOLOGIES
This section summarizes, the field and laboratory methodologies utilized in theexecution of ttie Burnt Fly Bog mobility studies.
2.1 Field Sampling Program
This section presents the field sampling program which was conducted inconjunction with Burnt Fly Bog Site lead mobility study. Included are theprocedures utilized in the collection of surface and subsurface soils andgrqundwater.
2.1.1 Soil Sampling Procedures
Surface soil grab sampling was dene on March 31, 1987. Surface soil sampleswere collected at six locations (designated SSI-T-13, SSII-T-1, SSIII-T-2SSIV-T-3, SSV-T-4 and SSVI-T-1) from the surface six inches into a cdoler andchilled, using vermiculite for temperature insulation. Approximately 25- lb..ofsoil was collected at each site. Sampling equipment was rinsed with distilledwater and wiped dry between sampling at each site. Figure 2-1 depicts the -location of the surface soil sampling sites. These sampling sites werelocated in areas in the Westerly Wetland of reportedly high Pb concentrationbased upon previous investigation results (Ebasco, 1985). Subsurface.soi1samples were aVso collected during the sampling program at two locations(cluster piezometers 55N and 7N). These subsurface soil samples werecollected at depths of 5-10 feet and were obtained from flight auger tailingsthat were brought up during the dri l l i n g of the piezometer wells at these two.locations (Figure 2-1). The subsurface soil samples were placed Into coolersand were stored at approximately 4CC prior to shipment to the laboratory.Soil lead analyses were initiated within 10 days of sample receipt by thelaboratory.
% •
In addition to the grab samples, fourteen undisturbed soil Cores werecollected at three locations along transects I and II on March 31, 1987.' Thelocation of these soil cores is presented in Figure 2-1. These soil cores
•were collected as part of the soil column experiment studies. Selected
• 400023• " • 6 . ' - . . - -
6217b '

undisturbed core samples were used in soil column studies. Six 24 inch long,2 inch diameter.PVC tubes were driven into the ground at two sites along-transects.! and 2. These PVC tubes were driven into the surface so'i 1 manuallywithout the aid of a driver. The edges of the bottom of the PVC tubes werebevelled. This enabled the PVC tubes to be driven into the on-site soil withrelative ease.
Once the PVC tubes were removed from the ground, the ends were wrapped withduct tape and placed gently into a cooler containing vermiculite and- ice to
f
minimize disturbance and dessication of the cores. This was done so thatcracks would not form in the soil cores. PVC tubes was then shipped to theHittman-Ebasco laboratories where they were stored at 4°C until they wereused in the soil column studies.
On.April 16, 1987 five additional 24 inch long, 2 ihch diameter PVC tubes wereused to collect undisturbed soil columns in the area of cluster piezometer 55N(Figure 2-1). The same procedures were followed as in the earlier samplingevent, however, the soil cores were taken from a depth of one to three feet.A 'small one foot deep pit was first dug and-the-PVC tubes were then manuallypushed into the sandy soil at the bottom of the pit. The PVC undisturbed soilcores were then shipped to the Hittman-Ebasco laboratory and were stored at4eC at the laboratory.
2.1.2 Groundwater Sampling Procedures
Groundwater was sampled twice during the course of the field samplingprogram. The-first groundwater sampling event took place on April 15 and 16,1987 at shallow piezometers 28S A and 28SB, 1n the Hesterly Hetland. Allpiezometers were evacuated to dryness or three well volumes of water wereremoved prior to sampling. Approximately five, gallons of groundwater werecollected on April 15, 1987 from piezometer 28S-A and stored at 4eC. Thisgroundwater sample was taken from a depth of 10 feet using a 2 Inchcentrifugal pump. On April 16, 1987 thirty gallons of groundwater (six 5gallon containers) were collected from shallow piezometer 28S-B (Figure 2-1)from a depth of 12.5 feet again using a 2 Inch centrifugal pump. All thegroundwater samples were stored at 4eC were shipped'to the lab within 48 hr.of collection. These groundwater samples were used in the treatability study.
6217b : ' 400°24

Additional groundwater samples collected only for the.purpose of chemicalanalysis were collected during second sampling event between May 19, 1987 andMay 29, 1987. The objective of this program was to characterize thegroundwater quality on-site in the Westerly Wetland (Figure 2-1). Allgroundwater samples were collected in nitric acid cleaned plastic containers.
All groundwater samples receiving dissolved lead analysis were filtered 1n thefield with a 0.45 micron filter. Groundwater samples collected for additionalanalyses (total organic carbon,'alkalinity, chloride, -and sulfate) were stored
* t
at 4eC and appropriately preserved. •
2.1.3 Surface Water Sampling Procedures
On March 31, several surface water samples were collected 1n the small creekthat drains Burnt Fly Bog in the western portion of the site near Transect13. Three 5 gallon acid cleaned plastic jugs were Immersed in the creek,filled, capped and stored in coolers at 5CC until shipment to.the laboratoryfor analysi s. • .
2.2 Laboratory Study Methodologies '• . .
This section summarizes the laboratory study methodologies which were utilizedin the experimental program. More detailed discussions are presented inAppendix A.
2.2.1 Preliminary Soil and Hater Analyses
Soil Samples
»
Upon receipt at the laboratory soil samples were chilled and stored untilactual usage. Each Individual soil sample was mixed using a stainless steelspatula to improve sample uniformity. Multiple subsamples of each Individualsoil sample were collected for total lead analysis. Subsamples of each soilwere also collected and submitted for additional physical/chemicalcharacterization (soil pH, cation exchange, capacity, particle size analysis,total iron and total manganese). The methods used in the analysis of these
62l'7b ' ' 400025

parameters are summarized in Table 2-1. Subsamples of most soil samples weresubsequently submitted for speciation studies performed by Dr. John Trefry 'atthe Florida Institute of Technology.
Hater Samples
Upon receipt at the laboratory all surface and groundwater samples wererefrigerated at 4°C. Surface and groundwater samples were also filtered(2.0 micron filter) at the time of sample receipt. Individual surface andgroundwater samples were then analyzed for total lead. The analyticalmethodologies used for water analysis are presented 1n Table 2-2.
2.2.2 Single Equilibration Batch Extraction Studies
Several types of batch extraction studies were conducted in the course of.theexperimental program. These included single equilibration standard ASTM andRCRA-EP batch tests, as well as serial batch extractions and consecutiveadsorption and desorption tests. The methodologies of each of these batchtests are summarized as follows: •' •
ASTH Batch Tests Method • - ' ' ' - . .
A subsample of each of the surface and .subsurface soils under study wassubmitted for analysis via the standard ASTM shake test methodology(ASTM-D3987-BD. • Briefly, this test methodology involves the equilibration ofsoil samples with deionized water. Samples were equilibrated at a 4/1 (ml/gm)solution to soil.ratio. Following equilibration solid and aqueous phases areseparated via filtration and the aqueous phase analyzed. Additional detailson this.test methodology are presented in Appendix A.
RCRA EP Toxicitv Tests
Several soil samples demonstrated to have high total lead concentrations wereanalyzed for lead using the RCRA-EP toxidty test. In contrast to the ASTMtest, the RCRA-EP test utilizes an acetic -add leaching solution at a 20:1leaching solution to solid ratio. Samples are equilibrated for 24 hours.Details of the RCRA-EP test methodology are presented 1.n Appendix A.
9 -. 400026•6217b • .

2.2.3 Consecutive Batch Desorptlon Tests
As part of the overall experimental study, a series of consecutive desorptiontests were, performed. Consecutive desorption tests were performed on severalsamples of soil SSVI-T-1 and SSV-T-4. The extraction processes illustratedin Figure 2-2.
Briefly, a 300 gm sample of contaminated soil (based on wet weight) was placed1n an extraction vessel (2L plastic beaker) and an appropriate volume ofdistilled water leaching solution added to generate either 4:1 or 10:1leachate to soil weight ratios. Leachate volumes were determined bysubtracting the amounts of moisture 1n the sample from the original volume.
The sample was slowly but continuously mixed, over a 24-hour period. Thesample, was then filtered under vacuum using hardened filter paper (Nhatman. 54)in a Buchner funnel. The Whatman 54 filtrate was then preserved for analysisby first filtering through a 0.5 micron Gelman filter and then acidified with1:1 HN03 acid to.pH 2. In certain tests an approximately 10 gm soil samplewas removed from the total solid sample and analyzed for total lead. The.remaining soil was placed in another extraction vessel and the next volume of.leaching solution (distilled water) added. w .
The extraction process was continued at. the appropriate extraction ratiothrough a total of six extraction sequences. During each extraction, thevolume of leachate was adjusted to result in an approximately constantsolution to soil ratio. Leachate solution ratios (LS)'of 4/1 and 10/1 wereused in these experiments.
2.2.4 Adsorption Equilibrium Tests
Adsorption equilibrium tests were performed to evaluate the attenuationcapacity of subsurface soils. In these experiments 100 -gram air driedsubsurface soil samples were equilibrated for 24 hour time periods with.varying concentrations of stock Inorganic l«ad solutions (prepared as leadchloride). Initial aqueous phase lead concentration's ranged from 0.005 to 5ppm. . Following'equilibration, aqueous and solid phases were separated bycentrlfugation and the aqueous phase subsequently analyzed for total lead. • .-
10 .. ' 4000276217b ' • . •

2.2.5 Serial Batch Extraction Study
As part of the overall experimental study, serial batch extraction tests wereperformed on one selected sample of soil SSVI-T-1.
The serial batch extraction method used was a modification of the methoddeveloped by Houle and Long (1980),and entails batch leaching a solid soilsample with progressively larger volumes of leachate. A sequence of threeextractions was conducted on one contaminated soil (SSVI-T-1). Thecontaminated soil was leached sequentially with distilled water at 3:1, 10:1and 20:1 leachate to soil ratios. After leaching for 24 hours, withoccasional mixing, the leachate was separated from the solid phase byfiltration. The resulting leachate was filtered again and preserved foranalysis while the remaining solid was returned to the extraction vessel andthe next volume of leachate added. The overall leaching scheme 1s depicted inFigure 2-3. ' .
To simulate the migration of a contaminated soil leachate into anuncontaminated soil, the leachate from each extraction is contacted with aseries of uncontaminated soil samples. As with the waste sample, the ratio of
.leaching solution to solid is increased according to the method. .Leachatesubsamples were collected for lead analysis following each equilibration step.
Specifically, an approximately 300 gram sample (dry weight) of soil sampleSSS-55N (1-2 ft depth) was i n i t i a l l y leached at a 3:1 leachate/solution ratio(approximately 900 grams of distilled water). The sample was occasionally,mixed, 4 to 5 times, over a 24-hour period. The sample-was then filteredunder vacuum using hardened filter paper (Hhatman 54) 1n a Buchner funnel. A •measured aliquot of the Hhatman 54 filtrate was then used for contacting withthe uncontaminated soil B. The uncontaminated soil weights were 150 grams inthe first extraction, 100 grams in the second extraction and 50 grams 1n thethird extraction. .
• . • *
The remaining aliquot of the Hhatman 54 filtrate was then preserved foranalysis by first filtering through a 0.45 micron Gelman filter,, then
i measuring and recording the-volume. 1:1 HN03. add and was then added to pH2. [ The remaining contaminated soil A was placed 1n another extraction vessel
• I' ' •' ' ' ' . ' • . •' . H . 400028
6217b . . , •

and the next volume of leaching solution added to attain a 10:1 liquid/solidratio. The extraction process was continued at the 10:1 ratio and at a 20:1ratio. •
Additional details on the experimental methodol.ogy are presented 1n Appendix A.
2.2.6 Soil Column Studies -
A series of laboratory soil column study experiments were conducted. Thepurpose of these experiments was to simulate the leaching of lead fromcontaminated surface soi'is. The overall experimental methodology 1s basedupon a modification of the soil column test methods of Fuller (1978).
A total of four column study experiments were run and each experiment was run1n duplicate. In two experiments air dried samples of site surface soil wereleached with d i s t i l l e d water and in the remaining two experiments field moistsamples of contaminated soil were leeched with groundwater collected from thesite. . . . ' . - . • • . . - . .
The air dried .soil samples were subsamples of the large grab samples collectedfrom selected site field locations. The field moist samples were undisturbedsurface soil core samples collected \n hand driven PVC Shelby tubes. Theseundisturbed soil samples were leached in the laboratory with no preparation oralteration of the samples. .
The overall soil column methodology Involves leaching the contaminated soil bya liquid (distil.led water or groundwater) and passing the resulting leachatethrough an uncontaminated soil sample. Both contaminated and uncontaminatedsoils we're in sealed PVC columns and the columns-connected by tygon tubing.The experimental design is presented 1n Figure 2-4. The leaching solution was
, " X
gravity fed from a head reservoir and adjusted so that a constant flow wasattained ^approximately 1 pore volume/24 hour's). Approximately 21 porevolumes of leaching solution was passed through each contaminated soilcolumn-. At selected Intervals samples from each column were collected andanalyzed. Samples were taken both before and after the leaching solution'passed through the uncontaminated soil column. Eight columns were run withthe specific soils in each column as diagramed 1n Figure 2-5.
1 2 - , • 4000296217b •'.

Samples from these soil column studies were analyzed according to the methodsidentified in Sections 2.2.1 and 2.2.2. Additional details concerning thecolumn study methods are presented in Appendix A. •
2.2.7 Preliminary Soil Treatabilitv Studies
The effectiveness of several chelating agents (EDTA) in extracting lead fromsite soils was investigated. Each test was carried out at room temperature,(approximately 20°C) using 150 grams (wet weight) of contaminated soil and
f
600 ml of aqueous reagent to form a slurry. The slurry was. stirredcontinuously for two hours at a speed of between 30 to 40 rpm.
At the end of two hours, the soil was separated (by filtration) from theleachate. Leachate samples were analyzed for dissolved lead, dissolved iron(certain samples only) and pH. Prior to the start of the experimentsduplicate subsamples each of the soils under study (SSVI-T-1, SSV-T-4 andSSII-T-1) were collected and analyzed for total lead.
The following individual experiments were run: •
Experiment-l - Duplicate samples containing 150 grams (wet weight) of soilSSVI-T-1 were equilibrated with 600 mis of 0.1M sodium EDTA for two hours.Following equilibration leachate samples were analyzed for dissolved lead(0.45 micron filter), dissolved iron, and pH.
o Experiment-l was repeated using distilled water as a blank.o Experiment-l was repeated using sampfes.of soil (SSV-T-4)o Experiment-l was repeated using samples of soil (SSII-T-1).o Experiment-l was repeated using samples of soil (SVI-T-1) using O.OlM
sodium EOTA. . . ,
o Experiment-! was repeated using samples of soil (SSVI-T-1) and 600 mlof 0.1M sodium EDTA in O.OlM HCL solution,
o In a follow-up experiment the same soil samples used in Experiment-lwere re-extracted with fresh 0.1M sodium EDTA.
o Experiment-l was repeated using the procedure outlined in, *
Experiment-l using samples of soil SSVI-T-1' and 600 ml of 0.1H sodium' . EDTA in 0:01 M NaOH. ' . .
62J7b - ' - 40003°

o Experiment-1 was repeated using the soil samples from Experiment-1(and Experiment-6) in which five sequential one hour extractionsusing d i s t i l l e d water were performed. After each extraction the .solid and l i q u i d phases were filtered with a one micron filter.
o' Experiment-! was repeated using 0.1 M hydroxylamine hydrochloride inacetic acid.
o Experiment-1 was repeated using citrate buffer 0.1 M at pH-3.
2.2.8 Selective Extraction and Spedation Studies*
A series of selective extraction studies were performed to assess theextractability and speciation of lead in site soils. These experiments wereperformed by Dr. John Tre.fly of the Florida Institute of Technology.
Selective Extraction Analyses •
Solid phase subsamples of a series of site surface- soils were treated with aseries of selected extracting reagents. The extracting sequence is summarizedas follows: .
o Treatment - 1 - Soil samples were heated in boiling distilled,deionized water to dissolve soluble chloride or sulfate phases andrelease associated Pb. Solutions were analyzed by atomic absorptionfor lead and iron.
o Treatment -. 2 - Samples were treated with- 1 N NH4C1 (pH 7) and'
0.01 N NH4C1 to remove adsorbed lead. Solutions were analyzed byatomic absorption for Pb and Fe.
o Treatment - 3 - Lead.associated with free metal oxides was leachedusing citrate-buffered sodium dithlonlte. Concentrations of Fe, Mnand Pb In these samples were analyzed by atomic absorption.
o Treatment - 4 - Lead held in association with sulflde phases wasextracted by treatment with 6.0 N HC1. The resulting solutions were
*
analyzed f o r P b , F e a n d S . • ' ' . . .
14 . 400031
6217b

o Organically bound Pb was extracted by reaction with 0.05 Mdiethylenetriaminetetrataacetic'acid in'0.2 M sodium acetate (pH 7.).
o Residual lead associated with the alumniosilicate matrices wasdetermined by solid phase dissolution in an acid (aqua regia) mixture.
pH Extraction Studies
Selected soil samples were leached in a series of buffered solutions to assessthe influence of pH on lead leaching. Approximately 0.4 gram solid soilsamples were equilibrated with approximately 20 ml of buffer solution.Samples were equilibrated for two hour time periods. In kinetic studies,equilibration times ranged from 0.5 - 24 hours. Following equilibrationaqueous and solid phases were centrifuged (2000 rpm) for ten minutes. PHequilibration tests were conducted at pH=2,'3, 4, 5, 6, and 7. Treatmentswere separate not sequential tests at each pH. . • '. .
400032
1 5 ' ' : " . .6217b

TABLE 2-1
ANALYTICAL METHODOLOGIES FOR SOIL SAMPLES
Parameter Method Reference (3)
Lead (total) EPA-7420
pH
Cation ExchangeCapacity
Total Organic Carbon
Particle Size Analysis 43-2[Seiving and Hydrometer) 43-5
Free Iron Oxide
Total Iron
17-5
17-1
EPA - Test Methods forEvaluating Solid WastesSW-846
EPA - Test Methods forEvaluating Solid WastesSW-846
Methods of Soi l .Analysis -Part 2 edited by A..L. Pageet al. 1982
Methods of Soil Analysis .Part 2 Edited by A.U Pageet al. 1982 .
Methods of Soil Analysis .Part 2 Edited by A.L. Pageet al. 1982
Methods of Soil AnalysisPart 2 Edited by A.-L. Page.et al. 1982
Methods of Soil AnalysisPart .2 Edited by A.L. Pageet al; 1982
NOTES
ICAP and/or'atomic absorption were utilized for soil lead analyses.
6205b400033
16

TABLE 2-2
ANALYTICAL METHODOLOGIES FOR WATER SAMPLES
Parameter
Lead (d issolved)
Lead (total)
Other Metals
Sulfate
Chloride
Alkalinity
Hardness
Total OrganicCarbon
Conductivity
Method
EPA 239.2
EPA 200.7(1)
EPA 230.2
EPA 200.7(1)
EPA 200.0
EPA 375.32
EPA 325.3
EPA 310.1
EPA 130.2
EPA 415.1 .
EPA 120.1
Reference
Methods for chemicalanalysis of water and wastes(EPA-600/4-79-020)
Methods for chemicalanalysis of water and wastes(EPA-600/4-79-020)
Methods for chemicalanalysis of water and wastes(EPA-600/4-79-020);
Methods for chemical,analysis of water and wastes(EPA-600/4-79-020). ..
Method? for chemicalanalysis of water and wastes(EPA-600/4-79-020)
Methods for chemicalanalysis of water and wastes(EPA-600/4-79-020)
Methods for chemicalanalysis of water and wastes(EPA 600/4-79-020) . .
Methods .for ch'emicalanalysis of water and wastes(EPA-600/4-79-020)
%
Methods for chemicalanalysis of water 'andwastes (EPA-600/4-79-020)
NOTES
Atomic absorption was primarily used for lead analysis.
6205b 17-400034


FIGURE 2-2CONSECUTIVE DESORPTION EXTRACTION TEST
DISTILLEDWATER
fcSOILXGM
4XML
IFILTER
RESIDUEI
DISTILLEDWATER .
SOILX-10GM
4(X-10)ML
FILTERI
RESIDUEI
DISTILLEDWATER
1*SOIL— ZOGM
4(X-20) ML
IFILTER
RESIDUE
DISTILLEDWATER
fcSOIL
X-50GM4(X-50)ML
FILTER
19
X-300GM
•>• ANALYZE LEACHATE-PBSOIL-PBLEACHATE-pH
-^•ANALYZE LEACHATE-PBSOIL-PBLEACHATE-pH
DISTILLEDWATER
DISTILLEDWATER
fhn
fe,
«RESIDUE
1
SOILX-30GM
4<X-30) ML
1FILTER
t_,.,.,
RESIDUE1
SOILX-40GM
4<X-40) ML
1FILTER
1
~
fe
fc
^ANALYZE LEACHATE-PBSOIL-PBLEACHATE-pH
^•ANALYZE LEACHATE-PBSOIL-PBLEACHATE-pH
ANALYZE LEACHATE-PBSOIL-PBLEACHATE-pH
-^•ANALYZE LEACHATE-PBSOIL-PBLEACHATE-pH
400036

FIGURE 2-3SERIAL BATCH EXTRACTION TEST
, 1ST WASTEEXTRACTION
1ST SOILEXTRACTION
2ND SOILEXTRACTION
3RD SOILEXTRACTION
RESIDUE RESIDUE
DISCARD
RESIDUE
*A
X = AMOUNT OF WASTEY = AMOUNT OF SOILA = ALIQUOT FOR FILTRATION
AND ANALYSIS
20400037

FIGURE 2-4MULTISTAGE DISTILLED WATER COLUMN TEST
DISTILLEDWATER ORGROUNDWATER
oooU)00
I
UNCONTAMINATEDSITE SUBSOIL(LOW LEAD) '
SITE SURFACESOIL(HIGH LEAD)

FIGURE 2-5SOIL COLUMN STUDY CONFIGURATIONS
COLUMNS
EXPERIMENT A B SOIL TYPE
B
SSS-I-55N
SSVI-T-KA)
PVC-II-55N
PVC-ll-T-1
SSS-I-55N
SSV-T-4
PVC-V-55N
PVC-l-T-2
SSS-I-55N
PVC-I-55N
SSS-I-55N
SSV-T-4
PVC-W-55N.
PVC-l-T-2
AIR-DRIED SOILSUNCONTAMINATED
6SVI-T-KA) CONTAMINATED
FIELD-MOIST SOILSUNCONTAMINATED
PVC-lll-T-1 CONTAMINATED
AIR-DRIED SOILSUNCONTAMINATED
CONTAMINATED
FIELD-MOIST SOILSUNCONTAMINATED
CONTAMINATED
400039
22

SECTION 3.0
RESULTS .
6217b . • ' ' 40004°'

3.0 RESULTS
The results of the lead mobility studies are presented in this section.Included are the results'of batch extraction and soil column studies, theanalysis of the field soil surface and ground water samples and the leadspeciation studies.
3.1 Site Soil and Water Chemical Characterization
3.1.1 Total Soil Lead Analyses ,
. The results of.total lead analyses of each soil sample are presented in Table3-1. Three subsamples of each soil sample were analyzed for total lead. Theresults, confirm that significant variations exist in the total lead content ofthe surface and subsurface soils located in different portions of the sites.
As is indicated in Table 3-1, the highest, mean total -lead concentration (2617ppm) was observed in soil sample SSVI-T-1. For this sample, replicate lead :analyses values ranged from 2380 ppm to 2840 ppm. High average leadconcentrations were also observed for surface samples SSII-T-1 (1190 ppm) andSSV-T-4 (1268 ppm). Average subsurface soil lead concentrations for samplesSSSI-55N (48 ppm - 5-10 foot depth), SSSI-7N (55.ppm) and SSI-55N (62 ppm- 1-2foot depth) are.all uniformly low.
As is indicated by comparison-to Figure 2-1, those soil samples displayingthe highest mean lead concentrations (SSVI-T-1, SSII-T-T and SSV-T-4) comefrom Westerly Wetland areas Immediately adjacent to or downgradient of former,lagoons 3 and 4. -This is consistent with previous site investigations showingthese areas to be highly contaminated wi.th lead.
3.1.2 Soil Chemical Characteristics
•*
Selected soil chemical properties were measured in order to bettercharacterize site soils. The purpose of these'-analyses was to assist 1nevaluating the environmental chemistry of lead in site soils. Thephysical/chemical properties of the field soil samples collected for
investigation are presented in Table 3-2 and are summarized as follows:
• ' . 246217t> 400041

Soil DH
The pH of the site surface soils investigated are generally aci-dic as ischaracteristic of New Jersey coastal plain soils. Measured pH values forsurface soils which were analyzed ranged from 3.4 for soil SSIV-T-3 to 5.8 forsoil SSII-T-1.
Soil Percent Solids • • .
Percent solids measurements provide an indication of the level of watersaturation of a soil. As is indicated in Table 3-2 the percent solids levelsof the field collected soil samples vary significantly. Values ranged from 28•percent SSV-T-4 to 82 percent for soil sample SSII-T-1. The low solidscontent for sample SSV-T-4 may be a reflection of the high organic characterof this soil as evidence by a high TOC content.
Caton Exchange Capacity
Cation exchange capacity analyses were performed on selected soil samples andthe results presented in Table 3-2. The results indicate the soils to possessgenerally high C.EC levels with values ranging from 41-57 meq/100 gm.
Total Iron
Concentrations of total iron in site soils vary widely. Concentrations rangefrom 3900 ppm in soil sample SSII-T-1 to a relatively high value of 59,600 ppmin sample SSV-T-4.
TQC Analyses . .
Total organic carbon analyses were performed on the soil samples. AsIndicated in Table 3-2 TOC levels vary widely. Concentrations range from-12,000 ppm in soil sample SSII-T-1 to a relatively high concentration of333,000 ppm 1n the organic rich sample SSV-T-4.
6217b 400042

Physical Properties of Soils
In Table- 3-3, the particle size distribution of certain soil samples ispresented. As is indicated, all of the analyzed soils are relatively coarsewith more than 80 percent of the soils classified as sand or coarser. SamplesSSI-T-13, SSII-T-1 and SSVI-T-1 are classified as loamy sand, sand and sand,respectively. Subsurface soil sample SSSI-55N (5-10 feet) was classified as aloamy sand (Brady, 1974). This soil sample was collected near clusterpiezometer 55N from a depth of 5-10 feet. The sandy textures, of these soilsare typical of soils in the coastal plain.province in New Jersey.
3.1.3 Surface Hater Analysis Results
As part of the overall laboratory mobility study program, several surfacewater samples were collected at one location for lead analysis. The samplinglocation was in the Western edge of the Westerly Wetland (Figure 2-1). The •results are presented in Table 3-4. As is indicated-in Table 3-4, relativelyhigh surface water total lead concentrations are observed in all samples withvalues ranging from 0.27 ppm to 0.41 ppm. 'As is indicated in Table 3-4 good.agreement is observed between total and dissolved lead (< 0.45 micron)•analyses. This suggests that- most of the lead in these surface water samplesis in a dissolved phase or attached to extremely fine clay or colloidal sizedparticles (<0.45 microns). • • .
3.1.4 .Groundwater Analyses - .
In .order to assist in the evaluation of the lead mobility study results, alimited groundwater sampling program was conducted. The purpose of this
program was to provide a preliminary characterization of lead concentrations
in site groundwaters. Groundwater samples were collected from several
locations at depths ranging from 10-38 feet. Samples were collected from bothPVC and stainless steel monitoring wells during 5/26/87 - 6/2/87. '
•266217b . . • •
400043

The results of the ground water chemical analysis program are summarized inTable 3-5. The results indicate that at all of the locations sampled,dissolved phase lead concentrations were below detection l i m i t s (<0.01 ppm) <
Total lead concentrations were in most cases also very low (<0..02 ppm)although higher concentrations (0.024 - 0.18 ppm) were observed in certainsamples. The higher total lead concentrations might reflect the entrainmentof some sediment in the samp-les during the collection process. At certainlocations relatively l i t t l e water was available for sampling and difficultiesin obtaining sufficient, sample volume were encountered.
Selected groundwater samples were also analyzed for certain water chemistryparameters i n c l u d i n g total organic carbon, alkalinity, s'ulfate and chloride.These results are also presented in Table 3-5. As is indicated, ground .waterconcentrations of all of these parameters'are relatively low. Total organiccarbon concentrations range from 1.0. ppm to 3.7 ppm for four analyses.Concentrations of sulfate of 52 ppm and 107 ppm were determined in twosamples. Chloride concentrations range from 3.0 to 11.6 p'pm (threeanalyses). Alkalinity concentrations range from 11.9 ppm to 4.1.5 for four
analyses. • . . ' • . . . . • • • •
3.2 ASTM Shake Test and RCRA-EP Toxicity Test Results
3.2.1 ASTM Test Results . . ' .•
The results of the ASTM shake tests (ASTM D3987-81) conducted on each of the •soil samples under study are presented in Table 3-6. As is indicated in Table3-6, the e q u i l i b r i u m aqueous total lead concentrations extracted vary -widelydepending upon the specific soil sample.
The highest aqueous phase lead concentrations were observed for soil samplesSSII T-l (1.22 ppm) SSV-T-4 (1.1 ppm), and SSVI-T-1 (0.82 ppm). Aqueous phaselead concentrations for the remaining surface soil samples range from 0.16 ppm(SSIII T-2) to 0.58 ppm (SSI-T-13). " •
6217b ' . 400044

Aqueous phase lead concentrations in the subsurface soil sample leachates aresignificantly lower. Values range from-0,013 ppm for sample SSSI55N (1-2 ft)to 0.044 ppm for sample SSS7N (5-10 ft).
Overall, the results of these ASTM shake tests indicate that potentiallysignificant lead concentrations (>0.5 ppm) can be leached from at least some
contaminated surface soils. This is of potential Importance since the ASTMtest is considered relatively'non-agressive. That .is, the leaching solution(distilled water) is neither highly acidic or basic and is considered to •provide only mild leaching conditions. This suggests that lead in somecontaminated site soils may be relatively available for leaching.
3.2.2 RCRA EP - Toxicity Test Results
EP toxicity' test analyses were performed on a series of four surface soilsamples including SSVI-T-1, SSIII-T-2, SSI-T-J3 and SSV-T-4. The purpose ofthese.analyses was to determine, whether or not, the surface soils at BurntFly Bog would be considered hazardous under RCRA.
The results of EP Toxicity test analyses are presented in Table 3-7. The-results indicate that none of the four samples which were a-nalyzed would beconsidered hazardous based upon measured leachate lead concentrations which inall cases were less than 0.5 mg/1. In addition, sample SSVI-T-1 was alsoanalyzed for other RCRA metals. None'was found to ex.ceed'the associated
RCRA-EP threshold levels for hazardous waste. It should be noted that due toanalytical difficulties mercury was not analyzed. •
3.3 Lead Adsorption Isotherm Study Results
A lead adsorption isotherm experiment was conducted on subsurface soilSSSI-55N. The purpose of this experiment was to further evaluate the abilityof subsurface soils at the site to attenuate aqueous phase lead. ,
• . - 2 8 . ' • • . • • • • • •6217b • • - . ' • • • ' • " . 400045

Subsamples of air dried subsurface soil SSSI-55N (5-10 ft) were equilibratedwith varying concentrations of dissolved phase inorganic lead ranging from0.005 ppm to 5.0 ppm. Initial solid and aqueous phase lead concentrations aswell as equilibrium aqueous phase lead concentrations are presented in Table3-8.
The results (Table 3-8) indicate that at low to moderate aqueous phase leadconcentrations (less than 1 ppm), this subsurface soil appears to effectivelyattenuate aqueous phase lead concentrations. In experiment three, Initialaqueous phase concentrations of 0.5 ppm are reduced to 0.02 ppm over the 24hour equilibration period.
At higher initial aqueous lead concentrations (1-5 ppm) increased equilibriumaqueous phase lead concentrations (up to 0.4 ppm) are observed. This suggeststhat the subsurface soil attenuation capacity may be somewhat limited in thepresence of very high aqueous lead concentrations.
3.4 Consecutive Batch Desorption Studies
A series of consecutive batch desorption studies were conducted in order toevaluate the desorption of lead from site soils. As discussed in Section2.2.3 these experiments involved the sequential equilibration of contaminatedsoil with fresh distilled water leaching solutions (see Figure 2-2). In'particular, these experiments were intended to simulate the potentialinteractions between lead contaminated surface soils and site surface waters.
3.4.1 Test - 1 Surface Soil SSVI-T-1 ' .
For surface soil VI-T-1, consecutive desorption tests consisting of- sixsequential extractions were run on each of two subsoil samples. Following
29 4000466217b . . ' • • . ' . ' -

equilibration, leachate solutions were analyzed for both total and dissolvedlead and pH. In addition, following each extraction'sol id phase, soilsubsamples were analyzed for total lead. • .
The results are presented in Table 3-9 indicate that both total and dissolvedleachate lead concentrations generally decrease with an increasing number ofsequential extractions. These trends are clearly.demonstrated in Table 3-9and Figure 3-1. '
In Experiment-A, i n i t i a l dissolved phase leaf: concentrations following thefirst extraction decrease from 3.08 ppm to 1.00 ppm following the sixthextraction. .Total lead concentrations decrease from 3.22 ppm following thefirst extraction to 0.84 ppm fol l o w i n g - t h e sixfh extraction'. The similarityin leachate d i s s o l v e d and total lead concentrations suggests that most or.allof the lead is in the dissolved phase (<0.45 micron filter). Leachate pHle v e l s , show evidence of a gradual increase from pH = 2,98 in the firstextraction leachate, to pH = 3.78 in the"sixth extraction 'leachate.
Soil lead concentrations indicate a decrease from an i n i t i a l l y measured v-alueof 3970 ppm. to approximately 2100 ppm. The inconsistent''trend in soil total-lead concentrations appears-to reflect analytical uncertainties related .to thesmall (10 gram) subsamples removed for analysis. ' .
The results, for Experiment-B confirm the Teaching trends' observed in'Experiment-A although leachate. lead concentrations are somewhat - lower.Dissolved phase 1ead .concentrations consistently decrease from 1.07 ppm.following the first extraction to 0.44 ppm following the-sixth extraction.Total aqueous p-hase lead concentrations agree quite well with dissolvedconcentrations and decrease from 1.16 ppm i n i t i a l l y to a final value of 0.42ppm. Leachate pH values increase from an initial value.of 2.98 in the firstextraction leachate to 3:69 ppm in the sixth extraction leachate. These pHvalues are in close agreement with the pH values of Experiment-A. ' ,
The consistency of the increased a.queous pharse dissolved and total leadconcentrations in Experiment-A when compared to Ex'periment-B Indicates, that
this trend is not the result of analytical variations. Rather, th'is trend :
. - • - . - • ' • 3 0 . • • • . • " •6217b • ' . . , - 400047

appears to be due to heterogeneousness in either the concentration and/or
a v a i l a b i l i t y of the lead w i t h i n the two SSVI-T-1 soil subsamples.
3.4.2 Test II - Soil SSV-T-4
A series of consecutive desorption experiments were also performed using soilSSV-T-4. These experiments were run at both 4:1 and 10:1 leachate to soil
ratios. The purpose of varying the l i q u i d / s o l i d ratio was to evaluate theinfluence of leaching conditions on lead mobility.
The results of these experiments are presented in Table 3-10 and Figures 3-2and 3-3.
4:1 IS Ratio Experiments
At a 4:1 LS ratio, i n i t i a l leachate dissolved lead concentrations inExperiment-A were 0.34 ppm in the first extraction. Lead concentrations were
relatively constant in the subsequent leachate extractions (0.14-0.50 ppm)with the-exception of an apparently. anomalous and high value' (2..01 ppm) in'thesixth extraction. • • . . '
The results for Expenment-B are quite similar to those of Experiment-A. •
Leachate dissolved lead concentrations ranged from 0.13 ppm to 0.80 ppm. As
in Exp-eriment-A', leachate lead concentrations are relatively constant and do
not show the decreases with increasing sequential extraction observed for theSSVI-T-1 soil. The consistent and relatively low leachate dissolved leadconcentration in the sixth extraction '(0.40 ppm) suggests that the elevatedresult for Experiment-A sixth extraction is in fact an artifact..
The i n i t i a l lead concentrations in both Experiments-A (0.34 ppm) and B (0.21ppm) are significantly lower than the initial values observed in the two'
experiments of SSVI-T-1 soil. This probably reflects the lower mean total
lead concentration of soil SSV-T-4 (1268 ppm) when compared to soil SSVI-T-1.
6217b .' . 400048

10:1 LS Ratio Experiments •
To evaluate the influence the soi1/leachate ratio on the leaching process, two
consecutive extraction experiments (C and D) were performed using soil SSV-T-4
at a 10:1 LS ratio. The results of these experiments are also presented in
Table 3-10. Overall leaching results for these experiments are quite similarto those of Experiments A and B for this soil. .
For Experiment-C leachate dissolved lead concentrations, range.from 0.-06 ppm to0.33 ppm over the course of .the six sequential'leachate extractions. ForExperiment-D, leachate dissolved lead concentrations range .from 0.18 ppm to
0.56 ppm over the course of the six extractions.
As with the 4:1 LS ratio experiments, results for experiments C and D do notindicate significant increases or decreases in aqueous lead concentrationswith increasing numbers of sequential extractions.
3.5 Serial Batch Extraction Studies
A serial batch extraction study was performed in order to simulate lead
mobility under batch extraction conditions. In these experiments, lead •
contaminated soil (SSVI-T-1) was sequentially, equilibrated with distilledwater at a 3:1 li q u i d / s o l i d (LS) ratio and the resulting aqueous leachate
equilibrated with uncontaminated subsurface soil (SSSI-55N 1-2 ft depth).
Subsequently, the contaminated soil was re-equilibrated with di s t i l l e d waterat 10:1 and 20:1 LS ratios. These leachates were -al so- subsequentlyequilibrated with uncontaminated soil SSSI-55N'(l-2 ft depth). The overallextraction procedure is summarized in Section 2.2.5.
The results of these experiments are summarized 1n Tables 3-11 and 3-12. In
Table 3-11 leachate dissolved phase lead concentrations are presented for theconsecutive leachate/solid phase extraction ratios of 3:1, 10:1 and 20:1. As
is Indicated in Table 3-11 relatively high leachate lead concentrations wereobserved in the initial extractions of the contaminated soil samples. The
maximum observed initial dissolved lead leachate concentration (1.8 ppm) was•
observed for one of.the two soils samples run at a 3:'1 Isachate/solid phase
6217b . . - ' ' . ' 400049

ratio. The contaminated soil leachate lead concentrations differed.considerably between the two subsamples of soil SSVI-T1 which were, tested -andapparently reflects (as in previous batch experiments) sampleheterogeneousness. A t - t h e 3:1 leachate/solid ratio the dissolved phase leadconcentrations were 1.8 ppm (Experiment-1) and 0.40 ppm (Experiment-2)
respectively. - '
As indicated in Table 3-11 a-nd Figures 3-4, 3-5, the leachate dissolved leadconcentrations for the 10:1 LS ratio were lower than those for the 3:1 LSratio. Leachate lead concentrations, for Experiment-1 were 0.623 ppm and forExperiment-2 0.26 ppm. Dissolved lead concentrations showed a small furtherdecrease in the 20:1 LS ration extraction with concentrations of 0.41 ppm forExperiment-1 and 0.23 ppm for Experiment-2.
As is indicated in Table 3-11, the uncontaminated subsurface soil (SSSI-55N1-2 ft depth) appears to s i g n i f i c a n t l y attenuate leachate dissolved leadconcentrations. At the 3:1 LS ratio, leachate lead concentrations werereduced to belov,< 0.02 ppm after the first subsurface soil -extraction andremained below this level after the .second and third extractions. At -the 10:1LS ratio, leachate dissolved lead concentrations were reduced from 0,62 ppm to0.14 ppm and 0.26 ppm to 0.08 ppm respectively after the first extraction.Leachate lead concentrations were reduced to below.0.04 ppm after threeextractions. Clearly, leachate dissolved lead concentrations were not beingas rapidly reduced as they were in the 3:1 LS ratio extraction. This probablyreflects both the increased ieachate volume at the'10:1 LS ratio and the factthat' the uncontaminated soil has been previously exposed to -lead contaminated -leachate. -
At the 20:1 LS ratio (Figure 3-6), leachate dissolved lead concentrations aregenerally s i m i l a r to those observed at the 10:1 LS ratio. Leachate leadconcentrations following equilibration with the first uncontaminated soilsamples are 0.11 ppm for both experiment, one and two. These concentrationsdecrease to approximately 0.02 ppm following the third uncontaminated soilequilibration. ' .
The results for leachate total lead concentration measurements for the 10:1and'20:1 LS ratio equilibration are presented:in Table 3-12 and Figures 3-7and 3-8. In general leachate total lead concentration's, show, good agreement"
33 •6217b ' . 400050

with dissolved lead concentrations. This suggests that most of the lead whichhas been released from the soil to the aqueous phase is in a dissolved orcomplexed form. At the 10:1 LS ratio contaminated soil leac'hate total.leadconcentrations are 0.80 ppm (Experiment-!) and 0.30 ppm (Experiment-2).Leachate lead concentrations decrease to approximately 0.04 ppm following thethird uncontaminated soil sample extraction. The 1'ead concentration's in theleachates following the second 'extraction (0.018 ppm and 0.017 ppm) arerelatively low and suggest tnat the 0.42 ppm valu-e reported for di ssol ved . leadfor the second extraction is probably.high and may represent an "analyticalartifact. .
At the 20:1 LS ratio, total leachate lead concentrations are reduced toapproximately 0.1 ppm after the first uncontaminated soil extraction. Totallead concentrations are subsequently reduced to approximately 0.02 ppmfollowing the third uncontaminated soil extraction.
3.6- Soil Column Studies ~ .
This section presents the results of the.soil column studies .conducted to-evaluate the .downward mobility cf lead into subsurface soils. As issummarized Section 2.2.6 and in Figure 2-5, four soil column experiments wereconducted. Each experiment consisted of a duplicate set of contaminated anduncontaminated soil columns connected.in series. This experimentalarrangement was designed to simulate field leaching, through site surface soilsand into site subsurface soils.. Leachate dissolved and total leadconcentrations were measured following passage through contaminated soil andsubsequently following passage through the.uncontaminated soi1.
3.6.1 Soil Column Experiment - A (Soil SSVI-T-1)
In soil.column experiment-A air dried samples of contaminated soil from sitetransect one (soil SSVI-T-1) were leached with d i s t i l l e d water and the•resulting leachate passed through air dried subsurface soil SSSI-55N .(5-10 ftdepth) which was collected in the field from a depth of approximately five tot e n .feet. • ' ' - . - .
• . • . • 34 ' . ; • • . . • •6217b • • . - . • ' . . _ • . ' • . , ' - . 400051

Contaminated Soil SSVI-T-1
As is indicated in Table 3-13 and Figure 3-9, dissolved lead.levels inleachates from the contaminated soil are relatively hi g h in the i n i t i a lleachate pore volumes. Values reach a maximum of 1.08 ppm in'pore volume ofcolumn 1 and a similarly high value of 0.92 ppm in pore volume 3 of column -1.Subsequently, dissolved lead concentrations show evidence of a gradualdecrease with increasing pore volumes of leachate passed; Dissolved leadconcentrations in the pore volume 19 samples were 0.25 ppm and 0.10 ppmrespectively. • • ' . . '
Total lead concentrations were also measured in certain leachate samples fromthe contaminated soils. As is indicated in.Ta.ble 3-13 and-Figure 3-10leachate total lead concentrations are generally consistent with.the dissolvedlead values. Total lead concentrations range from a maximum value of 0.61 ppmin pore volume 5 of column -1 to a minimum value of 0.20 ppm in pore volume17. In'column 2 total lead concentrations range from 0.14-ppm (pore.volume17) to 0.39 ppm (pore volume 21). Overall, total lead concentrations in column-r] are s l i g h t l y higher than those in column -2.
The leachate contaminated lead profiles for both dissolved and total lead -suggest that overall 'eachate lead levels exhibit a gradual decline with •increased l e a c h i n g with an apparent l e v e l i n g off of leachate leadconcentrations in a range of 0.15 - 0.35 ppm. Therefore, it does not appearthat the reservoir of lead available for desorption is rapidly exhausted. Thesimi l a r i t y in shapes of the total and dissolved lead curves suggests that.mostof the lead which is leached from the contaminated soil is leached in adissolved form. Leachate pH levels are presented in Table 3-rl4. The pH
levels for all pore volumes are quite acidic and range from pH =-2.2 to pH =3.6. There do not appear to be any consistent trends of increasing ordecreasing pH levels, in either column during the course of the experiment.
Uricontaminated Soil SSSI-55N
Dissolved and total lead concentrations in leachates from the uncontaminatedsoil column portions of experiment -A are presented in Table 3-15. Background
6217b . ' 400°52

d i s s o l v e d lead concentrations in columns one and two are 0.005 ppm and 0.009
.ppm respectively. Dissolved lead concentrations in the first leachate porevolume' remain low in column 1 (0.01 ppm) and show increase slightly in column-2 (0.066 ppm). Subsequent lead concentrations are uniformly low throughoutthe course of the experiment and range from the analytical detection l i m i t0.005 ppm to 0.026 ppm. . .
Measured pH l e v e l s for the uncontaminated soil leachates are presented inTable 3-14. As is. indicated, measured1 pH levels are quite consistent andrange from pH 4.1 to pH 4.6 with the exception of two values less than pH =4.0. The pH of these uncontaminated soil leathates appear to be consistentlyhigher by about one pH unit than those of the contaminated soil leachates.
Total .lead concentrations are also consistently low throughout the experimentand range from 0.005 ppm to 0.033 ppm. As is indicated, measured total leadconcentrations do not s i g n i f i c a n t l y differ from i n i t i a l background values..
«,
As .part of the overall characterization of the uncontaminated soil leachates,a series of water chemistry parameters were analyzed for pore volume 4/5-- •.composites.. The results are presented in Table 3-16. As is indicatedchloride and - a l k a l ini ty concentrations are relatively low for all samples (<10ppm). Sulfate concentrations are moderate in the two columns with values of223 ppm and 149 ppm respectively. Hardness leve l s are also moderate withvalues of 72 and 52 ppm. Conductivity l e v e l s . i n the two samples are 340 and270 umhos/cm. Overall, the-se .measurements .indicate the leachate from theuncontaminated soil columns to contain relatively low anion concentrations andto apparently be of relatively low ionic str-ength.
Measurements of total organic carbon (TOO were also made'on uncontaminated-soil leachates and are presented in Table 3-17. The-results., for Experiment Aindicate that moderate TOC concentrations are present in the pore volume 2samples (197 ppm and 261 ppm) for columns -1 and -2 respectively.' TOCconcentrations subsequently decrease to relatively low concentrations (<30 'ppm) in all subsequent pore volumes. These-results suggest that most readilyavailable or soluble carbon is rapidly removed from the uncontaminated. soil.
The results also suggest-that dissolved organic'carbon from the contaminatedsoil column does not continuously leach through the uncontaminated soil.' : • ' ' . . " ' ; • • ' - ' " ;
. • 36 . 4000536217b• • ' ' ' ' . - - . ,

3.6.2 > Soil Column Experiment - B (Soil PVCII-T-1)
In soil column Experiment-B, field moist surface soil samples PVCII-T-1 andPVCIII-T-1 collected along site transect T-l were leached in-situ. Thesesoils were collected as the hand driven PVC equivalents of shelby tubes.Samples were shipped to the laboratory and leached in the PVC tubes directlyas collected. The purpose of this experiment was to simulate as nearly aspossible actual field leaching conditions and to evaluate the possible effectsof air drying and column packing on lead mobility.
Contaminated Soil Leachates
The results of leaching the contaminated soil columns -T and -2.are presentedin Table 3-18 and Figure 3-11. In both columns, i n i t i a l dissolved phase leadconcentrations (1.17 ppm and 0.68 ppm) in first pore volume were quite high.However, d i s s o l v e d phase lead concentrations decrease rapidly in 'subsequentpore volumes. Concentrations in pore volume 3 samples are '(0.057 ppm and0.036 ppm) respectively. Dissolved lead-concentrations remain low .(less than0.1 ppm)'in all of the remaining pore volume samples. From .pore volume threeto pore volume 21, dissolved lead concentrations appear relatively constant'.
Total lead concentrations (Figure 3-12) display somewhat greater scatter thanthe dissolved phase concentrations. In pore volume 5 total leadconcentrations are 0.30 ppm (Column 1) and 0.029 ppm (Column 2). As with thedisso l v e d phase data, to-tal lead concentrations-do'not show any consistenttrend with increasing leachate volume. The scatter in the total leadconcentrations in pore volumes 5-21 may reflect some carry over and analysisof soil particles during the sampling procedure. • •
Initial background pH l e v e l s (Table 3-19) .of the site ground water used as aleaching solution were pH = 6.8. The pH levels in- pore volumes 1-21 arerelatively consistent and range from pH 6.1 - 6.6 (Table 3-18). The pH- ofthese leachates are somewhat greater than those observed for the contaminatedsoil leachates of experiment-A. This may reflect the higher pH of sitegroundwater and possibly a greater buffering capacity than d i s t i l l e d water.
. 37 • . . ' 4000546217b " ' • • • - . - . • -

Uncontaminated Soil Leachates . •
The results for dissolved and total lead analyses for the uncontami'nated soilleachates are presented in Table 3-20. As is indicated dissolved leadconcentrations are low in all pore volumes. Concentrations range from thedetection limit (0.005 ppm) to 0.025 ppm. There is no evidence of any.consistent trends in lead concentrations with increasing leachate volume.
Total lead concentrations are very low and quite similar to the dissolvedphase concentrations. Values range from 0.005 ppm to 0.012 ppm. As with thedissolved phase concentrations, total lead levels do not indicate anyconsistent increases or decreases with increasing leachate volumes.
The pH.levels for leachates from the uncontaminated soils (Table 3-19) aresomewhat variable and range from pH 6.4 to pH 4.2 wi'th most values between pH5.1 and pH 5.8. The uncontaminated soil leachate pH levels are somewhat lowerthan those of the contaminated soil leachates. The reason for this is 'uncertain. Uncontaminated soil leachate TOC concentrations (Table 3-17) aresimilar to experiment A. Values decrease from 413 ppm and 326 ppm'in porevolume 2 to less than 20 ppm in pore volume 19. .
3.6.3 Soil Column Exoeriment-C (Soil SSV-T-4)
In this experiment air dried soil SSV-T-4 was leached with distilled waterwhich was subsequently passed'through air dried uncontaminated soil SSSI-55N.
Contaminated Soil SSV-T-4
The results of dissolved and total leachate lead concentrations.forcontaminated soil SSV-T-4 are presented in Table 3-21 and Figures 3-13 and3-14. ' • • • ' • • • ' .
Dissolved phase lead concentrations in the Initial pore volumes of columns -1and -2 are 0.037 ppm and 0.05 ppm respectively. Values in the subsequentleachate pore volumes are relatively constant and range from 0.028 ppm to
. ' 386217b .

0.064 ppm in both columns. Leachate lead concentrations do not appear todemonstrate any consistent increasing or decreasing trend with increasing
leachate volume.
Total lead concentrations are generally similar to the dissolvedconcentrations with the exception of pore volumes 3 and 5. Total leadconcentrations in duplicate samples for pore volumes 3 and 5 range from 0.079ppm to 0.414 ppm. Total lead -concentrations in the remaining pore volumes arelow and range from 0.01 - 0.046 ppm. ..
The pH levels in the contaminated soil leachates are presented in Table 3-22.Values are generally consistent and range from 2.6 to 5.5 with most valuesranging from pH 4.5 - 5.5. It is uncertain whether the more acidic readingsfor pore volumes 15 and 24 represent a real trend or an experimentalartifact. Initial leachate TOC concentrations (Table 3-17) decrease from 98ppm and 255 ppm to less than 20 ppm in pore volume 19.
Uncontaminated Soil SSSI-55N
The results for the uncontaminated soil SSSI-55N leachates for experiment -Care presented in Table 3-23. ' .
Dissolved lead concentrations are uniformly low throughout the experiment. Amaximum value of 0.05 ppm is observed for the first pore volume of column -2.Values for all other pore-volumes range from the detection limit 0.005 ppm to0.021 ppm. Total lead concentrations are similarly low for all pore volumesand range from 0.006 ppm to 0.01 ppm.
PH values for these uncontaminated soil leachates are relatively uniform andi
range from pH - 3.9 to pH - 4.9. These pH values show no evidence ofconsistent increase or decrease during the experiment.
3.6.4 Soil Column Experiment-D (Soil PVCI-T-2)
In this experiment field moist surface soil samples PVCI-T-2 and PVCII-T-2,were leached in-situ. These soil samples were collected as hand driven PVCequivalents of shelby tubes, shipped to the laboratory and Veached 1n the PVC
. • 39. • . • •62l7b • 400056

tubes directly as collected. The methodology employed was Identical to soil
column experiment-B and. intended to simulate field l e a c h i n g as close by as'
possible.
Contaminated Soil PVC II-T-1/2 ' . .
The results of leachate dissolved and total lead concentrations for the
contaminated soil tubes are 'presented in Table 3-24 and Figures 3-15 and3-16, Dissolved phase lead concentrations are uniformly low throughout -theexperiment and range from 0.01 ppm to 0.023 ppm. (Due to analytical-difficulties several samples were not analyzed.) Total -lead concentrationsare also consistently low (Table 3-24) and range from 0.01 ppm to 0.039 ppm..
The s l i g h t l y higher total lead concentrations when compared to the dissolvedlead concentrations may reflect small amounts of particulate matter carriedover into the sample collection device. . •
Con.taminated soil leachate pH l e v e l s are'presented in Table 3-25. As isindicated, pH values are relatively acidic although quite variable. Reportedvalues range from pH.= 2.0 to pH- = 6.1.' The reason for'the wide range In- .contaminated .soil p H values i s uncertain. . ' ' . . - ' •
Uncontaminated Soil PVC-55N .
The uncontaminated PVC tubes used in this experiment were/collected from
shallow subsurface s o i l s (1-2 ft) at location 55'N where low soil leadconcentrations have been reported.
Dissolved phase leachate lead concentrations are presented in Table 3-26.
Concentrations for both columns are uniformly low and range from 0.01 ppm to
0.049 ppm with most values below 0.02 .ppm. . Total lead concentrations aresimilarly low and range from 0.01 ppm'to 0.024 ppm. These low leachate lead
concentrations suggest that soil lead concentrations are relatively .low.
pH levels for these uncontaminated soil leacnates are relatively uniform andrange from 4.3 to 6.2.- These values are somewhat'more-consistent and higher
• . -40 • - 40005762.17b . ' • • ' . • • • . . • " ' • •

(more basic) than the range of pH values observed for. the associatedcontami nated soi1 . •
Analyses for selected water quality parameters (Table 3-27)'for uncontaminatedleachate pore volume 4/5 are generally low. Chloride, hardness, a l k a l i n i t yand sulfate concentrations are all less than 3'0 ppm. Conductivity values aremoderate (193 and 200 umhos/cm).
Total organic carbon (TOO concentrations in .uncontaminated soil leachatesfollow the pattern of the other soil column experiments. Elevated values areobserved in pore volume two for both column one (290 ppm) and column two (346pp'm). In both columns TOC values significantly diminish in the subsequentpore volume samples. • ' .
3.7 Total Soil Lead Concentrations and Particle Size
Several experiments were conducted to evaluate the correlation between soilparticle size and total lead concentration. In these experiments subsamplesof several of soil'Samples were air dried and .then seived to separate thecoarser sand fractions (>74 microns) from the very fine sand s i l t and'clayfractions (<74 microns). Following separation both fractions were analyzedfor total lead.
The results of these experiments (Table 3-28) indicate that for all of thesoil samples tested, the total lead concentration is strongly dependent uponthe soil particle size. For soil sample SSVI-T-1 total lead concentration'sfor the coarse particle fraction are 2160 and 3010 ppm 'respectively (mean 2585ppm). However, for the fine particle fraction total lead concentrations -aremuch higher (mean 11,850). Similarly dramatic increases are observed for soilsample SSI-T-13 with a mean coarse fraction lead concentration of 741 ppm anda mean fine particle- fraction concentration of 2,270.ppm. The highconcentration of-lead in the fine particle fraction of soil SSII-T-1 suggests.very highly contaminated soil.
. 4 1 . . ' . . - ' 4000586217b • • • • • . - . • . - . . .

3.8 Lead Speciation and pH Extraction Studies
In order to better understand the chemical behavior and mobility of lead in
the Burnt Fly Bog surface s o i l s , a series of lead speciation .and
extractability studies were performed. These experiments were performed by
Dr. John Trefry at the Fl o r i d a Institute of Technology. The specific goals of
these experiments were t o : . • - . • ' •
o characterize the chemical b i n d i n g of -lead in selected site' soils and
its l i k e l y influence on lead m o b i l i t y , and to .
o evaluate the influence of pH changes on lead extractability in site
surface s o i 1 s • ' .
This section summarizes the p r i n c i p a l re-suits of these studies.
3.8.1 Lead Speciation Studies '- .
A series of sequential s e l e c t i v e extraction experiments were performed'on.
subsamples of five site s o i l s (SSVI-T-1, SSIII-T-2-, , SSIV-T-3, SSV-T-4,
SS.IT-13 and SSSI-55N). - ' "' ' . . '
Each of the s e l e c t i v e extraction experiments which was performed was designed
to assist in determining the relative .amounts.of lead which were bound to
specific soil fractions in each of the soil, samples.
.The selective extraction experiments which were performed i n c l u d e d thefollowing: . . .
o Hot water extraction - to determine the readily soluble lead fraction.
o Ammonium chloride'extraction to determine-the exchangeable lead
.-fraction. '
o Citrate-dithionate extraction - to determine the lead fraction
associated .with.free iron oxides. . - ' • • ' . • * • • .
6217b '. - ; . 400059

o 6M HC1 and EDTA Extractions - to determine the lead fractionassociated with sulflde/oxlde and organic phases.
o Aqua Regia Extraction - to determine the residual lead fraction.associated with the soil silicate matrix.
Each soil sample was subjected to each of these extraction solutions 1n aconsecutive leaching sequence.' It should be emphasized, that these wetchemical selective extraction procedures are not exact. That 1s, they wereIntended to provide only a general estimation of the relative amounts of leadassociated with specific soil phases.
Hot Hater Extractions • ' '
Samples of each of the six soil samples were leached with hot water (70°C) todetermine the readily water soluble soil lead fractions. The results of thisexperiment are presented in Table 3-29 and Figure 3-17 in terms of the amountof lead removed per unit weight of soil.
As is indicated in Table 3-29 the highest lead concentrations were removedfrom soil samples SSV-T-4 and (7.6. ppm) and SSI-T-13 (4.8 ppm). Lower leadconcentrations were removed from sample SSVI-T-1 (2.3 ppm). As expected thesubsurface soil SSSI-55N showed very little leaching of lead with only 0.01ppm of lead removed.
The initial lead concentrations for each of the subsamples which wereextracted are included in Table 3-29. The concentration of the subsamples arein general agreement with those used in the batch and column studies with theexception of sample SSV-T-4. The differences for this sample appear to be'dueto significant heterogeneousness in the original soil sample which were notcompletely removed by Initial sample mixing.
1.0 Ammonium Chloride Extraction
Samples of each of the six soil samples selected for study were extracted withammonium chloride (NH4C1). Studies have shown this extractant to remove
43 • . • • 4000606217b •
I • . . . • - . . . - . . . . .

exchangeable lead from s o i l s . The results 'of these experiments are presented
in Table 3-29.
As is indicated the amounts of lead released from each soil are significantlygreater than for the hot water extraction treatment. The maximum leadconcentration removed is observed for soil SSV-T-4 '(441 ppm) with a high
concentration (185 ppm) also observed for soil SSI-T-13. Lower although s t i l lelevated '1-eachate lead concentrations were observ.ed for soils SSVI-T-1 (103.ppm) and SSIII-T-2 (93 ppm). It should be noted that soil SSI-T-13 released
more lead under this treatment than the1SSVI-T-1 sample although the totallead concentration of the SSVI-T-1 sample (mean 2770 ppm) is much greater than
that of the SSI-T-13 sample (mean 514 ppm). .
Q.Q1N Ammonium Chloride Extraction • •
To better s i m u l a t e the relatively low ionic strength.of site surface waters,soil samples were also extracted with 0.01N ammonium chloride. The results of
these experiments ?.re included in Table 3-29 and Figure 3-18.
As is i n d i c a t e d , the 0.01N ammonium chloride extraction solution removed 15-50
times less lead from the contaminated soil samples than did the 1.0'N-ammoniumchloride solution. The pattern of removal was, however, i d e n t i c a l . The
maximum lead concentration removed was observed for soi1•sampVe SSV-T-4 (14.8
ppm) with.a lower concentration observed for .soil sample SSI-T-13 (7.5 ppm).-
The lead concentration removed from soil sample SSVI-T-1 (5.5 ppm) was againless than that of soil SSI-T-13. Essentially no lead was leached out of the
SSSI-55-N (5-10 ft) subsurface soil. This result suggests that l i t t l e or noreadily a v a i l a b l e lead is present in contaminated site subsurface soils.
In addition to the 0.01 N ammonium chloride extraction, potassium phthalate
buffer extractions were run at pH 4 and pH.7 respectively. The results 'of
these extractions are included in Table 3-29.. The lead concentrations removedat pH 4 are less than those observed for 1.0 N ammonium chloride leachatesalthough greater than those observed for 0.01 N ammonium chloride. The
maximum lead concentrations removed are observed for s'oi 1 sample SSV-T-4 (296
6217b

ppm). At pH 7 leachate lead concentrations are approximately a factor of fourlower than those for the pH 4 buffer. The maximum lead concentration removedis again observed for soil SSV-T-4 (50 ppm).
Citrate-Dithionite Extraction
Each soil sample was treated with a citrate sodium dithionite extractionsolution. This extracting solution removes free iron oxide components fromthe soil samples and provides a measure of the soil lead fraction which isbound to these components.
The citrate-sodium dithionite extracting solutions removed one to six weightpercent iron from each of the soil samples. The amounts of iron removed aregenerally typical for clay rich soils. Overall approximately 86r95 percent ofthe total iron present in the each soil sample was removed. This indicatesthat most of the iron present in the site soils is present as free iron oxides.
The results of the citrate-sodium dithionite extractions for lead are.summarized in Figure 3-19 in terms of the amount of lead removed per unitweight of soil.- As is indicated the amount of. lead released from thecontaminated soil samples ranged from 60-120 ppm (mg/kg). In theuncontaminated SSSI-55N (5-10 ft) sample approximately 12 ppm of lead wasreleased. The highest concentrations of were removed from samples SSV-T-4 andSSVI-T-1. Overall for the contaminated soils only about 2-18 percent of thetotal soil lead was removed by the citrate-sodium dithionite treatment.
6N HC1 and EDTA Extractions .
Following the citrate-sodium dithionite extraction sequence an effqrt was madeto evaluate the total amounts of lead which were bound to soil sulfide andorganic phases. This was attempted through the use of 6 N HC1 and EDTAextractions.
62175 ' • " 400062

As is indicated in Table 3-30 and Figure 3-19 the amounts of lead removed bythe HC1 leach varied dramatically from sample to sample. Large amounts oflead were removed from.soil samples SSV-T-4 (approximately 2000 ppm) andS'SVI-T-1 (approximately 1500 ppm). By comparison less than 300 ppm wasreleased from the other contaminated soils and only about 4 ppm from theuncontaminated SSSI-55N (5-10 ft) sample.
The amounts -of lead released from the SSVI-T-1 and SSV-T-4 samples by thisacid treatment are unusually high compared to results for most natural soijs.It is possible that all of the lead released from these two soils by thismethod may not only be in a sulfide phase but may also be in a resistant oxidephase.
Following the 6N HCL extraction, the soil samples were extracted with 0.05 NEDTA solutions. In addition, separate soil samples, not previously extractedwere subjected to a 0.05 M EDTA extraction. The results of these extractionsare also presented in Table 3-30. As is indicated, in all cases the 0.'05 MEDTA solutions extracted more lead from the fresh soils than from thepreviously extracted soils. • ••' ' ' •
For the "fresh" soil samples, the maximum amount of lead was removed fromsample SSV-T-4 (1740 ppm). For the previously extracted soils the maximum .amount of lead was also removed from sample SSV-T-4 (626 ppm). Based onprevious .work it is believed that the 'lead extracted from the fresh soilsamples probably represents a better estimate of the amount of lead actuallybound to organic matter in site soils.
In an effort to better reconcile the differences between the two EDTAextraction results, the estimated organic fraction was recalculated based onthe following equation .
Organic fraction - (Pb EDTA*) - (Pb in Hot Water) -.(Pb in Hot NH4 CD
The rationale for this equation is that the fresh soil EDTA may have alsoremoved 'water soluble and. extractable lead. These revised values.are includedin Table 3-30. In addition, a revised sulfide/resistant oxide (SRO) fraction,calculation was made based on the following equation:
• • 400063• 4 6 • ' • • • •
6217b ' . • . . . ' • ' • . , . . .

SRO - (6N HC1 Pb) - (Organic Pb) - (EDTA Pb)
This equation adjusts the sulfide resistant oxide lead phase for the possible6N HC1 extraction of some lead associated with organics. The results of thiscalculation presented in Table 3-30 suggest that the sulfide/resistant oxidelead component is quite variable and somewhat uncertain but probably small formost contaminated site soils.
Aqua Regia Extraction
In the final sequential extraction which was performed on the site soilsamples aqua regia (concentrated nitric acid/sulfuric acid) was used toextract lead from the soil silicate matrices.. The results of this extractionare presented in Table 3-30 and Figure 3-20. Overall, the lead component ofthe respective silicate matrices is small with significant amounts of leadreported only for soils SSV-T-4 (approximately 700 ppm) and SSVI-T-1(approximately 150 ppm). The remaining values are much less:than 100 ppm. Inreality, it is likely that the values for the SSV-T-4 and SSVI-T-1 samples .represent .significant over estimates of the actual amounts of residual'leadassociated with the silicate matrices. Due to the very large amounts of leadini t i a l l y present in these samples, the reported residual .values probablyreflect lead which was not completely removed by the preceding treatments. •
3.8.2 Pti and Lead Leaching From Soils
A detailed series of experiments were conducted to assess the influence ofsolution pH on lead leaching from site soils. The purpose of theseexperiments was also to determine how changes in the pH of site waters mightinfluence future leaching of lead.
Each of the soils under study were leached 1n 48 hour equilibration experimentsusing a series of buffered solutions at pH levels ranging from pH 2.2 to.pH 7.This pH range was selected to reflect the acidic nature of site surface soils.
6217b • ' . . " . 400064

The results of these pH leaching experiments are summarized in Table 3-31.For all six soil samples, the amount of lead leached from the individualsamples decreased as the pH increased (became more basic). However, theamounts of lead released .and the sensitivity of lead release to pH changesvaried considerably from sample to sample.
As is indicated in Figure 3-21 the largest total amounts of lead released atany given pH were from the contaminated SSV-T-4 sample with over 1000 ppmreleased at pH 2.4. .However, the largest percentages of total lead whoserelease is pH dependent were found in samples SSI-T-13 (76,6 percent) andSSIV-T-3 (74.9 percent). Thus, although lower total amounts of lead arepresent in these samples, greater percentages of the lead which is present aresubject to pH dependent release. •
The sensitivity of the respective soils to pH induced lead release is alsodepicted in Figures 3-13. It can be seen that the SSVI-T-1 soil sample isLess sensitive to changes in pH with the amount of lead decreasing only.gradually as the pH is increased from approximately pH 2 to pH 6.By contrast lead release from soil samples SSIV-J-3, SSV-T-4, SSI-T-13 and •SSSI-55N (5-10 ft) appears to be highly sensitive to pH changes with abruptdecreases in lead release as solution pH levels increase from pH 2.4 to pH.6.5.
Overall, these results indicate that lead release from many site surface soilsis likely to be relatively sensitive to pH solution changes. This is .potentially significant since .as previously indicated site soil pH levels aregenerally in the pH 3 to pH 5 range.
Kinetics of pH Leaching
Several experiments were conducted to assess changes in lead leaching withtime for soil samples SSIV-T-3 and SSV-T-4. The amounts of lead released atvarying reaction times ranging from 0.5 to 96 hours was investigated-atsolution pH 3 and also pH 5. The results of these experiments are presentedin Table 3-32 and Figure 3-22. The results of.these experiments Indicate thatat pH 5 -the reaction process appears to be quite rapid for both soils. Thatis , - e q u i l i b r i u m between aqueous and solid phase lead .components 1s achieved
6217b '. • . • 400065

within the first hour with little or no subsequent reaction. However, at pH3, the amounts of lead released from both soil samples appear to increase withincreasing reaction time. This trend is quite pronounced for the highlycontaminated SSV-T-4 soil sample. This result suggests that acidic reactionconditions favor the slow long term release of lead from this and potentiallyother contaminated surface samples.
3.9 Soil Extraction Studies .
A series of soil extraction studies were performed to further assess theavailability of lead with respect to mobility and to provide a preliminaryevaluation of EDTA extraction as a potential soil treatment.methodology.
In these experiments samples of contaminated soil SSVI-T-1 were equilibratedwith sodium EDTA and certain other complexing agents (hydroxylaminehydrochloride and sodium citrate/citric acid) under varying experimentalconditions. The results of these experiments are presented as follows.
3.9.1 Extracting Agents and Lead Removal from Soils
The results of several experiments to assess the effectiveness of selectedextracting agents in removing lead from site soils are summarized in Table •.3-33 and Figure 3-23. These results indicate that among the chelating agentstested on site soil SSVI-T-1 sodium ethylenediaminetetracetate (EDTA) wasfound to be the most effective in extracting lead from site soils. As isindicated in Table 3-33, dissolved lead concentrations in 0.1M EDTA extractingsolutions were 43.3 ppm and 35.9 ppm in duplicate samples. By contrast .dissolved lead concentrations 1n blank distilled water experiments were,approximately 0.01 ppm in duplicate samples. More dilute (O.OTM) EDTAsolutions were somewhat less effective in extracting lead from soil SSVI-T-1.Dissolved lead concentrations in duplicate experiments were 10.3 ppm and 10.4ppm respectively.
For comparison purposes samples of soil SSVI-T-1 were also extracted with twoother extracting solutions (hydroxylamine hydrochloride and sodiumcitrate/citric acid buffer). Both solutions have been,previously found to
49 . 4000666217b ' .

extract lead from soil solutions (Traver, 1987). As indicated in Table 3-32,lead concentrations in duplicate 0.1M hydroxlamine hydrochloride solutionswere 7.5 ppm and 8.9 ppm respectively. These concentrations are somewhat lessthan the concentrations extracted using 0.01M EDTA. Lead concentrations induplicate 0.1M sodium citrate citric acid buffer solutions were 5.5 ppm and8.9 ppm respectively. These values are similar to those observed for thehydroxylamine hydrochloride solution and again less than those observed for0.01M EDTA. • . :
As is indicated in Table 3-33, all three of the extracting solutions used inthis i n i t i a l experiment were relatively acidic. For comparison purposes, asupplemental experiment was conducted in which a basic solution of 0.1MEDTA/0.1M NaOH was used for extraction. The results of this experiment arepresented in Figure 3-24. Unfortunately, as is indicated, the acidic natureof site soil SSVI-T-1 neutralized the pH of the extracting solution resultingin a final leachate pH of 4.6 - 4.9 for duplicate samples. Nevertheless, theresults suggest some increase in the lead concentration of the extractingsolution. Leachate lead concentrations were 56.1 ppm and 83.6 ppmrespectively. This would be consistent with equilibrium constant equationsfor EDTA which indicate stronger complexing of lead at higher pH.
3.9.2 Variations in Lead Extractabilitv from Site Soils
An experiment was conducted to compare the ability of 0.1M EDTA to extractlead from several different site soils. The results of this experiment arepresented in Table 3-34' and Figure 3-25. As is indicated in Table 3-34somewhat greater amounts of lead were extracted from subsamples of soilSSV-T-4 and SSII-T-1 than from soil sample SSVI-T-1. Lead concentrations inleachate samples from soil SSV-T-4 were 92 ppm and 143 ppm, respectively.Lead concentrations in leachate samples from soils SSII-T-1 were 225 ppm and295 ppm respectively. For both soils 'SSV-T-4 and SSII-T-1, variations 1n theleachate lead concentrations appear to be consistent with variations 1n themeasured total lead concentrations of the solid phase soil subsamples used inthe respective experiments.
Also Included in Table 3-34 are measurements of dissolved iron 1n the leachatesamples from each of the three soils. As is Indicated in Table 3-34, the
•50 . 400067.62176. • ' . . ' ' •

order of increasing amounts of iron being extracted from site soils differsfrom that of lead. That is relatively high' concentrations of dissolved irond.,100 ppm and 903 ppm) are present in the leachate samples from soilSSVI-T-1 . Conversely, somewhat lower concentrations of iron (296 ppm and 319ppm) are observed in the leachates from the SSII-T-1 soil sample. This occursdespite the fact that much higher concentrations of lead are observed in theleachates from the SSII-T-1 soil sample.
3.9.3 Effects of Re-extraction on Lead Removal
The SSVI-T-1 soil subsamples used in the initial 0.1M EDTA experiment werere-extracted with additional 0.1M EDTA and subsequently distilled water. Thepurpose of this experiment was to determine whether additional extractioncycles could remove additional lead from site soils. The results of this.experiment are presented in Table 3-35 and Figure 3-26. As is indicated inTable 3-35 leachate lead concentrations in the initial soil re-extractionusing additional 0.1M EDTA are 20.8 ppm and 18.7 ppm respectively, thesevalues are approximately a factor of two lower than the leachate leadconcentrations (43.3 ppm and 35.9 ppm) in the first 0.1M EDTA.extractioa.
Following the second 0.1M EDTA extraction, the soil was re-extracted fiveconsecutive times using d i s t i l l e d water. The purpose of this experiment wasto determine whether any lead would be leached from the soil by distilledwater or by analogy site surface water following EDTA extraction.
•
As is illustrated in Figure 3-26 leachate lead concentrations in the first'distil l e d water extraction experiment (24.8 ppm and 22.2 ppm) wereapproximately the same as the values in the preceding 0.1M EDTA extraction.In addition, leachate lead concentrations 1n the second distilled w,aterextraction experiment (20.1 ppm and 19.1 ppm) were also approximately the sameas those of the second 0.1M EDTA experiment. In the subsequent distilledwater extractions, leachate lead concentrations gradually decrease to valuesof 1.9 ppm and 0.6 ppm in the two leachate samples from the fifth distilledwater extraction. The reason for the continued leaching of lead by distilledwater is uncertain. EDTA may remove soil components (such as Iron) which bindwith lead, as well as lead itself. This could reduce, the strength of lead•binding to the soi 1 . : •
6217b ' ' 40°068

TABLE 3-1
TOTAL Pb CONTENT OF BURNT FiY BOG SOIL SAMPLES
MEAN .IQIAL_LEAD(1)
(mg/kg)
SOIL SAMPLE • •
SSI-T-13 764
SSII-T-1 . 1190
SSIII-T-2 ' - 4 6 7
SSIV-T-3 " 289
SSV-T-4 . 1268 ' '
SSVI-T-1 ' • ' 2617
SSSK55N) (5-10 feet) ' .48
SSSK7N)' • 55
SS'K55N)(l-2 feet) . 62 ."
Mean value of three subsample lead analyses. Values less than thedetection l i m i t for subsurface- soils are assumed equal to thedetection limit.' All concentrations in ppm (mg/kg).
..*
6205b ' . - . ; • - • 400069
. • • - . - . 5 - 2 • • ' • ' ' -

TABLE 3-2
CHEMICAL PROPERTIES OF SOIL SAMPLES
171
SOIL SAMPLE
SSI-T-13
SSII-T-1
SSSIII-T-2
SSIV-T-3
SSV-f-4
SSVI-T-1
SSSI(55N)(5-10)
SSSI 55NO-2)
SAMPLE DEPTH
(ft.)
0-1
0-1
0-1
0-1
0-1
0-1
5-10
1-2
_fiH_
3.96
5.84
4.05
3.40
4.34
N0(5)
4.6
ND<5)
PERCENT^)SOLIDS
53.9
82.3
41.4
66.0
28.0
69.1
71.9
72.7
(2)CEC
(meq/lOOg)
57.6
44.5
ND(5)
ND<5)
41.5
44.9
44.6
ND<5)
TOTAL IRON
(mg/kg)
20,900
3,900
50,900
67,600
59,600 -
17,900
11,400
ND<5)
TOTAL 'MANGANESE
(mg/kg)
<12
<7.8
13
9.8
<22
<10
14
ND<5)
(3)TOC
(mg/kg)
115,000
12,400
169,000
69,200
333,000
40,000
17,100
1 7 , 600
('LIO
0.44
0.20
3.76
3.39
1.56
0.28
0.98
ND(
(^Mean of. three samples.
(2>CEC - Cation Exchange Capacity. Mean of.two samples.
<3>TOC -Total Organic Carbon.
(4)FIO - Free Iron Oxides - Values listed in per cent.
<5)flD. = Not Determined.
6205b
•&.ooo-Jo

TABLE 3-3
PHYSICAL 'PROPERTIES OF SELECTED BURNT FLY BOG SOILS
SOIL SAMPLE.
SSSI 55N (5-10)
SSVI-T-1
SSII-T-1
SSI-T-13
PERCENTSAND
85
92
95
85
PERCENTSILT
12
5
4 '
13
PERCENTCLAY TEXTURE
3
3
1
2
Loamy Sand
Sand
Sand
Loamy Sand
62055
54
400071

TABLE 3-4
CHEMICAL PROPERTIES OF BURNT FLY BOG
SURFACE HATER SAMPLES
TOTAL LEAD .
0.408
0.402
0.271
0.294 .
DISSOLVED LEAD
0.406' •
0.409
0.285 . '
0.329 .
SAMPLE
A
B
C
D
Surface water samples were collected in the stream that originatesnear transect 13 in the western edge of the Westerly' Wetland. Allconcentrations in ppm.
' 62055 • - ; . ' 400072
55

TABLE 3-5
en
LWALEJLSAMPLE
7N-I
7N-D
17S
25S
28SA
28SB
39S
'41 S
41S-DUPLICATE
43SA •
43SB
48S-I ' '
48S-D .
49S
WFB-3 (FIELD BLANK)
WFB-4 (FIELD BLANK)
WELL DEPTH( f t . )
17.5
38.0
10.0
' 10.0
10.0
12.5
10.0
. 10.0
10.0
10.-0_ ( 1 )
17.5
38.0
10.0 .
IOTA.L_Pb
<0.010
0:170
<0.010
0.015.
0.010
0.059
0.024
<0.010
0.117
•0.183
0/149
<0.010
<o!oio
0.051
.
-
CHEMICAL PARAMETER .'DISSOLVED_£b TOC ALKALINITY. SULFATE
<0.010 " - • - '
<0.010 - .- -
<0.010 - -
<0.010 - - -
<0.010 - - ' •-
<0.010 . 3.7 33.2 107
<0.010' : - - -
<o.oio • - ' • ; - .<0.010 . - - -
<0.010 <1.0* 41.5
<0.010 <1.0 24.9
<0.010 - - : ' • • -
<0.010 - - -
<0.010 <1,0 11.9 52.1
<0.010 ' - : . - - ' -
<0.010 . - .
CHLORIC
_
-
-
-
.-
11 .6
-
-
.
3.0
3.9
-
.
6 .1
.
_
- 1) = Dash (-) indicates not analyzed. .All concentrations in ppm..ooo-J
6205b

TABLE 3-6
ASTM SHAKE TEST RESULTS^
SOIL SAMPLE
SSI-T-13
SSII-T-1
SSIII-T-2
SSIV-T-3
SSV-T-4
SSVI-T-1
SSS 55N (5-10)
SSS 7N (5-10)
SSS 55N (1-2)
TOTAL Pb
0.581
1.22
. 0.163
0.497
1.11
0.823
0.014
0.044
0.013
All concentrations in ppm. Detection limit of total lead is 0.005 ppm.
4000746205b 57 •

TABLE 3-7
RCRA-EP TOXICITY TEST RESULTS
Parameter Sample
Arsenic
Barium
Cadmi urn.
Chromium
Lead
Selenium
.Silver
bbV.i-I-l SSIII-T-Z
<0.5
<10 -
<0.1
<0.5-
<0.5 . <0.5
. <0.1
<0.5 - . - . ' .
5SI-T-13 SSV-T-4
-
• - ._
-
<0.5 . <0.5
. -
.
NOTES:
All concentrations' in mg/1
Dash indicates not analyzed.
4000756205b ' . • . • • • • • '
• • - * " • • > " .
• - . ' • • ' 5 8 ' - ' - • . . ' .

TABLE 3-8
LEAD ADSORPTION ISOTHERM STUDY
SUBSURFACE SOIL SSSI-55N (5-10')
INITIAL SOIL LEAD INITIAL AQUEOUS PHASE EQUILIBRIUM AQUEOUS PHASEEXPERIMENT CONCENTRATION LEAD CONCENTRATION LEAD CONCENTRATION
( m g / k g ) . ' (mg/L) . (mg/L)
1 14 . • 0.005 <0.0100.005 <0.010
'.2 14 0.2 0.0130.2 0.015
3 14 0.5 ' 0.0210.5 0.022
4 14 1.0 Q.121.0 <0,010
5 14 5.0 0.4215.0 0.415
NOTE -.Equilibration time of 24 hr was used, A 5:1 liquid to soil ratio wasmaintained- during equilibration. •
6205b
' 59

TABLE 3-9
Extraction
Experiment A
123456DW Blank
Experiment B
123 '456DW Blank
CONSECUTIVE BATCHSURFACE SOIL
Soil LeadConcentration
397028503513
. 306919302138~
3610 ' •2950273617772513 - .2791'-
DESORPTIONSSVI-T-1(1)
pH
2.983.454.143.263.473.785.37
2.983.273.953.273.413.695.37
STUDY
LeachateDissolved
Lead
3.082.791.631.36 '1.271.00~
1.07 •0.710.39 .0.-350.35
. . 0.44
lotaiLead
3.222.611.631.90
• 1,140.84<0.001
'• 1.16.0.76
_' •0.760.36.0.42<0.01
(1) All concentrations in ppmDUP = DuplicateDW = Distilled Water
62Q55' 60.
400077

TABLE 3-10
CONSECUTIVE BATCH DESORPTION STUDY
SURFACE SOIL SSV-T-4^1)
4:1Extraction
Experiment
'l2
• 3456
Experiment
12 .
.3t.
. 56
LS RatioDissolvedLead
A
0.340.14_
0.400.512.01
B
0.210.130.270.410.800.40
10:1 LS RatioExtraction
Experiment C
123456
Experiment C
12
' 3456
DissolvedLead
0.170.060.120.230.080.33
0.180.460.250..320.280-.56
(1) Al.l concentrations in ppm (mg/1 )
62.05 b 61400078

to
Leachate/SolidPhase Ratio
(rnl/g)
3:1
. 10:1
* 20:1
Exp
12
12
12
. TABLE 3-11
SERIAL BATCH EXTRACTION DISSOLVED LEAD RESULTS
Contaminated^ )Surface Soil
1.8400.3.99
0.6230.261
0.4140.223
Leachate
. . FirstExtraction
0.0110.011
0.1420.077
0.1080.108
Lead Concentration
Uncontaminated SoilSecond
Extraction
<0.0050.007
0.0410.42
0.0060.020
. ThirdExtraction
0.0160.037
<0.0050.045
0.0250.024
(1) All concentrations are expressed in ppm (mg/1)Contaminated soil 1s SSVI-T-1.Uncontaminated soil is SSSI-55N.
ooo-jvo
conck

Leachate/SolidPhase Ratio
(mg/g)
10:1
20:1
(TlLO
Exp
12
12
TABLE 3-12
SERIAL BATCH EXTRACTION TOTAL LEAD RESULTS^1)
ContaminatedSurface Soil
0.802'0.303
0.210
(1) All concentrations are expressed in ppm (mg/1)Contaminated soil is SSVI-T-1,Uncontaminated soil is SSS-I-55N.Dash indicates sample not analyzed
Leachate Lead Concentration
Uncontaminated SoilFirst
Extraction
0.091
0.0990.092
SecondExtract ion
0.0180.017
0.0070.002
ThirdExtract ion
0.0360.036
0.0160.022
OOO00O

TABLE 3-13
SOIL_COLUMN_SIUDIES
EXPERIMENT A - CONTAMINATED SOIL LEACHATE^)
Co'l umn IColumn 2
1
0.2G0.37
. - '
3
1.08 00.55 0
• - 00
•PORE VOLUME • • .5-6 7 9 11 12 13 15 17 19 21 24
DISSOLVED LEAD
.92 - 0.56 - - - - 0.18 - 0.25
.48 - 0.30 - - - - 0.324 - 0.10
TOTAL LEAD
.61 - - 0.48 - - . 0.43 - 0.20 - 0.32 • -
.25 - - 0.37 - - 0.15 - 0.14 - 0.39Column 1.Column 2
CD - Experiment I consisted of air-dried soils SSVI-T-1 and SSS-I-55N. Each contaminated soil leachate sampleconsisted of a 100 ml..volume taken from the co>umn'following passage of the indicated pore volume. All
. concentrations are expressed in ppm (mg/1). The detection l i m i t is 0.01 ppm. Dash •(-) indicates sample not. . analyzed. : •
ooooo
62t)5b

TABLE 3-14
SOIL COLUMN STUDIES
ContaminatedColumn 1Column 2
5.65.6
CTlcn
UncontaminatedColumn 1 5.6Column 2 5.6
3.63.1
4.64.3
3.23.3
4.14.4
3.13.2
4.44.4
3.33.3
3.44.1
PQRE_VOLUME_11 12 13
4.44.3-
3.63.4
15 17 19
2.92.7
4.44.4
3.63.7
2.92.2
21
3.83.4
4.33.3
24
Following the passage of the appropriate pore volumes (186 ml. per day) though the entire soil column, leachatesamples were collected and the pH was measured. Dash (-) indicates sample not analyzed. Background (B) indicatesthe pH level in the deionized water that leached the soil columns.
ooo00ro
6205b

TABLE 3-15
SOIL COLUMN STUDIES
CTi
Column 1Column 2
Column 1Column 2
EXPERIMENT A - UNCONTAMINATED SOIL LEACHATE^)
PORE VOLUMEB . I 3 5 6 7 9 11 12 13 15 17 19 Zl <LO,
• . DISSOLVED LEAD
0.005 0.010 0.009 - 0,0050.009 0.066 0.005 - 0.023
0.016 0.017 0.007 - . -0.0130.011- 0.007 0.010 - . 0.033
0.0070.005
0.0050.005
0.019 - 0.012 - - 0.010O.C26 - 0.010 - - 0.016
(3)TOTAL LEAD . .
0.010 - 0.013 - - 0.0100.010 - 0.01Q - - 0.010
- Experiment I consisted of air-dried soils SSVI-T-1 and SSS-I-55N. Background (B) indicates level of Pb in theinitial uncontaminated soil leachate. All concentrations are expressed in ppm (mg/1). The detection limit is0.005 ppm. Dash (-) indicates sample not analyzed.
ooo0010

TABLE 3-16
EXPERIMENT A -.UNCONTAMINATED LEACHATE CHEMICAL ANALYSES*
Parameter
Chloride
Sulfate
Hardness
Alkal inity
Conductivity
(1) All concentrations in ppm except conductivity (umhos/cm). Samples werecollected from a pore volume 4/5 composite of uncontaminated soilleachate. B indicates the background value for uncontaminated soilsolution from column 1 prior to leaching.
ColumnB
< 1
19 . •
2
y 3i ty 36
1
4
223
72
< 1
340 . •
2
2
149
52
< 1
270
62050 ' 40°084
- ' • • 6 7 . . . . . .

TALE 3-17
LEACH-ATE TOTAL ORGANIC CARBON CONCENTRATIONS^1
Experiment/Column
A - 1
A - 2
B - 1
B - 2
C - 1 .
C - 2
D - 1
D - 2
nn Pore Volume2 I y iz . iy
197
261
413
326
98
.255
290
346
29
19
239
11
15
19
34
106 '•
21 ' < 1
'14 • ' ' . < ! '
22 .15
23 18-
13
. 19 '
25 -
44 22 -'
4
2.2
'
6
13 '
13
29
53
(1) All concentrations in ppm. All samples collected from uncontaminatedsoil leachate samples. • • '
400085•6205b
68

TABLE 3-18
SOIL COLUMN STUDIES
EXPERIMENT-B - CONTAMINATED SOIL LEACHATE(1)
PORE VOLUME11 12 13 15 17 19 _21_ 24_
DISSOLVED LEAD
Column 1 1.17 0.057 - - 0.051 - 0.090 - - 0.019 - 0.010• Column 2 0.68 0.036 - - 0.024 - • 0.012 - - 0.011 - 0.015
CTt
' TOTAL LEAD
Cplumn 1 ' - - 0.302 - - 0.033 - - 0.368 - 0.263 - 0.082'Column 2 - - 0.029 - - - - - 0.094 - 0.028 - 0.032
(D-- . Experiment -B consisted of field-moist soils PVCII-Vl and PVCIII-T-1 (Pb contaminated soils) and PVCII-55N andPVCI-55N (Pb uncontaminated-soils).- Each sample consisted of a 100 ml. volume taken from the column followingpassage of the indicated pore volume. ATI concentrations are expressed in ppm (mg/1). The detection l i m i t is0.01 ppm. Dash (-) indicates sample not analyzed. Lead was analyzed in leachate that passed only .through thecontaminated soil portion of the column. . . . -
, t * ' ' ' . . . - • •oo • . • - • • - .o •00 .
• • '
6205b. .

TABLE 3rl9.
SOIL COLUMN STUDIES
SOIL LEACHATE pH OF EXPERIMENT B
ContaminatedColumn 1 6.8Column 2 6.8
^j Uncontaminated0 6". 8
6.8Column 1'Column 2
6.46.5
6.46.6
PORE VOLUME(1
6.36.6
5.7'5.8
6.26.2
5.15.8
6.16.1
4.74.2
11 12
5.55.8
17 19 21 24
6.16.3
6.16.6
5.05.6
6.26.3
4.56.4
(1) , PVCII-T-1 and PVCIH-T-1 were the undisturbed, field-moist Pb .contaminated soils used in both columns 1 and .2respectively.' PYCII-55N and PVCI-55N were the undisturbed, fieTd-moist Pb uncontaminated soils used in columns 1and 2 respectively. Background (B) indicates level of pH in the site groundwater that leached the soil columns..Dash (-) indicates sample not analyed.
ooo00-J

TABLE 3-20
SOIL COLUMN.STUDIES*!)
EXPERIMENT B - UNCONTAMINATED SOIL LEACHATE
PORE VOLUME11 12 13 15 17 19 21 74
DISSOLVED LEAD
Column 1 0.010 0.005 0.010Column 2 - 0.005 0.005
0.0070.005
0.0250.005
0.0100.011
0.0100.021
0.0100.011
TOTAL LEAD
Column 1 0.012 0.006 0.005Column 2 0.009 0.005 0.005
0.0050.005
0.0060.005
0.0100.010
0.0100.010
0.0100.010
Experiment II consisted of field-moist Pb contaminated soil (PVCII-T-1 and PVCIII-T-1) and Pb uncontaminated soil(PVCII-55N and PVCI-55N). Background (B) indicates level of Pb the initial in uncontaminated soil leachate. Allconcentrations are expressed i.n ppm (mg/1). All detection limit is 0.005 ppm. Dash (-) indicates not analyzed.
ooo0000

TABLE 3-21
SOIL COLUMN STUDIES
NJ
Column 1Column 2
Column 1Column 2
EXPERIMENT-C - CONTAMINATED SOIL LEACHATE(1)
PORE VOLUME1 3 5 6. 7 9 11 12 13 15 17 19 21 24
DISSOLVED LEAD
0.037 - . 0.059 - 0.045 - 0.0450.050 - 0.058 - 0.042 - - - - 0.029
TOTAL LEAD
0.414 0.079 - - 0.024 - - 0.036:- '0.300. 0.128 •- - - - - 0.046 - -
0.064 - 0.0280.056 - 0.031
0.0110.010
Experiment C consisted of air-dried soils SSV-T-4 (Pb contaminated) and SSSI-55N (Pb uncontaminated) . Allconcentrations are expressed in ppm (mg/- l ) . The detection l i m i t . i s 0.01 ppm. Dash (-) indicates not analyzed;
ooooovo

TABLE 3-22
SOIL_CQLUMri_SiyD_IES
SO I L_1E ACHAlE__pHj:)F_E_X_P_ERIMENT_C
B 1 3 5 6 7 9
ContaminatedColumn 1 5.6 - - 4.5 -• 5.4Column 2 5.6 - - 4.7
UncontaminatedColumn 1 5.6 3.9 - - 4.5 - 4.9Column 2 5.6 - - - 4.3 - 4.5
(1)PORE VOLUME11 12 13 15 17
5.2 2.6 5.15.6 3.3 5.4
4.6 - 4.84.5 - 4.6
19 21
5.55.5
4.44.5
24
4.62.7
2.32.7
(1) _ SSV-T.-4 was the air-dried Pb contaminated soil used in both columns 1 and 2 (5-10 ft). SSSI-55N was the air-driedPb Uncontaminated soil used in both columns 1 and 2. Background (B) indicates deionized water pH. Dash '(-•)indicates not analyzed.
ooo
6205b

£>.
TABLE 3-23
SOIL COLUMN STUDIES
EXPERIMENT- C - UNCONTAMINATED SOIL LEACHATE ( 1)
PORE VOLUME11 12~ TT TT"
DISSOLVED LEAD
Column 1 0.005 0.006 0..005Column 2 0.008 0.054
0.0210.012
0.0100.010
0.0100.010
TOTAL LEAD
0.0100.010
0.0100.010
0.0100.010
Column 1Column 2
0.01 0.006 0.0100.010
0.0100.010
O . O J O0.010
0.0100.010
Experiment C consisted of air-dried soils SSV-T-4 and SSSI-55N where the former soil is Pb contaminated and thelatter is pot contaminted with Pb. Background (B) indicates level of Pb in uncontaminated soil leachate. Allconcentrations-are expressed in ppm (mg/T). The detection limit is 0.005 ppm. Dash (-) indicates sample notanalyzed.
OOOVO
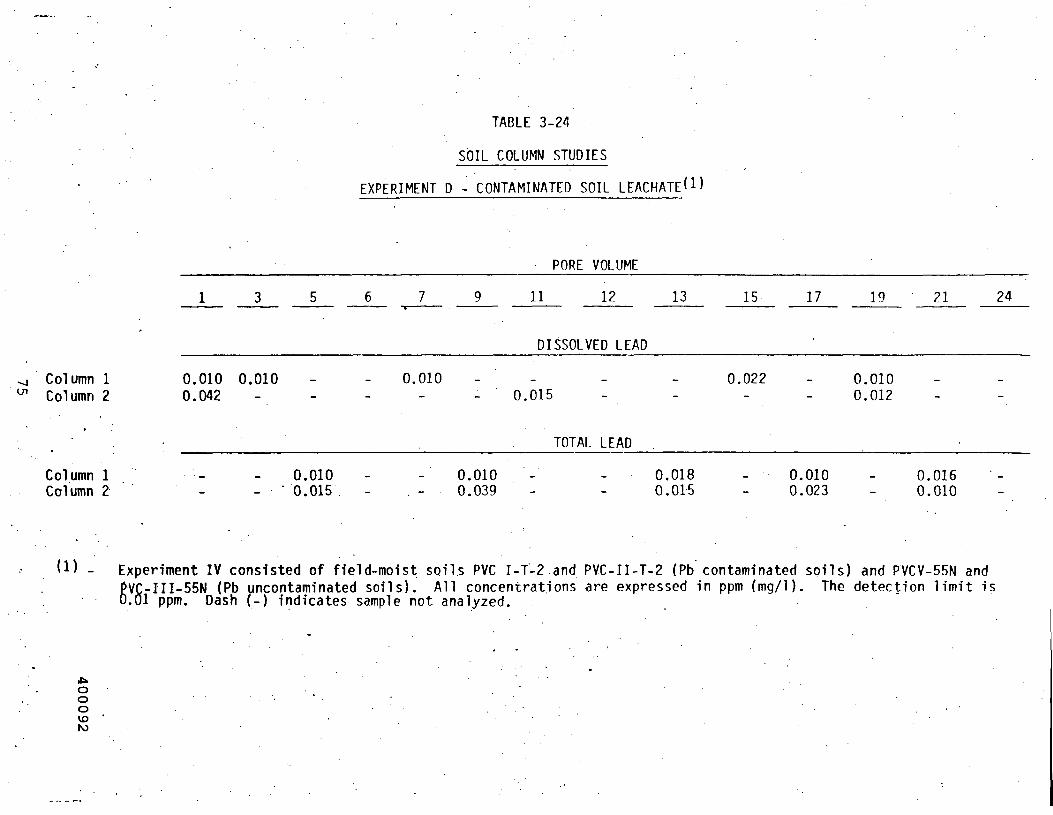
TABLE 3-24
SOIL COLUMN STUDIES
EXPERIMENT D - CONTAMINATED SOIL LEACHATE^)
PORE VOLUME
Column 1Column 2
Column 1Column 2
1 • 3 5 6 7 9 11 12 13 15 17 19 21 24
DISSOLVED LEAD
0.010 0.010 - - 0.010 - - - - 0.022 - 0.0100.042 - - - - - 0.015 - - - - 0.012
TOTAL LEAD
Q.010 - - 0.010 - - 0.018 - 0.010 - 0.016- '0.015. - . - 0.039 - - 0.015 - 0.023 - 0.010
Experiment IV consisted of field-moist soils PVC I-T-2 and PVC-II-T-2 (Pb contaminated soils) and PVCV-55N and:-III-55N (Pb uncontaminated soils). All concer31 ppm. Dash (-) indicates sample not analyzed.
PVC-III-55N_(Pb uncontaminated soils). All concentrations are expressed in ppm (mg/1). The detection limit is
ooovoro

TABLE 3.-2S
SOIL COLUMN STUDIES
SOIL LEACHATE pH OF EXPERIMENT-^1
Contaminated^)Column 1Column 2 6.9
(.1)
B
2)6.9
1 3
5.1
5
4.6
PORE VOLUME . .6 7 9 11 12 13 15 17 19 21 24
2.7 4.0 - - 3.7 4.8 - 5.04.4 2.3 4.5 2.2 5.8 5'. 7 6.1
Uncorrtaminated^)Column 1 6.9 5.6 "5.5Column 2 6.9 6.2 4.4
4.84.9
4.64.3 5.0
4.75.3
4.65.8'
B -
(D . PVCI-T-2 and PVCIII-T-2 were the field-moist, undisturbed Pb contaminated soil used in columns 1 and 2.respectively. PVCV-55N and PVCIII-55N were the field-moist, undisturbed Pb uncontaminated soils used in columns 1and 2 respectively.Background (B.) indicates ground water leachate pH. Dash (-) indicates sample not analyzed.
ooo

TABLE 3-26
SOIL COLUMN STUDIES
Column 1Column 2
Column 1Column 2
B 1 3
EXPERIMENT 'D -
5 6 7
UNCONTAMINATED SOIL LEACHATE^1)
9PORE VOLUME11 12 13 15 17 19 2.1 24
DISSOLVED LEAD
0.005 0.016 0.0100.007 0.010
0.010 0.010 0.0100.007 0.010
0.0100.010
0.0100.010
0.0100.010
0.0100.024
0.010 - - 0.0100.010 - 0.049 - - 0.011
TOTAL LEAD
- - 0.0100.015 - 0.020 - - -
Experiment no. 4 consisted of undisturbed field-moist soils PVCI-T-2 and PVCIII-T-2 (Pb contaminated) and. PVCV-55N and PVC III-55N (Pb uncontaminated). Pore volume = 186 ml. Background (B) indicates leaching solution pH,All concentrations are expressed in ppm (mg/1). The detection limit is 0.01 ppm. Dash (-) indicates sample notanalyzed.
ooovo
6205b

TABLE 3-27
EXPERIMENT D - UNCONTAMINATED LEACHATE CHEMICAL A N A L Y S E S ^ 1 '
Parameter
.Chloride
Sulfate
Hardness
Alkalinity
Conductivity
(1) All concentrations in ppm except conductivity (umhos/cm). Samples werecollected from a pore volume 4/5 composite of uncontaminated soilleachate. B indicates the background value for uncontaminated soilsolution from column 1 prior to leaching.
C o l u m nB
8
80
26
/ - .
ity . 249
1
10
.'
15
2
193
2
9
. 8
19
1
200
400095
62055 ' . . . ' . ' ' .... - 78 . • ' . •

TABLE 3-28
DISTRIBUTION OF TOTAL LEAD ACCORDING TO
PARTICLE SIZE <D
SOIL SAMPLE PARTICLE SIZE
SSI-T13SSI-T13 (DUP)
SSII-T1SSII-T1 (DUP)
SSVI-T1SSVI-T1 (DUP)
(1) All concentrations in ppm (tug/kg).
DUP = Duplicate sample.
>74 u
701780
73206800
21603010
MEAN
741
7060
2585.
<74 u
2,1802,360
23,20024,200
11,50011,900
MEAN
2,270
23,700
• 11,850
6205b • - ' 400096
' • " ' • • 7 9 . ' - - . . • ' . ' • • ' ' • - . . -

TABLE. 3-29
LEAD CONCENTRATIONS EXTRACTED FROM SITE
Sample
SSVI-T-1
SIII-I-2
SSIV-T-3
SSV-T-4
SSI-T-13
SSSI-55N(5-10 ft)
I n i t i a lTotal
2770
531
289
5200
514
21
HotWater
2.3
1 .4
1.3
7.5
4.8 .
0.01
1 N NH.C1
103
93
44
441
185
0.18
0.01 N NH4C1
5.5
: 2.0f
2.7
14.8
'7.5
0.001
0.1 NpH 7
34
11 .
12'
50
17
< 0.5
KHPpH .4
130
41
' 48
296
98
0.5
U) A' 1 lead concentrations in ppm (mg/kg).: . KHP - pot'assi urn hydrogen- phthalate
NH4C1 - ammonium ch l o r i d e
6205b . • -. ' . 400097
• - 80'

TABLE 3--30
LEAD CONCENTRATIONS EXTRACTED FROM SITE SOILS
SAMPLE
SSVI-T-1
SSIII-T-2
SSIV-T-3
SSV-T-4
SSI-T-13
SSSI-55N
6 N HC1
1500
272
55
2000
219
3.6
EDTA
508
63
.5
626
7
2.4
EDTA*
600
350
125 .
1740
404
4.5
REVISEDORGANIC
495
256
80
1290
214
4.3
REVISEDSULFIDE
1500
80
small
1 300
smal 1
1.7
AQUAREGIA
156
44
4.4 •
691
4.1
2.4
AQUAREGIA
156
44
4.4
691
4.1
2.4
(1) All concentrations in ppm.* Indicates EDTA treatment of a fresh subsoil sample.
6205b
81
400098

TABLE-3-31
pH AND SOIL LEAD EXTRACTION^1
Sample ID
SSVI-T-1
SSIII-T-2
SSIV-T-3
;SSV.-T-4
SSV-T-13
SSSI-55N
2.303.003.994.925.806.58
2.403.114.004.905.756.30
2.353.104.004.905.756.45
2.403.104.004.905.706.29
2.323.104.004.955.806.40
2.303.104.004.925.806.65
( n
( n
( n
( n
( n
( n
LeadRemoved (ppm)
240161130134110
= 3) 33.9 *_ 0.5
18281.8
= 3) 40.8 +• 1.532 . 9~15.711.0' .
146 •= 3) 82.0 + 5.1
47. F29 .,4
• 19.312.4
1030512296212
= 3 ) 1 2 3 + 45070
39417997.8
= 3) 65.9 + 2.336.717.0
= 3) -1.4! + 0.10.80.5 .0.2
<0.05<0.05 •
Percent of TotalLead Leached
8.75.84.74.8 •4.01.2
3.415.4
7.76.23.02,1
•74.942.024.5
•15.1 •• . 9.9 '
6.4 • '
19.8 ' ..9.85.74.12.41.0
76.634.819.012.8• 7 . 13.3
6.8. 3.9
2.41.0
<0.2<0.2
(1) AM concentrations in ppm
6205b400099
82

TABLE 3-32
KINETICS OF LEAD RELEASE FROM SOILS
TIME (HR) ; LEAD LEACHED
PH 3
62
61
68
70
74
'78
80
SSIV-T-3
PH 5
29
30
31
30
• 32
35
29
SSV-T-4
PH-3
140
200 •
230
220
225 • ' .
• 380 •'
490
PH-4
80
100
140
170
170
180
185
0.5.
1
3
6
12.
.24
48
72 - • - -
96 82 - . 600
Concentrations in.ppm. .
Dash (-) indicates not analyzed,
6205b • . . . . . . ' •. . , . - • 400100
• • ' 83 ' •

TABLE 3-33
COMPARISON OF EXTRACTING SOLUTIONS AND LEAD REMOVAL FROM- SOILS*1
Leaching
Dist i l l e d WaterDistilled Water
0.1M EDTA0.1M EDTA
0.01M EDTA0.01M EDTA
0.1M EDTA/0.1M NaOH0.1M EDTA/0.1M NaOH
0.1M HydroxylamineHydrochloride
0.1M HydroxylamineHydrochloride
Q.1M Sodium Citrate/Citric Acid
0.1M Sodium Citrate/
SoilSampl e
SSVI-T-1ASSVI-T-1B1
SSVI-T-1ASSVI-T-1B
SSVI-T-1ASSVI-T-1B
SSVI-T-1ASSVI-T-1B
SSVI-T-1A
SSVI-T-1B
SSVI-T-1A
SSVI-T-1B
Dissolved • DissolvedLead Iron
0.0920,082
43.3 ' 1,10035.$ . .903
10.3 16410.. 4 - 210
56.183.6
7.5 -
• • • 8 . 9
5.5 -
9.0
pH
5.665.52
. 3.833.96
3.593.15
.4.654.91
2.66
2.7
4.2
4.2Citric Acid
(1) Lead and iron concentrations in ppm (mg/1). Soil total leadconcentations SSVI-T-1A T890 ppm, SSVI-T-1B - 2590 ppm.
6205b 84 400101

TABLE 3-34
VARIATIONS IN EXTRACTABILITY FROM SITE SOILS
Dissolved DissolvedSoil Lead Iron pH
SSVI-T-1A 43.3 1,100 3.83SSVI-T-1B 35.9 .. 903 3.96
SSI'I-T-1 225 296 .. 3:98SSII-T-1 295 , '319 • 3.89
SSV-T-4 92.1 686 3.03SSV-T-4 143 2,590 2.99
(1) All iron and lead concentrations in ppm (mg/1). Initial so'i 1 subsamplelead concentrations as follows: SSVI-T-1A - 1890 ppm, SSVI-T-1B 2590. ppm
SSVI-T-1A - 5650 ppm, SSVI-1B 5650 ppm; .SSV-T-4A - 644 ppm, SSV-T-4B 1850 ppm .
. . . • . • 400102
i . . , ' • ' . . • -85 .

TABLE 3-35
EFFECT OF RE-EXTRACTION ON LEAD REMOVAL FROM SOIL SSVI-T-1
LeachingExtraction Solution
1 . . 0.1 M ED.TA.
2 0.1. M EDTA
3 Distilled Water
4 D i s t i l l e d Water
5 D i s t i l l e d Water
6 D i s t i l l e d Water
7 D i s t i l l e d Water'
DissolvedLead
43.335.9
20.818.7
24.822.2
20.119.1
5.34 '5.12
1.461.93
0,661.02
DissolvedIron
1,100' 903
389382
_
• -
-
-
.- • •
pH
3.833.96
4.424.37
2.522.29
5.675.63
5.76.5.79
5.925.78
5.80. 5/69
(1) All lead and iron concentrations in ppm (mg/1). Dash •(-) indicates samplenot analyzed. •
6205b . . ' 400103
> •
86 ' '. - •

FIGURE 3-1CONSECUTIVE BATCH DESORPTION STUDY
SOIL SSVI-T-1
CO
EQ.Q.
O<LU
OuiUO
OOH1
O
EXPERIMENT A
• - DISSOLVED LEAD
O - TOTAL LEAD
EXPERIMENTS
A - DISSOLVED LEAD
A - TOTAL LEAD
EXTRACTION NUMBER

COoo
OOMOcn
2.0
1.5
EQ.Q.
Q
LU
Q 1-0UJ>_lO
0.5
FIGURE 3-2CONSECUTIVE BATCH DESORPTION STUDY
SOIL SSV-T-4
4:1 LIQUID-SOLID RATIO
EXTRACTION NUMBER

c»
Oo
2.0
1.5
•Eaa.
01
0 1.0LU
CO
Q
0.5
FIGURE 3-3CONSECUTIVE BATCH DESORPTION STUDY
SOILSSV-T-4
10:1 LIQUID-SOLID RATIO
EXTRACTION NUMBER

FIGURE 3-4SERIAL BATCH EXTRACTION STUDY
1.0
0
ZUJoZo°foi<&UJ_iOin
io
0.1
0.01
0.005
I I TEST!
\/A TEST 2
CS CONTAMINATED SOILSSVI-T-1
1E,2E,2E CONSECUTIVE SOILEXTRACTIONS
. SOIL SSI-55N
3:1 LS RATIO
CS 1E 2E 3E
400107
90

FIGURE 3-5SERIAL BATCH EXTRACTION STUDY
1.0,-
Z 'UJu
llat< —UJ
O•UJ
OV)
0.005
TEST t
TEST 2
CS CONTAMINAtEDSOIL SSVI-T-1
1E,2E,3E CONSECUTIVE SOILEXTRACTIONSSOIL SSI-55N .
10:1 LS RATIO
CS 1E 2E 3E
91 400108

FIGURE 3-6SERIAL BATCH EXTRACTION STUDY
§ 0.1
.ZUioz
° CLUJ_J
•Qui
O
5 o.oi
0.005CS IE
EZZITEST 1
TEST 2
CS CONTAMINATED SOIL SSVI-T-1
IE, 2E,3E CONSECUTIVE SOILEXTRACTIONSSOIL SSI-55N
20:1 LS RATIO .
2E
92
3E
400109

FIGURE 3-7SERIAL BATCH EXTRACTION STUDY
i.o
0.1.zo
z111u
oUJ_i_j<
O
0.01
0.005
TEST 1
CS
CS CONTAMINATED SOILSSVI-T. 1
1E,2E,3E CONSECUTIVE SOILEXTRACTIONSSOIL SSI-55N
10:1 LS RATIO
1E 2E
93
3E
400110

FIGURE 3-8SERIAL BATCH EXTRACTION STUDY
1.0
0.1zo
UJo _
o<UJ
<o
0.01
C005CS 1E
94
TEST 1
f/^TI TEST2
CS CONTAMINATED SOIL SSVI-T-1•.
1E, 2E, 3E CONSECUTIVE SOILEXTRACTIONSSOIL SSI-55W
20:1 LS RATIO
2E 3E
400111

FIGURE 3-9SOIL COLUMN EXPERIMENT-A
(AIR-DRIED SOILS)
5.0
— CS - CONTAMINATED SO'lLSSVI-T-1
- US - UNCONTAMINATED SOILSSSI-55N (5-10 FT)
1.0
0.5
EaD..ca.aLU
IDLU
Io
0.1
.05
GROUNDWATERSTANDARD
.01
0.005
I I I I I I9 11 13 15
PORE VOLUME
95 ' •
17 19 21 24
400112

5.0
FIGURE 3-10SOIL COLUMN EXPERIMENT-A
(AIR-DRIED SOILS)
1.0
O- CS - CONTAMINATED SOILSSVI-T-1
Q- US - UNCONTAMINATED SOILSSSI-55N (5-10 FT)
0.5
a.aJSo.
O
LLJ
XO
o.i —
.05
.01
0.005
4 fi
GROUNDWATERSTANDARD
I11 13 15
PORE VOLUME
96
17 19 21 . 24
400113

5.0
FIGURE 3-11SOIL COLUMN EXPERIMENT-B
(FIELD-MOIST SOILS)
1.0
0.5
t
II
*
\- CS - CONTAMINATED.SOILSPVC-ll-T-1 AND PVC-fll-T-1
|- US - UNCONTAMINATED SOILSPVC-II-55N AND PVC-I-55.N
ES
a.aLU
D-LU
XO
0.1 -
.05 - —
GROUNDWATERSTANDARD
.01
.005
I I I9 11 13 15
PORE VOLUME
17 19 21 24
400114
97

FIGURE 3-12SOIL COLUMN EXPERIMENT-B
(FIELD-MOIST SOILS)
i.o
0.5
n.a.Da.
LLJ
ICJ<UJ
0.1
.05
O- CS - CONTAMINATED SOILSPVC-ll-T-1 AND PVC-lll-T-1
D- US - UNCONTAMINATED SOILSPVC-H-55N AND PVC-I-55N
GROUNDWAtERSTANDARD
.01 —
.005
D
9 11 13 15
PORE VOLUME
• 9 8 . ' - .
17 19 21 24
400115
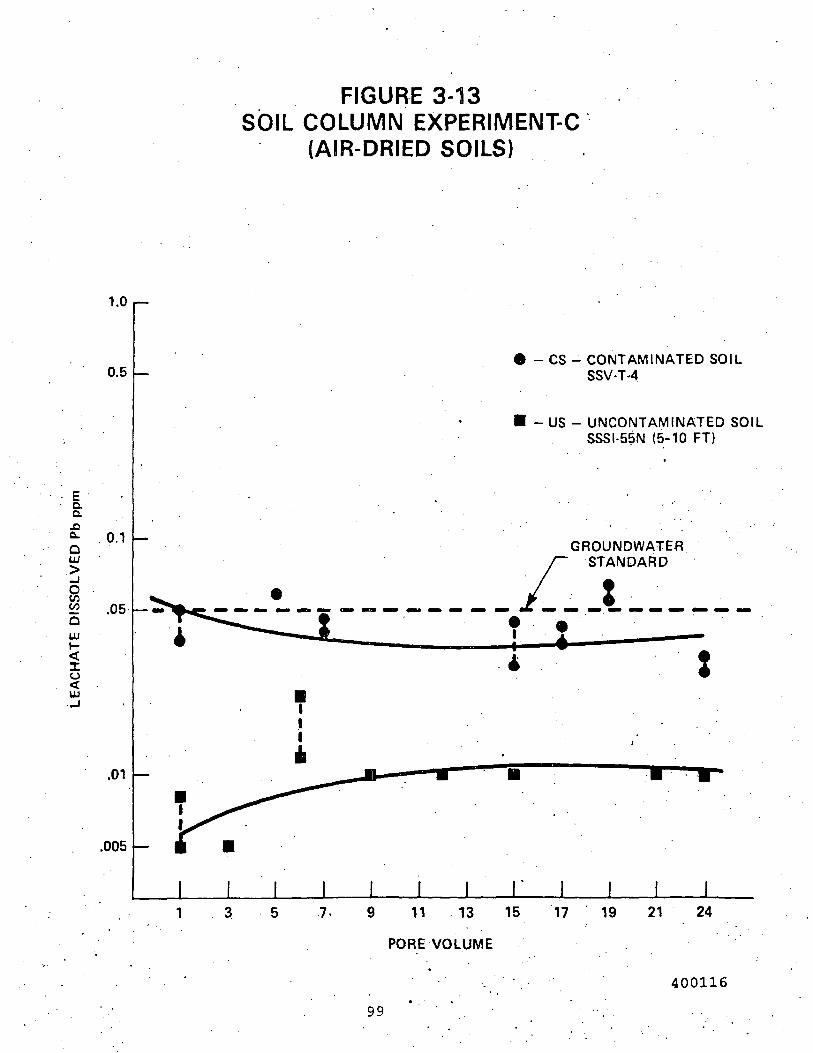
1.0
FIGURE 3-13SOIL COLUMN EXPERIMEIMT-C
(AIR-DRIED SOILS)
0.5CS - CONTAMINATED SOIL
SSV-T-4
.01
.005
US - UNCONTAMINATED SOILSSSI-55N (5-10 FT)
aa..oa.Gai
0.1
<2 .05QUJ
Io
GROUNDWATERSTANDARD
1 3 5 7 - 9 11 13 15 17 19 21 24
PORE VOLUME
99
400116

1.0
0.5
ao..oa.
O
UJ
IO<UJ
0.1 —
.05
.01 —
.005
FIGURE 3-14SOIL COLUMN EXPERIMENT-C
(AIR-DRIED SOILS)
D
O
O - CS - CONTAMINATED SOILSSV-T-4
D - US - UNCONTAMINATED SOILSSSI-55N (5-10 FT)
GROUNDWATERSTANDARD
O
I I I I
1 3 5 9 1 1 - 1 3 15
PORE VOLUME
17 19 .21 24
100400117

FIGURE 3-15SOIL COLUMN EXPERIMENT-D
(FIELD-MOIST SOILS)
i.o
0.5
c.D.
£20.oLU
0.1 —
£ .05|—oUJ
Iu<UJ
.01 -
.005 -
- CS - CONTAMINATED SOILSPVC-l-T-2 AND PVC-ll-T-2
- US - UNCONTAMINATED SOILSPVC-V-55N AND PVC-III-55N
i.
GROUNDWATERSTANDARD
11
1 I I 1 I I 1 13 57 9 11 13 15 17 1
PORE VOLUME
I I .
9 21
1
24
101 400118

FIGURE 3-16SOIL COLUMN EXPERIMENT-D
(FIELD-MOIST SOILS)
l.U
0.5
I •1 0.1O.
0t— n nc
LE
AC
HA
TE
e "e i
0.01
0.005
— . O - CS - CONTAMINATED SOILSPVC-l-T-2 AND PVC-ll-T-2
D - US - UNCONTAMINATED SOILSPVC-V-55N AND PVC-III-55N
GROUNDWATER/STANDARD
. ' • • • -
? o 7 I
I I I I I I I I I I I
1 3 5 79 11 13 15 17 19 21 • 24
PORE VOLUME
102 400119

OUJ
cco
FIGURE 3-17SOIL LEAD FRACTION REMOVED
BY HOT WATER
nn 0.01
T1 12 T3 T4 T13 55N
SOIL SAMPLE
103 400120

FIGURE 3-18SOIL LEAD FRACTION REMOVED
BY AMMONIUM CHLORIDE
a.a.
aUJ
o5UJcc
UJ
500
400
300
200
100
1N NH4CI
FT 0.18
T1 T2 T3 T4SOIL SAMPLE
T13 55M
a.o.
OLU
O5UJcc
UJ
18
14
10
0.01N NH4CI
n PI 0.001
T1 T2 T3 T4
SOIL SAMPLE
T13 55N
' 104. 400121

FIGURE 3-19SOIL LEAD FRACTION REMOVED
BY CITRATE-DITHIONITE AND 6N HCI
CITRATE-DITHIONITE180 —
140 —
LE
AD
RE
MO
VE
D -
F
NJ
O)
OO
O
O E
•
mm mm
•
•
•M
•
•i•
•
mm
•
••i
r*i
0.a.
o5UJOC
oUJ
3600
2800
2000
1200
400
T1
6N HCI
T2 T3 T4SOIL SAMPLE
T13 55N
3.6
T1 T2 T3 T4SOIL'SAMPLE
T13 55N400122
105

FIGURE 3-20SOIL LEAD FRACTION REMOVED
BY AQUA REGIA
900
£ 700a.
IDui
O 5002UJcc
300
100 n 44 4.1 2.4
T1 T2 T3 T4
SOIL SAMPLE
T13 55 N
400123
106

FIGURE 3-21EFFECT OF pH ON SOIL LEAD LEACHING
5a.a.I
OLUICJ
LU
£ 200
800
600
400
SSVI-T-1
1000
800
a.a.I 600
DUJIo£ 400
.ca.
200
SSI-T-13
pH
4
pH
a.a.
o<LLJ
1000
800
600
400
200
SSV-T-4
J I I I I
PH
1-6r SSSI-55N
S 1.2a.a.
Xo<UJ_J.aa.
0.8
0.4
i 1 1 i i e i2 4 6
pH
107 400124

FIGURE 3-22KINETICS OF SOIL LEAD RELEASE
a.n.
IO<UJ
CDa.
0
pH 5
SOIL SSIV-T-3
I I24 48
TIME (H)
72
pH 3
96
pH 5
SOIL SSV-T-4
I I24
TIME (H)
48 72
108
pH 3
96
400125

FIGURE 3-23COMPARISON OF EXTRACTING AGENTS AND
LEAD REMOVAL FROM SOIL
100.0 i-
10.0 -
o.a.
O
oo
UJ
<Io<UJ
1.0 -
0.1DISTILLED
WATER0.1MEDTA
HAH -HYDROXYLAMINEHYDROCHLORIDE
t
SC - SODIUM CITRATE/CITRIC ACID
—
•I_--^^— ' Iwm*m
0.01MEDTA
109
0.1MHAH
0.1MSC 400126

FIGURE 3-24EFFECT OF pH ON EDTA EXTRACTION
OF LEAD
1000.0 r-
0.1M EDTA
100.0 -
o.0.
1 '0
O.OD
LE
AC
HA
TE
L
EA
-*-»
o3
6
11B^
1pH 3.8-4.0 pH 4.6-4.9
lib 400127

1000.0 r-
FIGURE 3-25VARIATIONS IN LEAD EXTRACTABILITY
FROM SITE SOILS
0.1M NaEDTA
100:0 -
tId
OoO<LLJ_)
UJ
Iu<UJ
10.0 -
1.0
- I Immm
^^m
i
SSVI-T-1 SSV-T-1 . SSII-T-1
so!L • '•" ' • - . ; . 400128
1 1 1 ' ' - . - . . - . .

FIGURE 3-26EFFECT OF RE-EXTRACTION ON LEAD REMOVAL
1000.0 p-
100.0 -
DW - DISTILLED WATER
SOIL - SSVI-T-1
CL.a.
1•d;zoo
LU
1L'J
10.01-
5.0 -
1.0 -
0.0
— I I . \1 'I I *1 10.1MEDTA
0.1MEDTA
DW-1 DW-2 DW-3 DW-4 DW-5
112 400129

SECTION 4
DISCUSSION
_ ' - . 113 . . 4001306217b . • • .

4.0 DISCUSSION
In this section the results of the laboratory studies are discussed in termsof the potential mobility of lead in site soils. Emphasis has been placed onassessing the implications of the experimental results with respect to:
o Variations in site surface soil lead concentrations,
o Potential interactions between -site surface soils and surface water,a n d . • ' ' . ' . .
o Potential soi1-groundwater interactions.
The implications of the lead speciation studies with respect to future leadmobility are also discussed. In addition, the results of the preliminarytreatability studies are discussed in terms of possible site remediationoptions. .
4.1 Soil.Lead Concentrations
The overall results of the April 1987 Stage II - Supplemental Field SamplingProgram showed significant differences in soil lead concentrations whencompared to -the previous results obtained during the 1985 Stage II Sampl-ingProgram., The overall results of the 1987 Sampling Program indicated overallsignificantly lower total lead concentrations in site surface soils than hadbeen generally reported in the 1985 Sampling Program. The result's of QA/QCanalyses indicated that the observed differences did not appear to beattributable to analysis problems. • • .
The results of soil total lead analyses made in conjunction with thelaboratory mobility studies provide some insights Into factors which may inpart be responsible for certain of the observed differences in site-soil leadprofiles between 1985 and 1987. Additional factors are discussed inSection 4.,2. Lead concentrations in soil samples collected for this mobilitystudy are characterized by wide variations. Median soil concentrations forthe samples collected for these mobility studies from contaminated portions of
1146217b .
400131

the Hesterly Wetland (see Figure 2-1) range from approximately 300-5000 ppm.In certain locations total lead concentrations were found to varysignificantly by (more than a factor of two) for subsamples collected in closeproximity (1-2 ft) to each other. By contrast, uncontaminated subsurface soillead concentrations were found to be generally less than 80 ppm.
These total lead concentration results are relatively consistent with theresults of the Stage II - Supplemental Field Program conducted in April,1987. In this program, soil lead concentrations for uncontaminated surfaceand subsurface soils were found to be less than 80 ppm with leadconcentrations of less than 30 ppm at many locations. Lead concentrations incontaminated surface soils were found to range from several hundred to inexcess of five thousand ppm.
The heterogeneous distribution of lead concentrations in the site surfacesoils appears to be due to several factors including:
o The exact soil sampling depth, and
• o Variations in lead concentration with soil particle size. . . •.
4.1.1 Soil Sampling Depth and Total Lead Concentration
Evidence indicates that within near surface contaminated soils (0-2 ft) at thesite, total lead concentrations can vary significantly with the exact sample .depth. Therefore, depending upon the actual depth of -sample collection,reported total.lead concentrations may vary significantly even at the samesampling location.
Evidence for the potential variations in soil total lead concentrations withnear surface depth is presented 1n Table 4-1. Soil samples collected fromhand driven plastic (PVC) and stainless steel Shelby Tubes were analyzed fortotal lead in different soil depth segments. The results indicate that insamples from certain locations (for example PVCI-T-1, and UCSSII-T-1) leadconcentrations appear relatively uniform with depth. In sample PVCI-T-1;
115 .6217b. 400132

lead concentrations are slightly higher between 6-18 inches than between 0-6inches. However, in other samples total lead concentrations decreasedramatically with increasing depth. For sample PVCIII-T-2, median lead .concentrations decrease from 4120 ppm in the top 6 inches to less than 100 ppmin the 6-12 inch samples and 12-18 inch samples. In both cases the results ofduplicate lea: analyses are quite consistent. Clearly, at these locations thereported total lead concentration wi l l be affected by the exact depth at whichany sample for total lead analysis was collected. • . • . '
These variations in lead concentrations with depth probably result in part,from the original pattern of site contamination and more recent effects oferosion and surface water transport. Surface water transport of soils wouldact to remove contaminated soil from certain locations and redistribute it toother locations.
It should be noted that during the 1985 Stage II and 1987 Supplementary Stage.II Sampling programs, differences in the depth of surface sample collectionfor.total lead analysis did occur. In the 1987 sampling program, most surfacesoil samples were collected from 0-?. feet and composited. During the 1985sampling program most samples were collected from 0-6 inches. Therefore, itis quite poss.ible that samples collected from the same location could-show,differences if the samples from 1987 program included less contaminated s-oilfrom a 6-24 inch depth. • ' . . ' '
4.1.2 Total Lead.Concentration and Soil Particle Size .
The- results of analyses of variations in total lead concentrations and soil,particle sizes (Section 3.6) demonstrate the overall Importance of the.contribution of the fine particle fraction contribution to the total soil leadconcentration. As is indicated in Table 3-28 total lead concentrations offine particle fractions of contaminated soils may easily exceed 10,000 ppm.Values 1n excess of this are demonstrated for the fine fractions of SSVI-T-1and SSII-T-1. The fine particle fractions of these soils are a factor of 3-10greater than the mean total concentrations reported for these soils (Table3-28). •
116 • • •6217b ' • ' 400133

The difference between the overall total lead concentrations and the fineparticle total lead concentrations reflects the physical character of thesoils. Both of these soils are characterized as sands with 92-95 percent ofthe soil composition"by weight being in this fraction. Therefore, the s i l tand clay fractions of these samples comprise only 5-8 percent of the totalsoil weight.
These results demonstrate that for these and by inference other site soils,lead contamination may be strongly concentrated in the fine particle silt andclay fractions. Moreover, the fine particle fraction appears to comprise onlya small percentage of the total weight of many site surface soils. The bulkof the soil by weight being comprised of sand. Therefore, the measured total .lead concentration at a given sampling location Is like to be stronglydependent upon small changes in the silt and clay component of the samplewhich is actually analyzed. At a given sampling location soil samples whichcontain slightly more silt and clay may show .significant increases in totallead.. '.
In addition, the fine particle fraction at a given surface sampling locationis likely to change with time more readily than the overall soil at that .location. Erosional and surface water runoff processes will constantlytendto redistribute the fine particle fractions as well as transport these soilfractions off-site. Where downstream migration and removalof these soilfractions has occurred, significantly lower soil lead concentrations would beexpected. The removal of small amounts of the fine particle fractions fromcertain site soils could, therefore, result in significant reductions inmeasured total lead concentrations over time.
4.2 Soil Lead Speciation Availability
A key issue with respect to soil lead'mobility is the relationship betweensoil lead concentration and lead mobility. The question, arises as to whetherall of the total lead 1n contaminated site soils may be available forsoil-water reactions and potentially mobile.
117 : • . 4001346217b . • . - • • ' •
The results of speciation studies on the binding of lead to site soilspresented in Section 3.7, suggest that a significant percentage of soil leadmay in fact be potentially'available for soil-water reactions. Summarized inTable 4-2 are the relative percentages of total lead associated with differentsoil chemical phases for selected site soil samples.
The overall results indicate that relatively small fractions (< one percent)of the total lead components of the soils studied are present in readilyavailable water soluble phases. The highest amount of readily available Ijead(approximately one percent) occurs in soil sample SSI-T-13. The relativepercentages of soluble (readily available) lead in the more highlycontaminated SSVI-T-1 (0.08 percent) and SSV-T-4 (0.2 percent) samples arelower. These results are not surprising considering that site surface soilshave been leached by rainfall and surface water flow for a number of years.Under these conditions the most readily available lead has probably alreadybeen leached from site soils. . •
A significantly greater percentage of lead appears to be present in theexchangeable phase. The highest percentage of exchangeable lead (36 pe-rcent)occurs in the SSI-T-13 sample. The exchangeable lead fractions 1n the twomost contaminated soils studied SSVI-T-1 (3.7 percent) and SSV-T-4 (8.5percent) are somewhat lower. The exchangeable lead fraction may be .consideredto be potentially available for release to the aqueous phase under certainchemical conditions such as changes in aqueous ionic strength or pH.
In the SSVI-T-1 and SSV-T-4 samples, the bulk of the remaining lead is presentin the free oxide, resistent oxide and organic phases. The two oxidecategories relate to binding to soil free and residual iron oxides. Theorganic phase relates to lead bound to soil organic matter. In the, SSVI-T-1soil sample, most of the lead appears to be bounJ t6 soil iron oxides (>60percent) with lesser amounts bound to the organic phase (< 20 percent).Conversely, for the SSV-T-4 sample a greater fraction of the total leatf (about25 percent) is bound to soil organic matter. These results are consistentwith the chemical characteristics of the respective soils. Soil SSVI-T-1 1scomparatively high in iron while the SSV-T-4 soi1 sample is relatively high intotal organic carbon. • • • ' . ' ;
• . • 118&217b • _ . - . . . 400135

The residual component of lead is generally low in all samples. This residualcomponent is a measure of the fraction of total lead which is essentiallystrongly bound to the soil matrix and unreactive or highly immobile.
Experimental results also suggest that the leaching of lead from site soils ishighly sensitive to solution pH levels. As indicated in Figure 3-13 for allof the site soils investigated, increases in solution pH levels over the pH-2to pH-5 range significantly reduced leachate lead concentrations. For certainsoils including 5SV-T-4, this pH effect is quite dramatic with a sharpincrease in leachate lead concentrations with decreasing pH particularly as pHlevels become, increasingly acidic below pH-4.
4.2.1 Implications for Lead Mobility
The lead speciation studies suggest that the bulk of the lead in the morecontaminated site surface soils is present exchangeable, iron oxide andorganic fractions. Lead present in the exchangeab-le form is likely to.bepotentially available for soil-water reactions depending uponphysical-chemical conditions. The relatively high percentages -of. exchangeablelead present in the reservoir of lead which may be mobilized into theenvironment remains in the site soils. • • "
Lead bound to iron oxide soil components ^s likely to be less readilyavailable. However, certain chemical changes in pH and/or redox potentialcould increase the availability of -ead in this fraction. The availability oflead bound to soil organic components is uncertain although this lead fractionis likely to be more available than the iron oxide associated component. Itappears that under certain sediment-water reaction conditions some of. thissoil lead fraction may be available. ..
The experimental pH studies indicate that release of lead from contaminated *site soils is likely to be very sensitive to pH. At the pH levels (pH-^3 topH.-4) that have been reported in site surface waters significant percentagesof the total lead present in contaminated surface soils may be available forleaching. ' •
' • • • ' • 1 1 9 • 4001366217b . . • •

Very high percentages (>30 percent) of total lead are released from certainsoils under very acidic conditions (pH <3) suggesting that both exchangeableand organic and/or oxide bound lead may be released. As pH levels increaseabove 4 the amounts of lead which are leached decrease rapidly.
4.3 Surface Soil-Surface Water Interactions and Lead Transport
The preceding lead speciation study results indicated that a significantfraction of lead in contaminated site surface soils was potentially availablefor mobilization into site surface waters.. The results of both field surfacewater lead measurements and laboratory desorption studies Indicate thatoff-site surface water transport of lead may, in fact, be a significantmigration pathway for lead. . '
4.3.1 Field Surface Hater Lead Concentrations •
Field surface water sampling programs were conducted at the Burnt Fly Bog sitein 1985 and again in 1987. In both programs, surface water samples werecollected for lead analysis. Lead concentrations in surface water samples'collected during 1985 and 1987 sampling programs are quite similar.. As'isindicated in Table 4-3, lead concentrations for many Westerly Wetland samplinglocations were found to typically range from 0.2 to 0.5 ppm with similarconcentrations noted in Downstream Area samples. Lower concentrations areobserved'at upgradient locations (WW-W1) and locations far downstream(SST-SW-8) on feeder streams not draining the Wetland (SST-SW-6).
Of significance, is the fact that in both sampling programs surface waterdissolved lead concentrations (<0.45 microns) closely correlate with totallead concentrations. This suggests that most of the measured surface water
»
lead is being transported in dissolved or corapUxed phases or on extremelysmall particles. , .

4.3.2 Soil - Surface Hater Chemical Interactions
The results of laboratory studies support the hypothesis that the surfacewater lead concentrations in the Westerly Wetland areas are being at leastpartially controlled by chemical reactions with contaminated surface soils.Consecutive batch desorption study results (Section 3.4) suggest that underthe acidic pH and low ionic strength conditions normally characteristic ofsite surface waters, lead can readily desorb from contaminated soils intooverlying surface water. This hypothesis is supported by the results of
»•
several different types of batch extraction studies and is consistent with theconclusions of the soil lead speciation studies.
ASTM Batch Test Results ' . ' .
The results of a series of ASTM batch tests support the argument that afraction of the total lead concentration in contaminated surface soils may bereleased to surface waters. As indicated in Table 3-6, ASTM test leachatelead concentrations for several contaminated site surface soils ranged from0.16 ppm to a maximum value of 1.22 ppm for soil SS II-T-1. Leachateconcentrations from several contaminated surface soil samples representing .varying site geographic locations (SSI-T-13, SSV-T-, SSVI-T-1) exceeded 0.5ppm.
The ASTM test employs a relatively non-aggressive distilled water leachingsolution and a relatively short reaction time (48 hours). Therefore, itappears quite possible -that lead which is leached during this test might alsobe leached under site field conditions.
Consecutive Batch Desorption Experiments . •t
The results of the series of consecutive batch desorption experiments alsosupport the argument that lead may be released from site soils to surfacewaters. Although similar to the ASTM batch experiments, the repetitiveleaching steps involved in these consecutive batch tests better simulatereaction processes which are likely to occur at the site: Specifically, •
1 2 1 . '6217b. ' 400138

during erosion or storm events contaminated site soils will be continuouslyexposed to relatively, uncontaminated rainwater or influent surface water fromupland areas. .
In the consecutive batch desorption experiments conducted on bothcontaminated surface soil SSVI-T-1 (sandy loam) and SSV-T-4 (organic rich)lead was found to desorb from the soil to the initially lead free (<0.01 ppm)distilled water phase. As is "indicated on Figure 3-1, for the SSVI-T-1 soilinitial leachates aqueous phase lead concentrations are quite high(approximately 1-3 ppm). In both soil SSVI-T-1 experiments, total anddissolved aqueous lead concentrations are in close agreement indicating thatthe aqueous phase lead is largely in a dissolved or complexed form andtherefore relatively mobile. Also, in both experiments aqueous phase leadconcentrations appear to approach similar equilibrium concentrations (0.2-0.8ppm) after which they remain relatively constant. Aqueous lead concentrationsdo not appear to rapidly approach zero or trace lead concentrations.(<0.05ppm).' This suggests that even after six extractions with dis.ti lied-water asignificant reservoir of available lead remains in the soil samples.
For the SSV-T-4 soil consecutive batch extraction studies were conducted, atboth 4:1 and. 10:1 li q u i d / s o l i d ratios. As indicated in Figures 3-2 a-nd'3-3,aqueous phase lead concentrations were found to be relatively constant .throughout the course of the experiments. Initial dissolved leadconcentrations were in both experiments lower than those observed for theSSVI-T-1 soil. Probably reflecting lower initial soil total lead .concentrations.
As with the SSVI-T-1 soil, aqueous phase lead concentrations do not showevidence of a rapid decrease to zero or trace levels (<0.05 ppm). This againsuggests that a significant reservoir of lead wnich is available for leachingremains present in the soil.
1 2 2 - . ' • • • • 400139•6217b

The fact that similar results were obtained at a 10:1 extraction ratio alsosupports this conclusion.. The higher 10:1 leachate/solid ratio did not appearto. significantly reduce aqueous phase lead concentrations. This suggests thatminor changes in leaching conditions will not significantly alter thesoil-water chemical interactions which are operating in site soils.
Serial Batch Extraction Tests
Certain results of the serial batch extraction study have potentiallysignificant application to site surface soil surface water interactions.Serial batch extractions were performed on soil SSVI-T-1 samples at 3:1, 10:1and 20:1 leachate to solid (LS) ratios. Initial leachate lead concentrationsranged from 0.2 ppm to 1.8 ppm with increasing LS ratios resulting indecreasing leachate lead concentrations. However, as Indicated in Table 4-4,the amount of lead extracted per gram of soil increases with increasing LSratio. Therefore, in assessing off-site transport of lead it may be importantto distinguish between the concentrations of lead in surface waters and, thetotal amount of lead be in removed. For instance, during low flow periods itis possible that surface water concentrations may be highest. However,, duringstorm events, the total amount of lead mobilized may be far greater.
4.3.3 Implications of Laboratory and Field Results
The results of the laboratory consecutive batch extraction studies andmeasured site surface water lead concentrations demonstrate surprisingly goodagreement. The principal range of measured surface water lead concentrations(0.2-0.5 ppm) agrees well with the range of equilibrium aqueous phase leadconcentrations observed in the consecutive batch desorption studies performedon both the SSVI-T-1 and SS V-T-4 soils. In addition, the few higher measuredsurface water lead concentrations (approximately 1-2 ppm) are quite similar tothe initial aqueous phase lead concentrations observed 1n the SSVI-T-1experiments.
1 123' 4001406217b . • ' •'•••

This evidence strongly suggests that a significant fraction of the lead insite surface soils may be mobile. That 1s, during interactions between leadcontaminated surface soils and uncontaminated .surface or rain waters, lead canmigrate from the soil to aqueous phase. The experimental results indicatethat this migration process reflects desorption of lead from soi.l particlesurfaces and/or dissolution of lead from mineral phases.
It is important to note that this "desorption" process is different from thesimple physical transport or erosion of contaminated surface soils off-isvte.In addition, it is probable that this "desorption" process can occur not onlyat the original contaminated soil location during and after while anycontaminated surface soils are transported downstream.
The fact that consecutive extraction aqueous phase lead concentrations did notrapidly approach zero or trace levels indicates that a significant reservoirof available lead may remain in many contaminated on-site site surface soils.If available soil lead were immediately released, a rapid drop off in leadconcentrations would be expected in both sequential extractions and in''fieldsurface water concentrations. The laboratory extraction results and the.' .similarities in the 1985 and 1987 site surface water concentrations, indicatethat this is not the case. Therefore, it is likely that lead migration from 'site surface soils into site surface waters to continue for some time.
These results suggest that with increasing dilution such as could occur duringa storm event, the increased volume of water may result in dilution and areduction, of surface water lead concentrations. However, this trend is likelyto be off-set by an overall increase in the total amount of dissolved phaselead transported off-site. These predictions assume that otherphysical-chemical conditions such as pH and the degree of soil-waterinteraction remain constant. • . .
. *
In reality, It is possible that changes in these factors might act to increaseboth the concentration of lead in site surface waters and the total amountstransported off-site. . •
. 124'6217b ' ' .
. . . 400141

4.4 Lead Contaminated Soils and Groundwater
The overall results of the laboratory mobility studies suggest -thatsignificant downward or off-site transport of lead in site ground waters isnot occurring. There is both laboratory and field evidence to support thisconclusion.
4.4.1 Laboratory Column and 'Batch Test Results
Both soil column and sequential batch laboratory experiments were conducted toassess lead behavior in subsurface soils and groundwater. The results ofthese two types of experiments were generally consistent and have a number ofimplications for site-groundwaters.
Soil Column Test Results
A series of four sets of soil column studies which were conducted, utilizedboth air dried and field moist contaminated surface soils. As Indicated inSection 3.5 the levels.of soil contamination differed. In each case leachatefrom the contaminated soil was subsequently passed through an uncontamin'ated•soil such to simulate what would occur in site subsurface-Soils.
The soil column.study results confirm the results of the previously discussedbatch extraction studies with respect to the availability of lead incontaminated soils. As in the batch studies, column leachate dissolved leadconcentrations from contaminated soils are observed in certain samples to berelatively high. As indicated for the SSVI-T-1 soil (Figures 3-9 and 3-10),leachate dissolved lead concentrations can exceed 1.0 ppm of lead in initialpore volumes. The data for this contaminated soil also indicated continuing
*
releases of lead in subsequent pore volumes with some evidence of a gradualdecrease in lead concentration with increasing volumes of leachate. Theinitial dissolved phase laad concentrations of.field moist soil samples fromthe transect T-l area (columns PVCII-T-1 and PVCIII-T-1) were, also relativelyhigh ( 0.5 ppm). Lower initial leachate dissolved lead concentrations wereobserved in the air dried SSV-T-4 soil sample and the field moist-PVC tubesfrom transect T-2. '
125 . 4001426217b

Leachate total lead concentrations for most soil column contaminated soilswere generally similar to, or slightly higher than observed leachate dissolvedlead concentrations. In all cases, however, maximum total lead concentrationswere within the same 0.5-1.5 ppm concentration range observed for thedissolved phase lead levels. The similarities 1n the soil column and theprevious consecutive batch leachate lead concentrations is encouraging. Theysuggest that observed concentration ranges may reflect actual soil-waterinteractions indicative of those ongoing at the site. . .
The variations in the contaminated soil column'leachates appear to reflectvariations in the initial soil lead concentrations. Lead concentrations inthe leachates from the uncontaminated soil samples are uniformly low for allof the soils systems investigated. With'the exception of one dissolved samplefrom ai.r dried SSVI-T-1 (0.06 ppm) all uncontaminated soil leachateconcentrations were below 0.05 ppm. This includes both total and dissolvedlead measurements. Concentrations generally range between 0.01 ppm and 0.03ppm. Uncontaminated soil leachates do not show any trends indicating columnbreakthrough over the lifetime, of these experimental studies.
Serial Batch Extraction . '
The conclusions of the serial batch extraction study performed on thecontaminated SSVI-T-1 and uncontaminated SSSI-55N soil support the results ofthe column studies. Initial leachate dissolved lead concentrations for thecontaminated SSVI-T-1 soil samples are high. At the 3:1 leachate/soi1 (LS)ratio most similar to the low LS ratios occurring in the soil columns theobserved dissolved phase lead concentrations (1.8 ppm and 0.4 ppm) are of thesame magnitude as the i n i t i a l leachate dissolved lead concentrations observedin the analogous soil column test (Experiment A). Also as in the soil columntest, the leachate dissolved lead concentrations in the sequential 10:1 ,and20:1 LS serial batch extractions are also high (approximately 0.2-0.7 ppm)indicating the release of more lead from soil to solution.
126 . 4001436217'b • ' ' . ' • '

As in the column studies, the uncontaminated soil SSSI-55N appears toeffectively attenuate dissolved lead concentrations in leachates from thecontaminated SSVI-T-1 soil. At the 3:1 LS ratio, lead concentrations arereduced to low levels (< 0.05 ppm) after the first uncontaminated soilextraction with values remaining low in the extractions. It should be notedthat the first uncontaminated soil also significantly reduced leachate leadconcentrations in the sequential 10:1 and 20:1 LS ratio experiments. Thissuggests a potentially significant soil attenuation capacity for lead.
r
4.4.2 Field Ground Hater Measurements •
The results of analyses of field ground water samples collected in May 1987support the laboratory soil column study results. As indicated in Tab.le 3-5groundwater dissolved phase concentrations were found to be uniformly low .(<0.01 ppm) in all of the samples which were analyzed.'
Total lead concentrations were also low in most sampl'es ( 0.02 ppm) althoughseveral samples did contain higher (0.024-0.18 ppm) total lead levels. .Thesehigher lead levels may reflect the entrainment of some sediment in certainwater samples as water volumes in most wells were low. • ••
It should be noted that the wells which were sampled were at widely varyinglocations around the site. Wells 48S and 49S were located in along Transect 4in areas of significantly contaminated surface soils. It should also be notedthat most of the wells were screened at shallow depths (< 15 feet) andrelatively close to the1 ground surface.
4.5 Preliminary Treatability Studies
The results of the preliminary soil lead treatability studies presented inSection 3.7 have a number of implications with respect to remediationalternatives for lead contaminated site surface soils.
. 127 . •6217b . 400144

First, the chelation-extraction experiments indicate that aqueous EDTAsolutions can effectively remove significant amounts of lead from site soils:The results of comparative extraction studies are summarized in Table 4-5, Asis indicated 0.1M EDTA solutions proved the most effective in extracting leadfrom site soil SSVI-T-1. This chelating agent was more effective thanhydroxlamine hydrochloride, sodium citrate/citric acid or distilled watersolutions in extracting lead. The 0.1M EDTA solution removed approximatelyseven percent of the total lead present in the SSVI-T-1 soil. All of theother extracting agents removed less than two percent.
The 0.1M EDTA solution extracted significantly more lead from the soil thandid the 0.01M EDTA solution (approximately 1.8 percent). Increasing the pH ofthe 0.1M EDTA extracting solution was found to increase the amount of leadextracted (approximately 12.4 percent). This is consistent with'the pHdependent complexing behavior of EDTA. It was found, however, that the finalaverage pH of the two 0.1M EDTA/NaOH experiments was 4.78. This indicates.that the acidity of the SSVI-T-1 soil significantly neutralized the 0.1M NaOH.solution and probably reduced the overall effectiveness of the EDTA solution,(At low pH levels EDTA carboxyl groups are 'less completely ionized than at.higher pH leve'' s). . • •
The effectiveness of EDTA to extract lead from site soils appears to vary withthe specific site soil sample. As is indicated in Table 4-6., significantlymore lead was extracted from both the SSV-T-4 soil subsample (472 ppm) and theSSII-T-1 soil subsample (1490 ppm). In addition, much higher percentages ofthe total lead present in eacn of these samples was removed (26.3 and 37.8percent respectively). These apparent variations in the effectiveness of EDTAin removing lead from site soils may reflect two factors. First, the resultsof lead speciation studies indicate that the fraction of lead readilyavailable in site soils may differ as a result of differences in lead bindingto site sediments. In addition, the available evidence suggests that highlevels of Iron in certain site soils may interfere with EOTA chelation andextraction of lead. As indicated in Table 4-6 significantly higherconcentrations of iron were removed from the SSVI-T-1 soil sample (1001 ppm)
1 2 8 . ' 4001456217b

by EDTA than the SSII-T-1 sample (260 ppm). 'This is consistent with the.higher total iron EDTA concentration in'the SSVI-T-1 sample (Table 3-2).Previous studies on EDTA washing of soils have identified high soil iron,levels as a potential process interferent (Travers, 1987).
Results (Table 3-4) also indicate that re-extraction of the SSVI-T-1 soil withadditional 0.1M EDTA removed significant additional amounts of lead. Thesecond extraction of the SSVI-T-1 soil released approximately an additionalfour percent of the total lead. Interestingly, subsequent re-extractions ofthis soil sample with di s t i l l e d water resulted in continued significantreleases of lead. This unexpected result suggests that EDTA washing mightincrease the overall availability of lead in site soils possibly by removingiron oxides to which lead had been found.
Overall, these results indicate that soil washing with EDTA solutions mayprovide a means of reducing lead concentrations in contaminated site soils.It appears that this method may be most effective in site soils which i^e bothhighly contaminated with lead and also low in iron. High soil ironconcentrations may reduce the effectiveness of EDTA treatments. • ; .
4.6 Geochemical Mechanisms . . . ' .
4.6.1.. Surface Soil - Surface Hater Interactions ''
Equilibrium solubility calculations suggest that surface water leadconcentrations are not being controlled by the solubilities of the more commonlead hydroxide (PbOH2) or lead carbonate (PbC03 or Pb3(C03)2(OH)2)minerals. As indicated in Figure 4-1 the dissolved lead concentrationsmeasured in laboratory batch extraction tests and site surface waters are well
»
below the concentrations which would be 1n equil.ibrium with these minerals.If these minerals were controlling surface water Interactions, higher leadconcentrations would be predicted particularly given the-low site surfacewater pH levels. Although precipitation of lead phosphate minerals can. not beruled out, detailed data are not available on a site soil phosphate
1 • • ' • • \ • '••• ' ' '• ' 1 2 9 • ' , ' • • • 400146
6217b . . . - ' • • '

concentrations. These results suggest that adsorption/desorption processesmay be of greater importance than precipitation processes in controlling leadconcentrations in site surface waters.
In Table 4-7 are presented the results of partition coefficient calculationsbased on the results of the ASTM shake test data. These results Indicatedthat desorption KD values range from approximately 900-3500 (I/kg) for thecontaminated surface soil samp.les.
The consecutive desorption results for the SSVI-T-1 and SSV-T-4 soils suggestthat some differences may exist 1n soil desorption processes reflected in theKD values presented in Table 4-7. SSVI-T-1 consecutive desorption resultsindicated steadily decreasing aqueous lead concentrations. As is Indicated inTable 4-8 and Figure 4-2 estimated K~ values for the SSVI-T soil (ExperimentA) linearly increase with increasing extraction. 1C values range from 849(Extraction 1) to 2576 (Extraction -6). •
By contrast results for the SSV-T-4 (Experiment - B) do not display thistrend. The marked differences in the behavior of KD values for the two ••soils may reflect differences in the desorption sites or processes involved.In particular, it is possible that the relatively low initial KQ values for '.the SSVI-T-1 soil reflect lead release from relatively low energy adsorptionsites (weakly bound lead). As lead bcund to these low energy sites isreleased and depleted, K~ values may increase reflecting the increasingimportance of equilibrium between the 'low energy site and dissolved lead. Inthis regard it should be noted that w:th increasing extraction, KD valuesfor both the SSVI-T-1 and SSV-T-4 soils approach each other. This may suggesta common desorption reaction process for both soils. Overall, these resultssuggest the potential importance of multiple desorption reaction processes incontrolling surface water lead concentrations. '
4.6.2 Subsurface Soil and Ground Hater ;.»
Equilibrium solubility calculations suggest that subsurface dissolved leadconcentrations are not being controlled by the solubilities of the more common
1306217b ' • 400147

lead hydroxide or carbonate minerals. As in Figure 4-1 these minerals wouldsupport aqueous phase lead concentrations significantly greater than thoseobserved in the soil column tests and as measured in site ground waters.These results suggest as with site surface waters, subsurface aqueous phasephase lead concentrations may also be controlled by adsorption-desorptionrather than precipitation reactions. .
Previous studies including Griffen and Shimp (1976), and McKenzie (1980) amongothers have demonstrated the strong adsorption of aqueous phase lead by soilclay minerals, soil organic matter, iron and manganese oxides. The adsorptionof 1-ead by soil hydrous oxide minerals has been demonstrated to be strongly pHdependent with' increasing aqueous pH level increasing soil adsorption. It hasalso been reported (Griffen and Shrimp, 1976) that soil clay minerals may becapable of adsorption of organically complexed lead minerals.
In the present study, soil column study subsurface soil Teac.hates werecharacterized by low conductivity (<1000 umhos/cm), low chloride. (<30 ppm),low alkalinity (<10 ppm) low moderate sulfate (8-223 ppm) and weakly acidic pH(pH 4-6). Equilibrium speciatiori calculations (Rai and Zachara, 1984) suggestthat under low ionic conditions such as this dissolved lead is likely to exist
O • t •'
'as Pb* or as PbSO.. However, the observation of significant organiccarbon concentrations in the initial uncontaminated soil column studyleachates suggests that lead could migrate out of surface soils as an organiccomplex. If so, then it appears that as suggested by Griffen and Shimp (1976)the lead organic complex may subsequently be adsorbed by subsurface soils.
.6217b
400148
131 •

TABLE 4-1
VERTICAL DISTRIBUTION OF TOTAL LEAD IN THE SURFACE SOILS OF
THE WESTERLY WETLAND
TOTAL Pb (mq/ka)
SOIL SAMPLE
PVC -I-T-1 (DUP)(1)
PVCPVC III-T-2 (DUP)(1:>
UCSSI-T-l(2>
UCSSII-T-1,(2)
UCSSI-T-2^)
UCSSI I-T-
0-6 X
1510 1206902
4840 41203400 •
8760 6440
4120
8220 6285 '
4350
fcJZ
19701750
6266
-
-
' ' -_
DEPTH (INCHES)
'X 12-18
1860 20702100
' 64 2933
•
-
• -_
X 18-24
2085
31
- 4100
4590
' - 14
3060
X
- •
4345
1537
(1) PVC tubes were cut into three equal segments (0-6", 6-12", and 12-18")and an undisturbed soil sample was removed from each segment. Eachsample was analyzed for total lead. The PVC cores were collected in the
• center of Transects 1 and 2 in the Westerly Wetland '
(2) Soil samples were taken from the upper and lower end of a 24 inchstainless steel Shelby tube and analyzed for total lead. The Shelbytubes were used to. collect undisturbed soil samples in the center ofTransects 1 and 2 in the Westerly Wetland..
DUP - Duplicate Sample. .
- « Sample not analyzed. . •
X - Mean values - Computed for the UCSS samples although these samples werenot collected, as exact duplicates. ' .
6205b 400149
132

TABLE 4-2
DISTRIBUTION OF LEAD IN SOIL FRACTIONS
SANPLE
SSVI-T-1
SSIII-T-2
SSIV-T-3
SSV-T-4
SSI-T-13
SSSI-55N
SOLUBLE
0.08
0.3
0.4
0.2
0.9
0.05
EXCHANGEABLE
3.'?
17.5
22.7
8.5
36.0
0.9
FREEOXIDE
17 . 7
10.9 ,
43.7
25.0
20.7
59.1
SULFIDE/RESISTANTOXIDE
54.1
14.8 '
'
.28.1
-
8,1
ORGANIC
18.8
48.2
30.9
24.8
41.6
20.5
.RESIDUAL
5.6
8.3
2.3
13,4
' 0.8
11.4
(1) Values are in percent. Total Pb concentrations-(in ppm) for each soilsubsample are as follows: • .. . '•• .
SSVI-T-U2770; SSIII-T-2=531; SSIV-T-3=289; SSV-T-4=5200; SSI-T-13=514;SSSI-55N=21. . . . '. .
62055 . . . - • • . 400150-133

TABLE 4-3
COMPARISON OF SELECTED SURFACE"WATER
*>.
TOTALSAMPLE LEAD
WESTERLY WETLAND
SST-SW-1 0.22SST-SW-2 0.22SST-SW-3 0.27
DOWNSTREAM
S:ST-SW-4 0.27SST-SW-5 0.28SST-SW-6 0.004SST-SW-7 0.26SST-SW-8 0.009
WW-W1 0.02WW-W2 ' ' 0.37WW-W3 0.33WW-W6 0.27WW-W7 1.3WW-W9 ' 0.43WW-W10 0.5
DISSOLVEDLEAD
0.20.220.22
0.190.200.0030.200.008
0.020.410.310.221.60.470.4
LEAD DATA
pH
3.493.643.69
3.803.763.793.763.81
_'
_ ._
_ - '•_
•
CHLORIDE
6.06.87.1
6.76.37.46.47.3_
' _.____
- _ ._
SULFATE
808960
5251655163
ALKALINITY
(1) All concentrations In ppim except pH. SST-Supplemental Stage II 1.987 sampling programWW-Westerly Wetland 1985 Sampling program. Dash (-) indicates not analyzed. o
oH»cn
6205b

TABLE 4-4
INFLUENCE OF LEACHATE-SOIL (LS) RATIO ON LEAD REMOVAL*1)
LSEXPERIMENT RATIO
1 • . 3:110:120:1
2 3:110:120:1.
LEACHATELEAD CONCENTRATION
1.80.620.40
0.40.270.22
SOIL LEADREMOVED
5.46.28.0 .
1.22.74.4
(1) Soil SSVI-T-1. Leachate lead concentrations in ppm (mg/1). Soil leadremoval concentrations in ppm (mg/kg).of soil.
'Note that the leachate extractions in each experiment were sequential.
r^ru . . ' 40015262055 '135. ' '• • .

LeachingSolution
D i s t i l l e d Hater
0.1M EDTA
0.01M EDTA
0.1M EDTA/O.lM.NaOH
0.1M HydroxylamineHydrochloride
0.1M Sodium Citrate/Citric Acid
TABLE 4-5
EXTRACTING SOLUTIONS AND SOIL LEADTREATABILITY ^ D
LeadRemoved
0.35
158.4
41.4
279.4 .
32.8
•
PercentRemoval
0.02
7.1
1.8
12.4
1.4
29.0 1.3
(1) Lead removal concentrations are in ppm (trig/kg). Values are averages fortwo experiments. Percent removal values are based on an average S'SVI-T-1
. soil lead concentration of 2240 ppm. . . • • . •.
6205b '136
400153

TABLE 4-6
VARIATION IN SOIL -LEAD EXTRACTION BY EDTA
LEAD PERCENT IRONSOIL REMOVED REMOVED '• REMOVED
SS VI-T-1 158:4 7.1 . 1001
SS II-T-1 1490.0 26.3 260'
SS V-T-4 472.0 37.8 . . 1638
(1) All lead removal concentrations were in ppm (mg/kg). The average soillead concentrations (duplicate samples) were 1247 ppm for the SSV-T-4subsample and 6085 ppm for the SSII-T-1 sample.
400154
6205b ' ' . ' - ' -• . " . »
' . - ' • ' . ' ' • ' 1 3 7 ' • . ' • • " ' .

TABLE 4-7
C A L C U L A T E D D E S O R P T I O N P A R T I T I O N
C O E F F I C I E N T S ( 1 )
Soil Sample K
SSI-T-13 . 1314t
SSiI-T-1 975
SSIII -T-2 ' 2865
SSJV-T-3 . ' 581
SSV-T-4 . ' . ' 1152
SSVI-T-1 ' • 3191
SSSI-55N 5-10 Feet .3428
SSSI-55N 1-2 Feet 4769
SSS 7N 1250
Calculated from ASTM shake test results values expressed as
4001556Z'17b ' . '
. . • - • • ' ' 138 . . . ' ' - . ' • - '

TABLE 4-8
ESTIMATED CONSECUTIVE DESORPTION K gVALUES
Calculated Dissolved '. CalculatedSoil Cone. Lead Cone. Kn
Soil SSVI-T-1
2617 3.08 ' : 849
2603 2.79 , 936
2692 1.63 ' 1600
2586 1.36 1901
. 2580 . . 1.27 ' ' 20312576 1.00 2576
Soil S5V-T-4
1268 0.21 " 6038
1268 0.13 9753
1266 0.27 4696
1267 '0.41 3092
1267 ' 0.80 1585
.1266 ' 0.40 . 3165
' 'All soil concentrations in ppm (mg/kq)
All leachate concentrations in ppm (mg/7)K - 1/kg
; 400156
6217b ' 139 -

FIGURE 4-1SOLUBILITY PREDICTED EQUILIBRIUM
LEAD CONCENTRATIONS
-2
-3
£'• -4
_ o
• .o-a. -5
-6 -
-7
PbOH2 -PbC03
x/Pb(C03)2(OH)2 SOLUBILITY
// /
/ / '/ / ' '
/'##'/##''///*//////''///—
"'///'"'/
SURFACEWATERS AND
CONTAMINATEDSOIL LEACHATES
SITEGROUNDWATERS
PH
APPROXIMATE EQUILIBRIUM RELATIONSHIPSADAPTED FROM HARTER (1983)
400157
140

ooH»UlCX3
FIGURE 4-2VARIATIONS IN SOIL Kp VALUES WITH
EXTRACTION
12
10
SSVI-T-1EXPERIMENT-A
SSVT-4'EXPERIMENT-B
xO
8
6
4
2SS
EXTRACTION

SECTION 5
FUTURE SOIL LEAD
MOBILITY
142'. 4001596217b • ' . ' • • • ' • •

5.0 FUTURE SOIL LEAD MOBILITY
In this section, the experimental study results have been considered in termsof potential future lead mobility at the site. An effort has been made toextrapolate existing data with respect to future lead migration in both thesurface and ground water systems. It must, however, be emphasized that theevaluations contained in this section are preliminary in nature.
5.1 Surface Hater Runoff • 'f
An attempt has been made to project future off-site lead migration in sitesurface waters'. The purpose of this calculation has been to estimate how longthe existing reservcir of lead in contaminated site soils might sustainsignificant dissolved lead concentrations in site surface waters.
5.1.1 Estimation of the Volume of Available Soil Lead . •*,
The first step in the surface water lead transport calculation was to.estimatethe volumes of site soils that were likely to contribute to significantsurface water lead concentrations. To do this, the result of the ASTM shake-'tests were used to generate an empirical desorption isotherm (Figure 5-1)relating approximate total soil lead concentrations and potential leachate orsurface water dissolved lead concentrations in equi librium with these soils.
Although consecutive desorption isotherm results plotted in this way are not atrue isotherm they do provide an ins'ght into the potential contaminated soillevels of concern.
The isotherm results suggest that contaminated soij lead concentrations of 250ppm may be capable of supporting leachate concentrations of 0.1 ppm orgreater. That is in the lower range of surface water lead concentrations ofconcern. • . • *
400160• : . ' • . ' . 1 4 3 •
6217b • . ' ' ' - .

Based on this estimation, it has been assumed that the principal reservoir ofcontaminated soils of concern are those containing lead concentrations of 250ppm or greater.
As indicated in Table 5-1, engineering estimates suggest that on the order of6.4 x 104 yds 3 of lead and PCB contaminated soi'l and 2.0 x 204 yds 3
of soil contaminated only with 250 ppm lead are present at the site. Forcalculation purposes, it has been assumed that the lead in'all of this soil isaccessible for possible leaching.
Field sampling results have demonstrated that the lead concentrations 1n manycontaminated soils are significantly in excess of 1000 ppm. Therefore, forcalculation purposes it has been assumed that .approximately 50 percent of thevolume of total lead contaminated soil contains lead at 250 ppm,- 40 percent at1000 ppm and 10 percent at 3000 ppm. These values are preliminary estimatesbased upon qualitative review of lead concentration contour lines developedfrom the results of the field sampling program. From these estimates & total
9contaminated soil lead loading of 7.8 x 10 mg has been calculated.
5.1.2 Lead A v a i l a b i l i t y ' . . '.
Based upon the results of the lead speciation tests, it has been estimatedthat approximately 20 percent of the total lead in contaminated site soils maybe in exchangeable or otherwise moderately available forms which couldinteract with site, surface-waters.
It should be noted that the range of exchangeable lead percentages determinedin the lead speciation tests vary significantly and reached a maximum of 36percent for the SSI-T-13 soil sample. Nonetheless, the 20 percent valueappears to be a reasonable first approximation. Using this value an available
glead reservoir of 1.6 x 10 mg is estimated for the lead contaminated sitesoils (Table 5-1). .
144 ' 4001616217b

5.1.3 Surface Hater Hydrology
Off-site surface water flow has been calculated on'a ye.arly basis assuming
average area rainfall of approximately 44 inches per year and a site area of
82 acres. It has been assumed for simplicity that approximately 75 percent of
rainfall is converted to runoff. Using these parameters approximately 0.9 xg
10 liters per year of water have been assumed to migrate off-site. .
5.1.4 Predicted Soil Lead Depletion .Times*
Based upon the estimated volumes of available lead and the .calculated yearly
volumes of surface water runoff, time frames for available lead removal havebeen calculated. These are presented in- Table 5-2. In Table 5-2, estimatedtimes for lead soil depletion have been calculated for the general range ofsurface water concentrations which have been observed at the site.
The results demonstrate the potentially significant magnitude of the soil leadreservoir. As indicated, depletion' times range from 12 years at a continuousoff-site lead concentration of 1.0 ppm to over 100 years at an off-site .waterconcentration of 0.1 ppm. The available field and laboratory data suggest
that typical surface water lead concentrations are likely to be less than .1.0ppm. Therefore, on going off-site lead transport processes may last forsignificantly longer than the minimum time (12 year) value. Again, .it should
be emphasized that these calculations 'are preliminary in nature and the
assumptions utilized probably, represent an over simplification of actual sitechemical processes. • ' .. .
5.2 Subsurface Lead Migration
A preliminary attempt has also been made to est'marte possible future downwardmigration rates of lead released from'surface soils to site ground waters.
The results of the serial batch extraction study employing surface soil
SSVI-T-1 and subsurface soil SSS-55N have been .used to provide an initial
estimate of soil adsorption capacities for lead. The approach is presented
6217b

in Figure 5-1 and is based on the method Griffin et al (1980). In Figure 5-2,the leachate lead concentrations resulting from equilibration of surface soilSSVI-T-1 leachates with uncontaminated soil SSS 55N have been plotted againstsoil-leachate ratios expressed in gms/ml. The leachate values' plotted are themean lead concentrations for the 3:1, 10:1 and 20:1 leachate to soi1 ratios ofthe sequential batch soil desorption experiments. (Only one data point forthe second uncontaminated soil.sample for the 10:1 extraction was plotted dueto data inconsistency).
The results of this plot have been used to estimate the amount ofuncontaminated soil which would reduce contaminated surface soil leachate leadconcentrations to 0.05 ppm, the National Interim Primary Drinking NaterRegulation level. The SSSI-55N sample used in this experiment has beenassumed to represent site subsurface soils. . It has been estimated from theplotted data that leachate concentrations are reduced to 0.05 ppm or less at asoil leachate ratio of approximately 0.15 gm/ml. The soil leachate ratio isdefined as the grams of soil necessary to remove or elute the indicated'concentration of lead from one mi l l i l i t e r of leachate solution.
The soil-leachate ratio thus provides a measure of the ability of-subsurfacesoils to attenuate lead. In reality, since the serial batch extractioninvolved sequential exposure of uncontaminated soil to contaminated leachate,the 0.15 gm/ml value might be conservative. Based on the results presented inFigure 5-1 preliminary calculations of potential subsurface lead migrationrates have bee-n made. These calculations have been based on the assumptionthat the SSSI-55N sample is representative of .the adsorption capacity of sitesubsurface soils. Obviously, this is an oversimplification of actual siteconditions but does provide an Initial indication of potential site soilbehavior. The results of these calculations are presented 1n Table 5-3.
In Table 5-3 are presented estimates of the downward migration distances ofthe 0.05 ppm ground water lead contamination zones with Increasing time.
. ' • 400163146
6217b • . .

Migration distances have been calculated from the following equation:
D.- (SL) x I x .T
.. • BD '
Where,
D « the leachate migration distance,
SL = the soil leachate ratio, which will reduce leachate lead.concentrations to 0.05 ppm,
I = the infiltration rate per year,
T = the migration time, and • • •
BD = the soil bulk density. •
Results are presented for the graphically estimated 0.15 gm/ml -adsorptioncapacity and also at an assumed value of 0.30 gm/ml. The latter value is a . 'factor of two higher than the graphical estimate and 'is Included inrecognition of the possible variability in .this estimate. The higher valuewould reflect site soils which may more poorly alternate lead.. The datapresented in Table 5-3 have been calculated for an assumed soil bulk densityof 1.5 gm per cubic centimeter and an infiltration rate of 20 inches per year(50.8 cm/yr).
The results of these calculations indicate that downward migration of leadleached from surface soils is likely to be slow. , For the estimated 0.15 gm/mlsubsurface soil adsorption capacity the calculations Indicate that downwardmigration of the 0.05 ppm leachate would occur at approximately. 0.17 ft/year.Over a 20 year migration time 0.05 ppm subsurface leachate concentrattonswould migrate a distance of 3.40 feet. At the higher soil leachate ratio of0.30 gm/ml (indicating poorer soil lead attenuation) the 0.05 ppm leachatelead level would migrate 6.8 feet. These results Indicate that lead.concentrations in shallow near surface groundwaters could exceed 0.05 ppm overan extended time period. .
62,7b

It must be emphasized that this is a preliminary calculation based on verylimited experimental data. Nonetheless, the results suggest that downwardlead migration into site ground waters is likely to be quite slow at best.
It is possible that downward lead migration may be slower than thiscalculation since the calculation does not take into account the dilution ofinfiltrating water by ground water. Nor does it include consideration of theapparently higher pH levels in site ground waters when compared to sitesurface waters. As demonstrated in the lead speciation studies, higher pHlevels (>pH 5), such as those of site grbundwaters may strongly reduceleachate lead release from soils to water. They might act to Immobilizesubsurface lead more than is indicated by the calculations of Table 5-3.
Overall, the results of the laboratory studies suggest lead is likely to berelatively immobile with respect to downward migration into site groundwaters. Any migration which does occur appears likely to be slow and on amass basis small compared to surface transport. .
. 148' 4001656217b . '

o .o
TABLE 5-1
ESTIMATION OF LEAD IN CONTAMINATED SITE SOILS
PARAMETER VALUE COMPONENTS/BASIS ASSUMPTIONS
LEAD CONTAMINATEDSOIL VOLUME
TOTAL CONTAMINATED
AVAILABLE SOIL LEAD
SURFACE WATER FLOW
9.5 x 10⁶ KG
1,8 x 10⁸
LITERS/YR
0 6.4 x 10⁴ YDS3 OF LEAD ANDPCB CONTAMINATED SOIL
o 2.0 x 10⁴ YDS3 OF ADDI-TIONAL LEAD CONTAMINATED SOIL
o 84 x 104 YDS3 = 6.3 x 10⁴
M3
7.8 x 10⁹ MG -0 ESTIMATION OF LEAD CONCEN-TRATION DISTRIBUTION IN CON-TAMINATED LEAD
1.6 x 10⁹ MG o LEAD SPECIATION STUDIES
o SITE HYDROLOGY DATA
o LEAD CONCENTRATION 250 PPM
o LEAD CONTAMINATION 250 PPM
o SOIL DENSITY = 1.5 GMS/CC
o 50 PERCENT OF 9.5 x 10⁶ KG = 250 PPMLEAD
o 40 PERCENT OF 9.5 x 10⁶ KG = 1000PPM LEAD
o 10 PERCENT OF 9.5 x 10⁶ KG = 3000PPM LEAD
o 20 PERCENT OF TOTAL LEAD ASSUMEDAVAILABLE FOR SOIL-WATER REACTION
6 SOME SUBSURFACE LEAD AVAILABLE FORREACTION
o 44 INCHES RAINFALL/YRo 82 ACRES LANDo 50 PERCENT RUNOFF
62(J5b

TABLE 5-2 '
ESTIMATED TINES FRAMES OF FUTURE OFF-SITESURFACE WATER LEAD MIGRATION
ASSUMEDSURFACE • LEAD REMOVED . TIME FOR AVAILABLE SOILLEAD CONCENTRATION PER YEAR LEAD DEPLETION
0.1 1.4 x 10⁷ 117
' 0.2 2.7 x 10⁷ 58
0.5 6.8 x 10⁷ . .24 • . '
1.0 1.4 x 10⁷ . 12
(1) Surface water lead concentrations are in ppm (mg/L). Soil lead removalrates are in mg. Removal times are in years.
400167
6205b ^. .
' 150 ' • ' • ' . " ' - . ' .

TABLE 5-3 -. ' . .
ESTIMATION OF DOHNHARD SUBSURFACE LEAD MIGRATION IN GROUNDHATER^1 >
SOIL LEACHATE MIGRATION ' • DISTANCERATIO (GM/ML) TIME YEARS TRAVELED (feet)
0.15 • . 1 • . . 0.17
0.15 5 . . • 0.85-f
0.15 '10 ' . . 1.70 •
0.15 15 2.55
0.15 • ' • 20 . 3.40 .
' ' 0.30 1 ' . 0.34
0.30 5 . . 1.70
'.. 0.30 ' • ' 10 , . ' 3.40 / .
• . 0.30 . ' 15 - .5..10.
' 0.30 '?0 • 6.80 •' ' '.
(1) Notes: , • . ' ' '
Calcu la t ions assume soi l bulk densi ty = 1.5 gm/cm3; inf i l t rat ion rate2 0 ' i n c h e s per year ( 50 .8 crr,/yr) ' . . •
151 . . 4001686205.b . - . . . - • . -

COoJ<o
FIGURE 5-1PREDICTED SITE
SOIL-SURFACE WATER LEAD RELATIONSHIP
BASED ON ASTMSHAKE TEST DATA
2
zuiozoo
UJ
oCO
oo
(O
I I
0.5 1.0
AQUEOUS LEAD CONCENTRATION (MG/L)
1.5

FIGURE 5-2ESTIMATION OF SUBSURFACE
SOIL LEAD ADSORPTION CAPACITY
1.0a.•a.
O
zUJOzIDO
UJ_lULJt-<XO<UJ
0.1GROUNDWATER
STANDARD
o.i 0.5
SOIL LEACHATE RATIO GM/ML•
153'
1.0
400170

6217b
SECTION 6
OVERVIEW OF LEAD MOBILITY
AT THE
BURNT FLY BOG SITE
400171
154 .

6.0 OVERVIEW OF LEAD MOBILITY AT THE BURNT FLY BOG SITE
The overall results of these laboratory and field studies suggest that theenvironmental chemistry of lead at the Burnt Fly Bog site is both dynamic andcomplex. ' . .
6.1 Site Surface Soils and Surface Hater .
Measurements indicate that from 1000 ppm to greater than 3000 ppmconcentrations of total lead are present in many westerly wetland surfacesoils. The distribution of these very contaminated soils is highly variableand significant differences in lead concentrations can occur even in the samegeneral sampling areas. Surface lead concentrations can also varysignificantly with depth. At certain locations lead concentrations of severalthousand ppm in the top six inches of soil.may decrease to less than 100 ppmbetween six and eighteen inch depths.
. . .
One of the reasons for the high variability of measured soil leadconcentrations is that most of the lead appears to be concentra-ted on the fineparticle s i l t and clay fraction of contaminated site soils. Limitedmeasurements indicate lead concentrations in this fine particle fraction(< 74 microns) may be at least a factor of 3-4 times greater than overall leadconcentrations in. a given soil sample. In certain cases lead concentrationsin these fine particle fractions may exceed 20,000 ppm. Thus, although many .site soils may be more than 90 percent sand, most of the lead is in the siltand clay fractions. Evidence indicates that a significant fraction of thelead present in many contaminated site surface soils may be potentiallyavailable for leaching to site surface and groundwater. Depending upon thechemical conditions, as much as twenty percent or more of the total lead incertain contaminated so^s may be potentially available for leaching.Moreover, the results of both laboratory and field studies suggest that this%
available lead fraction is currently being leached into site surface asters inan ongoing process.
Laboratory desorption studies suggest that lead concentrations simil.ar to
those observed in site surface waters (0.2-0.5 ppm) can and will result-fromthe interactions with contaminated site soils. These desorption studies also
• - • . . • ' • - 155 • • '6217b . . • ' • • ' . 400172

indicate that the relatively large reservoir of available lead is slowly beingreleased to site surface waters .in ongoing interactions. That is, future leadrelease is.likely to be a slow long term process rather than rapid short-termone. As fresh relatively lead free influent surface water from off-siteupland areas or from rainfall moves through contaminated site soils lead isreleased to the surface water to reestablish equilibrium between the aqueousand solid phases. It appears likely that lead release to site surface watersis quite sensitive to surface water pH levels and accelerated by the acidic,character of site surface waters (generally pH < 4.5).
In the downstream areas, evidence suggests that processes including adsorptionto uncontaminated sediments and dilution will act to reduce surface water leadconcentrations. The measurement of relatively low lead concentrations (< 0.05ppm) in certain far downstream surface water samples (Ebasco Spring 1987Sampling Program) provides some support for this argument. It is also likelythat the effectiveness of downstream attenuation processes will be influencedby surface water pH levels. The introduction of any higher pH water. (pH-5 topH-6) from influent tributary streams should act to accelerate leadattenuation processes and reduce surface water lead concentrations.
Overall, storm events are likely to accelerate the downstream migration of.lead from site surface soils through several processes. First, assuming .thatsurface water pH .levels remain approximately constant, storm events willprovide a greater volume of water for reaction with lead contaminated soils.Laboratory experimental stgdies suggest that this should tend to .increase the .total amount of lead released per unit weight contaminated site soils. Stormevents may also act to erode the immediate surface soils of the WesterlyWetlands and expose additional lead contaminated hear surface soils to sitesurface water. Finally, storm events will move contaminated surface soils 1
downstream via physical transport and erosion.
6217b
400173
156 ' '

With respect to physical transport of contaminated soils it should be notedthat following downstream deposition, these soils may continue to desorb'leadinto the overlying surface water. Again, downstream lead desorption may bereduced if surface water pH levels increase above pH 5.0.
The results of empirical calculations Indicate that reservoir of available forlead release from contaminated site surface soils 1s quite large. Based onassumptions of slow lead release over time, it is projected that off-site leadmigration in surface waters might continue foretime periods in excess of 10years. '
6.2 Site Ground Water
Available laboratory and field evidence suggests that extensive downwardmigration of lead into, site subsurface soils and extensive lead contaminationof site ground water appears unlikely to occur.
Laboratory soil column studies suggest that surface water infiltrating throughsome contaminated surface soils may l.each significant (> .1 ppm) concentrationsof lead into the aqueous phase. However, the laboratory column studies also .indicated that uncontaminated site subsurface soils appear to significantlyattenuate the lead concentrations in leachates from contaminated soils.Contaminated soil leachates in excess of one ppm were reduced to below 0.05ppm during passage through uncontaminated soil columns, equal in volume tocontaminated soil columns.,
No -evidence of increases in uncontaminated soil column leachate leadconcentrations was observed over the approximately twenty-one day duration ofthe soil column studies. The volume of distilled water and/or site groundwater leachate passed through the laboratory co-iumns was estimated toapproximate the infiltration of 390 ml of rain. This 1s estimated to be theapproximate average rainfall over a four year period at the site.
157 400174

The results of sequential batch extraction studies also supported the soilcolumn results. At the high solid/liquid ratios characteristic of subsurfacesoil-ground water systems, uncontaminated site soilwas found to reduce thelead levels in contaminated leachates from > 1.0 ppm to less than 0.05 ppm in.one extraction. These results thus supporting those of the soil column tests.
Empirical calculations suggest that any downward migration of lead Into sitegroundwaters is likely* to be relatively slow. Calculations suggest thatdownward migration of aqueous lead concentrations of 0.05 ppm or greater mightbe on the order of 0.17 feet per year. This calculation does not, however,consider the potentially important influences of dilution by ground water orchanges in aqueous pH. .
The results of a limited ground water sampling campaign also support thelaboratory conclusions. Dissolved lead concentrations in ground water samplescollected during May 1987 sampling event were in all cases less than .thedetection l i m i t (0.01 ppm). These samples were collected from PVC and 'stainless steel wells located at a number of locations across the Westerly .Wetland.and screened in most cases at 10-15 feet. Although very limited,these results are encouraging. In particular, the relatively shallow ;screening depths, suggest that to-date leachate lead concentrations h-ave beenlargely attenuated within the first ten feet of soil. However, it should benoted that these results do not rule out possible lead contamination of thenear surface (0-10 ft) shallow groundwater zone which may exist at the site.
In addition to the subsurface soil cation exchange capacities and organiccarbon contents, it appears that site ground water pH levels may be a keyfactor in controlling ground water lead concentrations. Limited measurementsindicate that site ground waters are between pH-5 and pH-6. This 1'ssignificant since laboratory leaching studies Indicate that lead availabilityin contaminated site soils tends to drop rapidly as solution pH levels areIncreased above pHr4. It, therefore, appears the groundwater pH levels inconjunction with lead adsorption by uncontaminated site subsurface soils maybe Inhibiting downward migration of lead. Additional periodic sampling 1s,however, recommended to monitor groundwater-lead levels at the site.
158 ' 4001756217b •

6.3 Potential Treatment Options
Based on the results of laboratory mobility studies and preliminarytreatability studies certain treatment options may be effective at the BurntFly bog site.
The apparent concentration of lead on the fine particle fraction of'sitesediments suggests that sieving site soils might provide a means of reducingthe total volume of soil required for subsequent treatment. For a possiblysignificant volume of contaminated soil, removal of the fine particle fractionthrough sieving may reduce residual lead concentrations to levels which wouldrequire no further treatment.
The results of the preliminary treatability studies also indicate that washingsite surface soils with EDTA solutions may provide one potential means oftreatment. The effectiveness of soil lead removal using EDTA solutions islikely to vary significantly at different site soil locations.. Preliminary
•.
experimental results indicate that high iron concentrations in some site soilsmay interfere with the effectiveness of EDTA chelation and extraction of lead.It is suggested.that this approach could be considered for use on onlylocalized areas of the site containing the most contaminated soils.
The results of the mobility studies suggest that pH adjustment of surfacewaters might be effective in reducing dissolved lead concentrations.Increasing surface water pH levels to pH-5 to pH-6 or above coupled with somemethod of filtration and removal of particulate matter could reduce streamdissolved .lead loadings. It is, however, recommended that the effectivenessof this methodology and the previous soil washing method receive additionallaboratory or pilot scale testing prior to Implementation.
6217b159 - ' 400r76

SECTION 7.0
CONCLUSIONS AND RECOMMENDATIONS
160 ' • ' 4°°177
€217b ' • - . ' ' .

7.0 CONCLUSIONS AND RECOMMENDATIONS
The results of laboratory and field investigations indicate that theenvironmental chemistry of lead in surface soils at Burnt-Fly'Bog is complex.Evidence indicates that under certain physical/chemical conditions lead incontaminated surface soils may be mobilized into the environment.
The principal pathway of concern with respect to off-site migration of leadappears to be surface water runoff. Laboratory and field evidence indicatesthat contaminated site surface soils are responsible for and controlling thecurrently elevated lead concentrations (0.1-1.0 ppm) present in site surfacewaters. Laboratory studies also suggest that up to twenty percent or more ofthe total lead concentrations currently in site surface soils is available forreaction with and release to site surface waters. This release is likely tooccur as a slow long term process "ather than a sudden rapid reaction.Empirical calculations indicate that the available lead reservoir in site.surface soils may be sufficient to maintain elevated surface water leafconcentrations (0.1-1.0 ppm) for time periods in excess of ten years. •Available laboratory .and field evidence indicates that lead is'not likely tobe readily mobilized and transported downward and'off-site via site ground -waters. Laboratory evidence suggests that site subsurface soils arerelatively effective in attenuating the downward'migration of lead throughadsorption and/or precipitation reactions. Lead concentrations in sitesurface waters infiltrating into subsurface soils appear likely to be rapidlyreduced to relatively low (<0.05 ppm) levels. Limited ground water fieldmeasurements indicated current grounclwater dissolved lead levels to be low(<0.05 ppm) even at relatively shallow depths (10-20 feet). Empiricalcalculations suggest that any downward migration of more contaminated leadleachates (<0.05 ppm) is likely to be quite slow. .These results do not,however, rule out the possibility of lead contamination 1n shallow (0-10 ft)near surface groundwater at the site.
•
7.1 Recommendations
Based on the results of this study it is recommended that remediation effortsat the site should include consideration on the issue of off-site leadtransport via surface waters. Initial experimentation, indicates that
• 161 - - 4001786217b- . • • ' ' .

selective soil washing using EDTA solutions might be effective in removinglead from the most highly contaminated soils. Additional laboratory and pilotscale investigations would, however, be appropriate to assess the potentialextent of process interference from the high iron contents of many site soils.
The use of sieving to reduce the volume of lead contaminated soils at the siteshould also be considered. Lead appears to be concentrated on the fineparticle fraction of the soils'. Sieving could separate .out the mostcontaminated soil thereby reducing the volume of soil requiring treatment..
The -treatment of site surface waters by pH adjustment should also beconsidered in conjunction with any surface water treatment efforts.Increasing surface water pH levels to above pH-5 is likely to result 1nreductions of aqueous phase lead concentrations. Again, laboratory and pilotscale studies should be conducted to better assess the potential effectivenessof this methodology and the best means of implementing it onsite.
Available laboratory and field evidence suggests that lead is not likely toundergo extensive downward migration and off-site transport via sitegroundwaters. The possibility of contamination of near surface (0-10 ft)shallow groundwater cannot however, be ruled out. It is recommended thatadditional ground water sampling be performed at appropriate intervals tomonitor dissolved lead concentrations in site groundwaters below ten feet. Itshould also be noted that any source remedial treatment recommendations suchas soil washing could be of potential benefit to site groundwaters by removingthe potential for contamination
Finally, any alternative surface remediation efforts should be evaluated withrespect to potential impacts on site groundwaters. For Instance, any
* . •
remediation, alternatives which increase the volu.ue of surface water ,Infiltrating to site subsurface soils could Increase risks to groundwaterthrough Increased leachate lead loadings and decreased groundwater dilutioneffects. Therefore, caution should be «xcercised in the Implementation ofremedial alternatives.
162 4001796217b ' , •

SECTION 8.0
REFERENCES
. . - 1636217b 400180

REFERENCES
American Society for Testing and Materials. 1981. Standard Test Method forShake Extraction of Solid Waste With Water, D-3987-81, Annual Bootk of ASTMStandards, ASTM, Philadelphia, PA.
Brady, N.C. 1974. In: The Nature and Properties of Soils. 8th Edition.MacMillian Publishing Co. Inc., New York.. 639 pp.
r
W. Fuller. 1978. Methods for Conducting 'Soi1 Column Tests to PredictPollutant Migration in Land Disposal of Hazardous Wastes, Proceedings of theFourth Annual Sumposium, San Antonio, TX. p 87-1-05. . •
Harter, R. 1983. Effect of Soil pH on Adsorption of Lead, Copper, Zinc andNickel. American Journal of the Soil Science Socity. Vol 47, pp 47-51.
Houle, M.J. and D.E. Long. 1978. Accelerated Testing of Waste Leachabilityand Contaminant Movem?nt in Soils in Land Disposal of Hazardous Wastes,Proceedings of the Fourth Annual Symposium, San Antonio,. Texas, p 152-168.
Griffen, R.A'. and N.F. Shimp. 1976. Effect of pH on Exchange-Adsorption orPrecipitation of Lead from Landfill Leachates by Clay Minerals. Environ SciTechnol. Vol 10, 1976 pp 1256-1261.
McKenzie, R.M: 1980. The'Adsorption of Lead and Other Heavy Metals on Oxidesof Manganese and Iron, Australian Journal of Soil. Research Vo. 18, pp 61-7.3.
Page A.L. 1982. Methods of Soil Analysis, Part 2, CHemical and • .Microbiological Properties. Soil Science Society of America, Madison,Wisconsin. ' •
Rai, D. and J. Zachara. 1984. Chemical Attenuation Rates, Coefficients, and.Constants 1n Leachate Migration. EA-3356, Electric Power Research InstituteProject EA-3356, EPRI, Palo Alto, CA.
6217b
400181
164 •

Traver, R.P. 1987. U.S. Environmental Protection Agency personalcommunication. • .
US.EPA. 1979. Methods for Chemical Analysis of Water and Wastes. EPA600/4-79-020. Washington, DC.
USEPA. 1982. Test Methods for Evaluating Solids Wastes, Physical. ChemicalMethods Environmental Protection Agency, Report SW-846. Washington DC.
' . . 4001821 6 5 • • / ' • - • ' .
6217b • ' - . ' : .

APPENDIX A
LABORATORY METHODS
SERIAL BATCH EXTRACTION
TEST METHOD
SOIL COLUMN STUDY METHODS
ASTM/EP TOXICITY TEST METHODS
- . 400183*
68665 ' ' \»
A-l

SERIAL BATCH EXTRACTION TESTS ••
The purpose of this procedure is to describe the methodology by which solidsamples w i l l be leached using a serial batch extraction method (Hittman EbascoMethod 4004) which is based on Interpreting Results From Serial BatchExtraction Tests of Hastes and Soils by Martin J. Houle and Duane. E. Long,March 1980.
Summary of Method* • *
The method developed by Houle and Long entails batch leaching a solid samplewith progressively larger volumes of leachate. A sequence of three (3)extractions is conducted on each contaminated soil. With each extraction, theratio of 'leach solvent to solid is increased according to the referencedmethod. After leaching for 24 hours, with occasional mixing, theleachate/solid solution is filtered. The resulting leachate is filtered againand preserved for analysis while the remaining solid is returned to theextraction vessel and the next volume of leachate added.
To simulate the leaching of a contaminated soil into an uncontaminated soil,the leachate from each extraction is contacted..With a s,.eries of soil samples.As with the waste sample, the ratio of leach solvent-to solid is increasedaccording to the method.
Equipment
4 L Plastic Beakers
Buchner FunnelsWhatman 54 Filter Paper
Gelman 0.45 Filter
•Erlenmeyer Flasks With Side Arms.Vacuum PumpMettler Electronic BalanceGelman Filtering ApparatusGraduated Cylinders
400184
A-26866b " .. ' , ,

Reagents
Oven- D i s t i l l e d , Deionized Water- . 1 : 1 Nitric Acid
Procedures
Sample Preparation
Determine the percent moisture of the solid by placing a weighed sample in anoven at 104°C for 24 hours, cooling in a desiccator until a constant weight isattained and recording the weight. The calculation for percent moisture is:
, AI - A£ x 100 where AI - original "wet" weightA2 = "dry" weightAT
The weight of the "wet" solid equivalent to 300g "dry" weight is thendetermined.
For the leaching of a contaminated soil through an uncontaminated soil, adetermination of the amount of liquid recoverable from that soil afterextraction is to be performed. This determination is accomplished by.contacting a measured amount of liquid with a weighted sample of soil for 24hours, filtering the mixture and measuring the amount of liquid returned. Theresulting calculation is:
B] - 62 x 100 where BI « original vol. of liquid62 " recovered vol.-of liquid
BI
The result is the percent recovery of liquid from a particular soil. /
Extraction
The extraction process is Illustrated 1n Figure 2-3.
300gm of contaminated soil (soil A) w i l l be leached in the initial'extractions. The-weights for the uncontaminated soils (soil B) will be ISOgm
A-3 • 4001856866b

for the first soil extraction, lOOgm for the second soil extraction, and 50gmfor the third soil extraction. The amount of uncontaminated soil B used mayvary slightly due to recoverability of leachates.
The correct weight of "wet" sample is placed in an extraction vessel (4L plas-tic beaker) and the appropriate volume of leach solvent added. This volume isdetermined by subtracting the amounts of moisture in the sample from the orig-inal volume. This allows for an accurate liquid/solid ratio to be maintained.
The sample is occasionally mixed, 4 to 5 tiroes, over a 24-hour period. Thesample is then filtered under vacuum using hardened filter paper (Whatman 54)in a Buchner funnel.
A measured aliquot of the Whatman 54 filtrate is then used for contacting withthe uncontaminated soil B.
The remaining aliquot of the Whatman 54 filtrate is then preserved foranalysis by first filtering through a 0:5 micron Gelman filter, then measuringand recording the volume and the pH. 1:1 HN03 is then added to pH 2.
The remaining contaminated soil A, is placed in another extraction vessel andthe next volume of flush leach solvent added to attain a 10:1 liquid/solidratio.
The extraction process is completed at the 10:1 ratio and at a 20:1 or 30:1ratio.
In order to simulate the effects of leachate movement through uncontaminatedsoil, the filtrate resulting from each sequential extraction of contaminatedsoil is mixed with the first of three batches of soil B. This 1s showngraphically in Figure ?.-3. '- ••
The Initial weight of the contaminated soil A and of the three soil samples.,will be;calculated using the percent recovery data. The amount ofcontaminated soil A and uncontaminated soil B used must provide sufficientvolumes of recovered leachate for analysis and for leaching the n&xt batch of
soil B. The.amount of leachate required for analysis is dependent on -thenumber of analyses requested.
A_4 400186
6866b

The uncontaminated soil B is contacted with the leachate for 24 hours, thenfiltered through a hardened filter. An aliquot is split off for 0.45 micronGelman filtration and analysis with the appropiate volume of the remaining'-filtrate being added to the next batch of soil. The uncontaminated soilexposed to the first contaminated soil extract is recovered and mixed with thesecond leachate1n the series. This is repeated until the leachate has progressed through allthree soil batches.
Sample Preservation
The 0.45 micron Gelman filtered sample is preserved at pH 2 and stored underrefrigeration until analysis.
Sample Analysi s
Each leachate sample .should be analyzed for dissolved lead. Backgroundleachate sample should be analyzed for alkalinity, sulfate,.chloride, andtotal organic carbon. '
6866b
400187
A-5

SOIL COLUMN STUDY .METHODOLOGY
The purpose of this1 procedure is to describe the'methodology by whichcontaminated soil and soil samples will be leached. Certain column tests w i l lbe run using air dried soils and certin tests will be run on field moistsoils. For the air dried soil columns, the method ;is a modification of HEAImethod 4005 which is in turn based on Methods for Conducting Soil Column Teststo Predict Pollutant Migration by Wallace H. Fuller, March 1978.
Summary of Soil Column Methods
The soil column methods call for the leaching of a contaminated soil by leachsolvent, and in certain tests, passing the resulting leachate through anuncontaminated soil sample. Both contaminated and uncontaminated soils areplaced in. sealed PVC columns and the columns are connected by tubing with aclamp inserted. The leach solvent is gravity fed from a head reservoir soconstant flow and pressure is attained between 0.5 to 1 pore volume/24 hours.
.•
A minimum of approximately 21 pore volumes of leach solvent w i l l be passedthrough the columns. The pore volumes w.ill be composited and samples fromeach column analyzed. In ea:h experiment''samples .will also be taken after theleach solvent has passed through the contaminated soil column but prior to theuncontaminated soil column. Up to eight columns will be run with eachcontaminated soil being leached in duplicate. . •
Equipment
PVC Columns (5 cm x 22 cm) w/top and bottom end plates,*
Manifold Distribution Apparatus. . •" .
Leach Solvent Head Reservoir. .- . ••
Polyethylene Sample Collection Bottles.
' ' 4001886866b . ' •',''

Reagents
Distilled, deionized water.
1:1 Nitric Acid.
Procedures and Equipment Set-Up
The columns are cut to size from PVC piping. Column size is a minimum of 5 cmi.d. x 22 cm long. Each column w i l l have top and bottom plates attached afterthe waste or soil has been properly placed. Inflow and outflow plugs will beplaced in each column on the top and bottom plates. For most columns, twocolumns wll be attached by tubing with a clamp inserted so that sample of theleachate from the contaminated soil can be sampled prior to contact withsoil. For air dried soils the contaminated soil sample will be placed in thebottom column with uncontaminated soil in.the upper column. See Figure 2-4(Column Testing Apparatus). It should be noted that in certain tests theleaching solution w i l l be analyzed after passage only through a contaminatedsoil column with no passage through uncontaminated soil.
The leach solvent w i l l be fed to the columns from a head reservoir locatedabove the columns. The leach solvent will be gravity fed at a fate of 0.5 to1.0 pore volumes/24 hours. The method of gravity feeding w i l l be accomplishedby a manifold which will feed each column set simultaneously.
The column effluent w i l l collect in polyethylene bottles.
Flow rate will be recorded daily for each column.
Sample Preparation
Air dried soil samples will be packed into their perspective columns by thefollowing method-. 1.0 cm of quartz sand 1s placed in the bottom 6f eachcolumn. A layer of air-dried soil (1-2 cm thick.) 1s spooned Into the column,packed uniformly with a round ended thick glass rod or a steel rod covered
6866D ' - -. 400189
- A-7 -

with durable plastic, and repeated until the column is filled to thepredetermined mark (23 cm). A top layer of quartz sand (1.0 cm) is placedover the packed soil. From measuring the amount -of material in each columnand by calculating its volume, several physical parameters of the packedcolumn w i l l be determined. These parameters are soil bulk density, soilparticle density, soil porosity, and soil volume.
For field moist soils, samples w i l l be leached in the PVC columns in whichthey have been collected in the field. The direction of leachate flow infield moist columns w i l l be the same as leachate flow through the air driedcolumns.
Soil Bulk Density Determination for Air Dried Soils
Dry 1 kilogram of soil overnight at 105°C.
Weigh an,empty 5 x 22 cm PVC column and-.record the weight.. :Pack the column aspreviously described. If the entire amount of dry soil does not fil::l thecolumn, measure (in cm) the height of the soil in the column. Record thismeasurement. . : ;
Determine the volume of the column by the following1 calculation:
Vol t 3.14 x r2h where:r = :radius of column
:
h = height of column
Determine the weight of the soil packed Into the column by either weighing thepacked column and subtracting the empty column weight, or by determining theamount of dry soil taken from the I kilogram dried aliquot.
6866b . 400190•• . A-8 , ' , ..

Calculation for Soil Bulk Density for Air Dried Soil
VolcBD, where:
M « mass of the soil packed in the column.Vol • volume of the column.
Solid Particle Density Determination for Air Dried Soil .
Tare weigh a clean dry 100 ml volumetric flask.
Add 50 grams of soil, then clean the outside and neck of the volumetric flaskto remove any s p i l l e d solid. Reweigh the flask, soil, and glass stopper.Record these weights.
Determine the water content of a duplicate sample of the soil by dryingovernight at 105°C.
F i l l volumetric flask approximately half full by rinsing the neck and anyadhering solid particles with d i s t i l l e d water and gently boil for sev.eralminutes to remove entrapped water. Cool to room temperature.
After cooling fill the volumetric flask to the mark and thoroughly dry theoutsid.e of the flask and stopper.
Weigh the volumetric flask and record the weight and temperature.
Remove the solids from the volumetric flask and- refill to the mark withdistilled water, at the same temperature as before. Replace the stopper andthoroughly dry the outside of the flask. WeVgh'the flask and record theweight and temperature.
4001916866b
A-9

Calculation of Solid Particle Density for Air Dried Soil
d.wDp = (W s--W a) - (Hsw-Hw) where:
d = density of water In grams per cubic centimeter at temperatureobserved
W « weight of volumetric flask plus solid sample corrected tooven-dry condition
H = weight of clean, dry volumetric flask filled with -aira .W = weight of. volumetric flask f i l l e d with solids and wateri W t
Ww = weight of volumetric flask filled with water at temperatureobserved.
Soil Porosity Determination for Air Dried Soil
The determination of soil porosity is by calculation, employing the values 'forsoil bulk density in the packed column and soil par'ticle density. Thecalculation is:
BDs where:
PS - 1 - Dp ,BO = soil bulk density in the packed columnD = soil particle density in the packed 'column
Pore Volume Determination
The determination of pore volume (P vol) is by calculation, employing thevalues for soil porosity in the packed column and the volume of the column.
The calculation is: * ••
Pvol. « Ps X Volc - where:
PS «= soil porosity in the packed columnVo1c «" volume of the column
6866b 400192
A-10

For field moist soils, pore volumes will be based on estimated soil porosityvalues.
Sample Preparation
The sample is then 0.45 micron Gelman filtered, preserved to less than pH 2and stored at 4°C.
Leaching Procedure
At least four experiments w i l l be run with each experiment being run induplicate (i.e., 2 columns each). In each experiment the soil columns will bebrought to saturation equilibrium with water or leach solvent before samplecollecton begins.
Leaching Procedures
The overall leaching procedures for all columns is as follows.
Initially a total of 21 pore volumes of distilled water (or ground water) w i l lbe passed through the underlying lead contaminated site soil. ..
The distilled water (or ground water) leachate w i l l subsequently pass througha sample of site subsoil of low lead content.
Samples of distrlled water w i l l be analyzed both before and after passage,through the contaminated and uncontaminated soils system.
o Prior to experimental initation one pore volume of distilled waterwil l be passed through the upper (uncoataminated) subsoil samplewhile bypassing the lower contaminated soil sample. This sample willbe analyzed for total and/or dissolved lead.
4001936866b
A-ll

One blank sample of the distilled water w i l l also be analyzed fortotal lead, dissolved lead, s,ulfate, chloride, alkalinijty, total
\ '
organic carbon conductivity and hardness at the start of theexperiment'.
Following the passage of approximately 1 and 3 pore 'volumes .ofd i s t i l l e d water through the contaminated soil, 100 ml ali.quots w i l lbe collected (from a three-way valve betwen the two soil columns) andanalyzed for pH total lead and dissolved lead. Subsequently, 100 mlaliquots w i l l be collected from this sampling port following thepassage of specified numbers of pore volumes of distilled waterthrough the contaminated soil column, until 21 pore volumes ofd i s t i l l e d water .have passed through.
Appropriate pore volumes of leachate passing through theuncontaminated soil w i l l be analyzed for total lead, and/or dissolvedlead and pH. TOC w i l l be analyzed, following filtration'on certainsamples. Composite pore volume 4-5 wi l l also be analyzed foralkalinity, total lead, chloride, sulfate and conductivity andhardness in certain experiments.
6866b . .. - -..;•• 4°°194
A-12

i
3
Detignatlon: D 3987 - 81
AMERICAN SOCIETY FOB TESTING AND MATERIALS19t6 R»ci St..Phil»dflphi».r». J81C3
W»pr!nt»d from the Annual Book of A.STM St«r>d«r(Ji. Coavr>V*t ASTMIt rvot liurd in thi eurtoM combined indii.will appear in th« rnn •dmon.
Standard Test Method forSHAKE EXTRACTION OF SOLID WASTE WITH WATER1
Tku U»nd»r4 it iuurd under tkt furd tftiifuiion D )'f the aumbrr •nmrdjitK follo»»{ ihr oVuftniior indi.iirt ihcyu: oConiifu: »dopuot> of. « ikt C*M of toinoci UK jrcai oTIui itMueB A ftymbci » pitrnilMini>v4icair> iht > c < > of tin
T
J
IJ
J
J
JJi
1.
1.1 Thii roethod coven • procedure fork*chin| of lobd wuie to obt» in oc »qucouscoluiion to be used 10 ceiermiDt the matertibk*chcd uoder the ipecified tesiLnj condiuons
J.2 Ii provide* Tor the ihakicg of t knownweigh! of wute with »i(er of specified com-pos IUOD and the tepiratioc of the aqueousphase for acaJysis.
2. Applicable Document*
2.1 ASTMD75 Sampluig Ag|regaies*D 4.0 Recommended Praniee for Inveslign-
ic| and Sampli££ of Soil and Rock forEngineering Purpo»esl
D 1)29 Defiriiions of Termi Relating to Wa-ier3
D 1)93 Specification for Reagem Water1
D I S K S Tests for Paniculate and DiuolvedMailer in Water5
D2216 Laboratory Determination of Mois-ture Cooieoi of Soils'
D2777 Practict for Determination of Preci-sion aod Bias of Methods of CommitteeD-19 oc Water*
D 223-4 Collection of i Ore's Sample ofCoaJ*
D 3370 Practices for Sampling Water5
£ 122 Recommended Practice for Choice ofSample Size to Estimate the AverageQuality of a Lot or Proceis1
3. Significance tod Vvc3.1 This method is intended as a' 'rapid
means for obtaining an extract of solid waste.The extract may be used to estimate the releaseof ceruia consul uenu of tbe solid waste under
the laboratory conditions described in this pro-cedure.
3.2 This method n not intended to providean extract that is representative of the actualkachate produced from a solid waste is thefield or to produce extracts to be used a~ thesole basis of engineering design
3.3 This method it not intended to simulatetile-specific leaching conditions It has not beendemonstrated to simulate actual disposal sitekaching conditions. .
3.4 It is intended that the final pH of theextract reflect the interact^:, of the extraciamwith the buffering capacity of the solid waste.
3.5 It is intended that the water-extractionsimulate conditions where the-solid waste is thedominant factor, in determining the pH of the.extract.
3.6 Tbe method produces an extract thai isamenable to the determination of both majorand minor constituents When minor constitu-ents are. being determined, it is especial!) im-portant that precautions are taken in samplestorage and handling to avoid possible contam-ination of the samples.
3.7 This method has been tested to deter-mine its applicability to certain inorganic com-ponents in the tolid wane (ue Apptndu X I ) .The method has not been tested for applicabil-
'Tfcu nrtKed u antfrT ibt juradmion ef Committee F>)4 or **iit Dupow! bnti u the dutn rttponubilm oflubcommiilrt D V Or en E»»nion«nd Lochlir Tftiinf
Cunt BitdiuOBtpmo^Td Mjtck It l » f l
•/ 4 5 TM Su*4,
ttn 19Nn 31f « n Jtf»ni I) end t\
400195
A-13'

J
• 1
1
J
J
J
J
JJ(
hy to organic substances and voUiilc miner(tee 53)
J.g The agi ta t ion technique and rale and theliquid-io-solid ratio specified in the proceduremay DOI be suitable for extracting all types ofaoLd watte. (See disoutiion in Appendix X2.)
4. Definitions
4.1 For definitions of Urms used inmethod, tee Definitions D 1129.
this
$. Apparatus5.1 Agitation Equipment— Agitation equip-
ment of any jype lha: will produce constantmovement of the aqueous phase equivalent tothat of a reciprocating, pi it form thaler oper-ated at 60 to 70 1-ifi. (25-mm)c}cIei per minutewiihoui incorporation of air is suitable. A cyclethai! be understood to include one forward andone equal return movement Equipment usedshall be Jesigned for continuous operationwithout beating the samples being agitated (teediscussion of agitation in Appendix X2).
5.2 Mtmb'ont Filter Xj-lfmfe/):—A borosili-cate glass or itainles- steel funnel wits a flat,fritted bivf of the ume material and membranefilters.
5.3 Containers— Round, wide-mouth bottlesof composition sui table la the nature of thesolid waste and the analyses to be performed,and constructed of materials that will not allowtorption of constituents of interest. One-gallon(or 4-litre) boitlei shou'd be used with 700-gsamples and H-g»l (or 2-L) bottles with 350-gsamples Multiples of these sizes may be usedfor la rger samples TH>e sizes were selected toestablish suitable geoVneiry and provide'thatthe'vample plus l iqu id would occupy approxi-mately &0 to 90% of the container BotUevmusthave a watertight closure Containers for sam-ples where gases ma\ Ix released should beprovided with a venting riechanism. (Note thatthe venting of the container has the potentialto afTect the concentration of volatile extractsin the extract.)Coniamen should be cleaned ina manner consistent with the analyses to beperformed.
(. Reagents6.1 Purity of tteaientt—Reagent grade
chemicah shall br used in all tests UnlessOtherwise indicated, it it intended thai all re-agents thai) conform to the specifications of the
0 3987
American Chemical Society, where tueh spec-•ificatioos are available.' Other grades may betsed, provided it is first ascenained that thereagent is of sufficiently high purity to permitiu use without le we Ding the accuracy of thedetermination
6.2 hiritj ef Waier—Unless otherwise indi-cated, references to water shall be understoodto mean Type IV reagent water at l§ to 27*C(Spectficatiot) D 1193).
7. Sampling7.1 Obtain a representative sample of the
•olid waste to be tested using ASTM samplemethods developed for the specific industrywhere available.
7 J Where DO specific methods are available,•amplifig methodology for materials of similarphysical form shall be used.
7J A minimum sample of 5000 g shall betent to the laboratory (see Method E 122)
7.4 li is important that the sample of thesolid waste be representative with respect tosurface area, as variations in surface area woulddirectly affen the leaching characteristics of the•ample Solid waste samples should contain arepresentative distribution of panicles sizes.
7.5 Keep samples in closed containers ap-propriate to the sample type prior to the ex-traction in order to prevent sample contami-nation or constituent low Where it is desiredto extract biologically or chemically active sam-ples; in their existing state, store the samples at4*C (Practices D 3370) and sun the extractionwithin 8 t Where it is desired to extract suchsamples in a state representative of the resultsof biological or chemical activities, the samplesmay be specifically handled to simulate suchactivities Record the storage conditions andhandling procedures in the report
f. Sample PreparationIII For free-flowing paniculate solid »»itei,
obtain a sample of the approximate size re-quired in the let! by quartering the sample(Section 7) received for testing on u ireper-Be-able sheet of glazed paper, oil cloth, or other
• *1lt»|t»'Ckcm»e»U. AmchUB Chemical SonciySpK-tficttiou. Am CktmiulSoc ,%uhin|toB.D C For wj•aiiont MI Ike i«i*| of rr«|tnu BO< luied b) iht AmmanCkcmicat Socitly t*t ~Kci|cni Cfcrmicil* »rv<! Sundirdi *^ lotcph Rotm D VM No»tiii»d Co.. lx..»ir» Yori.K
' V. aM Uw ~U»MC< Suio PkarmuDpri* *
400196
A-14 .-

1
iClf>
flexible material u follows:1.1.1 Em pi) the umplc container into the
center of the sheet.1.1.2 Flatten oui the umplc gently with a
suitable straightedge unti l it ii spread uniformlyto * depth 11 le»ii twice the maximum paniclediameter panicle Kit.
1.1 J Remix the umple by lifting a comerof Ihe sheet and drawing it across, low down,to the opposite comer in a manner that thematerial is made lo roll over and over and doesnot merely slide along Continue operationwith each comer, proceeding in a clockwisedirection Repeal this operation ten times.
1.1 4 Lift aU Tour corners of the sheet to-wards the cepter and holding aU four cornerstogether, raise the entire sheet into the air toform a pocket for the sample.
8 1.5 Repeat Step 8.1.2.1.1.6 With a straightedge at least us long as
the f la t tened mound of sample (such u a thin-edged yard sl ick) , gently divide the umple intoquanerv AD effort should be made to avoidusing pressure OB the straightedge sufficient 10CJUK damage to the panicles.
8.1.7 Discard alternate quanersI 1.8 If funher reduction of umple size is
necessary, repeal Steps 8.1.3 through 8.1.7. Aminimum umple size of 350 g is recommendedfor each extranion Addit ional umples shouldbt provided for deierminatio/i of solids content.If smaller samples are used is the lesi, reponthii fan.
8.2 For field-cored solid wastes or castingsproduced in the laboratory,cut a representativesec1'on weighing approximately 350 or 700 gfor testing, plus umples for determination ofsolhds coDtcDi. Shape the umple so that thekaching solution will covei the material to betested
8.3 For fluid solid wattes, mix thoroughly ina manner that does Dot incorporate air to assureuniformity before withdrawing n 350 or 700-gumple for test Take umples for determinationof solids content at ibe ume tine u ibe testsample. •• ••
f. Procedure9.1 Record the physical description of the
umple to be tested including panicle sue sofar u it is known.
9.2 Solids Content—Determine the solidscontent of separate ponions of the umple u
D 3987
follows.9J.I Dry to constant weight two dishes or
pans of size suitable to the solid w a s t e beingtested at 104 i 2*C. Cool in a desiccator andweigh Record the value to i 0 I g
9.2.2 Put an appropriately sized portion ofumple of the solid waste to be tested into eachpan Scale the weight used to the physical formof the solid waste tested Use a minimum of 50g but use larger umples where panicles largerthan 10-mm in average diameter are beingtested Weigh Record the weight to i 0 I g
9.2.3 Dry 16 to 20 h at 104 ± 2"C Cenain•olid wastes, such as scrubber sludges, maycontain compounds that arc subject to calci-nation at the specified drying temperature. Drythese compounds at lower temperatures Forexample, gypsum may be successful!) dried at45*C (Method C 471) and CaSCVl/QHjOwastes at 85*C. Record the actual temperatureand lime of the drying period.
9.2.4 Cool to room temperature in a desic-cator and reweigh Record the weight to i O.I
9.3 Shake Procedure—Vt'tifh or tare thecontainer to be used-in the shale test to theoearesi or wiihic 1 g
9.4 Add the container approximately 700 gof solid waste (Section g) and determine andrecord the weight of umple used to 1 g Ifweights other than 700 g are used, note in therepon.
9.5 Add to the container'a volume of lestwater (6.2) equal in milhliires to four tunes theweight'in grams of the umple used in 9.4. Seediscussion of dilution ratio in Appendix X2.
9.6 Close the container Inven the containerapproximate!) 25 limes per minute for 3 minPlace the container upright on the agitationequipment
9.7 Agitate continuously for 48 h ± 0.5 h atIt to 27°C
96 Open the container Observe and recordany physical changes in the umple and leach-ing solution.
9.9 Shake the container to mix the entireumple thoroughly Let the umple settle for Smin. then separate the bulk of the aqueousphase from solid phase by decantation. centrif-ugation, or filtration through filler paper asappropriate Then vacuum or-presiure fiher theliquid through a 0 45-pm filter. If these sepa-ration means result ic prolonged filtering tune.
j
A-15
400197

J»
JJJJ
1
1
ii
• l->im filler ot other device may be u*ed.Record any such deviations in the report
9.10 The filtrate obtained in 9.9 is the extractmentioned elsewhere in this method Measurethe pH of the extract immediately, then pre-aerve the rxiraci in • manner comment withthe chemical analysis or biological letting pro-cedure* lo be performed (Practices D 3370) Ifsufficient liquid phase is not available for theanalyses, to indicate in the repon and do notcontinue the procedure, or alternatively, per-form the extraction procedure on additionalsamples of the solid waste to obtain sufficientliquid phase Where phase separation occursduring the storage of the extract, approprij»emixing thould be used to ensure the horri^t-Beity of the extract prior to iu use ic suchanalysis or testing
911 Analyze the extract for specific constit-uents or propeniet or use the extract for bio-logical testing procedures.as desired using ap-'propriate ASTM s tandard methods. Where noappropriate ASTM methods exist, other meth-ods may be used and recorded in the repon.
10. Calculation
10 1 Calculate the solids content of the in-d iv idua l samples from the data obtained in 9.2au folJowj
S-A/B
where:A .*> wright in grams of umple after drying.B - original »eighi in grams of umple. andS - aobd cooient. g/gAverage the two values obtained Record as theaolids cootem
11. Repon
11.1. The repon ihal! include the following11.1.1 Source of the tolid waste, datt of
D39B7
sampling and sample preservation used.11.1.2 Description of the solid waste includ-
ing physical characteristics and panicle tire, ifknown (91).
11.1.3 Solids content (9.2).11.1.4 Sample weight if other than "700 g11.1.3 Drying time aVd temperature if other
than 16 1020bat 104 ± 2*C,11.1.6 pH and results of specific analyses
calculated in appropriate units State analyticalprocedures used, and filter used if other than0.45 pm, . '
11.1.7 Observation of changes in test mitt-rial or leaching solution recorded in 9.8
11.1.1 Date leach testing .staned. preserva-tion used for extract, and date of analysis
12. Precision and Aecwary
12.1 No information b presently availableas to the precision or accuracy of the analysisof specific constituents in the extran It is rec-ommended that usen of this test validate theapplicability of their chosen methods of detec-tion by spiking ponions of the extran. beforeusing these methods for the analysis of theex (ran.
12.2 Based on a collaborative series of testson'Six solid wastes including fly ash. scrubbersludge. API separator sludge, metal finishingwaste, textile waste, and soil, the precision ofiron and calcium determinations for these spe-cific solitf wastes was measured. Informationon the lest program is provided in AppendixXI .
12.3 The precision of this method may varydepending on the solid waste being tested andon the element being extracted
12.4 Determination of the accuracy of thismethod is not possible, as no standard referencematenaJ exists
400198
A-16

D 3987
APPENDIXES
XI. COLLABORATIVE TEST PROCKAM '
3
Xl I Btsed on a colUborativt teries of mis on iix•olid wastes mclud_un{ fl> ash tcrubhtr tludgc. APItepiritor s lwd te . meul f in ishing «utc. teitile wute.end soil the precision of this method for these specifictnaitnals. including vanabili t) of the extraction lest• nd the analytical procedure. m»y be expreued ajtho»n belo* Twent) one laboratories participatedin the collaborative lest program, and each of the uitolid mutes «aj tested b) at leut five of the labora-tories, with a »ingle operator performing three ex-traction replicates : The collaborative test program•u conducted with both an vnclear dermitior. ofwbejher a itrole constiiuted fo»»rd-reiurr. tcove-ancnt (tee 5.1) and without the inversion instruction(tec 96) It bu not been determined ho» this eon-*nbuied to the observed deviation
Xl 1 I For calcium in concentrations ranging be-twetn 2.8 and 220 mg/L:
S, - O.JIU* «J6
f. - 0 192JT - 139when:Si • overall pre-riuor.5. •• lingle^peiaior precuion. andX • determined concentration of Ca. mg 'L
Xl.f .J For uon. in conceitirauom rjngmf from0.06 and 1.4 mg/L:
i.-O.MU - 0.023
»here5i <• overall precition.f. • wn|le-operaioi prtciuon. andX » deiennined concentration of Fe. m; 'L
' *Tbr cetltbontior diu *rr oe fik >< ASTM H t » d q u > ' -terv l»l t Rit t Si . fh, l»dt!phi» l>i I? 1C1 (ni! mj\ be•buirtttf oa tote b> n^u«tii)|RR DI ' - ICX*.
Xi. AGITATION TECHNIQUE AND »ATt. AVD LIOL'ID/SOLID ItATJOS
XT I U'hile the m»jor ttTon relitivr to develop-tneni of the ten method has been undertaken at ibctf miion rair and I/quid 'irhd raiioi rpcnfied in ibcmethod it is rccogmted thai these variables mi\aignificantl) in f luence the results on crnain tolid• asies. and that the> ma) not be adequate TOT ctnamtolid whiles
X^ I I Tbc possible eflera of varying ihr igiia-tion t echn ique and rate include degree of mixing rateof release of constituents, and panicle abrasion ef-
fccxs The precuton of the method ma\ also be influ-enced
X2 U The pouihle cffecu of vaning the dilutionratio include degree of mixing rate of release ofcofivntuenii (and pouible concentration tlTe'ci' de-ptndin| nnavailabilnx). and pinictttbrasicm elfects
X2.2 The agnation technique and ratio and di-lation raiir used b» other piop^td extraction me;h-•ds differ from ihote used in this method
^A Servfi /b' Ttnt*if***rrito* •!'* f> > urm mmttemrd intf »*t mtcti faint nfku. o*4 ito rut
£ Htftatri ae potato*tt'i of tkii voxdatf mifti n|A/j. tn m»t(\ ikr* •>* nifotuit*lii\
'
«wt fjrfftf nf*i> t<irri4
TVOJ^J if net
'1 a t*kj. tllkf
i ic rrnuo* 01 n't t\ wrkiuu! etmmurittff m\*tj tllkf fo* rt\tHO* if Ikl* UO*4a'j *rfvr «^Jn>f»IS/
Your to*v*r*it »W/ rrrritr t *ftfu! ro*HJtrei»»* fi • mrritn} *f.i*rrtifotuioit ifektirmt tommjiifr. »A/rA r»» M«I mnr*4 If tovfrrl tkat »»»' tommrmn A0^r mot tntittt tft" teti'mf \o» t*o»Mmskt itnc nni *ae«« re (Ar ASTM Comminn Of Sit*Jo>4l /«/6 left i; . ftultJtlfkie ft /«/('.'. •*"•« mill tettft,,r t
i In fnii "l" '"l ,"•' to*imr*ii ftiliff uii^ftiv lltrrt. !•• •»> tffttl if lit ASfM tofJ •/ tkrmo'i
j3
400199
JA-17

1J
1111J1
t
1
JJJJJ
•>';^«;y-V.V;.-;
'tKt&^t&i:L*>-• *•&&*• C^V.;; :!.;'• -.;Vrtj5>.V*5.-''-y>iV*Si ""'t J- * '.-.t.^v--.— f • ^: . "TJ jr—~"»..Vi:i.-> •>•<.•*-• 7-, f-\\ - -ACu-U-•:i> '.v.*r < C L? I ••. •- V -^v-^ix*:^ , 4 rHv- '.v<f£4^->,*-*- -*T r~i ..-A-;•••-..< t.-.'gi r Jt-^%'-.'-I'.'-/'.'-I •-» -7T-^« i-J fc-*»—• 1- ^
. »ukr.A*-,*
Protection ofEnvironfnent
40PARTS 190 TO 399Revised as of July 1, 19&3
•f.
400200
A-18

Ii
]]]1ii
Pan 261. App. n
This manual also e«nUlns additional in-formation on application of these protocols.
II—EP TOXICITY TKTPR oc counts
A. Extraction Froettvrt (tP)1. A representative aample of the waste to
be tested (minimum sire 100 grams) thai] beobtained using the methods specified In Ap-pendix I or any other method capable olyielding a representative sample within themeaning of Fan 360 [For detailed g-utdaneeen conducting the various aspect* of the EPsee "Ten Methods lor the Evaluation ofSolid Wasu, Physical/Chemical Methods"Clncorporated by reference, see I 260.11).)
S The aample ihill be separated Into Itscomponent l iquid and solid phases uilni themethod described In "Separation Proce-dure" below. U the solid residue • obtainedusing thU method totals leu than 0.5% ofthe erlginaJ weight of the w-aste. the residuecan be discarded and th( operator shalltreat the liquid phase as the extract andproceed Immediately to Step S.
1. The solid material ob'-alned from theSeparation Procedure thai) t* evaJuat*d forla particle size. If the solid material has osurface area per tram of material equal to.or greater than. » 1 cm1 or paues through n•.S mrc (0.375 inch) standard sieve, the oper-ator thai' proceed to Step 4 If the turfitearea b smaller or the part.iclf all? largerthan specified above, the solid materialShaJl be prepared for extraction by crush-int. cutting or grinding the material ao thatIt paists through a Si mm (0.37S Inch) sieveor. If the material Is In a tingle piece, bysubjecting the malerta.' to the "ElructuraJIntegrity Procedure" described below.
4. The solid material obtained in Step IshsJ) be we ighed and placed in an extractorwith 1C tunes IU w-eight of delonlied water.Do no', allow the maierltJ to dry prior toweighing Tor purposes of 1hu> test, an ac-cep'-abic exlmcLor is one which wUl impart•uf f ic len t arlLallon to the mixture to notcnjy prevent itrallficatlon of the aampleand extraction fluid but aUo Insure that allaample curfaces are continuous]) broughtlaic eoniact with veil mixed extractionfluJd.
•The percent oollds Is deUrmtned bydrying the fil ter pad at 10'C until n reacheseonstant weight and then calculating thepercent aolidj using the following equation:
Percent aollds •
K100
Title 40—ffofeclion of Ihviror\mtM
S. After the solid material and delonlz«dwater are placed In the extractor , the optrator shall begin agJtalron and measure thepH of the solution in the ext rac tor ]| in(pH is greater than ft.O. the pH of the solu-tion shall be decreased to S.O = 0.2 byadding O.S N acetic acid If the pH U equalto or leu than i.O. no acetic acid should beadded The pH of the solution shall be men-ttored. as described belov dur ing the courseof the extraction and If the pH rises above6.J. 0.5N acetic acid shall be added to bringthe pH dow-n to 5.0 £ 0.2. However. In no•vent shall the aggregrate amount of acidadded to the solution exceed 4 ml of acidper gram of solid. The mixture shall be agi-tated for 94 hours and maintained at K'-40'C (68 -104T) during this time It is rec-ommended that the operator monitor andadjust the pH during the course of the ex-traction with a device such as the Type 4S-ApH Controller manu'actured by Chemtrix.Inc.. Hlllsboro. Oregon SI 123 or IU equiva-lent. In conjunction with a metering pumpand reservoir of O.SN acetic acid If such a•ystcm Is not available, the followingAanuaJ procedure shall b; employed:
(a) A pH meter shall b>> calibrated In ac-cordance with the manufacturer's specifica-tions
(b) The pR of the solution 'shall beChecked and. If neceuary.-'O.SN acetic acidshall be manually added to the extractoruntil the pH reaches S.O £ 0.2 The pH t'.the solution thai! be adjusted at li. >0 and•0 minute Intervals, moving to the nextlonger interval if the pH does not have to beadjusted more than O.SN pH units
<c> The adjustment procedure ahall becontinued for at least 6 hours
<d> If at the end of the 34-hour extractionperiod, the pH of the solution Is not below(.2 and the maximum amount of acid (4 mlper tram of solidj) has not been added, thepH shall be adjusted to SO = 02 and the ex-traction continued for an additional fourhours, during which the pH shall be adjust-ed at one hour Intervals.:
fl At the end of the 24 hour extractionperiod, deIonized water shall be added tothe extractor in an amount determined bythe following equation:V-(20KW)_16(W)-A : 'V-ml delonlred water to be addedW« weight In (rams of solid charged to ex-
tractorA-ml of O.SN acetic add added during ex-
tractionV The material In the extractor shall be
separated Into Its component liquid and•olid phases at described under "SeparationProcedure.*"
• The liquids resulting from Steps I and 1Shall be combined This combined liquid forthe waste luelf U II has leu than H percentsolids, as noted in step 2) U the extract and
$80
400201
A-19.

li1
j
Chop1»r I — Environmental Protect ion Agancy fart 261, App. B
•hall be anajyted for the presence cf any ,olthe contaminant! apeclfied In Table I of|3»1.}« uslni the Analytical Procedure*designated below.
Separation ProcedureEquipment: A filter holder, designed for
filtration media having a nominal port alte•f 6 45 mlcromrun and capable of applyinga 1.1 kg/emMli psl) hydrostatic prtuurt tothe aolullon being filtered. ahall bt uaed.For mixtures containing Bonab*orpU»e•olids. where aeparaUon CMI b« effectedWithout imposing a S3 kg/cm1 preasurt dif-ferential. vacuum filters employing a C.45micrometers filler media can be us*d. (Forfurther f-uldance en filtration equipment orprocedure* ttt "T«t Wfihoii for £v»Ju»t-inj Solid V-'kite. PhyHc*:/ChemlcjJ MtUi-*ds" lncorpop»t*<J by* nttrtnct, »ee| J60.)l). PTocedurt:*
(I) rollovint minuftfturcr'* tflrcctloru.•>if filler unit «h»U be •ufmblrd vlih »fi l ler bed coruistint of t 0.45 micrometerfiller nembr&ne. For dJfJ icuK or »lo* tofilur mixtures t preflKer bed comUlini ofthr tol)o»ln| prefilien Ir incrruin* porekite (C 85 micromelet membruie, fine ili^ifiber prefilLer. ijtd cotne gluts fiber pre-filler) un be used.
( I I ) The »ule *h»J! be poured lnt« the fU-traiion iinli.
(ill) The rtservolr ihiJl be *lo»ly preaur.h^d unU! liquid tx-firu to Do* from Iht 111-tr»if outlet at which point the preuure inthe fi l ler shtll be immedulely lowered to10-15. psit FMlrftllon »h»U be continueduntil liquid Hov cruet. .
( lv) The preuure ih»J! be Ir>creu«d vtcp-»i»f In 10 psi incremenu to 75 put and 111-tniion cenlinued until Ho* ceuet or the
'Thii procedure U intended to refuU tn•rpinlion of the "free" liquid portion ofthe «ute from any solid mttier htvlm •ptrtielr »ire >0.45 »<m If the Mmple vlllnot filler, virioui other •eptrtlion tech-riiqurt un be used tc kid In the flltntlon.Ai deirnbed above, preuure fil tration Uemployed to spred up the (i)lralton process.Thi> dors not aller the nature of Iht tepar*-lion If'liquid dotj not aeptrate OUT in t fil-tration, the % aile can be eentrifuted If aep-•raiion oerurt during crnirlfuialion. theliquid portion (cent r l fu i t te ) U filtered .through the 0 45 m filler prior to becomlntmiked »un thr liquid portion of the *aiieobtained from the ini i ia) filtration. Any ma-terial .that will no,l pau through the filler•Her centrifucation b eoruiderrd a aollda\r,d it txlrarttd
prtisurliinr tu bef In* to exit from the fll-inle outlet. .
<»> The filter unit ahall be drpreuurixed.the »olid ma'.erial removed and *el»hed andthen Ir&mferred to the extraction appu-a-Uu. or, in the eaie of final flltraUon prior tomaJyiU. discarded. Do not olio* the nulerl-aJ retained on the filter pad to dry prior to
lyl) The liquid pha»e thall be stored at 4'Cfor cubtequent uce tn Step C.
M. ttr*et**] InUfrltt FnotdvrtBQulpment: A Structural Inteirlty Teeter
havint a 3.18 cm (1.5$ in.) diameter hammertteiththr O.J3 in (0.11 Ibt.) and havlnf afree fall of li 24 on <« in.) «haU be uaed.ThU device U available from AiaodaledDeiirn and Manufacturlnc Company. Alex-andria. VA 32314, a* Pan No. 125. or it maybe fabricated to meet the apeci/leaUoniahown in rirure 1.
Procedure
1. The aantple holder ohol: be filled withthe material to be teited If the aample ofwaste li » larie mon'ollthlr block. • portionBhall be cut from the block havini the dJ-mentions oi' a 3.3 cm (1.3 In.) diameter x 1.1em (SB in.) cylinder- Tor a fixated vane.oamplet may be cut in the form of a 1.3 em(1.3 in.) diarn?i«r x T.I cm (3.1 In.) cylinderfor purposes of conducting this test. ID luchcues, the vaste may be alloved to curt forSO dayi prior 10 further tettlni-
2. Thr sample holder (hall be- placed bitethe Eiructu-x! Integrity Tuter, then thehammer chall be raised to JU maximumheight and dropped. This nhall be repeatedfifteen times. .. ..
3. The rr.ii.! sria! ahall be removed from theaamp'.e h c i d r r . weighed, and .transferred tothe extractiO'i apparaiui for ektrmflJon.
Anttli/ticc.l Procriurtt for Anal tring txtruct
The test unfthodA for onaJyxini the ex-tract are tu loSlowt:
1. Por an;nlc. barium. cadmJum. chromJ-urn. letd, mercury, aeleniure. allvrr. endrux.llndane. ir^ethoxychlor, toxaphene. 1.4-Dl2.4-dichlorophenoxyacetic Midi or 3.4. STP IS.4.J triehlorophenoxyproplonlc »cid3:"Ten Methods for the Evaluation of SolidWaste, Physical/Chemical Methods" (incor-porated by reference, ace I 360.111.
Por all analyaes. the methods ft aundardaddition ahall be uaed for quantification of.•pecie* concentration.
281
A-20
400202