west nile virus: ecology and impacts on greater sage
TRANSCRIPT

Dave NaugleBrett WalkerJason Tack
West Nile Virus: Ecology and Impacts on Greater
Sage-grouse Populations
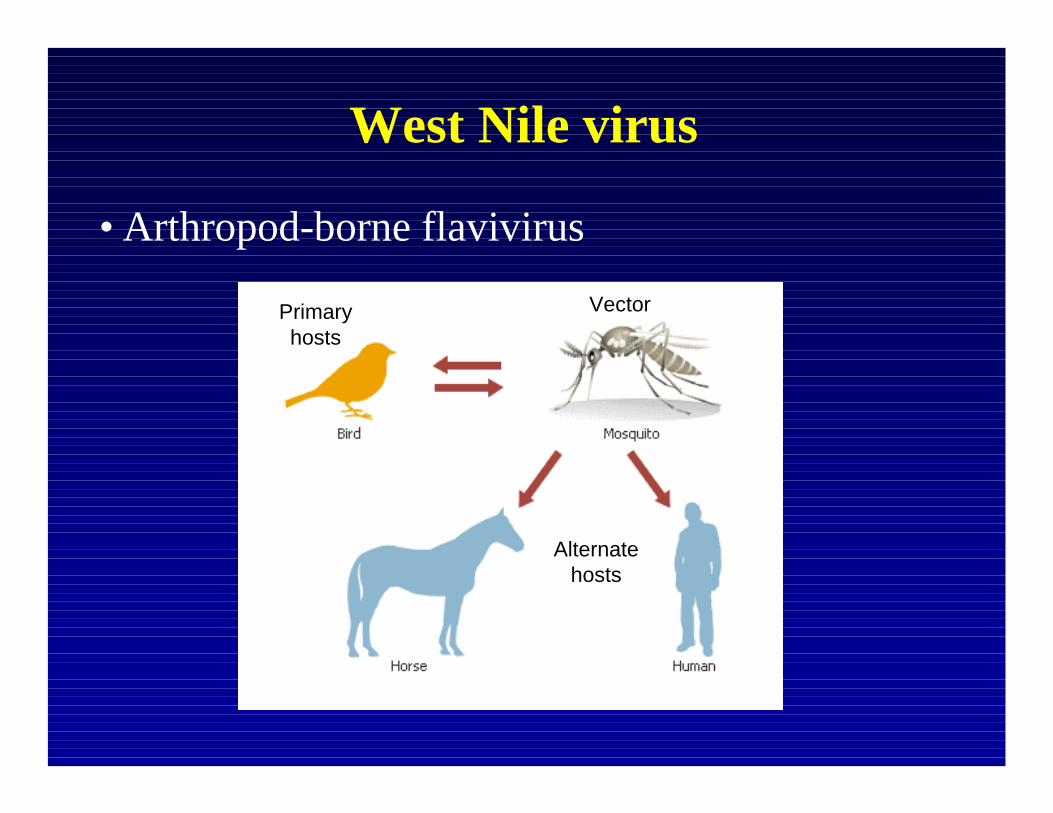
• Arthropod-borne flavivirus
West Nile virus
Primaryhosts
Vector
Alternatehosts

• Outbreaks more common during drought- Epstein and deFilippo 2001, Shaman et al. 2005
• High temperatures = faster virus amplification, mosquito development, and population growth
- Reisen et al. 2006, Zou et al. 2006
• More surface water = more mosquitos for longer- Zou et al. 2006, Doherty 2007
Ecology in sagebrush habitats


Hen survival July-August 2003, PRB
76%(no WNV)
20%(WNV)
Walker et al. 2004, Wildlife Society Bulletin
0.4
0.5
0.6
0.7
0.8
0.9
1
Upper GreenRiver Basin
Southern PhillipsCounty
Alberta SouthernPowder River
Basin
Northern PowderRiver Basin
Cu
mu
lativ
e P
rop
ort
ion
Su
rviv
ing
(1
Ju
ly to
31
Au
gu
st)
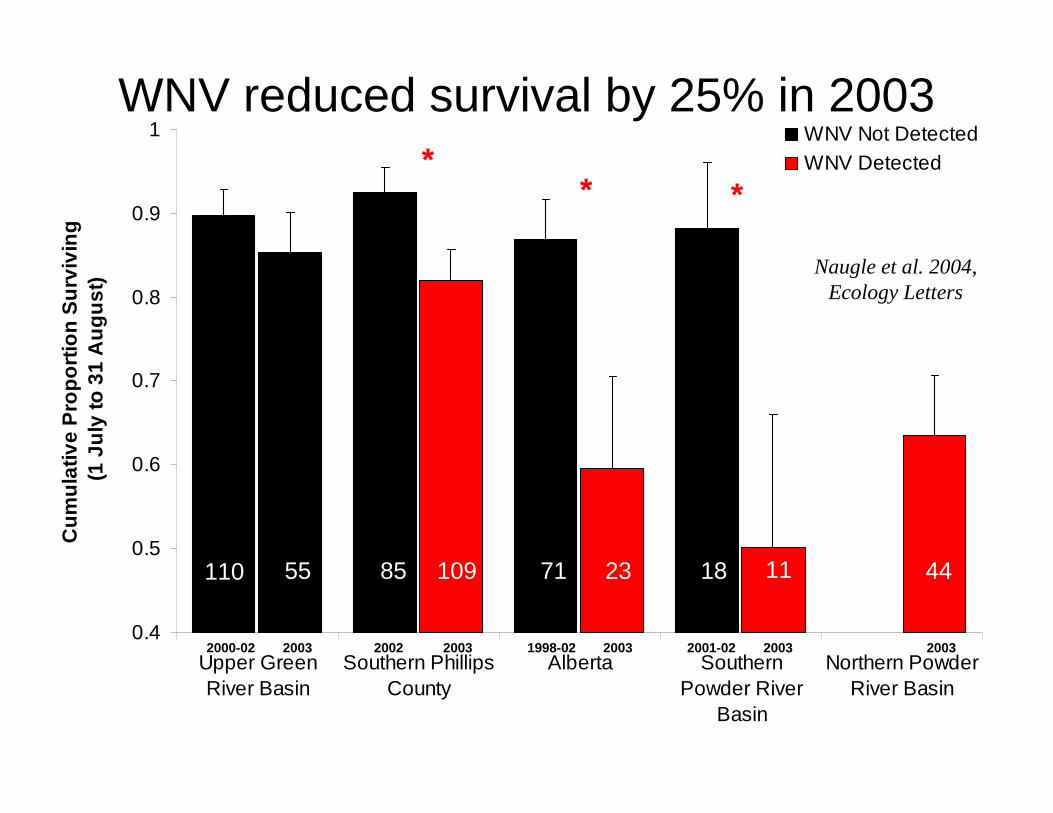
WNV Not DetectedWNV Detected
44
20022000-02 1998-02 2001-022003 2003 20032003 2003
110 237155 10985 1118
** *
WNV reduced survival by 25% in 2003
Naugle et al. 2004,Ecology Letters
-1.0
-0.5
0
0.5
1.0
Pro
port
iona
l Cha
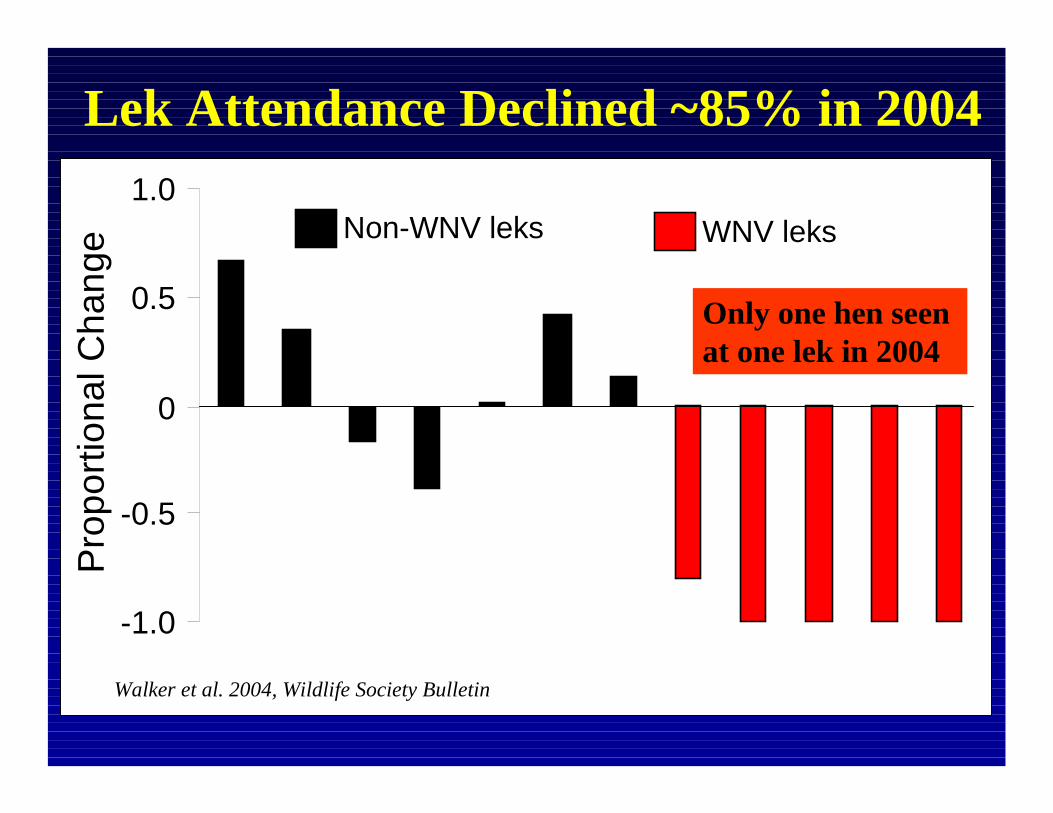
nge Non-WNV leks WNV leks
Only one hen seen at one lek in 2004
Lek Attendance Declined ~85% in 2004
Walker et al. 2004, Wildlife Society Bulletin

West Nile virusDetected
Not detected
Sage-grouse range
Current
Potential pre-settlement
Greater
Gunnison
Greater
Gunnison
Reported WNv mortality in sage-grouse

Recent example from western Idaho
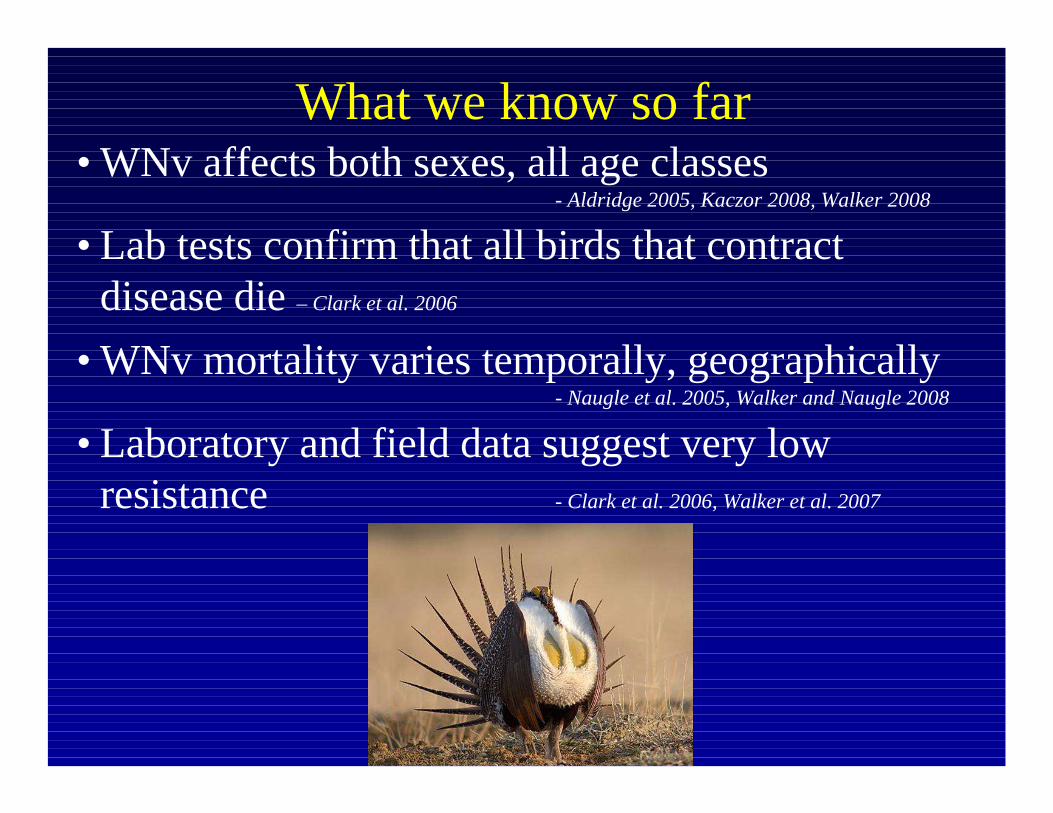
• WNv affects both sexes, all age classes- Aldridge 2005, Kaczor 2008, Walker 2008
• Lab tests confirm that all birds that contract disease die – Clark et al. 2006
• WNv mortality varies temporally, geographically- Naugle et al. 2005, Walker and Naugle 2008
• Laboratory and field data suggest very low resistance - Clark et al. 2006, Walker et al. 2007
What we know so far
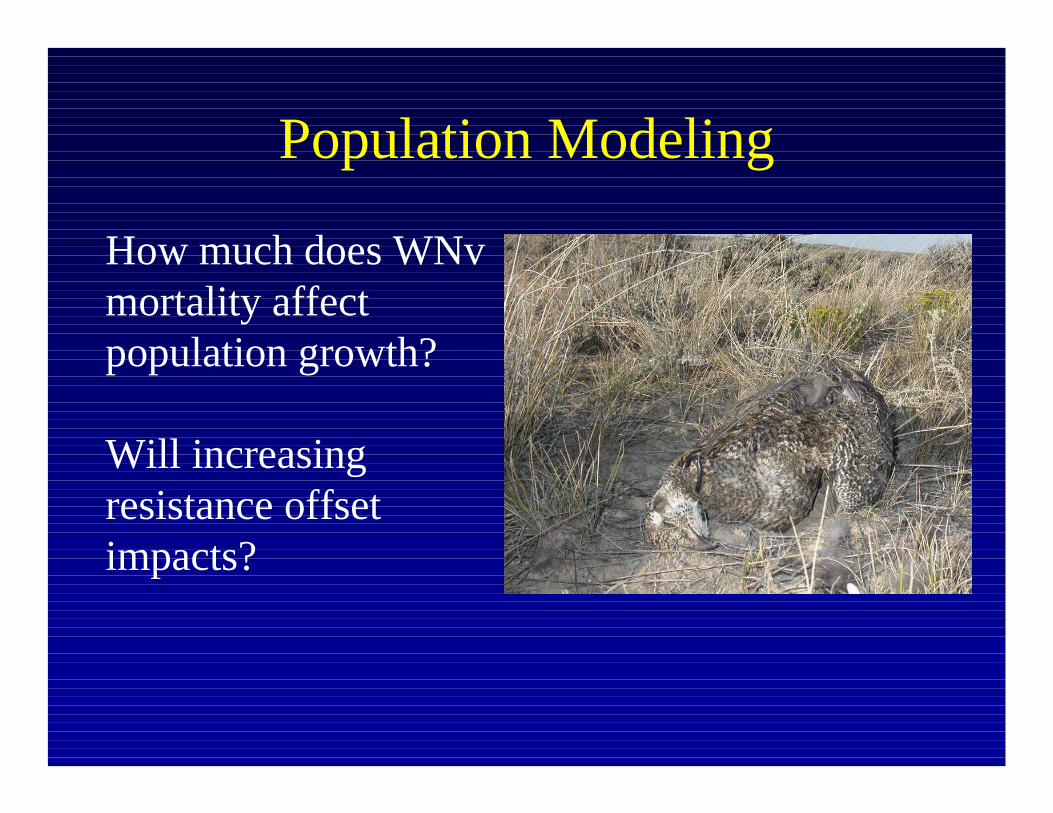
Population Modeling
How much does WNv mortality affect population growth?
Will increasing resistance offset impacts?
Simulations
• Three simulation scenarios:
1) No WNv
2) Simulated WNv (4% resistance)- Walker et al. 2007
3) Simulated WNv (increasing resistance)
• 1000 replicates per simulation

0
20
40
60
80
100
120
140
0.00
0.05
0.10
0.15
0.20
0.25
0.30
0.35
WNv infection rate
Fre
qu
ency
.
Simulated WNv infection rates• Typically low, but with extreme values (~50%)
- Walker et al. 2007
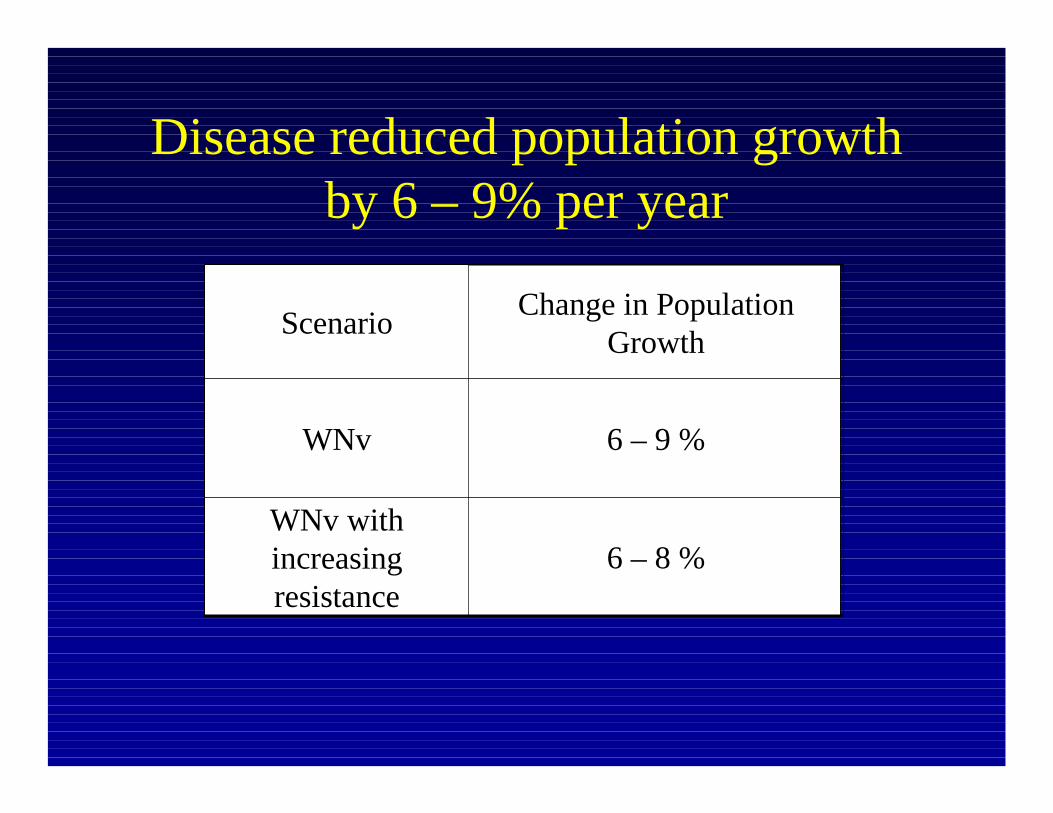
Disease reduced population growth by 6 – 9% per year
ScenarioChange in Population
Growth
WNv 6 – 9 %
WNv with increasing resistance
6 – 8 %
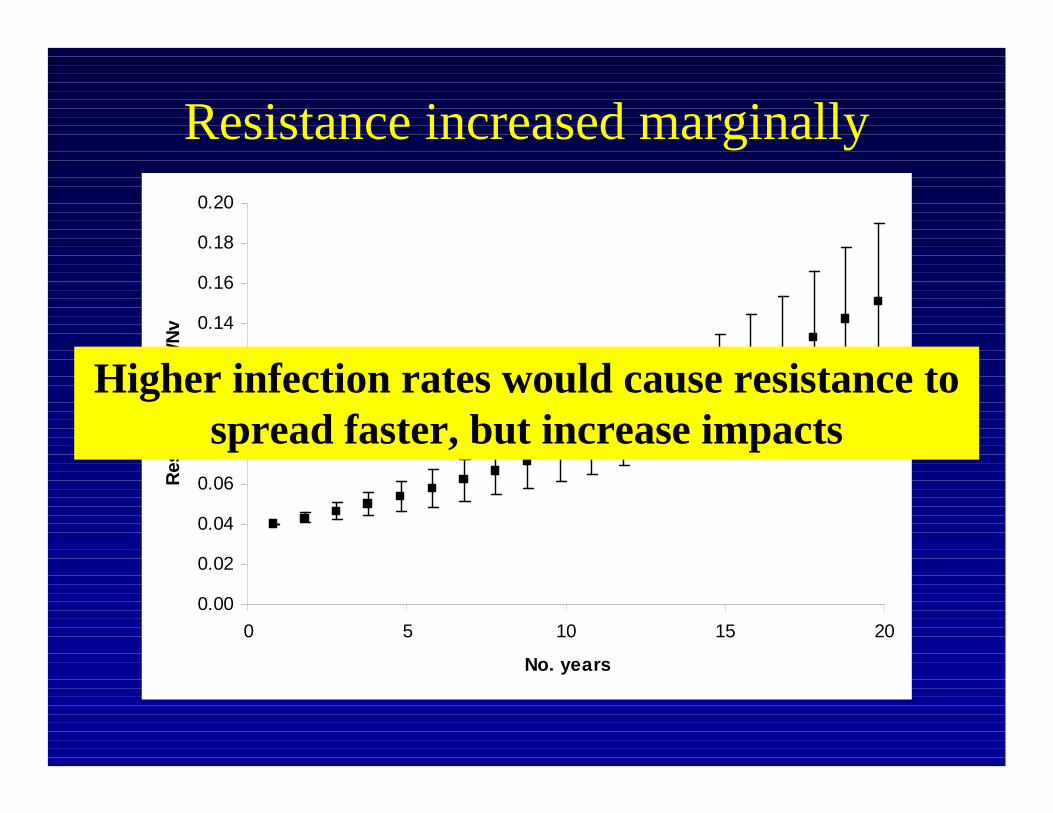
Resistance increased marginally
0.00
0.02
0.04
0.06
0.08
0.10
0.12
0.14
0.16
0.18
0.20
0 5 10 15 20
No. years
Res
ista
nce
to
WN
v
.
Higher infection rates would cause resistance to spread faster, but increase impacts
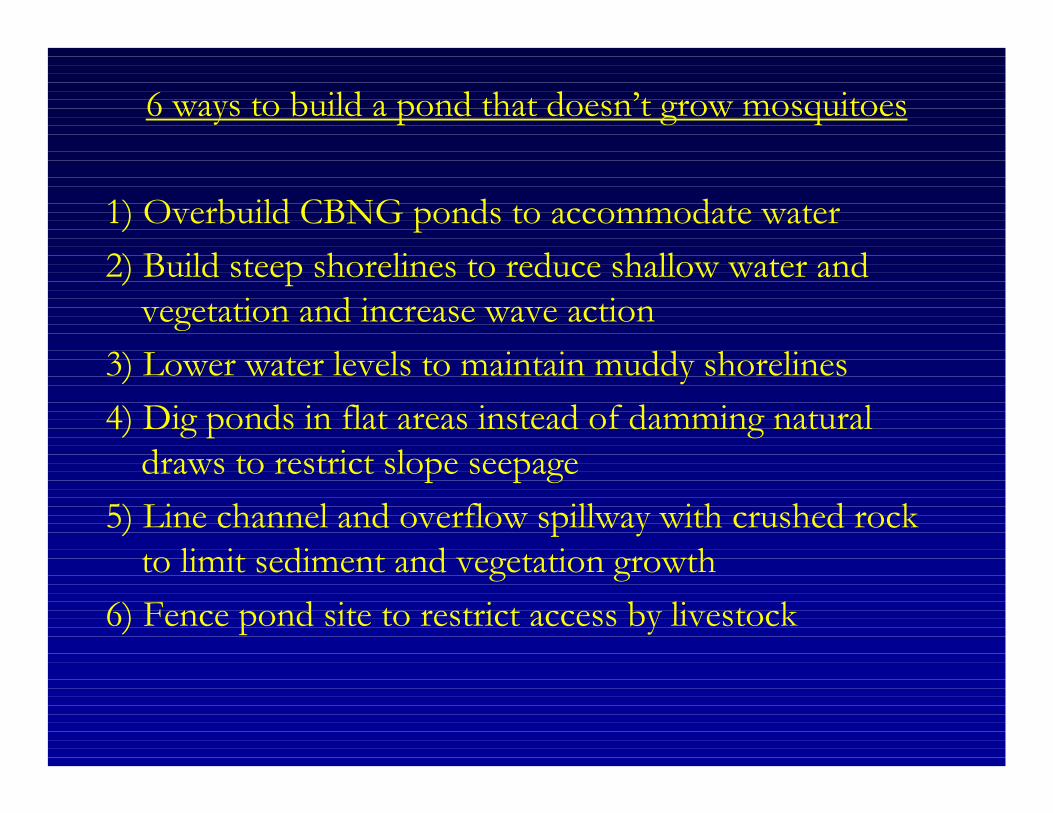
6 ways to build a pond that doesn’t grow mosquitoes
1) Overbuild CBNG ponds to accommodate water
2) Build steep shorelines to reduce shallow water and
vegetation and increase wave action
3) Lower water levels to maintain muddy shorelines
4) Dig ponds in flat areas instead of damming natural
draws to restrict slope seepage
5) Line channel and overflow spillway with crushed rock
to limit sediment and vegetation growth
6) Fence pond site to restrict access by livestock
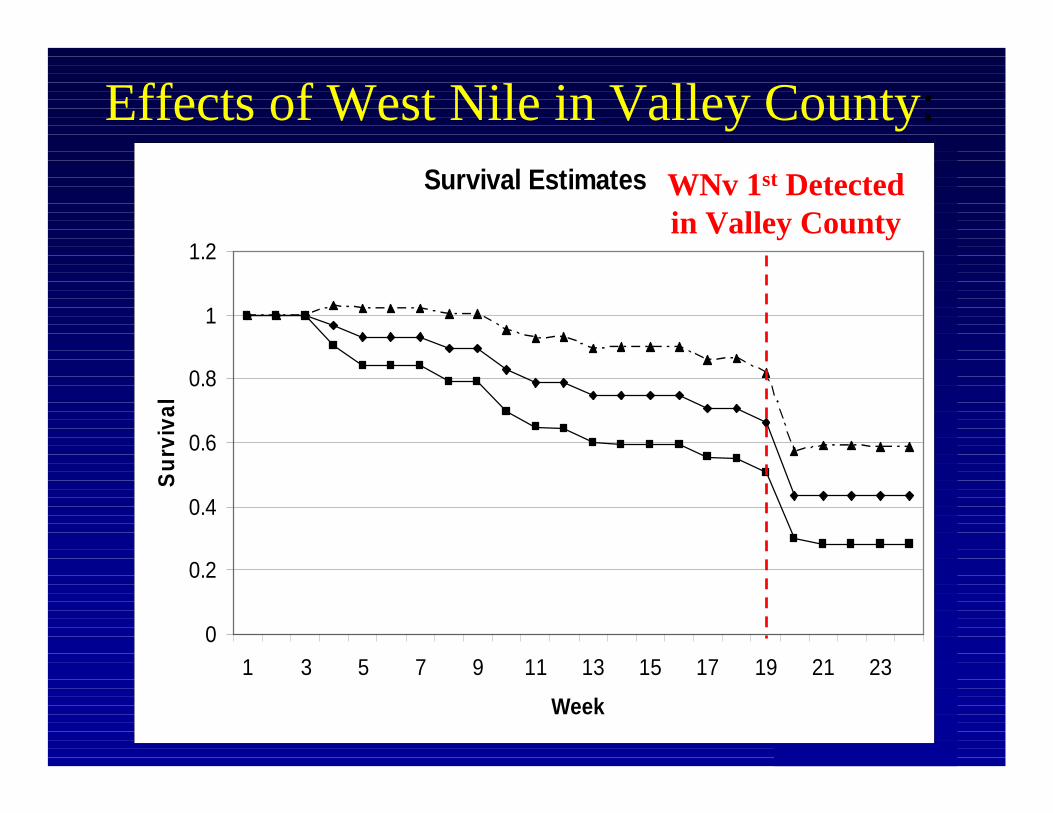
Effects of West Nile in Valley County:Survival Estimates
0
0.2
0.4
0.6
0.8
1
1.2
1 3 5 7 9 11 13 15 17 19 21 23
Week
Su
rviv
alWNv 1st Detected in Valley County
0 10 205Miles
0 10 205Miles
Milk River Basin North Dakota
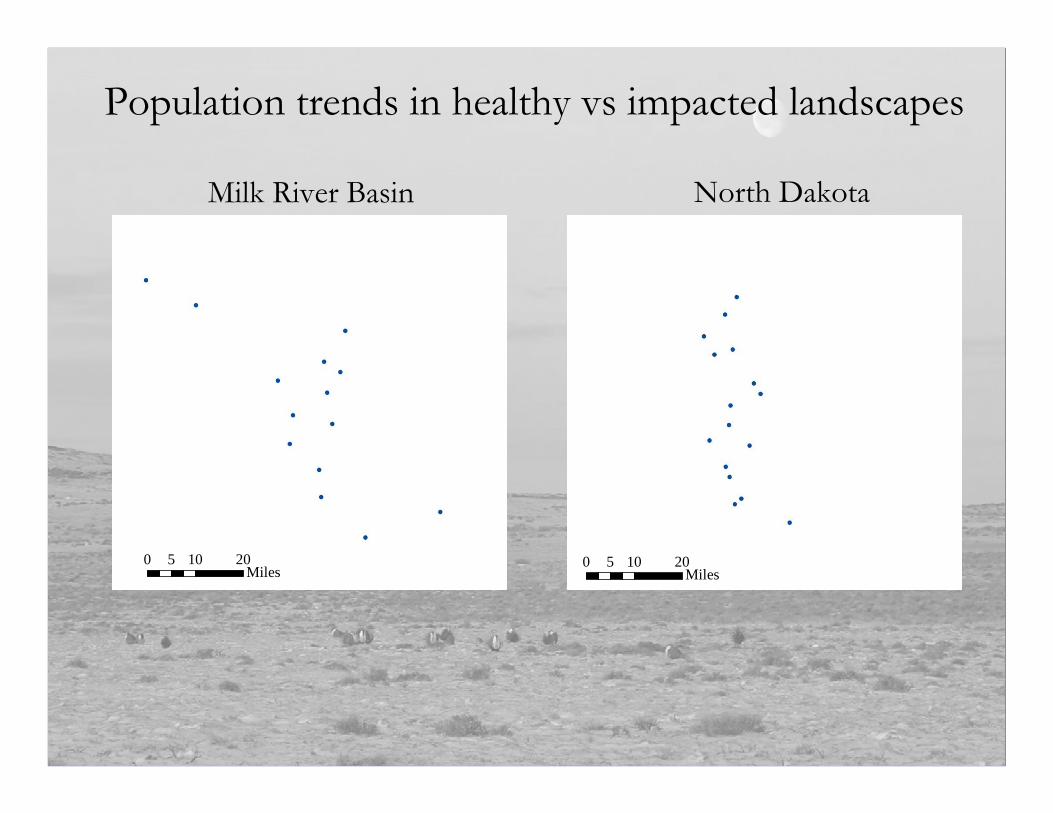
Population trends in healthy vs impacted landscapes
0 10 205Miles
0 10 205Miles
Milk River Basin North Dakota
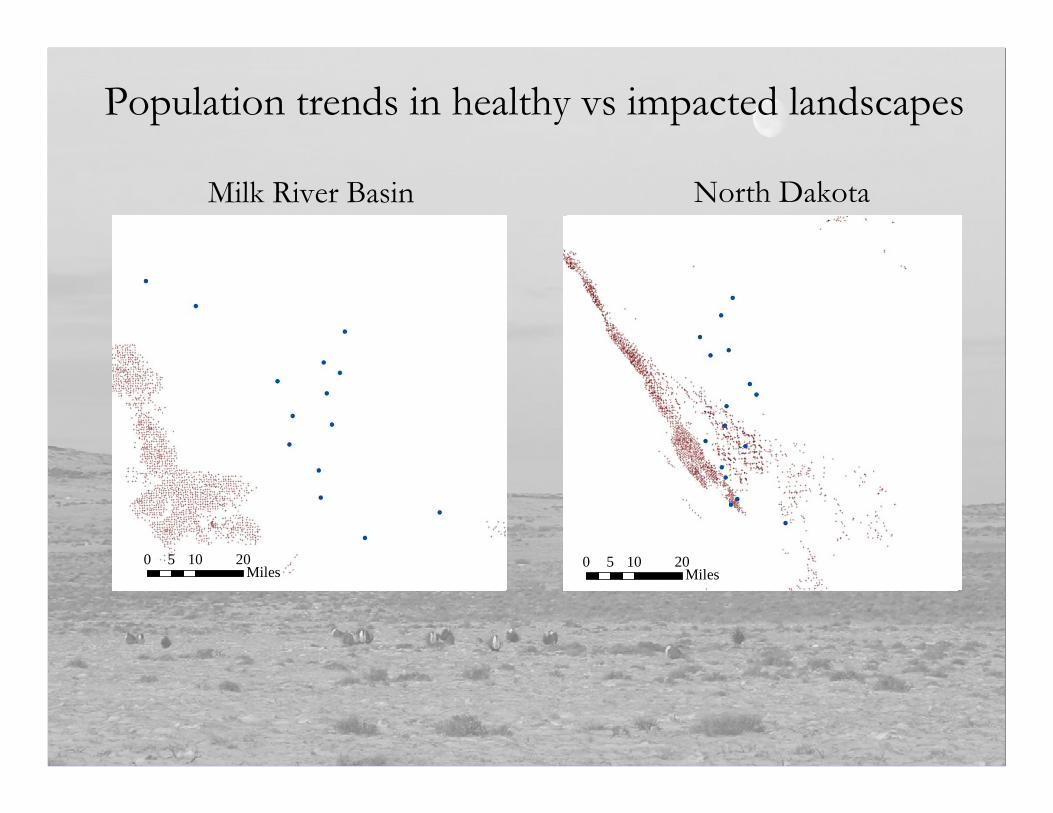
Population trends in healthy vs impacted landscapes

0 10 205Miles
0 10 205Miles
Milk River Basin North Dakota
Population trends in healthy vs impacted landscapes

0 10 205Miles
0 10 205Miles
Milk River Basin North Dakota
Population trends in healthy vs impacted landscapes
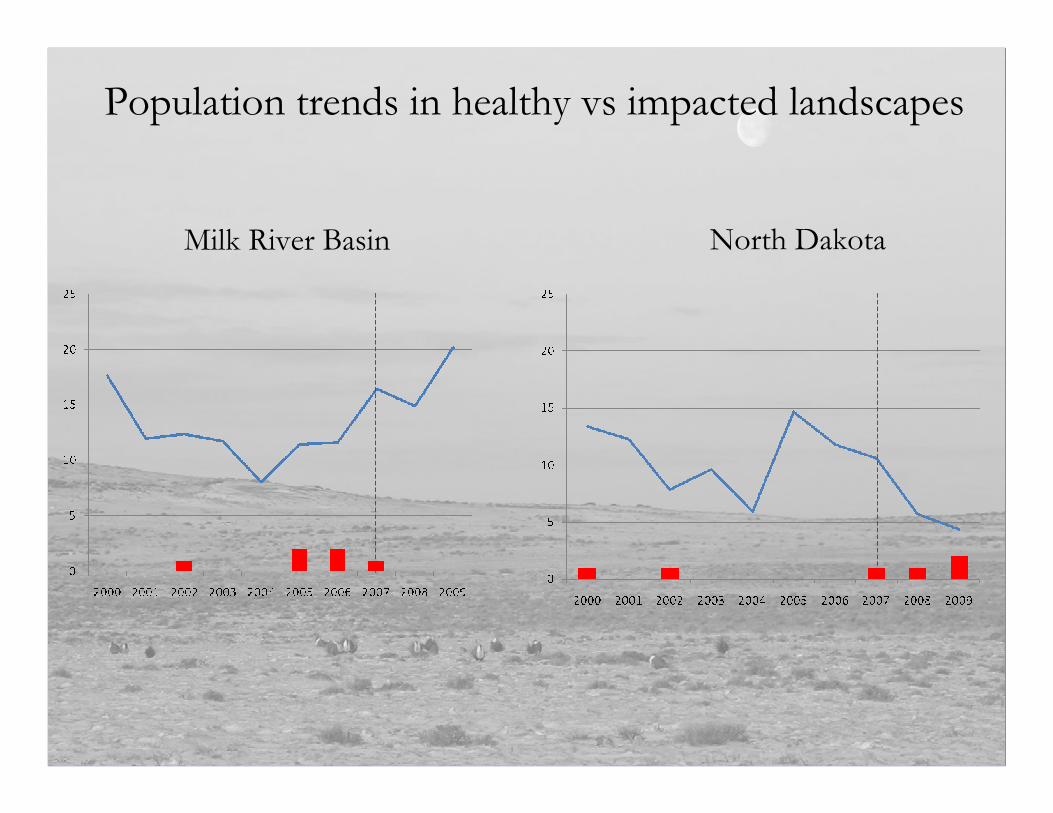
Milk River Basin North Dakota
Population trends in healthy vs impacted landscapes
• WNv is an endemic stressor that is here to stay
• Locally we can design water projects to help reduce impacts
• Continue to monitor resistance to see if rates increase to buffer
against losses
• Small populations will experience inordinately large impacts
• A call for conservation of large intact landscapes
Take Homes

Thanks for listening, questions or comments?