west golis pastoral livelihood baseline report · west-golis pastoral livelihood baseline report...
TRANSCRIPT
West-Golis Pastoral Livelihood Baseline Report Issued May 31, 2016
WEST GOLIS PASTORAL LIVELIHOOD BASELINE REPORT
May 31, 2016
Technical Series Report No VI. 68
FSNAUFood Security and Nutrition Analysis Unit - Somalia
Information for Better Livelihood
Technical Partners FSNAU Funding Agencies

West-Golis Pastoral Livelihood Baseline Report Issued May 31, 2016
iii
West-Golis Pastoral Livelihood Baseline Report Issued May 31, 2016
Ack
now
ledg
emen
ts
Acknowledgements
The Food Security and Nutrition Analysis Unit (FSNAU) would like to acknowledge the special contributions from Somaliland Government staff (FSNAU focal Points) for the administrative, technical and logistical support they provided in conducting the baseline assessment. Special thanks also go to the pastoralist households from the 10 sampled villages that participated in the survey and provided useful information. The process of conducting West Golis baseline assessment and preparing this report would not have been possible without the commitment of FSNAU Livelihoods Baseline team (Ahmed Mohamed Mohamoud, Baseline/Livelihood Lead Analyst and Ahmed Jibril Tawakal, Assistant Livelihood Analyst, the commendable inputs of Abdi Hussein Roble, FSNAU Food Security Deputy Technical Manager and the FSNAU Food Security Field Analysts (Yusuf Mire, Hussein Aden Ade and Mohamed Salat) who did the actual field data collection. The support of Somaliland Government staff in conducting the fieldwork, data analysis, validation and comments in delivery of quality outputs is highly appreciated.
Utmost appreciation also goes to FSNAU Technical Support Team for the time and effort spent in preparing this report. Special thanks to Alex Koton, FSNAU GIS Specialist. The authors acknowledge the nutrition information provided by the Senior Nutrition Analyst, Abukar Yusuf and the laying out of the report done by the publications team consisting of the Graphics Assistant, Catherine Kimani and Publications Officer, Barasa Sindani.
Finally, special thanks to FSNAU Chief Technical Advisor, Daniel Molla and Peter Muhangi, Food Security and Livelihoods Analyst for their technical and methodological review of the report.

iv
West-Golis Pastoral Livelihood Baseline Report Issued May 31, 2016
Tabl
e of
Con
tent
s
TABLE OF CONTENTSAcknowlwdgements iii1. EXECUTIVE SUMMARY 12. INTRODUCTION 4 2.1 Background Information 42.2 Baseline analytical approach (Methodology) 53. LIVELIHOOD ZONE OVERVIEW 64. HISTORICAL TIMELINE AND SEASONALITY 74.1 Historical Timeline 74.2 Seasonality 85. MARKET ANALYSIS 85.1 Livestock Prices 95.2 Milk Production 115.3 Staple and non-Staple Food Prices 115.4 Terms of Trade (ToT) 126. LIVELIHOOD ASSETS 126.1 Natural Capital 126.2 Human Capital 136.3 Social Capital 146.4 Physical Capital 146.5 Economic Capital 147. WEALTH BREAK DOWN 147.1 Wealth characteristics 147.2 Herd Dynamics 158. LIVELIHOOD STRATEGIES 168.1 Sources of Food, income and Expenditure 168.1.1 Sources of Food 168.2 Sources of Income 178.3 Expenditure Patterns 179. HAZARDS AND VULNERABILITY CONDITIONS 1810. CONCLUSION 1911. RECOMMENDATIONS 19
v
West-Golis Pastoral Livelihood Baseline Report Issued May 31, 2016
LisL
t of F
igur
es,T
able
s&
Map
s
Figure 1: Estimated average rainfall in mm in West Golis Pastoral Zone 7Figure 2: Seasonal calendar for the West Golis Pastoral Zone 9Figure 3: Sheep Export Quality (Borama & Hargeisa) 0Figure 4: Goat Export Quality (Borama & Hargeisa) 10Figure 5: Goat Local Quality Price (Borama & Hargeisa) 10Figure 6: Camel Local Quality Price in Borama and Hargeisa 11Figure 7: Fresh Camel Milk, 1 liter (Barama and Hargeisa) 11Figure 8: Price Trend of Sorghum per 1kg in Borama & Hargeisa 11 Figure 9: Price trend of Imported Rice per 1kg Borama & Hargeisa 11Figure 10: Price Trend of Vegetable Oil 12Figure 11: Price Trend of Sugar 12Figure 12: Terms of Trade Between Local Quality Goat to Rice 12Figure 13: Terms of Trade Between Local Quality Goat to Sorghum 12Figure14: Wealth Breakdown in West Golis Pastoral Livelihood Zone 15Figure 15: Food Sources by Wealth Group, West Golis Pastoral Zone 16Figure 16: Cash Income Sources by Wealth Group, West Golis Pastoral Zone 16Figure 17: Expenditure Patterns by Wealth Group, West Golis Pastoral Zone 17
LIST OF TABLES
Table 1: The Integrated HEA and SLA Framework 5Table 2: Historical Timeline 7Table 3: IPC progression in West-Golis Pastoral Livelihood Zone 13Table 4: Wealth Group characteristics in West Golis Pastoral Livelihood Zone 14Table 5: Goat and Sheep Herd Dynamics 15Table 6: Camel Herd Dynamics 16Table 8: Key Parameters to monitor in West GolisPastoral 19
LIST OF MAPS
Map 1: West-Golis Pastoral Livelihood Zone in Somalia 6Map 2: Major Livestock Markets 9
LIST OF FIGURES
West-Golis Pastoral Livelihood Baseline Report Issued May 31, 2016

Exec
utiv
e Su
mm
ary
1
West-Golis Pastoral Livelihood Baseline Report Issued May 31, 2016
1. EXECUTIVE SUMMARY
In November 2014, the Food Security and Nutrition Analysis Unit (FSNAU) conducted a baseline assessment in the West-Golis Pastoral livelihood zone. The purpose of the study was to assess the main sources of food and income of West Golis pastoral and to measure the extent, depth, and the underlying causes of vulnerability to livelihoods and food insecurity in this livelihood zone. Another objective of the study was to customize early warning indicators to be monitored for both food and livelihood security of the livelihood Zone.
Livelihood Zone Description: The West Golis Pastoral zone covers the highlands of the Golis mountain range and stretches from the international border in western Awdal region, into Woqooyi Galbeed region and northern Togdheer region. The zone also includes a small section in the west of Sanaag region (the district of Ceel Afweyn). The general elevation along the crest of these mountains averages 1800 meters above sea level, with shallow plateau valleys. The ecology of the zone is semi-desert and the basis of the economy is pastoralism. The total estimated population for the livelihood zone is 335,989 (UNFPA 2014).
Main FindingsWealth Break down: Households in West Golis Pastoral livelihood zone are categorized into: Poor (30%), Middle (50%) and Better-off (20%). The clear determinant of wealth in this livelihood zone is the ownership of livestock mainly Camels, goats and sheep in order of importance and preference. The Poor households are defined as those who have up to 5 camels and between 40 and 60 shoats (mixed herds of sheep and goats, although goats are the dominant species). The Middle households are those who own nearly 12 camels, 125 sheep and goats while the Better-off households own significantly larger herds of about 28 camels and 200 sheep and goats. Household size and number of wives vary across the wealth groups with the Middle and the Better-off wealth groups more likely to be polygamous, which explains the larger household sizes (Poor: 6 members, middle: 8 and the Better off: 11 members).
Livelihood Assets: Livestock and livestock products sales provide the largest economic sources for all wealth groups of West Golis Pastoral, despite the variations in livestock holdings across the different wealth groups. The vegetation cover is dominated by grasses, shrubs and forest trees. The acacia trees are the most important for livestock feed especially during the dry seasons. Forest resources also permit the production of charcoal, which is sold by poor households. The main water sources in the zone are shallow wells in the valleys, ballis (water catchment areas on the slopes of the mountains), springs and small seasonal streams. Majority of the West Golis pastoral households (Poor and Middle) are monogamous with a household size of about 5 -7 and 7 - 8 members, respectively while the Better-off which represents a smaller portion of the population are polygamous with a household size of about 10 -12 dependents. Pastoral households in West-Golis livelihood zone have access to two educational systems: the traditional Koranic school system and the modern educational (non-Koranic) system. Almost all pastoralists access Koranic education. Formal primary to secondary education is limited to large settlements and urban towns.
The food security situation in West Golis pastoral was classified as stressed (IPC Phase 2) during the reference year, while nutrition status was categorized as serious with a Global Acute Malnutrition (GAM) rate of about 15%. Although road transport is poor, communication networks have improved and mobile phones are widely used in the area. These services are carried out by local private enterprises such as Golis, National link and Somtel.
The Poor households have a relatively strong access to the traditional social support such as Irmansi (sharing milk) and cash gifts provided by the Middle and the Better-off groups. Both men and women have access to gifts in kind and cash and even credit opportunities from traders some of whom are close clan relations. Usually livestock migration routes are contained within the region, towards the Guban coastal area and the Hawd plateau pasture lands. However environmental degradation is an endemic problem contributing to the loss of pastures due to changing climatic conditions and lack of proper land and water resource management systems.
Seasonality: West Golis pastoral livelihood zone receives bi-modal rainfall i.e. the gu rains (April-June) and Deyr rains (October-December), separated by two dry seasons namely, Jilaal which is characterized by high temperatures (January-March), and Hagaa (July – September). It’s important to note that there are variations in terms of rainfall patterns across the livelihood zone between the Eastern and Western parts of the zone. The Golis areas of Togdheer mainly receives Gu and Deyr rains, while the Golis areas of Woqooyi Galbeed and Awdal regions receive gu rains (April –June), karan rains (late
Exec
utiv
e Su
mm
ary
2
West-Golis Pastoral Livelihood Baseline Report Issued May 31, 2016
July –August) and only minor deyr rains (Oct-Nov). The Golis in Borama, facing the Guban Pastoral zone, receives xays rains (Dec-Feb). During the wet seasons (Gu and Deyr), and depending on rainfall performance, surface water and pasture availability for livestock production improves, thereby increasing livestock reproduction and productivity.
The opportunities for livestock migration (seasons of inadequate rains) is guided by availability of pasture and water and insecurity (clan alliances and conflicts). Livestock sales, especially those for export markets, peak during the Eid and Hajj season when demand increases (the timing of which differs each year), while local sales peak during and just after the rains when livestock body conditions have improved. Animal sales also occur during the dry seasons and the pastoral lean season when cash income is needed.
Milk production increases during the rainy seasons when most mating and birthing takes place. Normally camel milk prices increase during Hagaa and remain high throughout the short rainy season due to limited supply of goat and sheep milk in the markets. Milk prices decrease when there is a concentration of livestock at watering points and when production increases during the rainy season.
Food prices often increase towards the end of the monsoon season (August) when rough navigation conditions reduce shipping activities and limit food imports, especially the staple cereals. The major pastoral lean season falls between the months of February and March at the end of the harsh Jilaal season. A secondary less intense lean season usually occurs between September and October, until the first deyr rains.
Livelihood Assets: The sustainable livelihoods approach seeks to get a deep understanding of people’s assets and their capacity to convert a range of assets (with the help of positive influences of other sustainable livelihood elements) to achieve favourable livelihood outcomes. In West Golis pastoral livelihoods, livestock and livestock products sales provide the largest economic sources for all wealth groups although there are visible variations in terms of livestock holdings across the three wealth groups.
The vegetation cover is dominated by grasses, shrubs and forest trees. The acacia trees are the most important for livestock feed especially during the dry seasons. The main water sources in the zone are shallow wells in the valleys, dams (water catchment areas on the slopes of the mountains), springs and small seasonal streams. Livestock migration routes are contained within the region, towards the Guban coastal area and the Hawd plateau pasture lands mostly during bad seasons. However the environmental degradation is an endemic problem contributing to the loss of pastures due to changing climatic conditions and lack of proper land and water resource management systems.
LIVELIHOOD STRATEGIES
Sources of Food: Most of the food consumed by all wealth groups in this livelihood zone is purchased, and this accounts for nearly 85% of total annual kilo calories requirements. Milk and meat from own livestock supplement the diet, providing an important source of protein, and the contribution of livestock products increases by wealth level. The staple foods for the Poor households are imported rice and wheat flour, supplemented with small quantities of local sorghum. These food commodities provide the greater part of the total energy needs of about 50% kcal/person/day, whereas, non-staple foods ( mainly sugar and oil) gives the second largest portion of 35% of energy requirements. Additionally, the Poor households also had 11% of kcal requirements from camel milk and goat consumption. Consequently, the Poor wealth groups obtained 96% of minimum kcal requirements during the reference year, showing still some survival deficit of 4%8, which is a clear sign of their exposure to shocks and weak resilience. Even with an allowance for unquantified food sources that would enable the Poor access 100% of the minimum energy requirements, total food access is just on the edge and any small shock would push the poor into acute food insecurity levels.
The Middle and Better off depend on similar food types as the poor. However, the two wealth groups have an ability to achieve more than basic survival threshold (105% Middle and 109% Better-off). The major differences in consumption patterns across the wealth groups are the larger quantities of milk and meat consumed by the Middle and Better-off households (roughly double that of poor households). The Better- off wealth group has additional access to pasta and maize meal in their staple basket, which is more expensive than rice and wheat flour.
Exec
utiv
e Su
mm
ary
3
West-Golis Pastoral Livelihood Baseline Report Issued May 31, 2016
Sources of Income: Livestock and livestock products sales are the main income for all wealth groups in West Golis pastoral. Total annual income for the poor household is estimated at Slsh 8,555,000, of which 63% (Slsh 5,400,000) comes from the sale of goats/sheep (6 export goats/sheep and 8 local goats/sheep) and Slsh 1,650,000 from sale of milk. To supplement their income, the Poor households collect Slsh 600,000 (7%) income of total income from the sale of charcoal during the dry seasons (this is usually practiced for approximately 5 months of the year) and rely on borrowing about Slsh 400,000 (5% of total income) from wealthier households. Although the majority of poor pastoral households are in debt, borrowing arrangements are flexible and households are not under pressure to repay the loans. Even though this is a good gesture from the lenders, continued borrowing without capacity to repay can potentially undermine long term recovery and asset building. The Poor also receive 6%t gifts in cash (Slsh512000) from social support. Typically, a wealthier household gives a camel to a group of disadvantaged households or a goat/sheep to an individual, as part of the Islamic social support system of zakat.
For the Middle and the Better –off, income patterns are still determined by livestock holdings, and average, annual income for the Middle and the Better-off households is estimated at Slsh 15 444 000 and Slsh 25 752 000, respectively which is about double and triple the income for the Poor households. The highest proportion of the total income - Slsh 12 300 000 and Slsh 18 900 000 (79% and 73%) is derived from the sale of small ruminants and camels, respectively. Milk sales also provide significant contribution to total income giving Slsh 3 144 000 and 5 002 000 (19% and 20%) respectively. In addition to the livestock sales, Better-off households top up their annual income through petty trade activities – Slsh 1 000 000 (4%) and remittances – Slsh 850 000 (3%) from the Diaspora or from family members based in urban areas inside the country.
Expenditure patterns: Poor households spent Slsh 8 525 000 on food and non-food commodities in the reference year (from an annual income of Slsh 8 558 000). About 66 percent (Slsh 5 658 000) of the total income is allocated to food purchases (staple 37% and non-staple 29%). The remaining portion is used on household items (10%), social services (9 %) and cloths (10%). The sum of annual income for Middle and Better - off is about double (Slsh 15 444 000) and triple (Slsh 25 752,000) of the income for the Poor. The Middle and Better – off spent a relatively smaller proportion of their annual income on food purchases at 50 % and 42 %, respectively. In terms of proportions spent on spent on food purchase, the Middle spent 31% on staple and 19% on non-staple food, while the Better –off spent 25% on staple and 17% on non-staple food. The two wealth groups allocate a higher proportion of their total expenditure to nonfood items including production related items such as animal drugs compared to the Poor. Higher expenditure on livestock drugs is in line with the larger livestock they own and rely on for their livelihoods. The second largest proportion of expenditure was directed to purchase of cloths (15-16%), while social services and household items came third as a proportion of total expenditure at 9% and 10% for the Middle, as well as 12% and 14% for the Better off wealth groups. Clan taxes are paid by the Middle and Better-off groups, paying an average of Slsh 300.000 (2%) and Slsh 500.000 (2%) per year. The remaining part of annual expenditure is on other personal items (6%).
Major hazards and constraints: The main hazards affecting West- Golis pastoral are persistent droughts, clan conflicts, inflation, high food prices, border closure, livestock and human diseases and environmental degradation.
Conclusions: Main results from the assessment revealed that livestock (Camel and Goat/Sheep) are the core assets that underpin livelihoods of most households in in West –Golis. During the reference year, herd size growths for all wealth groups have shown increasing trends. On average, the herd size of goats and sheep across all wealth groups increased by 11% and 16% respectively. Likewise, camel herd size increased by 13% during the same period. Kidding rates for goats and sheep were 44% and 40% respectively, whereas, camels kidding rates also increased by 20%, which compensated for the off-take incurred (i.e. sold, slaughter, died) in the reference year.
Market purchases of imported food commodities (rice, wheat flour, pasta, sugar and oil), provide the greater part of the energy requirements for the three wealth groups defined in this livelihood zone (approximately 85% of minimum annual kilocalorie needs). This is obtained mainly through the sale of livestock and livestock products which is quite easy for households with a big number of livestock but more difficult for the poorer households who are already affected by increased livestock losses due to drought and diseases. Most poor households struggle to meet the minimum energy requirement for survival (96% kcal/p/day) by their own means even during the reference year, although what they access is within an acceptable range. This is ascribed to persistent chronic food insecurity from recurrent droughts, insecurity and lack of effective government and functional institutions.

4
West-Golis Pastoral Livelihood Baseline Report Issued May 31, 2016
Intr
oduc
tion
2. INTRODUCTION
2.1 Background information:Livelihood baselines are quantified analysis of livelihood strategies (sources of food, income and patterns of expenditure) for different wealth groups over a defined reference period in a given population (Chambers and Conway, 1992; DFID, 2000). In a food security context, baseline information provides an analytical basis for identifying key indicators for livelihood and food security monitoring, as well as inform policy, programming and development decisions aimed at risk reduction and resilience building. Livelihood and food security baselines use participatory rapid assessment techniques in generating useful information which explains how the most vulnerable live, profiles the status of households across the wealth ranks and determines changes in assets or shifts in livelihood strategies.
In November 2014, FSNAU conducted a baseline assessment in West Golis Pastoral livelihood zone and the purpose of the exercise was to measure the extent, depth, and the underlying causes of vulnerability to livelihoods and food insecurity. The objectives of the baseline assessment were:1. To establish baseline information that will inform future livelihood and food security monitoring, analysis and reporting.
This baseline report describes the West Golis Pastoral livelihood zone in terms of rainfall patterns, pasture and water resources, linkages to neighboring zones, historical timeline and seasonality as well as market analysis. The report also discusses livelihood assets, livelihood strategies, and the coping/response mechanisms employed by households. The findings are useful in designing timely and appropriate interventions as well as long-term development and policy planning.
2. Investigate the socio-economic characteristics and asset holdings of different wealth groups in the livelihood zone.3. Determine the coping strategies employed by wealth groups and identify changes in livelihood strategies and/or wealth
ranking in the pastoral livelihood system.4. Assess the vulnerability factors (persistent shocks and hazards) and how these influence the strategies adopted for
pastoral livelihood survival.5. Identify the main problems and priorities for addressing livelihood and food insecurity within the livelihood zone.
2.2 Baseline analytical approach (Methodology)The methodology employed for West Golis Pastoral livelihood baseline is the FSNAU’s expanded baseline livelihoods analysis framework (BLAF). The BLAF approach integrates concepts of both the Household Economy Approach (HEA) and the Sustainable Livelihoods Framework (SLA) (DFID, 2000), as shown in the table below. The BLAF approach focuses on how households in different wealth groups obtain their food, generate their income and organize their expenditure patterns, as well as understanding of household asset holding.
Recommendations• Introduce cash for work programs for the construction of communal assets such as roads, dams for slowing down
running water from mountains and rain water harvest. This intervention will provide additional cash resources to enable poor households increase access to food while at the same time support the enhancement of the pastoral livelihood system.
• Establish pastoral committees consisting of different wealth groups and council of elders that have direct link to the government institution for proper rangeland management.
• Promote livestock/livestock products marketing system to increase incomes of the pastoralists. This will enable the poor pastoralists to build up savings, get out of perpetual indebtedness, and ultimately strengthen livelihood resilience.
• Provide micro credit and revolving funds to cooperatives (women and youth groups) for engaging in income generating activities such as milk/ghee, skin, and livestock trade.
• Extend livestock services (animal health services) to the livelihood zone by increasing access to livestock inputs (drugs) and to train community animal health workers.
Key parameters to monitor:• Goat/sheep prices(export and local)• Camel prices (export only)• Camel milk supply and prices• Fuel wood/charcoal supply and prices• Cereal and non-cereal prices• Security situations• Rainfall situation

5
West-Golis Pastoral Livelihood Baseline Report Issued May 31, 2016
Intr
oduc
tion
Before the baseline fieldwork, FSNAU organized a training workshop in Hargeysa (Somaliland), for all the technical participants of the baseline assessment with the majority of participants being FSNAU food security field analysts. These analysts are based in the area and have extensive food security knowledge of the pastoral livelihood zone in question. At the workshop, the participants discussed seasonality issues that are relevant to the pastoral livelihood zone under study, particularly the onset of the main rainy season, reference year to be taken for the collection, security situation and accessibility. Discussions on the above and other food security and livelihoods aspects led to the purposive selection of 10 villages to be surveyed for this particular livelihoods baseline study. On the other hand, the reference year1 was collectively identified based on food security performance of recent years determined by refer IPC2 progression Maps produced by FSNAU and the knowledge of the participants. In this case, April 2013 to March 2014 was selected to be used as reference year (see notes on what to consider when selecting a reference year).
During the fieldwork, focus groups discussions (FGDs) with community representatives were organized in the selected villages. The FGDs concentrated on historical timelines, seasonality and livestock migration patterns in ‘bad’ and ‘good’ years. Proportional piling was used to categorize households into Poor, Middle and Better-off wealth groups, based on their livestock assets and other livelihood strategy. From this wealth categorization exercise, representative households were mobilized from each wealth group and focus group interviews were conducted. In total, 10 community-leaders focus group interviews and 30 wealth group interviews were conducted in all of the surveyed villages.
Selection of Reference year: A reference year is the timeframe to which the baseline information applies, and all the collected information during the baseline field work will be based to what happened during the reference year. This allows the analyst to calculate changes in access to food and cash income at a future date, in relation to the reference year. In HEA baseline studies, the reference year has to coincide with beginning of the consumption year which in pastoral set up (like Guban pastoral) is the beginning of the main rainfall season (in this case Xays which is usually received in January). The key considerations while selecting the f HEA baseline reference year is that it should be;1. An average year as understood by the community and considering all dimensions of food security including relative
stability in terms of security.2. Normal year which means without major hazards like drought, diseases, hyperinflation or escalation of conflicts.3. Typical year or most frequent type of year in terms of climate performance, livestock conditions, market activities and
insecurity that are all determinants of food security situation of rural livelihoods.4. Specific year which entails how far back people can remember accurately
Discussions on the above factors were held during the pre-field work training workshops and with subsequent reference to secondary data like the IPC progression Maps of food security phase classifications of the area for April 2013 to March 2014 was selected as most the most appropriate reference year for West Golis pastoral baseline study. In particular, the reference year chosen was a recent year hence easy to recall what actually transpired regarding key food security issues including livelihoods strategies adopted. The GU ’2013 seasonal rainfall which coincided with the first quarter of the reference year (April-June 2013) was average while the Deyr season rainfall towards the end of the reference year was equally near average resulting in the improvement of the associated food security parameters such as rangeland conditions that led to enhancement of the livestock body condition and livestock reproduction. These improvements
1 A reference year is the timeframe to which the baseline information applies; all the collected information during the baseline field work will be based to what happened during the reference year. This allows the analyst to calculate changes in access to food and cash income in relations to the reference at a future date.2 The Integrated Food Security Phase Classification (IPC) is a set of standardized tools that aims at providing a “common currency” for classifying the severity and magnitude of food insecurity. This evidence-based approach uses international standard. http://www.ipcinfo.org/
Table 1: The Integrated HEA and SLA Framework
HEA Baseline HEA Outcome AnalysisStep 1 Step 2 Step 3 Step 4 Step 5 Step 6
HEAProcess
LivelihoodZoning
WealthBreakdown
Food, Income,ExpenditureQuantification
+ProblemSpecification
+Coping Capacity/Response Strategies
=ScenarioOutcome
↕ ↕ ↕ ↕ ↕ ↕
SLFCoreAreas
Vulnerability/Context
Livelihood Assets&Policies, Institutions, Processes (PIPs)
Livelihood Strategies&Policies, Institutions, Processes (PIPs)
Policies, Institutions, Processes (PIPs)&Shocks/Trends(under VulnerabilityContext)
Livelihood Strategies&Livelihood Assets&Policies, Institutions, Processes (PIPs)
Livelihood Outcomes
6
West-Golis Pastoral Livelihood Baseline Report Issued May 31, 2016
Live
lihoo
d Zo
ne O
verv
iew
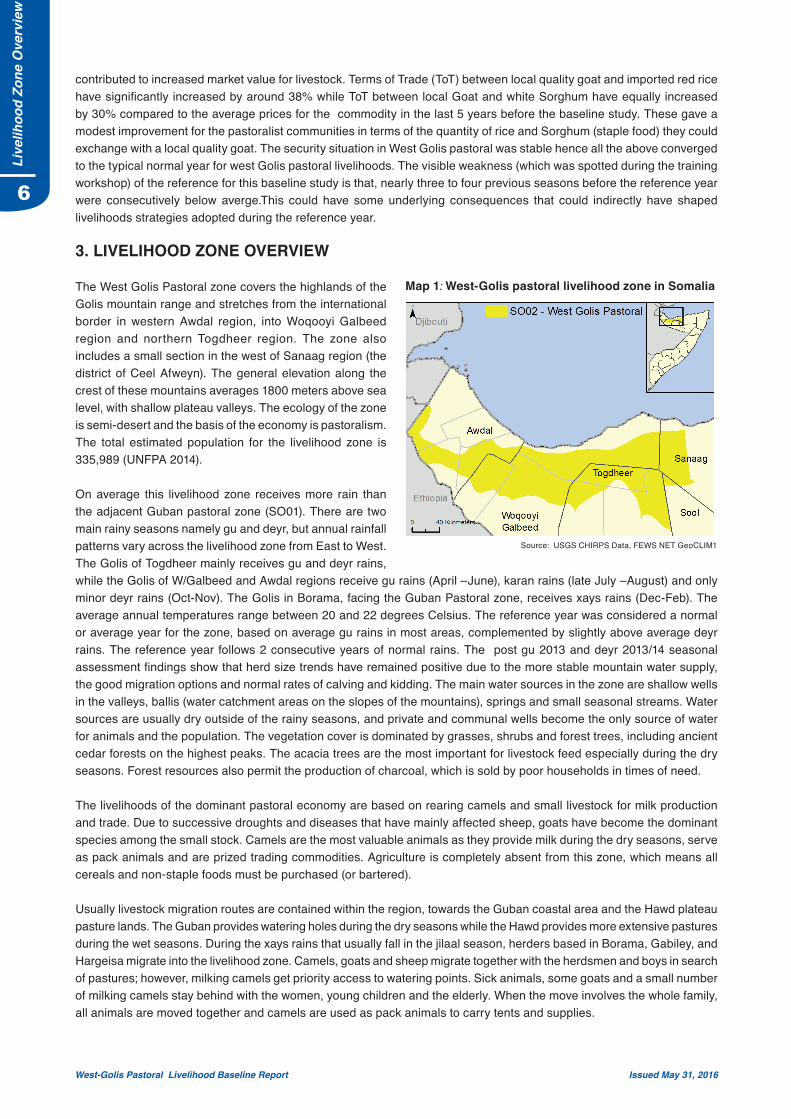
Source: USGS CHIRPS Data, FEWS NET GeoCLIM1
Map 1: West-Golis pastoral livelihood zone in Somalia
contributed to increased market value for livestock. Terms of Trade (ToT) between local quality goat and imported red rice have significantly increased by around 38% while ToT between local Goat and white Sorghum have equally increased by 30% compared to the average prices for the commodity in the last 5 years before the baseline study. These gave a modest improvement for the pastoralist communities in terms of the quantity of rice and Sorghum (staple food) they could exchange with a local quality goat. The security situation in West Golis pastoral was stable hence all the above converged to the typical normal year for west Golis pastoral livelihoods. The visible weakness (which was spotted during the training workshop) of the reference for this baseline study is that, nearly three to four previous seasons before the reference year were consecutively below averge.This could have some underlying consequences that could indirectly have shaped livelihoods strategies adopted during the reference year.
3. LIVELIHOOD ZONE OVERVIEW
The West Golis Pastoral zone covers the highlands of the Golis mountain range and stretches from the international border in western Awdal region, into Woqooyi Galbeed region and northern Togdheer region. The zone also includes a small section in the west of Sanaag region (the district of Ceel Afweyn). The general elevation along the crest of these mountains averages 1800 meters above sea level, with shallow plateau valleys. The ecology of the zone is semi-desert and the basis of the economy is pastoralism. The total estimated population for the livelihood zone is 335,989 (UNFPA 2014).
On average this livelihood zone receives more rain than the adjacent Guban pastoral zone (SO01). There are two main rainy seasons namely gu and deyr, but annual rainfall patterns vary across the livelihood zone from East to West. The Golis of Togdheer mainly receives gu and deyr rains, while the Golis of W/Galbeed and Awdal regions receive gu rains (April –June), karan rains (late July –August) and only minor deyr rains (Oct-Nov). The Golis in Borama, facing the Guban Pastoral zone, receives xays rains (Dec-Feb). The average annual temperatures range between 20 and 22 degrees Celsius. The reference year was considered a normal or average year for the zone, based on average gu rains in most areas, complemented by slightly above average deyr rains. The reference year follows 2 consecutive years of normal rains. The post gu 2013 and deyr 2013/14 seasonal assessment findings show that herd size trends have remained positive due to the more stable mountain water supply, the good migration options and normal rates of calving and kidding. The main water sources in the zone are shallow wells in the valleys, ballis (water catchment areas on the slopes of the mountains), springs and small seasonal streams. Water sources are usually dry outside of the rainy seasons, and private and communal wells become the only source of water for animals and the population. The vegetation cover is dominated by grasses, shrubs and forest trees, including ancient cedar forests on the highest peaks. The acacia trees are the most important for livestock feed especially during the dry seasons. Forest resources also permit the production of charcoal, which is sold by poor households in times of need.
The livelihoods of the dominant pastoral economy are based on rearing camels and small livestock for milk production and trade. Due to successive droughts and diseases that have mainly affected sheep, goats have become the dominant species among the small stock. Camels are the most valuable animals as they provide milk during the dry seasons, serve as pack animals and are prized trading commodities. Agriculture is completely absent from this zone, which means all cereals and non-staple foods must be purchased (or bartered).
Usually livestock migration routes are contained within the region, towards the Guban coastal area and the Hawd plateau pasture lands. The Guban provides watering holes during the dry seasons while the Hawd provides more extensive pastures during the wet seasons. During the xays rains that usually fall in the jilaal season, herders based in Borama, Gabiley, and Hargeisa migrate into the livelihood zone. Camels, goats and sheep migrate together with the herdsmen and boys in search of pastures; however, milking camels get priority access to watering points. Sick animals, some goats and a small number of milking camels stay behind with the women, young children and the elderly. When the move involves the whole family, all animals are moved together and camels are used as pack animals to carry tents and supplies.

7
West-Golis Pastoral Livelihood Baseline Report Issued May 31, 2016
His
toric
al T
imel
ine
and
Seas
onal
ity
The main markets for the zone are the urban centers of Borama and Hargeisa. There are other important trading centers further away such as Wajaale, Burao, Oodweyne, and Berbera and, across the border, Djibouti. The main road in the area links Burao, Hargeisa and Berbera forming a triangle to the east of the zone. It also links Hargeisa to Djibouti crossing the western limits of the livelihood zone. Due to the mountainous terrain, there are no major roads that traverse the zone. The majority of the transport routes are dirt tracks, which link rural settlements with rural markets and are transited mainly by camels and donkeys. Access with motorized transport is difficult. Although road transport is poor, communication networks have improved and mobile phones are widely used to transmit information.
4. HISTORICAL TIMELINE AND SEASONALITY
4.1 Historical TimelineThe historical timeline describes the major food security related events that occurred in the West Golis livelihood zone recently. The timeline provides a broader understanding of the climatic, socio-political and economic events in the livelihood zone. It is through intensive discussions of the historical timeline that, the baseline reference year was identified (April 2013- March 2014). The two main seasonal rainfall (Gu’13 and Deyr’14/15) that fall in the reference year were average (Gu: April -June 2013) and above average (deyr: Oct –Dec 2013).The other two previous seasons constituted an average year due to near normal rainfall levels that led to improvements in livestock conditions (FSNAU Technical series Report No VI.40 and VI.50). The zone was less affected by the recent food crises that have had damaging consequences across the central and southern regions. In particular, the zone was classified in stressed phase (IPC level 2) in both Gu2011 and Deyr 2011/12, when other parts of Somalia were either in Crisis (IPC 3) or Emergency (IPC 4). This means that, in the last four years, the West Golis livelihood zone was free from food crisis situations (IPC level 3), leading to substantial recovery and improvements of livelihoods security.
Figure 1: Estimated average rainfall in mm in West Golis Pastoral Zone
Year Season Rank2 Events Effects Responses
2013
Deyr-2013/14 4 • Good rains
• Improved rangeland conditions (pasture and water).
• Improved livestock body conditions.• Improved milk availability• Improved livestock reproduction.• Improved livestock market value
• Normal coping strategies.• Increased livestock sales to offset
debts• Normal migration.• Increased consumption of livestock
products (milk and meat)
Gu 2013 3 • Normal rains
• Good pasture and water conditions.• Good livestock body conditions.• Improved milk availability• Improved livestock reproduction.
• Normal coping strategies.• Increased livestock sales to offset
debts• Normal migration.• Increased consumption of livestock
products (milk and meat)
2012
Deyr 2012/13 3 • Near average rainfall
• Good pasture and water conditions.• Good livestock body conditions.• Improved milk availability• Improved livestock reproduction
Normal coping strategies.Increased sale of livestock. Reduced debts due to increased ability to offset.Normal migration.Increased consumption of livestock products (milk and meat)
Gu 2012 3 • Near average rainfall
• Good pasture and water conditions.• Good livestock body conditions.• Improved milk availability.• Improved livestock reproduction.
• Normal coping strategies.• Increased sale of livestock. • Reduced debts due to increased ability to offset.•Normal migration.•Increased consumption of livestock products (milk and meat)
Table 2: Historical Timeline

8
West-Golis Pastoral Livelihood Baseline Report Issued May 31, 2016
Mar
ket A
naly
sis
4.2 Seasonality• In general, the zone receives bi-modal rainfall: the gu rains (April-June) and the normally shorter deyr rains (October-
December), separated by two dry seasons jilaal (January-March), and hagaa (July – September). During the wet season surface water and pasture availability for livestock production improves, thereby increasing livestock reproduction and productivity. Livestock migrations are mainly influenced by availability of pasture and water and insecurity..
• Livestock sales, especially those for export markets, peak for the Eid and Hajj season when demand increases (the timing of which differs each year), while local sales peak during and just after the rains when animal body conditions are at their best. Animal sales also occur during the dry seasons and the pastoral lean season when cash income is needed, and also to reduce the number of stressed animals.
• Milk production increases during the rainy season when most mating and birthing takes place. Normally camel milk prices increase during Hagaa and remain high throughout the short rainy season due to limited supply of goat and sheep milk in the markets. Milk prices decrease when there is a concentration of livestock at watering points and when production increases during the rainy season.
• Food prices often increase towards the end of the monsoon season (August) when rough navigation conditions reduce shipping activities and limit food imports, especially the staple cereals. The major pastoral lean season falls between the months of February and March at the end of the harsh jilaal season. A secondary less intense lean season occurs between September and October, until the first deyr rains.
5. MARKET ANALYSIS
This section discusses the characteristics of livestock market which form an integral part of West Golis livelihoods. It also considers the price performance for staple and non-staple food items. This analysis looks into average commodity prices of the reference year (April 2013 –March2014) compared to the previous five - year average (2008-2012) in order to see the price changes and trends of the concerned items. The markets used for the analysis are Borama and Hargeysa -the main markets in livelihood zone. However, there are other important trading centers further away, such as Wajaale, Burao, Oodweyne and Berbera whose market prices are relevant for this zone. The objective is to understand households’ access to food and other essential commodities since the population heavily depends on market purchase and sale of livestock as their major sources of food and income respectively.
The main roads in the area links Burao, Hargeisa and Berbera to the east of the zone, and also Hargeisa to Djibouti crossing the western boarder of the livelihood zone. Due to the mountainous terrain, there are no major roads that traverse the zone. The majority of the transport routes are dirt tracks, which link rural settlements with rural markets and are transited mainly by camels and donkeys. Access with motorized transport is difficult. Although road transport is poor, communication networks have improved and mobile phones are widely used to transmit information.
2011
Deyr 2011/12 2-3 • Near average rainfall
• Good pasture and water conditions.• Good livestock body conditions.• Improved milk availability• Improved livestock reproduction
• Normal coping strategies.• Increased sale of livestock. • Reduced debts due to increased ability to offset.• Normal migration.• Increased consumption of livestock products (milk and meat)
Gu 2011 2-3 • Near average rainfall
• Average water and livestock body conditions.Poor pasture and browsing due to locust outbreak.
• Normal coping strategies.• Increased sale of livestock. • Reduced debts due to increased ability to offset.• Normal migration.• Increased consumption of livestock products (milk and meat)
2010 Deyr 2010/11 2-3• Below average rainfall performance
• Below average rangeland conditions• Poor livestock body conditions• Over grazing due to pressure of in-migration to areas that received some rains.
• Normal coping strategies.• Increased sale of livestock. • Reduced debts due to increased ability to offset.• Normal migration.• Increased consumption of livestock products (milk and meat)
5 = an excellent season for household food security (e.g. due to good rains, good prices, good crop yields); 4 = a good season or above average season for household food security; 3 = an average season in terms of household food security; 2 = a below average season for household food security; 1 = a poor season (e.g. due to drought, flooding, livestock disease, pest attack) for household food security

9
West-Golis Pastoral Livelihood Baseline Report Issued May 31, 2016
Mar
ket A
naly
sis
Source: FEWS NET/FSNAU
Map 2: Major Livestock Markets
o
o
o
o
n|
n|
n|
n|
n|
n|
n|
X
X
X
#0
#0
#0
#0
#0
#0
#0
#0
#0
#0
#0
#0
#0#0
#0
#0
#0
#0
#0
#0
#0
#0
#0
KEN
YA
ETHIOPIA
DJIBOUTIGulf of Aden
Indian Ocean
Burao
Baidoa
Galkayo
Gode
Liboi
Wajir
DarorAware
Werder
Kelafo
Mandera
Garissa
Ji Jiga
Bur Hosc
Mustahil
LuuqHudur
Hobyo
Galad
AdaleJowhar
Garowe
Boroma
Kismayo
Gebiley
Diinsor
Erigabo
Bossaso
Berbera
Bardera
Afmadow
Oodweyne
Las Anod
Hargeysa
El Barde
Tog Wajaale
Qansah Dere
Beled-Weyne
Xiis
Maydh
MERKA
El Man
BERBERA
MOGADISHU
ETHIOPIA
KENYA
YEMEN
DJIBOUTI
ERITREA
Updated: 18, May 2015
Datum: WGS84Data Source: FSAU, 2002Admin. layers: UNDP, 1998
Baidoa
To Gulf States
To Gulf States
To Gulf States
To Gulf States
To Gulf States
To Gulf States
To Gulf States
To Gulf States
SOMALIA: MAJOR LIVESTOCK MARKETS, ROUTES AND INFRASTRUCTURE
LEGEND
&3 Main Market
#0 Market
X Slaughter House
n| Sea Port
o Export by plane to Emirates
Livestock movementExport by boat
Regional Boundary
District Boundary
International Boundary
Coastline
Household income in the West Golis livelihood zone is derived primarily from the trade of livestock and livestock products like milk. Borrowing is common in the zone and it is arranged on informal and flexible terms with no fixed repayment deadlines. As a result, this source of cash income should be partly interpreted as a gift than normal credit. The main reason to treat the credit as a gift is that often it’s not paid within the same year so it is difficult to account for in the annual household income/expenditure analysis. What make this even more difficult is that fact that credit providers will not compel the borrowers to pay, and often write off the debt in the name of individual social responsibility to assist the poorer people. Credit is usually arranged with wealthier households of the same community. The analysis will equally consider food items (both staple and non-staple)
5.1 Livestock PricesExport quality livestock are transported to Berbera from where they are shipped on dhows or cargo ships to Yemen, Saudi Arabia, Egypt and other Gulf states. In the past several decades Gulf exports have been disrupted by a series of trade bans due to fear of the spread of livestock diseases, mainly Rift Valley Fever and Rinderpest. The last such ban was imposed in 2000 and was not lifted until 2009. Animals are now quarantined before export in Aljaberia and Indhodeero (near Berbera) where quarantine facilities were established in 2007 and 2011 to provide health screening and vaccinations. Animals are also trekked and trucked to Tog Wajaale (situated close to the Ethiopian border) for sale in Ethiopia and Djibouti. Burao market on the Hawd plateau is the largest assembly point for sheep, goats and camels because of its central location and proximity to the Ethiopian-Somali region as well as to Central Somalia.
There are a number of agents and intermediaries along the livestock value chain namely; producers (pastoralists and agro-pastoralists), jeeble (traders), agents, brokers, transporters, escorts and exporters. Jeeble are traders who buy livestock in rural villages, keep them for a short
West Golis Seasonal calendar
Rainy/dry seasons gu
Livestock
Camel Conception
Births-Camel
Sheep and Goats Conception
Births (Sheep & Goats)
Milk production
Livestock sales
Livestock Migration-average year
Livestock Migration-bad year
Livestock Diseases
Purchases of staple food
Purchases of non staple food
Lean Season
Human diseases
Legend livestock Conception Calving and Kidding Milk production
hagaa deyrJilaal
Peak
Jan Feb Mar Apr May Nov DecJun July Aug Sept Oct
Figure 2: Seasonal Calendar for the West Golis Pastoral Zone

10
West-Golis Pastoral Livelihood Baseline Report Issued May 31, 2016
Figure: 4 Goat Export Quality (Borama & Hargeisa)Figure: 3 Sheep Export Quality (Borama & Hargeisa)
Figure: 5 Goat Local Quality Price (Borama & Hargeisa)
Mar
ket A
naly
sis
period and sell them on at secondary markets. Selling directly to traders reduces the cost of the trip to the main markets and often traders pay the producers even before collecting the animals. Brokers facilitate livestock sales at the main markets but also secure animals against theft during the transaction.
Livestock markets are generally in poor condition and need upgrades in basic infrastructure such as water provision, fencing, feedlots, holding grounds, loading ramps and veterinary services. Animals can spend a number of days or weeks in intermediary markets waiting for onward transport and body conditions can deteriorate during this period lowering the value of the animal.
Livestock prices are influenced by a number of factors, first of which are the animal’s age, sex , breed and, especially, the body condition which is linked to rainfall, water and pasture availability. Other factors include exchange rates (Somali shillings against American Dollars) and the level of external demand in Gulf markets, which increases during the main Islamic festivals (Eid and Hajj). The Hajj pilgrimage is the most important season for small stock sales and around half of all goats and sheep are exported during this period and the preparations leading to the Eid celebrations.
Figure 3, 4, and 5 demonstrate seasonal trends for goats and sheep prices, reflecting higher prices during the peak rainy season and declining in the dry period. However, prices of all species in the reference year are considerably higher than the five- year average.
Actual livestock prices during the reference year and last 5 years average in LZ.
The average monthly price for the goat local quality has shown an increase of 32% (from Slsh 257 339 to Slsh 339 033) during the reference year, compared to five-year average (2008- 2012) while the goat export quality prices increased during the reference year by 47% (from Slsh 331 451 to Slsh 476 974) compared to the five year average. On the other hand, sheep export quality prices have shown significant improvement of about 32 % compared to the 5 year average (from Slsh 338 398 to Slsh 447 177).The favorable prices for small ruminants during the reference year can be ascribed to increased livestock demand for export to Saudi Arabia during the Islamic pilgrimage while more local quality livestock is sold and consumed locally including but not limited to demands triggered by Islamic festivals (Eid-ul Adha and Eid-ul-fitr). Camels are rarely sold on local markets except for huge family expenditure like weeding or offsetting accrued debt.
Camel local quality market prices has registered a tremendous increase of 90% during the reference year (Slsh 3 851 219) compared to the five-year average (2008- 2012) which was Slsh 2 021 868. Additionally, fresh camel milk prices in the reference year are slightly higher compared to the last five year before the livelihood baseline was conducted. A small increase of 5% was observed (from SLSh 4 176 to SLSh 4 370)

11
West-Golis Pastoral Livelihood Baseline Report Issued May 31, 2016
Mar
ket A
naly
sis
5.2 Milk ProductionWest-Golis pastoralists obtain substantial amount of income and food from livestock products. This varies across the wealth groups in direct proportion to herd sizes. The Poor households have the least amount of milk production consumption and sale while the Middle and Better- off have much larger volumes. Milk production is highly influenced by seasonal rainfall performance in the livelihood zone and is at peak level for all livestock during the wet season and low during dry periods. Camel milk forms the highest traded milk volumes in West Golis and its prices remain stable for most of the year. Aggregated camel milk prices during the reference year compared to the 5 year average has increased by 5% (from Slsh4176 to Slsh4370).This depicts relative stability in camel milk prices during reference period mainly due to normal milk supply facilitated by the improved rangeland conditions due to near- average seasonal rainfall performance with opportunities for migration.
5.3 Staple and non-staple food PricesBoth locally produced cereals, mainly sorghum from North West agro pastoral (Gebiley, Boramo and Baki) and imported commodities are available in both the main and rural markets of the livelihood zone. Average Sorghum prices during the reference year (April 2013 to March 2014) was Slsh3002 while that of the 5 year average (April 2008 to April 2012) was Slsh3180. This translates to 6% decrease compared to the 5 -year average. Other staple foods purchased are imported red rice and wheat flour, and non-cereal food like sugar, vegetable oil, and pasta (mainly for the Middle and Better - off wealth groups).Seasonal price variation is common, due to monsoon tide, which normally restricts trade flow. The purchasing power of households is linked to income levels of the different wealth groups, which are determined by the number of saleable livestock, livestock body conditions and livestock market value. In general, the price of imported food items are affected by fluctuations in the exchange rate, variations in international prices of fuel, transport costs, market supply and local demand.
Imported Rice and Wheat FlourThe average rice prices have declined by 6% and remained stable for wheat flour during the reference year (April 2013-March 2014) compared to the 5-year average prices. This means during the reference year staple food items were cheaper compared to previous 5 years hence favorable for the pastoralists whose livestock fetched more prices and bought staple food items at a cheaper prices.
Figure 6: Camel Local Quality Price in Borama and Hargeisa
Figure 7: Fresh Camel Milk 1 liter (Barama and Hargeisa)
Figure 8.Price trend of Sorghum per 1kg in Borama & Hargeisa
Figure 9 .Price trend of imported rice per 1kg Borama & Hargeisa

West-Golis Pastoral Livelihood Baseline Report Issued May 31, 2016
12
Live
lihoo
d A
sset
s
Other Food Items (Sugar and vegetable oil)The prices of sugar and vegetable oil in West Golis livelihood zone shares similar trends with other imported commodities. The average price of sugar during the reference year was Slsh 5320 compared to Slsh 5165 for the 5 - year average price translating to 3% increase. Vegetable oil price patterns have behaved differently for West Golis livelihoods mainly influenced by Global factors. The average price of vegetable oil in the reference year was Slsh 12,250 while that of the 5 - year average is Slsh 10,525 representing an increase of 16% for the reference year compared to the last 5- year average.
5.4 Terms of Trade (ToT)Terms of Trade (ToT) between local quality goat and imported red rice have significantly increased by around 38% while Terms of Trade between local goat and white sorghum have equally increased by 30% compared to the average prices for commodity in the last 5 years before the baseline study. The average kilograms of rice that a goat could buy during the last 5 years (before the study) was 53 kg while in the reference year a goat was exchanged with 72 kilogram of rice. Similarly a goat could buy around 89kg of sorghum for the 5 - year average and 116kg of sorghum during the reference year. The main reason for this is the increased goat prices in the reference year while that of rice and sorghum remained stable throughout the reference year.
6. LIVELIHOOD ASSETS
This section presents the main livelihood assets that the households in different wealth groups in the West-Golis Pastoral livelihood zone have access to and utilize. The assets described include both communal (public) and individual (household/domestic) assets.
6.1 Natural CapitalRangeland resourcesThe vegetation cover is dominated by grasses, shrubs and forest trees, including ancient cedar forests on the highest peaks. The acacia trees are the most important for livestock feed especially during the dry seasons. Forest resources also permit the production of charcoal, which is sold by poor households in times of need. The livelihoods of the dominant pastoral economy are based on rearing camels and small livestock for milk production and trade. Due to successive droughts and diseases that have mainly affected sheep, goats have become the dominant species among the small stock.
Figure 10: Price Trend of Vegetable Oil Figure 11: Price trend of Sugar
Figure 12: Terms of Trade between Local Quality Goat to Rice
Figure 13: Terms of Trade between Local Quality Goat to Sorghum

West-Golis Pastoral Livelihood Baseline Report Issued May 31, 2016
13
Live
lihod
Ass
ets
Camels are the most valuable animals as they provide milk during the dry seasons, serve as pack animals and are prized trading commodities.
Access to water resourcesThe main water sources in the zone are shallow wells in the valleys, ballis (water catchment areas on the slopes of the mountains), springs and small seasonal streams. Watercourses are usually dry outside of the rainy seasons; however, private and communal wells become the only source of water for animals and population.
Usually livestock migration routes are contained within the region, towards the Guban coastal area and the Hawd plateau pasture lands. The Guban provides watering holes during the dry seasons while the Hawd provides more extensive pastures during the wet seasons. During the xays rains that usually fall in the jilaal season, herders based in Borama, Gabiley, and Hargeisa migrate into the livelihood zone. Camels, goats and sheep migrate together with the herdsmen and boys in search of pastures and milking camels get priority access to watering points.
Environmental degradation: This is an endemic problem contributing to the loss of pastures due to changing climatic conditions and lack of proper land and water resource management systems. The loss of pastures is further intensified by the increase in agricultural land areas, Khat farming and charcoal production. Uncontrolled construction of berkads for commercial purposes results in overgrazing around water points. This contributes to increasing environmental degradation that ultimately undermines livelihoods.
6.2 Human Capital. Human capital includes labour, skills, education, health and knowledge which directly influence livelihood choices and food security outcomes.
Family structures: The majority of West Golis pastoral households (Poor and Middle) are monogamous with a household size of about 5-9 members, while the Better-off which represents a smaller portion of the population are polygamous with a household size of about 10-12 dependents.
Access to Education Pastoral households in West-Golis livelihood zone have access to two educational systems: the traditional Koranic school system and the modern educational (non-Koranic) system. Almost all pastoralists access Koranic education. Formal primary to secondary education is limited to large settlements and urban towns. Formal education is accessible to the Better Off and some Middle wealth groups because they have the resources to educate their children. Often, nomadic families send their children to large villages or towns to stay with relatives in order to ensure access to education. Middle and Better -off families send their children to urban areas where schools are better equipped, more stable, and provide quality education. There is however very limited access to formal education in most pastoral rural areas.
Food security, health and nutrition:In Post Gu 2013 food security analysis (start of reference year), nearly 36% (33 000 persons) of total population of West Golis livelihood Zone was classified as Stressed (IPC level 2) with nobody else remaining in Crisis (IPC level 3). The Nutrition situation of the West Golis pastoral during the same period was Serious with a GAM rate of about 14.9%. Similarly modest improvement continued to be realized during the following season which was towards the end of the reference year (Deyr 2013/14) whereby about 26% (24,400) of the total population were identified in Stressed (IPC Level 2) while nutrition situation remained serious with a GAM –MUAC rates of about 5.6%3. In the following season (GU 2014), Food security situation further improved where by about 22% of the total population were identified in stressed phase while significant deterioration (Critical 15.8% GAM rates) was witnessed in nutrition due to other nonfood related factors including limited access to health services, limited drug supplies and lack of qualified staff.
3 GAM rate is Global Acute Malnutrition derived from Weight for Height whereas GAM-MUAC is Acute malnutrition based on MUAC only
Table 3: IPC progression in West-Golis pastoral livelihood zone
Season of Reference
Estimated population by Livelihood Zone
Stressed (IPC Phase 2)
Crisis (IPC Phase 3)
Emergency (IPC phase4)
Total Population IN crisis
GU 2013 92,680 33,000 0 0 0Deyr 2013/14 92,680 24,400 0 0 0Gu 2014 92,680 20,800 0 0 0

West-Golis Pastoral Livelihood Baseline Report Issued May 31, 2016
14 14
Wea
lth b
reak
dow
n
6.3 Social CapitalThe Poor households have a relatively strong access to the traditional social support (such as Irmansi- sharing milk and also cash gifts) from Middle and Better-off groups. Both men and women have access to gifts in kind and cash and even credit opportunities from traders who they share among other issues, clan relations. Credit is usually used for purchasing food and this is a common practice in the zone. Although the majority of Poor pastoral households are in debt, borrowing arrangements are flexible and households are not under pressure to return the loans. This source of income has been determined as a gift rather than loans for West Golis. Poor households also receive monetary gifts. Typically, a wealthier household will sell a camel and donate the proceeds to a group of disadvantaged households as part of the Islamic system of zakat.
In addition to the sale of livestock, Better-off households top up their annual income through petty trade activities and remittances from the Diaspora or from family members based in urban areas inside the country. Remittance flows to the pastoral communities is common, but not typical for all wealth groups, and is most common amongst urban communities. Like Better-off households, the Middle households offer gifts to poorer households and may receive gifts or remittances from family members, but the latter are not common strategies for their livelihoods.
6.4 Physical Capital The chronic poor conditions of infrastructure networks always jeopardize market access and increase transportation costs of staple and non–staple items. Due to the mountainous terrain, there are no major roads that traverse the zone. The majority of the transport routes are dirt tracks, which link rural settlements with rural markets and are used mainly by camels and donkeys. Access with motorized transport is difficult. Although road transport is poor, communication networks have improved and mobile phones are widely used to transmit information. These services are carried out by local private enterprises such as Golis, National link and Somtel. Livestock markets are generally in poor conditions and need upgrades in basic infrastructure such as water provision, fencing, feedlots, holding grounds, loading ramps and veterinary services. The zone is generally vulnerable to water scarcity and the main water sources are shallow wells in the valleys, ballis (water catchment areas on the slopes of the mountains), springs and small seasonal streams. All the sources are unprotected which may increase human susceptibility to diseases. Water sources are usually dry outside of the rainy seasons, meaning only private and communal wells become the only available source of water for animals and population alike.
6.5 Financial Capital: Livestock and livestock products sales are important sources of income for all the wealth groups of west Golis pastoral. Despite the variations in livestock holdings across the different wealth groups, the contribution of livestock and livestock products to income and food, respectively, is very significant. Camels are the most important animals for the pastoralists.
7. WEALTH BREAK DOWN
7.1 Wealth characteristicsThe clear determinant of wealth in this livelihood zone is the ownership of livestock, firstly, camels which are worth 10 times the economic value of a goat, followed by goats and lastly sheep. Poor households are defined from local context as those who have 4 to 5 camels and between 40 and 60 goats/Sheep. The Poor are mainly monogamous with a household size of 6 members and constitute 30% - 35 % of the total population in the livelihood zone. The Middle and the Better-off households are those who own more livestock, about 10-15 camels, 100-140 goats/sheep for Middle; and 20-35 camels; 170-230 goats/Sheep for the Better-off wealth groups. Like Poor households, most Middle households are monogamous with an average household size of 8 members, while the t Better-off are typically polygamous (2 wives) with extended family size of 10-12 including some extra dependents.
Table 4: Wealth Group characteristics in West Golis Pastoral Livelihood Zone
Wealth Group characteristics Poor Middle Better-offHousehold percentage (%) 30 - 35 50 - 55 15 -20Household size (#) 5 -7 (6) 7 – 8 (8) 10 -12 (11)Typical livestock holding (#)Sheep 10 - 15 25 - 40 40 - 60Goats 30 - 45 80 - 100 130 -170Cattle 0 0 0Camels 3 - 5 10 - 15 20 - 35Donkeys 0 - 1 1- 3 2- 4
West-Golis Pastoral Livelihood Baseline Report Issued May 31, 2016
15 15
Wea
lth B
reak
dow
n
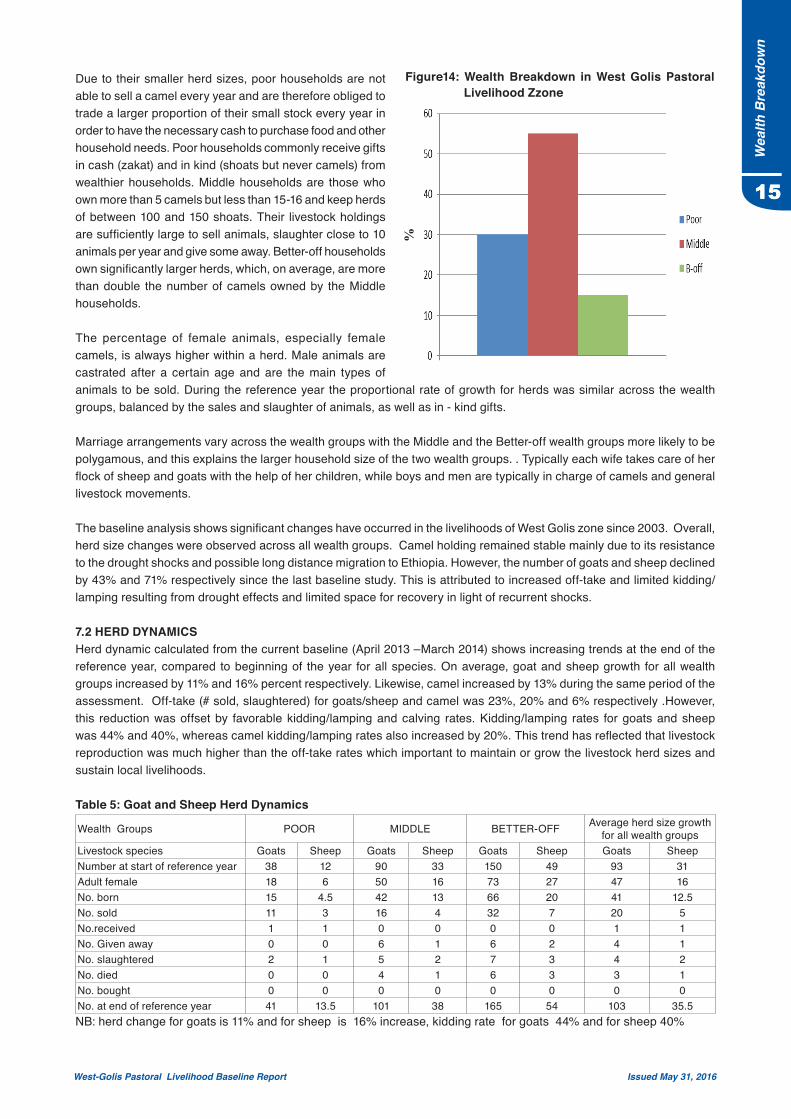
Due to their smaller herd sizes, poor households are not able to sell a camel every year and are therefore obliged to trade a larger proportion of their small stock every year in order to have the necessary cash to purchase food and other household needs. Poor households commonly receive gifts in cash (zakat) and in kind (shoats but never camels) from wealthier households. Middle households are those who own more than 5 camels but less than 15-16 and keep herds of between 100 and 150 shoats. Their livestock holdings are sufficiently large to sell animals, slaughter close to 10 animals per year and give some away. Better-off households own significantly larger herds, which, on average, are more than double the number of camels owned by the Middle households.
The percentage of female animals, especially female camels, is always higher within a herd. Male animals are castrated after a certain age and are the main types of animals to be sold. During the reference year the proportional rate of growth for herds was similar across the wealth groups, balanced by the sales and slaughter of animals, as well as in - kind gifts.
Marriage arrangements vary across the wealth groups with the Middle and the Better-off wealth groups more likely to be polygamous, and this explains the larger household size of the two wealth groups. . Typically each wife takes care of her flock of sheep and goats with the help of her children, while boys and men are typically in charge of camels and general livestock movements.
The baseline analysis shows significant changes have occurred in the livelihoods of West Golis zone since 2003. Overall, herd size changes were observed across all wealth groups. Camel holding remained stable mainly due to its resistance to the drought shocks and possible long distance migration to Ethiopia. However, the number of goats and sheep declined by 43% and 71% respectively since the last baseline study. This is attributed to increased off-take and limited kidding/lamping resulting from drought effects and limited space for recovery in light of recurrent shocks.
7.2 HERD DYNAMICS Herd dynamic calculated from the current baseline (April 2013 –March 2014) shows increasing trends at the end of the reference year, compared to beginning of the year for all species. On average, goat and sheep growth for all wealth groups increased by 11% and 16% percent respectively. Likewise, camel increased by 13% during the same period of the assessment. Off-take (# sold, slaughtered) for goats/sheep and camel was 23%, 20% and 6% respectively .However, this reduction was offset by favorable kidding/lamping and calving rates. Kidding/lamping rates for goats and sheep was 44% and 40%, whereas camel kidding/lamping rates also increased by 20%. This trend has reflected that livestock reproduction was much higher than the off-take rates which important to maintain or grow the livestock herd sizes and sustain local livelihoods.
Table 5: Goat and Sheep Herd Dynamics
Wealth Groups POOR MIDDLE BETTER-OFF Average herd size growth for all wealth groups
Livestock species Goats Sheep Goats Sheep Goats Sheep Goats SheepNumber at start of reference year 38 12 90 33 150 49 93 31Adult female 18 6 50 16 73 27 47 16No. born 15 4.5 42 13 66 20 41 12.5No. sold 11 3 16 4 32 7 20 5No.received 1 1 0 0 0 0 1 1No. Given away 0 0 6 1 6 2 4 1No. slaughtered 2 1 5 2 7 3 4 2No. died 0 0 4 1 6 3 3 1No. bought 0 0 0 0 0 0 0 0No. at end of reference year 41 13.5 101 38 165 54 103 35.5NB: herd change for goats is 11% and for sheep is 16% increase, kidding rate for goats 44% and for sheep 40%
Figure14: Wealth Breakdown in West Golis Pastoral Livelihood Zzone
%
16
West-Golis Pastoral Livelihood Baseline Report Issued May 31, 2016
Live
lihoo
d St
rate
gies
Table 6: Camel Herd Dynamics
Wealth Groups POOR MIDDLE BETTER-OFFAverage herd size
growth for all wealth groups
Livestock species Camels Camels Camels CamelsNumber at start of reference year 4 12 28 15Adult female 2 6 14 7No. born 1 3 6 3No. sold 0 1 1 1No.received 0 0 1 0No. Given away 0 0 0 0No. slaughtered 0 0 1 0No. died 0 0 0 0No. bought 5 14 31 17No. at end of reference year 4 12 28 15NB: herd change for camel is 13% increase, off take 6%, calving rate is 20%.
8. LIVELIHOOD STRATEGIES
Livelihood strategies is the way in which different wealth groups obtain their food and income, their expenditure patterns, and coping mechanisms engaged during the shock time to maintain their strategies and achieve desired outcome. The type of assets they have and external factors (vulnerability context and policy, institutions and processes), are determinant factors to household’s livelihood food security outcomes. This section discusses the livelihood strategies of three different wealth categories (Poor, Middle & Better - off) in West Golis Pastoral livelihood zone in reference year.
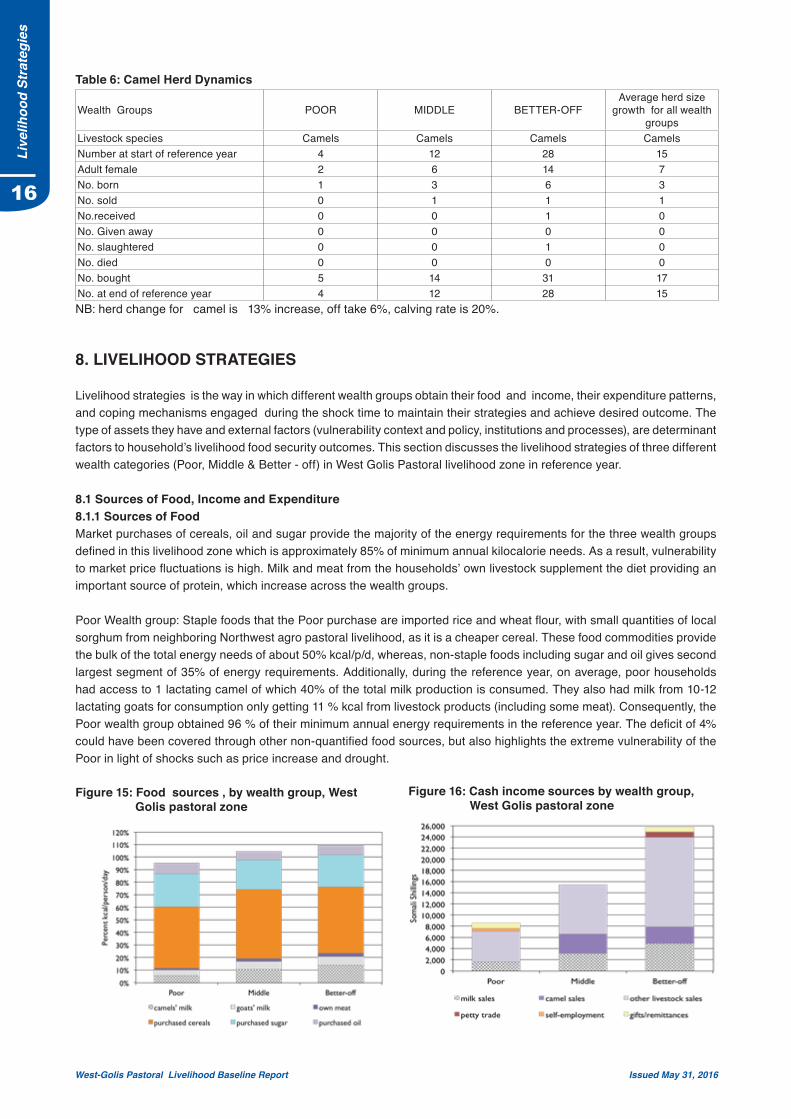
8.1 Sources of Food, Income and Expenditure8.1.1 Sources of FoodMarket purchases of cereals, oil and sugar provide the majority of the energy requirements for the three wealth groups defined in this livelihood zone which is approximately 85% of minimum annual kilocalorie needs. As a result, vulnerability to market price fluctuations is high. Milk and meat from the households’ own livestock supplement the diet providing an important source of protein, which increase across the wealth groups.
Poor Wealth group: Staple foods that the Poor purchase are imported rice and wheat flour, with small quantities of local sorghum from neighboring Northwest agro pastoral livelihood, as it is a cheaper cereal. These food commodities provide the bulk of the total energy needs of about 50% kcal/p/d, whereas, non-staple foods including sugar and oil gives second largest segment of 35% of energy requirements. Additionally, during the reference year, on average, poor households had access to 1 lactating camel of which 40% of the total milk production is consumed. They also had milk from 10-12 lactating goats for consumption only getting 11 % kcal from livestock products (including some meat). Consequently, the Poor wealth group obtained 96 % of their minimum annual energy requirements in the reference year. The deficit of 4% could have been covered through other non-quantified food sources, but also highlights the extreme vulnerability of the Poor in light of shocks such as price increase and drought.
Figure 15: Food sources , by wealth group, West Golis pastoral zone
Figure 16: Cash income sources by wealth group, West Golis pastoral zone

17
West-Golis Pastoral Livelihood Baseline Report Issued May 31, 2016
Live
lihoo
d St
rate
gies
Middle and Better off: The Middle and Better-off households depend on similar food types as the Poor. However, the Better- off wealth group has additional access to pasta and maize meal in their staple basket, which is more expensive than rice and wheat flour. The two wealth groups have an ability to achieve more than basic survival needs and obtain 86 % from market purchases, while 19% and 23% of energy was attained from own livestock products(milk and meat) respectively. The major differences in consumption patterns across the wealth groups are the larger quantities of milk and meat consumed by the Middle and the Better-off households (roughly double that of the Poor households) during the reference year.
8.2. Sources of IncomePoor wealth group: Livestock and livestock products sales are the main income for all wealth groups of west Golis pastoral. Total annual income for the poor household is estimated at Slsh 8,555,000, of which 63 %( Slsh 5,400,000) comes from the sale of goats/Sheep (6 export goats/sheep and 8 local goats/sheep) and Slsh 1,650,000 from sale of 60 % of the total milk production from 1 lactating camel. To supplement their income, the Poor households group collect Slsh600,000 (7%) income from the sale of charcoal during the dry seasons (charcoals selling is for approximately 5 months of the year) and rely on borrowing about Slsh400,000 (5%) from wealthier households. Although the majority of the Poor pastoral households are in debt, borrowing arrangements are flexible and households are not under pressure to return the loans. They also receive 6% percent of their annual income in the form of gifts in cash (Slsh 512,000) from social support. Typically, a wealthier household gives a camel to a group of disadvantaged households as part of the Islamic system of zakat, to share among them or goats/sheep to an individual.
Middle and Better-Off: Income patterns are equally determined by livestock holdings. The Middle and the Better-off households own larger herds and support their livelihood through the sale of camel milk, at least one live camel per year and between 20 and 35 small livestock, mainly goats. The majority of these animals are sold for export to the Gulf States and export quality livestock fetch around 60% higher prices than local sale prices. Male animals are the preferred type of animal to be exported. This can be a pre-requisite for exports to the Gulf – a policy that is more easily implemented at the seaports and is in place to prevent the export of breeding stock.
On average, annual income for the Middle and the Better - off households is calculated at SlSh 15 444 000 and Slsh 25 752 000 which is about the double and triple of the total income of Poor households. The highest proportion of the total income i.e. Slsh 12 300 000 and Slsh 18 900 000 (79% and 73% respectively) is derived from the sale of larger number of small ruminants and camels respectively. Milk sales also provide significant contribution to total income giving Slsh3, 144 000 and Slsh 5 002 000 (19% and 20%) respectively. In addition to the sale of livestock, the Better-off households top up their annual income through petty trade activities – Slsh 1,000,000 (4%) and remittances – Slsh 850,000(3%) from the Diaspora or from family members based in urban areas inside the country. Remittance flows to the pastoral communities is common, but not typical for all wealth groups, and is more common in urban communities.
8.3 Expenditure patternThe three wealth groups purchase similar products but in different quantities. With respect to expenditure patterns, food represents the largest expenditure category across the wealth groups. However, the Poor and the Middle wealth groups spend more on food compared to the Better - off group. The relative weight of this item is heaviest for the Poor households (approximately 66% of their annual expenditure) but it is also an important expenditure category for the Middle households (roughly 53% of their annual income), however, for the Better -off group t 56% of total expenditure was on non-food items while 44% was on food, which is indicative of their relative stability and less vulnerability to shocks such as market price fluctuations.
The Poor: The Poor households spent a total of Slsh 8,525,000 on food and non-food commodities. About 66% of the total expenditure was on food commodities (staple 37% and non-staple 29%). The remaining portion was spent on household items (10%), social services (10%) and cloths (10%).Moreover, another 3% was used to purchase Khat and tobacco and the least amount spent on livestock inputs (1%). Often, the Poor wealth groups will cut expenditure on less essential items to ensure they are able to access the minimum food energy requirements.
Figure 17: Expenditure Patterns, by Wealth Group, West Golis Pastoral Zone
18
West-Golis Pastoral Livelihood Baseline Report Issued May 31, 2016
18
Haz
ards
and
vul
nera
bilit
y co
nditi
ons
The Middle and the Better-Off: The total annual income for the Middle and the Better- off is about double and triple of the earnings of the Poor. These two wealth groups also used about 50% and 42% of their annual expenditure on food purchase (31% on staple and 19% on non-staple food for the Middle), and (25% staple and 17% on non-staple for the Better - off). The two wealth groups spent relatively more on non-food items than the Poor households due to their higher livestock holdings and their access to more diversified income, particularly the Better off wealth group. The second largest expenditure was on buying cloths (15-16%). Social services and household items are the third category of expenditure at 9% and 10% for the Middle, and 12% and 14% for the Better – off. Clan taxes are paid by the Middle and the Better-off groups, paying an average of Slsh 300.000(2%) and Slsh 500.000(2%) per year. The remaining expenditure is on Khat, and tobacco at 6%.
9. HAZARDS AND VULNERABILITY CONDITIONS
The main hazards which affect the pastoral economy of the West Golis livelihood zone are listed below;
Drought/weather shocks – by far the main hazard is the lack of pasture and water due to reduction in rainfall levels and drought situations, which lead to weakened animal body weight and value. Insufficient water and pasture also reduce milk production. Recurrent and persistent droughts affect livestock production and herd viability as miscarriages can occur alongside the death of young animals. The drying up of water sources often results in having to rely on water trucking (and this comes with increased household expenditure on water), and increased migration and family separation.
Livestock diseases - animal disease outbreaks follow in importance and are frequent especially during the dry season. Tick-borne diseases deteriorate livestock body conditions and reduce their value. Common livestock diseases include internal parasites (Gooriyan), diarrhoea (Shuban), lumpy skin disease and respiratory diseases.
Livestock ban or restrictions and border closures: Restrictions on livestock exports especially to the Gulf States have a serious impact on pastoralist livelihoods in the zone. The 2000 – 2009 ban on livestock export to prevent the spread of livestock diseases into the Gulf peninsula is a case in point.
Insecurity: this is often the result of conflict among different clans of the livelihood zone and neighboring zones over pasture and water sharing. Civil insecurity causes frequent displacement of pastoralists and it can disrupt trade, increasing the cost of essential food items. Sometimes conflict results in death.
High food prices – especially for rice, wheat flour, sugar, tealeaves and oil.
Environmental degradation: - This is an endemic problem contributing to the loss of pastures due to changing climatic conditions and lack of proper land and water resource management systems. The loss of pastures is further intensified by the increase in agricultural land areas, Khat farming and charcoal production. Moreover, uncontrolled construction of berkads for commercial purposes results in overgrazing around water points.
In order to cope with changes in weather patterns and other hazards, households resort to certain strategies many of which are used every year such as adjusting the timing of mating and birthing for livestock, migrating, hand feeding animals, selling older animals and/or exchanging them for younger ones, storing ghee for consumption during lean season, or selling first quality goats to build up a reserves of cash.
Table 7: Coping strategies in response to shocks in West Golis Pastoral
Very poor/poor Middle/better offReduction of expenditure on non-food items and meal sizes Reduction of expenditure on non-food items and meal sizes
Increasing livestock sales Increasing livestock sales (especially export quality animals)Long distance migration (camels and sheep, followed by goats later on) Long distance migration (camels and sheep, followed by goats later on)
Consumption of wild fruits (Kulan and Garas) Consumption of wild fruits (Kulan and Garas)
Seeking gifts, loans and other forms of social support locally Seek for increased remittances from family members in urban centers or other areas
Splitting family members to go and work in urban centers Migration from affected areas to safe areas in cases of livestock disease epidemics
19
West-Golis Pastoral Livelihood Baseline Report Issued May 31, 2016
19
Con
clus
ion\
Rec
omm
enda
tions
10. CONCLUSIONS
The main finding of the assessment is that livestock (camel and goat/sheep) are the core assets for pastoral livelihoods in West –Golis. During the reference year, herd size growths for all wealth groups have shown increasing trends. On average, goat and sheep growth across all wealth groups was by 11% and 16% respectively. Likewise, camel increased by 13% during the same period of the assessment. Kidding/lamping rates for goats and sheep was 44% and 40% respectively, whereas, camel also showed an increase of 20%. This good calving/kidding/lamping rate stabilized the losses incurred through off- take i.e. sold, slaughter and died) in the reference year.
Market purchases of the imported food commodities (rice, wheat flour, pasta, sugar and oil), provide the greater part of the energy requirements for the three wealth groups defined in this livelihood zone. Purchases accounted for approximately 85% of total food energy in take in the reference year. Cash to purchase the food and nonfood items is obtained from the sale of livestock and livestock products. Most of the Poor households are unable to meet the minimum energy requirement for survival (only accessed 96% kcal/p/day in the reference year) by their own means, though this level of access is reasonable in pastoralist contexts. The main reasons behind this poor access include persistent chronic food insecurity from recurrent droughts, insecurity, and lack of effective government and functional institutions.
Market purchase is the main source of food in the zone, complemented with livestock products. Livestock sales are the main enabler for this significant food purchase and the poorer households are struggling to maintain their herd sizes as a result.
11. Recommendations
In order to improve the well being of pastrolalists in West Golis Pastoral Zone, the following development interventions are recomended:• Cash for work programs for the construction of communal assets such as roads, dams for slowing down running water
from mountains and rain water harvest can enhance this livelihood system. • Establish pastoral committees consisting of different wealth groups and council of elders that have direct link to the
government institution for proper rangeland management.• Promote livestock marketing systems and products, for better access to increased income. This will enable higher
returns from fewer livestock sales compared to the current systems that deny adequate incomes for the Poor.• Provide micro credit and revolving funds to cooperatives (women and youth groups) for engaging in income generating
activities such as milk/ghee, skin, and livestock trade.• Extend livestock services (especially animal health services) to the livelihood zone by increasing access to livestock
inputs (drugs) and to train community animal health workers.
Table 8: Key Parameters to Monitor in West GolisPastoral
Crop Production n/a n/a
Animal Production
Supply of camelsSupply of goatsSupply of camel milk (season 1 and 2)Supply of camel milk (one season only)
Price of camels (local and export quality)Price of goats (local and export quality)Price of camel milk (season 1 and 2)
Other Price of maize

West-Golis Pastoral Livelihood Baseline Report Issued May 31, 2016
The Information Management Process Gathering & processing• FSNAU has a unique network of 32 specialists all over Somalia, who assess the food security and nutrition situation
regularly and 120 enumerators throughout the country, who provide a rich source of information to ensure a good coverage of data.
• Food security information is gathered through rapid assessments as well as monthly monitoring of market prices, climate, crop and livestock situations.
• Baseline livelihood analysis is conducted using an expanded Household Economy Approach (HEA).• The Integrated Database System (IDS), an online repository on FSNAU’s official website www.fsnau.org, provides
a web-based user interface for data query, data import and export facilities from and into MS Excel, graphing, spreadsheet management and edit functions.
• Nutrition data is processed and analyzed using the Statistical Package for Social Sciences (SPSS), EPInfo/ENA and STATA software for meta-analysis.
• FSNAU developed the Integrated Phase Classification (IPC), a set of protocols for consolidating and summarizing situational analysis. The mapping tool provides a common classification system for food security that draws from the strengths of existing classification systems and integrates them with supporting tools for analysis and communication of food insecurity.
Validation of Analysis• Quality control of nutrition data is done using the automated plausibility checks function in ENA software. The
parameters tested include; missing/flagged data, age distribution, kurtosis, digit preference, skewness and overall sex ratio.
• Quality control of food security data is done through exploratory and trend analysis of the different variables including checks for completeness/missing data, market price consistency, seasonal and pattern trends, ground truthing and triangulation of data with staff and other partner agencies, and secondary data such as satelitte imagery, international market prices, FSNAU baseline data, etc.
• Before the launch of the biannual seasonal assessment results (Gu and Deyr), two separate day-long vetting meetings are held comprising of major technical organizations and agencies in Somalia’s Food Security and Nutrition clusters. The team critically reviews the analysis presented by FSNAU and challenges the overall analysis where necessary. This is an opportunity to share the detailed analysis, which is often not possible during shorter presentations or in the briefs.
Products and Dissemination • A broad range of FSNAU information products include, monthly, quarterly and biannual reports on food and
livelihood insecurity, markets, climate and nutrition, which are distributed both in print and digital formats including PowerPoint presentations and downloadable file available on the FSNAU site.
• Feedback meetings with key audiences enable us to evaluate the effectiveness of our information products. We constantly refine our information to make sure it is easily understandable to our different audiences.
• FSNAU has also developed a three year integrated communication strategy to ensure that its information products are made available in ways appropriate to different audiences including, donors, aid and development agencies, the media, Somalia authorities and the general public.
United Nations Somalia, Ngecha Road Campus Box 1230, Village Market, Nairobi, Kenya
Tel: +254-(0)20-4000000/500, Cell: +254-(0)722202146 / (0)733-616881Fax: +254-20-4000555Email: [email protected]
Website: www.fsnau.org