were they prepared for retirement? financial …bventi/papers/w17824.pdfwere they prepared for...
TRANSCRIPT
NBER WORKING PAPER SERIES
WERE THEY PREPARED FOR RETIREMENT? FINANCIAL STATUS AT ADVANCEDAGES IN THE HRS AND AHEAD COHORTS
James M. PoterbaSteven F. VentiDavid A. Wise
Working Paper 17824http://www.nber.org/papers/w17824
NATIONAL BUREAU OF ECONOMIC RESEARCH1050 Massachusetts Avenue
Cambridge, MA 02138February 2012
Poterba is a trustee of the College Retirement Equity Fund and the TIAA-CREF mutual funds, whichprovide retirement saving products. This research has been supported by the National Institute ofAging through grant P01 AG005842. The views expressed herein are those of the authors and do notnecessarily reflect the views of the National Bureau of Economic Research.
At least one co-author has disclosed a financial relationship of potential relevance for this research.Further information is available online at http://www.nber.org/papers/w17824.ack
NBER working papers are circulated for discussion and comment purposes. They have not been peer-reviewed or been subject to the review by the NBER Board of Directors that accompanies officialNBER publications.
© 2012 by James M. Poterba, Steven F. Venti, and David A. Wise. All rights reserved. Short sectionsof text, not to exceed two paragraphs, may be quoted without explicit permission provided that fullcredit, including © notice, is given to the source.

Were They Prepared for Retirement? Financial Status at Advanced Ages in the HRS and AHEADCohortsJames M. Poterba, Steven F. Venti, and David A. WiseNBER Working Paper No. 17824February 2012JEL No. D14,D91,J14
ABSTRACT
Many analysts have considered whether households approaching retirement age have accumulatedenough assets to be well prepared for retirement. In this paper, we shift from studying household financesat the start of the retirement period, an ex ante measure of retirement preparation, to studying the assetholdings of households in their last years of life. The analysis is based on Health and RetirementStudy with special attention to Asset and Health Dynamics Among the Oldest Old (AHEAD) cohortthat was first surveyed in 1993. We consider the level of assets that households hold in the last surveywave preceding their death. We study how assets at the end of life depend on three family status pathwaysprior to death— (1) original one-person households in 1993, (2) persons in two-person household in1993 with a deceased spouse in the last year observed, and (3) persons in two-person households in1993 with the spouse alive when last observed. We find that a substantial fraction of persons die withvirtually no financial assets—46.1 percent with less than $10,000—and many of these householdsalso have no housing wealth and rely almost entirely on Social Security benefits for support. In additionthis group is disproportionately in poor health. Based on a replacement rate comparison, many ofthese households may be deemed to have been well-prepared for retirement, in the sense that theirincome in their final years was not substantially lower than their income in their late 50s or early 60s.Yet with such low asset levels, they would have little capacity to pay for unanticipated needs suchas health expenses or other financial shocks or to pay for entertainment, travel, or other activities.This raises a question of whether the replacement ratio is a sufficient statistic for the “adequacy” ofretirement preparation.
James M. PoterbaDepartment of EconomicsMIT, E52-35050 Memorial DriveCambridge, MA 02142-1347and [email protected]
Steven F. VentiDepartment of Economics6106 Rockefeller CenterDartmouth CollegeHanover, NH 03755and [email protected]
David A. WiseHarvard Kennedy School79 John F. KennedyCambridge, MA 02138and [email protected]

2
Many analysts have considered whether households approaching
retirement age have accumulated enough assets to be well prepared for retirement. Various methods have been used to evaluate retirement preparedness, and the range of studies that apply these methods has yielded a diverse set of conclusions. Some studies are based on comparisons between observed saving or consumption and the predictions of the life-cycle model. Others measure the ability of households to replace pre-retirement levels of income or consumption, or compare post-retirement income to poverty thresholds. Many recent studies have been based on the Health and Retirement Study (HRS), with emphasis and the original HRS cohort that was between the ages of 51 and 61 in 1992. Other studies use the Survey of Consumer Finances or the SSA's Employee Beneficiary Survey. A partial list of recent studies of retirement preparedness would include Bernheim (1992), Mitchell and Moore (1998), Engen, Gale and Uccello (1999), Haveman, Holde, Wolfe and Romanov (2005), Scholz, Seshadri and Khitatrakun (2006), Munnell, Webb and Golub-Sass (2007), Love, Smith and McNair (2008), Hurd and Rohwedder (2009), VanDerhei and Copeland (2010).
In this paper, we shift from studying household finances at the start of the
retirement period, an ex ante measure of retirement preparation, to studying the asset holdings of households in their last years of life. We focus on non-annuitized assets and income. Virtually all households have a Social Security annuity, and many have a defined benefit pension annuity as well. We examine non-annuitized assets held at the end of life, in addition to income, because they can provide an ex post indicator of whether households were well-prepared for retirement. If there are substantial numbers of very old households with very low asset levels, relative to the number of households with low asset levels at the start of retirement, then many households exhausted their retirement resources. If most households still hold substantial assets at very advanced ages, or in the last few years before their death, the pattern is more difficult to interpret. It is difficult to determine whether such households had what they would have considered "sufficient" resources for retirement, and did not need to reduce their consumption outlays in late life, or if they conserved the (insufficient) resources they had throughout the retirement period.

3
We study the level of assets that households hold in the last survey wave preceding their death. In parts of the analysis we make use of all of the cohorts that are now part of the Health and Retirement Study. We give special attention, however, to the older Asset and Health Dynamics Among the Oldest Old (AHEAD) cohort. We calculate the level of wealth at death and offer several metrics for determining the proportion of households that may be thought of as having “insufficient assets” for their retirement. In addition to summarizing the level of assets, we also study how assets at the end of life depend on family status pathways to prior to death. We are particularly interested in the strong relationship between of health and assets near the end of life. We also give special attention to the relationship between assets and longevity after the 1993 first wave of the AHEAD cohort. We find a strong relationship between health status and wealth at death.
Our paper is divided into six sections. In the first, we show detailed
balance sheets in 2008 for households by five-year age intervals—65 to 69, 70 to 74, 75 to 79, 80 to 84, and 85 and older, respectively. These balance sheets are based on households in all HRS cohorts—HRS, AHEAD, Children of Depression (CODA), War Baby (WB) and Early Baby Boomer (EBB). We find that the change in assets with age, as well as the level of assets, differs greatly between single households and married couples.
We explore this pattern further by considering the evolution of assets of
the AHEAD as well as the HRS cohorts, distinguishing two-person households, one-person households, and households that transition from two- to one-person households. We emphasize the distinction between the evolution of assets between survey waves for persons who are alive in adjacent waves, and the evolution of assets with age that can be attributed to "mortality selection effects" and the progressive selection over time of households with greater financial assets and lower mortality risk. We are also careful to distinguish between death and attrition as separate reasons why persons do not remain in the sample through 2008. The selection effects we calculate are due to death and not due to sample attrition.
In the second section, we present greater detail on the evolution of wealth
for AHEAD households. We distinguish three family status pathways based on family status in 1993 (the first year observed) and family status when last observed—(1) original one-person households in 1993 who were also single at death, (2) original two-person households in 1993 in which one spouse is deceased in the last year observed, and (3) original two-person households in 1993 in which both spouses remain alive in the last year observed. A fourth group—those who were single in 1993 and who later remarried—is not analyzed because of its small sample size. Within each of these groups we show the evolution of wealth by the last year observed (LYO), which is the last wave prior to death for those who die or 2008, the most recent survey wave available, for those who are still alive in that year. We highlight the strong relationship

4
between wealth in 1993 and subsequent longevity. We consider several components of wealth—total wealth, financial assets including personal retirement accounts, housing wealth, and annuity wealth including both Social Security benefits and defined benefit pension benefits. We also report information on an indicator variable for whether the household owns a home.
In the third and fourth sections, we present results for the single-person
family pathway group. We focus attention on this group because it is the largest of the three pathway groups and because it is the group most likely to have low wealth prior to death. In section three, we present estimates of the relationship between wealth and age, and between wealth and health, with separate estimates of the health and age effects for each LYO. The health measure we use is similar to the index developed in Poterba, Venti, and Wise (2010a, 2010b). Using the regression estimates we predict assets by health and age interval and by LYO. In section four, we show the distribution of assets by asset category within each health quintile and age interval. We also suggest metrics to help to put the results in context.
In the fifth section, we present data for all family pathway groups
combined and we compare results across all three family pathways. The last section summarizes and concludes.
1. Balance Sheets and Evolution of Non-Annuity Wealth by Family Status Table 1-1 summarizes information in the HRS on household balance sheets for three age groups and for five aggregated asset categories—financial assets (balances in taxable financial assets as well as balances in IRA plans, Keogh plans, 401(k) and similar plans), equity in the primary home, other non-annuity assets (the net value of other real estate, equity in second homes and business assets less non-housing debt), the expected present discounted value of Social Security and defined benefit pension benefits, and net worth (total wealth). These balance sheets are based on households in all HRS cohorts—HRS, AHEAD, Children of Depression (CODA), War Baby (WB) and Early Baby Boomer (EBB). The data on 401(k) balances in these tables are incomplete because respondents in the two oldest cohorts, CODA and AHEAD, were not asked for their 401(k) balances. However, these cohorts were unlikely to have substantial accumulations because they left the labor force before or shortly after 401(k) accounts became available in 1982. Members of the CODA cohort were age 68 to 74 when first surveyed in 1998 and members of the AHEAD cohort were age 70 and older when first surveyed in 1993. Appendix Tables 1a through 1e show detailed balance sheets in 2008 for households by five-year age intervals—65 to 69, 70 to 74, 75 to 79, 80 to 84, and 85 and older respectively. Separate panels are shown for all households as well as for one-person and two-person households. Data are shown for both means and medians.

5
Asset Category% of House-holds with
Asset
Median Holding
Mean Holding
% of House-
holds with Asset
Median Holding
Mean Holding
Financial Assets 84.2 12,500 130,156 92.6 111,600 354,455Home Equity 65.9 52,000 107,483 91.1 150,000 232,300
Other Non-annuity Assets 18.8 0 96,357 38.8 0 171,441
PV of Social Security and DB Pension Benefits
90.5 268,766 315,165 92.3 571,575 617,767
Net worth 99.1 414,435 649,161 99.6 1,015,317 1,375,963
Financial Assets 86.4 13,000 128,522 93.9 112,500 331,901Home Equity 65.7 60,000 123,144 88.9 151,000 228,371
Other Non-annuity Assets 15.2 0 47,447 31.7 0 198,979
PV of Social Security and DB Pension Benefits
99.0 200,303 243,304 99.9 460,509 525,772
Net worth 99.4 336,058 542,416 100.0 858,331 1,285,024
Financial Assets 88.6 22,000 152,958 91.8 125,000 332,631Home Equity 54.1 35,000 101,728 84.8 125,000 210,917
Other Non-annuity Assets 13.3 0 45,294 28.2 0 155,145
PV of Social Security and DB Pension Benefits
99.0 82,855 108,582 99.7 224,317 284,348
Net worth 99.7 214,371 408,562 100.0 674,965 983,042
aged 65 to 69 in 2008
Single-Person Households
aged 75 to 79 in 2008
aged 85 or older in 2008
Two-Person Households
Table 1-1. Balance sheets for households in 2008, by age and marital status
Several features of the summary data in Table 1-1 warrant comment. First, whether measured by medians or means, the net worth of older households, even those aged 85 and older, seems rather large. The net worth of two-person households is more than twice as large as the net worth of one-person households. Median (mean) total net worth for households aged 65 to 69 is $414,435 ($649,161) for singles and $1,015,317 ($1,375,963) for couples in 2008. Net worth is lower at older ages, in large part because of the decline in expected present value of benefits from Social Security and defined benefit pensions. Wealth from these sources is lower for older households than for younger households because expected payments from these sources are weighted by survival probabilities. We do not focus on cross-age comparisons in the balance sheets. The pattern of levels across ages depends on at least two competing effects: assets are lower for older households because of "cohort effects" (older generations had

6
lower lifetime earnings, on average, than younger generations) and assets are higher for older households because of "mortality effects" (on average, within each cohort, poorer households die at younger ages). We give special attention to mortality effects in the subsequent analysis. The largest components of non-annuity net worth are housing wealth and financial assets (including personal retirement accounts). Of single person households, 66 percent of those aged 65-69 own homes and this rate remains about the same for nearly twenty years; for the group aged 85 and older, the rate drops to 54 percent. About 91 percent of married couples aged 65-69 own homes. Thereafter the rate drops gradually to about 89 percent for ages 75 to 79 and 85 percent for those aged 85 and older.
Asset Categorypercen-
tileage 65 to
69age 75 to
79age 85 or
olderage 65 to
69age 75 to
79age 85 or
older
Financial Assets 10 0 0 0 300 450 75025 300 500 1,300 13,500 11,000 27,00050 12,500 13,000 22,000 111,600 112,500 125,00075 110,721 110,000 133,500 442,000 355,715 402,00090 380,000 408,000 430,000 878,000 839,000 927,200
Home Equity 10 0 0 0 7,000 0 025 0 0 0 63,000 75,000 46,00050 52,000 60,000 35,000 150,000 151,000 125,00075 150,000 175,000 140,000 290,000 275,000 240,00090 300,000 345,000 300,000 450,000 475,000 438,000
Other Non-annuity 10 -7,000 -5,000 0 -7,000 -3,700 025 -1,000 0 0 -100 0 050 0 0 0 0 0 075 0 0 0 80,000 42,000 20,00090 80,000 60,000 80,000 450,000 400,000 500,000
10 37,796 97,040 38,288 128,811 257,448 118,70525 173,114 141,069 56,932 353,873 344,486 160,94050 268,766 200,303 82,855 571,575 460,509 224,31775 410,707 276,711 124,659 789,737 620,279 350,82590 610,166 410,850 196,096 1,155,331 840,320 478,903
Net worth 10 157,921 123,191 56,266 346,946 388,174 223,84725 237,154 193,157 93,411 609,949 566,980 350,80150 414,435 336,058 214,371 1,015,317 858,331 674,96575 778,662 662,494 470,768 1,660,631 1,443,753 1,177,96690 1,291,336 1,155,530 1,051,622 2,582,332 2,279,724 1,821,628
Table 1-2. Selected percentiles of the distribution for households in 2008, by age and marital status
Single-Person Households Two-Person Households
PV of Social Security and DB Pension Benefits
Table 1-2 shows selected percentiles of the distribution of assets. It demonstrates that a large proportion of households have very few, or no, liquid financial assets. This is especially true for single-person households. The 25th percentile of financial assets for singles is less than $1,300 for all age groups. Many single-person households also have no home equity. The 25th percentile is zero for all age groups. In addition, a large fraction of both single- and two-
7
person households have no other non-annuity assets. The 75th percentile is zero for single-households at all ages and the 50th percentile is zero for two-person households at all ages. Recall that the balance sheets pertain to the wealth of those who survive to each age. In contrast, Figures 1-1 and 1-2 show the evolution of assets by family status—two person households, one-person households, and households that transition from two- to one-person households during the interval between survey waves—for HRS and AHEAD households respectively. The figures exclude persons in households that transitioned from one-person to two-person because the sample sizes for this group were too small to give reliable results. Wealth includes all assets reported in Table 1-1 except Social Security wealth, defined benefit pension wealth, and 401(k) balances. For the HRS cohort, 401(k) balances are not included because of missing data in some of the early years, as discussed in Venti (2011). Balances in 401(k) accounts were not collected in the AHEAD.
Figure 1-1 shows the wave-to-wave change in median non-annuity wealth in the three family status groups for HRS households. All values are converted to 2008 dollars using the CPI. For example, the median wealth of persons who remained in two-person households between 1992 and 1994 (labeled as "2 to 2") increased from about $184,000 to $213,000. For those who remained in two-person households between 1994 and 1996, median wealth increased from about $223,000 to $231,000. In all intervals, wealth increased for persons in continuing two person households.
It is important to distinguish between the within-interval changes in wealth
shown by the line segments in the figure and the effect of differential mortality indicated by the vertical height of the "gaps" between segments. To illustrate this point, note that persons in two-person households present in both the 1996 and 1998 waves had $243,706 in wealth in 1998, but that persons in two-person households present in both the 1998 and 2000 waves had $254,419 in 1998. This difference is circled in the figure. The difference between $243,706 and $254,419 is the "selection" effect—two-person households that dissolved because of death of a spouse, divorce or separation between 1998 and 2000 had lower wealth in 1998 than those who continued as two-person households through the 1998 to 2000 period.
To understand the evolution of wealth with age, as distinct from the selection effect, it is important to focus on the wave-to-wave changes (segment slopes). For two-person households in the HRS who were between the ages of 51 and 61 in 1992, the wave-to-wave changes are positive in all intervals. The increase in wealth for persons in continuing two-person households can be seen by tracking the assets in the first year of each interval. Some component of this increase is due to the progressive selection of households with greater wealth. For one-person households wealth increased in all but two wave-to-wave

8
intervals. The mortality selection effects are not so apparent for single-person households, in part because a large fraction of one-person households had relatively low wealth, with median levels between $50,000 and $100,000 over the 1992 to 2008 period.
Figure 1-1 also shows that the non-annuity wealth of persons in two-
person households that dissolve between waves declines substantially. This is observed in each of the intervals. The assets of persons in two- to one-person households were also much lower at the beginning of an interval than the assets of persons in continuing two-person households. After dissolution, however, the wealth of the surviving single persons was still larger than the wealth of continuing one-person households.
Figure 1-2 shows the evolution of non-annuity wealth for persons in AHEAD households. The data for 1993 are omitted from the figure because, as Rohwedder, Haider, and Hurd (2006) explain, financial assets were under-reported in AHEAD in that year. For the AHEAD households, the mortality selection effects are extremely important (circles in the figure). Persons who continued in two-person households from one interval to the next typically held much greater wealth balances than those who did not. For AHEAD households, the within-interval change in wealth for persons in continuing two-person households was negative in all but the first interval, 1995 to 1998. The wealth of continuing one-person households declined in each period. For AHEAD households the decline in the wealth for persons in two-person households that dissolved during an interval is similar in magnitude to the decline for persons in continuing two-person households. For these households dissolution was primarily the consequence of mortality, whereas for HRS households dissolution was more often the consequence of divorce or separation. As with the HRS cohort, the level of wealth of persons in two-person households that dissolved during an interval was much lower than the level of wealth of persons in continuing two person households. Among persons in households that dissolved in an interval the wealth of the surviving spouse remained much higher than the wealth of continuing one-person households. In short, the figures show the within interval change in the wealth of households that survive over the interval, but they also make clear that some of the change from interval to interval is due to the progressive selection of households with greater wealth. This effect plays a key role in the subsequent analysis.

9
Figure 1‐1. Median non‐annuity wealth of persons in
the HRS, by family status
$0
$50,000
$100,000
$150,000
$200,000
$250,000
$300,000
$350,000
$400,000
1992
19921994
19941996
19961998
19982000
20002002
20022004
20042006
year
dollars
1 to 1 2 to 2 2 to 1
Figure 1‐2. Median non‐annuity wealth of persons in
the AHEAD, by family status
$0
$50,000
$100,000
$150,000
$200,000
$250,000
$300,000
$350,000
$400,000
$450,000
1995
1995
1998
1998
2000
2000
2002
2002
2004
2004
2006
year
dollars
1 to 1 2 to 2 2 to 1

10
2. The Evolution of Wealth for AHEAD Households The remainder of the paper focuses on AHEAD households. The goal is to describe the evolution of wealth by family pathway group and by asset category from 1993 to 2008 and to consider the wealth of persons in the last year observed (LYO). All persons last observed in years before 2008 are known to be deceased--persons who leave the sample but are not known to be deceased are excluded from the analysis. Persons whose last year observed is 2008 are not deceased. Most waves are spaced two years apart, with the exception of a three year gap between the 1995 and 1998 waves. Thus for persons who have an LYO before 2008, the last observation may be up to two years before the actual date of death (or three years if the LYO is 1995.) We begin by dividing the AHEAD respondents into three groups defined by family status when first observed in 1993 and family status in the LYO. These groups, which we call "family pathway groups," are: (1) original one-person households in 1993, (2) persons in two-person household in 1993 with a deceased spouse in the last year observed before death, and (3) persons in two-person households in 1993 with the spouse alive when last observed. For shorthand we sometimes refer to the groups as one-person, two-person to one-person, and two-person respectively. A fourth group of persons, in a one-person household in 1993 and in a two-person household when last observed, is excluded because this group is too small for meaningful analysis. Also, all persons who joined the AHEAD sample after 1993 are excluded. Some persons in one-person households in 1993 may have been in two-person households prior to 1993. Figure 2-1 is a graphical description of the total wealth (including the present values of Social Security and DB pension benefits) and the relative size of each of these groups in each LYO. For each family progression group, the location of each circle indicates the level of median wealth (shown on the vertical axis) and the associated LYO (shown on the horizontal axis). The size of each circle indicates the percent of the total sample in each LYO group accounted for by the particular sub-group. In each family progression group, the wealth and the percent of persons last observed in 2008 (not deceased) is represented by the dark blue circles. The other circles indicate wealth in the last wave prior to death. One-person households in 1993 died with the least wealth, between $142,000 and $188,000 at the median. Those in two-person households in 1993 with a spouse alive when they died had the greatest wealth in the wave prior to death, between $585,000 and $685,000. Those in two-person households in 1993 whose spouse was deceased when last observed had median wealth in the wave prior to death between $206,000 and $286,000.

11
Figure 2-1. Total wealth in year last observed by route to death and % of observations (circle size)
$0
$100,000
$200,000
$300,000
$400,000
$500,000
$600,000
$700,000
$800,000
$900,000
0 1 2 3 4 5 6 7 8 9 10 11 12 13 14 15 16 17 18 19 20 21 22 23 24 25 26 27 28
Family pathway group and year
We
alt
h
Route: one-person in 1993, last observed 1993 … 2008
Route: two-person in 1993, spouse deceased when last observed,1995…2008
Route: two-person in 1993, spouse alive when last observed, 1993…2008
93 95 98 00 02 04 96 08 Single in 1993
93 95 98 00 02 04 96 08 2-person
93 95 98 00 02 04 96 08 2-person to 1-person
A general feature of the data is the strong and consistent relationship between wealth in 1993 and survival, the year a person is last observed in the data. Among persons first observed in 1993, those who will die the earliest begin with the lowest assets in 1993. The relationship holds for all asset categories. Figure 2-2a shows the relationship for three of the four asset categories shown in Table 1-1—annuity wealth, home equity, and financial assets—for each of the family progression groups. The figure shows medians for each asset category in1993. The fourth category in Table 1-1, other non-annuity assets, is not shown because the median is zero in all years for all groups. Because medians are used in the figure, the stacked vertical height of the bars in the figure is not equal to median total wealth. Figure 2-2b shows means for all four categories. In the subsequent discussion we often show medians and not means.
For each of the groups, Social Security and defined benefit pension wealth is by far the largest wealth holding. The relationship between wealth when first observed and subsequent mortality is striking. For example, the rising profiles within each group shows that annuity wealth in 1993 is higher for persons who die prior to the 2000 wave (whose LYO is 1998) than for persons who die prior to 1998 wave (whose LYO is 1995). Similarly persons who die prior to the 2002 wave have higher annuity wealth in 1993 than persons who die prior to the 2000 wave, and so forth. Similar patterns are evident for the home equity and financial assets. The wealth-mortality gradient that has been widely observed by others is strongly evident in these data. Examples of previous studies that have found

12
strong positive correlation between wealth and longevity include Smith (1999, 2004, 2005), Adams et. al. (2003), Wu (2003), Michaud and van Soest (2008), Case and Deaton (2009), Attanasio (2003), and Hurd and McFadden (2001).
Figure 2-2a. Median annuity wealth, home equity, and financial assets in 1993 by family route and
last year observed
$0
$100,000
$200,000
$300,000
$400,000
$500,000
$600,000
$700,000
$800,000
1993
1995
1998
2000
2002
2004
2006
2008
1993
1995
1998
2000
2002
2004
2006
2008
1993
1995
1998
2000
2002
2004
2006
2008
Am
ou
nt
($s)
Annuity wealth Home Equity Financial Assets
One-person Two- to one-person Two-person
Figure 2-2b. Mean annuity wealth, home equity, financial assets, and other wealth in 1993 by family
route and last year observed
$0
$200,000
$400,000
$600,000
$800,000
$1,000,000
$1,200,000
1993
1995
1998
2000
2002
2004
2006
2008
1993
1995
1998
2000
2002
2004
2006
2008
1993
1995
1998
2000
2002
2004
2006
2008
Am
ou
nt
($s)
Annuity wealth Home Equity Financial Assets Other assets
One-person Two- to one-person Two-person

13
We do not address the direction of causality between health and wealth or between wealth and mortality although here and elsewhere in the paper we often implicitly assume that health is given and subsequent outcomes follow. This assumption is consistent with the findings of Smith (1999, 2004, 2005), Adams et al. (2003), Wu (2003), Michaud and van Soest (2008), and Case and Deaton (2009). The general consensus is that that causation from health to wealth is the dominant pathway at least in the U.S. but there is no universal agreement. The figure above shows that persons "closer" to death in 1993 have lower assets in 1993 than those who will live longer. We can see the same pattern over time by showing how assets evolve over time for groups of persons identified by the last year observed in the sample. Again, an LYO of 2006 or earlier indicates that the person died in the two-year interval following the LYO. An LYO of 2008 indicates that the person is still alive in 2008, the last year of our sample. The next series of figures show the evolution of assets for several wealth sub-categories—total wealth, financial assets (including IRA and Keogh accounts), home equity, Social Security wealth, and defined benefit pension wealth. We also show the percentage of households who own their homes and the evolution of total income. There is one figure for each wealth category, with data for each of three family pathway groups. For each figure the evolution of median wealth is shown by LYO. Figure 2-3 shows median total wealth for the three family pathway groups. Total wealth in 1993 is lowest for the first family pathway group (one-person households) and highest for the third pathway group (two-person households with a spouse alive when last observed). In each of the groups, total wealth in 1993 is very strongly related to the LYO. Those who live longer have higher wealth. In addition, total wealth typically declines as persons get "closer" to death for each of the groups, largely because of the mechanical decline in annuity wealth. But the decline is much slower for the for persons in two-person families who have a spouse alive when last observed, a group that also has much greater wealth in 1993. Figure 2-4 shows the evolution of financial assets (including IRA and Keogh accounts) for the three pathway groups. The vertical line between 1993 and 1995 is a reminder that some financial assets were under-reported in 1993, although we present the data because IRA and Keogh assets are not underreported. Again, the financial assets of the first group decline quite systematically after 1995 and the financial assets of the second group typically decline as well, at least after 1998. The decline is in part induced by the minimum distribution requirement for 401(k) and non-Roth IRA accounts. Nonetheless, there is much less decline in the financial assets of the third pathway group.

14
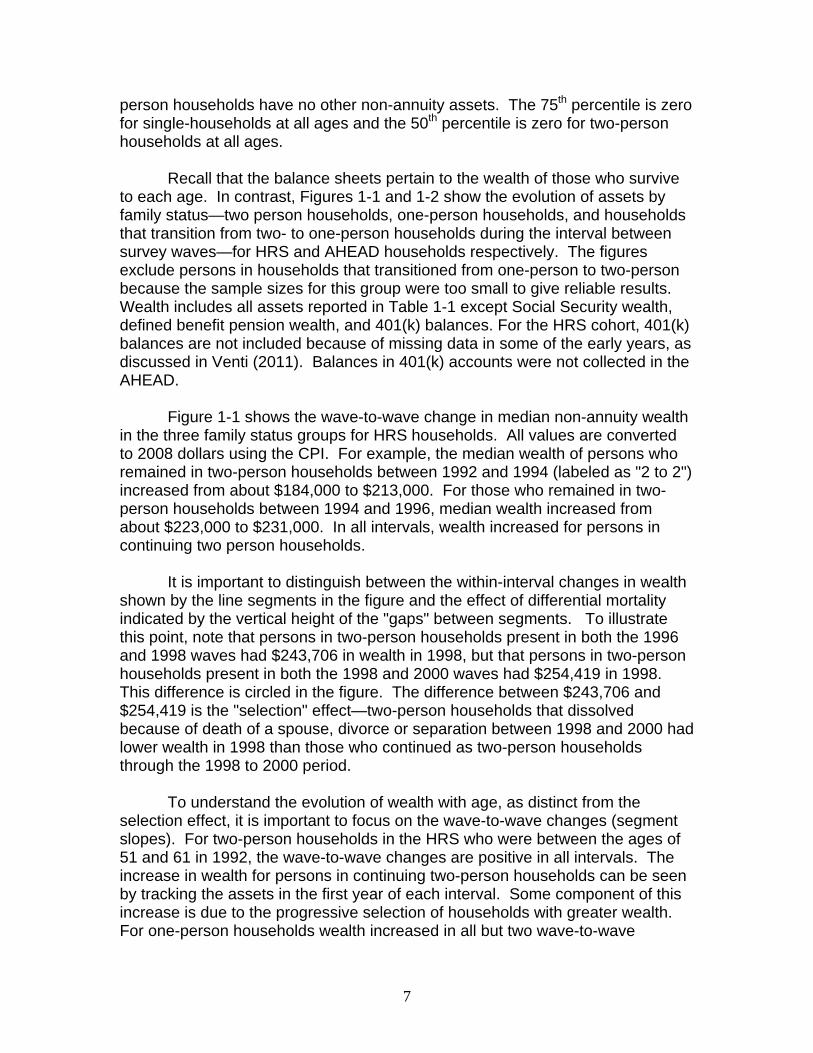
Figure 2-5 shows the evolution of home equity. For one-person households the data show a very sharp decline in median home equity beginning two or three years before death. Indeed for each LYO, median home equity in the wave prior to death was zero for all but those whose LYO was 1993. For original two-person households with the spouse deceased at the LYO, a sharp decline near the end of life is also apparent, although the median at death is zero only for those whose LYO was 2002 or 2004. For original two-person households with the spouse alive at the LYO, there is a decline in home equity in the year or two before death, but it is more modest than that for the previous two groups. Home equity declines relatively little in prior years for this group. The results are consistent with the findings of Venti and Wise (2002, 2004) who emphasize that home equity tends to be husbanded until a precipitating shock such as entry to a nursing home or death of a spouse. Figure 2-6 shows the evolution of home ownership rates. The decline in ownership seems more consistent over time than the decline in housing wealth for all family pathway groups. Housing wealth typically declined sharply near the end of life. The decline in ownership between 1993 and the year last observed was greatest for the one-person and the two- to one-person family groups. For the one-person group the decline ranged from -3.4 percent for persons whose LYO was1995 to -39.9 percent for persons whose LYO was 2006. For the two- to one-person group, the decline ranged from -0.1 percent for persons whose LYO was1995 to -31.6 percent for persons whose LYO was 2006. For the two-person group, however the decline was less than three percent through 2000 and then ranged from -6.9 percent for persons whose LYO was 2002 to -11.5 percent for persons whose LYO was 2006. The evolution of Social Security wealth is shown in Figure 2-7. The pattern of decline for each group is a mechanical feature of the way annuity wealth is calculated: benefits in each future year are weighted by the probability of survival. As an individual ages, the present value of remaining benefits declines because the probability of surviving for any number of years declines. Like each of the other wealth categories, the Social Security wealth data show that wealth in 1993 is very strongly related to year of death. The data also show that one-person households have substantially less Social Security wealth in 1993 than persons in the second pathway whose spouse had died before the YLO, who in turn have less wealth than the third pathway group, persons in two-person households whose spouse is alive when last observed. These data are consistent with the large literature cited earlier showing the strong relationship between measures of SES such as lifetime earnings (the primary determinant of Social Security benefits) and mortality.

15
Figure 2-3. Median total wealth by family progression group and last year observed
$0
$100,000
$200,000
$300,000
$400,000
$500,000
$600,000
$700,000
$800,000
$900,000
$1,000,000
1993
1995
1998
2000
2002
2004
2006
2008
1993
1995
1998
2000
2002
2004
2006
2008
1993
1995
1998
2000
2002
2004
2006
2008
LYO and Family Group
Do
llar
s
Two- to One-Person Two PersonSingle
Figure 2-4. Median financial wealth by family progression group and last year observed
$0
$20,000
$40,000
$60,000
$80,000
$100,000
$120,000
$140,000
$160,000
$180,000
$200,000
1993
1995
1998
2000
2002
2004
2006
2008
1993
1995
1998
2000
2002
2004
2006
2008
1993
1995
1998
2000
2002
2004
2006
2008
Last Year Observed and Family Group
Do
llars
Two- to One-Person Two PersonSingle person

16
Figure 2-5. Median housing wealth by family progression group last year observed
$0
$20,000
$40,000
$60,000
$80,000
$100,000
$120,000
$140,000
$160,000
1993
1995
1998
2000
2002
2004
2006
2008
1993
1995
1998
2000
2002
2004
2006
2008
1993
1995
1998
2000
2002
2004
2006
2008
LYO and Family Group
Do
llar
s
Two- to One-Person Two PersonSingle
Figure 2-6. Home ownership rate by family progression group last year observed
$0
$100,000
$200,000
$300,000
$400,000
$500,000
$600,000
$700,000
$800,000
$900,000
$1,000,000
1993
1995
1998
2000
2002
2004
2006
2008
1993
1995
1998
2000
2002
2004
2006
2008
1993
1995
1998
2000
2002
2004
2006
2008
LYO and Family Group
Do
llar
s
Two- to One-Person Two PersonSingle
17
Figure 2-7. Median Social Security wealth by family progression group last year observed
$0
$50,000
$100,000
$150,000
$200,000
$250,000
$300,000
$350,000
$400,000
$450,000
1993
1995
1998
2000
2002
2004
2006
2008
1993
1995
1998
2000
2002
2004
2006
2008
1993
1995
1998
2000
2002
2004
2006
2008
LYO and Family Group
Do
llar
s
Two- to One-Person Two PersonSingle
Figure 2-8. Median DB wealth by family progression group last year observed
$0
$20,000
$40,000
$60,000
$80,000
$100,000
$120,000
$140,000
1993
1995
1998
2000
2002
2004
2006
2008
1993
1995
1998
2000
2002
2004
2006
2008
1993
1995
1998
2000
2002
2004
2006
2008
LYO and Family Group
Do
llar
s
Two- to One-Person Two PersonSingle

18
Figure 2-9. Median total income by family pathway group and last year observed
$0
$10,000
$20,000
$30,000
$40,000
$50,000
$60,000
1993
1995
1998
2000
2002
2004
2006
2008
1993
1995
1998
2000
2002
2004
2006
2008
1993
1995
1998
2000
2002
2004
2006
2008
Last Year Observed and Family Group
Do
llars
Two- to One-Person Two PersonSingle person
Figure 2-8 shows the evolution of defined benefit pension wealth. Single persons in the first pathway group essentially have no DB pension wealth. The median is zero for all one-person households except for those who survive to 2008. But persons who were in two-person households in 1993 with the spouse deceased by the LYO do have substantial median DB wealth in 1993 and persons in two-person households in 1993 with the spouse alive in the LYO had even more DB wealth. Most of the persons in the second group had zero or close to zero DB wealth at death, but persons in the third group still had noticeable DB wealth at death. Part of the explanation for the very low level of DB wealth among persons in the two-person to one-person group apparently lies with the waiver of survivorship benefits. ERISA (1974) requires employers to offer joint and survivor annuities as the default option and the Retirement Equity Act (1984) requires written consent to waive survivor benefits. Nonetheless, Johnson, Uccello, and Goldwyn (2005) report that in 2000, 28 percent of men and 69 percent of women covered by DB plans had waived survivor benefits. Even if survivor benefits are not waived, the surviving spouse's benefit is often less than 100 percent of the deceased's benefit. The implications of the husband's death for the finances of widows is discussed further in Hurd and Wise (1989), Weir and Willis (2000), and Sevak, Weir, and Willis (2003) Finally, Figure 2-9 shows the evolution of total household income for persons in each of the three pathway groups. We will discuss the level and path of total income in more detail in the next section, but we include the pathway figure here because it is in the same format as the figures for asset categories.
19
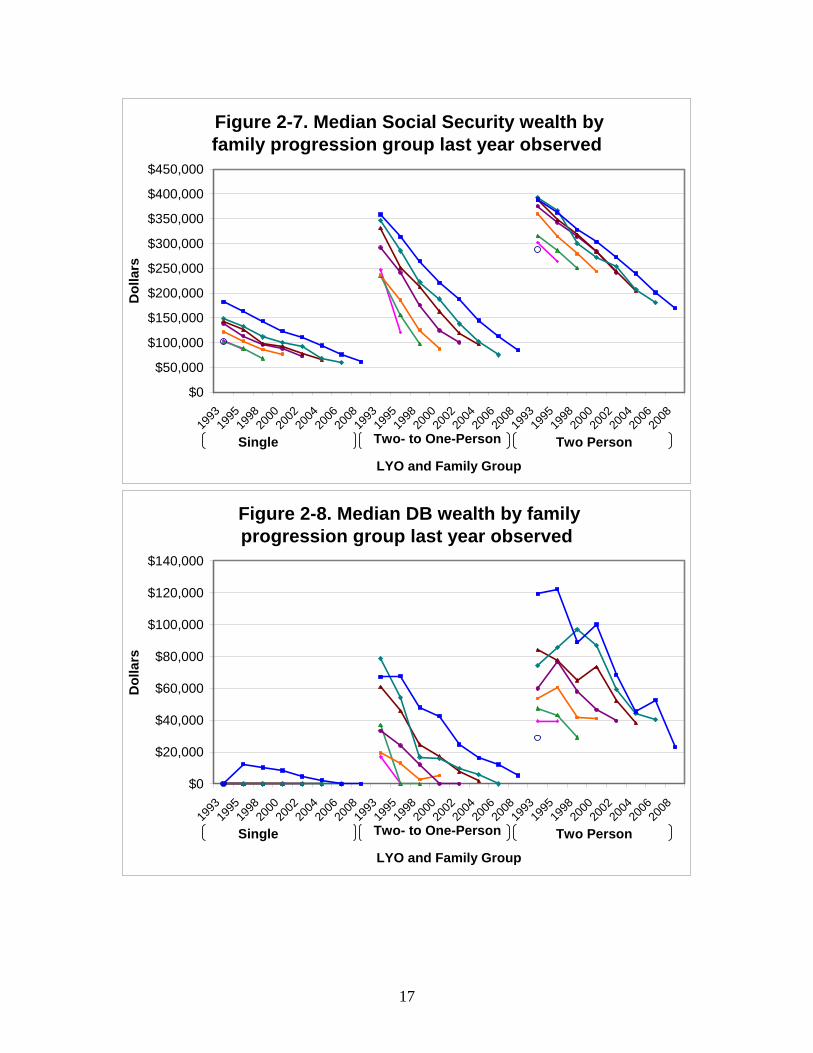
The figure shows little decline for the one-person group, a modest decline for the two-person group, and a substantial decline for the two to one-person group. The percent decline between 1993 and the year last observed is shown in Table 2-1. As might be expected, the decline is especially large for persons in the two- to one-person family pathway group. For persons last observed in 2008 the decline is -48.5 percent.
1995 1998 2000 2002 2004 2006 2008
One-person 4.4% 5.7% 0.5% -2.3% -10.8% -14.5% -17.6%Two- to one-person
0.4% -8.9% -17.1% -27.4% -36.9% -42.4% -48.5%
Two-person 0.6% 5.0% -7.2% -5.3% -14.0% -19.1% -19.2%
Table 2-1. Percent change in total income from 1993 to year last observed by family pathway group and by YLO.
Family pathway group
Year last observed
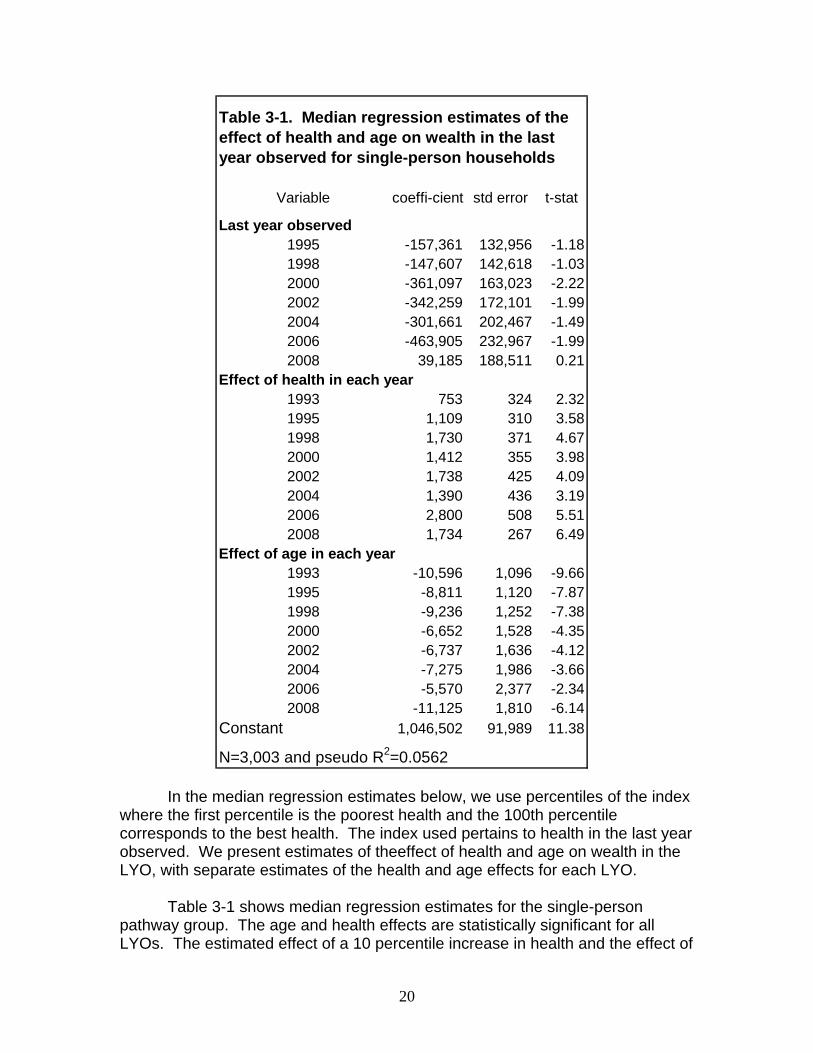
3. The Effect of Health and Age: The Single-Person Pathway In the previous section we emphasized the strong relationship between wealth in 1993 and the time until death. In this section we emphasize the relationship between wealth and health, given the year last observed, and we draw attention to the strong relationship between health and wealth just prior to death. We begin by using a simple median regression framework to describe how the level of assets in the last year observed depends on age and health. For each person we construct an index of health based on the first principal component of responses to 27 health-related questions contained in AHEAD. These questions asked about functional limitations, the presence of health conditions and other indicators of overall health. The list of questions used to construct the index and a discussion of the properties of the index are reported in Poterba, Venti and Wise (2010b). There are two differences between our approach in the current paper and that in our past work. First, the earlier paper constructed an index for each wave using information from the contemporaneous and all preceding waves. The index used here only uses contemporaneous wave information. Many of the questions are of the form "have you ever experienced" a health condition, so there is little extra information obtained by using prior wave information. Second, the principal component estimates varied little from wave to wave, so in the present analysis we have pooled the waves.
20
Variable coeffi-cient std error t-stat
Last year observed1995 -157,361 132,956 -1.181998 -147,607 142,618 -1.032000 -361,097 163,023 -2.222002 -342,259 172,101 -1.992004 -301,661 202,467 -1.492006 -463,905 232,967 -1.992008 39,185 188,511 0.21
Effect of health in each year1993 753 324 2.321995 1,109 310 3.581998 1,730 371 4.672000 1,412 355 3.982002 1,738 425 4.092004 1,390 436 3.192006 2,800 508 5.512008 1,734 267 6.49
Effect of age in each year1993 -10,596 1,096 -9.661995 -8,811 1,120 -7.871998 -9,236 1,252 -7.382000 -6,652 1,528 -4.352002 -6,737 1,636 -4.122004 -7,275 1,986 -3.662006 -5,570 2,377 -2.342008 -11,125 1,810 -6.14
Constant 1,046,502 91,989 11.38
N=3,003 and pseudo R2=0.0562
Table 3-1. Median regression estimates of the effect of health and age on wealth in the last year observed for single-person households
In the median regression estimates below, we use percentiles of the index where the first percentile is the poorest health and the 100th percentile corresponds to the best health. The index used pertains to health in the last year observed. We present estimates of theeffect of health and age on wealth in the LYO, with separate estimates of the health and age effects for each LYO.
Table 3-1 shows median regression estimates for the single-person pathway group. The age and health effects are statistically significant for all LYOs. The estimated effect of a 10 percentile increase in health and the effect of

21
an additional year of age are graphed in Figure 3-1. The effect of health on wealth in the last year observed is substantial. The estimated effect of an increase of 10 percentile points in health ranges from $7,530 in 1993 to $28,004 in 2006. Thus persons who have better health when last observed prior to death have much more wealth. Recall that these estimated effects are conditional on YLO, which is also related to health. For persons last observed in 2008, the estimated health effect is $17,340. The effect of an additional year of age on wealth ranges from -$10,596 in 1993 to -$5,570 in 2006. The age effect is -$11,125 for those who are last observed in 2008. Those who are last observed in 2008 have substantially more wealth than those who die before 2008.
-15,000
-10,000
-5,000
0
5,000
10,000
15,000
20,000
25,000
30,000
1993 1995 1998 2000 2002 2004 2006 2008Est
imat
ed e
ffec
t (in
do
llar
s)
Last year observed
Figure 3-1. Estimated effect of health and age on total wealth for original single-person households,
by last year observed
Health (10 pctl point increase) Age (one year increase)
To get an idea of how much wealth in the LYO varies by health and age, we use the estimated effects from the median regression to predict total wealth for selected health percentiles and for selected ages. Table 3-2 shows predicted total wealth for every other LYO between 1993 and 2006. The estimates show the very large effects of health, as well as age, on wealth in the LYO. The pattern is quite similar in each of the LYO panels. These results suggest that persons who die at older ages and in poorer health are likely to die with less wealth than persons who die young and in good health. We are particularly interested in the proportion of people that die with little wealth. Without trying to define what “little” is, we begin by calculating selected percentiles of total wealth and selected categories of wealth in the last year observed by health quintile and by age interval. Unlike the previous table,

22
these percentiles are based on actual data rather than predictions from the median regression.
70 75 80 85 90
10 312,294 259,313 206,331 153,349 100,36830 327,362 274,380 221,399 168,417 115,43650 342,429 289,448 236,466 183,485 130,50370 357,497 304,515 251,534 198,552 145,57190 372,565 319,583 266,602 213,620 160,638
10 269,706 223,528 177,350 131,172 84,99430 304,316 258,138 211,960 165,781 119,60350 338,926 292,747 246,569 200,391 154,21370 373,535 327,357 281,179 235,001 188,82390 408,145 361,967 315,789 269,611 223,433
10 250,069 216,387 182,704 149,021 115,33930 284,837 251,154 217,472 183,789 150,10650 319,605 285,922 252,239 218,557 184,87470 354,372 320,690 287,007 253,324 219,64290 389,140 355,457 321,775 288,092 254,409
10 220,711 192,861 165,012 137,163 109,31430 276,718 248,868 221,019 193,170 165,32150 332,725 304,876 277,026 249,177 221,32870 388,732 360,883 333,033 305,184 277,33590 444,739 416,890 389,041 361,191 333,342
last year observed: 1993
last year observed: 1998
last year observed: 2002
last year observed: 2006
Table 3-2. Predicted wealth by last year observed, health, and age for original single person households.
Health percentile
Age
Table 3-3 shows the percentiles combining all LYOs between 1993 and 2006 (the LYOs associated with death) for original single-person households. One cell in the lower left is blank because it contains fewer than 10 observations. The small cell size reflects the fact that the young and healthy are least likely to die. The shaded cells help to identify cell entries with less that $100,000 of wealth. There are 24 such cells. All are for persons older than age 80 and 21 of the 24 are for person 85 and older. Seventeen of the 24 are for persons in the bottom 3 health quintiles and 12 of 24 are for persons in the bottom two quintiles. Only 7 are for persons in the top 2 health quintiles. Thus dying with "little" wealth is clearly concentrated among older persons who are also less healthy.

23
70-74 75-79 80-84 85-89 90+ All10 146,504 113,251 76,147 45,965 30,435 41,24525 226,187 140,603 105,001 64,086 43,329 68,885
1st 50 289,289 190,574 169,315 111,297 74,131 141,76775 400,516 325,225 263,544 225,118 215,388 271,17890 611,455 634,392 412,432 468,717 491,710 489,875
10 151,751 122,305 83,788 50,762 22,337 42,68225 198,163 178,408 126,530 84,101 41,995 84,109
2nd 50 259,629 268,122 194,964 148,420 97,552 169,30875 430,948 422,380 295,601 282,716 205,091 295,60190 529,604 957,304 441,308 467,657 400,654 484,527
10 151,813 170,324 83,137 53,708 33,517 59,24025 173,241 205,106 115,090 80,575 66,561 103,906
3rd 50 265,021 298,352 232,848 135,976 130,760 194,57875 376,713 499,910 512,820 284,931 364,276 394,14290 441,416 897,024 847,482 545,362 770,434 763,727
10 151,281 104,359 82,397 73,714 33,549 62,76525 310,036 177,720 121,934 89,622 56,037 113,915
4th 50 393,199 308,350 238,307 196,087 117,708 211,84775 501,495 461,537 425,897 334,731 241,294 398,83490 659,133 690,508 560,694 615,394 718,681 618,513
10 113,930 181,567 51,116 30,700 86,42725 137,305 228,253 101,239 82,943 137,305
5th 50 419,738 331,494 154,716 178,331 297,72975 589,394 643,717 297,729 307,344 592,38190 1,728,930 1,035,252 876,750 580,655 1,122,089
10 151,281 116,460 80,674 50,234 28,603 44,50925 198,785 159,336 117,758 75,127 44,509 81,537
All 50 293,117 250,722 189,450 133,062 90,477 166,90475 442,282 428,277 320,667 264,543 230,651 311,08190 610,956 735,176 532,784 508,185 520,890 580,655
Table 3-3. Selected percentiles of the distribution of total wealth by age interval and health quintile for original single-person households, based on actual data.
Health quintile
Percen-tile
Age Interval
Table 3-4, shows the distribution of annuity wealth in the last year observed before death by health quintile and age interval. Levels less than $50,000 are highlighted. The decline in annuity wealth by age in largely mechanical and is reflected in the concentration of low annuity wealth among persons who are aged 90 or older. But the differences across health quintiles indicate the large differences in percentiles by health status. For example, over all age intervals, the 25th percentile ranges from $49,795 for persons in the lowest health quintile to $119,704 for persons in the top quintile.

24
70-74 75-79 80-84 85-89 90+ All10 146,504 84,462 67,373 39,226 19,763 32,93925 182,397 119,670 87,452 53,120 33,127 49,795
1st 50 216,478 156,883 122,644 75,127 46,334 84,02475 282,159 200,956 172,217 104,866 65,745 140,07490 377,282 261,551 222,440 157,881 95,294 210,203
10 148,035 119,461 68,332 39,576 16,836 32,19425 162,059 133,168 95,812 55,257 31,063 49,626
2nd 50 220,464 204,342 139,005 87,861 43,734 90,54275 287,001 303,756 181,787 115,311 63,601 152,83290 447,557 390,558 243,032 165,576 86,446 232,899
10 119,705 126,846 53,078 48,710 25,754 35,45025 148,999 160,141 81,537 64,803 35,450 62,783
3rd 50 173,241 202,302 120,631 87,226 51,376 103,90675 287,228 267,148 183,379 112,799 90,138 175,24990 338,406 374,556 255,310 175,742 150,621 261,526
10 149,020 78,089 54,787 47,065 26,932 42,61525 198,785 137,287 102,542 59,469 38,403 62,909
4th 50 264,892 193,126 126,194 83,256 53,681 108,87975 388,554 224,004 189,339 113,048 74,544 177,66090 422,514 262,745 297,670 149,315 131,100 262,745
10 94,456 64,562 35,307 25,417 37,5435th 25 115,549 104,903 58,256 30,690 86,713
50 182,547 129,124 89,660 52,569 119,70475 223,477 192,981 128,086 93,537 197,20690 416,116 363,229 192,280 139,621 307,168
10 137,815 100,415 64,540 39,576 20,482 33,40725 171,467 132,378 90,512 55,968 33,348 53,120
All 50 219,310 176,458 126,979 81,725 46,697 92,26275 284,306 231,936 178,023 110,868 67,334 154,08290 408,161 345,033 243,032 164,827 101,357 228,345
Health quintile
Percen-tile
Table 3-4. Selected percentiles of the distribution of annuity wealth by age interval and health quintile for original single-person households, based on actual data.
Age interval
Table 3-5 shows the distribution of non-annuity wealth by health quintile and by age interval. A large fraction of single-person households have essentially no non-annuity wealth, particularly those in the bottom two health quintiles. In these health groups, the 25th percentile is zero or close to zero for all age intervals. Even for the higher health quintiles the 10th percentile is zero averaged over all age intervals.

25
70-74 75-79 80-84 85-89 90+ All10 0 0 0 0 0 025 51 0 184 73 115 56
1st 50 45,844 11,021 20,259 16,692 16,165 16,69275 136,583 126,857 101,098 122,901 148,621 126,57990 337,745 401,714 206,677 322,781 394,736 310,659
10 0 0 0 0 0 025 1,391 1,669 605 3,464 0 848
2nd 50 38,180 58,738 42,985 47,293 24,338 44,51175 125,188 199,710 138,035 164,180 160,536 155,74390 161,530 340,609 243,986 329,213 338,341 326,323
10 0 0 0 0 0 025 4,405 8,811 5,564 670 6,695 3,027
3rd 50 43,259 110,155 88,401 37,986 53,690 70,27275 161,530 186,494 316,551 166,327 276,853 211,56990 232,292 572,698 685,591 417,742 584,826 584,826
10 1,028 727 1,717 506 190 50625 2,261 33,506 23,495 10,279 4,405 10,279
4th 50 88,034 113,819 63,310 96,362 70,969 87,63175 170,728 225,384 214,759 290,754 151,311 225,38490 273,867 528,644 344,849 561,945 682,263 487,412
10 27,819 734 18,163 0 0 73425 120,514 22,792 63,504 18,242 57,579 27,819
5th 50 199,465 177,683 174,076 81,037 151,312 145,61375 393,645 308,796 506,481 192,525 235,284 365,62090 4,384,988 1,523,115 671,987 365,620 441,034 696,237
All 10 0 0 0 0 0 025 1,391 556 693 974 462 64450 58,052 58,560 44,188 37,558 26,163 39,64875 160,657 186,494 142,440 154,188 155,789 158,00790 325,488 468,666 354,847 365,620 404,116 382,018
Table 3-5. Selected percentiles of the distribution of non-annuity wealth by age interval and health quintile for original single-person households, based on actual data.health quin-tile
per-cen-tile
Age Interval
Perhaps a better way to judge whether persons have "low" resources at death is to look at resources immediately available for day-to-day expenses. Table 3-6 shows the distribution of total income in the last year observed before death by health quintile and age interval.

26
70-74 75-79 80-84 85-89 90+ All10 8,847 7,730 7,597 6,992 7,177 7,34225 11,684 9,648 9,251 9,214 9,422 9,480
1st 50 16,353 12,791 14,071 13,219 13,040 13,34175 23,648 19,197 20,441 19,505 19,973 19,93590 31,225 36,968 29,344 33,890 33,487 32,541
10 8,179 9,715 7,979 7,177 6,534 7,59725 10,978 11,965 11,084 9,876 9,498 10,332
2nd 50 18,862 18,077 15,877 15,452 13,440 15,01275 28,758 30,250 21,808 24,665 20,390 23,93190 83,614 51,954 34,577 39,745 36,232 38,631
10 8,482 10,978 6,510 8,000 8,421 8,17925 9,075 13,810 9,898 10,555 10,662 10,662
3rd 50 13,353 21,525 15,802 14,253 14,264 15,80275 21,699 29,463 28,376 23,009 24,264 26,65190 26,705 49,487 47,586 37,734 44,434 42,780
10 10,749 7,628 8,838 8,112 7,785 8,12425 17,621 10,610 12,353 10,623 10,680 10,783
4th 50 22,432 16,904 17,809 14,840 15,814 16,88775 27,272 33,481 29,057 22,623 27,672 26,00990 33,994 72,054 35,681 40,342 54,600 47,314
10 8,936 8,346 11,087 6,911 8,718 8,71825 13,320 12,335 13,798 10,015 11,102 12,335
5th 50 20,586 21,146 22,342 18,483 19,472 20,58675 47,216 43,383 30,410 30,518 28,329 33,28390 341,744 79,189 46,596 33,383 47,215 61,494
All 10 8,413 8,282 7,774 7,177 7,265 7,63425 11,219 10,916 10,516 9,560 9,641 10,05950 16,952 15,935 15,423 14,097 13,440 14,34475 26,009 27,255 23,123 21,849 21,018 22,80690 32,692 51,625 34,194 36,390 36,513 37,209
Table 3-6. Selected percentiles of the distribution of total income by age interval and health quintile for original single-person households, based on actual data.health quin-tile
per-cen-tile
Age Interval
Total income includes benefits from Social Security and defined benefit pension plans, government transfer income, and dividends, interest payments, rent received and other income from assets. Again, the relationship between health and income is quite pronounced. Even controlling for age and heath, total income varies considerably within each cell. The 90th percentile is typically at

27
least four times as large as the 10th percentile. Of particular interest is the association between health and total income summarized in the last column. The 10th percentile of total income is surprisingly similar across all levels of health—between $7,342 for persons in the lowest health quintile and $8,718 for persons in the top health quintile. However, health has a more depressive effect at higher percentiles. The 90th percentile of total income for persons in the poorest health quintile is only $32,541, but the 90th percentile for persons in the top health quintile is $61,494. We next consider summary measures of financial resources that focus on the joint distribution of annuity income and liquid financial assets. The top panel of Table 3-7 shows the selected points on the bivariate cumulative distribution of annuity income and liquid financial assets (including IRA accounts) in the LYO (again combining all LYO between 1993 and 2006). For convenience, the diagonals are shown in bold. The upper-left entry in the table shows, for example, that 12.1 of single-person households have less than $10,000 in annuity income and no financial assets in the last year observed. The entry below it shows that 23.9 percent of households have less than $10,000 in annuity income and less than $10,000 in financial assets. More than half of all households (57 percent) have less than $10,000 in financial assets in the last year we observe them. As a point of reference, the 2008 poverty threshold for single persons aged 65 and older is about $10,000. The table also shows that 52.0 percent of single-person households have annuity income less than $20,000 (about twice the poverty level) and financial assets less than $10,000. Although not shown in the table the percent of single-person households with annuity income less that $15,000 (about one and one-half time the poverty level) and financial assets less than $5,000 is 39.6 percent. Over all financial asset levels, 31.9 percent had annuity income less than $10,000 and 82 percent of households had less than $20,000 of annuity income. Of this latter group, 23 percent also has no financial assets. Home equity is an illiquid asset that households tend to hold through late life. Venti and Wise (2004) and several other studies find that households typically sell their homes only when confronted with a precipitating shock to family structure, like death of a spouse or entry into a nursing home. By the time single-person AHEAD households approach the last year observed, many have divested their housing wealth, as shown in earlier in Figure 2-5.

28
Annuity Income ($000s)
< $10 < $20 < $30 < $40 All
Zero 12.1 23.0 24.2 24.7 24.9
<$10 23.9 52.0 55.7 56.4 57.0
<$25 26.3 58.8 64.5 65.7 66.5
<$50 27.9 65.5 72.8 74.4 75.4
All 31.9 82.0 94.1 97.7 100.0
$0- $10 $10- $20$20- $30
$30- $40
All
Zero 76.3 69.8 74.8 63.6 73.1
$0-$10 62.9 63.3 57.8 53.8 61.2
$10-$25 49.8 46.8 52.2 53.5 50.0
$25-$50 48.6 47.2 48.3 47.0 47.7
All 63.7 57.7 53.9 47.6 57.1
$0- $10 $10- $20$20- $30
$30- $40
All
Zero 24.1 24.8 22.4 28.3 24.5
$0-$10 23.4 28.2 24.3 26.2 25.6
$10-$25 28.5 33.3 38.3 35.6 33.5
$25-$50 26.6 25.3 26.8 43.3 30.2
All 25.1 28.4 29.5 33.4 28.5
Table 3-7. Selected characteristics of single-person households, by annuity income and financial assets in the last year observed before death
Financial Assets ($000s)
Percentage distribution
Financial Asset
Interval ($000s)
Annuity Income Interval ($000s)Mean health percentile
Percent of households with zero home equity
Financial Asset
Interval ($000s)
Annuity Income Interval ($000s)
The middle panel of Table 3-7 shows the proportion of single-person households with zero housing wealth (including persons with negative home equity) by annuity income and financial asset intervals that are comparable to the cumulative levels in the first panel. For example, of persons with annuity income less than $10,000 and no financial assets, 76.3 percent have no housing wealth. Of persons with $30,000 to $40,000 in annuity income and $25,000 to $50,000 in

29
financial assets, 47.0 percent have no housing equity. Overall, 57.1 percent of persons in the single-household family pathway have no housing equity in the last year observed before death. The bottom panel of Table 3-7 shows the mean health percentile of persons in each of the annuity income/financial asset intervals. For example, the mean health percentile of persons with annuity income less than $10,000 and no financial assets is 24.1. For those with annuity income between $30,000 and $40.000 and financial assets between $25,000 and $50,000 the median health percentile is 43.3. Thus again the strong relationship between health and wealth is evident. In short, we find that a large fraction of original single-person households has no housing wealth and very limited financial assets in the last year observed before death. This suggests that the sole source of wealth for many persons is the value of annuity benefits. Most persons receive Social Security benefits (either directly or as a survivor) and about half receive income from a DB pension (again either directly or as a survivor). 4. Compared to What? It is not clear how we should judge what constitutes a “low” or “sufficient” level of either assets or income. In Table 3-6 we highlighted the distribution of total income by health quintile and age, showing the level of income for persons at the 10th, 25th, 50th, 75th and 90th percentiles with wealth below given levels. At all ages and for all levels of health, total income at the 10th percentile was between $7,000 and $10,000. In Table 3-7 we showed the percentage of single-person households with annuity income below levels that were chosen to approximate multiples of the poverty threshold in 2008 (about $10,000). We will now provide some rough benchmarks to give context to these income levels just before death. First, we compare total income in the year last observed with total income in 1993 when these persons were first observed in AHEAD. The top panel of Table 4-1 shows median total income by age interval and health quintile in the last year observed before death (which can be any year from 1993 to 2006). These are the same data that were shown as the 50th percentile in Table 3-6. The lower panel shows the total income of these same households in 1993, the first year they were observed in AHEAD. All dollar amounts have been converted to 2008 dollars. On balance, income was slightly lower in the last year before death. It was one percent higher for the 1st health quintile, and then -6 percent for the 2nd quintile, -2 percent for the 3rd, -7 percent for the 4th and -3 percent for the 5th health quintile. The similarity of incomes in 1993 and the last year observed should not be surprising because a large fraction of income is indexed Social Security benefits. These sample members were single in 1993 and single at the time of death and thus did not transition to survivorship benefits. On the other hand, some income is DB pension benefits which are not fully indexed. These data do not suggest that household income

30
declined in the years just before death. Household assets, in contrast, do show a decline.
70-74 75-79 80-84 85-89 90+ all
1 16,353 12,791 14,071 13,219 13,040 13,3412 18,862 18,077 15,877 15,452 13,440 15,0123 13,353 21,525 15,802 14,253 14,264 15,8024 22,432 16,904 17,809 14,840 15,814 16,8875 20,586 21,146 22,342 18,483 19,472 20,586
all 16,952 15,935 15,423 14,097 13,440 14,344
1 16,917 12,406 14,221 13,269 12,864 13,2692 18,890 21,868 17,586 15,119 14,993 15,9473 15,031 21,513 18,027 13,690 14,285 16,1534 22,432 20,532 17,445 16,887 17,375 18,1325 28,159 28,488 25,296 16,564 19,472 21,146
all 17,621 17,340 16,317 14,097 13,906 14,943
Total income in 1993
Table 4-1. Comparison of total income in last year observed to total income in 1993, original one-person households
health quintile
Age Interval
Total income in last year observed
Although it is informative to consider the change in income over the (at most) 13 years of AHEAD (from 1993 to 2006 for persons who died before 2008), we would like to compare resources just before death to resources at a younger age, say prior to “retirement age.” Such a comparison is not easy to make. Nonetheless, we begin by comparing total income of single-persons in the last year observed before death to median earnings of these same persons when they were between ages 57 and 62, based on Social Security earnings records. We first index earnings to 2008 using the SSA Average Index of Monthly Earnings (AIME). We then calculate the median of earnings for ages 57 to 62 excluding years in which earnings were not positive. Approximately half of the original single-person households have matched SSA earnings records. The SSA only records earnings up to the SSA earnings limit which ranged from $57,600 in 1993 to $94,200 in 2006. Thus our estimate of pre-retirement earnings may be low for some higher earning workers. More importantly, the Social Security earnings of these original single persons in 1993 may be a very inexact indicator of household resources at the younger age. Many persons may have been married at ages 57 to 62, but were single when first interviewed in 1993. Single women who were previously married may have substantially greater Social Security benefits at older ages than women who never married.

31
70-74 75-79 80-84 85-89 90+ All
1 21,468 31,017 29,594 27,711 28,828 28,8282 32,321 33,539 37,551 31,978 29,465 32,1723 31,957 42,526 31,318 28,073 28,896 31,3184 31,029 41,584 26,969 45,607 27,318 34,2025 51,203 35,990 24,493 38,227 47,373 35,990
All 31,957 35,029 29,981 30,602 29,078 30,651
1 16,353 12,791 14,071 13,219 13,040 13,3412 18,862 18,077 15,877 15,452 13,440 15,0123 13,353 21,525 15,802 14,253 14,264 15,8024 22,432 16,904 17,809 14,840 15,814 16,8875 20,586 21,146 22,342 18,483 19,472 20,586
All 16,952 15,935 15,423 14,097 13,440 14,344
Total median income in last year observed
Table 4-2. Comparison of earnings at ages 57 to 62 and total income in last year observed, original one-person households with matched SSA earnings records
health quintile
Age Interval
Median of non-zero pre-retirement eanings for ages 57 to 62, AIME indexed
Table 4-2 shows the comparison. Overall median total income in the last year observed was less than half of median earnings at ages 57 to 62. The percentage difference is greatest for those in the poorest health and smallest for those in the best health. Combining all age intervals, LYO income was only 46.3 percent of "pre-retirement" earnings in the first health quintile and 57.2 percent of "pre-retirement" earnings in the fifth health quintile. If these “pre-retirement” earnings are an underestimate of actual pre-retirement earning, then these “replacement” rates are an overestimate of true replacement rates. Overall, for the original single-person pathway, we find that a rather large fraction of these single persons have low income judged by poverty thresholds—12.1 percent below the poverty threshold and with no financial assets, 23 percent below twice the poverty line and no financial assets. And the proportion in poverty is much greater for those in poor health than for those in good health. On the other hand, the data show little difference between income just prior to death and income in 1993 when first observed in the AHEAD survey. However, total income in the last year observed is, on average, only about 50 percent of (possibly poorly measured) income in the pre-retirement years. While this difference is hard to evaluate because the two measures are not directly comparable, the implied replacement rate is likely an overestimate of the true replacement rate.

32
5. The Other Marital Pathway Groups and All Groups Combined Table 5-1 presents median regression estimates of the effects of age and health on assets in the last year observed. Separate estimates are presented for each of three marital pathway groups. The estimates control for last year observed as a marker for financial market returns that the household experienced since 1993. These estimated age and year effects are the average over all last years observed. Unlike the estimates for single-person households in Table 3-1, these estimated health and age effects are not interacted with LYO but instead show the average effects over all years. The estimates are graphed for all three marital pathway groups in the left side panel of Figure 5-1. The figure shows the effect of a 10 percentile increase in health on total wealth. The estimates range from $10,000 for single-persons to $20,000 for the other two pathways. The estimated age effect varies from a decline of $7,203 per year of age for persons in original two-person households whose spouse is deceased in the last year observed to $20,619 for persons in original two-person households whose spouse is alive in the last year observed.
Variable
coeffi-cient
t-statcoeffi-cient
t-stat coeffi-cient t-stat
LYO1995 -7,707 -0.67 94,130 2.981998 -14,346 -1.19 -44,452 -0.62 106,030 3.152000 -13,933 -1.12 -68,460 -1.01 118,320 3.322002 18,767 1.42 10,161 0.15 106,023 2.692004 4,266 0.30 -48,988 -0.73 204,739 4.872006 20,731 1.36 -16,651 -0.25 318,929 6.462008 3,788 0.31 -7,164 -0.12 275,335 8.08
health 1,260 9.53 2,063 5.01 2,042 6.02age -9,323 -17.14 -7,203 -3.52 -20,619 -12.24
constant 933,078 20.16 808,133 4.58 2,038,368 15.06N 3,003 1,357 2,286
R2 0.0545 0.0246 0.036
Table 5-1. Median regression estimates of the effects of health and age on assets in last year observed, by family
pathway.
Original Singles
Original Two-Person
Household with Spouse
Deceased at Death
Original Two-Person Household with Spouse Alive
at Death

33
Figure 5-1. Estimated median and OLS estimates of the effect of health and age on assets in last
year observed, by family pathway
-$30,000
-$20,000
-$10,000
$0
$10,000
$20,000
$30,000
$40,000
$50,000
Singles Two- toOne
Person
Two-person
Singles Two- toOne
Person
Two-person
Pathway
Est
imat
ed e
ffe
ct
Health 10 pctl ptsAge year
Median OLS
We next consider summary measures of financial resources that focus on the joint distribution of annuity income and liquid financial assets. We first present these results for all family pathways combined. We then compare the results across family pathways. Table 5-2 shows results for all family pathways combined. The table follows the same format as Figure 3-6 for persons in the single household pathway. Among all family pathways, 9.1 percent of persons have annuity income less than $10,000 (approximately the poverty rate for single persons 65 and older) and no liquid financial assets; 40.0 percent have annuity income less than $20,000 and financial assets less than $10,000. Overall, 50.4 percent have no housing wealth. Of those with annuity income less than $10,000 and no liquid financial assets, 67.0 percent have no housing wealth. The strong relationship between wealth and health is again observed for persons in all family pathways combined. The median health percentile ranges from 24.3 for persons with annuity income less than $10,000 to 42.4 percent for those with annuity income between $30,000 and $40,000 and financial assets between $25,000 and $50,000.

34
Annuity Income ($000s)
< $10 < $20 < $30 < $40 All
Zero 9.1 17.0 18.2 18.5 18.8<$10 19.1 40.0 44.5 45.2 46.1<$25 21.7 47.3 53.3 54.6 55.5<$50 23.7 54.1 62.0 63.7 64.9
All 31.0 76.2 92.0 96.2 100.0
$0- $10
$10- $20
$20- $30
$30- $40
All
Zero 67.0 60.7 64.9 49.7 63.2$0-$10 51.9 54.6 51.5 45.0 51.7$10-$25 42.2 36.9 37.3 37.2 38.5$25-$50 30.8 39.0 37.9 25.3 33.2
All 48.4 46.5 40.3 31.2 50.4
$0- $10
$10- $20
$20- $30
$30- $40
All
Zero 24.3 26.6 23.2 33.9 25.8$0-$10 26.5 28.2 30.1 30.3 28.2$10-$25 31.3 35.4 34.7 36.4 34.3$25-$50 31.1 32.7 35.0 42.4 35.5
All 28.0 30.9 32.2 37.2 31.7
Mean health percentileFinancial
Asset Interval ($000s)
Annuity Income Interval ($000s)
Table 5-2. Selected characteristics of persons in all family pathways, by annuity income and financial assets in the last year observed before death
Percentage distributionFinancial Assets ($000s)
Percent of households with zero home equityFinancial
Asset Interval ($000s)
Annuity Income Interval ($000s)
Tables 5-3, 5-4, and 5-5 compare results across family pathways. Table 5-3 compares the bivariate cumulative distribution of annuity income and financial assets. The easiest way to compare across pathways is to consider the diagonals in the tables for each pathway. Entries are the proportion of persons below any annuity income/financial asset level. The table shows that more single-person households have low resources than persons in the two-person to one-person pathway (persons in original two-person households whose spouse pre-deceased them), which in turn have lower resources than persons in the two-

35
person pathway (persons in original two-person households whose spouse is alive at their death). For example the proportion of persons below $30,000 in annuity income and below $25,000 in financial assets is 64.5 percent for one-person households, 52.2 percent of two- to one-person households and 38.9 percent for two-person households.
Annuity Income ($000s)
< $10 < $20 < $30 < $40 All
Zero 12.1 23.0 24.2 24.7 24.9<$10 23.9 52.0 55.7 56.4 57.0<$25 26.3 58.8 64.5 65.7 66.5<$50 27.9 65.5 72.8 74.4 75.4
All 31.9 82.0 94.1 97.7 100.0
Zero 6.2 14.1 16.0 16.1 16.6<$10 13.2 36.4 43.7 44.3 45.5<$25 15.0 43.6 52.2 53.1 54.7<$50 15.6 50.0 60.2 61.5 63.6
All 18.7 67.5 87.7 93.0 100.0
Zero 6.2 10.1 11.0 11.2 11.6<$10 14.8 26.3 30.1 30.8 31.7<$25 18.1 33.4 38.9 40.3 41.3<$50 21.1 40.5 48.3 50.3 51.6
All 34.2 71.7 90.7 95.3 100.0
two-person households
Table 5-3. Percentage distribution of persons by annuity income and financial assets in the last year observed before death, by family pathway
one-person householdsFinancial Assets ($000s)
two person to one-person households
Table 5-4 shows the proportion of households with zero housing wealth for each of the three pathways. Again, the diagonal values facilitate the comparison. For example, in the $20,000 to $30,000 annuity interval and the $10,000 to $25,000 financial asset interval 52.2 percent of one-person households have no housing wealth but only 27.9 percent of one- to two-person households, and just 20 percent of two-person households. Overall, in the last year before death, 57.1 percent of single-person households have no housing wealth and 49.6 percent of persons in two-to one-person households have no housing wealth. Remarkably,

36
only 20.4 percent of persons who die with a surviving spouse have no home equity.
$0- $10
$10- $20
$20- $30
$30- $40
All
Zero 76.3 69.8 74.8 63.6 73.1$0-$10 62.9 63.3 57.8 53.8 61.2$10-$25 49.8 46.8 52.2 53.5 50.0$25-$50 48.6 47.2 48.3 47.0 47.7
All 63.7 57.7 53.9 47.6 57.1
Zero 70.5 63.5 82.1 74.5 69.6$0-$10 60.0 53.0 60.6 63.0 58.0$10-$25 65.6 28.6 27.9 48.2 39.4$25-$50 44.0 33.4 49.0 11.8 32.7
All 61.7 50.3 50.0 41.7 49.6
Zero 42.0 24.2 19.3 11.7 31.7$0-$10 29.4 25.9 35.2 23.1 28.3$10-$25 30.8 22.0 20.0 15.3 23.1$25-$50 17.5 27.4 14.0 10.5 16.9
All 27.0 21.2 18.0 13.1 20.4
Annuity Income Interval ($000s)
Table 5-4. Percentage of persons with zero home equity by annuity income and financial assets in the last year observed before death, by family pathway
one-person households
two-person households
Financial Asset Interval
($000s)
two person to one-person households
Table 5-5 shows the mean health percentile of persons in each of the three pathways. Unlike the very dissimilar proportions of households below annuity income/ financial asset thresholds across family pathways, and the very different proportions with zero housing wealth within annuity income/financial asset intervals, the levels of health within the cells are very similar across family pathways. That is, given similar annuity income and levels of financial assets, the mean health percentile is about the same for persons in each family status pathway. For example, the overall mean health percentile in the three groups is 28.5, 32.3, and 28.5 respectively in the one-person, two- to one-person, and the two-person pathways. For persons in the zero to $10,000 annuity income and zero housing wealth interval, the mean health percentiles are 24.1, 22.7, and 24.1 respectively.

37
$0- $10
$10- $20
$20- $30
$30- $40
All
Zero 24.1 24.8 22.4 28.3 24.5$0-$10 23.4 28.2 24.3 26.2 25.6$10-$25 28.5 33.3 38.3 35.6 33.5$25-$50 26.6 25.3 26.8 43.3 30.2
All 25.1 28.4 29.5 33.4 28.5
Zero 22.7 28.5 30.6 46.3 29.2$0-$10 33.7 23.9 36.1 28.1 28.9$10-$25 24.9 42.0 31.5 29.3 32.6$25-$50 41.2 40.7 47.9 49.1 45.4
All 29.1 31.0 33.2 35.0 32.3
Zero 24.1 24.8 22.4 28.3 24.5$0-$10 23.4 28.2 24.3 26.2 25.6$10-$25 28.5 33.3 38.3 35.6 33.5$25-$50 26.6 25.3 26.8 43.3 30.2
All 25.1 28.4 29.5 33.4 28.5
two-person households
Annuity Income Interval ($000s)
Table 5-5. Mean health percentile by annuity income and financial assets in the last year observed before death, by family pathway
one-person householdsFinancial
Asset Interval ($000s)
two person to one-person households
Finally, Table 5-6 compares median income in the last year observed with income in 1993. Because of small sample sizes in many cells the table shows data for all health quintiles and for all last years observed combined. For men with matched Social Security records the table also compares median income in 1993 with median earnings for ages 57 to 62. For one-person households and for two-person households total income in the last year observed was, on average, only slightly below income in 1993, for two- to one-person households the decline in income between 1993 and the last year observed was almost 75 percent. For men with matched Social Security records Table 5-6 shows that for one to one and for two to one person households total income in the last year observed much lower than income when aged 57 to 62—over 68 percent less for one to one households and almost 106 percent less for two to one households. The decline was only 23.2 percent for two to two person households.

38
One to one Two to one Two to two
Total income in 1993 14,943 31,719 34,656
Total income in last year observed
14,344 18,143 33,449
Percent change -4.2% -74.8% -3.6%
Median earnings when age 57 to 62
25,604 40,855 41,584
Medial total income in last year observed
15,213 19,844 33,759
Percent change -68.3% -105.9% -23.2%
For men with matched Social Security records
Table 5-6. Comparison of median total income in last year observed to median income in 1993 and median earnings when age 57 to 62, all persons, by pathway
ComparisonPathway
For all persons

39
6. Summary and Conclusions We began by summarizing the balance sheets of households in the Health and Retirement Study by five-year age intervals from age 65 to 69 through age 85 and older. These balance sheets show that many households have accumulated considerable wealth, ranging in 2008 from a median of $214,371 for older single-person households to a median of $1,015,317 for younger two-person households. Interpretation of these balances is confounded by cohort effects (older generations have lower lifetime earnings than younger generations) and mortality effects (persons in poorer households within a cohort die at younger ages). Thus although these balance sheets present the point-in time wealth of households who survive to a given age they do not reveal the evolution of assets of the same households over time. To analyze this evolution, we direct attention to the AHEAD households, who were aged 70 and older in 1993 when first observed and age 87 and older in 2008 when last observed. We divide the AHEAD households into three family pathway groups: (1) original one-person households in 1993, (2) persons in two-person household in 1993 with a deceased spouse in the last year observed, and (3) persons in two-person households in 1993 with the spouse alive when last observed. For each of these pathways we describe the evolution of assets from 1993 to the year last observed. We describe the evolution of total wealth and several of its components—financial assets including IRA accounts, housing wealth and housing ownership, Social Security annuity wealth, and DB pension annuity wealth. We find a very strong relationship between health when last observed and the level of assets just before death. Those in poor health have much lower assets than those in good health. Much of our analysis is restricted to persons who are known to have died. For these persons we are able to calculate wealth in the last year observed before their death. Because waves of the AHEAD are typically spaced two years apart, our last observation for each person is at most two years prior to death. Several general results stand out: 1) Median total wealth was relatively high in the year last observed for each of the three family pathway groups. 2) Wealth in the last year before death is greatest for persons who were in two-person households the longest period of time. For example, the average assets in the last year observed were $141,606 for persons in one-person households in 1993 whose last year observed before death was 2006, $252,849 for persons in two-person households in 1993 whose spouse was deceased when last observed in 2006, and $691,588 for person in two-person households in 1993 whose spouse was alive when last observed in 2006. 3) For total wealth and for each of the asset sub-categories there is a strong correspondence between the level of assets in 1993 and the number of years a person survives after 1993. Persons who lived longer had higher initial assets. 4) For each family pathway group, there is a very strong relationship between health status and wealth in the last year observed. Thus there is a strong association between health and wealth

40
even among persons who would die within the next two years. 5) Despite the appearance of substantial assets at the median, a substantial fraction of people die with income less than $10,000 and with no financial assets and with zero housing wealth. A rather large fraction of the original single-person households have low income judged by the income poverty thresholds. We find that 12.1 percent are below the poverty threshold and have no financial assets, and that 23 percent are below twice the income poverty line and have no financial assets. To put the results in context we first compare the total income in the last year observed to total income in 1993, the first year the AHEAD data were collected. Total income in the last year observed was about 4 percent higher, on average, than total income in 1993. We also compare total median income in the last year observed to median earnings (in 2008 dollars) of the same persons when they were between ages 57 and 62. While the difference is hard to evaluate because the two measures are not clearly comparable, overall median income in the last year observed was approximately 50 percent lower than median earnings of the same persons at ages 57 to 62. There are also important differences across the pathways. Consider for example the proportion of persons with annuity income less than $20,000 (approximately twice the poverty level for single persons over age 65) and financial assets less than $10,000: 52 percent of persons in the single-household pathway fall below these thresholds, but only 36.4 percent of those in the two- to one-person pathway, and only 26.3 percent of those in the two-person pathway. Similarly, consider the proportion of persons with annuity income in the $10,000 to $20,000 interval and financial assets less than $10,000 who have zero housing wealth: of those in the single family pathway 63.3 percent have zero housing wealth, 53.0 percent of those in the two- to one-person pathway, and only 25.9 percent of those in the two-person pathway. A perhaps striking similarity across the pathways is that given income and housing wealth the health status of the persons in the three pathways is very close. The median health percentile of persons with annuity income in the $10,000 to $20,000 interval and financial assets less than $10,000 is 28.2 for persons in the single-household pathway, 23.9 percent for those in the two-to one-person pathway, and 28.2 for persons in the two-person pathway. Finally, the total household income of one to one and two to two households when last observed was only slightly less than income in 1993, while income of two to one households was almost 75 percent lower when last observed than in 1993. And for men with matched Social Security records income when last observed was over 68 percent lower than earning at ages 57 to 62 for one to one households, 106 percent lower for two to one households, but only 23 percent less for two to two households. The results raise several issues. First, a noticeable fraction of persons die with virtually no financial assets—46.1 percent with less than $10,000. Based on a replacement rate comparison, many of these may be deemed to have been

41
well-prepared for retirement, in the sense that their income in their final years was not substantially lower than their income in their late 50s or early 60s. Yet with such low asset levels, they would have little capacity to pay for unanticipated needs such as health or other shocks or to pay for entertainment, travel, or other activities. This raises a question of whether the replacement ratio is a sufficient statistic for the “adequacy” of retirement preparation. In addition, this group relies almost entirely on Social Security benefits for support in retirement. These persons balance on only one leg of the oft touted three-legged stool that is said to provide retirement support—Social Security, pension benefits, and personal saving. If the one leg is judged inadequate it raises the question of how to strengthen the other legs which in turn may, for example, increase interest in the spread of 401(k)-like plans to low-wage workers in firms with high turnover.

42
References: Adams P., Hurd M.D., McFadden D. Merrill A and Ribeiro T. "Healthy, Wealthy
and Wise? Tests for Direct Causal Paths between Health and Socioeconomic Status," Journal of Econometrics, 112(1), 3-56, 2003.
Attanasio, Orazio and Carl Emmerson, "Mortality, Health Status, and Wealth," Journal of the European Economic Association, 1(4):821-850, 2003.
Bernheim, B. Douglas, "Is the Baby Boom Generation Preparing Adequately for Retirement?", Merrill Lynch, 1992.
Case, Anne and Angus Deaton, "Health and Wealth Among the Poor: India and South Africa Compared," American Economic Review (Papers and Proceedings), 95 (2005), 229-233.
Engen, Eric, William Gale and Cory Uccello, "The Adequacy of Household Saving," Brookings Papers on Economic Activity, vol. 2, p. 65-187, 1999.
Haveman, Robert, Karen Holden, Barbara Wolfe, and Andrei Romanov, "Assessing the Maintenance of Savings Sufficiency over the First Decade of Retirement," CESIFO Working Paper No. 1567, October 2005.
Hurd, Michael, Daniel McFadden and Angela Merrill, "Predictors of Mortality among the Elderly," in D. Wise (ed.) Themes in the Economics of Aging, University of Chicago Press, 2001.
Hurd, Michael and Susann Rohwedder, "The Adequacy of Economic Resources in Retirement, Then and Now," RAND, December 2009.
Hurd, Michael and David Wise, "The Wealth and Poverty of Widows: Assets Before and After the Husband's Death," in D. Wise (ed.) The Economics of Aging, University of Chicago Press, p. 177-199,1989.
Johnson, Richard, Cori Uccello, and Joshua Goldwyn, "Who Forgoes Survivor Protection in Employer-Sponsored Pension Annuities," The Gerontologist, Feb. 2005, 45(1), p. 26-35.
Love, David, Paul Smith and Lucy McNair, "A New Look at the Wealth Adequacy of Older U.S. Households," Federal Reserve Board Finance and Economics Discussion Paper No. 2008-20, 2008.
Michaud, P.-C. , A. van Soest, “Health and Wealth of Elderly Couples: Causality Tests using Dynamic Panel Data Models” Journal of Health Economics 27:5,pp. 1312-1325, 2008.
Mitchell, Olivia and James Moore, "Can Americans Afford to Retire? New Evidence on Retirement Saving Adequacy," Journal of Risk and Insurance, 65(3), p. 371-400, 1998.
Munnell, Alicia, Anthony Webb and francesca Golub-Sass, "Is There Really a Retirement Saving Crisis? An NRRI Analysis," CRR Boston College No. 7-11, August 2007.
Poterba, James, Steven F. Venti and David A. Wise. “Family Status Transitions, Latent Health, and the Post-Retirement Evolution of Assets?” NBER Working Paper No. 15789, 2010a and forthcoming in David A. Wise (ed), Explorations in the Economics of Aging.
Poterba, James, Steven F. Venti and David A. Wise. “The Asset Cost of Poor Health” NBER Working Paper No. 16389, 2010b.

43
Rohwedder, Susann, Steven J. Haider, and Michael D. Hurd, 2006, “Increases in
Wealth among the Elderly in the Early 1990s: How Much is Due to Survey Design?” Review of Income and Wealth, Dec. 2006, 52(4), 509-524.
Scholz, John Karl, Ananth Seshadri, and Surachai Khitatrakun, "Are Americans Saving Optimally for Retirement," Journal of Political Economy 114 (4), 2006, 607-647.
Sevak, Purvi, David Weir and Robert Willis, "The Economic Consequences of a Husband's Death: Evidence from the HRS and AHEAD, Social Security Bulletin, vol 65, no. 3, p. 31-44, 2003.
Smith, James P. “Healthy Bodies and Thick Wallets: The Dual Relation between Health and Economic Status,” Journal of Economic Perspectives, 13(2):145-166, 1999.
Smith, James P. “Unraveling the SES-Health Connection,” Population and Development Review Supplement: Aging, Health and Public Policy, 30:108-132, 2004.
Smith, James P., “Consequences and Predictors of New Health Events,” in David A. Wise (eds.) Analyses in the Economics of Aging, University and Chicago Press, p.213-240. 2005.
VanDerhei, Jack and Craig Copeland, "The EBRI Retirement Readiness Rating: Retirement Income Preparation and Future Prospects," EBRI Issue Brief no. 344, July 2010
Venti, Steven F. and David A. Wise, “Aging and Housing Equity,” in Bodie, Hammond, and Mitchell (ed.) Innovations in Retirement Financing. University of Pennsylvania Press and the Pension Research Council. 2002.
Venti, Steven F. and David A. Wise, “Aging and Housing Equity: Another Look,” In D.A. Wise, (ed.), Perspectives on the Economics of Aging, University of Chicago Press, 2004.
Weir, David and Robert Willis, "Prospects for Widow Poverty in the Finances of Marries Couples in the HRS," in O. Mitchell, B. Hammond and A. Rappaport (ed.), Forecasting Retirement Needs and Retirement Wealth, University of Pennsylvania Press, p. 208-234, 2000.
Wu, Stephen, "The Effects of Health Status Events on the Economic Status of Married Couples," Journal of Human Resources, vol. 38, no. 1, p. 219-230. 2003.

44
Mean Median
Financial Assets 86.7 15000 132,484 12.6 152,805 25,000Non-Mortgage Debt 36.2 0 -3,679 -0.4 10,225 5,000Home Equity (primary home) 79.8 100,000 176,188 16.8 222,546 145,000Home Equity (second home) 15.8 0 26,280 2.5 166,423 50,000Other Real Estate 14.8 0 69,137 6.6 466,416 125,000Business Assets 9.7 0 45,966 4.4 473,289 200,000Personal Retirement Accounts 52.2 5,000 121,137 11.5 231,910 100,000 - IRAs & Keoghs 41.5 0 75,299 7.2 181,577 80,000 - 401(k)s and Similar Plans 26.1 0 45,839 4.4 175,670 50,000Social Security 88.2 315,163 341,556 32.6 387,195 351,709Defined Benefit Pension 42.1 0 140,176 13.4 332,834 232,492Non-Annuity Net Worth 90.8 221,700 567,496 54.1 626,768 269,800Net Worth 99.4 731,121 1,049,228 100.0 1,056,245 732,866
Financial Assets 82.3 5,000 83,082 12.8 100,941 12,000Non-Mortgage Debt 34.8 0 -3,042 -0.5 8,734 4,000Home Equity (primary home) 65.9 52,000 107,483 16.6 165,712 110,000Home Equity (second home) 9.4 0 7,969 1.2 86,894 20,000Other Real Estate 8.7 0 73,361 11.3 845,335 150,000Business Assets 6.1 0 18,069 2.8 297,513 100,000Personal Retirement Accounts 36.4 0 47,074 7.3 129,148 64,000 - IRAs & Keoghs 27.9 0 32,206 5.0 115,385 52,000 - 401(k)s and Similar Plans 15.6 0 14,869 2.3 95,604 30,000Social Security 86.6 230,060 225,842 34.8 260,890 256,051Defined Benefit Pension 38.0 0 89,323 13.8 235,059 190,032Non-Annuity Net Worth 84.4 100,000 333,996 51.5 398,690 150,000Net Worth 99.1 414,435 649,161 100.0 655,857 420,494
Financial Assets 90.3 27,750 172,830 12.6 191,419 39,000Non-Mortgage Debt 37.2 0 -4,232 -0.3 11,364 5,000Home Equity (primary home) 91.1 150,000 232,300 16.9 256,111 160,000Home Equity (second home) 21.1 0 41,235 3.0 195,369 70,000Other Real Estate 19.8 0 65,688 4.8 331,062 120,000Business Assets 12.7 0 68,750 5.0 542,028 250,000Personal Retirement Accounts 65.1 35,000 181,625 13.2 278,881 122,000 - IRAs & Keoghs 52.5 5,841 110,493 8.0 210,295 100,000 - 401(k)s and Similar Plans 34.7 0 71,132 5.2 204,975 59,600Social Security 89.6 473,933 436,059 31.7 486,901 494,485Defined Benefit Pension 45.5 0 181,708 13.2 399,557 272,490Non-Annuity Net Worth 96.0 357,000 758,196 55.1 790,385 385,000Net Worth 99.6 1,015,317 1,375,963 100.0 1,381,422 1,016,076Source: Authors' tabulations using Health and Retirement Survey, Wave 9 (2008).
All Households
Single-Person Households
Married Couples
Appendix Table 1-1. Balance sheets for households aged 65-69 in 2008
Asset CategoryPercent of
Households with Asset
Mean Holding
Share of Total Wealth
Values Conditional on Positive Holding
Median Holding

45
Mean Median
Financial Assets 88.1 17000 146,663 14.8 166,540 28,000Non-Mortgage Debt 27.8 0 2,991 0.3 -10,776 -3,000Home Equity (primary 76.9 100,000 156,484 15.8 204,387 150,000Home Equity (second 13.7 0 26,975 2.7 197,037 92,000Other Real Estate 14 0 44,987 4.5 321,528 120,000Business Assets 7.4 0 50,443 5.1 682,759 200,000Personal Retirement 45.9 0 94,632 9.6 206,233 83,000 - IRAs & Keoghs 40.6 0 77,796 7.9 191,775 88,144 - 401(k)s and Similar 11.8 0 16,836 1.7 142,647 35,000Social Security 98.1 287,912 320,915 32.4 327,011 292,487Defined Benefit Pension 49.1 0 152,105 15.4 309,847 189,075Non-Annuity Net Worth 90.6 202,500 517,194 52.2 572,153 243,200Net Worth 99.7 660,495 990,214 100.0 993,139 661,260
Financial Assets 84 5,000 86,738 14.4 103,207 11,300Non-Mortgage Debt 27.9 0 -1,980 -0.3 -7,100 -2,500Home Equity (primary 63.1 50,000 107,729 17.9 171,368 129,000Home Equity (second 7.1 0 9,669 1.6 135,861 70,000Other Real Estate 8.2 0 20,458 3.4 248,626 100,000Business Assets 4.4 0 36,342 6.0 817,311 200,000Personal Retirement 34 0 38,520 6.4 113,276 47,000 - IRAs & Keoghs 29.6 0 35,258 5.9 118,981 56,000 - 401(k)s and Similar 6.3 0 3,262 0.5 51,824 14,000Social Security 97.4 207,740 212,967 35.4 218,590 209,732Defined Benefit Pension 42 0 91,236 15.2 217,174 132,887Non-Annuity Net Worth 84.7 95,300 297,478 49.4 352,107 151,200Net Worth 99.7 389,592 601,680 100.0 603,457 390,909
Financial Assets 92.3 40,000 209,205 15.0 226,751 50,000Non-Mortgage Debt 27.6 0 -4,046 -0.3 -14,649 -3,500Home Equity (primary 91.4 150,000 207,368 14.9 228,178 160,000Home Equity (second 20.6 0 45,037 3.2 219,136 110,000Other Real Estate 20 0 70,586 5.1 352,821 130,000Business Assets 10.5 0 65,159 4.7 623,052 235,000Personal Retirement 58.3 20,000 153,195 11.0 262,835 117,000 - IRAs & Keoghs 52 9,000 122,193 8.8 235,088 116,000 - 401(k)s and Similar 17.6 0 31,002 2.2 176,645 41,000Social Security 98.9 427,936 433,578 31.1 438,510 429,213Defined Benefit Pension 56.5 55,539 215,633 15.4 381,789 254,016Non-Annuity Net Worth 96.7 355,700 746,505 53.5 773,307 373,000Net Worth 99.7 1,009,818 1,395,716 100.0 1,399,833 1,012,407Source: Authors' tabulations using Health and Retirement Survey, Wave 9 (2008).
Median Holding
Married Couples
All Households
Single-Person Households
Appendix Table 1-2. Balance sheets for households aged 70-74 in 2008
Asset CategoryPercent of
Households with Asset
Mean Holding
Share of Total Wealth
Values Conditional on Positive Holding

46
Mean Median
Financial Assets 88.6 16000 144,536 16.8 163,087 25,000Non-Mortgage Debt 23.2 0 -2,760 -0.3 -11,883 -4,300Home Equity (primary 75.7 100,000 168,464 19.5 223,100 150,000Home Equity (second 11.6 0 21,243 2.5 183,253 75,000Other Real Estate 10.9 0 63,748 7.4 584,397 190,000Business Assets 6.9 0 30,479 3.5 444,372 200,000Personal Retirement 41.2 0 71,579 8.3 173,870 75,000 - IRAs & Keoghs 39.4 0 68,179 7.9 173,252 76,139 - 401(k)s and Similar 4.3 0 3,401 0.4 79,890 30,000Social Security 98.2 216,900 249,219 28.9 253,707 219,136Defined Benefit Pension 51.8 11,613 115,742 13.4 223,644 130,383Non-Annuity Net Worth 91.5 195,000 497,290 57.7 544,699 230,000Net Worth 99.7 565,440 862,250 100.0 865,427 566,676
Financial Assets 85.6 8,000 96,633 17.8 112,913 15,000Non-Mortgage Debt 24.9 0 -3,134 -0.6 -12,562 -4,000Home Equity (primary 65.7 60,000 123,144 22.7 187,707 130,000Home Equity (second 7.6 0 10,826 2.0 143,125 60,000Other Real Estate 7.2 0 24,687 4.6 341,794 200,000Business Assets 3.9 0 15,067 2.8 386,937 200,000Personal Retirement 28.9 0 31,888 5.9 110,192 50,000 - IRAs & Keoghs 28.3 0 30,716 5.7 108,481 50,000 - 401(k)s and Similar 1.6 0 1,173 0.2 72,316 14,000Social Security 97.3 166,846 164,939 30.4 169,456 168,794Defined Benefit Pension 45.2 0 78,365 14.4 173,531 103,213Non-Annuity Net Worth 87.3 113,000 299,112 55.1 344,599 150,900Net Worth 99.4 336,058 542,416 100.0 546,110 337,517
Financial Assets 92.6 50,000 207,856 16.2 224,353 60,000Non-Mortgage Debt 21 0 -2,266 -0.2 -10,816 -5,000Home Equity (primary 88.9 151,000 228,371 17.8 257,672 175,000Home Equity (second 17 0 35,013 2.7 206,890 75,000Other Real Estate 15.8 0 115,381 9.0 731,182 175,000Business Assets 10.8 0 50,852 4.0 471,801 200,000Personal Retirement 57.3 14,000 124,045 9.7 216,355 92,000 - IRAs & Keoghs 53.9 11,000 117,700 9.2 218,192 96,000 - 401(k)s and Similar 7.7 0 6,345 0.5 81,987 30,000Social Security 99.4 348,675 360,624 28.1 362,742 349,695Defined Benefit Pension 60.5 61,531 165,148 12.9 273,115 174,047Non-Annuity Net Worth 97.1 345,000 759,251 59.1 782,508 364,500Net Worth 100 858,331 1,285,024 100.0 1,285,024 858,331Source: Authors' tabulations using Health and Retirement Survey, Wave 9 (2008).
Median Holding
Percent of Households with Asset
Mean Holding
Share of Total Wealth
Values Conditional on Positive Holding
All Households
Single-Person Households
Married Couples
Appendix Table 1-3. Balance sheets for households aged 75-79 in 2008
Asset Category

47
Mean Median
Financial Assets 88.8 23000 185,056 24.7 208,370 35,700Non-Mortgage Debt 17.3 0 -1,179 -0.2 -6,820 -3,000Home Equity (primary 72.3 90,000 149,537 20.0 207,112 140,000Home Equity (second 9.2 0 18,553 2.5 201,880 80,000Other Real Estate 9.6 0 38,186 5.1 396,044 95,000Business Assets 6.1 0 28,029 3.7 461,058 230,000Personal Retirement 35.3 0 54,757 7.3 155,294 55,000 - IRAs & Keoghs 35 0 52,459 7.0 149,766 55,000 - 401(k)s and Similar 1.1 0 2,298 0.3 203,348 107,000Social Security 98.1 146,095 177,651 23.7 181,080 147,263Defined Benefit Pension 53.7 9,872 97,520 13.0 181,722 98,386Non-Annuity Net Worth 92.2 180,000 472,940 63.2 512,981 207,000Net Worth 99.9 418,124 748,110 100.0 748,615 418,221
Financial Assets 86.7 12,000 120,453 24.8 138,870 20,000Non-Mortgage Debt 16.3 0 -1,037 -0.2 -6,360 -2,000Home Equity (primary 65.4 70,000 117,856 24.3 180,250 125,000Home Equity (second 5.5 0 9,937 2.0 179,155 100,000Other Real Estate 7.2 0 20,634 4.2 286,954 55,000Business Assets 4.2 0 12,438 2.6 292,913 200,000Personal Retirement 27.6 0 26,042 5.4 94,199 41,000 - IRAs & Keoghs 27.6 0 26,022 5.4 94,127 41,000 - 401(k)s and Similar 0.2 0 20 0.0 12,500 12,500Social Security 97.8 119,406 123,086 25.3 125,834 121,259Defined Benefit Pension 49.7 0 56,229 11.6 113,231 64,384Non-Annuity Net Worth 90.7 127,000 306,323 63.1 337,868 160,000Net Worth 100 302,751 485,638 100.0 485,638 302,751
Financial Assets 92.8 70,500 309,775 24.7 333,758 84,000Non-Mortgage Debt 19.2 0 -1,451 -0.1 -7,578 -4,900Home Equity (primary 85.5 136,000 210,697 16.8 246,798 160,000Home Equity (second 16.2 0 35,185 2.8 216,879 65,000Other Real Estate 14.4 0 72,070 5.7 501,400 125,000Business Assets 9.6 0 58,127 4.6 604,378 280,000Personal Retirement 50 0 110,193 8.8 220,558 73,000 - IRAs & Keoghs 49.3 0 103,496 8.2 210,026 72,000 - 401(k)s and Similar 3 0 6,697 0.5 222,938 110,000Social Security 98.7 262,814 282,989 22.6 286,814 263,889Defined Benefit Pension 61.4 51,693 177,233 14.1 288,665 141,651Non-Annuity Net Worth 95.1 371,500 794,595 63.3 835,385 400,000Net Worth 99.8 748,356 1,254,817 100.0 1,257,291 748,875Source: Authors' tabulations using Health and Retirement Survey, Wave 9 (2008).
Share of Total Wealth
Values Conditional on Positive Holding
All Households
Single-Person Households
Married Couples
Percent of Households with Asset
Mean Holding
Median Holding
Appendix Table 1-4. Balance sheets for households aged 80-84 in 2008
Asset Category

48
Mean Median
Financial Assets 88.7 29000 177,611 33.2 200,293 48,000Non-Mortgage Debt 9.4 0 -757 -0.1 -8,070 -2,000Home Equity (primary 60.9 63,000 125,883 23.5 206,935 140,000Home Equity (second 6.5 0 14,358 2.7 222,543 100,000Other Real Estate 8.4 0 29,243 5.5 346,127 150,000Business Assets 5.4 0 26,752 5.0 500,032 350,000Personal Retirement 20.9 0 15,096 2.8 72,396 33,387 - IRAs & Keoghs 20.7 0 15,031 2.8 72,626 35,000 - 401(k)s and Similar 0.2 0 65 0.0 41,803 2,500Social Security 98 77,587 99,613 18.6 101,678 78,026Defined Benefit Pension 49.8 0 47,853 8.9 96,114 45,257Non-Annuity Net Worth 92.6 153,000 388,186 72.5 419,435 179,000Net Worth 99.8 291,832 535,652 100.0 536,739 293,342
Financial Assets 88.1 19,000 143,704 35.2 163,115 30,000Non-Mortgage Debt 9.2 0 -572 -0.1 -6,226 -2,000Home Equity (primary 54.1 35,000 101,728 24.9 188,223 130,000Home Equity (second 4.4 0 9,805 2.4 223,061 125,000Other Real Estate 6.5 0 19,064 4.7 293,103 150,000Business Assets 4.5 0 16,997 4.2 375,286 275,000Personal Retirement 15.6 0 9,255 2.3 59,211 25,000 - IRAs & Keoghs 15.6 0 9,255 2.3 59,211 25,000 - 401(k)s and Similar 0 0 0 0.0Social Security 98 69,352 73,500 18.0 75,024 70,373Defined Benefit Pension 47.8 0 35,082 8.6 73,462 35,319Non-Annuity Net Worth 91 116,500 299,980 73.4 329,835 148,000Net Worth 99.7 214,371 408,562 100.0 409,628 214,511
Financial Assets 90.7 98,000 296,971 30.2 327,416 125,000Non-Mortgage Debt 10.1 0 -1,411 -0.1 -13,961 -2,000Home Equity (primary 84.8 125,000 210,917 21.5 248,919 150,000Home Equity (second 13.7 0 30,388 3.1 221,957 100,000Other Real Estate 15.3 0 65,075 6.6 425,514 155,000Business Assets 8.2 0 61,094 6.2 741,382 500,000Personal Retirement 39.2 0 35,660 3.6 90,885 51,000 - IRAs & Keoghs 38.5 0 35,365 3.6 91,783 51,000 - 401(k)s and Similar 0.7 0 295 0.0 41,803 2,500Social Security 98 170,162 191,539 19.5 195,504 173,503Defined Benefit Pension 56.9 23,633 92,809 9.4 162,990 87,063Non-Annuity Net Worth 98.2 362,000 698,693 71.1 711,635 378,200Net Worth 100 674,965 983,042 100.0 983,042 674,965Source: Authors' tabulations using Health and Retirement Survey, Wave 9 (2008).
Appendix Table 1. Balance sheets for households aged 85 or older in 2008
Asset CategoryPercent of
Households with Asset
Mean Holding
Share of Total Wealth
Values Conditional on Positive Holding
Median Holding
All Households
Single-Person Households
Married Couples