wellsfargo(lux)worldwidefundunaudited) wellsfargo(lux)worldwidefund 1 china equity fund industry...
TRANSCRIPT

Semi-Annual Report30 September 2017
Wells Fargo (Lux) Worldwide Fund
▪ China Equity Fund
▪ Emerging Markets Equity Fund
▪ Emerging Markets Equity Income Fund
▪ EUR Investment Grade Credit Fund*
▪ Global Equity Fund
▪ Global Focused Equity Fund
▪ Global Long/Short Equity Fund**
▪ Global Low Volatility Equity Fund*
▪ Global Opportunity Bond Fund
▪ U.S. All Cap Growth Fund
▪ U.S. Dollar Short-Term Money Market Fund
▪ U.S. High Yield Bond Fund
▪ U.S. Large Cap Growth Fund
▪ U.S. Select Equity Fund
▪ U.S. Short-Term High Yield Bond Fund
▪ U.S. Small Cap Value Fund
▪ USD Investment Grade Credit Fund
* EUR Investment Grade Credit Fund and Global Low Volatility Equity Fund commenced operations on 19 June 2017.
** Global Long/Short Equity Fund commenced operations on 31 July 2017.
China Equity Fund, EUR Investment Grade Credit Fund, Global Long/Short Equity Fund, Global Low VolatilityEquity Fund, Global Opportunity Bond Fund, U.S. Dollar Short-Term Money Market Fund and USD InvestmentGrade Credit Fund have not been authorised by the Hong Kong Securities and Futures Commission and arenot available for investment by Hong Kong retail investors.
Wells Fargo (Lux) Worldwide Fund is incorporated with limited liability in the Grand Duchy of Luxembourg asa Société d’Investissement à Capital Variable under number RCS Luxembourg B 137.479.
Registered office of Wells Fargo (Lux) Worldwide Fund: 80, route d’Esch, L-1470 Luxembourg, Grand Duchy ofLuxembourg.

Table of Contents
Portfolios of investmentsChina Equity Fund . . . . . . . . . . . . . . . . . . . . . . . . . . . . . . . . . . . . . . . . . . . . . . . . . . . . 1Emerging Markets Equity Fund . . . . . . . . . . . . . . . . . . . . . . . . . . . . . . . . . . . . . . . . . 4Emerging Markets Equity Income Fund . . . . . . . . . . . . . . . . . . . . . . . . . . . . . . . . . 8EUR Investment Grade Credit Fund . . . . . . . . . . . . . . . . . . . . . . . . . . . . . . . . . . . . . 13Global Equity Fund . . . . . . . . . . . . . . . . . . . . . . . . . . . . . . . . . . . . . . . . . . . . . . . . . . . 19Global Focused Equity Fund . . . . . . . . . . . . . . . . . . . . . . . . . . . . . . . . . . . . . . . . . . . 21Global Long/Short Equity Fund . . . . . . . . . . . . . . . . . . . . . . . . . . . . . . . . . . . . . . . . 23Global Low Volatility Equity Fund . . . . . . . . . . . . . . . . . . . . . . . . . . . . . . . . . . . . . . . 27Global Opportunity Bond Fund . . . . . . . . . . . . . . . . . . . . . . . . . . . . . . . . . . . . . . . . 33U.S. All Cap Growth Fund . . . . . . . . . . . . . . . . . . . . . . . . . . . . . . . . . . . . . . . . . . . . . . 37U.S. Dollar Short-Term Money Market Fund . . . . . . . . . . . . . . . . . . . . . . . . . . . . . . 40U.S. High Yield Bond Fund . . . . . . . . . . . . . . . . . . . . . . . . . . . . . . . . . . . . . . . . . . . . . 43U.S. Large Cap Growth Fund . . . . . . . . . . . . . . . . . . . . . . . . . . . . . . . . . . . . . . . . . . . 51U.S. Select Equity Fund . . . . . . . . . . . . . . . . . . . . . . . . . . . . . . . . . . . . . . . . . . . . . . . . 53U.S. Short-Term High Yield Bond Fund . . . . . . . . . . . . . . . . . . . . . . . . . . . . . . . . . . 55U.S. Small Cap Value Fund . . . . . . . . . . . . . . . . . . . . . . . . . . . . . . . . . . . . . . . . . . . . . 59USD Investment Grade Credit Fund . . . . . . . . . . . . . . . . . . . . . . . . . . . . . . . . . . . . . 63
Statement of assets and liabilities . . . . . . . . . . . . . . . . . . . . . . . . . . . . . . . . . . . . . . . . . . . 68Statement of operations and changes in net assets . . . . . . . . . . . . . . . . . . . . . . . . . . . 74Statistics . . . . . . . . . . . . . . . . . . . . . . . . . . . . . . . . . . . . . . . . . . . . . . . . . . . . . . . . . . . . . . . . . 78Notes to financial statements . . . . . . . . . . . . . . . . . . . . . . . . . . . . . . . . . . . . . . . . . . . . . . . 88Directors, administration and management . . . . . . . . . . . . . . . . . . . . . . . . . . . . . . . . . . 102General information . . . . . . . . . . . . . . . . . . . . . . . . . . . . . . . . . . . . . . . . . . . . . . . . . . . . . . . 104Appendix I: Total expense ratios . . . . . . . . . . . . . . . . . . . . . . . . . . . . . . . . . . . . . . . . . . . . 105Appendix II: Performance . . . . . . . . . . . . . . . . . . . . . . . . . . . . . . . . . . . . . . . . . . . . . . . . . . 109Appendix III: Securities financing transactions . . . . . . . . . . . . . . . . . . . . . . . . . . . . . . . . 113
China Equity Fund, EUR Investment Grade Credit Fund, Global Long/Short Equity Fund, Global Low Volatility Equity Fund, Global Opportunity Bond Fund, U.S.
Dollar Short-Term Money Market Fund and USD Investment Grade Credit Fund have not been authorised by the Hong Kong Securities and Futures Commission
and are not available for investment by Hong Kong retail investors.

[THIS PAGE INTENTIONALLY LEFT BLANK]

Portfolio of investments as at 30 September 2017 (unaudited) Wells Fargo (Lux) Worldwide Fund 1
CHINA EQUITY FUND
Industry Shares
MarketValue
USD
% ofNet
Assets
Transferable securities and money market instruments admitted to an official stock exchange listing or dealt in on another regulated market
Common Shares
China3SBio Incorporated Biotechnology 193,000 309,330 0.53
Agricultural Bank of China Limited Banks 1,419,500 636,009 1.09
Alibaba Group Holding Limited ADR Internet 31,210 5,390,279 9.26
Aluminum Corp. of China Limited Mining 668,000 599,452 1.03
Anhui Conch Cement Company Limited Building Materials 65,000 259,198 0.45
AviChina Industry & Technology Company
Limited Aerospace/Defense 883,000 533,535 0.92
Baidu Incorporated ADR Internet 13,270 3,286,846 5.65
Bank of China Limited Banks 4,107,000 2,024,163 3.48
Beijing Capital International Airport Company
Limited Engineering & Construction 344,000 512,592 0.88
Beijing Urban Construction Design &
Development Group Company Limited Engineering & Construction 355,000 211,320 0.36
Bright Scholar Education Holdings Limited ADR Commercial Services 12,900 299,667 0.52
BYD Company Limited Auto Manufacturers 67,000 621,403 1.07
China Communications Construction Company
Limited Engineering & Construction 393,000 490,520 0.84
China Construction Bank Corporation Banks 3,348,000 2,777,285 4.77
China Galaxy Securities Company Limited Diversified Financial Services 248,000 217,471 0.37
China Lesso Group Holdings Limited Building Materials 480,000 327,513 0.56
China Life Insurance Company Limited Insurance 287,000 854,210 1.47
China Longyuan Power Group Corporation
Limited Energy – Alternate Sources 309,000 230,219 0.40
China Merchants Bank Company Limited Banks 170,000 597,381 1.03
China Petroleum & Chemical Corporation Oil & Gas Services 1,174,200 879,342 1.51
China Resources Pharmaceutical Group Limited Pharmaceuticals 421,000 500,138 0.86
China Resources Phoenix Healthcare Holdings
Company Limited Healthcare – Services 185,000 230,670 0.40
China Telecom Corporation Limited Telecommunications 912,000 466,998 0.80
CNOOC Limited Oil & Gas Services 668,000 861,980 1.48
Ctrip.com International Limited ADR Internet 22,400 1,181,376 2.03
Hengan International Group Company Limited Healthcare – Products 50,500 467,401 0.80
Huaneng Renewables Corporation Limited Electric 1,858,000 613,657 1.05
Industrial & Commercial Bank of China Limited Banks 3,470,991 2,577,161 4.43
JD.com Incorporated ADR Internet 26,000 993,200 1.71
Kingdee International Software Group Company
Limited Software 628,000 276,553 0.48
New Oriental Education & Technology Group
Incorporated ADR Commercial Services 3,500 308,910 0.53
PetroChina Company Limited Oil & Gas Services 938,000 594,385 1.02
PICC Property & Casualty Company Limited Insurance 348,000 613,887 1.05
Ping An Insurance Group Company of China
Limited Insurance 279,400 2,144,251 3.68
Shanghai Fosun Pharmaceutical Group Company
Limited Pharmaceuticals 148,000 613,856 1.05
Tencent Holdings Limited Internet 130,600 5,620,836 9.66
Xinjiang Goldwind Science & Technology
Company Limited Electrical Component & Equipment 219,440 274,174 0.47
Zhejiang Expressway Company Limited Commercial Services 296,000 367,935 0.63
39,765,103 68.32
The accompanying notes are an integral part of these financial statements.
China Equity Fund, EUR Investment Grade Credit Fund, Global Long/Short Equity Fund, Global Low Volatility Equity Fund, Global Opportunity Bond Fund, U.S.
Dollar Short-Term Money Market Fund and USD Investment Grade Credit Fund have not been authorised by the Hong Kong Securities and Futures Commission
and are not available for investment by Hong Kong retail investors.
2 Wells Fargo (Lux) Worldwide Fund Portfolio of investments as at 30 September 2017 (unaudited) (continued)
CHINA EQUITY FUND
Industry Shares
MarketValue
USD
% ofNet
Assets
Transferable securities and money market instruments admitted to an official stock exchange listing or dealt in on another regulated market(continued)
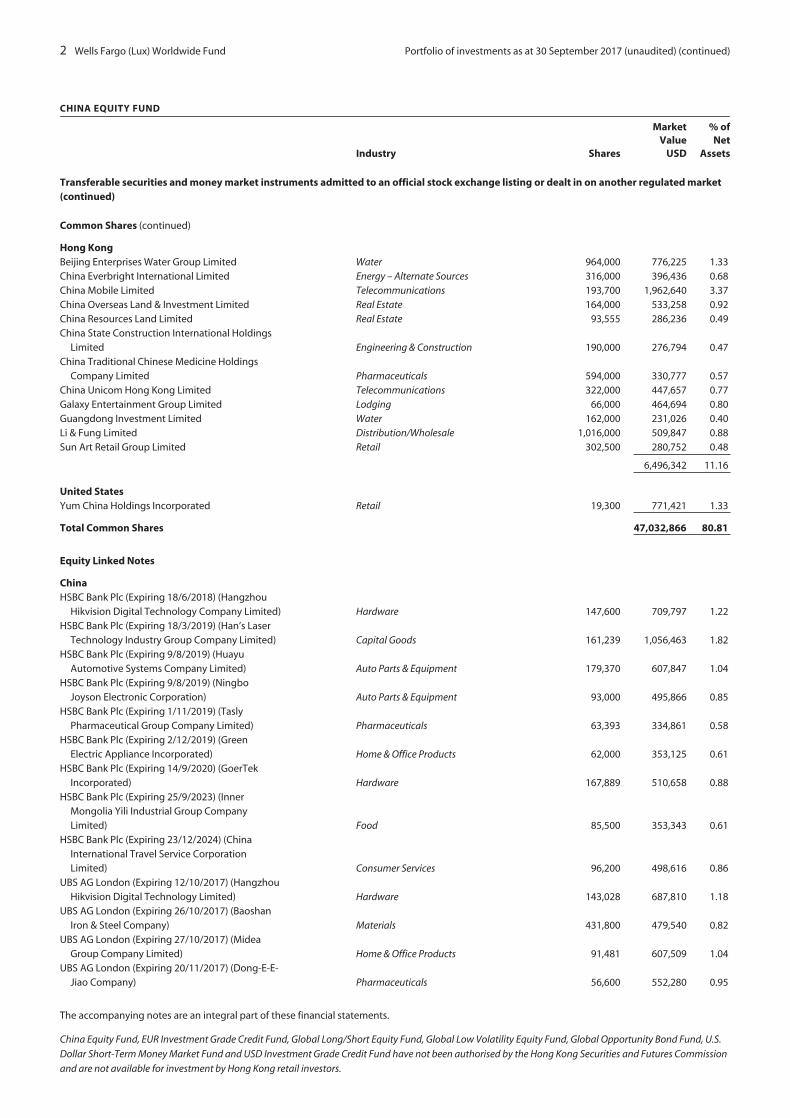
Common Shares (continued)
Hong KongBeijing Enterprises Water Group Limited Water 964,000 776,225 1.33China Everbright International Limited Energy – Alternate Sources 316,000 396,436 0.68China Mobile Limited Telecommunications 193,700 1,962,640 3.37China Overseas Land & Investment Limited Real Estate 164,000 533,258 0.92China Resources Land Limited Real Estate 93,555 286,236 0.49China State Construction International Holdings
Limited Engineering & Construction 190,000 276,794 0.47China Traditional Chinese Medicine Holdings
Company Limited Pharmaceuticals 594,000 330,777 0.57China Unicom Hong Kong Limited Telecommunications 322,000 447,657 0.77Galaxy Entertainment Group Limited Lodging 66,000 464,694 0.80Guangdong Investment Limited Water 162,000 231,026 0.40Li & Fung Limited Distribution/Wholesale 1,016,000 509,847 0.88Sun Art Retail Group Limited Retail 302,500 280,752 0.48
6,496,342 11.16
United StatesYum China Holdings Incorporated Retail 19,300 771,421 1.33
Total Common Shares 47,032,866 80.81
Equity Linked Notes
ChinaHSBC Bank Plc (Expiring 18/6/2018) (Hangzhou
Hikvision Digital Technology Company Limited) Hardware 147,600 709,797 1.22HSBC Bank Plc (Expiring 18/3/2019) (Han’s Laser
Technology Industry Group Company Limited) Capital Goods 161,239 1,056,463 1.82HSBC Bank Plc (Expiring 9/8/2019) (Huayu
Automotive Systems Company Limited) Auto Parts & Equipment 179,370 607,847 1.04HSBC Bank Plc (Expiring 9/8/2019) (Ningbo
Joyson Electronic Corporation) Auto Parts & Equipment 93,000 495,866 0.85HSBC Bank Plc (Expiring 1/11/2019) (Tasly
Pharmaceutical Group Company Limited) Pharmaceuticals 63,393 334,861 0.58HSBC Bank Plc (Expiring 2/12/2019) (Green
Electric Appliance Incorporated) Home & Office Products 62,000 353,125 0.61HSBC Bank Plc (Expiring 14/9/2020) (GoerTek
Incorporated) Hardware 167,889 510,658 0.88HSBC Bank Plc (Expiring 25/9/2023) (Inner
Mongolia Yili Industrial Group CompanyLimited) Food 85,500 353,343 0.61
HSBC Bank Plc (Expiring 23/12/2024) (ChinaInternational Travel Service CorporationLimited) Consumer Services 96,200 498,616 0.86
UBS AG London (Expiring 12/10/2017) (HangzhouHikvision Digital Technology Limited) Hardware 143,028 687,810 1.18
UBS AG London (Expiring 26/10/2017) (BaoshanIron & Steel Company) Materials 431,800 479,540 0.82
UBS AG London (Expiring 27/10/2017) (MideaGroup Company Limited) Home & Office Products 91,481 607,509 1.04
UBS AG London (Expiring 20/11/2017) (Dong-E-E-Jiao Company) Pharmaceuticals 56,600 552,280 0.95
The accompanying notes are an integral part of these financial statements.
China Equity Fund, EUR Investment Grade Credit Fund, Global Long/Short Equity Fund, Global Low Volatility Equity Fund, Global Opportunity Bond Fund, U.S.
Dollar Short-Term Money Market Fund and USD Investment Grade Credit Fund have not been authorised by the Hong Kong Securities and Futures Commission
and are not available for investment by Hong Kong retail investors.
Portfolio of investments as at 30 September 2017 (unaudited) (continued) Wells Fargo (Lux) Worldwide Fund 3
CHINA EQUITY FUND
Industry Shares
MarketValue
USD
% ofNet
Assets
Transferable securities and money market instruments admitted to an official stock exchange listing or dealt in on another regulated market(continued)
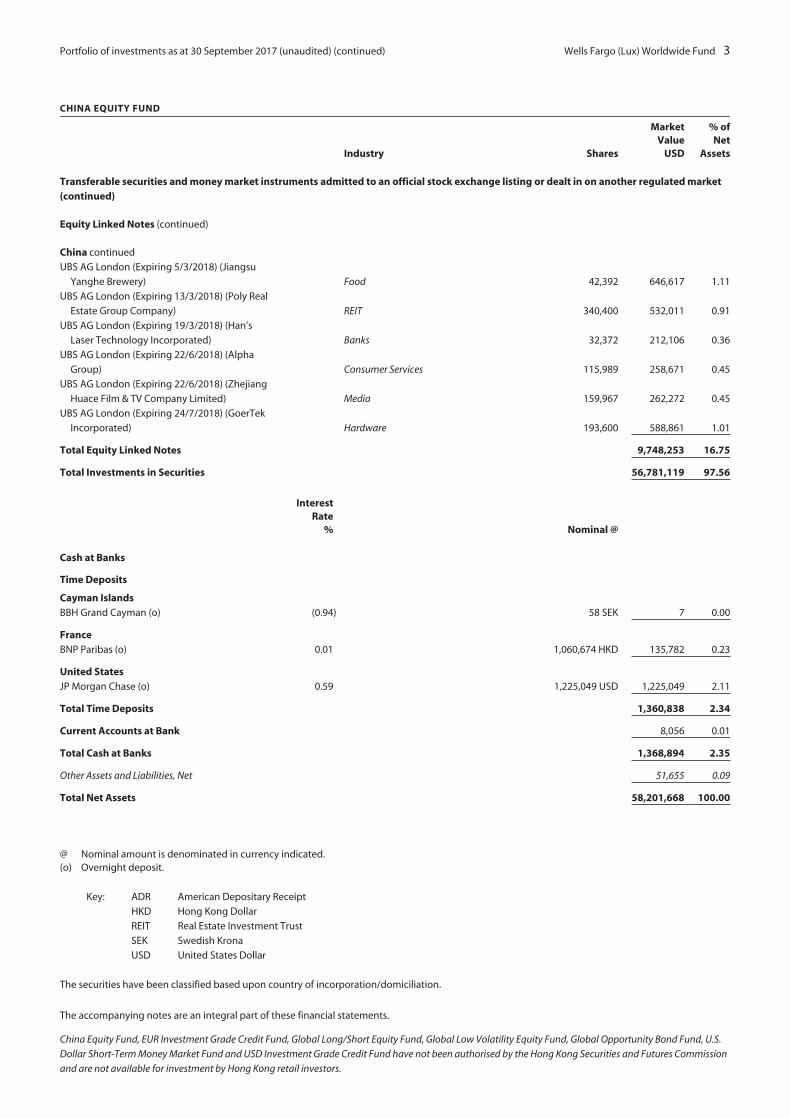
Equity Linked Notes (continued)
China continued
UBS AG London (Expiring 5/3/2018) (Jiangsu
Yanghe Brewery) Food 42,392 646,617 1.11
UBS AG London (Expiring 13/3/2018) (Poly Real
Estate Group Company) REIT 340,400 532,011 0.91
UBS AG London (Expiring 19/3/2018) (Han’s
Laser Technology Incorporated) Banks 32,372 212,106 0.36
UBS AG London (Expiring 22/6/2018) (Alpha
Group) Consumer Services 115,989 258,671 0.45
UBS AG London (Expiring 22/6/2018) (Zhejiang
Huace Film & TV Company Limited) Media 159,967 262,272 0.45
UBS AG London (Expiring 24/7/2018) (GoerTek
Incorporated) Hardware 193,600 588,861 1.01
Total Equity Linked Notes 9,748,253 16.75
Total Investments in Securities 56,781,119 97.56
InterestRate
% Nominal @
Cash at Banks
Time Deposits
Cayman IslandsBBH Grand Cayman (o) (0.94) 58 SEK 7 0.00
FranceBNP Paribas (o) 0.01 1,060,674 HKD 135,782 0.23
United StatesJP Morgan Chase (o) 0.59 1,225,049 USD 1,225,049 2.11
Total Time Deposits 1,360,838 2.34
Current Accounts at Bank 8,056 0.01
Total Cash at Banks 1,368,894 2.35
Other Assets and Liabilities, Net 51,655 0.09
Total Net Assets 58,201,668 100.00
@ Nominal amount is denominated in currency indicated.(o) Overnight deposit.
Key: ADR American Depositary Receipt
HKD Hong Kong Dollar
REIT Real Estate Investment Trust
SEK Swedish Krona
USD United States Dollar
The securities have been classified based upon country of incorporation/domiciliation.
The accompanying notes are an integral part of these financial statements.
China Equity Fund, EUR Investment Grade Credit Fund, Global Long/Short Equity Fund, Global Low Volatility Equity Fund, Global Opportunity Bond Fund, U.S.
Dollar Short-Term Money Market Fund and USD Investment Grade Credit Fund have not been authorised by the Hong Kong Securities and Futures Commission
and are not available for investment by Hong Kong retail investors.

4 Wells Fargo (Lux) Worldwide Fund Portfolio of investments as at 30 September 2017 (unaudited)
EMERGING MARKETS EQUITY FUND
Industry Shares
MarketValue
USD
% ofNet
Assets
Transferable securities and money market instruments admitted to an official stock exchange listing or dealt in on another regulated market
Common Shares
ArgentinaMercadoLibre Incorporated Internet 5,245 1,358,088 0.47
BrazilAmBev SA ADR Beverages 410,700 2,706,513 0.94Atacadao Distribuicao Comercio e Industria
Limiteda Retail 450,000 2,203,716 0.76B2W Compania Digital Internet 319,125 2,130,086 0.74B3 SA – Brasil Bolsa Balcao Diversified Financial Services 496,300 3,753,023 1.30Banco Bradesco SA ADR Banks 257,330 2,848,643 0.99BRF SA ADR Food 111,150 1,601,672 0.55IRB Brasil Resseguros SA Insurance 92,298 881,554 0.30Lojas Renner SA Retail 228,545 2,602,129 0.90Multiplan Empreendimentos Imobiliarios SA Real Estate 58,002 1,342,938 0.46Raia Drogasil SA Retail 53,100 1,257,440 0.43
21,327,714 7.37
ChileBanco Santander Chile ADR Banks 89,400 2,656,074 0.92SACI Falabella Retail 287,447 2,803,243 0.97
5,459,317 1.89
China51job Incorporated ADR Internet 53,020 3,213,542 1.11Alibaba Group Holding Limited ADR Internet 36,218 6,255,211 2.16Baidu Incorporated ADR Internet 9,240 2,288,656 0.79BEST Incorporated ADR Transportation 165,223 1,977,719 0.68China Distance Education Holdings Limited ADR Commercial Services 40,121 268,008 0.09China International Capital Corporation Limited Diversified Financial Services 145,283 295,714 0.10China Life Insurance Company Limited Insurance 1,940,000 5,774,105 2.00China Rapid Finance Limited ADR Internet 75,882 500,062 0.17CNOOC Limited Oil & Gas Services 2,162,000 2,789,820 0.97Ctrip.com International Limited ADR Internet 84,868 4,475,938 1.55Gridsum Holding Incorporated ADR Software 45,700 470,710 0.16Hengan International Group Company Limited Healthcare – Products 369,000 3,415,267 1.18Li Ning Company Limited Retail 2,479,827 2,209,483 0.76New Oriental Education & Technology Group
Incorporated ADR Commercial Services 65,788 5,806,449 2.01Shandong Weigao Group Medical Polymer
Company Limited Healthcare – Products 1,580,000 1,118,516 0.39SINA Corporation Internet 70,223 8,051,067 2.78Tencent Holdings Limited Internet 189,600 8,160,111 2.82Tsingtao Brewery Company Limited Beverages 441,520 1,689,980 0.59Vipshop Holdings Limited ADR Internet 408,592 3,591,524 1.24Want Want China Holdings Limited Food 3,393,000 2,384,604 0.83Weibo Corporation ADR Internet 47,794 4,728,738 1.64ZhongAn Online P&C Insurance Company
Limited Insurance 28,187 228,950 0.08Zhou Hei Ya International Holdings Company
Limited Food 1,472,437 1,425,012 0.49
71,119,186 24.59
ColombiaBancolombia SA ADR Banks 32,500 1,488,175 0.51
The accompanying notes are an integral part of these financial statements.
China Equity Fund, EUR Investment Grade Credit Fund, Global Long/Short Equity Fund, Global Low Volatility Equity Fund, Global Opportunity Bond Fund, U.S.
Dollar Short-Term Money Market Fund and USD Investment Grade Credit Fund have not been authorised by the Hong Kong Securities and Futures Commission
and are not available for investment by Hong Kong retail investors.

Portfolio of investments as at 30 September 2017 (unaudited) (continued) Wells Fargo (Lux) Worldwide Fund 5
EMERGING MARKETS EQUITY FUND
Industry Shares
MarketValue
USD
% ofNet
Assets
Transferable securities and money market instruments admitted to an official stock exchange listing or dealt in on another regulated market(continued)
Common Shares (continued)
Hong KongAIA Group Limited Insurance 680,000 5,014,081 1.73China Mobile Limited Telecommunications 838,000 8,490,924 2.94Johnson Electric Holdings Limited Electrical Components & Equipment 380,825 1,455,224 0.50Sun Art Retail Group Limited Retail 1,867,500 1,733,240 0.60WH Group Limited Food 5,533,000 5,878,936 2.03
22,572,405 7.80
IndiaAU Small Finance Bank Limited Banks 2,474 21,536 0.01Bajaj Finance Limited Diversified Financial Services 33,752 949,753 0.33Bharti Airtel Limited Telecommunications 200,849 1,197,499 0.41Bharti Infratel Limited Telecommunications 207,474 1,265,426 0.44Dalmia Bharat Limited Holding Companies – Diversified 24,362 958,088 0.33Fortis Healthcare Limited Healthcare – Services 300,000 661,359 0.23HDFC Bank Limited ADR Banks 20,361 1,962,189 0.68Housing Development Finance Corporation
Limited Diversified Financial Services 83,400 2,224,362 0.77ICICI Bank Limited ADR Banks 176,632 1,511,970 0.52IndusInd Bank Limited Banks 73,377 1,889,694 0.65Infosys Limited ADR Computers 146,936 2,143,796 0.74ITC Limited Agriculture 741,500 2,932,172 1.01Kotak Mahindra Bank Limited Banks 77,921 1,195,596 0.41Laurus Labs Limited Pharmaceuticals 34,873 270,757 0.09Max Financial Services Limited Insurance 72,844 658,964 0.23PNB Housing Finance Limited Diversified Financial Services 17,437 395,616 0.14Reliance Industries Limited Oil & Gas Services 453,800 5,425,175 1.88SBI Life Insurance Company Limited Insurance 68,076 729,535 0.25SH Kelkar & Company Limited Chemicals 104,002 400,675 0.14
26,794,162 9.26
IndonesiaPT Astra International Tbk Retail 1,817,700 1,066,139 0.37PT Bank Central Asia Tbk Banks 1,044,000 1,573,480 0.54PT Blue Bird Tbk Transportation 1,552,410 562,459 0.20PT Link Net Tbk Internet 2,128,993 817,993 0.28PT Matahari Department Store Tbk Retail 869,100 598,478 0.21PT Telekomunikasi Indonesia Persero Tbk ADR Telecommunications 72,860 2,499,098 0.86
7,117,647 2.46
LuxembourgBiotoscana Investments SA Pharmaceuticals 74,287 567,622 0.20
MalaysiaGenting Bhd Lodging 637,100 1,440,925 0.50Genting Malaysia Bhd Lodging 1,090,900 1,389,945 0.48
2,830,870 0.98
MexicoAmerica Movil SAB de CV ADR Telecommunications 126,560 2,246,440 0.78Becle SAB de CV Beverages 712,998 1,195,769 0.41Cemex SAB de CV ADR Building Materials 147,229 1,336,839 0.46Fibra Uno Administracion SA de CV REIT 2,029,010 3,422,910 1.18Fomento Economico Mexicano SAB de CV ADR Beverages 60,360 5,766,191 2.00Grupo Financiero Banorte SAB de CV Banks 452,544 3,115,620 1.08
The accompanying notes are an integral part of these financial statements.
China Equity Fund, EUR Investment Grade Credit Fund, Global Long/Short Equity Fund, Global Low Volatility Equity Fund, Global Opportunity Bond Fund, U.S.
Dollar Short-Term Money Market Fund and USD Investment Grade Credit Fund have not been authorised by the Hong Kong Securities and Futures Commission
and are not available for investment by Hong Kong retail investors.

6 Wells Fargo (Lux) Worldwide Fund Portfolio of investments as at 30 September 2017 (unaudited) (continued)
EMERGING MARKETS EQUITY FUND
Industry Shares
MarketValue
USD
% ofNet
Assets
Transferable securities and money market instruments admitted to an official stock exchange listing or dealt in on another regulated market(continued)
Common Shares (continued)
Mexico continuedGrupo Financiero Santander Mexico SAB de CV
ADR Banks 131,502 1,326,855 0.46Wal-Mart de Mexico SAB de CV Retail 648,500 1,485,033 0.51
19,895,657 6.88
PeruCompania de Minas Buenaventura SAA ADR Mining 83,030 1,061,954 0.37
PhilippinesAyala Corporation Real Estate 69,652 1,329,982 0.46SM Investments Corporation Retail 84,900 1,475,737 0.51
2,805,719 0.97
PolandPLAY Communications SA Telecommunications 120,345 1,222,908 0.42
RussiaLUKOIL PJSC ADR Oil & Gas Services 33,890 1,793,798 0.62Magnit PJSC GDR Food 32,000 1,310,400 0.45Sberbank of Russia PJSC ADR Banks 118,800 1,691,118 0.58Yandex NV Internet 92,600 3,051,170 1.06
7,846,486 2.71
South AfricaAngloGold Ashanti Limited ADR Mining 74,613 693,155 0.24Clicks Group Limited Retail 50,000 583,621 0.20MTN Group Limited Telecommunications 174,586 1,603,915 0.55Shoprite Holdings Limited Food 209,100 3,195,324 1.10Standard Bank Group Limited Banks 131,208 1,529,383 0.53Steinhoff Africa Retail Limited Retail 350,570 567,593 0.20Tiger Brands Limited Food 94,980 2,647,268 0.92
10,820,259 3.74
South KoreaAmorepacific Corporation Cosmetics/Personal Care 1,800 407,823 0.14KT Corporation ADR Telecommunications 251,426 3,487,279 1.21KT&G Corporation Agriculture 17,057 1,571,147 0.54Naver Corporation Internet 6,100 3,967,783 1.37Netmarble Games Corporation Software 1,805 238,754 0.08Samsung Biologics Company Limited Biotechnology 3,468 1,021,915 0.36Samsung Electronics Company Limited Semiconductors 7,079 15,847,170 5.48Samsung Life Insurance Company Limited Insurance 37,471 3,696,881 1.28SK Hynix Incorporated Semiconductors 66,000 4,777,055 1.65
35,015,807 12.11
Taiwan104 Corporation Commercial Services 157,357 783,568 0.27MediaTek Incorporated Semiconductors 294,880 2,766,566 0.96President Chain Store Corporation Retail 317,000 2,670,937 0.92Taiwan Semiconductor Manufacturing Company
Limited ADR Semiconductors 360,760 13,546,538 4.68Uni-President Enterprises Corporation Food 2,775,071 5,811,140 2.01
25,578,749 8.84
The accompanying notes are an integral part of these financial statements.
China Equity Fund, EUR Investment Grade Credit Fund, Global Long/Short Equity Fund, Global Low Volatility Equity Fund, Global Opportunity Bond Fund, U.S.
Dollar Short-Term Money Market Fund and USD Investment Grade Credit Fund have not been authorised by the Hong Kong Securities and Futures Commission
and are not available for investment by Hong Kong retail investors.

Portfolio of investments as at 30 September 2017 (unaudited) (continued) Wells Fargo (Lux) Worldwide Fund 7
EMERGING MARKETS EQUITY FUND
Industry Shares
MarketValue
USD
% ofNet
Assets
Transferable securities and money market instruments admitted to an official stock exchange listing or dealt in on another regulated market(continued)
Common Shares (continued)
ThailandPTT Exploration & Production PCL Oil & Gas Services 236,957 635,911 0.22PTT PCL Oil & Gas Services 149,430 1,828,109 0.63Siam Commercial Bank PCL Banks 587,700 2,696,195 0.94Thai Beverage PCL Beverages 4,405,850 2,923,267 1.01
8,083,482 2.80
TurkeyAvivaSA Emeklilik ve Hayat AS Insurance 164,962 861,167 0.30
United KingdomStandard Chartered plc Banks 197,681 1,964,443 0.68
Total Common Shares 275,791,817 95.35
DividendYield
%
Preferred Shares
BrazilLojas Americanas SA 0.51 Retail 780,054 4,741,184 1.64
Total Preferred Shares 4,741,184 1.64
Total Investments in Securities 280,533,001 96.99
InterestRate
% Nominal @
Cash at Banks
Time Deposits
FranceBNP Paribas (o) 0.01 3,290,251 HKD 421,201 0.14
Cayman IslandsBBH Grand Cayman (o) 6.25 419,866 ZAR 31,012 0.01
JapanSumitomo Mitsui Banking Corporation (o) 0.59 2,856,291 USD 2,856,291 0.99
Total Time Deposits 3,308,504 1.14
Current Accounts at Bank 5,295,343 1.83
Total Cash at Banks 8,603,847 2.97
Other Assets and Liabilities, Net 119,752 0.04
Total Net Assets 289,256,600 100.00
@ Nominal amount is denominated in currency indicated.(o) Overnight deposit.
Key: ADR American Depositary ReceiptHKD Hong Kong DollarREIT Real Estate Investment TrustUSD United States DollarZAR South African Rand
The securities have been classified based upon country of incorporation/domiciliation.
The accompanying notes are an integral part of these financial statements.
China Equity Fund, EUR Investment Grade Credit Fund, Global Long/Short Equity Fund, Global Low Volatility Equity Fund, Global Opportunity Bond Fund, U.S.
Dollar Short-Term Money Market Fund and USD Investment Grade Credit Fund have not been authorised by the Hong Kong Securities and Futures Commission
and are not available for investment by Hong Kong retail investors.
8 Wells Fargo (Lux) Worldwide Fund Portfolio of investments as at 30 September 2017 (unaudited)
EMERGING MARKETS EQUITY INCOME FUND
Industry Shares
MarketValue
USD
% ofNet
Assets
Transferable securities and money market instruments admitted to an official stock exchange listing or dealt in on another regulated market
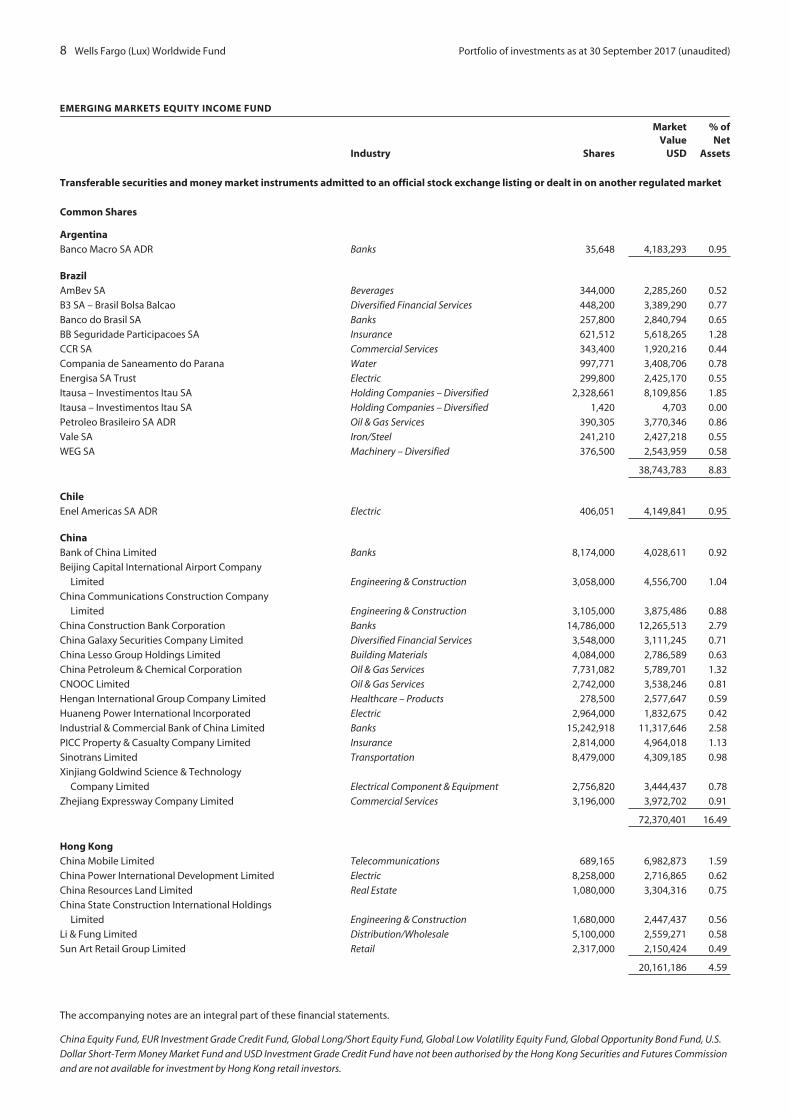
Common Shares
ArgentinaBanco Macro SA ADR Banks 35,648 4,183,293 0.95
BrazilAmBev SA Beverages 344,000 2,285,260 0.52
B3 SA – Brasil Bolsa Balcao Diversified Financial Services 448,200 3,389,290 0.77
Banco do Brasil SA Banks 257,800 2,840,794 0.65
BB Seguridade Participacoes SA Insurance 621,512 5,618,265 1.28
CCR SA Commercial Services 343,400 1,920,216 0.44
Compania de Saneamento do Parana Water 997,771 3,408,706 0.78
Energisa SA Trust Electric 299,800 2,425,170 0.55
Itausa – Investimentos Itau SA Holding Companies – Diversified 2,328,661 8,109,856 1.85
Itausa – Investimentos Itau SA Holding Companies – Diversified 1,420 4,703 0.00
Petroleo Brasileiro SA ADR Oil & Gas Services 390,305 3,770,346 0.86
Vale SA Iron/Steel 241,210 2,427,218 0.55
WEG SA Machinery – Diversified 376,500 2,543,959 0.58
38,743,783 8.83
ChileEnel Americas SA ADR Electric 406,051 4,149,841 0.95
ChinaBank of China Limited Banks 8,174,000 4,028,611 0.92
Beijing Capital International Airport Company
Limited Engineering & Construction 3,058,000 4,556,700 1.04
China Communications Construction Company
Limited Engineering & Construction 3,105,000 3,875,486 0.88
China Construction Bank Corporation Banks 14,786,000 12,265,513 2.79
China Galaxy Securities Company Limited Diversified Financial Services 3,548,000 3,111,245 0.71
China Lesso Group Holdings Limited Building Materials 4,084,000 2,786,589 0.63
China Petroleum & Chemical Corporation Oil & Gas Services 7,731,082 5,789,701 1.32
CNOOC Limited Oil & Gas Services 2,742,000 3,538,246 0.81
Hengan International Group Company Limited Healthcare – Products 278,500 2,577,647 0.59
Huaneng Power International Incorporated Electric 2,964,000 1,832,675 0.42
Industrial & Commercial Bank of China Limited Banks 15,242,918 11,317,646 2.58
PICC Property & Casualty Company Limited Insurance 2,814,000 4,964,018 1.13
Sinotrans Limited Transportation 8,479,000 4,309,185 0.98
Xinjiang Goldwind Science & Technology
Company Limited Electrical Component & Equipment 2,756,820 3,444,437 0.78
Zhejiang Expressway Company Limited Commercial Services 3,196,000 3,972,702 0.91
72,370,401 16.49
Hong KongChina Mobile Limited Telecommunications 689,165 6,982,873 1.59
China Power International Development Limited Electric 8,258,000 2,716,865 0.62
China Resources Land Limited Real Estate 1,080,000 3,304,316 0.75
China State Construction International Holdings
Limited Engineering & Construction 1,680,000 2,447,437 0.56
Li & Fung Limited Distribution/Wholesale 5,100,000 2,559,271 0.58
Sun Art Retail Group Limited Retail 2,317,000 2,150,424 0.49
20,161,186 4.59
The accompanying notes are an integral part of these financial statements.
China Equity Fund, EUR Investment Grade Credit Fund, Global Long/Short Equity Fund, Global Low Volatility Equity Fund, Global Opportunity Bond Fund, U.S.
Dollar Short-Term Money Market Fund and USD Investment Grade Credit Fund have not been authorised by the Hong Kong Securities and Futures Commission
and are not available for investment by Hong Kong retail investors.
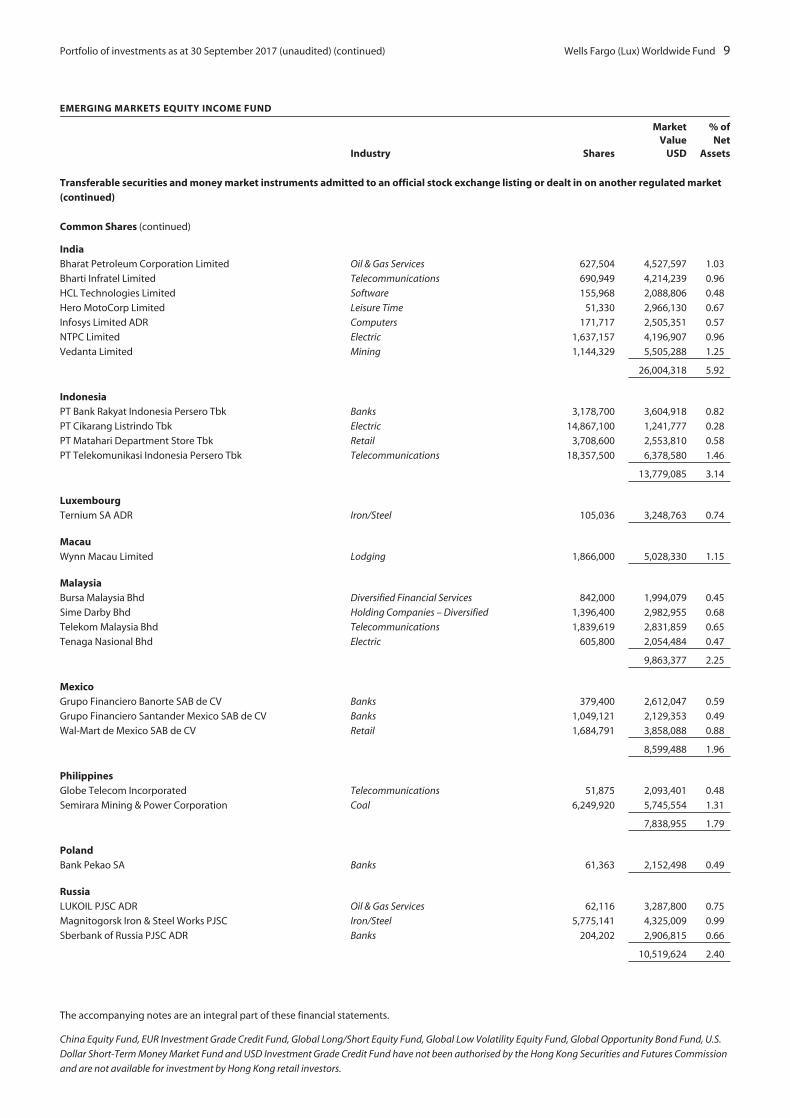
Portfolio of investments as at 30 September 2017 (unaudited) (continued) Wells Fargo (Lux) Worldwide Fund 9
EMERGING MARKETS EQUITY INCOME FUND
Industry Shares
MarketValue
USD
% ofNet
Assets
Transferable securities and money market instruments admitted to an official stock exchange listing or dealt in on another regulated market(continued)
Common Shares (continued)
IndiaBharat Petroleum Corporation Limited Oil & Gas Services 627,504 4,527,597 1.03
Bharti Infratel Limited Telecommunications 690,949 4,214,239 0.96
HCL Technologies Limited Software 155,968 2,088,806 0.48
Hero MotoCorp Limited Leisure Time 51,330 2,966,130 0.67
Infosys Limited ADR Computers 171,717 2,505,351 0.57
NTPC Limited Electric 1,637,157 4,196,907 0.96
Vedanta Limited Mining 1,144,329 5,505,288 1.25
26,004,318 5.92
IndonesiaPT Bank Rakyat Indonesia Persero Tbk Banks 3,178,700 3,604,918 0.82
PT Cikarang Listrindo Tbk Electric 14,867,100 1,241,777 0.28
PT Matahari Department Store Tbk Retail 3,708,600 2,553,810 0.58
PT Telekomunikasi Indonesia Persero Tbk Telecommunications 18,357,500 6,378,580 1.46
13,779,085 3.14
LuxembourgTernium SA ADR Iron/Steel 105,036 3,248,763 0.74
MacauWynn Macau Limited Lodging 1,866,000 5,028,330 1.15
MalaysiaBursa Malaysia Bhd Diversified Financial Services 842,000 1,994,079 0.45
Sime Darby Bhd Holding Companies – Diversified 1,396,400 2,982,955 0.68
Telekom Malaysia Bhd Telecommunications 1,839,619 2,831,859 0.65
Tenaga Nasional Bhd Electric 605,800 2,054,484 0.47
9,863,377 2.25
MexicoGrupo Financiero Banorte SAB de CV Banks 379,400 2,612,047 0.59
Grupo Financiero Santander Mexico SAB de CV Banks 1,049,121 2,129,353 0.49
Wal-Mart de Mexico SAB de CV Retail 1,684,791 3,858,088 0.88
8,599,488 1.96
PhilippinesGlobe Telecom Incorporated Telecommunications 51,875 2,093,401 0.48
Semirara Mining & Power Corporation Coal 6,249,920 5,745,554 1.31
7,838,955 1.79
PolandBank Pekao SA Banks 61,363 2,152,498 0.49
RussiaLUKOIL PJSC ADR Oil & Gas Services 62,116 3,287,800 0.75
Magnitogorsk Iron & Steel Works PJSC Iron/Steel 5,775,141 4,325,009 0.99
Sberbank of Russia PJSC ADR Banks 204,202 2,906,815 0.66
10,519,624 2.40
The accompanying notes are an integral part of these financial statements.
China Equity Fund, EUR Investment Grade Credit Fund, Global Long/Short Equity Fund, Global Low Volatility Equity Fund, Global Opportunity Bond Fund, U.S.
Dollar Short-Term Money Market Fund and USD Investment Grade Credit Fund have not been authorised by the Hong Kong Securities and Futures Commission
and are not available for investment by Hong Kong retail investors.

10 Wells Fargo (Lux) Worldwide Fund Portfolio of investments as at 30 September 2017 (unaudited) (continued)
EMERGING MARKETS EQUITY INCOME FUND
Industry Shares
MarketValue
USD
% ofNet
Assets
Transferable securities and money market instruments admitted to an official stock exchange listing or dealt in on another regulated market(continued)
Common Shares (continued)
SingaporeCapitaLand Retail China Trust REIT 1,793,139 2,121,706 0.49Jardine Cycle & Carriage Limited Distribution/Wholesale 89,400 2,592,795 0.59Singapore Telecommunications Limited Telecommunications 1,587,800 4,307,644 0.98
9,022,145 2.06
South AfricaBarclays Africa Group Limited Banks 411,119 4,220,887 0.96Foschini Group Limited Retail 194,707 1,952,283 0.45Life Healthcare Group Holdings Limited Healthcare – Services 1,133,841 1,984,824 0.45MTN Group Limited Telecommunications 461,894 4,243,403 0.97Sanlam Limited Insurance 841,738 4,206,592 0.96Sasol Limited Oil & Gas Services 72,823 1,995,556 0.45
18,603,545 4.24
South KoreaCoway Company Limited Home Furnishings 35,670 2,927,472 0.67Hana Financial Group Incorporated Diversified Financial Services 80,810 3,340,772 0.76Hyundai Motor Company Auto Manufacturers 23,960 3,148,365 0.72KB Financial Group Incorporated Diversified Financial Services 92,863 4,548,491 1.04Korea Electric Power Corporation Electric 131,765 4,486,694 1.02Korean Reinsurance Company Insurance 329,540 3,265,621 0.74Samsung Electronics Company Limited Semiconductors 8,902 19,928,169 4.54Shinhan Financial Group Company Limited Diversified Financial Services 74,388 3,266,876 0.74SK Telecom Company Limited Telecommunications 26,817 5,970,520 1.36S-Oil Corporation Oil & Gas Services 46,072 5,128,720 1.17
56,011,700 12.76
TaiwanCathay Financial Holding Company Limited Insurance 1,928,000 3,064,556 0.70Chicony Electronics Company Limited Computers 1,192,935 2,832,454 0.64CTBC Financial Holding Company Limited Diversified Financial Services 3,751,412 2,350,509 0.53CTCI Corporation Engineering & Construction 1,243,000 1,996,244 0.45Formosa Plastics Corporation Chemicals 694,000 2,100,950 0.48Hon Hai Precision Industry Company Limited Electronics 1,939,500 6,715,720 1.53Novatek Microelectronics Corporation Semiconductors 527,000 1,981,203 0.45Siliconware Precision Industries Company
Limited Semiconductors 1,201,000 1,920,871 0.44Taiwan Semiconductor Manufacturing Company
Limited Semiconductors 1,800,000 12,851,207 2.93Teco Electric & Machinery Company Limited Machinery – Diversified 1,696,000 1,518,480 0.35Uni-President Enterprises Corporation Food 1,636,000 3,425,867 0.78United Microelectronics Corporation Semiconductors 5,065,000 2,530,496 0.58
43,288,557 9.86
ThailandCharoen Pokphand Foods PCL Food 3,770,000 3,023,913 0.69Intouch Holdings PCL Telecommunications 1,328,200 2,290,000 0.52Land & Houses PCL Home Builders 14,565,100 4,323,673 0.99Major Cineplex Group PCL Entertainment 2,212,200 2,023,151 0.46Thai Beverage PCL Beverages 4,637,300 3,076,833 0.70
14,737,570 3.36
The accompanying notes are an integral part of these financial statements.
China Equity Fund, EUR Investment Grade Credit Fund, Global Long/Short Equity Fund, Global Low Volatility Equity Fund, Global Opportunity Bond Fund, U.S.
Dollar Short-Term Money Market Fund and USD Investment Grade Credit Fund have not been authorised by the Hong Kong Securities and Futures Commission
and are not available for investment by Hong Kong retail investors.
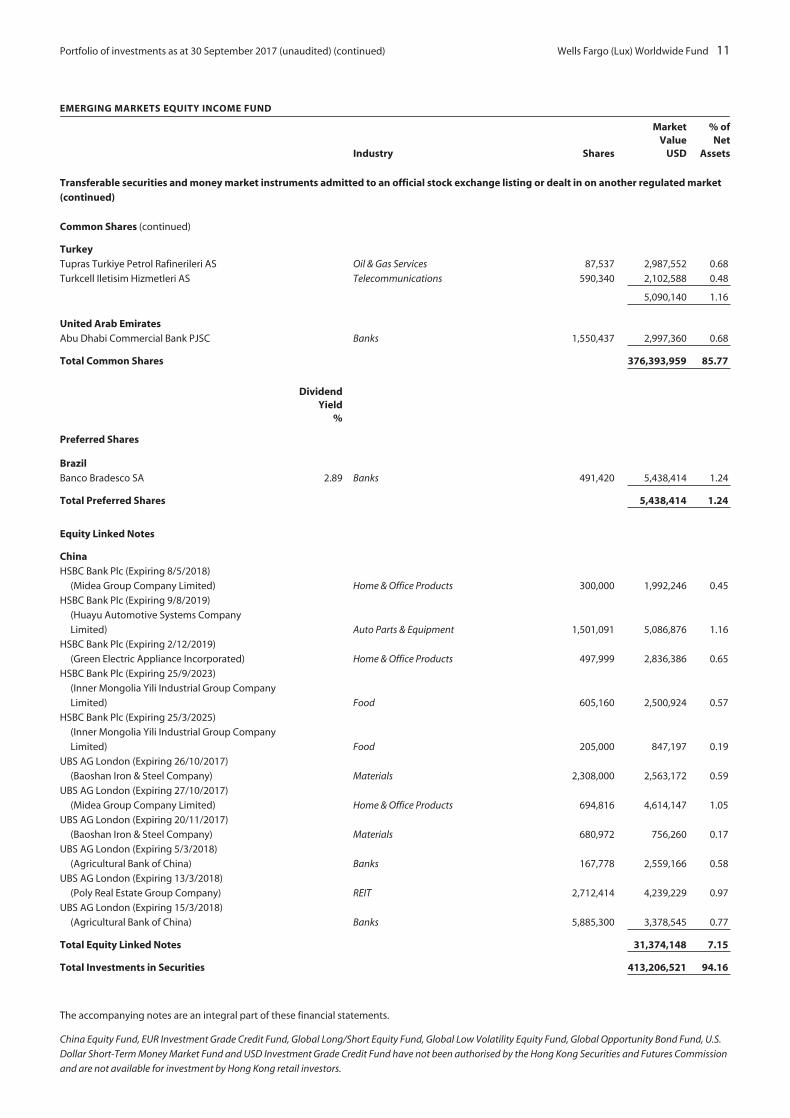
Portfolio of investments as at 30 September 2017 (unaudited) (continued) Wells Fargo (Lux) Worldwide Fund 11
EMERGING MARKETS EQUITY INCOME FUND
Industry Shares
MarketValue
USD
% ofNet
Assets
Transferable securities and money market instruments admitted to an official stock exchange listing or dealt in on another regulated market(continued)
Common Shares (continued)
TurkeyTupras Turkiye Petrol Rafinerileri AS Oil & Gas Services 87,537 2,987,552 0.68
Turkcell Iletisim Hizmetleri AS Telecommunications 590,340 2,102,588 0.48
5,090,140 1.16
United Arab EmiratesAbu Dhabi Commercial Bank PJSC Banks 1,550,437 2,997,360 0.68
Total Common Shares 376,393,959 85.77
DividendYield
%
Preferred Shares
BrazilBanco Bradesco SA 2.89 Banks 491,420 5,438,414 1.24
Total Preferred Shares 5,438,414 1.24
Equity Linked Notes
ChinaHSBC Bank Plc (Expiring 8/5/2018)
(Midea Group Company Limited) Home & Office Products 300,000 1,992,246 0.45
HSBC Bank Plc (Expiring 9/8/2019)
(Huayu Automotive Systems Company
Limited) Auto Parts & Equipment 1,501,091 5,086,876 1.16
HSBC Bank Plc (Expiring 2/12/2019)
(Green Electric Appliance Incorporated) Home & Office Products 497,999 2,836,386 0.65
HSBC Bank Plc (Expiring 25/9/2023)
(Inner Mongolia Yili Industrial Group Company
Limited) Food 605,160 2,500,924 0.57
HSBC Bank Plc (Expiring 25/3/2025)
(Inner Mongolia Yili Industrial Group Company
Limited) Food 205,000 847,197 0.19
UBS AG London (Expiring 26/10/2017)
(Baoshan Iron & Steel Company) Materials 2,308,000 2,563,172 0.59
UBS AG London (Expiring 27/10/2017)
(Midea Group Company Limited) Home & Office Products 694,816 4,614,147 1.05
UBS AG London (Expiring 20/11/2017)
(Baoshan Iron & Steel Company) Materials 680,972 756,260 0.17
UBS AG London (Expiring 5/3/2018)
(Agricultural Bank of China) Banks 167,778 2,559,166 0.58
UBS AG London (Expiring 13/3/2018)
(Poly Real Estate Group Company) REIT 2,712,414 4,239,229 0.97
UBS AG London (Expiring 15/3/2018)
(Agricultural Bank of China) Banks 5,885,300 3,378,545 0.77
Total Equity Linked Notes 31,374,148 7.15
Total Investments in Securities 413,206,521 94.16
The accompanying notes are an integral part of these financial statements.
China Equity Fund, EUR Investment Grade Credit Fund, Global Long/Short Equity Fund, Global Low Volatility Equity Fund, Global Opportunity Bond Fund, U.S.
Dollar Short-Term Money Market Fund and USD Investment Grade Credit Fund have not been authorised by the Hong Kong Securities and Futures Commission
and are not available for investment by Hong Kong retail investors.
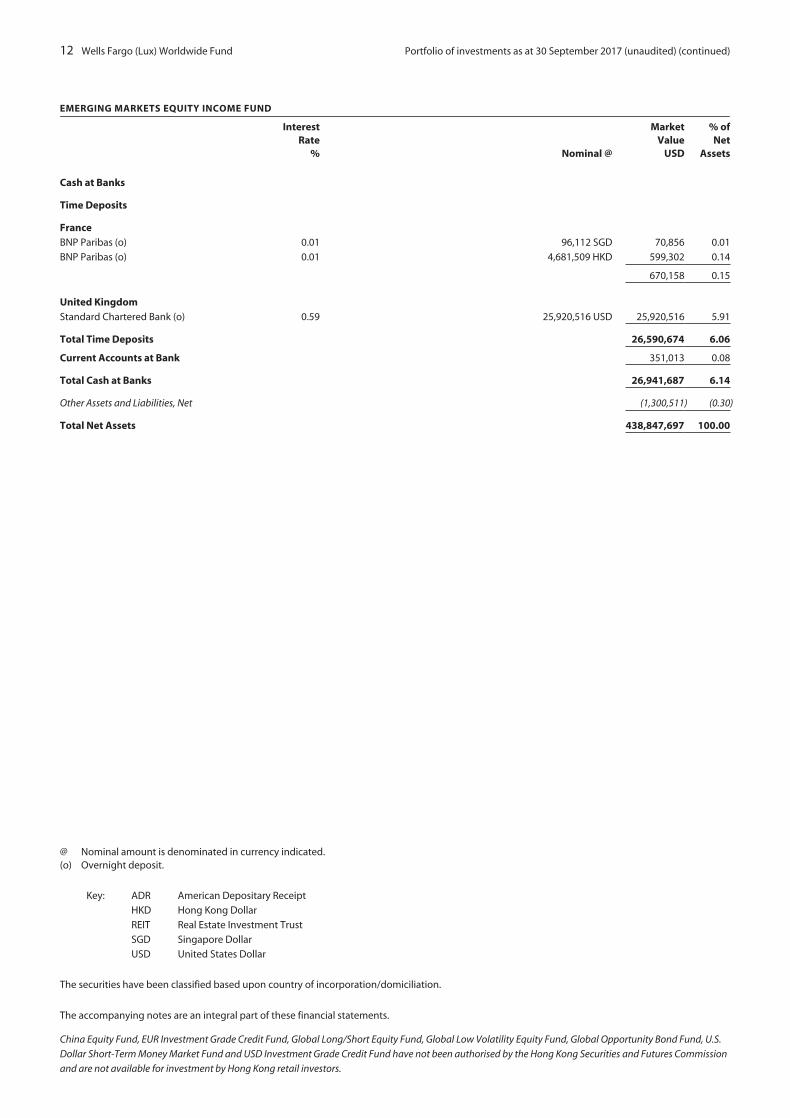
12 Wells Fargo (Lux) Worldwide Fund Portfolio of investments as at 30 September 2017 (unaudited) (continued)
EMERGING MARKETS EQUITY INCOME FUND
InterestRate
% Nominal @
MarketValue
USD
% ofNet
Assets
Cash at Banks
Time Deposits
FranceBNP Paribas (o) 0.01 96,112 SGD 70,856 0.01
BNP Paribas (o) 0.01 4,681,509 HKD 599,302 0.14
670,158 0.15
United KingdomStandard Chartered Bank (o) 0.59 25,920,516 USD 25,920,516 5.91
Total Time Deposits 26,590,674 6.06
Current Accounts at Bank 351,013 0.08
Total Cash at Banks 26,941,687 6.14
Other Assets and Liabilities, Net (1,300,511) (0.30)
Total Net Assets 438,847,697 100.00
@ Nominal amount is denominated in currency indicated.(o) Overnight deposit.
Key: ADR American Depositary Receipt
HKD Hong Kong Dollar
REIT Real Estate Investment Trust
SGD Singapore Dollar
USD United States Dollar
The securities have been classified based upon country of incorporation/domiciliation.
The accompanying notes are an integral part of these financial statements.
China Equity Fund, EUR Investment Grade Credit Fund, Global Long/Short Equity Fund, Global Low Volatility Equity Fund, Global Opportunity Bond Fund, U.S.
Dollar Short-Term Money Market Fund and USD Investment Grade Credit Fund have not been authorised by the Hong Kong Securities and Futures Commission
and are not available for investment by Hong Kong retail investors.
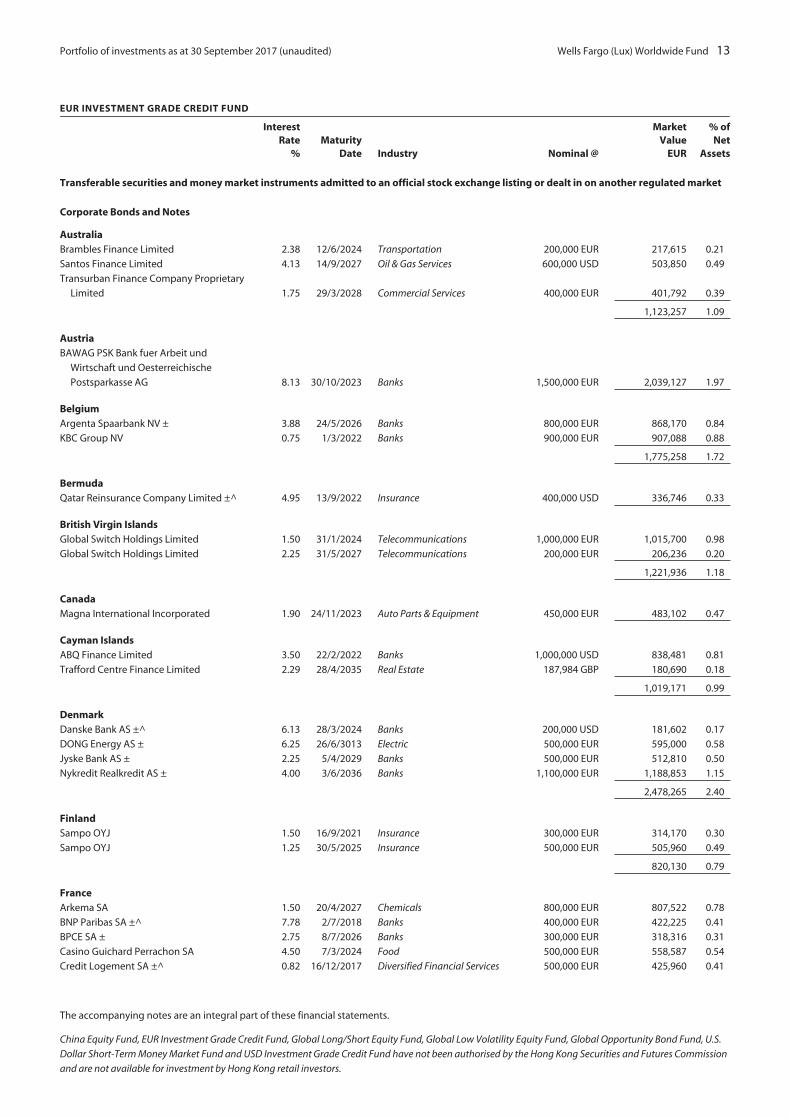
Portfolio of investments as at 30 September 2017 (unaudited) Wells Fargo (Lux) Worldwide Fund 13
EUR INVESTMENT GRADE CREDIT FUND
InterestRate
%Maturity
Date Industry Nominal @
MarketValue
EUR
% ofNet
Assets
Transferable securities and money market instruments admitted to an official stock exchange listing or dealt in on another regulated market
Corporate Bonds and Notes
AustraliaBrambles Finance Limited 2.38 12/6/2024 Transportation 200,000 EUR 217,615 0.21
Santos Finance Limited 4.13 14/9/2027 Oil & Gas Services 600,000 USD 503,850 0.49
Transurban Finance Company Proprietary
Limited 1.75 29/3/2028 Commercial Services 400,000 EUR 401,792 0.39
1,123,257 1.09
AustriaBAWAG PSK Bank fuer Arbeit und
Wirtschaft und Oesterreichische
Postsparkasse AG 8.13 30/10/2023 Banks 1,500,000 EUR 2,039,127 1.97
BelgiumArgenta Spaarbank NV ± 3.88 24/5/2026 Banks 800,000 EUR 868,170 0.84
KBC Group NV 0.75 1/3/2022 Banks 900,000 EUR 907,088 0.88
1,775,258 1.72
BermudaQatar Reinsurance Company Limited ±^ 4.95 13/9/2022 Insurance 400,000 USD 336,746 0.33
British Virgin IslandsGlobal Switch Holdings Limited 1.50 31/1/2024 Telecommunications 1,000,000 EUR 1,015,700 0.98
Global Switch Holdings Limited 2.25 31/5/2027 Telecommunications 200,000 EUR 206,236 0.20
1,221,936 1.18
CanadaMagna International Incorporated 1.90 24/11/2023 Auto Parts & Equipment 450,000 EUR 483,102 0.47
Cayman IslandsABQ Finance Limited 3.50 22/2/2022 Banks 1,000,000 USD 838,481 0.81
Trafford Centre Finance Limited 2.29 28/4/2035 Real Estate 187,984 GBP 180,690 0.18
1,019,171 0.99
DenmarkDanske Bank AS ±^ 6.13 28/3/2024 Banks 200,000 USD 181,602 0.17
DONG Energy AS ± 6.25 26/6/3013 Electric 500,000 EUR 595,000 0.58
Jyske Bank AS ± 2.25 5/4/2029 Banks 500,000 EUR 512,810 0.50
Nykredit Realkredit AS ± 4.00 3/6/2036 Banks 1,100,000 EUR 1,188,853 1.15
2,478,265 2.40
FinlandSampo OYJ 1.50 16/9/2021 Insurance 300,000 EUR 314,170 0.30
Sampo OYJ 1.25 30/5/2025 Insurance 500,000 EUR 505,960 0.49
820,130 0.79
FranceArkema SA 1.50 20/4/2027 Chemicals 800,000 EUR 807,522 0.78
BNP Paribas SA ±^ 7.78 2/7/2018 Banks 400,000 EUR 422,225 0.41
BPCE SA ± 2.75 8/7/2026 Banks 300,000 EUR 318,316 0.31
Casino Guichard Perrachon SA 4.50 7/3/2024 Food 500,000 EUR 558,587 0.54
Credit Logement SA ±^ 0.82 16/12/2017 Diversified Financial Services 500,000 EUR 425,960 0.41
The accompanying notes are an integral part of these financial statements.
China Equity Fund, EUR Investment Grade Credit Fund, Global Long/Short Equity Fund, Global Low Volatility Equity Fund, Global Opportunity Bond Fund, U.S.
Dollar Short-Term Money Market Fund and USD Investment Grade Credit Fund have not been authorised by the Hong Kong Securities and Futures Commission
and are not available for investment by Hong Kong retail investors.

14 Wells Fargo (Lux) Worldwide Fund Portfolio of investments as at 30 September 2017 (unaudited) (continued)
EUR INVESTMENT GRADE CREDIT FUND
InterestRate
%Maturity
Date Industry Nominal @
MarketValue
EUR
% ofNet
Assets
Transferable securities and money market instruments admitted to an official stock exchange listing or dealt in on another regulated market(continued)
Corporate Bonds and Notes (continued)
France continued
Edenred 1.38 10/3/2025 Commercial Services 500,000 EUR 507,811 0.49
Edenred 1.88 30/3/2027 Commercial Services 400,000 EUR 411,510 0.40
Gecina SA 1.38 26/1/2028 REIT 700,000 EUR 690,182 0.67
Imerys SA 2.00 10/12/2024 Building Materials 300,000 EUR 319,578 0.31
La Mondiale SAM ±^ 5.05 17/12/2025 Insurance 500,000 EUR 567,500 0.55
RCI Banque SA 1.00 17/5/2023 Auto Manufacturers 600,000 EUR 604,230 0.58
TDF Infrastructure SAS 2.88 19/10/2022 Media 400,000 EUR 435,160 0.42
TDF Infrastructure SAS 2.50 7/4/2026 Media 700,000 EUR 728,735 0.70
TOTAL SA ±^ 3.37 6/10/2026 Oil & Gas Services 500,000 EUR 522,395 0.51
7,319,711 7.08
GermanyAllianz SE ^ 5.50 26/9/2018 Insurance 200,000 USD 173,020 0.17
Bayer AG ± 2.38 2/4/2075 Pharmaceuticals 800,000 EUR 819,190 0.79
Deutsche Bank AG 0.47 16/5/2022 Banks 900,000 EUR 910,737 0.88
HeidelbergCement AG 2.25 30/3/2023 Building Materials 500,000 EUR 538,995 0.52
HeidelbergCement AG 1.50 7/2/2025 Building Materials 400,000 EUR 409,202 0.40
Landesbank Baden-Wuerttemberg ± 2.88 27/5/2026 Banks 1,000,000 EUR 1,041,850 1.01
3,892,994 3.77
GuernseyGlobalworth Real Estate Investments
Limited 2.88 20/6/2022 REIT 600,000 EUR 612,755 0.59
IcelandArion Banki HF 3.13 12/3/2018 Banks 267,000 EUR 270,610 0.26
Islandsbanki HF 1.75 7/9/2020 Banks 625,000 EUR 645,206 0.63
Landsbankinn HF 1.38 14/3/2022 Banks 400,000 EUR 405,828 0.39
1,321,644 1.28
IrelandAllied Irish Banks plc 2.75 16/4/2019 Banks 500,000 EUR 521,100 0.50
Bank of Ireland Group plc ± 4.13 19/9/2027 Banks 400,000 USD 335,423 0.33
Borets Finance DAC 6.50 7/4/2022 Oil & Gas Services 200,000 USD 181,064 0.18
FCA Bank SpA 2.63 17/4/2019 Diversified Financial Services 400,000 EUR 415,732 0.40
FCA Bank SpA 2.00 23/10/2019 Diversified Financial Services 650,000 EUR 674,435 0.65
FCA Bank SpA 1.25 23/9/2020 Diversified Financial Services 300,000 EUR 307,855 0.30
Novolipetsk Steel via Steel Funding DAC 4.50 15/6/2023 Iron/Steel 500,000 USD 436,048 0.42
Sibur Securities DAC 4.13 5/10/2023 Oil & Gas Services 700,000 USD 592,267 0.57
3,463,924 3.35
ItalyAtlantia SpA 1.88 13/7/2027 Commercial Services 800,000 EUR 802,901 0.78
ENI SpA 1.00 14/3/2025 Oil & Gas Services 600,000 EUR 595,537 0.58
Intesa Sanpaolo SpA 1.13 4/3/2022 Banks 550,000 EUR 561,580 0.54
Intesa Sanpaolo SpA 1.38 18/1/2024 Banks 750,000 EUR 763,712 0.74
Mediobanca SpA 0.63 27/9/2022 Banks 500,000 EUR 496,000 0.48
Terna Rete Elettrica Nazionale SpA 1.38 26/7/2027 Electric 400,000 EUR 398,484 0.38
UniCredit SpA ± 6.38 2/5/2023 Banks 212,000 USD 183,290 0.18
3,801,504 3.68
The accompanying notes are an integral part of these financial statements.
China Equity Fund, EUR Investment Grade Credit Fund, Global Long/Short Equity Fund, Global Low Volatility Equity Fund, Global Opportunity Bond Fund, U.S.
Dollar Short-Term Money Market Fund and USD Investment Grade Credit Fund have not been authorised by the Hong Kong Securities and Futures Commission
and are not available for investment by Hong Kong retail investors.
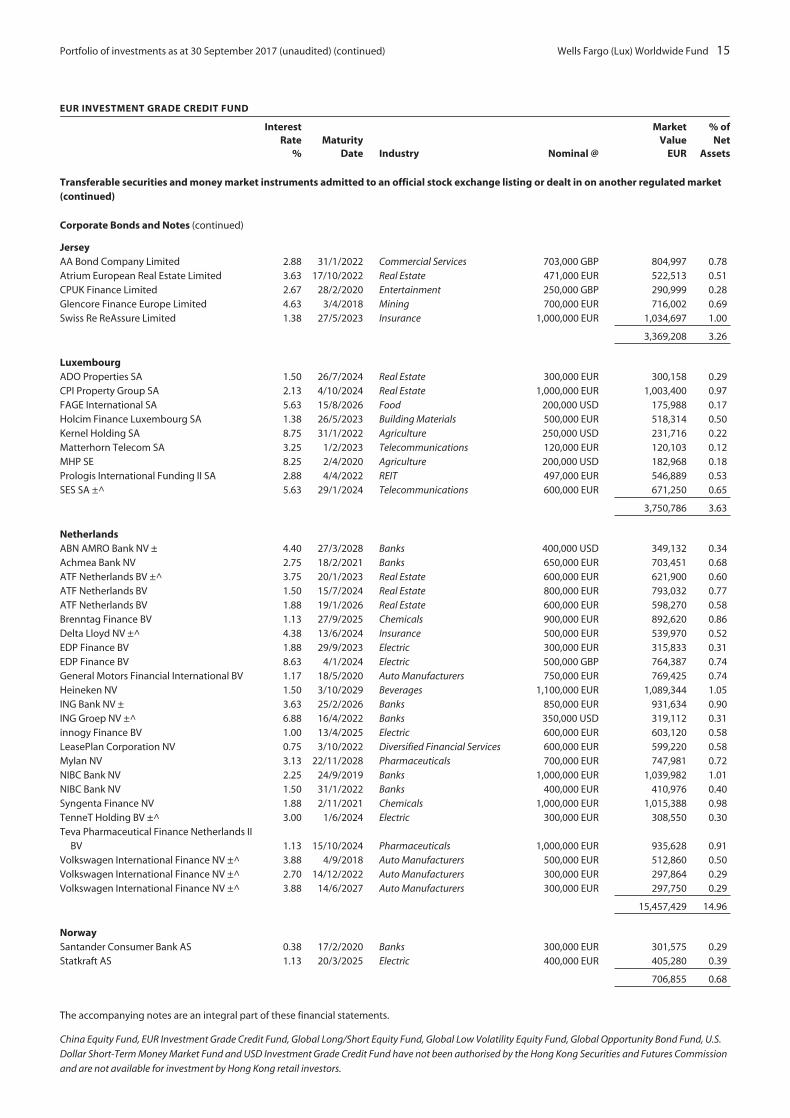
Portfolio of investments as at 30 September 2017 (unaudited) (continued) Wells Fargo (Lux) Worldwide Fund 15
EUR INVESTMENT GRADE CREDIT FUND
InterestRate
%Maturity
Date Industry Nominal @
MarketValue
EUR
% ofNet
Assets
Transferable securities and money market instruments admitted to an official stock exchange listing or dealt in on another regulated market(continued)
Corporate Bonds and Notes (continued)
JerseyAA Bond Company Limited 2.88 31/1/2022 Commercial Services 703,000 GBP 804,997 0.78Atrium European Real Estate Limited 3.63 17/10/2022 Real Estate 471,000 EUR 522,513 0.51CPUK Finance Limited 2.67 28/2/2020 Entertainment 250,000 GBP 290,999 0.28Glencore Finance Europe Limited 4.63 3/4/2018 Mining 700,000 EUR 716,002 0.69Swiss Re ReAssure Limited 1.38 27/5/2023 Insurance 1,000,000 EUR 1,034,697 1.00
3,369,208 3.26
LuxembourgADO Properties SA 1.50 26/7/2024 Real Estate 300,000 EUR 300,158 0.29CPI Property Group SA 2.13 4/10/2024 Real Estate 1,000,000 EUR 1,003,400 0.97FAGE International SA 5.63 15/8/2026 Food 200,000 USD 175,988 0.17Holcim Finance Luxembourg SA 1.38 26/5/2023 Building Materials 500,000 EUR 518,314 0.50Kernel Holding SA 8.75 31/1/2022 Agriculture 250,000 USD 231,716 0.22Matterhorn Telecom SA 3.25 1/2/2023 Telecommunications 120,000 EUR 120,103 0.12MHP SE 8.25 2/4/2020 Agriculture 200,000 USD 182,968 0.18Prologis International Funding II SA 2.88 4/4/2022 REIT 497,000 EUR 546,889 0.53SES SA ±^ 5.63 29/1/2024 Telecommunications 600,000 EUR 671,250 0.65
3,750,786 3.63
NetherlandsABN AMRO Bank NV ± 4.40 27/3/2028 Banks 400,000 USD 349,132 0.34Achmea Bank NV 2.75 18/2/2021 Banks 650,000 EUR 703,451 0.68ATF Netherlands BV ±^ 3.75 20/1/2023 Real Estate 600,000 EUR 621,900 0.60ATF Netherlands BV 1.50 15/7/2024 Real Estate 800,000 EUR 793,032 0.77ATF Netherlands BV 1.88 19/1/2026 Real Estate 600,000 EUR 598,270 0.58Brenntag Finance BV 1.13 27/9/2025 Chemicals 900,000 EUR 892,620 0.86Delta Lloyd NV ±^ 4.38 13/6/2024 Insurance 500,000 EUR 539,970 0.52EDP Finance BV 1.88 29/9/2023 Electric 300,000 EUR 315,833 0.31EDP Finance BV 8.63 4/1/2024 Electric 500,000 GBP 764,387 0.74General Motors Financial International BV 1.17 18/5/2020 Auto Manufacturers 750,000 EUR 769,425 0.74Heineken NV 1.50 3/10/2029 Beverages 1,100,000 EUR 1,089,344 1.05ING Bank NV ± 3.63 25/2/2026 Banks 850,000 EUR 931,634 0.90ING Groep NV ±^ 6.88 16/4/2022 Banks 350,000 USD 319,112 0.31innogy Finance BV 1.00 13/4/2025 Electric 600,000 EUR 603,120 0.58LeasePlan Corporation NV 0.75 3/10/2022 Diversified Financial Services 600,000 EUR 599,220 0.58Mylan NV 3.13 22/11/2028 Pharmaceuticals 700,000 EUR 747,981 0.72NIBC Bank NV 2.25 24/9/2019 Banks 1,000,000 EUR 1,039,982 1.01NIBC Bank NV 1.50 31/1/2022 Banks 400,000 EUR 410,976 0.40Syngenta Finance NV 1.88 2/11/2021 Chemicals 1,000,000 EUR 1,015,388 0.98TenneT Holding BV ±^ 3.00 1/6/2024 Electric 300,000 EUR 308,550 0.30Teva Pharmaceutical Finance Netherlands II
BV 1.13 15/10/2024 Pharmaceuticals 1,000,000 EUR 935,628 0.91Volkswagen International Finance NV ±^ 3.88 4/9/2018 Auto Manufacturers 500,000 EUR 512,860 0.50Volkswagen International Finance NV ±^ 2.70 14/12/2022 Auto Manufacturers 300,000 EUR 297,864 0.29Volkswagen International Finance NV ±^ 3.88 14/6/2027 Auto Manufacturers 300,000 EUR 297,750 0.29
15,457,429 14.96
NorwaySantander Consumer Bank AS 0.38 17/2/2020 Banks 300,000 EUR 301,575 0.29Statkraft AS 1.13 20/3/2025 Electric 400,000 EUR 405,280 0.39
706,855 0.68
The accompanying notes are an integral part of these financial statements.
China Equity Fund, EUR Investment Grade Credit Fund, Global Long/Short Equity Fund, Global Low Volatility Equity Fund, Global Opportunity Bond Fund, U.S.
Dollar Short-Term Money Market Fund and USD Investment Grade Credit Fund have not been authorised by the Hong Kong Securities and Futures Commission
and are not available for investment by Hong Kong retail investors.
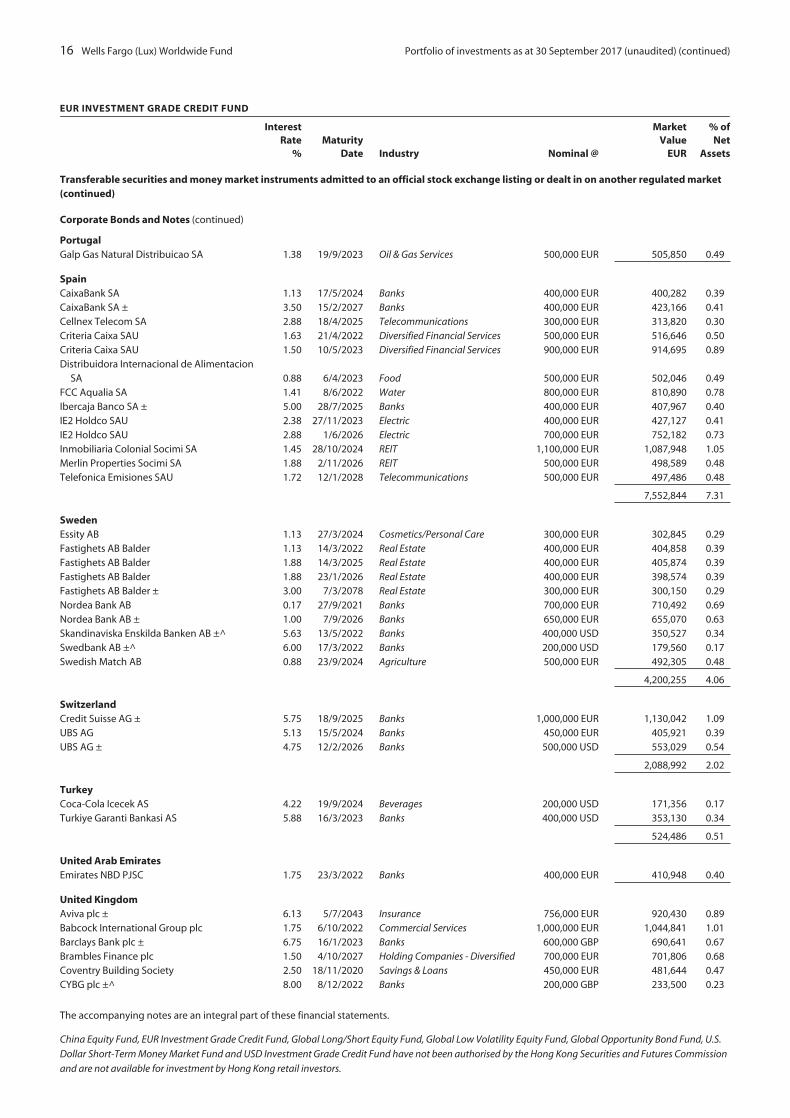
16 Wells Fargo (Lux) Worldwide Fund Portfolio of investments as at 30 September 2017 (unaudited) (continued)
EUR INVESTMENT GRADE CREDIT FUND
InterestRate
%Maturity
Date Industry Nominal @
MarketValue
EUR
% ofNet
Assets
Transferable securities and money market instruments admitted to an official stock exchange listing or dealt in on another regulated market(continued)
Corporate Bonds and Notes (continued)
PortugalGalp Gas Natural Distribuicao SA 1.38 19/9/2023 Oil & Gas Services 500,000 EUR 505,850 0.49
SpainCaixaBank SA 1.13 17/5/2024 Banks 400,000 EUR 400,282 0.39CaixaBank SA ± 3.50 15/2/2027 Banks 400,000 EUR 423,166 0.41Cellnex Telecom SA 2.88 18/4/2025 Telecommunications 300,000 EUR 313,820 0.30Criteria Caixa SAU 1.63 21/4/2022 Diversified Financial Services 500,000 EUR 516,646 0.50Criteria Caixa SAU 1.50 10/5/2023 Diversified Financial Services 900,000 EUR 914,695 0.89Distribuidora Internacional de Alimentacion
SA 0.88 6/4/2023 Food 500,000 EUR 502,046 0.49FCC Aqualia SA 1.41 8/6/2022 Water 800,000 EUR 810,890 0.78Ibercaja Banco SA ± 5.00 28/7/2025 Banks 400,000 EUR 407,967 0.40IE2 Holdco SAU 2.38 27/11/2023 Electric 400,000 EUR 427,127 0.41IE2 Holdco SAU 2.88 1/6/2026 Electric 700,000 EUR 752,182 0.73Inmobiliaria Colonial Socimi SA 1.45 28/10/2024 REIT 1,100,000 EUR 1,087,948 1.05Merlin Properties Socimi SA 1.88 2/11/2026 REIT 500,000 EUR 498,589 0.48Telefonica Emisiones SAU 1.72 12/1/2028 Telecommunications 500,000 EUR 497,486 0.48
7,552,844 7.31
SwedenEssity AB 1.13 27/3/2024 Cosmetics/Personal Care 300,000 EUR 302,845 0.29Fastighets AB Balder 1.13 14/3/2022 Real Estate 400,000 EUR 404,858 0.39Fastighets AB Balder 1.88 14/3/2025 Real Estate 400,000 EUR 405,874 0.39Fastighets AB Balder 1.88 23/1/2026 Real Estate 400,000 EUR 398,574 0.39Fastighets AB Balder ± 3.00 7/3/2078 Real Estate 300,000 EUR 300,150 0.29Nordea Bank AB 0.17 27/9/2021 Banks 700,000 EUR 710,492 0.69Nordea Bank AB ± 1.00 7/9/2026 Banks 650,000 EUR 655,070 0.63Skandinaviska Enskilda Banken AB ±^ 5.63 13/5/2022 Banks 400,000 USD 350,527 0.34Swedbank AB ±^ 6.00 17/3/2022 Banks 200,000 USD 179,560 0.17Swedish Match AB 0.88 23/9/2024 Agriculture 500,000 EUR 492,305 0.48
4,200,255 4.06
SwitzerlandCredit Suisse AG ± 5.75 18/9/2025 Banks 1,000,000 EUR 1,130,042 1.09UBS AG 5.13 15/5/2024 Banks 450,000 EUR 405,921 0.39UBS AG ± 4.75 12/2/2026 Banks 500,000 USD 553,029 0.54
2,088,992 2.02
TurkeyCoca-Cola Icecek AS 4.22 19/9/2024 Beverages 200,000 USD 171,356 0.17Turkiye Garanti Bankasi AS 5.88 16/3/2023 Banks 400,000 USD 353,130 0.34
524,486 0.51
United Arab EmiratesEmirates NBD PJSC 1.75 23/3/2022 Banks 400,000 EUR 410,948 0.40
United KingdomAviva plc ± 6.13 5/7/2043 Insurance 756,000 EUR 920,430 0.89Babcock International Group plc 1.75 6/10/2022 Commercial Services 1,000,000 EUR 1,044,841 1.01Barclays Bank plc ± 6.75 16/1/2023 Banks 600,000 GBP 690,641 0.67Brambles Finance plc 1.50 4/10/2027 Holding Companies - Diversified 700,000 EUR 701,806 0.68Coventry Building Society 2.50 18/11/2020 Savings & Loans 450,000 EUR 481,644 0.47CYBG plc ±^ 8.00 8/12/2022 Banks 200,000 GBP 233,500 0.23
The accompanying notes are an integral part of these financial statements.
China Equity Fund, EUR Investment Grade Credit Fund, Global Long/Short Equity Fund, Global Low Volatility Equity Fund, Global Opportunity Bond Fund, U.S.
Dollar Short-Term Money Market Fund and USD Investment Grade Credit Fund have not been authorised by the Hong Kong Securities and Futures Commission
and are not available for investment by Hong Kong retail investors.
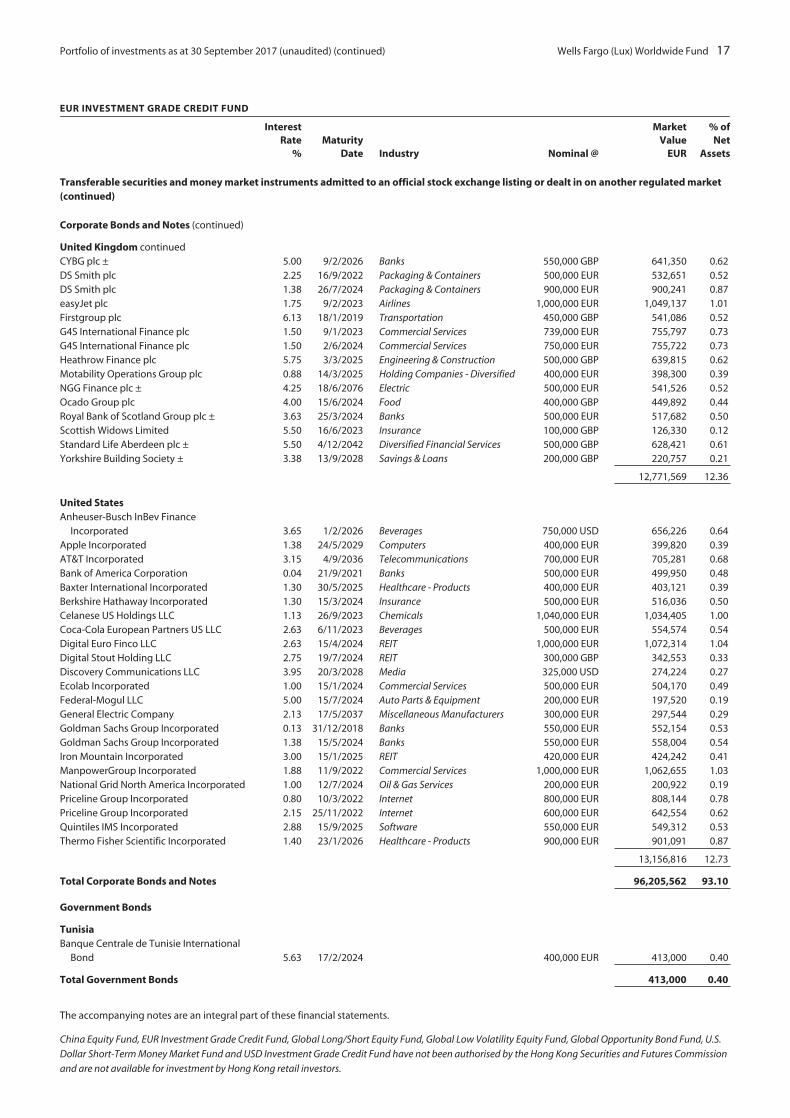
Portfolio of investments as at 30 September 2017 (unaudited) (continued) Wells Fargo (Lux) Worldwide Fund 17
EUR INVESTMENT GRADE CREDIT FUND
InterestRate
%Maturity
Date Industry Nominal @
MarketValue
EUR
% ofNet
Assets
Transferable securities and money market instruments admitted to an official stock exchange listing or dealt in on another regulated market(continued)
Corporate Bonds and Notes (continued)
United Kingdom continuedCYBG plc ± 5.00 9/2/2026 Banks 550,000 GBP 641,350 0.62DS Smith plc 2.25 16/9/2022 Packaging & Containers 500,000 EUR 532,651 0.52DS Smith plc 1.38 26/7/2024 Packaging & Containers 900,000 EUR 900,241 0.87easyJet plc 1.75 9/2/2023 Airlines 1,000,000 EUR 1,049,137 1.01Firstgroup plc 6.13 18/1/2019 Transportation 450,000 GBP 541,086 0.52G4S International Finance plc 1.50 9/1/2023 Commercial Services 739,000 EUR 755,797 0.73G4S International Finance plc 1.50 2/6/2024 Commercial Services 750,000 EUR 755,722 0.73Heathrow Finance plc 5.75 3/3/2025 Engineering & Construction 500,000 GBP 639,815 0.62Motability Operations Group plc 0.88 14/3/2025 Holding Companies - Diversified 400,000 EUR 398,300 0.39NGG Finance plc ± 4.25 18/6/2076 Electric 500,000 EUR 541,526 0.52Ocado Group plc 4.00 15/6/2024 Food 400,000 GBP 449,892 0.44Royal Bank of Scotland Group plc ± 3.63 25/3/2024 Banks 500,000 EUR 517,682 0.50Scottish Widows Limited 5.50 16/6/2023 Insurance 100,000 GBP 126,330 0.12Standard Life Aberdeen plc ± 5.50 4/12/2042 Diversified Financial Services 500,000 GBP 628,421 0.61Yorkshire Building Society ± 3.38 13/9/2028 Savings & Loans 200,000 GBP 220,757 0.21
12,771,569 12.36
United StatesAnheuser-Busch InBev Finance
Incorporated 3.65 1/2/2026 Beverages 750,000 USD 656,226 0.64Apple Incorporated 1.38 24/5/2029 Computers 400,000 EUR 399,820 0.39AT&T Incorporated 3.15 4/9/2036 Telecommunications 700,000 EUR 705,281 0.68Bank of America Corporation 0.04 21/9/2021 Banks 500,000 EUR 499,950 0.48Baxter International Incorporated 1.30 30/5/2025 Healthcare - Products 400,000 EUR 403,121 0.39Berkshire Hathaway Incorporated 1.30 15/3/2024 Insurance 500,000 EUR 516,036 0.50Celanese US Holdings LLC 1.13 26/9/2023 Chemicals 1,040,000 EUR 1,034,405 1.00Coca-Cola European Partners US LLC 2.63 6/11/2023 Beverages 500,000 EUR 554,574 0.54Digital Euro Finco LLC 2.63 15/4/2024 REIT 1,000,000 EUR 1,072,314 1.04Digital Stout Holding LLC 2.75 19/7/2024 REIT 300,000 GBP 342,553 0.33Discovery Communications LLC 3.95 20/3/2028 Media 325,000 USD 274,224 0.27Ecolab Incorporated 1.00 15/1/2024 Commercial Services 500,000 EUR 504,170 0.49Federal-Mogul LLC 5.00 15/7/2024 Auto Parts & Equipment 200,000 EUR 197,520 0.19General Electric Company 2.13 17/5/2037 Miscellaneous Manufacturers 300,000 EUR 297,544 0.29Goldman Sachs Group Incorporated 0.13 31/12/2018 Banks 550,000 EUR 552,154 0.53Goldman Sachs Group Incorporated 1.38 15/5/2024 Banks 550,000 EUR 558,004 0.54Iron Mountain Incorporated 3.00 15/1/2025 REIT 420,000 EUR 424,242 0.41ManpowerGroup Incorporated 1.88 11/9/2022 Commercial Services 1,000,000 EUR 1,062,655 1.03National Grid North America Incorporated 1.00 12/7/2024 Oil & Gas Services 200,000 EUR 200,922 0.19Priceline Group Incorporated 0.80 10/3/2022 Internet 800,000 EUR 808,144 0.78Priceline Group Incorporated 2.15 25/11/2022 Internet 600,000 EUR 642,554 0.62Quintiles IMS Incorporated 2.88 15/9/2025 Software 550,000 EUR 549,312 0.53Thermo Fisher Scientific Incorporated 1.40 23/1/2026 Healthcare - Products 900,000 EUR 901,091 0.87
13,156,816 12.73
Total Corporate Bonds and Notes 96,205,562 93.10
Government Bonds
TunisiaBanque Centrale de Tunisie International
Bond 5.63 17/2/2024 400,000 EUR 413,000 0.40
Total Government Bonds 413,000 0.40
The accompanying notes are an integral part of these financial statements.
China Equity Fund, EUR Investment Grade Credit Fund, Global Long/Short Equity Fund, Global Low Volatility Equity Fund, Global Opportunity Bond Fund, U.S.
Dollar Short-Term Money Market Fund and USD Investment Grade Credit Fund have not been authorised by the Hong Kong Securities and Futures Commission
and are not available for investment by Hong Kong retail investors.

18 Wells Fargo (Lux) Worldwide Fund Portfolio of investments as at 30 September 2017 (unaudited) (continued)
EUR INVESTMENT GRADE CREDIT FUND
InterestRate
%Maturity
Date Industry Nominal @
MarketValue
EUR
% ofNet
Assets
Transferable securities and money market instruments admitted to an official stock exchange listing or dealt in on another regulated market(continued)
Mortgage-and Asset-Backed Securities
IrelandDeco 2014 Tulip DAC 0.98 27/7/2024 Commercial MBS 77,523 EUR 77,700 0.08Taurus 2016-1 DEU DAC 2.40 17/11/2026 Commercial MBS 683,491 EUR 685,340 0.66Taurus CMBS UK 2014-1 Limited 1.69 1/5/2022 Commercial MBS 71,058 GBP 80,414 0.08
843,454 0.82
ItalyLeasimpresa Finance Srl 0.22 22/12/2025 Other ABS 3,355 EUR 3,241 0.00
LuxembourgDECO 2015-Charlemagne SA 1.45 27/4/2025 Commercial MBS 425,566 EUR 426,951 0.41
SpainBankinter 2 PYME FTA 0.19 16/5/2043 Other ABS 300,000 EUR 294,023 0.28
United KingdomEddystone Finance plc 1.05 19/4/2021 Commercial MBS 500,000 GBP 568,177 0.55First Flexible No 7 plc 0.57 15/9/2033 WL Collateral CMO 52,843 GBP 59,305 0.06Logistics UK 2015 plc 1.53 20/8/2025 Commercial MBS 1,150,000 GBP 1,304,086 1.26Paragon Mortgages No 9 plc 1.32 15/5/2041 WL Collateral CMO 133,554 GBP 142,028 0.14Paragon Mortgages No 11 plc 0.57 15/10/2041 WL Collateral CMO 436,606 EUR 405,191 0.39
2,478,787 2.40
Total Mortgage-and Asset-Backed Securities 4,046,456 3.91
Total Investments in Securities 100,665,018 97.41
Cash at Banks
Time Deposits
GermanyDeutsche Bank (o) (0.56) 3,792,989 EUR 3,792,989 3.67
United KingdomHSBC Bank plc (o) 0.05 72,932 GBP 82,688 0.08
United StatesJP Morgan Chase (o) 0.59 1,058,235 USD 895,367 0.87
Total Time Deposits 4,771,044 4.62
Current Account at Bank 306,238 0.30
Total Cash at Banks 5,077,282 4.92
Other Assets and Liabilities, Net (2,403,244) (2.33)
Total Net Assets 103,339,056 100.00
± Variable rate investment. The rate shown is the rate in effect at period end.^ Investment is perpetual and, thus, does not have a predetermined maturity date. The date shown reflects the next call date.@ Nominal amount is denominated in currency indicated.(o) Overnight deposit.
Key: EUR EuroGBP Pound SterlingUSD United States Dollar
The securities have been classified based upon country of incorporation/domiciliation.
The accompanying notes are an integral part of these financial statements.
China Equity Fund, EUR Investment Grade Credit Fund, Global Long/Short Equity Fund, Global Low Volatility Equity Fund, Global Opportunity Bond Fund, U.S.
Dollar Short-Term Money Market Fund and USD Investment Grade Credit Fund have not been authorised by the Hong Kong Securities and Futures Commission
and are not available for investment by Hong Kong retail investors.
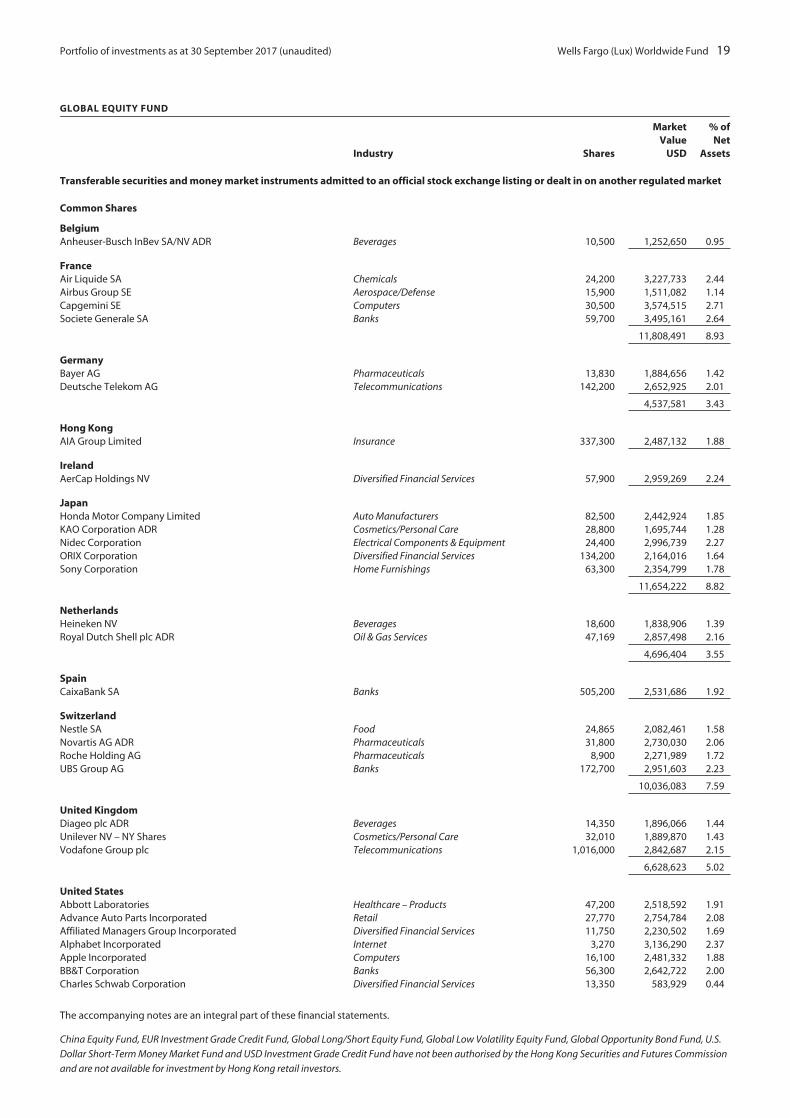
Portfolio of investments as at 30 September 2017 (unaudited) Wells Fargo (Lux) Worldwide Fund 19
GLOBAL EQUITY FUND
Industry Shares
MarketValue
USD
% ofNet
Assets
Transferable securities and money market instruments admitted to an official stock exchange listing or dealt in on another regulated market
Common Shares
BelgiumAnheuser-Busch InBev SA/NV ADR Beverages 10,500 1,252,650 0.95
FranceAir Liquide SA Chemicals 24,200 3,227,733 2.44Airbus Group SE Aerospace/Defense 15,900 1,511,082 1.14Capgemini SE Computers 30,500 3,574,515 2.71Societe Generale SA Banks 59,700 3,495,161 2.64
11,808,491 8.93
GermanyBayer AG Pharmaceuticals 13,830 1,884,656 1.42Deutsche Telekom AG Telecommunications 142,200 2,652,925 2.01
4,537,581 3.43
Hong KongAIA Group Limited Insurance 337,300 2,487,132 1.88
IrelandAerCap Holdings NV Diversified Financial Services 57,900 2,959,269 2.24
JapanHonda Motor Company Limited Auto Manufacturers 82,500 2,442,924 1.85KAO Corporation ADR Cosmetics/Personal Care 28,800 1,695,744 1.28Nidec Corporation Electrical Components & Equipment 24,400 2,996,739 2.27ORIX Corporation Diversified Financial Services 134,200 2,164,016 1.64Sony Corporation Home Furnishings 63,300 2,354,799 1.78
11,654,222 8.82
NetherlandsHeineken NV Beverages 18,600 1,838,906 1.39Royal Dutch Shell plc ADR Oil & Gas Services 47,169 2,857,498 2.16
4,696,404 3.55
SpainCaixaBank SA Banks 505,200 2,531,686 1.92
SwitzerlandNestle SA Food 24,865 2,082,461 1.58Novartis AG ADR Pharmaceuticals 31,800 2,730,030 2.06Roche Holding AG Pharmaceuticals 8,900 2,271,989 1.72UBS Group AG Banks 172,700 2,951,603 2.23
10,036,083 7.59
United KingdomDiageo plc ADR Beverages 14,350 1,896,066 1.44Unilever NV – NY Shares Cosmetics/Personal Care 32,010 1,889,870 1.43Vodafone Group plc Telecommunications 1,016,000 2,842,687 2.15
6,628,623 5.02
United StatesAbbott Laboratories Healthcare – Products 47,200 2,518,592 1.91Advance Auto Parts Incorporated Retail 27,770 2,754,784 2.08Affiliated Managers Group Incorporated Diversified Financial Services 11,750 2,230,502 1.69Alphabet Incorporated Internet 3,270 3,136,290 2.37Apple Incorporated Computers 16,100 2,481,332 1.88BB&T Corporation Banks 56,300 2,642,722 2.00Charles Schwab Corporation Diversified Financial Services 13,350 583,929 0.44
The accompanying notes are an integral part of these financial statements.
China Equity Fund, EUR Investment Grade Credit Fund, Global Long/Short Equity Fund, Global Low Volatility Equity Fund, Global Opportunity Bond Fund, U.S.
Dollar Short-Term Money Market Fund and USD Investment Grade Credit Fund have not been authorised by the Hong Kong Securities and Futures Commission
and are not available for investment by Hong Kong retail investors.

20 Wells Fargo (Lux) Worldwide Fund Portfolio of investments as at 30 September 2017 (unaudited) (continued)
GLOBAL EQUITY FUND
Industry Shares
MarketValue
USD
% ofNet
Assets
Transferable securities and money market instruments admitted to an official stock exchange listing or dealt in on another regulated market(continued)
Common Shares (continued)
United States continuedChevron Corporation Oil & Gas Services 23,400 2,749,500 2.08Cigna Corporation Healthcare – Services 15,840 2,961,130 2.24CIT Group Incorporated Diversified Financial Services 63,600 3,119,580 2.36Eli Lilly & Company Pharmaceuticals 17,000 1,454,180 1.10EOG Resources Incorporated Oil & Gas Services 30,345 2,935,575 2.22Gilead Sciences Incorporated Biotechnology 29,800 2,414,396 1.83Goldman Sachs Group Incorporated Banks 5,810 1,378,074 1.04Honeywell International Incorporated Electronics 18,150 2,572,581 1.95Merck & Company Incorporated Pharmaceuticals 41,900 2,682,857 2.03Microsoft Corporation Software 42,400 3,158,376 2.39Mondelez International Incorporated Food 70,500 2,866,530 2.17Motorola Solutions Incorporated Telecommunications 31,000 2,630,970 1.99Northrop Grumman Corporation Aerospace/Defense 7,550 2,172,286 1.64Oracle Corporation Software 48,600 2,349,810 1.78Samsonite International SA Household Products/Wares 682,000 2,924,753 2.21Schlumberger Limited Oil & Gas Services 36,400 2,539,264 1.92Sensata Technologies Holding NV Electronics 48,790 2,345,335 1.77United Parcel Service Incorporated Transportation 23,608 2,835,085 2.15Verizon Communications Incorporated Telecommunications 55,400 2,741,746 2.07Visa Incorporated Diversified Financial Services 30,800 3,241,392 2.45Vulcan Materials Company Building Materials 16,776 2,006,410 1.52Walt Disney Company Media 20,300 2,000,971 1.51
72,428,952 54.79
Total Common Shares 131,021,093 99.12
Total Investments in Securities 131,021,093 99.12
InterestRate
% Nominal @
Cash at Banks
Time Deposits
Cayman IslandsBBH Grand Cayman (o) 0.01 40 SGD 29 0.00BBH Grand Cayman (o) 0.05 2 GBP 3 0.00
32 0.00
United KingdomStandard Chartered Bank (o) 0.59 1,133,225 USD 1,133,225 0.86
Total Time Deposits 1,133,257 0.86
Current Accounts at Bank 438 0.00
Total Cash at Banks 1,133,695 0.86
Other Assets and Liabilities, Net 28,669 0.02
Total Net Assets 132,183,457 100.00
@ Nominal amount is denominated in currency indicated.(o) Overnight deposit.
Key: ADR American Depositary ReceiptGBP Pound SterlingSGD Singapore DollarUSD United States Dollar
The securities have been classified based upon country of incorporation/domiciliation.
The accompanying notes are an integral part of these financial statements.
China Equity Fund, EUR Investment Grade Credit Fund, Global Long/Short Equity Fund, Global Low Volatility Equity Fund, Global Opportunity Bond Fund, U.S.
Dollar Short-Term Money Market Fund and USD Investment Grade Credit Fund have not been authorised by the Hong Kong Securities and Futures Commission
and are not available for investment by Hong Kong retail investors.
Portfolio of investments as at 30 September 2017 (unaudited) Wells Fargo (Lux) Worldwide Fund 21
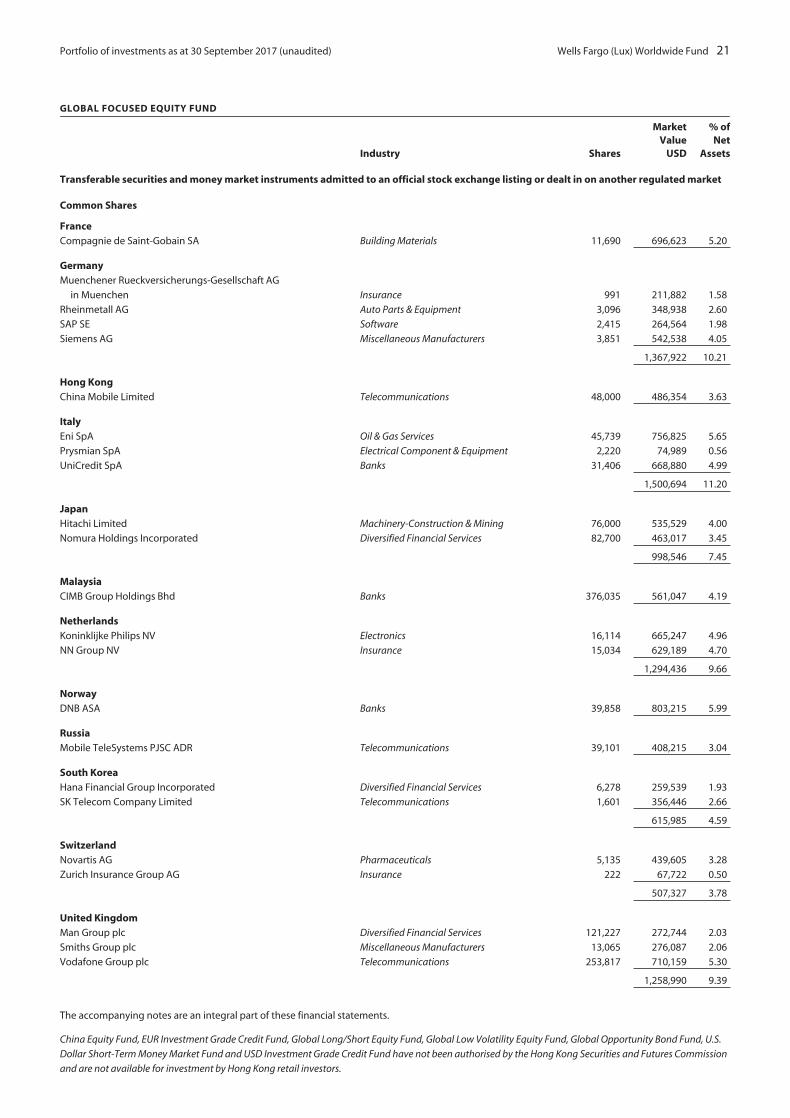
GLOBAL FOCUSED EQUITY FUND
Industry Shares
MarketValue
USD
% ofNet
Assets
Transferable securities and money market instruments admitted to an official stock exchange listing or dealt in on another regulated market
Common Shares
FranceCompagnie de Saint-Gobain SA Building Materials 11,690 696,623 5.20
GermanyMuenchener Rueckversicherungs-Gesellschaft AG
in Muenchen Insurance 991 211,882 1.58
Rheinmetall AG Auto Parts & Equipment 3,096 348,938 2.60
SAP SE Software 2,415 264,564 1.98
Siemens AG Miscellaneous Manufacturers 3,851 542,538 4.05
1,367,922 10.21
Hong KongChina Mobile Limited Telecommunications 48,000 486,354 3.63
ItalyEni SpA Oil & Gas Services 45,739 756,825 5.65
Prysmian SpA Electrical Component & Equipment 2,220 74,989 0.56
UniCredit SpA Banks 31,406 668,880 4.99
1,500,694 11.20
JapanHitachi Limited Machinery-Construction & Mining 76,000 535,529 4.00
Nomura Holdings Incorporated Diversified Financial Services 82,700 463,017 3.45
998,546 7.45
MalaysiaCIMB Group Holdings Bhd Banks 376,035 561,047 4.19
NetherlandsKoninklijke Philips NV Electronics 16,114 665,247 4.96
NN Group NV Insurance 15,034 629,189 4.70
1,294,436 9.66
NorwayDNB ASA Banks 39,858 803,215 5.99
RussiaMobile TeleSystems PJSC ADR Telecommunications 39,101 408,215 3.04
South KoreaHana Financial Group Incorporated Diversified Financial Services 6,278 259,539 1.93
SK Telecom Company Limited Telecommunications 1,601 356,446 2.66
615,985 4.59
SwitzerlandNovartis AG Pharmaceuticals 5,135 439,605 3.28
Zurich Insurance Group AG Insurance 222 67,722 0.50
507,327 3.78
United KingdomMan Group plc Diversified Financial Services 121,227 272,744 2.03
Smiths Group plc Miscellaneous Manufacturers 13,065 276,087 2.06
Vodafone Group plc Telecommunications 253,817 710,159 5.30
1,258,990 9.39
The accompanying notes are an integral part of these financial statements.
China Equity Fund, EUR Investment Grade Credit Fund, Global Long/Short Equity Fund, Global Low Volatility Equity Fund, Global Opportunity Bond Fund, U.S.
Dollar Short-Term Money Market Fund and USD Investment Grade Credit Fund have not been authorised by the Hong Kong Securities and Futures Commission
and are not available for investment by Hong Kong retail investors.
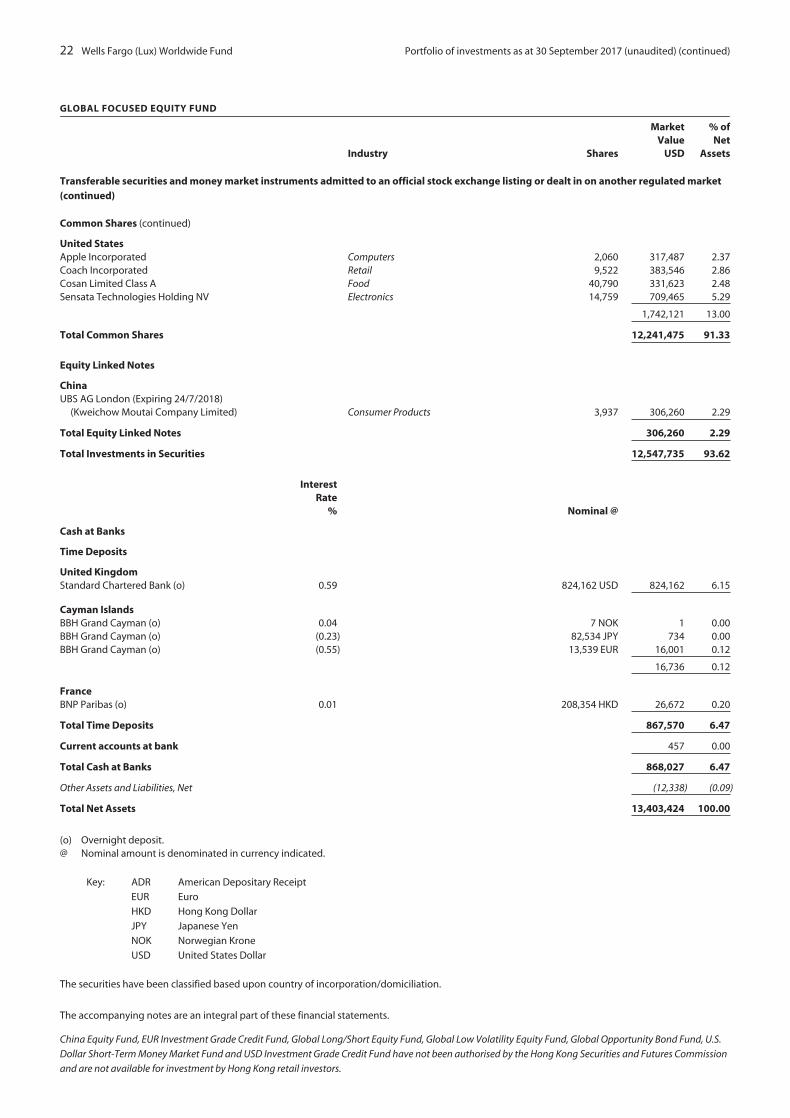
22 Wells Fargo (Lux) Worldwide Fund Portfolio of investments as at 30 September 2017 (unaudited) (continued)
GLOBAL FOCUSED EQUITY FUND
Industry Shares
MarketValue
USD
% ofNet
Assets
Transferable securities and money market instruments admitted to an official stock exchange listing or dealt in on another regulated market(continued)
Common Shares (continued)
United StatesApple Incorporated Computers 2,060 317,487 2.37Coach Incorporated Retail 9,522 383,546 2.86Cosan Limited Class A Food 40,790 331,623 2.48Sensata Technologies Holding NV Electronics 14,759 709,465 5.29
1,742,121 13.00
Total Common Shares 12,241,475 91.33
Equity Linked Notes
ChinaUBS AG London (Expiring 24/7/2018)
(Kweichow Moutai Company Limited) Consumer Products 3,937 306,260 2.29
Total Equity Linked Notes 306,260 2.29
Total Investments in Securities 12,547,735 93.62
InterestRate
% Nominal @
Cash at Banks
Time Deposits
United KingdomStandard Chartered Bank (o) 0.59 824,162 USD 824,162 6.15
Cayman IslandsBBH Grand Cayman (o) 0.04 7 NOK 1 0.00BBH Grand Cayman (o) (0.23) 82,534 JPY 734 0.00BBH Grand Cayman (o) (0.55) 13,539 EUR 16,001 0.12
16,736 0.12
FranceBNP Paribas (o) 0.01 208,354 HKD 26,672 0.20
Total Time Deposits 867,570 6.47
Current accounts at bank 457 0.00
Total Cash at Banks 868,027 6.47
Other Assets and Liabilities, Net (12,338) (0.09)
Total Net Assets 13,403,424 100.00
(o) Overnight deposit.@ Nominal amount is denominated in currency indicated.
Key: ADR American Depositary Receipt
EUR Euro
HKD Hong Kong Dollar
JPY Japanese Yen
NOK Norwegian Krone
USD United States Dollar
The securities have been classified based upon country of incorporation/domiciliation.
The accompanying notes are an integral part of these financial statements.
China Equity Fund, EUR Investment Grade Credit Fund, Global Long/Short Equity Fund, Global Low Volatility Equity Fund, Global Opportunity Bond Fund, U.S.
Dollar Short-Term Money Market Fund and USD Investment Grade Credit Fund have not been authorised by the Hong Kong Securities and Futures Commission
and are not available for investment by Hong Kong retail investors.
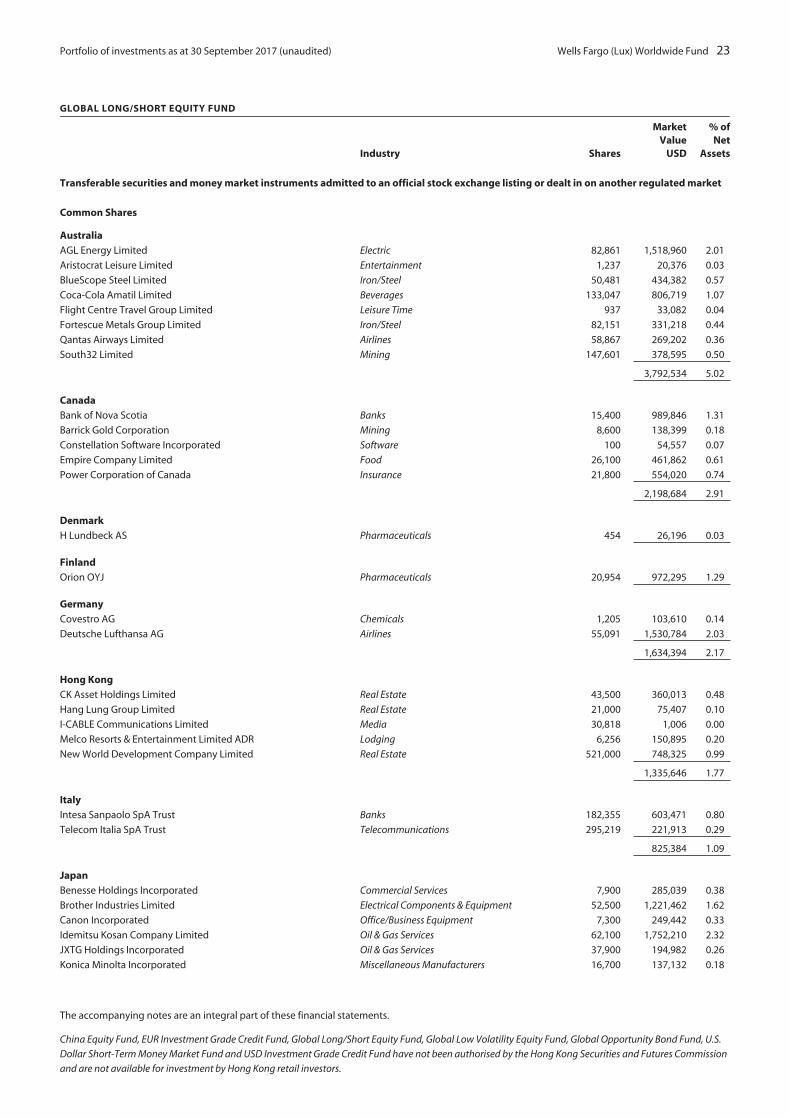
Portfolio of investments as at 30 September 2017 (unaudited) Wells Fargo (Lux) Worldwide Fund 23
GLOBAL LONG/SHORT EQUITY FUND
Industry Shares
MarketValue
USD
% ofNet
Assets
Transferable securities and money market instruments admitted to an official stock exchange listing or dealt in on another regulated market
Common Shares
Australia
AGL Energy Limited Electric 82,861 1,518,960 2.01
Aristocrat Leisure Limited Entertainment 1,237 20,376 0.03
BlueScope Steel Limited Iron/Steel 50,481 434,382 0.57
Coca-Cola Amatil Limited Beverages 133,047 806,719 1.07
Flight Centre Travel Group Limited Leisure Time 937 33,082 0.04
Fortescue Metals Group Limited Iron/Steel 82,151 331,218 0.44
Qantas Airways Limited Airlines 58,867 269,202 0.36
South32 Limited Mining 147,601 378,595 0.50
3,792,534 5.02
Canada
Bank of Nova Scotia Banks 15,400 989,846 1.31
Barrick Gold Corporation Mining 8,600 138,399 0.18
Constellation Software Incorporated Software 100 54,557 0.07
Empire Company Limited Food 26,100 461,862 0.61
Power Corporation of Canada Insurance 21,800 554,020 0.74
2,198,684 2.91
Denmark
H Lundbeck AS Pharmaceuticals 454 26,196 0.03
Finland
Orion OYJ Pharmaceuticals 20,954 972,295 1.29
Germany
Covestro AG Chemicals 1,205 103,610 0.14
Deutsche Lufthansa AG Airlines 55,091 1,530,784 2.03
1,634,394 2.17
Hong Kong
CK Asset Holdings Limited Real Estate 43,500 360,013 0.48
Hang Lung Group Limited Real Estate 21,000 75,407 0.10
I-CABLE Communications Limited Media 30,818 1,006 0.00
Melco Resorts & Entertainment Limited ADR Lodging 6,256 150,895 0.20
New World Development Company Limited Real Estate 521,000 748,325 0.99
1,335,646 1.77
Italy
Intesa Sanpaolo SpA Trust Banks 182,355 603,471 0.80
Telecom Italia SpA Trust Telecommunications 295,219 221,913 0.29
825,384 1.09
Japan
Benesse Holdings Incorporated Commercial Services 7,900 285,039 0.38
Brother Industries Limited Electrical Components & Equipment 52,500 1,221,462 1.62
Canon Incorporated Office/Business Equipment 7,300 249,442 0.33
Idemitsu Kosan Company Limited Oil & Gas Services 62,100 1,752,210 2.32
JXTG Holdings Incorporated Oil & Gas Services 37,900 194,982 0.26
Konica Minolta Incorporated Miscellaneous Manufacturers 16,700 137,132 0.18
The accompanying notes are an integral part of these financial statements.
China Equity Fund, EUR Investment Grade Credit Fund, Global Long/Short Equity Fund, Global Low Volatility Equity Fund, Global Opportunity Bond Fund, U.S.
Dollar Short-Term Money Market Fund and USD Investment Grade Credit Fund have not been authorised by the Hong Kong Securities and Futures Commission
and are not available for investment by Hong Kong retail investors.

24 Wells Fargo (Lux) Worldwide Fund Portfolio of investments as at 30 September 2017 (unaudited) (continued)
GLOBAL LONG/SHORT EQUITY FUND
Industry Shares
MarketValue
USD
% ofNet
Assets
Transferable securities and money market instruments admitted to an official stock exchange listing or dealt in on another regulated market
(continued)
Common Shares (continued)
Japan continued
Mitsubishi Tanabe Pharma Corporation Pharmaceuticals 7,300 167,376 0.22
Mixi Incorporated Internet 26,900 1,298,085 1.72
Nippon Electric Glass Company Limited Electronics 18,700 723,737 0.96
NTT DOCOMO Incorporated Telecommunications 12,800 292,401 0.39
Osaka Gas Company Limited Oil & Gas Services 1,800 33,464 0.04
Seiko Epson Corporation Office/Business Equipment 25,900 626,756 0.83
Start Today Company Limited Internet 23,800 754,028 1.00
Sumitomo Dainippon Pharma Company Limited Pharmaceuticals 6,100 79,364 0.11
Tokyo Electron Limited Semiconductors 7,000 1,074,961 1.42
Trend Micro Incorporated Internet 800 39,387 0.05
8,929,826 11.83
Netherlands
Gemalto NV Computers 689 30,778 0.04
Randstad Holding NV Commercial Services 3,127 193,438 0.26
Royal Dutch Shell plc Class A Oil & Gas Services 3,665 110,426 0.15
Royal Dutch Shell plc Class B Oil & Gas Services 7,895 242,742 0.32
577,384 0.77
Singapore
Genting Singapore plc Entertainment 711,200 613,442 0.81
Sweden
Industrivarden AB Holding Companies – Diversified 35,580 901,196 1.19
Switzerland
Adecco Group AG Commercial Services 27,107 2,110,671 2.80
United Kingdom
Rio Tinto Limited Mining 18,442 962,417 1.28
United States
AbbVie Incorporated Pharmaceuticals 27,824 2,472,441 3.28
AGNC Investment Corporation REIT 97,027 2,103,545 2.79
Align Technology Incorporated Healthcare – Products 2,950 549,496 0.73
Alphabet Incorporated Class A Internet 1,655 1,611,507 2.13
Alphabet Incorporated Class C Internet 1,261 1,209,438 1.60
Amgen Incorporated Biotechnology 12,194 2,273,571 3.01
Annaly Capital Management Incorporated REIT 160,177 1,952,558 2.59
Anthem Incorporated Healthcare – Services 3,427 650,719 0.86
Athene Holding Limited Insurance 23,266 1,252,641 1.66
Berkshire Hathaway Incorporated Insurance 5,156 945,198 1.25
Best Buy Company Incorporated Retail 17,987 1,024,539 1.36
CA Incorporated Software 28,118 938,579 1.24
Celgene Corporation Biotechnology 12,192 1,777,837 2.36
Centene Corporation Healthcare – Services 14,682 1,420,777 1.88
Cigna Corporation Healthcare – Services 5,424 1,013,963 1.34
Costco Wholesale Corporation Retail 6,313 1,037,163 1.37
Darden Restaurants Incorporated Retail 20,451 1,611,130 2.13
Domino’s Pizza Incorporated Retail 6,688 1,327,902 1.76
The accompanying notes are an integral part of these financial statements.
China Equity Fund, EUR Investment Grade Credit Fund, Global Long/Short Equity Fund, Global Low Volatility Equity Fund, Global Opportunity Bond Fund, U.S.
Dollar Short-Term Money Market Fund and USD Investment Grade Credit Fund have not been authorised by the Hong Kong Securities and Futures Commission
and are not available for investment by Hong Kong retail investors.
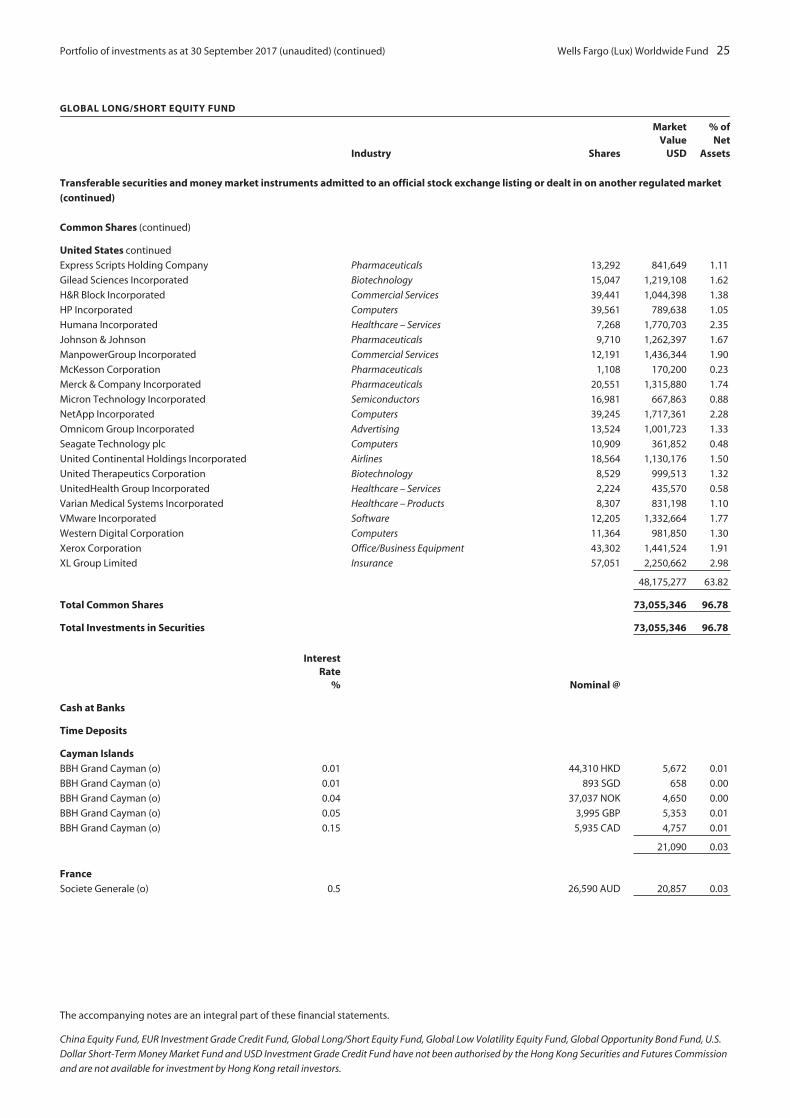
Portfolio of investments as at 30 September 2017 (unaudited) (continued) Wells Fargo (Lux) Worldwide Fund 25
GLOBAL LONG/SHORT EQUITY FUND
Industry Shares
MarketValue
USD
% ofNet
Assets
Transferable securities and money market instruments admitted to an official stock exchange listing or dealt in on another regulated market
(continued)
Common Shares (continued)
United States continued
Express Scripts Holding Company Pharmaceuticals 13,292 841,649 1.11
Gilead Sciences Incorporated Biotechnology 15,047 1,219,108 1.62
H&R Block Incorporated Commercial Services 39,441 1,044,398 1.38
HP Incorporated Computers 39,561 789,638 1.05
Humana Incorporated Healthcare – Services 7,268 1,770,703 2.35
Johnson & Johnson Pharmaceuticals 9,710 1,262,397 1.67
ManpowerGroup Incorporated Commercial Services 12,191 1,436,344 1.90
McKesson Corporation Pharmaceuticals 1,108 170,200 0.23
Merck & Company Incorporated Pharmaceuticals 20,551 1,315,880 1.74
Micron Technology Incorporated Semiconductors 16,981 667,863 0.88
NetApp Incorporated Computers 39,245 1,717,361 2.28
Omnicom Group Incorporated Advertising 13,524 1,001,723 1.33
Seagate Technology plc Computers 10,909 361,852 0.48
United Continental Holdings Incorporated Airlines 18,564 1,130,176 1.50
United Therapeutics Corporation Biotechnology 8,529 999,513 1.32
UnitedHealth Group Incorporated Healthcare – Services 2,224 435,570 0.58
Varian Medical Systems Incorporated Healthcare – Products 8,307 831,198 1.10
VMware Incorporated Software 12,205 1,332,664 1.77
Western Digital Corporation Computers 11,364 981,850 1.30
Xerox Corporation Office/Business Equipment 43,302 1,441,524 1.91
XL Group Limited Insurance 57,051 2,250,662 2.98
48,175,277 63.82
Total Common Shares 73,055,346 96.78
Total Investments in Securities 73,055,346 96.78
InterestRate
% Nominal @
Cash at Banks
Time Deposits
Cayman Islands
BBH Grand Cayman (o) 0.01 44,310 HKD 5,672 0.01
BBH Grand Cayman (o) 0.01 893 SGD 658 0.00
BBH Grand Cayman (o) 0.04 37,037 NOK 4,650 0.00
BBH Grand Cayman (o) 0.05 3,995 GBP 5,353 0.01
BBH Grand Cayman (o) 0.15 5,935 CAD 4,757 0.01
21,090 0.03
France
Societe Generale (o) 0.5 26,590 AUD 20,857 0.03
The accompanying notes are an integral part of these financial statements.
China Equity Fund, EUR Investment Grade Credit Fund, Global Long/Short Equity Fund, Global Low Volatility Equity Fund, Global Opportunity Bond Fund, U.S.
Dollar Short-Term Money Market Fund and USD Investment Grade Credit Fund have not been authorised by the Hong Kong Securities and Futures Commission
and are not available for investment by Hong Kong retail investors.

26 Wells Fargo (Lux) Worldwide Fund Portfolio of investments as at 30 September 2017 (unaudited) (continued)
GLOBAL LONG/SHORT EQUITY FUND
InterestRate
% Nominal @
MarketValue
USD
% ofNet
Assets
Cash at Banks (continued)
Time Deposits (continued)
United KingdomStandard Chartered Bank (o) 0.59 2,272,962 USD 2,272,962 3.01
Total Time Deposits 2,314,909 3.07
Current Accounts at Bank 365,649 0.48
Total Cash at Banks 2,680,558 3.55
Other Assets and Liabilities, Net (250,508) (0.33)
Total Net Assets 75,485,396 100.00
@ Nominal amount is denominated in currency indicated.(o) Overnight deposit.
Key: ADR American Depositary Receipt
AUD Australian Dollar
CAD Canadian Dollar
GBP Pound Sterling
HKD Hong Kong Dollar
NOK Norwegian Krone
REIT Real Estate Investment Trust
SGD Singapore Dollar
USD United States Dollar
The securities have been classified based upon country of incorporation/domiciliation.
The accompanying notes are an integral part of these financial statements.
China Equity Fund, EUR Investment Grade Credit Fund, Global Long/Short Equity Fund, Global Low Volatility Equity Fund, Global Opportunity Bond Fund, U.S.
Dollar Short-Term Money Market Fund and USD Investment Grade Credit Fund have not been authorised by the Hong Kong Securities and Futures Commission
and are not available for investment by Hong Kong retail investors.

Portfolio of investments as at 30 September 2017 (unaudited) Wells Fargo (Lux) Worldwide Fund 27
GLOBAL LOW VOLATILITY EQUITY FUND
Industry Shares
MarketValue
USD
% ofNet
Assets
Transferable securities and money market instruments admitted to an official stock exchange listing or dealt in on another regulated market
Common Shares
AustraliaAGL Energy Limited Electric 53,597 982,510 0.58
Aurizon Holdings Limited Transportation 164,801 633,423 0.37
Coca-Cola Amatil Limited Beverages 129,730 786,606 0.46
Cochlear Limited Healthcare – Products 3,039 379,523 0.22
CSL Limited Biotechnology 32,959 3,463,273 2.04
Flight Centre Travel Group Limited Leisure Time 15,130 534,177 0.31
LendLease Group Trust Engineering & Construction 53,872 757,249 0.45
Orica Limited Miscellaneous Manufacturers 28,037 434,786 0.26
Qantas Airways Limited Airlines 16,277 74,436 0.04
Sonic Healthcare Limited Healthcare – Services 18,057 296,167 0.18
South32 Limited Mining 598,477 1,535,086 0.90
Stockland REIT 91,598 308,953 0.18
Telstra Corporation Limited Telecommunications 411,018 1,125,185 0.66
Wesfarmers Limited Food 99,807 3,235,668 1.90
14,547,042 8.55
BelgiumColruyt SA Food 4,078 208,865 0.12
Proximus SADP Telecommunications 32,319 1,113,658 0.66
1,322,523 0.78
CanadaAtco Limited Electric 9,700 356,049 0.21
Barrick Gold Corporation Mining 73,200 1,178,005 0.69
BCE Incorporated Telecommunications 11,900 557,543 0.33
Canadian Utilities Limited Oil & Gas Services 16,500 512,422 0.30
CCL Industries Incorporated Packaging & Containers 20,000 967,822 0.57
Constellation Software Incorporated Software 1,300 709,246 0.42
Dollarama Incorporated Retail 4,500 492,394 0.29
First Capital Realty Incorporated Real Estate 1,800 28,390 0.02
George Weston Limited Food 4,100 357,015 0.21
Goldcorp Incorporated Mining 25,000 324,584 0.19
H&R Real Estate Investment Trust REIT 43,300 747,491 0.44
Intact Financial Corporation Insurance 7,800 644,317 0.38
Jean Coutu Group PJC Incorporated Retail 17,100 333,024 0.19
Kinross Gold Corporation Mining 105,500 447,281 0.26
Metro Incorporated Food 46,900 1,612,886 0.95
National Bank of Canada Banks 89,800 4,321,771 2.54
Open Text Corporation Software 7,900 254,902 0.15
RioCan Real Estate Investment Trust REIT 46,600 893,719 0.52
Rogers Communications Incorporated Telecommunications 63,700 3,284,679 1.93
Saputo Incorporated Food 12,600 436,140 0.26
Shaw Communications Incorporated Media 4,900 112,786 0.06
18,572,466 10.91
DenmarkColoplast AS Healthcare – Products 2,466 200,139 0.12
H Lundbeck AS Pharmaceuticals 2,110 121,749 0.07
ISS AS Commercial Services 8,626 346,890 0.20
Novo Nordisk AS Pharmaceuticals 40,444 1,933,476 1.14
The accompanying notes are an integral part of these financial statements.
China Equity Fund, EUR Investment Grade Credit Fund, Global Long/Short Equity Fund, Global Low Volatility Equity Fund, Global Opportunity Bond Fund, U.S.
Dollar Short-Term Money Market Fund and USD Investment Grade Credit Fund have not been authorised by the Hong Kong Securities and Futures Commission
and are not available for investment by Hong Kong retail investors.

28 Wells Fargo (Lux) Worldwide Fund Portfolio of investments as at 30 September 2017 (unaudited) (continued)
GLOBAL LOW VOLATILITY EQUITY FUND
Industry Shares
MarketValue
USD
% ofNet
Assets
Transferable securities and money market instruments admitted to an official stock exchange listing or dealt in on another regulated market(continued)
Common Shares (continued)
Denmark continuedTDC AS Telecommunications 41,188 241,322 0.14William Demant Holding AS Healthcare – Products 23,890 630,616 0.37
3,474,192 2.04
FranceDassault Aviation SA Aerospace/Defense 121 195,702 0.12
GermanyDeutsche Lufthansa AG Airlines 4,676 129,929 0.08MAN SE Machinery – Diversified 5,054 570,393 0.33
700,322 0.41
Hong KongASM Pacific Technology Limited Semiconductors 195,000 2,808,324 1.65BOC Hong Kong Holdings Limited Banks 204,500 993,494 0.58CK Asset Holdings Limited Real Estate 57,500 475,879 0.28CK Infrastructure Holdings Limited Engineering & Construction 82,500 709,714 0.42CLP Holdings Limited Electric 236,500 2,423,553 1.42First Pacific Company Limited Food 184,000 146,746 0.09Hang Lung Group Limited Real Estate 45,000 161,587 0.10Hang Seng Bank Limited Banks 13,500 329,049 0.19HK Electric Investments & HK Electric Investments
Limited Trust Electric 628,000 572,400 0.34HKT Trust & HKT Limited Telecommunications 1,195,000 1,451,758 0.85Hysan Development Company Limited Real Estate 45,000 211,704 0.12I-CABLE Communications Limited Media 31,603 1,032 0.00Kerry Properties Limited Real Estate 102,500 424,481 0.25Link REIT REIT 250,500 2,029,885 1.19MTR Corporation Limited Transportation 241,000 1,406,831 0.83New World Development Company Limited Real Estate 26,000 37,344 0.02NWS Holdings Limited Holding Companies – Diversified 167,000 325,380 0.19PCCW Limited Telecommunications 797,000 431,577 0.25Power Assets Holdings Limited Electric 36,500 316,097 0.19Shangri-La Asia Limited Lodging 42,000 77,853 0.05Sun Hung Kai Properties Limited Real Estate 3,000 48,735 0.03Swire Pacific Limited Holding Companies – Diversified 40,500 392,993 0.23WH Group Limited Food 2,108,000 2,239,797 1.32Wheelock & Company Limited Real Estate 45,000 316,548 0.19Yue Yuen Industrial Holdings Limited Apparel 212,500 807,933 0.47
19,140,694 11.25
JapanAlfresa Holdings Corporation Pharmaceuticals 3,500 64,044 0.04Aozora Bank Limited Banks 14,500 551,522 0.32Brother Industries Limited Electrical Components & Equipment 7,000 162,862 0.10Daiichi Sankyo Company Limited Pharmaceuticals 7,300 164,651 0.10Eisai Company Limited Pharmaceuticals 2,000 102,662 0.06Fujitsu Limited Computers 147,000 1,092,000 0.64Hoya Corporation Electronics 20,800 1,122,950 0.66Idemitsu Kosan Company Limited Oil & Gas Services 6,500 183,404 0.11Japan Airlines Company Limited Airlines 18,700 632,834 0.37
The accompanying notes are an integral part of these financial statements.
China Equity Fund, EUR Investment Grade Credit Fund, Global Long/Short Equity Fund, Global Low Volatility Equity Fund, Global Opportunity Bond Fund, U.S.
Dollar Short-Term Money Market Fund and USD Investment Grade Credit Fund have not been authorised by the Hong Kong Securities and Futures Commission
and are not available for investment by Hong Kong retail investors.
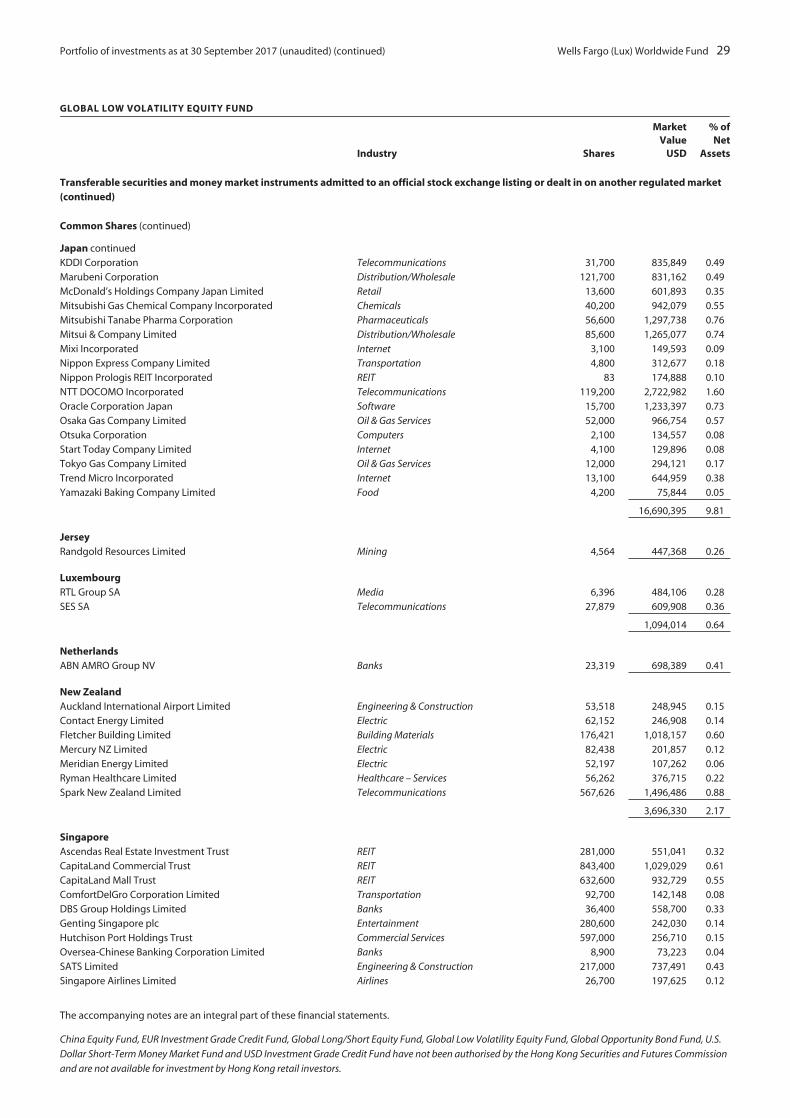
Portfolio of investments as at 30 September 2017 (unaudited) (continued) Wells Fargo (Lux) Worldwide Fund 29
GLOBAL LOW VOLATILITY EQUITY FUND
Industry Shares
MarketValue
USD
% ofNet
Assets
Transferable securities and money market instruments admitted to an official stock exchange listing or dealt in on another regulated market(continued)
Common Shares (continued)
Japan continuedKDDI Corporation Telecommunications 31,700 835,849 0.49Marubeni Corporation Distribution/Wholesale 121,700 831,162 0.49McDonald’s Holdings Company Japan Limited Retail 13,600 601,893 0.35Mitsubishi Gas Chemical Company Incorporated Chemicals 40,200 942,079 0.55Mitsubishi Tanabe Pharma Corporation Pharmaceuticals 56,600 1,297,738 0.76Mitsui & Company Limited Distribution/Wholesale 85,600 1,265,077 0.74Mixi Incorporated Internet 3,100 149,593 0.09Nippon Express Company Limited Transportation 4,800 312,677 0.18Nippon Prologis REIT Incorporated REIT 83 174,888 0.10NTT DOCOMO Incorporated Telecommunications 119,200 2,722,982 1.60Oracle Corporation Japan Software 15,700 1,233,397 0.73Osaka Gas Company Limited Oil & Gas Services 52,000 966,754 0.57Otsuka Corporation Computers 2,100 134,557 0.08Start Today Company Limited Internet 4,100 129,896 0.08Tokyo Gas Company Limited Oil & Gas Services 12,000 294,121 0.17Trend Micro Incorporated Internet 13,100 644,959 0.38Yamazaki Baking Company Limited Food 4,200 75,844 0.05
16,690,395 9.81
JerseyRandgold Resources Limited Mining 4,564 447,368 0.26
LuxembourgRTL Group SA Media 6,396 484,106 0.28SES SA Telecommunications 27,879 609,908 0.36
1,094,014 0.64
NetherlandsABN AMRO Group NV Banks 23,319 698,389 0.41
New ZealandAuckland International Airport Limited Engineering & Construction 53,518 248,945 0.15Contact Energy Limited Electric 62,152 246,908 0.14Fletcher Building Limited Building Materials 176,421 1,018,157 0.60Mercury NZ Limited Electric 82,438 201,857 0.12Meridian Energy Limited Electric 52,197 107,262 0.06Ryman Healthcare Limited Healthcare – Services 56,262 376,715 0.22Spark New Zealand Limited Telecommunications 567,626 1,496,486 0.88
3,696,330 2.17
SingaporeAscendas Real Estate Investment Trust REIT 281,000 551,041 0.32CapitaLand Commercial Trust REIT 843,400 1,029,029 0.61CapitaLand Mall Trust REIT 632,600 932,729 0.55ComfortDelGro Corporation Limited Transportation 92,700 142,148 0.08DBS Group Holdings Limited Banks 36,400 558,700 0.33Genting Singapore plc Entertainment 280,600 242,030 0.14Hutchison Port Holdings Trust Commercial Services 597,000 256,710 0.15Oversea-Chinese Banking Corporation Limited Banks 8,900 73,223 0.04SATS Limited Engineering & Construction 217,000 737,491 0.43Singapore Airlines Limited Airlines 26,700 197,625 0.12
The accompanying notes are an integral part of these financial statements.
China Equity Fund, EUR Investment Grade Credit Fund, Global Long/Short Equity Fund, Global Low Volatility Equity Fund, Global Opportunity Bond Fund, U.S.
Dollar Short-Term Money Market Fund and USD Investment Grade Credit Fund have not been authorised by the Hong Kong Securities and Futures Commission
and are not available for investment by Hong Kong retail investors.

30 Wells Fargo (Lux) Worldwide Fund Portfolio of investments as at 30 September 2017 (unaudited) (continued)
GLOBAL LOW VOLATILITY EQUITY FUND
Industry Shares
MarketValue
USD
% ofNet
Assets
Transferable securities and money market instruments admitted to an official stock exchange listing or dealt in on another regulated market(continued)
Common Shares (continued)
Singapore continuedSingapore Press Holdings Limited Media 190,500 381,997 0.22Singapore Technologies Engineering Limited Engineering & Construction 146,000 370,261 0.22Singapore Telecommunications Limited Telecommunications 200,600 544,221 0.32StarHub Limited Telecommunications 332,000 636,367 0.37Suntec Real Estate Investment Trust REIT 38,000 52,247 0.03United Overseas Bank Limited Banks 9,600 166,316 0.10Wilmar International Limited Food 330,400 774,575 0.46
7,646,710 4.49
SwedenICA Gruppen AB Food 12,561 472,065 0.28Swedish Match AB Agriculture 15,468 542,573 0.32
1,014,638 0.60
SwitzerlandBarry Callebaut AG Food 126 193,095 0.11Chocoladefabriken Lindt & Spruengli AG Food 6 416,068 0.24Chocoladefabriken Lindt & Spruengli AG Food 20 114,112 0.07Nestle SA Food 36,537 3,060,000 1.80Novartis AG Pharmaceuticals 14,276 1,222,162 0.72Pargesa Holding SA Investment Companies 2,565 213,231 0.13Roche Holding AG Pharmaceuticals 4,418 1,127,825 0.66Schindler Holding AG Hand/Machine Tools 8,217 1,815,063 1.07Sonova Holding AG Healthcare – Products 9,159 1,554,008 0.91Swiss Prime Site AG Real Estate 15,046 1,352,563 0.79Swisscom AG Telecommunications 4,305 2,205,960 1.30
13,274,087 7.80
United KingdomeasyJet plc Airlines 1,364 22,244 0.01G4S plc Commercial Services 23,531 87,752 0.05Imperial Brands plc Agriculture 199 8,490 0.00Rio Tinto Limited Mining 1,199 62,571 0.04Tate & Lyle plc Food 3,420 29,720 0.02
210,777 0.12
United StatesAbbVie Incorporated Pharmaceuticals 11,147 990,522 0.58AGNC Investment Corporation REIT 196,772 4,266,017 2.51Altria Group Incorporated Agriculture 25,635 1,625,772 0.96AmerisourceBergen Corporation Pharmaceuticals 7,830 647,933 0.38Amgen Incorporated Biotechnology 1,346 250,962 0.15Annaly Capital Management Incorporated REIT 338,311 4,124,011 2.42Baxter International Incorporated Healthcare – Products 16,482 1,034,246 0.61Carnival plc Leisure Time 16,619 1,056,240 0.62Clorox Company Household Products/Wares 24,312 3,206,996 1.88Coca-Cola Company Beverages 38,621 1,738,331 1.02Consolidated Edison Incorporated Electric 13,288 1,072,076 0.63Darden Restaurants Incorporated Retail 19,542 1,539,519 0.91Dr Pepper Snapple Group Incorporated Beverages 6,379 564,350 0.33Exelon Corporation Electric 81,651 3,075,793 1.81Gap Incorporated Retail 43,858 1,295,127 0.76
The accompanying notes are an integral part of these financial statements.
China Equity Fund, EUR Investment Grade Credit Fund, Global Long/Short Equity Fund, Global Low Volatility Equity Fund, Global Opportunity Bond Fund, U.S.
Dollar Short-Term Money Market Fund and USD Investment Grade Credit Fund have not been authorised by the Hong Kong Securities and Futures Commission
and are not available for investment by Hong Kong retail investors.

Portfolio of investments as at 30 September 2017 (unaudited) (continued) Wells Fargo (Lux) Worldwide Fund 31
GLOBAL LOW VOLATILITY EQUITY FUND
Industry Shares
MarketValue
USD
% ofNet
Assets
Transferable securities and money market instruments admitted to an official stock exchange listing or dealt in on another regulated market(continued)
Common Shares (continued)
United States continued
Gilead Sciences Incorporated Biotechnology 38,445 3,114,814 1.83
Hershey Company Food 6,520 711,788 0.42
Humana Incorporated Healthcare – Services 3,788 922,870 0.54
Intuitive Surgical Incorporated Healthcare – Products 2,221 2,322,899 1.37
Johnson & Johnson Pharmaceuticals 30,251 3,932,933 2.31
Kimberly-Clark Corporation Household Products/Wares 3,354 394,699 0.23
McDonald’s Corporation Retail 25,282 3,961,184 2.33
Merck & Company Incorporated Pharmaceuticals 57,447 3,678,331 2.16
PepsiCo Incorporated Beverages 20,151 2,245,426 1.32
Procter & Gamble Company Cosmetics/Personal Care 33,894 3,083,676 1.81
Southern Company Electric 44,112 2,167,664 1.27
Symantec Corporation Internet 18,863 618,895 0.36
Sysco Corporation Food 55,829 3,011,975 1.77
Tyson Foods Incorporated Food 20,947 1,475,716 0.87
United Therapeutics Corporation Biotechnology 19,618 2,299,033 1.35
VMware Incorporated Software 20,846 2,276,175 1.34
Wal-Mart Stores Incorporated Retail 38,017 2,970,648 1.75
65,676,621 38.60
Total Common Shares 168,402,270 98.96
Rights
SingaporeCapitaLand Commercial Trust REIT 140,004 30,138 0.02
Total Rights 30,138 0.02
Total Investments in Securities 168,432,408 98.98
InterestRate
% Nominal @
Cash at Banks
Time Deposits
Cayman IslandsBBH Grand Cayman (o) (0.23) 491,173 JPY 4,365 0.00
BBH Grand Cayman (o) 0.01 4,716 SGD 3,476 0.00
BBH Grand Cayman (o) 0.05 5,191 GBP 6,957 0.01
BBH Grand Cayman (o) 0.15 19,197 CAD 15,385 0.01
BBH Grand Cayman (o) 0.70 20,695 NZD 14,948 0.01
45,131 0.03
FranceBNP Paribas (o) 0.01 587,963 HKD 75,268 0.04
GermanyDeutsche Bank (o) (0.56) 18,320 EUR 21,653 0.01
JapanSumitomo Mitsui Banking Corporation (o) 0.59 892,166 USD 892,166 0.52
The accompanying notes are an integral part of these financial statements.
China Equity Fund, EUR Investment Grade Credit Fund, Global Long/Short Equity Fund, Global Low Volatility Equity Fund, Global Opportunity Bond Fund, U.S.
Dollar Short-Term Money Market Fund and USD Investment Grade Credit Fund have not been authorised by the Hong Kong Securities and Futures Commission
and are not available for investment by Hong Kong retail investors.
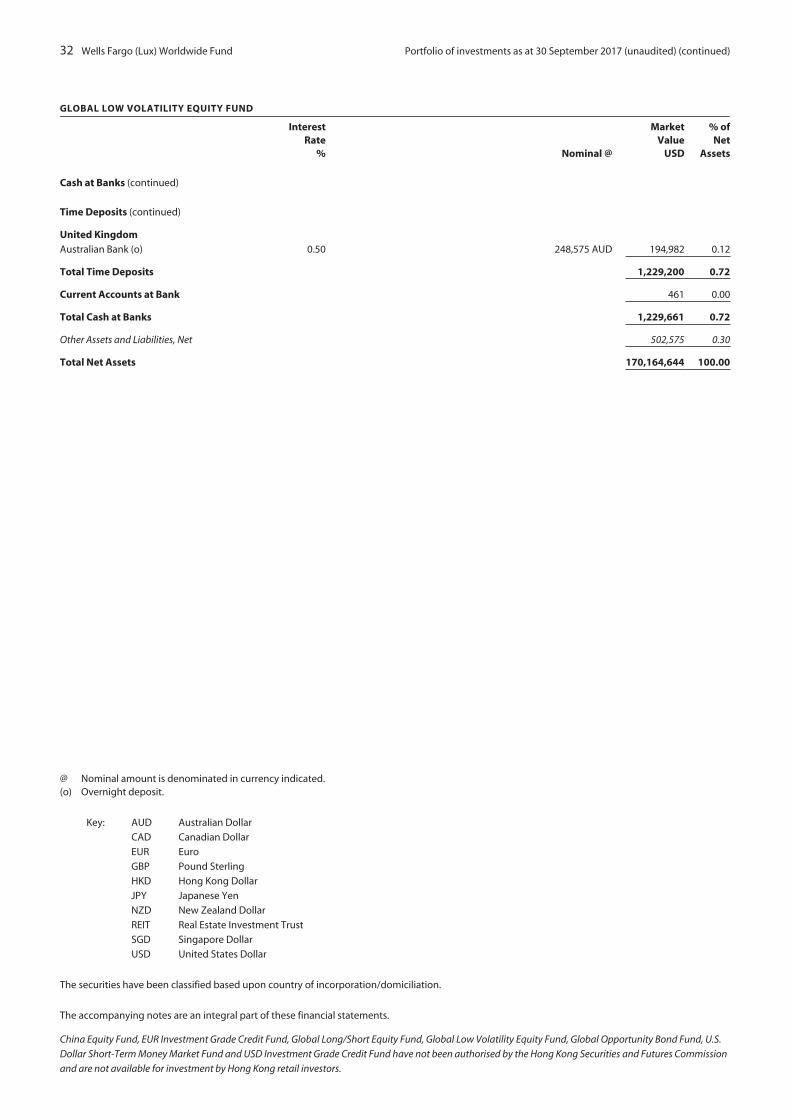
32 Wells Fargo (Lux) Worldwide Fund Portfolio of investments as at 30 September 2017 (unaudited) (continued)
GLOBAL LOW VOLATILITY EQUITY FUND
InterestRate
% Nominal @
MarketValue
USD
% ofNet
Assets
Cash at Banks (continued)
Time Deposits (continued)
United KingdomAustralian Bank (o) 0.50 248,575 AUD 194,982 0.12
Total Time Deposits 1,229,200 0.72
Current Accounts at Bank 461 0.00
Total Cash at Banks 1,229,661 0.72
Other Assets and Liabilities, Net 502,575 0.30
Total Net Assets 170,164,644 100.00
@ Nominal amount is denominated in currency indicated.(o) Overnight deposit.
Key: AUD Australian Dollar
CAD Canadian Dollar
EUR Euro
GBP Pound Sterling
HKD Hong Kong Dollar
JPY Japanese Yen
NZD New Zealand Dollar
REIT Real Estate Investment Trust
SGD Singapore Dollar
USD United States Dollar
The securities have been classified based upon country of incorporation/domiciliation.
The accompanying notes are an integral part of these financial statements.
China Equity Fund, EUR Investment Grade Credit Fund, Global Long/Short Equity Fund, Global Low Volatility Equity Fund, Global Opportunity Bond Fund, U.S.
Dollar Short-Term Money Market Fund and USD Investment Grade Credit Fund have not been authorised by the Hong Kong Securities and Futures Commission
and are not available for investment by Hong Kong retail investors.

Portfolio of investments as at 30 September 2017 (unaudited) Wells Fargo (Lux) Worldwide Fund 33
GLOBAL OPPORTUNITY BOND FUND
InterestRate
%Maturity
Date Industry Nominal @
MarketValue
USD
% ofNet
Assets
Transferable securities and money market instruments admitted to an official stock exchange listing or dealt in on another regulated market
Corporate Bonds and Notes
Brazil
BRF SA 7.75 22/5/2018 Food 300,000 BRL 93,538 0.49
Denmark
Nykredit Realkredit AS 2.00 1/10/2047 Banks 606,691 DKK 96,231 0.50
Nykredit Realkredit AS 2.50 1/10/2047 Banks 856,157 DKK 140,806 0.74
Realkredit Danmark AS 2.00 1/10/2047 Banks 254,114 DKK 40,307 0.21
277,344 1.45
Jersey
Heathrow Funding Limited 7.13 14/2/2024 Engineering & Construction 100,000 GBP 169,800 0.89
Mexico
Sigma Alimentos SA de CV 2.63 7/2/2024 Food 150,000 EUR 187,896 0.98
Netherlands
ABN AMRO Bank NV 2.45 4/6/2020 Banks 250,000 USD 251,880 1.32
United Kingdom
BP Capital Markets plc 3.22 14/4/2024 Oil & Gas Services 100,000 USD 102,190 0.54
United States
Abbott Laboratories 3.40 30/11/2023 Healthcare – Products 150,000 USD 154,407 0.81
AbbVie Incorporated 3.20 14/5/2026 Pharmaceuticals 150,000 USD 150,244 0.79
Amazon.com Incorporated 3.15 22/8/2027 Internet 100,000 USD 100,385 0.53
Anheuser-Busch InBev Finance Incorporated 3.65 1/2/2026 Beverages 150,000 USD 155,119 0.81
Apple Incorporated 2.90 12/9/2027 Computers 100,000 USD 99,121 0.52
AT&T Incorporated 3.90 14/8/2027 Telecommunications 150,000 USD 150,169 0.79
Bank of America Corporation 4.00 1/4/2024 Banks 150,000 USD 158,419 0.83
Chubb INA Holdings Incorporated 3.35 3/5/2026 Insurance 100,000 USD 102,482 0.54
Comcast Corporation 3.30 1/2/2027 Media 150,000 USD 152,010 0.80
Cox Communications Incorporated 3.50 15/8/2027 Media 150,000 USD 147,559 0.77
Discovery Communications LLC 3.95 20/3/2028 Media 25,000 USD 24,931 0.13
Gilead Sciences Incorporated 2.95 1/3/2027 Biotechnology 100,000 USD 99,029 0.52
Goldman Sachs Group Incorporated 3.75 25/2/2026 Banks 150,000 USD 153,502 0.80
Johnson & Johnson 2.95 3/3/2027 Pharmaceuticals 150,000 USD 152,102 0.80
JPMorgan Chase & Company 3.25 23/9/2022 Banks 150,000 USD 154,856 0.81
Kraft Heinz Foods Company 3.00 1/6/2026 Food 150,000 USD 143,834 0.75
Microsoft Corporation 2.40 8/8/2026 Software 125,000 USD 121,123 0.63
Morgan Stanley 3.88 29/4/2024 Banks 150,000 USD 157,439 0.82
Novartis Capital Corporation 3.00 20/11/2025 Pharmaceuticals 100,000 USD 102,057 0.53
Oracle Corporation 2.65 15/7/2026 Software 75,000 USD 73,496 0.38
QUALCOMM Incorporated 3.25 20/5/2027 Semiconductors 200,000 USD 201,621 1.06
Thermo Fisher Scientific Incorporated 2.95 19/9/2026 Healthcare – Products 100,000 USD 97,830 0.51
2,851,735 14.93
Total Corporate Bonds and Notes 3,934,383 20.60
The accompanying notes are an integral part of these financial statements.
China Equity Fund, EUR Investment Grade Credit Fund, Global Long/Short Equity Fund, Global Low Volatility Equity Fund, Global Opportunity Bond Fund, U.S.
Dollar Short-Term Money Market Fund and USD Investment Grade Credit Fund have not been authorised by the Hong Kong Securities and Futures Commission
and are not available for investment by Hong Kong retail investors.
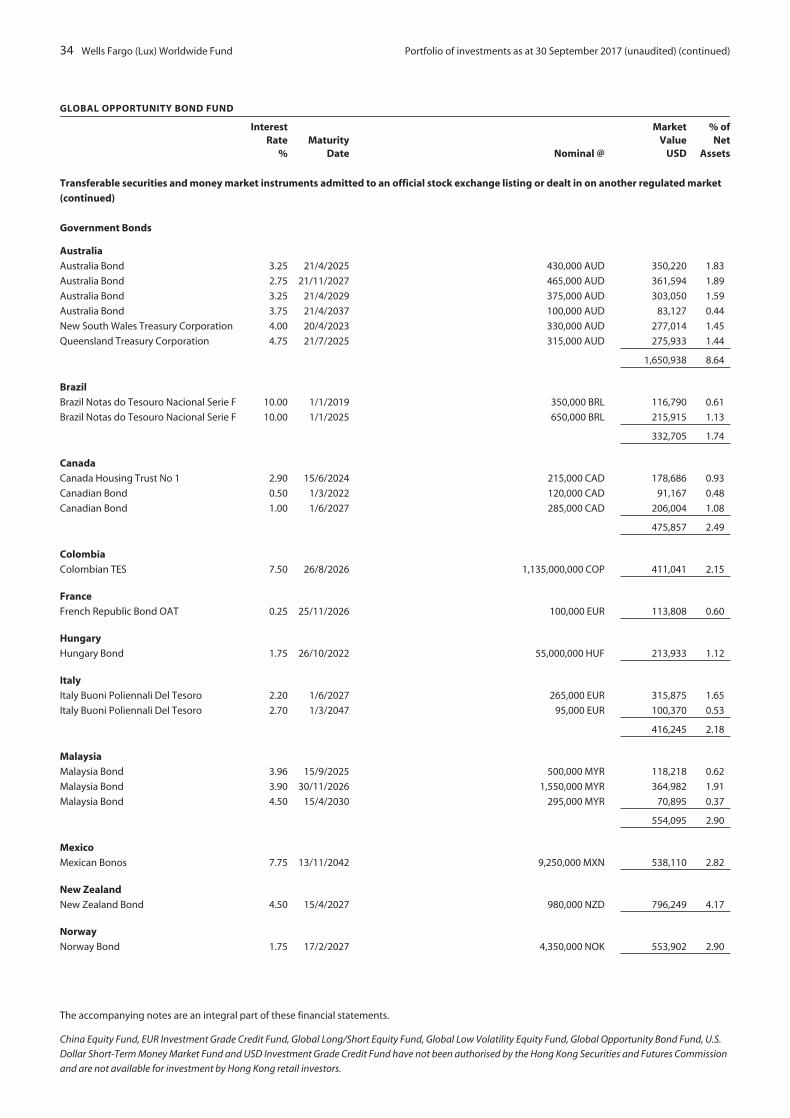
34 Wells Fargo (Lux) Worldwide Fund Portfolio of investments as at 30 September 2017 (unaudited) (continued)
GLOBAL OPPORTUNITY BOND FUND
InterestRate
%Maturity
Date Nominal @
MarketValue
USD
% ofNet
Assets
Transferable securities and money market instruments admitted to an official stock exchange listing or dealt in on another regulated market
(continued)
Government Bonds
Australia
Australia Bond 3.25 21/4/2025 430,000 AUD 350,220 1.83
Australia Bond 2.75 21/11/2027 465,000 AUD 361,594 1.89
Australia Bond 3.25 21/4/2029 375,000 AUD 303,050 1.59
Australia Bond 3.75 21/4/2037 100,000 AUD 83,127 0.44
New South Wales Treasury Corporation 4.00 20/4/2023 330,000 AUD 277,014 1.45
Queensland Treasury Corporation 4.75 21/7/2025 315,000 AUD 275,933 1.44
1,650,938 8.64
Brazil
Brazil Notas do Tesouro Nacional Serie F 10.00 1/1/2019 350,000 BRL 116,790 0.61
Brazil Notas do Tesouro Nacional Serie F 10.00 1/1/2025 650,000 BRL 215,915 1.13
332,705 1.74
Canada
Canada Housing Trust No 1 2.90 15/6/2024 215,000 CAD 178,686 0.93
Canadian Bond 0.50 1/3/2022 120,000 CAD 91,167 0.48
Canadian Bond 1.00 1/6/2027 285,000 CAD 206,004 1.08
475,857 2.49
Colombia
Colombian TES 7.50 26/8/2026 1,135,000,000 COP 411,041 2.15
France
French Republic Bond OAT 0.25 25/11/2026 100,000 EUR 113,808 0.60
Hungary
Hungary Bond 1.75 26/10/2022 55,000,000 HUF 213,933 1.12
Italy
Italy Buoni Poliennali Del Tesoro 2.20 1/6/2027 265,000 EUR 315,875 1.65
Italy Buoni Poliennali Del Tesoro 2.70 1/3/2047 95,000 EUR 100,370 0.53
416,245 2.18
Malaysia
Malaysia Bond 3.96 15/9/2025 500,000 MYR 118,218 0.62
Malaysia Bond 3.90 30/11/2026 1,550,000 MYR 364,982 1.91
Malaysia Bond 4.50 15/4/2030 295,000 MYR 70,895 0.37
554,095 2.90
Mexico
Mexican Bonos 7.75 13/11/2042 9,250,000 MXN 538,110 2.82
New Zealand
New Zealand Bond 4.50 15/4/2027 980,000 NZD 796,249 4.17
Norway
Norway Bond 1.75 17/2/2027 4,350,000 NOK 553,902 2.90
The accompanying notes are an integral part of these financial statements.
China Equity Fund, EUR Investment Grade Credit Fund, Global Long/Short Equity Fund, Global Low Volatility Equity Fund, Global Opportunity Bond Fund, U.S.
Dollar Short-Term Money Market Fund and USD Investment Grade Credit Fund have not been authorised by the Hong Kong Securities and Futures Commission
and are not available for investment by Hong Kong retail investors.
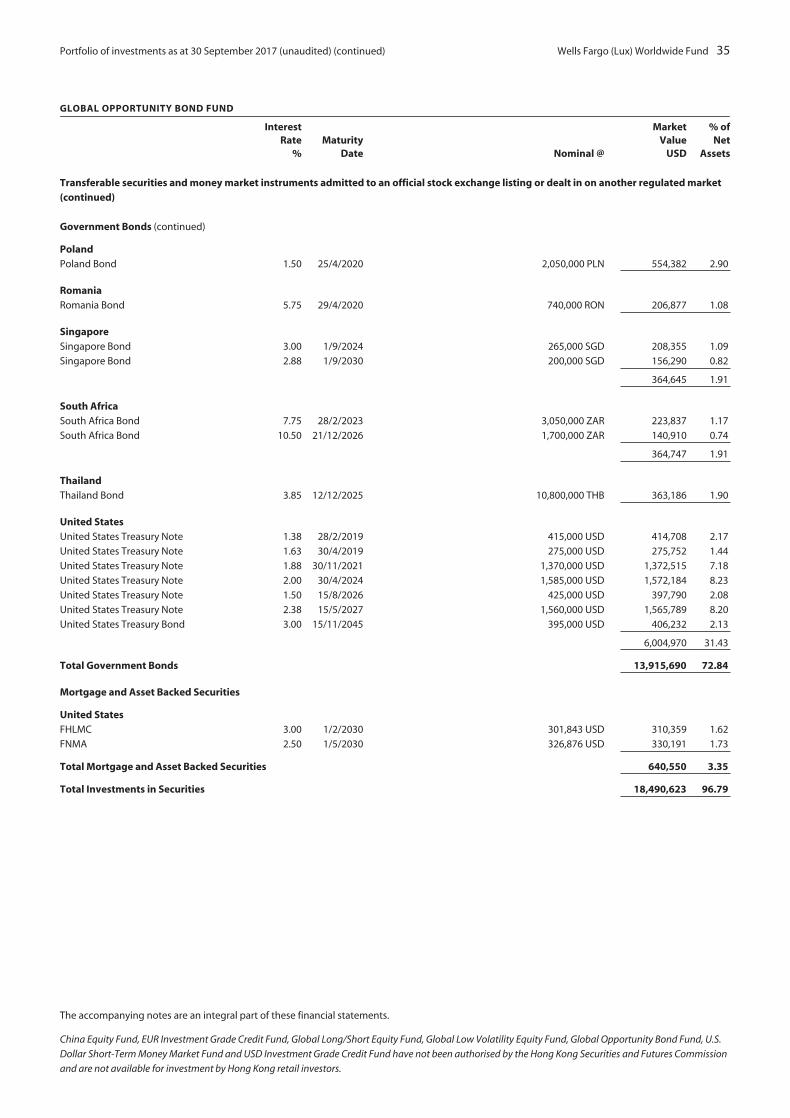
Portfolio of investments as at 30 September 2017 (unaudited) (continued) Wells Fargo (Lux) Worldwide Fund 35
GLOBAL OPPORTUNITY BOND FUND
InterestRate
%Maturity
Date Nominal @
MarketValue
USD
% ofNet
Assets
Transferable securities and money market instruments admitted to an official stock exchange listing or dealt in on another regulated market(continued)
Government Bonds (continued)
PolandPoland Bond 1.50 25/4/2020 2,050,000 PLN 554,382 2.90
RomaniaRomania Bond 5.75 29/4/2020 740,000 RON 206,877 1.08
SingaporeSingapore Bond 3.00 1/9/2024 265,000 SGD 208,355 1.09
Singapore Bond 2.88 1/9/2030 200,000 SGD 156,290 0.82
364,645 1.91
South AfricaSouth Africa Bond 7.75 28/2/2023 3,050,000 ZAR 223,837 1.17
South Africa Bond 10.50 21/12/2026 1,700,000 ZAR 140,910 0.74
364,747 1.91
ThailandThailand Bond 3.85 12/12/2025 10,800,000 THB 363,186 1.90
United StatesUnited States Treasury Note 1.38 28/2/2019 415,000 USD 414,708 2.17
United States Treasury Note 1.63 30/4/2019 275,000 USD 275,752 1.44
United States Treasury Note 1.88 30/11/2021 1,370,000 USD 1,372,515 7.18
United States Treasury Note 2.00 30/4/2024 1,585,000 USD 1,572,184 8.23
United States Treasury Note 1.50 15/8/2026 425,000 USD 397,790 2.08
United States Treasury Note 2.38 15/5/2027 1,560,000 USD 1,565,789 8.20
United States Treasury Bond 3.00 15/11/2045 395,000 USD 406,232 2.13
6,004,970 31.43
Total Government Bonds 13,915,690 72.84
Mortgage and Asset Backed Securities
United StatesFHLMC 3.00 1/2/2030 301,843 USD 310,359 1.62
FNMA 2.50 1/5/2030 326,876 USD 330,191 1.73
Total Mortgage and Asset Backed Securities 640,550 3.35
Total Investments in Securities 18,490,623 96.79
The accompanying notes are an integral part of these financial statements.
China Equity Fund, EUR Investment Grade Credit Fund, Global Long/Short Equity Fund, Global Low Volatility Equity Fund, Global Opportunity Bond Fund, U.S.
Dollar Short-Term Money Market Fund and USD Investment Grade Credit Fund have not been authorised by the Hong Kong Securities and Futures Commission
and are not available for investment by Hong Kong retail investors.

36 Wells Fargo (Lux) Worldwide Fund Portfolio of investments as at 30 September 2017 (unaudited) (continued)
GLOBAL OPPORTUNITY BOND FUND
InterestRate
% Nominal @
MarketValue
USD
% ofNet
Assets
Cash at Banks
Time Deposits
Cayman IslandsBBH Grand Cayman (o) (0.56) 1,283 EUR 1,516 0.01
BBH Grand Cayman (o) 0.50 2 AUD 1 0.00
1,517 0.01
United KingdomStandard Chartered Bank (o) 0.59 460,380 USD 460,380 2.41
Total Time Deposits 461,897 2.42
Current Accounts at Bank 2,361 0.01
Total Cash at Banks 464,258 2.43
Other assets and liabilities, Net 149,110 0.78
Total Net Assets 19,103,991 100.00
@ Nominal amount is denominated in currency indicated.(o) Overnight deposit.
Key: AUD Australian Dollar
BRL Brazilian Real
CAD Canadian Dollar
COP Colombian Peso
DKK Danish Krone
EUR Euro
GBP Pound Sterling
HUF Hungarian Forint
MXN Mexican Peso
MYR Malaysian Ringgit
NOK Norwegian Krone
NZD New Zealand Dollar
PLN Polish Zloty
RON Romanian New Leu
SGD Singapore Dollar
THB Thai Baht
USD United States Dollar
ZAR South African Rand
The securities have been classified based upon country of incorporation/domiciliation.
The accompanying notes are an integral part of these financial statements.
China Equity Fund, EUR Investment Grade Credit Fund, Global Long/Short Equity Fund, Global Low Volatility Equity Fund, Global Opportunity Bond Fund, U.S.
Dollar Short-Term Money Market Fund and USD Investment Grade Credit Fund have not been authorised by the Hong Kong Securities and Futures Commission
and are not available for investment by Hong Kong retail investors.
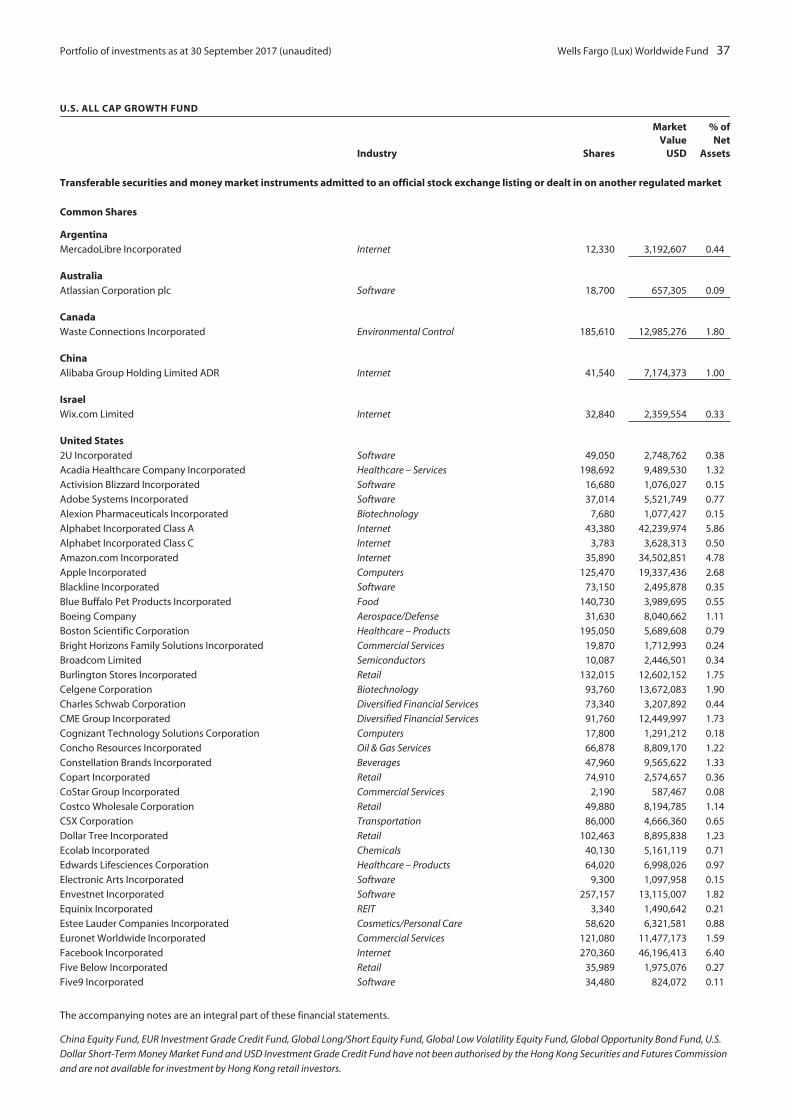
Portfolio of investments as at 30 September 2017 (unaudited) Wells Fargo (Lux) Worldwide Fund 37
U.S. ALL CAP GROWTH FUND
Industry Shares
MarketValue
USD
% ofNet
Assets
Transferable securities and money market instruments admitted to an official stock exchange listing or dealt in on another regulated market
Common Shares
ArgentinaMercadoLibre Incorporated Internet 12,330 3,192,607 0.44
AustraliaAtlassian Corporation plc Software 18,700 657,305 0.09
CanadaWaste Connections Incorporated Environmental Control 185,610 12,985,276 1.80
ChinaAlibaba Group Holding Limited ADR Internet 41,540 7,174,373 1.00
IsraelWix.com Limited Internet 32,840 2,359,554 0.33
United States2U Incorporated Software 49,050 2,748,762 0.38
Acadia Healthcare Company Incorporated Healthcare – Services 198,692 9,489,530 1.32
Activision Blizzard Incorporated Software 16,680 1,076,027 0.15
Adobe Systems Incorporated Software 37,014 5,521,749 0.77
Alexion Pharmaceuticals Incorporated Biotechnology 7,680 1,077,427 0.15
Alphabet Incorporated Class A Internet 43,380 42,239,974 5.86
Alphabet Incorporated Class C Internet 3,783 3,628,313 0.50
Amazon.com Incorporated Internet 35,890 34,502,851 4.78
Apple Incorporated Computers 125,470 19,337,436 2.68
Blackline Incorporated Software 73,150 2,495,878 0.35
Blue Buffalo Pet Products Incorporated Food 140,730 3,989,695 0.55
Boeing Company Aerospace/Defense 31,630 8,040,662 1.11
Boston Scientific Corporation Healthcare – Products 195,050 5,689,608 0.79
Bright Horizons Family Solutions Incorporated Commercial Services 19,870 1,712,993 0.24
Broadcom Limited Semiconductors 10,087 2,446,501 0.34
Burlington Stores Incorporated Retail 132,015 12,602,152 1.75
Celgene Corporation Biotechnology 93,760 13,672,083 1.90
Charles Schwab Corporation Diversified Financial Services 73,340 3,207,892 0.44
CME Group Incorporated Diversified Financial Services 91,760 12,449,997 1.73
Cognizant Technology Solutions Corporation Computers 17,800 1,291,212 0.18
Concho Resources Incorporated Oil & Gas Services 66,878 8,809,170 1.22
Constellation Brands Incorporated Beverages 47,960 9,565,622 1.33
Copart Incorporated Retail 74,910 2,574,657 0.36
CoStar Group Incorporated Commercial Services 2,190 587,467 0.08
Costco Wholesale Corporation Retail 49,880 8,194,785 1.14
CSX Corporation Transportation 86,000 4,666,360 0.65
Dollar Tree Incorporated Retail 102,463 8,895,838 1.23
Ecolab Incorporated Chemicals 40,130 5,161,119 0.71
Edwards Lifesciences Corporation Healthcare – Products 64,020 6,998,026 0.97
Electronic Arts Incorporated Software 9,300 1,097,958 0.15
Envestnet Incorporated Software 257,157 13,115,007 1.82
Equinix Incorporated REIT 3,340 1,490,642 0.21
Estee Lauder Companies Incorporated Cosmetics/Personal Care 58,620 6,321,581 0.88
Euronet Worldwide Incorporated Commercial Services 121,080 11,477,173 1.59
Facebook Incorporated Internet 270,360 46,196,413 6.40
Five Below Incorporated Retail 35,989 1,975,076 0.27
Five9 Incorporated Software 34,480 824,072 0.11
The accompanying notes are an integral part of these financial statements.
China Equity Fund, EUR Investment Grade Credit Fund, Global Long/Short Equity Fund, Global Low Volatility Equity Fund, Global Opportunity Bond Fund, U.S.
Dollar Short-Term Money Market Fund and USD Investment Grade Credit Fund have not been authorised by the Hong Kong Securities and Futures Commission
and are not available for investment by Hong Kong retail investors.
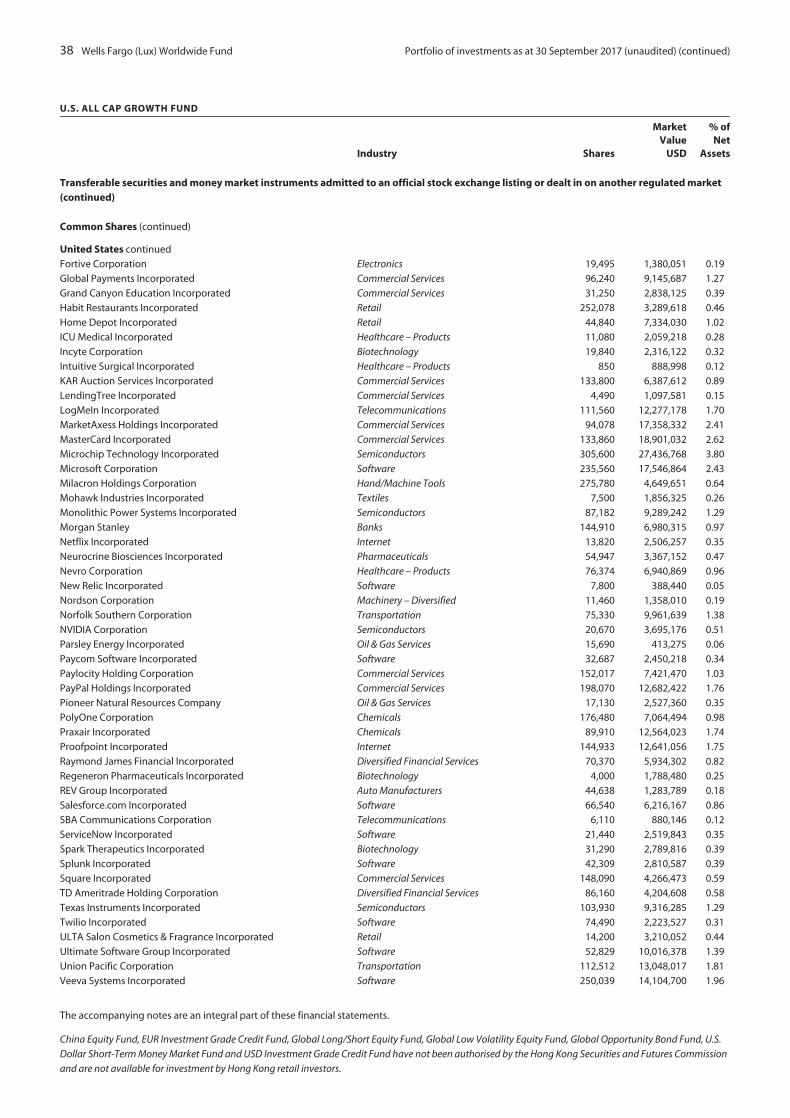
38 Wells Fargo (Lux) Worldwide Fund Portfolio of investments as at 30 September 2017 (unaudited) (continued)
U.S. ALL CAP GROWTH FUND
Industry Shares
MarketValue
USD
% ofNet
Assets
Transferable securities and money market instruments admitted to an official stock exchange listing or dealt in on another regulated market(continued)
Common Shares (continued)
United States continued
Fortive Corporation Electronics 19,495 1,380,051 0.19
Global Payments Incorporated Commercial Services 96,240 9,145,687 1.27
Grand Canyon Education Incorporated Commercial Services 31,250 2,838,125 0.39
Habit Restaurants Incorporated Retail 252,078 3,289,618 0.46
Home Depot Incorporated Retail 44,840 7,334,030 1.02
ICU Medical Incorporated Healthcare – Products 11,080 2,059,218 0.28
Incyte Corporation Biotechnology 19,840 2,316,122 0.32
Intuitive Surgical Incorporated Healthcare – Products 850 888,998 0.12
KAR Auction Services Incorporated Commercial Services 133,800 6,387,612 0.89
LendingTree Incorporated Commercial Services 4,490 1,097,581 0.15
LogMeIn Incorporated Telecommunications 111,560 12,277,178 1.70
MarketAxess Holdings Incorporated Commercial Services 94,078 17,358,332 2.41
MasterCard Incorporated Commercial Services 133,860 18,901,032 2.62
Microchip Technology Incorporated Semiconductors 305,600 27,436,768 3.80
Microsoft Corporation Software 235,560 17,546,864 2.43
Milacron Holdings Corporation Hand/Machine Tools 275,780 4,649,651 0.64
Mohawk Industries Incorporated Textiles 7,500 1,856,325 0.26
Monolithic Power Systems Incorporated Semiconductors 87,182 9,289,242 1.29
Morgan Stanley Banks 144,910 6,980,315 0.97
Netflix Incorporated Internet 13,820 2,506,257 0.35
Neurocrine Biosciences Incorporated Pharmaceuticals 54,947 3,367,152 0.47
Nevro Corporation Healthcare – Products 76,374 6,940,869 0.96
New Relic Incorporated Software 7,800 388,440 0.05
Nordson Corporation Machinery – Diversified 11,460 1,358,010 0.19
Norfolk Southern Corporation Transportation 75,330 9,961,639 1.38
NVIDIA Corporation Semiconductors 20,670 3,695,176 0.51
Parsley Energy Incorporated Oil & Gas Services 15,690 413,275 0.06
Paycom Software Incorporated Software 32,687 2,450,218 0.34
Paylocity Holding Corporation Commercial Services 152,017 7,421,470 1.03
PayPal Holdings Incorporated Commercial Services 198,070 12,682,422 1.76
Pioneer Natural Resources Company Oil & Gas Services 17,130 2,527,360 0.35
PolyOne Corporation Chemicals 176,480 7,064,494 0.98
Praxair Incorporated Chemicals 89,910 12,564,023 1.74
Proofpoint Incorporated Internet 144,933 12,641,056 1.75
Raymond James Financial Incorporated Diversified Financial Services 70,370 5,934,302 0.82
Regeneron Pharmaceuticals Incorporated Biotechnology 4,000 1,788,480 0.25
REV Group Incorporated Auto Manufacturers 44,638 1,283,789 0.18
Salesforce.com Incorporated Software 66,540 6,216,167 0.86
SBA Communications Corporation Telecommunications 6,110 880,146 0.12
ServiceNow Incorporated Software 21,440 2,519,843 0.35
Spark Therapeutics Incorporated Biotechnology 31,290 2,789,816 0.39
Splunk Incorporated Software 42,309 2,810,587 0.39
Square Incorporated Commercial Services 148,090 4,266,473 0.59
TD Ameritrade Holding Corporation Diversified Financial Services 86,160 4,204,608 0.58
Texas Instruments Incorporated Semiconductors 103,930 9,316,285 1.29
Twilio Incorporated Software 74,490 2,223,527 0.31
ULTA Salon Cosmetics & Fragrance Incorporated Retail 14,200 3,210,052 0.44
Ultimate Software Group Incorporated Software 52,829 10,016,378 1.39
Union Pacific Corporation Transportation 112,512 13,048,017 1.81
Veeva Systems Incorporated Software 250,039 14,104,700 1.96
The accompanying notes are an integral part of these financial statements.
China Equity Fund, EUR Investment Grade Credit Fund, Global Long/Short Equity Fund, Global Low Volatility Equity Fund, Global Opportunity Bond Fund, U.S.
Dollar Short-Term Money Market Fund and USD Investment Grade Credit Fund have not been authorised by the Hong Kong Securities and Futures Commission
and are not available for investment by Hong Kong retail investors.
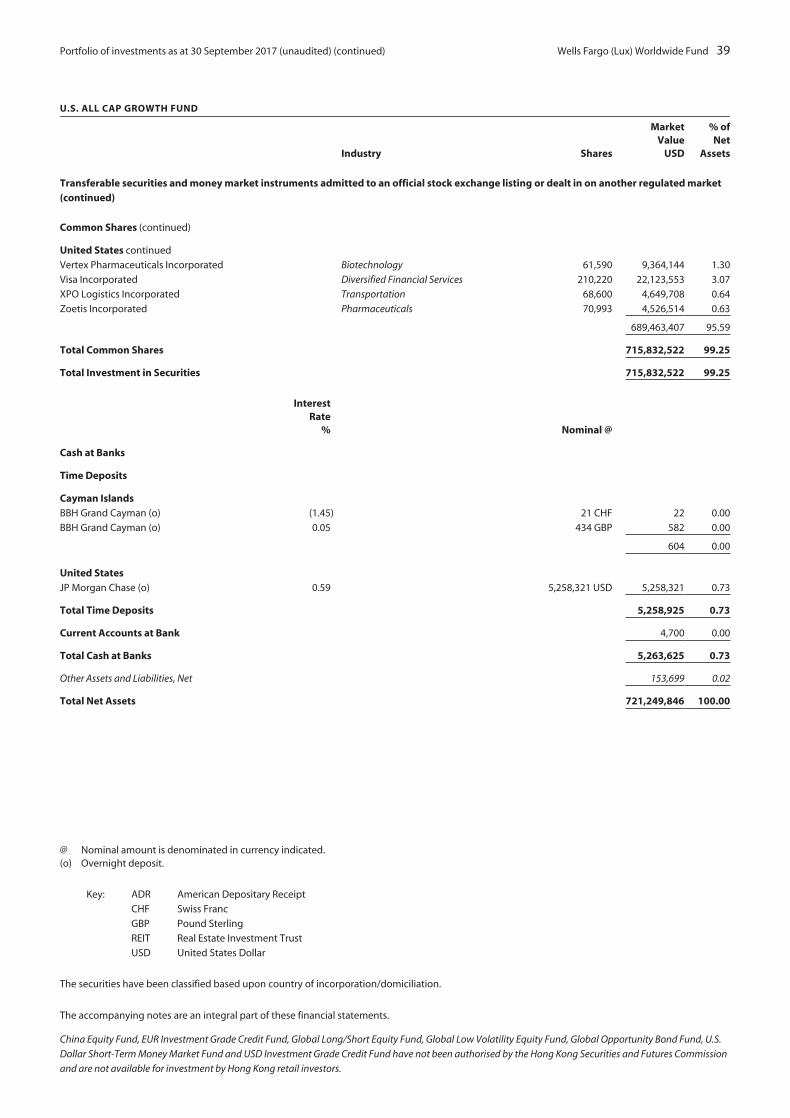
Portfolio of investments as at 30 September 2017 (unaudited) (continued) Wells Fargo (Lux) Worldwide Fund 39
U.S. ALL CAP GROWTH FUND
Industry Shares
MarketValue
USD
% ofNet
Assets
Transferable securities and money market instruments admitted to an official stock exchange listing or dealt in on another regulated market(continued)
Common Shares (continued)
United States continued
Vertex Pharmaceuticals Incorporated Biotechnology 61,590 9,364,144 1.30
Visa Incorporated Diversified Financial Services 210,220 22,123,553 3.07
XPO Logistics Incorporated Transportation 68,600 4,649,708 0.64
Zoetis Incorporated Pharmaceuticals 70,993 4,526,514 0.63
689,463,407 95.59
Total Common Shares 715,832,522 99.25
Total Investment in Securities 715,832,522 99.25
InterestRate
% Nominal @
Cash at Banks
Time Deposits
Cayman IslandsBBH Grand Cayman (o) (1.45) 21 CHF 22 0.00
BBH Grand Cayman (o) 0.05 434 GBP 582 0.00
604 0.00
United StatesJP Morgan Chase (o) 0.59 5,258,321 USD 5,258,321 0.73
Total Time Deposits 5,258,925 0.73
Current Accounts at Bank 4,700 0.00
Total Cash at Banks 5,263,625 0.73
Other Assets and Liabilities, Net 153,699 0.02
Total Net Assets 721,249,846 100.00
@ Nominal amount is denominated in currency indicated.(o) Overnight deposit.
Key: ADR American Depositary Receipt
CHF Swiss Franc
GBP Pound Sterling
REIT Real Estate Investment Trust
USD United States Dollar
The securities have been classified based upon country of incorporation/domiciliation.
The accompanying notes are an integral part of these financial statements.
China Equity Fund, EUR Investment Grade Credit Fund, Global Long/Short Equity Fund, Global Low Volatility Equity Fund, Global Opportunity Bond Fund, U.S.
Dollar Short-Term Money Market Fund and USD Investment Grade Credit Fund have not been authorised by the Hong Kong Securities and Futures Commission
and are not available for investment by Hong Kong retail investors.

40 Wells Fargo (Lux) Worldwide Fund Portfolio of investments as at 30 September 2017 (unaudited)
U.S. DOLLAR SHORT-TERM MONEY MARKET FUND
InterestRate
%Maturity
DateNominal
USD
MarketValue
USD
% ofNet
Assets
Transferable securities and money market instruments admitted to an official stock exchange listing or dealt in on another regulated market
Certificates of DepositAbbey National Treasury Services ± 1.41 15/12/2017 5,000,000 5,000,000 0.47
Bank of Nova Scotia ± 1.39 20/3/2018 10,000,000 10,000,000 0.95
China Construction Bank Corporation ± 0.00 20/7/2018 25,000,000 25,000,000 2.38
Citibank ± 1.33 3/1/2018 15,000,000 15,000,000 1.43
Commonwealth Bank of Australia ± 1.40 30/7/2018 5,000,000 5,000,000 0.48
Credit Suisse ± 1.46 7/11/2017 5,000,000 5,000,000 0.48
Erste Abwicklungs Anstalt ± 1.46 27/10/2017 10,000,000 10,000,000 0.95
HSBC Bank USA NA ± 1.46 11/5/2018 5,000,000 5,000,000 0.47
HSBC Bank USA NA ± 1.44 9/8/2018 5,000,000 5,000,000 0.48
Mizuho Bank Limited ± 1.54 10/10/2017 10,000,000 10,000,000 0.95
Mizuho Bank Limited ± 1.46 8/11/2017 8,000,000 8,000,503 0.76
Sumitomo Mitsui Banking Corporation ± 1.41 30/11/2017 20,000,000 20,002,052 1.91
Sumitomo Mitsui Banking Corporation ± 1.41 16/1/2018 15,000,000 15,000,000 1.43
Toronto-Dominion Bank ± 1.57 5/3/2018 5,000,000 5,000,000 0.48
Toronto-Dominion Bank ± 1.44 10/8/2018 5,000,000 5,000,000 0.48
Total Certificates of Deposit 148,002,555 14.10
Commercial Paper
Asset-Backed Commercial PaperAlpine Securitization Limited ± 1.47 10/4/2018 5,000,000 5,000,000 0.48
Anglesea Funding LLC ± 1.42 25/5/2018 5,000,000 5,000,000 0.48
Antalis SA (z) 1.37 16/10/2017 5,000,000 4,997,336 0.48
Antalis SA (z) 1.37 7/11/2017 4,000,000 3,994,520 0.38
Bedford Row Funding Corporation ± 1.46 31/5/2018 10,000,000 10,000,000 0.95
Chesham Finance Limited (z) 1.23 2/10/2017 10,000,000 10,000,000 0.95
Chesham Finance Limited (z) 1.23 2/10/2017 15,000,000 15,000,000 1.43
Chesham Finance Limited (z) 1.51 18/12/2017 5,000,000 4,983,958 0.47
ConcordMinutemen Capital Company (z) 1.34 20/10/2017 10,000,000 9,993,300 0.95
Crown Point Capital Company LLC ± 1.49 26/2/2018 5,000,000 5,000,000 0.48
Gotham Funding Corporation (z) 1.34 19/12/2017 5,000,000 4,985,483 0.47
Institutional Secured Funding LLC (z) 1.30 2/10/2017 20,000,000 20,000,000 1.91
Lexington Parker Capital Company (z) 1.37 24/10/2017 5,000,000 4,995,814 0.48
Liberty Street Funding LLC (z) 1.31 12/12/2017 15,000,000 14,961,246 1.43
Mountcliff Funding LLC (z) 1.23 2/10/2017 27,000,000 27,000,000 2.57
RegencyMarkets No.1 LLC (z) 1.23 5/10/2017 10,000,000 9,998,975 0.95
Versailles Commercial Paper LLC ± 1.44 27/11/2017 10,000,000 10,000,000 0.95
165,910,632 15.81
Financial Company Commercial PaperABN AMRO Funding LLC (z) 1.30 10/10/2017 8,000,000 7,997,689 0.76
Australia and New Zealand Banking Group ± 1.41 14/8/2018 5,000,000 5,000,000 0.47
Banco de Credito e Inversiones (z) 1.34 5/10/2017 25,000,000 24,997,208 2.38
Bank of Nova Scotia ± 1.45 11/4/2018 7,000,000 7,000,000 0.67
Commonwealth Bank of Australia ± 1.58 1/3/2018 5,000,000 5,000,000 0.48
Commonwealth Bank of Australia ± 1.43 13/4/2018 5,000,000 5,000,000 0.48
Commonwealth Bank of Australia ± 1.43 20/4/2018 2,000,000 2,000,431 0.19
DBS Bank Limited ± 1.43 17/7/2018 10,000,000 10,000,000 0.95
DZ Bank AG (z) 1.21 2/10/2017 27,000,000 27,000,000 2.57
Federation Des Caisses (z) 1.08 2/10/2017 15,000,000 15,000,000 1.43
Intercontinental Exchange (z) 1.15 2/10/2017 25,000,000 25,000,000 2.38
JP Morgan Securities LLC (z) 1.41 8/12/2017 5,000,000 4,986,972 0.48
Macquarie Bank Limited (z) 1.30 2/11/2017 12,000,000 11,986,567 1.14
The accompanying notes are an integral part of these financial statements.
China Equity Fund, EUR Investment Grade Credit Fund, Global Long/Short Equity Fund, Global Low Volatility Equity Fund, Global Opportunity Bond Fund, U.S.
Dollar Short-Term Money Market Fund and USD Investment Grade Credit Fund have not been authorised by the Hong Kong Securities and Futures Commission
and are not available for investment by Hong Kong retail investors.

Portfolio of investments as at 30 September 2017 (unaudited) (continued) Wells Fargo (Lux) Worldwide Fund 41
U.S. DOLLAR SHORT-TERM MONEY MARKET FUND
InterestRate
%Maturity
DateNominal
USD
MarketValue
USD
% ofNet
Assets
Transferable securities and money market instruments admitted to an official stock exchange listing or dealt in on another regulated market(continued)
Commercial Paper (continued)
Financial Company Commercial Paper continued
Macquarie Bank Limited (z) 1.41 8/1/2018 13,000,000 12,950,456 1.23
Massachusetts Mutual Life Insurance
Company (z) 1.17 20/10/2017 25,000,000 24,985,375 2.38
Mitsubishi UFJ Trust and Banking (z) 1.44 17/10/2017 5,000,000 4,997,021 0.48
National Australia Bank Limited ± 1.58 6/3/2018 8,000,000 8,000,000 0.76
National Australia Bank Limited ± 1.42 13/9/2018 5,000,000 5,000,000 0.48
Nationwide Building Society (z) 1.22 16/10/2017 20,000,000 19,990,511 1.91
Oversea-Chinese Banking Corporation (z) 1.32 6/10/2017 10,000,000 9,998,533 0.95
Oversea-Chinese Banking Corporation ± 1.37 11/1/2018 5,000,000 5,000,000 0.48
Oversea-Chinese Banking Corporation ± 1.41 12/2/2018 5,000,000 5,000,372 0.48
Standard Chartered plc (z) 1.32 20/12/2017 22,000,000 21,936,274 2.09
Toronto-Dominion Bank (z) 1.31 19/12/2017 15,000,000 14,957,425 1.43
Toyota Industries Corporation (z) 1.14 5/10/2017 10,000,000 9,999,050 0.95
United Overseas Bank Limited (z) 1.30 30/11/2017 5,000,000 4,989,347 0.47
United Overseas Bank Limited (z) 1.30 15/12/2017 21,000,000 20,943,883 2.00
Westpac Banking Corporation ± 1.55 2/3/2018 10,000,000 10,000,000 0.95
Westpac Banking Corporation ± 1.55 15/3/2018 8,000,000 8,000,000 0.76
1.43 13/4/2018 6,000,000 6,000,000 0.57
343,717,114 32.75
Other Commercial PaperBaylor Scott and White Holdings (z) 1.33 20/11/2017 20,000,000 19,963,795 1.90
Caisse des Depots et Consignations (z) 1.27 1/12/2017 25,000,000 24,947,083 2.38
Nederlandse Waterschapsbank (z) 1.27 2/10/2017 12,000,000 12,000,000 1.14
Nederlandse Waterschapsbank (z) 1.23 16/10/2017 13,000,000 12,993,782 1.24
NV Bank Nederlandse Gemeenten (z) 1.20 12/10/2017 20,000,000 19,993,333 1.91
NV Bank Nederlandse Gemeenten (z) 1.20 16/10/2017 9,000,000 8,995,800 0.86
Ontario Teachers Finance Trust ± 1.37 3/4/2018 5,000,000 5,000,000 0.48
PSP Capital Incorporated ± 1.39 4/5/2018 10,000,000 10,000,000 0.95
PSP Capital Incorporated ± 1.40 30/5/2018 5,000,000 5,000,000 0.48
Toyota Motor Finance (Netherlands) BV ± 1.44 12/3/2018 9,000,000 9,000,000 0.86
Toyota Motor Finance (Netherlands) BV ± 1.44 11/6/2018 5,000,000 5,000,000 0.48
132,893,793 12.68
Total Commercial Paper 642,521,539 61.24
Municipal Obligations
ArizonaSalt River Project Agricultural Improvement &
Power District (z) 1.28 18/10/2017 15,000,000 14,991,600 1.43
FloridaCity of Gainesville (z) 1.29 2/10/2017 8,000,000 8,000,000 0.76
County of Hillsborough (z) 1.31 30/11/2017 5,520,000 5,508,148 0.53
13,508,148 1.29
PennsylvaniaUniversity of Pittsburgh 1.26 2/11/2017 15,000,000 15,000,000 1.43
Total Municipal Obligations 43,499,748 4.15
Total Investment in Securities 834,023,842 79.49
The accompanying notes are an integral part of these financial statements.
China Equity Fund, EUR Investment Grade Credit Fund, Global Long/Short Equity Fund, Global Low Volatility Equity Fund, Global Opportunity Bond Fund, U.S.
Dollar Short-Term Money Market Fund and USD Investment Grade Credit Fund have not been authorised by the Hong Kong Securities and Futures Commission
and are not available for investment by Hong Kong retail investors.
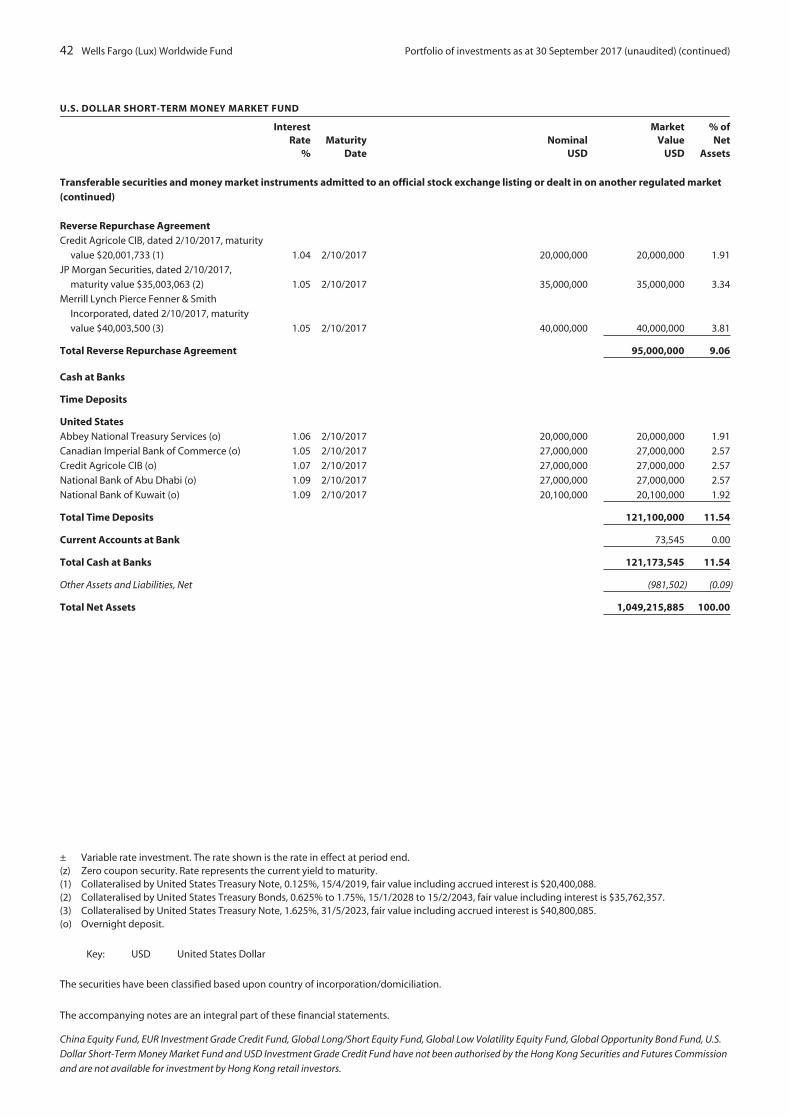
42 Wells Fargo (Lux) Worldwide Fund Portfolio of investments as at 30 September 2017 (unaudited) (continued)
U.S. DOLLAR SHORT-TERM MONEY MARKET FUND
InterestRate
%Maturity
DateNominal
USD
MarketValue
USD
% ofNet
Assets
Transferable securities and money market instruments admitted to an official stock exchange listing or dealt in on another regulated market(continued)
Reverse Repurchase AgreementCredit Agricole CIB, dated 2/10/2017, maturity
value $20,001,733 (1) 1.04 2/10/2017 20,000,000 20,000,000 1.91
JP Morgan Securities, dated 2/10/2017,
maturity value $35,003,063 (2) 1.05 2/10/2017 35,000,000 35,000,000 3.34
Merrill Lynch Pierce Fenner & Smith
Incorporated, dated 2/10/2017, maturity
value $40,003,500 (3) 1.05 2/10/2017 40,000,000 40,000,000 3.81
Total Reverse Repurchase Agreement 95,000,000 9.06
Cash at Banks
Time Deposits
United StatesAbbey National Treasury Services (o) 1.06 2/10/2017 20,000,000 20,000,000 1.91
Canadian Imperial Bank of Commerce (o) 1.05 2/10/2017 27,000,000 27,000,000 2.57
Credit Agricole CIB (o) 1.07 2/10/2017 27,000,000 27,000,000 2.57
National Bank of Abu Dhabi (o) 1.09 2/10/2017 27,000,000 27,000,000 2.57
National Bank of Kuwait (o) 1.09 2/10/2017 20,100,000 20,100,000 1.92
Total Time Deposits 121,100,000 11.54
Current Accounts at Bank 73,545 0.00
Total Cash at Banks 121,173,545 11.54
Other Assets and Liabilities, Net (981,502) (0.09)
Total Net Assets 1,049,215,885 100.00
± Variable rate investment. The rate shown is the rate in effect at period end.(z) Zero coupon security. Rate represents the current yield to maturity.(1) Collateralised by United States Treasury Note, 0.125%, 15/4/2019, fair value including accrued interest is $20,400,088.(2) Collateralised by United States Treasury Bonds, 0.625% to 1.75%, 15/1/2028 to 15/2/2043, fair value including interest is $35,762,357.(3) Collateralised by United States Treasury Note, 1.625%, 31/5/2023, fair value including accrued interest is $40,800,085.(o) Overnight deposit.
Key: USD United States Dollar
The securities have been classified based upon country of incorporation/domiciliation.
The accompanying notes are an integral part of these financial statements.
China Equity Fund, EUR Investment Grade Credit Fund, Global Long/Short Equity Fund, Global Low Volatility Equity Fund, Global Opportunity Bond Fund, U.S.
Dollar Short-Term Money Market Fund and USD Investment Grade Credit Fund have not been authorised by the Hong Kong Securities and Futures Commission
and are not available for investment by Hong Kong retail investors.
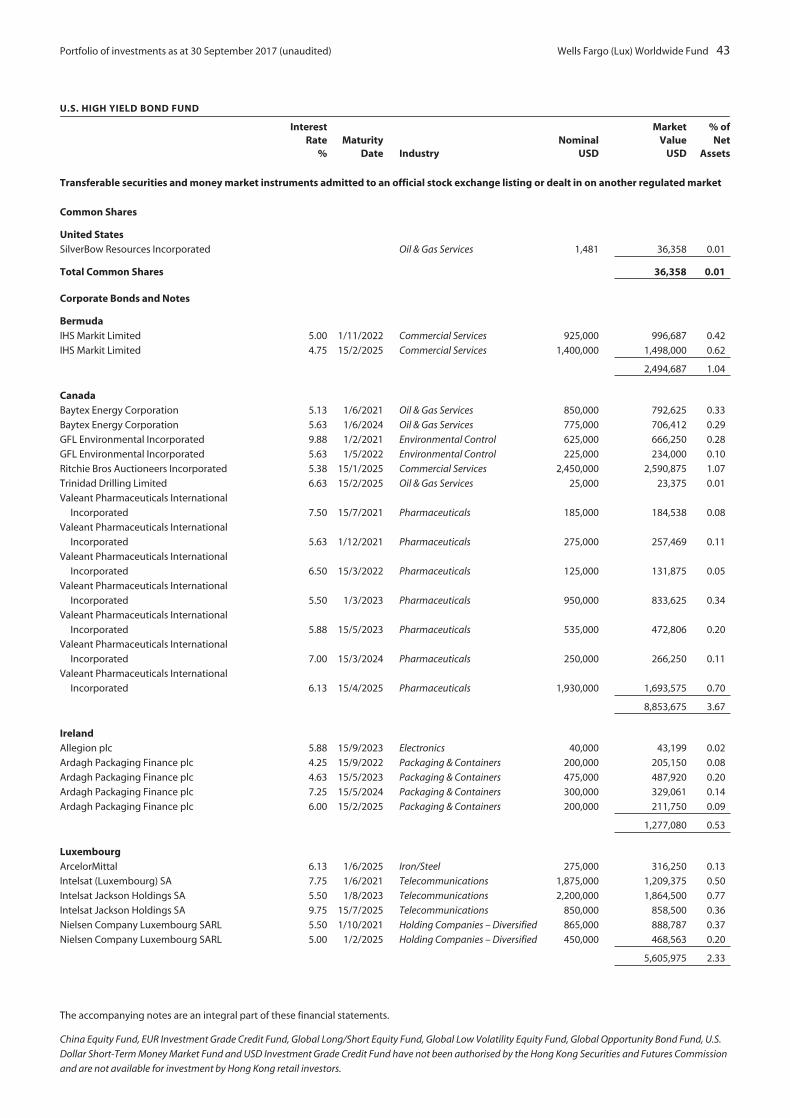
Portfolio of investments as at 30 September 2017 (unaudited) Wells Fargo (Lux) Worldwide Fund 43
U.S. HIGH YIELD BOND FUND
InterestRate
%Maturity
Date IndustryNominal
USD
MarketValue
USD
% ofNet
Assets
Transferable securities and money market instruments admitted to an official stock exchange listing or dealt in on another regulated market
Common Shares
United StatesSilverBow Resources Incorporated Oil & Gas Services 1,481 36,358 0.01
Total Common Shares 36,358 0.01
Corporate Bonds and Notes
BermudaIHS Markit Limited 5.00 1/11/2022 Commercial Services 925,000 996,687 0.42
IHS Markit Limited 4.75 15/2/2025 Commercial Services 1,400,000 1,498,000 0.62
2,494,687 1.04
CanadaBaytex Energy Corporation 5.13 1/6/2021 Oil & Gas Services 850,000 792,625 0.33
Baytex Energy Corporation 5.63 1/6/2024 Oil & Gas Services 775,000 706,412 0.29
GFL Environmental Incorporated 9.88 1/2/2021 Environmental Control 625,000 666,250 0.28
GFL Environmental Incorporated 5.63 1/5/2022 Environmental Control 225,000 234,000 0.10
Ritchie Bros Auctioneers Incorporated 5.38 15/1/2025 Commercial Services 2,450,000 2,590,875 1.07
Trinidad Drilling Limited 6.63 15/2/2025 Oil & Gas Services 25,000 23,375 0.01
Valeant Pharmaceuticals International
Incorporated 7.50 15/7/2021 Pharmaceuticals 185,000 184,538 0.08
Valeant Pharmaceuticals International
Incorporated 5.63 1/12/2021 Pharmaceuticals 275,000 257,469 0.11
Valeant Pharmaceuticals International
Incorporated 6.50 15/3/2022 Pharmaceuticals 125,000 131,875 0.05
Valeant Pharmaceuticals International
Incorporated 5.50 1/3/2023 Pharmaceuticals 950,000 833,625 0.34
Valeant Pharmaceuticals International
Incorporated 5.88 15/5/2023 Pharmaceuticals 535,000 472,806 0.20
Valeant Pharmaceuticals International
Incorporated 7.00 15/3/2024 Pharmaceuticals 250,000 266,250 0.11
Valeant Pharmaceuticals International
Incorporated 6.13 15/4/2025 Pharmaceuticals 1,930,000 1,693,575 0.70
8,853,675 3.67
IrelandAllegion plc 5.88 15/9/2023 Electronics 40,000 43,199 0.02
Ardagh Packaging Finance plc 4.25 15/9/2022 Packaging & Containers 200,000 205,150 0.08
Ardagh Packaging Finance plc 4.63 15/5/2023 Packaging & Containers 475,000 487,920 0.20
Ardagh Packaging Finance plc 7.25 15/5/2024 Packaging & Containers 300,000 329,061 0.14
Ardagh Packaging Finance plc 6.00 15/2/2025 Packaging & Containers 200,000 211,750 0.09
1,277,080 0.53
LuxembourgArcelorMittal 6.13 1/6/2025 Iron/Steel 275,000 316,250 0.13
Intelsat (Luxembourg) SA 7.75 1/6/2021 Telecommunications 1,875,000 1,209,375 0.50
Intelsat Jackson Holdings SA 5.50 1/8/2023 Telecommunications 2,200,000 1,864,500 0.77
Intelsat Jackson Holdings SA 9.75 15/7/2025 Telecommunications 850,000 858,500 0.36
Nielsen Company Luxembourg SARL 5.50 1/10/2021 Holding Companies – Diversified 865,000 888,787 0.37
Nielsen Company Luxembourg SARL 5.00 1/2/2025 Holding Companies – Diversified 450,000 468,563 0.20
5,605,975 2.33
The accompanying notes are an integral part of these financial statements.
China Equity Fund, EUR Investment Grade Credit Fund, Global Long/Short Equity Fund, Global Low Volatility Equity Fund, Global Opportunity Bond Fund, U.S.
Dollar Short-Term Money Market Fund and USD Investment Grade Credit Fund have not been authorised by the Hong Kong Securities and Futures Commission
and are not available for investment by Hong Kong retail investors.
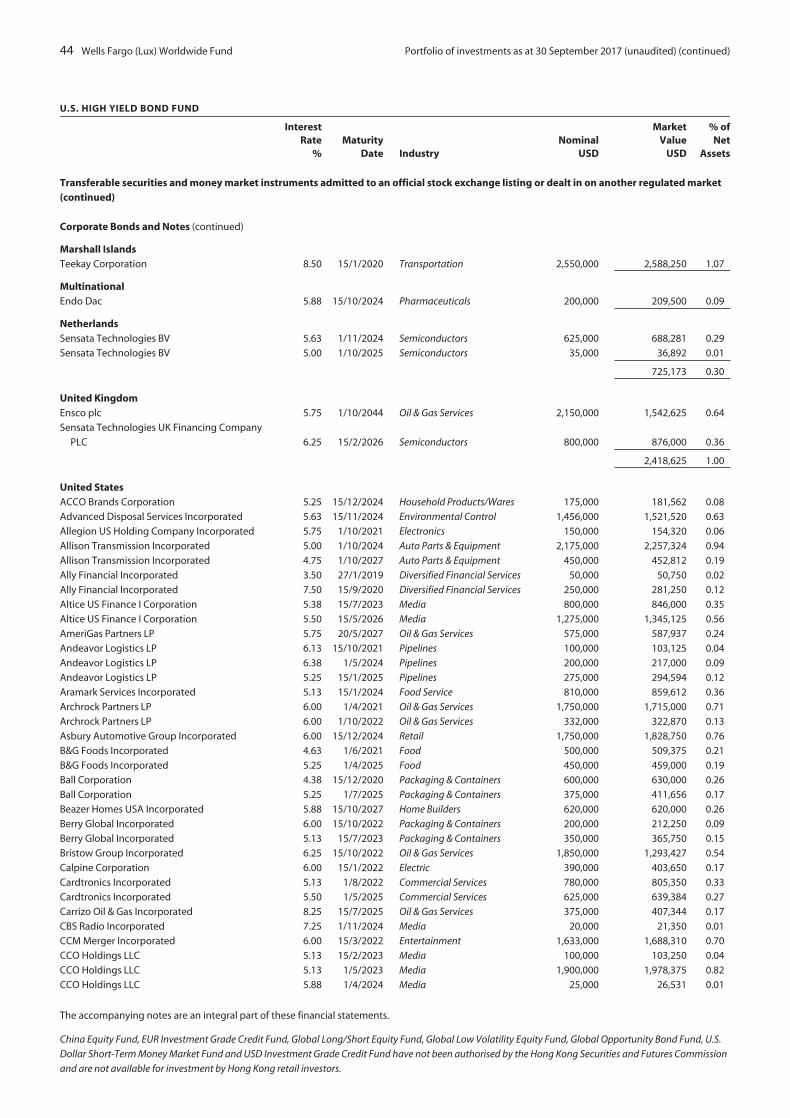
44 Wells Fargo (Lux) Worldwide Fund Portfolio of investments as at 30 September 2017 (unaudited) (continued)
U.S. HIGH YIELD BOND FUND
InterestRate
%Maturity
Date IndustryNominal
USD
MarketValue
USD
% ofNet
Assets
Transferable securities and money market instruments admitted to an official stock exchange listing or dealt in on another regulated market(continued)
Corporate Bonds and Notes (continued)
Marshall IslandsTeekay Corporation 8.50 15/1/2020 Transportation 2,550,000 2,588,250 1.07
MultinationalEndo Dac 5.88 15/10/2024 Pharmaceuticals 200,000 209,500 0.09
NetherlandsSensata Technologies BV 5.63 1/11/2024 Semiconductors 625,000 688,281 0.29
Sensata Technologies BV 5.00 1/10/2025 Semiconductors 35,000 36,892 0.01
725,173 0.30
United KingdomEnsco plc 5.75 1/10/2044 Oil & Gas Services 2,150,000 1,542,625 0.64
Sensata Technologies UK Financing Company
PLC 6.25 15/2/2026 Semiconductors 800,000 876,000 0.36
2,418,625 1.00
United StatesACCO Brands Corporation 5.25 15/12/2024 Household Products/Wares 175,000 181,562 0.08
Advanced Disposal Services Incorporated 5.63 15/11/2024 Environmental Control 1,456,000 1,521,520 0.63
Allegion US Holding Company Incorporated 5.75 1/10/2021 Electronics 150,000 154,320 0.06
Allison Transmission Incorporated 5.00 1/10/2024 Auto Parts & Equipment 2,175,000 2,257,324 0.94
Allison Transmission Incorporated 4.75 1/10/2027 Auto Parts & Equipment 450,000 452,812 0.19
Ally Financial Incorporated 3.50 27/1/2019 Diversified Financial Services 50,000 50,750 0.02
Ally Financial Incorporated 7.50 15/9/2020 Diversified Financial Services 250,000 281,250 0.12
Altice US Finance I Corporation 5.38 15/7/2023 Media 800,000 846,000 0.35
Altice US Finance I Corporation 5.50 15/5/2026 Media 1,275,000 1,345,125 0.56
AmeriGas Partners LP 5.75 20/5/2027 Oil & Gas Services 575,000 587,937 0.24
Andeavor Logistics LP 6.13 15/10/2021 Pipelines 100,000 103,125 0.04
Andeavor Logistics LP 6.38 1/5/2024 Pipelines 200,000 217,000 0.09
Andeavor Logistics LP 5.25 15/1/2025 Pipelines 275,000 294,594 0.12
Aramark Services Incorporated 5.13 15/1/2024 Food Service 810,000 859,612 0.36
Archrock Partners LP 6.00 1/4/2021 Oil & Gas Services 1,750,000 1,715,000 0.71
Archrock Partners LP 6.00 1/10/2022 Oil & Gas Services 332,000 322,870 0.13
Asbury Automotive Group Incorporated 6.00 15/12/2024 Retail 1,750,000 1,828,750 0.76
B&G Foods Incorporated 4.63 1/6/2021 Food 500,000 509,375 0.21
B&G Foods Incorporated 5.25 1/4/2025 Food 450,000 459,000 0.19
Ball Corporation 4.38 15/12/2020 Packaging & Containers 600,000 630,000 0.26
Ball Corporation 5.25 1/7/2025 Packaging & Containers 375,000 411,656 0.17
Beazer Homes USA Incorporated 5.88 15/10/2027 Home Builders 620,000 620,000 0.26
Berry Global Incorporated 6.00 15/10/2022 Packaging & Containers 200,000 212,250 0.09
Berry Global Incorporated 5.13 15/7/2023 Packaging & Containers 350,000 365,750 0.15
Bristow Group Incorporated 6.25 15/10/2022 Oil & Gas Services 1,850,000 1,293,427 0.54
Calpine Corporation 6.00 15/1/2022 Electric 390,000 403,650 0.17
Cardtronics Incorporated 5.13 1/8/2022 Commercial Services 780,000 805,350 0.33
Cardtronics Incorporated 5.50 1/5/2025 Commercial Services 625,000 639,384 0.27
Carrizo Oil & Gas Incorporated 8.25 15/7/2025 Oil & Gas Services 375,000 407,344 0.17
CBS Radio Incorporated 7.25 1/11/2024 Media 20,000 21,350 0.01
CCM Merger Incorporated 6.00 15/3/2022 Entertainment 1,633,000 1,688,310 0.70
CCO Holdings LLC 5.13 15/2/2023 Media 100,000 103,250 0.04
CCO Holdings LLC 5.13 1/5/2023 Media 1,900,000 1,978,375 0.82
CCO Holdings LLC 5.88 1/4/2024 Media 25,000 26,531 0.01
The accompanying notes are an integral part of these financial statements.
China Equity Fund, EUR Investment Grade Credit Fund, Global Long/Short Equity Fund, Global Low Volatility Equity Fund, Global Opportunity Bond Fund, U.S.
Dollar Short-Term Money Market Fund and USD Investment Grade Credit Fund have not been authorised by the Hong Kong Securities and Futures Commission
and are not available for investment by Hong Kong retail investors.
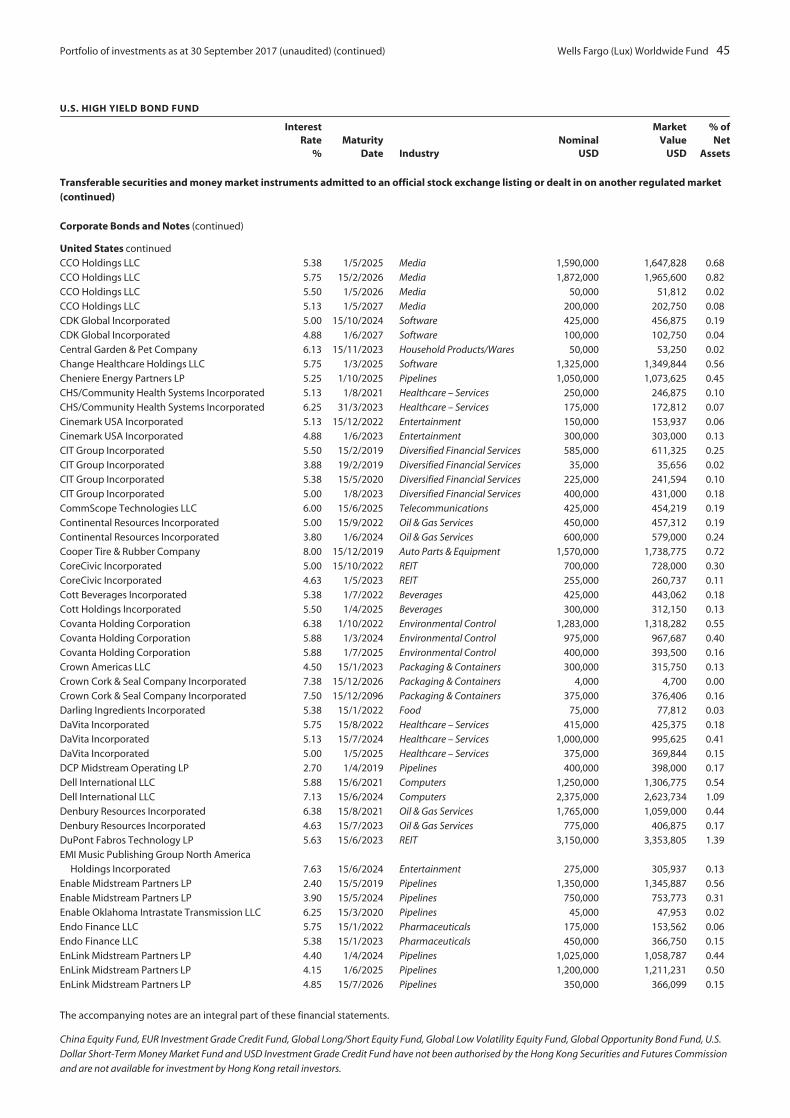
Portfolio of investments as at 30 September 2017 (unaudited) (continued) Wells Fargo (Lux) Worldwide Fund 45
U.S. HIGH YIELD BOND FUND
InterestRate
%Maturity
Date IndustryNominal
USD
MarketValue
USD
% ofNet
Assets
Transferable securities and money market instruments admitted to an official stock exchange listing or dealt in on another regulated market(continued)
Corporate Bonds and Notes (continued)
United States continued
CCO Holdings LLC 5.38 1/5/2025 Media 1,590,000 1,647,828 0.68
CCO Holdings LLC 5.75 15/2/2026 Media 1,872,000 1,965,600 0.82
CCO Holdings LLC 5.50 1/5/2026 Media 50,000 51,812 0.02
CCO Holdings LLC 5.13 1/5/2027 Media 200,000 202,750 0.08
CDK Global Incorporated 5.00 15/10/2024 Software 425,000 456,875 0.19
CDK Global Incorporated 4.88 1/6/2027 Software 100,000 102,750 0.04
Central Garden & Pet Company 6.13 15/11/2023 Household Products/Wares 50,000 53,250 0.02
Change Healthcare Holdings LLC 5.75 1/3/2025 Software 1,325,000 1,349,844 0.56
Cheniere Energy Partners LP 5.25 1/10/2025 Pipelines 1,050,000 1,073,625 0.45
CHS/Community Health Systems Incorporated 5.13 1/8/2021 Healthcare – Services 250,000 246,875 0.10
CHS/Community Health Systems Incorporated 6.25 31/3/2023 Healthcare – Services 175,000 172,812 0.07
Cinemark USA Incorporated 5.13 15/12/2022 Entertainment 150,000 153,937 0.06
Cinemark USA Incorporated 4.88 1/6/2023 Entertainment 300,000 303,000 0.13
CIT Group Incorporated 5.50 15/2/2019 Diversified Financial Services 585,000 611,325 0.25
CIT Group Incorporated 3.88 19/2/2019 Diversified Financial Services 35,000 35,656 0.02
CIT Group Incorporated 5.38 15/5/2020 Diversified Financial Services 225,000 241,594 0.10
CIT Group Incorporated 5.00 1/8/2023 Diversified Financial Services 400,000 431,000 0.18
CommScope Technologies LLC 6.00 15/6/2025 Telecommunications 425,000 454,219 0.19
Continental Resources Incorporated 5.00 15/9/2022 Oil & Gas Services 450,000 457,312 0.19
Continental Resources Incorporated 3.80 1/6/2024 Oil & Gas Services 600,000 579,000 0.24
Cooper Tire & Rubber Company 8.00 15/12/2019 Auto Parts & Equipment 1,570,000 1,738,775 0.72
CoreCivic Incorporated 5.00 15/10/2022 REIT 700,000 728,000 0.30
CoreCivic Incorporated 4.63 1/5/2023 REIT 255,000 260,737 0.11
Cott Beverages Incorporated 5.38 1/7/2022 Beverages 425,000 443,062 0.18
Cott Holdings Incorporated 5.50 1/4/2025 Beverages 300,000 312,150 0.13
Covanta Holding Corporation 6.38 1/10/2022 Environmental Control 1,283,000 1,318,282 0.55
Covanta Holding Corporation 5.88 1/3/2024 Environmental Control 975,000 967,687 0.40
Covanta Holding Corporation 5.88 1/7/2025 Environmental Control 400,000 393,500 0.16
Crown Americas LLC 4.50 15/1/2023 Packaging & Containers 300,000 315,750 0.13
Crown Cork & Seal Company Incorporated 7.38 15/12/2026 Packaging & Containers 4,000 4,700 0.00
Crown Cork & Seal Company Incorporated 7.50 15/12/2096 Packaging & Containers 375,000 376,406 0.16
Darling Ingredients Incorporated 5.38 15/1/2022 Food 75,000 77,812 0.03
DaVita Incorporated 5.75 15/8/2022 Healthcare – Services 415,000 425,375 0.18
DaVita Incorporated 5.13 15/7/2024 Healthcare – Services 1,000,000 995,625 0.41
DaVita Incorporated 5.00 1/5/2025 Healthcare – Services 375,000 369,844 0.15
DCP Midstream Operating LP 2.70 1/4/2019 Pipelines 400,000 398,000 0.17
Dell International LLC 5.88 15/6/2021 Computers 1,250,000 1,306,775 0.54
Dell International LLC 7.13 15/6/2024 Computers 2,375,000 2,623,734 1.09
Denbury Resources Incorporated 6.38 15/8/2021 Oil & Gas Services 1,765,000 1,059,000 0.44
Denbury Resources Incorporated 4.63 15/7/2023 Oil & Gas Services 775,000 406,875 0.17
DuPont Fabros Technology LP 5.63 15/6/2023 REIT 3,150,000 3,353,805 1.39
EMI Music Publishing Group North America
Holdings Incorporated 7.63 15/6/2024 Entertainment 275,000 305,937 0.13
Enable Midstream Partners LP 2.40 15/5/2019 Pipelines 1,350,000 1,345,887 0.56
Enable Midstream Partners LP 3.90 15/5/2024 Pipelines 750,000 753,773 0.31
Enable Oklahoma Intrastate Transmission LLC 6.25 15/3/2020 Pipelines 45,000 47,953 0.02
Endo Finance LLC 5.75 15/1/2022 Pharmaceuticals 175,000 153,562 0.06
Endo Finance LLC 5.38 15/1/2023 Pharmaceuticals 450,000 366,750 0.15
EnLink Midstream Partners LP 4.40 1/4/2024 Pipelines 1,025,000 1,058,787 0.44
EnLink Midstream Partners LP 4.15 1/6/2025 Pipelines 1,200,000 1,211,231 0.50
EnLink Midstream Partners LP 4.85 15/7/2026 Pipelines 350,000 366,099 0.15
The accompanying notes are an integral part of these financial statements.
China Equity Fund, EUR Investment Grade Credit Fund, Global Long/Short Equity Fund, Global Low Volatility Equity Fund, Global Opportunity Bond Fund, U.S.
Dollar Short-Term Money Market Fund and USD Investment Grade Credit Fund have not been authorised by the Hong Kong Securities and Futures Commission
and are not available for investment by Hong Kong retail investors.
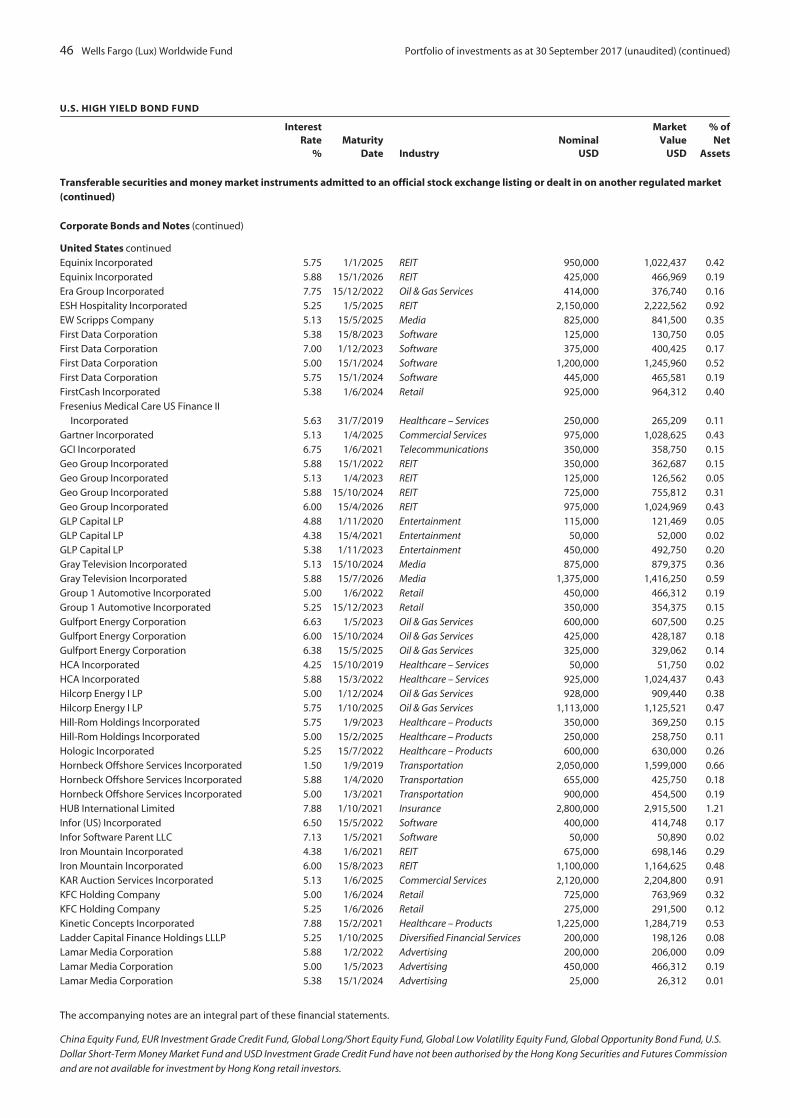
46 Wells Fargo (Lux) Worldwide Fund Portfolio of investments as at 30 September 2017 (unaudited) (continued)
U.S. HIGH YIELD BOND FUND
InterestRate
%Maturity
Date IndustryNominal
USD
MarketValue
USD
% ofNet
Assets
Transferable securities and money market instruments admitted to an official stock exchange listing or dealt in on another regulated market(continued)
Corporate Bonds and Notes (continued)
United States continuedEquinix Incorporated 5.75 1/1/2025 REIT 950,000 1,022,437 0.42Equinix Incorporated 5.88 15/1/2026 REIT 425,000 466,969 0.19Era Group Incorporated 7.75 15/12/2022 Oil & Gas Services 414,000 376,740 0.16ESH Hospitality Incorporated 5.25 1/5/2025 REIT 2,150,000 2,222,562 0.92EW Scripps Company 5.13 15/5/2025 Media 825,000 841,500 0.35First Data Corporation 5.38 15/8/2023 Software 125,000 130,750 0.05First Data Corporation 7.00 1/12/2023 Software 375,000 400,425 0.17First Data Corporation 5.00 15/1/2024 Software 1,200,000 1,245,960 0.52First Data Corporation 5.75 15/1/2024 Software 445,000 465,581 0.19FirstCash Incorporated 5.38 1/6/2024 Retail 925,000 964,312 0.40Fresenius Medical Care US Finance II
Incorporated 5.63 31/7/2019 Healthcare – Services 250,000 265,209 0.11Gartner Incorporated 5.13 1/4/2025 Commercial Services 975,000 1,028,625 0.43GCI Incorporated 6.75 1/6/2021 Telecommunications 350,000 358,750 0.15Geo Group Incorporated 5.88 15/1/2022 REIT 350,000 362,687 0.15Geo Group Incorporated 5.13 1/4/2023 REIT 125,000 126,562 0.05Geo Group Incorporated 5.88 15/10/2024 REIT 725,000 755,812 0.31Geo Group Incorporated 6.00 15/4/2026 REIT 975,000 1,024,969 0.43GLP Capital LP 4.88 1/11/2020 Entertainment 115,000 121,469 0.05GLP Capital LP 4.38 15/4/2021 Entertainment 50,000 52,000 0.02GLP Capital LP 5.38 1/11/2023 Entertainment 450,000 492,750 0.20Gray Television Incorporated 5.13 15/10/2024 Media 875,000 879,375 0.36Gray Television Incorporated 5.88 15/7/2026 Media 1,375,000 1,416,250 0.59Group 1 Automotive Incorporated 5.00 1/6/2022 Retail 450,000 466,312 0.19Group 1 Automotive Incorporated 5.25 15/12/2023 Retail 350,000 354,375 0.15Gulfport Energy Corporation 6.63 1/5/2023 Oil & Gas Services 600,000 607,500 0.25Gulfport Energy Corporation 6.00 15/10/2024 Oil & Gas Services 425,000 428,187 0.18Gulfport Energy Corporation 6.38 15/5/2025 Oil & Gas Services 325,000 329,062 0.14HCA Incorporated 4.25 15/10/2019 Healthcare – Services 50,000 51,750 0.02HCA Incorporated 5.88 15/3/2022 Healthcare – Services 925,000 1,024,437 0.43Hilcorp Energy I LP 5.00 1/12/2024 Oil & Gas Services 928,000 909,440 0.38Hilcorp Energy I LP 5.75 1/10/2025 Oil & Gas Services 1,113,000 1,125,521 0.47Hill-Rom Holdings Incorporated 5.75 1/9/2023 Healthcare – Products 350,000 369,250 0.15Hill-Rom Holdings Incorporated 5.00 15/2/2025 Healthcare – Products 250,000 258,750 0.11Hologic Incorporated 5.25 15/7/2022 Healthcare – Products 600,000 630,000 0.26Hornbeck Offshore Services Incorporated 1.50 1/9/2019 Transportation 2,050,000 1,599,000 0.66Hornbeck Offshore Services Incorporated 5.88 1/4/2020 Transportation 655,000 425,750 0.18Hornbeck Offshore Services Incorporated 5.00 1/3/2021 Transportation 900,000 454,500 0.19HUB International Limited 7.88 1/10/2021 Insurance 2,800,000 2,915,500 1.21Infor (US) Incorporated 6.50 15/5/2022 Software 400,000 414,748 0.17Infor Software Parent LLC 7.13 1/5/2021 Software 50,000 50,890 0.02Iron Mountain Incorporated 4.38 1/6/2021 REIT 675,000 698,146 0.29Iron Mountain Incorporated 6.00 15/8/2023 REIT 1,100,000 1,164,625 0.48KAR Auction Services Incorporated 5.13 1/6/2025 Commercial Services 2,120,000 2,204,800 0.91KFC Holding Company 5.00 1/6/2024 Retail 725,000 763,969 0.32KFC Holding Company 5.25 1/6/2026 Retail 275,000 291,500 0.12Kinetic Concepts Incorporated 7.88 15/2/2021 Healthcare – Products 1,225,000 1,284,719 0.53Ladder Capital Finance Holdings LLLP 5.25 1/10/2025 Diversified Financial Services 200,000 198,126 0.08Lamar Media Corporation 5.88 1/2/2022 Advertising 200,000 206,000 0.09Lamar Media Corporation 5.00 1/5/2023 Advertising 450,000 466,312 0.19Lamar Media Corporation 5.38 15/1/2024 Advertising 25,000 26,312 0.01
The accompanying notes are an integral part of these financial statements.
China Equity Fund, EUR Investment Grade Credit Fund, Global Long/Short Equity Fund, Global Low Volatility Equity Fund, Global Opportunity Bond Fund, U.S.
Dollar Short-Term Money Market Fund and USD Investment Grade Credit Fund have not been authorised by the Hong Kong Securities and Futures Commission
and are not available for investment by Hong Kong retail investors.
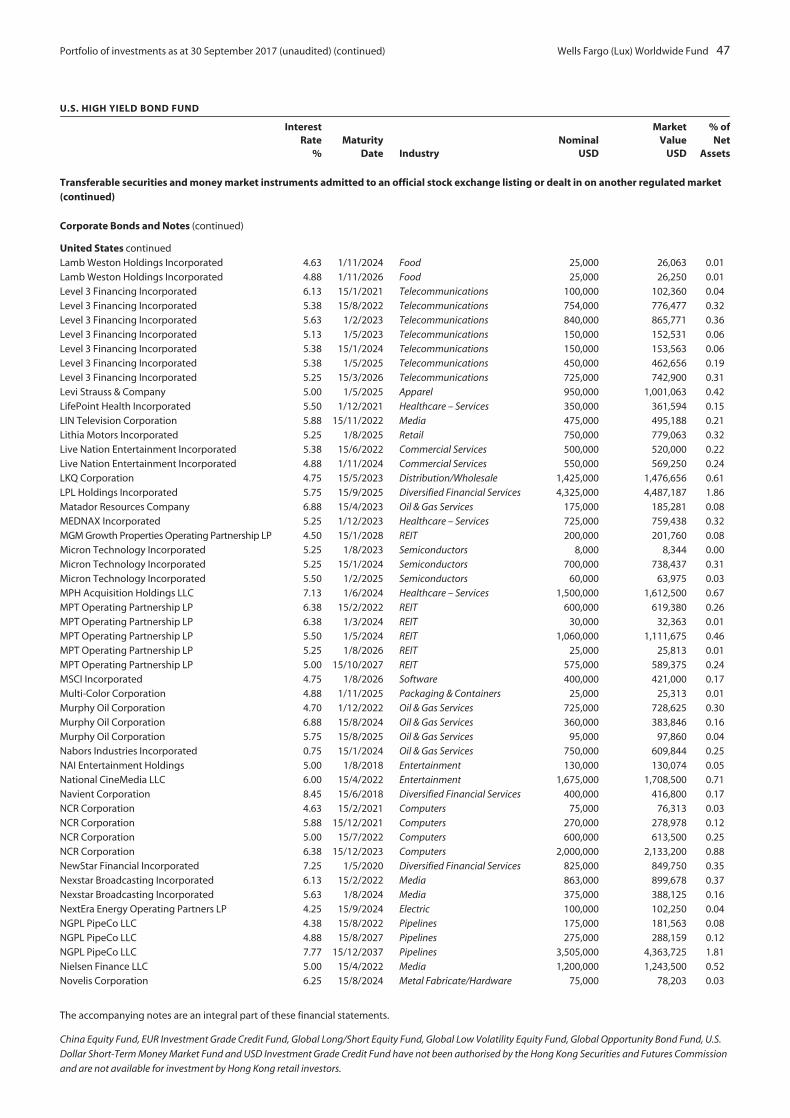
Portfolio of investments as at 30 September 2017 (unaudited) (continued) Wells Fargo (Lux) Worldwide Fund 47
U.S. HIGH YIELD BOND FUND
InterestRate
%Maturity
Date IndustryNominal
USD
MarketValue
USD
% ofNet
Assets
Transferable securities and money market instruments admitted to an official stock exchange listing or dealt in on another regulated market(continued)
Corporate Bonds and Notes (continued)
United States continuedLamb Weston Holdings Incorporated 4.63 1/11/2024 Food 25,000 26,063 0.01Lamb Weston Holdings Incorporated 4.88 1/11/2026 Food 25,000 26,250 0.01Level 3 Financing Incorporated 6.13 15/1/2021 Telecommunications 100,000 102,360 0.04Level 3 Financing Incorporated 5.38 15/8/2022 Telecommunications 754,000 776,477 0.32Level 3 Financing Incorporated 5.63 1/2/2023 Telecommunications 840,000 865,771 0.36Level 3 Financing Incorporated 5.13 1/5/2023 Telecommunications 150,000 152,531 0.06Level 3 Financing Incorporated 5.38 15/1/2024 Telecommunications 150,000 153,563 0.06Level 3 Financing Incorporated 5.38 1/5/2025 Telecommunications 450,000 462,656 0.19Level 3 Financing Incorporated 5.25 15/3/2026 Telecommunications 725,000 742,900 0.31Levi Strauss & Company 5.00 1/5/2025 Apparel 950,000 1,001,063 0.42LifePoint Health Incorporated 5.50 1/12/2021 Healthcare – Services 350,000 361,594 0.15LIN Television Corporation 5.88 15/11/2022 Media 475,000 495,188 0.21Lithia Motors Incorporated 5.25 1/8/2025 Retail 750,000 779,063 0.32Live Nation Entertainment Incorporated 5.38 15/6/2022 Commercial Services 500,000 520,000 0.22Live Nation Entertainment Incorporated 4.88 1/11/2024 Commercial Services 550,000 569,250 0.24LKQ Corporation 4.75 15/5/2023 Distribution/Wholesale 1,425,000 1,476,656 0.61LPL Holdings Incorporated 5.75 15/9/2025 Diversified Financial Services 4,325,000 4,487,187 1.86Matador Resources Company 6.88 15/4/2023 Oil & Gas Services 175,000 185,281 0.08MEDNAX Incorporated 5.25 1/12/2023 Healthcare – Services 725,000 759,438 0.32MGM Growth Properties Operating Partnership LP 4.50 15/1/2028 REIT 200,000 201,760 0.08Micron Technology Incorporated 5.25 1/8/2023 Semiconductors 8,000 8,344 0.00Micron Technology Incorporated 5.25 15/1/2024 Semiconductors 700,000 738,437 0.31Micron Technology Incorporated 5.50 1/2/2025 Semiconductors 60,000 63,975 0.03MPH Acquisition Holdings LLC 7.13 1/6/2024 Healthcare – Services 1,500,000 1,612,500 0.67MPT Operating Partnership LP 6.38 15/2/2022 REIT 600,000 619,380 0.26MPT Operating Partnership LP 6.38 1/3/2024 REIT 30,000 32,363 0.01MPT Operating Partnership LP 5.50 1/5/2024 REIT 1,060,000 1,111,675 0.46MPT Operating Partnership LP 5.25 1/8/2026 REIT 25,000 25,813 0.01MPT Operating Partnership LP 5.00 15/10/2027 REIT 575,000 589,375 0.24MSCI Incorporated 4.75 1/8/2026 Software 400,000 421,000 0.17Multi-Color Corporation 4.88 1/11/2025 Packaging & Containers 25,000 25,313 0.01Murphy Oil Corporation 4.70 1/12/2022 Oil & Gas Services 725,000 728,625 0.30Murphy Oil Corporation 6.88 15/8/2024 Oil & Gas Services 360,000 383,846 0.16Murphy Oil Corporation 5.75 15/8/2025 Oil & Gas Services 95,000 97,860 0.04Nabors Industries Incorporated 0.75 15/1/2024 Oil & Gas Services 750,000 609,844 0.25NAI Entertainment Holdings 5.00 1/8/2018 Entertainment 130,000 130,074 0.05National CineMedia LLC 6.00 15/4/2022 Entertainment 1,675,000 1,708,500 0.71Navient Corporation 8.45 15/6/2018 Diversified Financial Services 400,000 416,800 0.17NCR Corporation 4.63 15/2/2021 Computers 75,000 76,313 0.03NCR Corporation 5.88 15/12/2021 Computers 270,000 278,978 0.12NCR Corporation 5.00 15/7/2022 Computers 600,000 613,500 0.25NCR Corporation 6.38 15/12/2023 Computers 2,000,000 2,133,200 0.88NewStar Financial Incorporated 7.25 1/5/2020 Diversified Financial Services 825,000 849,750 0.35Nexstar Broadcasting Incorporated 6.13 15/2/2022 Media 863,000 899,678 0.37Nexstar Broadcasting Incorporated 5.63 1/8/2024 Media 375,000 388,125 0.16NextEra Energy Operating Partners LP 4.25 15/9/2024 Electric 100,000 102,250 0.04NGPL PipeCo LLC 4.38 15/8/2022 Pipelines 175,000 181,563 0.08NGPL PipeCo LLC 4.88 15/8/2027 Pipelines 275,000 288,159 0.12NGPL PipeCo LLC 7.77 15/12/2037 Pipelines 3,505,000 4,363,725 1.81Nielsen Finance LLC 5.00 15/4/2022 Media 1,200,000 1,243,500 0.52Novelis Corporation 6.25 15/8/2024 Metal Fabricate/Hardware 75,000 78,203 0.03
The accompanying notes are an integral part of these financial statements.
China Equity Fund, EUR Investment Grade Credit Fund, Global Long/Short Equity Fund, Global Low Volatility Equity Fund, Global Opportunity Bond Fund, U.S.
Dollar Short-Term Money Market Fund and USD Investment Grade Credit Fund have not been authorised by the Hong Kong Securities and Futures Commission
and are not available for investment by Hong Kong retail investors.
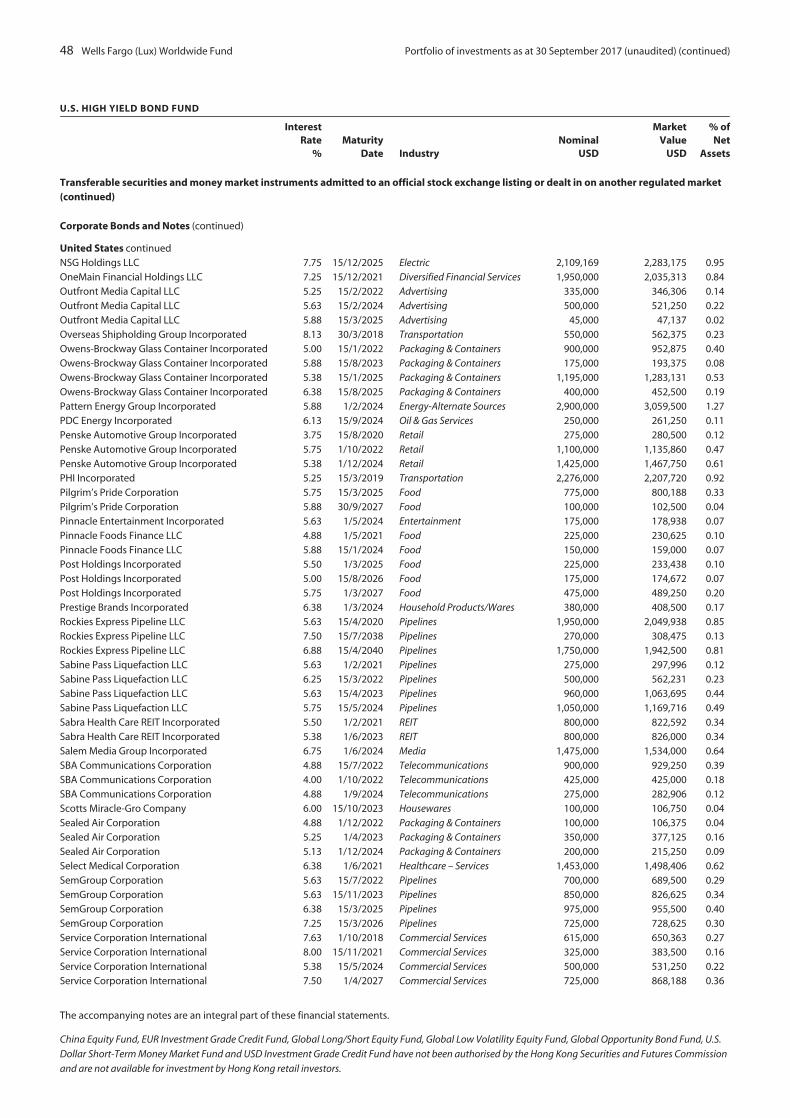
48 Wells Fargo (Lux) Worldwide Fund Portfolio of investments as at 30 September 2017 (unaudited) (continued)
U.S. HIGH YIELD BOND FUND
InterestRate
%Maturity
Date IndustryNominal
USD
MarketValue
USD
% ofNet
Assets
Transferable securities and money market instruments admitted to an official stock exchange listing or dealt in on another regulated market(continued)
Corporate Bonds and Notes (continued)
United States continuedNSG Holdings LLC 7.75 15/12/2025 Electric 2,109,169 2,283,175 0.95OneMain Financial Holdings LLC 7.25 15/12/2021 Diversified Financial Services 1,950,000 2,035,313 0.84Outfront Media Capital LLC 5.25 15/2/2022 Advertising 335,000 346,306 0.14Outfront Media Capital LLC 5.63 15/2/2024 Advertising 500,000 521,250 0.22Outfront Media Capital LLC 5.88 15/3/2025 Advertising 45,000 47,137 0.02Overseas Shipholding Group Incorporated 8.13 30/3/2018 Transportation 550,000 562,375 0.23Owens-Brockway Glass Container Incorporated 5.00 15/1/2022 Packaging & Containers 900,000 952,875 0.40Owens-Brockway Glass Container Incorporated 5.88 15/8/2023 Packaging & Containers 175,000 193,375 0.08Owens-Brockway Glass Container Incorporated 5.38 15/1/2025 Packaging & Containers 1,195,000 1,283,131 0.53Owens-Brockway Glass Container Incorporated 6.38 15/8/2025 Packaging & Containers 400,000 452,500 0.19Pattern Energy Group Incorporated 5.88 1/2/2024 Energy-Alternate Sources 2,900,000 3,059,500 1.27PDC Energy Incorporated 6.13 15/9/2024 Oil & Gas Services 250,000 261,250 0.11Penske Automotive Group Incorporated 3.75 15/8/2020 Retail 275,000 280,500 0.12Penske Automotive Group Incorporated 5.75 1/10/2022 Retail 1,100,000 1,135,860 0.47Penske Automotive Group Incorporated 5.38 1/12/2024 Retail 1,425,000 1,467,750 0.61PHI Incorporated 5.25 15/3/2019 Transportation 2,276,000 2,207,720 0.92Pilgrim’s Pride Corporation 5.75 15/3/2025 Food 775,000 800,188 0.33Pilgrim’s Pride Corporation 5.88 30/9/2027 Food 100,000 102,500 0.04Pinnacle Entertainment Incorporated 5.63 1/5/2024 Entertainment 175,000 178,938 0.07Pinnacle Foods Finance LLC 4.88 1/5/2021 Food 225,000 230,625 0.10Pinnacle Foods Finance LLC 5.88 15/1/2024 Food 150,000 159,000 0.07Post Holdings Incorporated 5.50 1/3/2025 Food 225,000 233,438 0.10Post Holdings Incorporated 5.00 15/8/2026 Food 175,000 174,672 0.07Post Holdings Incorporated 5.75 1/3/2027 Food 475,000 489,250 0.20Prestige Brands Incorporated 6.38 1/3/2024 Household Products/Wares 380,000 408,500 0.17Rockies Express Pipeline LLC 5.63 15/4/2020 Pipelines 1,950,000 2,049,938 0.85Rockies Express Pipeline LLC 7.50 15/7/2038 Pipelines 270,000 308,475 0.13Rockies Express Pipeline LLC 6.88 15/4/2040 Pipelines 1,750,000 1,942,500 0.81Sabine Pass Liquefaction LLC 5.63 1/2/2021 Pipelines 275,000 297,996 0.12Sabine Pass Liquefaction LLC 6.25 15/3/2022 Pipelines 500,000 562,231 0.23Sabine Pass Liquefaction LLC 5.63 15/4/2023 Pipelines 960,000 1,063,695 0.44Sabine Pass Liquefaction LLC 5.75 15/5/2024 Pipelines 1,050,000 1,169,716 0.49Sabra Health Care REIT Incorporated 5.50 1/2/2021 REIT 800,000 822,592 0.34Sabra Health Care REIT Incorporated 5.38 1/6/2023 REIT 800,000 826,000 0.34Salem Media Group Incorporated 6.75 1/6/2024 Media 1,475,000 1,534,000 0.64SBA Communications Corporation 4.88 15/7/2022 Telecommunications 900,000 929,250 0.39SBA Communications Corporation 4.00 1/10/2022 Telecommunications 425,000 425,000 0.18SBA Communications Corporation 4.88 1/9/2024 Telecommunications 275,000 282,906 0.12Scotts Miracle-Gro Company 6.00 15/10/2023 Housewares 100,000 106,750 0.04Sealed Air Corporation 4.88 1/12/2022 Packaging & Containers 100,000 106,375 0.04Sealed Air Corporation 5.25 1/4/2023 Packaging & Containers 350,000 377,125 0.16Sealed Air Corporation 5.13 1/12/2024 Packaging & Containers 200,000 215,250 0.09Select Medical Corporation 6.38 1/6/2021 Healthcare – Services 1,453,000 1,498,406 0.62SemGroup Corporation 5.63 15/7/2022 Pipelines 700,000 689,500 0.29SemGroup Corporation 5.63 15/11/2023 Pipelines 850,000 826,625 0.34SemGroup Corporation 6.38 15/3/2025 Pipelines 975,000 955,500 0.40SemGroup Corporation 7.25 15/3/2026 Pipelines 725,000 728,625 0.30Service Corporation International 7.63 1/10/2018 Commercial Services 615,000 650,363 0.27Service Corporation International 8.00 15/11/2021 Commercial Services 325,000 383,500 0.16Service Corporation International 5.38 15/5/2024 Commercial Services 500,000 531,250 0.22Service Corporation International 7.50 1/4/2027 Commercial Services 725,000 868,188 0.36
The accompanying notes are an integral part of these financial statements.
China Equity Fund, EUR Investment Grade Credit Fund, Global Long/Short Equity Fund, Global Low Volatility Equity Fund, Global Opportunity Bond Fund, U.S.
Dollar Short-Term Money Market Fund and USD Investment Grade Credit Fund have not been authorised by the Hong Kong Securities and Futures Commission
and are not available for investment by Hong Kong retail investors.

Portfolio of investments as at 30 September 2017 (unaudited) (continued) Wells Fargo (Lux) Worldwide Fund 49
U.S. HIGH YIELD BOND FUND
InterestRate
%Maturity
Date IndustryNominal
USD
MarketValue
USD
% ofNet
Assets
Transferable securities and money market instruments admitted to an official stock exchange listing or dealt in on another regulated market(continued)
Corporate Bonds and Notes (continued)
United States continuedServiceMaster Company LLC 5.13 15/11/2024 Commercial Services 50,000 51,375 0.02Silgan Holdings Incorporated 5.00 1/4/2020 Packaging & Containers 78,000 79,073 0.03Silgan Holdings Incorporated 5.50 1/2/2022 Packaging & Containers 600,000 615,750 0.26Sonic Automotive Incorporated 5.00 15/5/2023 Retail 565,000 552,288 0.23Sonic Automotive Incorporated 6.13 15/3/2027 Retail 750,000 765,938 0.32Southern Star Central Corporation 5.13 15/7/2022 Oil & Gas Services 1,165,000 1,201,406 0.50Southwestern Energy Company 4.10 15/3/2022 Oil & Gas Services 325,000 313,625 0.13Southwestern Energy Company 6.70 23/1/2025 Oil & Gas Services 25,000 25,375 0.01Southwestern Energy Company 7.50 1/4/2026 Oil & Gas Services 200,000 207,750 0.09Southwestern Energy Company 7.75 1/10/2027 Oil & Gas Services 200,000 207,500 0.09SP Finco LLC 6.75 1/7/2025 Healthcare – Services 675,000 634,500 0.26Spectrum Brands Incorporated 5.75 15/7/2025 Household Products/Wares 675,000 718,875 0.30Speedway Motorsports Incorporated 5.13 1/2/2023 Entertainment 50,000 51,625 0.02Springleaf Finance Corporation 6.00 1/6/2020 Diversified Financial Services 516,000 545,025 0.23Springleaf Finance Corporation 8.25 15/12/2020 Diversified Financial Services 25,000 28,250 0.01Springleaf Finance Corporation 7.75 1/10/2021 Diversified Financial Services 900,000 1,014,750 0.42Springleaf Finance Corporation 8.25 1/10/2023 Diversified Financial Services 305,000 347,700 0.14Sprint Capital Corporation 6.90 1/5/2019 Telecommunications 325,000 346,531 0.14Sprint Capital Corporation 6.88 15/11/2028 Telecommunications 1,150,000 1,288,000 0.53Sprint Capital Corporation 8.75 15/3/2032 Telecommunications 325,000 415,594 0.17Sprint Communications Incorporated 7.00 15/8/2020 Telecommunications 545,000 595,478 0.25Sprint Corporation 7.88 15/9/2023 Telecommunications 300,000 348,000 0.14Sprint Corporation 7.13 15/6/2024 Telecommunications 120,000 135,000 0.06Sprint Corporation 7.63 15/2/2025 Telecommunications 750,000 862,500 0.36SS&C Technologies Holdings Incorporated 5.88 15/7/2023 Software 1,000,000 1,055,425 0.44Summit Midstream Holdings LLC 5.75 15/4/2025 Pipelines 100,000 101,500 0.04Surgery Center Holdings Incorporated 8.88 15/4/2021 Healthcare – Services 1,100,000 1,155,000 0.48Symantec Corporation 5.00 15/4/2025 Internet 75,000 78,422 0.03Tallgrass Energy Partners LP 5.50 15/9/2024 Pipelines 3,400,000 3,493,500 1.45Tempo Acquisition LLC 6.75 1/6/2025 Diversified Financial Services 425,000 429,250 0.18Tenet Healthcare Corporation 4.75 1/6/2020 Healthcare – Services 315,000 324,450 0.13Tenet Healthcare Corporation 6.00 1/10/2020 Healthcare – Services 900,000 959,139 0.40Tenet Healthcare Corporation 4.63 15/7/2024 Healthcare – Services 545,000 538,869 0.22TerraForm Power Operating LLC 6.38 1/2/2023 Energy-Alternate Sources 2,150,000 2,236,000 0.93TerraForm Power Operating LLC 6.63 15/6/2025 Energy-Alternate Sources 1,150,000 1,224,750 0.51T-Mobile USA Incorporated 6.13 15/1/2022 Telecommunications 500,000 520,000 0.22T-Mobile USA Incorporated 4.00 15/4/2022 Telecommunications 275,000 284,768 0.12T-Mobile USA Incorporated 6.00 1/3/2023 Telecommunications 350,000 368,813 0.15T-Mobile USA Incorporated 6.63 1/4/2023 Telecommunications 372,000 391,537 0.16T-Mobile USA Incorporated 6.84 28/4/2023 Telecommunications 555,000 586,219 0.24T-Mobile USA Incorporated 6.50 15/1/2024 Telecommunications 5,000 5,328 0.00T-Mobile USA Incorporated 6.00 15/4/2024 Telecommunications 50,000 53,063 0.02T-Mobile USA Incorporated 6.38 1/3/2025 Telecommunications 1,250,000 1,345,875 0.56T-Mobile USA Incorporated 5.13 15/4/2025 Telecommunications 175,000 182,875 0.08T-Mobile USA Incorporated 5.38 15/4/2027 Telecommunications 100,000 107,780 0.04Ultra Resources Incorporated 6.88 15/4/2022 Oil & Gas Services 800,000 816,000 0.34Ultra Resources Incorporated 7.13 15/4/2025 Oil & Gas Services 400,000 404,000 0.17USIS Merger Sub Incorporated 6.88 1/5/2025 Insurance 100,000 101,875 0.04Valeant Pharmaceuticals International 6.38 15/10/2020 Pharmaceuticals 750,000 750,705 0.31Valeant Pharmaceuticals International 6.75 15/8/2021 Pharmaceuticals 700,000 686,875 0.29Valeant Pharmaceuticals International 7.25 15/7/2022 Pharmaceuticals 525,000 511,875 0.21
The accompanying notes are an integral part of these financial statements.
China Equity Fund, EUR Investment Grade Credit Fund, Global Long/Short Equity Fund, Global Low Volatility Equity Fund, Global Opportunity Bond Fund, U.S.
Dollar Short-Term Money Market Fund and USD Investment Grade Credit Fund have not been authorised by the Hong Kong Securities and Futures Commission
and are not available for investment by Hong Kong retail investors.
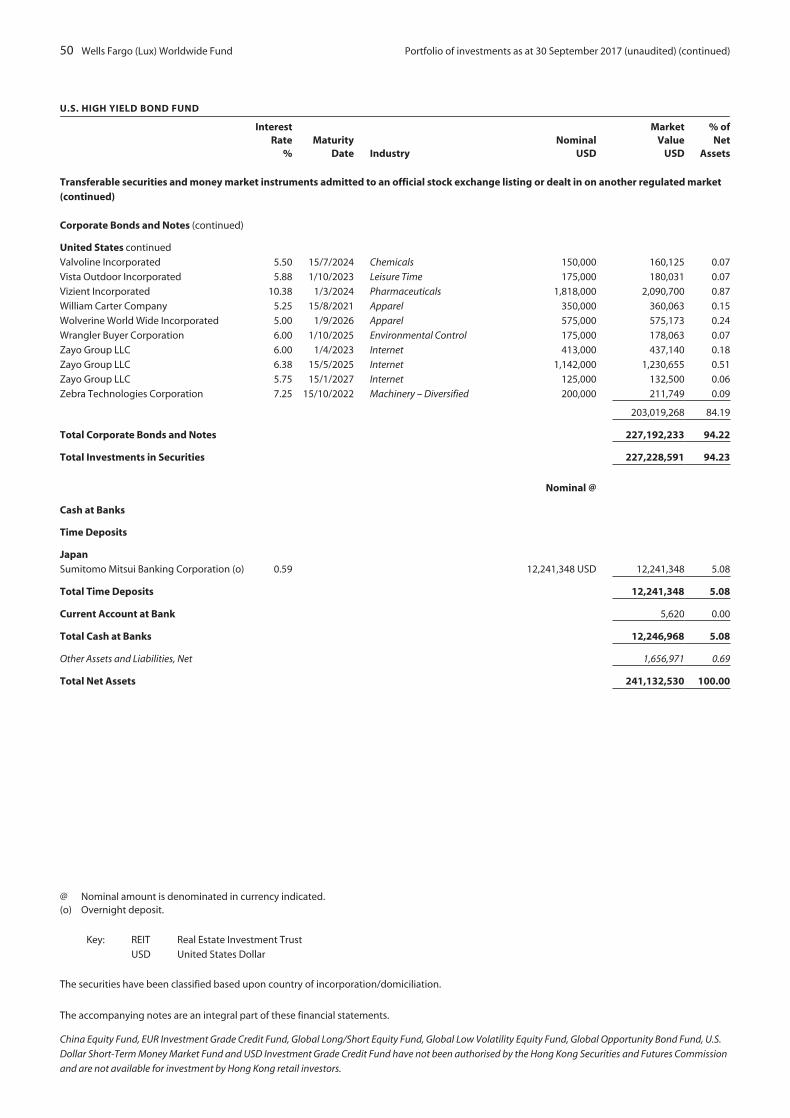
50 Wells Fargo (Lux) Worldwide Fund Portfolio of investments as at 30 September 2017 (unaudited) (continued)
U.S. HIGH YIELD BOND FUND
InterestRate
%Maturity
Date IndustryNominal
USD
MarketValue
USD
% ofNet
Assets
Transferable securities and money market instruments admitted to an official stock exchange listing or dealt in on another regulated market(continued)
Corporate Bonds and Notes (continued)
United States continued
Valvoline Incorporated 5.50 15/7/2024 Chemicals 150,000 160,125 0.07
Vista Outdoor Incorporated 5.88 1/10/2023 Leisure Time 175,000 180,031 0.07
Vizient Incorporated 10.38 1/3/2024 Pharmaceuticals 1,818,000 2,090,700 0.87
William Carter Company 5.25 15/8/2021 Apparel 350,000 360,063 0.15
Wolverine World Wide Incorporated 5.00 1/9/2026 Apparel 575,000 575,173 0.24
Wrangler Buyer Corporation 6.00 1/10/2025 Environmental Control 175,000 178,063 0.07
Zayo Group LLC 6.00 1/4/2023 Internet 413,000 437,140 0.18
Zayo Group LLC 6.38 15/5/2025 Internet 1,142,000 1,230,655 0.51
Zayo Group LLC 5.75 15/1/2027 Internet 125,000 132,500 0.06
Zebra Technologies Corporation 7.25 15/10/2022 Machinery – Diversified 200,000 211,749 0.09
203,019,268 84.19
Total Corporate Bonds and Notes 227,192,233 94.22
Total Investments in Securities 227,228,591 94.23
Nominal @
Cash at Banks
Time Deposits
JapanSumitomo Mitsui Banking Corporation (o) 0.59 12,241,348 USD 12,241,348 5.08
Total Time Deposits 12,241,348 5.08
Current Account at Bank 5,620 0.00
Total Cash at Banks 12,246,968 5.08
Other Assets and Liabilities, Net 1,656,971 0.69
Total Net Assets 241,132,530 100.00
@ Nominal amount is denominated in currency indicated.(o) Overnight deposit.
Key: REIT Real Estate Investment Trust
USD United States Dollar
The securities have been classified based upon country of incorporation/domiciliation.
The accompanying notes are an integral part of these financial statements.
China Equity Fund, EUR Investment Grade Credit Fund, Global Long/Short Equity Fund, Global Low Volatility Equity Fund, Global Opportunity Bond Fund, U.S.
Dollar Short-Term Money Market Fund and USD Investment Grade Credit Fund have not been authorised by the Hong Kong Securities and Futures Commission
and are not available for investment by Hong Kong retail investors.

Portfolio of investments as at 30 September 2017 (unaudited) Wells Fargo (Lux) Worldwide Fund 51
U.S. LARGE CAP GROWTH FUND
Industry Shares
MarketValue
USD
% ofNet
Assets
Transferable securities and money market instruments admitted to an official stock exchange listing or dealt in on another regulated market
Common Shares
ArgentinaMercadoLibre Incorporated Internet 5,050 1,307,597 1.31
CanadaWaste Connections Incorporated Environmental Control 50,770 3,551,869 3.55
ChinaCtrip.com International Limited ADR Internet 28,590 1,507,836 1.51
Tencent Holdings Limited ADR Internet 57,250 2,514,134 2.51
4,021,970 4.02
ItalyFerrari NV Auto Manufacturers 14,110 1,558,873 1.56
United StatesActivision Blizzard Incorporated Software 28,390 1,831,439 1.83
Alphabet Incorporated Class A Internet 5,380 5,238,614 5.24
Alphabet Incorporated Class C Internet 1,487 1,426,197 1.43
Amazon.com Incorporated Internet 6,585 6,330,490 6.33
Baxter International Incorporated Healthcare – Products 23,640 1,483,410 1.48
Boston Scientific Corporation Healthcare – Products 62,480 1,822,542 1.82
Broadcom Limited Semiconductors 9,100 2,207,114 2.21
Celgene Corporation Biotechnology 23,100 3,368,442 3.37
Charter Communications Incorporated Media 6,610 2,402,206 2.40
Edwards Lifesciences Corporation Healthcare – Products 14,550 1,590,460 1.59
Electronic Arts Incorporated Software 14,750 1,741,385 1.74
Facebook Incorporated Internet 20,010 3,419,109 3.42
Fidelity National Information Services Incorporated Software 28,850 2,694,301 2.69
FleetCor Technologies Incorporated Commercial Services 14,950 2,313,811 2.31
Harris Corporation Aerospace/Defense 11,440 1,506,419 1.51
Hologic Incorporated Healthcare – Products 34,310 1,258,834 1.26
Home Depot Incorporated Retail 25,360 4,147,882 4.15
Intercontinental Exchange Incorporated Diversified Financial Services 37,785 2,595,830 2.60
Microsoft Corporation Software 59,980 4,467,910 4.47
Northrop Grumman Corporation Aerospace/Defense 6,520 1,875,934 1.88
PayPal Holdings Incorporated Commercial Services 32,990 2,112,350 2.11
Raymond James Financial Incorporated Diversified Financial Services 18,580 1,566,851 1.57
S&P Global Incorporated Commercial Services 11,940 1,866,341 1.87
Salesforce.com Incorporated Software 31,980 2,987,572 2.99
SBA Communications Corporation Telecommunications 10,520 1,515,406 1.52
Sherwin-Williams Company Chemicals 7,410 2,653,076 2.65
SLM Corporation Diversified Financial Services 128,540 1,474,354 1.47
Spirit Airlines Incorporated Airlines 27,510 919,109 0.92
TJX Companies Incorporated Retail 31,900 2,351,987 2.35
Total System Services Incorporated Commercial Services 37,150 2,433,325 2.43
TransUnion Commercial Services 54,000 2,552,040 2.55
UnitedHealth Group Incorporated Healthcare – Services 24,830 4,862,956 4.86
Visa Incorporated Diversified Financial Services 47,860 5,036,786 5.04
Vulcan Materials Company Building Materials 19,270 2,304,692 2.31
88,359,174 88.37
Total Common Shares 98,799,483 98.81
Total Investments in Securities 98,799,483 98.81
The accompanying notes are an integral part of these financial statements.
China Equity Fund, EUR Investment Grade Credit Fund, Global Long/Short Equity Fund, Global Low Volatility Equity Fund, Global Opportunity Bond Fund, U.S.
Dollar Short-Term Money Market Fund and USD Investment Grade Credit Fund have not been authorised by the Hong Kong Securities and Futures Commission
and are not available for investment by Hong Kong retail investors.

52 Wells Fargo (Lux) Worldwide Fund Portfolio of investments as at 30 September 2017 (unaudited) (continued)
U.S. LARGE CAP GROWTH FUND
InterestRate
% Nominal @
MarketValue
USD
% ofNet
Assets
Cash at Banks
Time Deposits
United StatesJP Morgan Chase (o) 0.59 1,639,503 USD 1,639,503 1.64
Total Time Deposits 1,639,503 1.64
Current Accounts at Bank 1,290 0.00
Total Cash at Banks 1,640,793 1.64
Other Assets and Liabilities, Net (451,882) (0.45)
Total Net Assets 99,988,394 100.00
@ Nominal amount is denominated in currency indicated.(o) Overnight deposit.
Key: ADR American Depositary Receipt
USD United States Dollar
The securities have been classified based upon country of incorporation/domiciliation.
The accompanying notes are an integral part of these financial statements.
China Equity Fund, EUR Investment Grade Credit Fund, Global Long/Short Equity Fund, Global Low Volatility Equity Fund, Global Opportunity Bond Fund, U.S.
Dollar Short-Term Money Market Fund and USD Investment Grade Credit Fund have not been authorised by the Hong Kong Securities and Futures Commission
and are not available for investment by Hong Kong retail investors.
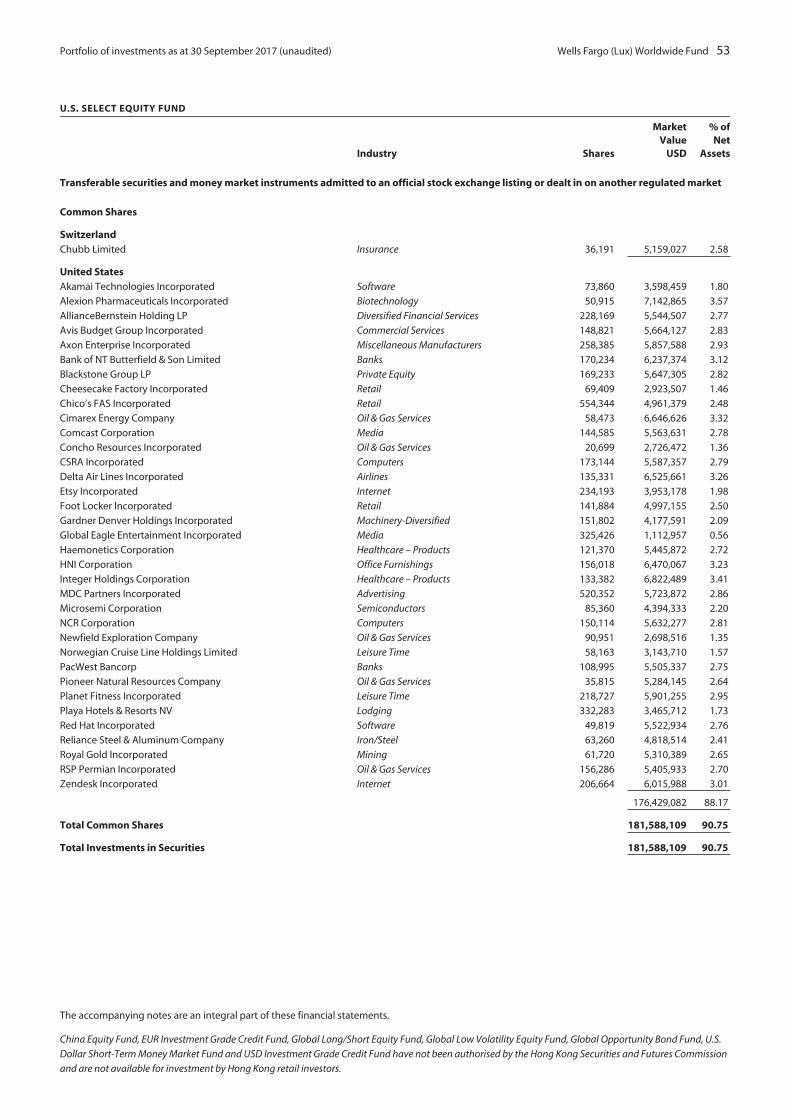
Portfolio of investments as at 30 September 2017 (unaudited) Wells Fargo (Lux) Worldwide Fund 53
U.S. SELECT EQUITY FUND
Industry Shares
MarketValue
USD
% ofNet
Assets
Transferable securities and money market instruments admitted to an official stock exchange listing or dealt in on another regulated market
Common Shares
SwitzerlandChubb Limited Insurance 36,191 5,159,027 2.58
United StatesAkamai Technologies Incorporated Software 73,860 3,598,459 1.80
Alexion Pharmaceuticals Incorporated Biotechnology 50,915 7,142,865 3.57
AllianceBernstein Holding LP Diversified Financial Services 228,169 5,544,507 2.77
Avis Budget Group Incorporated Commercial Services 148,821 5,664,127 2.83
Axon Enterprise Incorporated Miscellaneous Manufacturers 258,385 5,857,588 2.93
Bank of NT Butterfield & Son Limited Banks 170,234 6,237,374 3.12
Blackstone Group LP Private Equity 169,233 5,647,305 2.82
Cheesecake Factory Incorporated Retail 69,409 2,923,507 1.46
Chico’s FAS Incorporated Retail 554,344 4,961,379 2.48
Cimarex Energy Company Oil & Gas Services 58,473 6,646,626 3.32
Comcast Corporation Media 144,585 5,563,631 2.78
Concho Resources Incorporated Oil & Gas Services 20,699 2,726,472 1.36
CSRA Incorporated Computers 173,144 5,587,357 2.79
Delta Air Lines Incorporated Airlines 135,331 6,525,661 3.26
Etsy Incorporated Internet 234,193 3,953,178 1.98
Foot Locker Incorporated Retail 141,884 4,997,155 2.50
Gardner Denver Holdings Incorporated Machinery-Diversified 151,802 4,177,591 2.09
Global Eagle Entertainment Incorporated Media 325,426 1,112,957 0.56
Haemonetics Corporation Healthcare – Products 121,370 5,445,872 2.72
HNI Corporation Office Furnishings 156,018 6,470,067 3.23
Integer Holdings Corporation Healthcare – Products 133,382 6,822,489 3.41
MDC Partners Incorporated Advertising 520,352 5,723,872 2.86
Microsemi Corporation Semiconductors 85,360 4,394,333 2.20
NCR Corporation Computers 150,114 5,632,277 2.81
Newfield Exploration Company Oil & Gas Services 90,951 2,698,516 1.35
Norwegian Cruise Line Holdings Limited Leisure Time 58,163 3,143,710 1.57
PacWest Bancorp Banks 108,995 5,505,337 2.75
Pioneer Natural Resources Company Oil & Gas Services 35,815 5,284,145 2.64
Planet Fitness Incorporated Leisure Time 218,727 5,901,255 2.95
Playa Hotels & Resorts NV Lodging 332,283 3,465,712 1.73
Red Hat Incorporated Software 49,819 5,522,934 2.76
Reliance Steel & Aluminum Company Iron/Steel 63,260 4,818,514 2.41
Royal Gold Incorporated Mining 61,720 5,310,389 2.65
RSP Permian Incorporated Oil & Gas Services 156,286 5,405,933 2.70
Zendesk Incorporated Internet 206,664 6,015,988 3.01
176,429,082 88.17
Total Common Shares 181,588,109 90.75
Total Investments in Securities 181,588,109 90.75
The accompanying notes are an integral part of these financial statements.
China Equity Fund, EUR Investment Grade Credit Fund, Global Long/Short Equity Fund, Global Low Volatility Equity Fund, Global Opportunity Bond Fund, U.S.
Dollar Short-Term Money Market Fund and USD Investment Grade Credit Fund have not been authorised by the Hong Kong Securities and Futures Commission
and are not available for investment by Hong Kong retail investors.
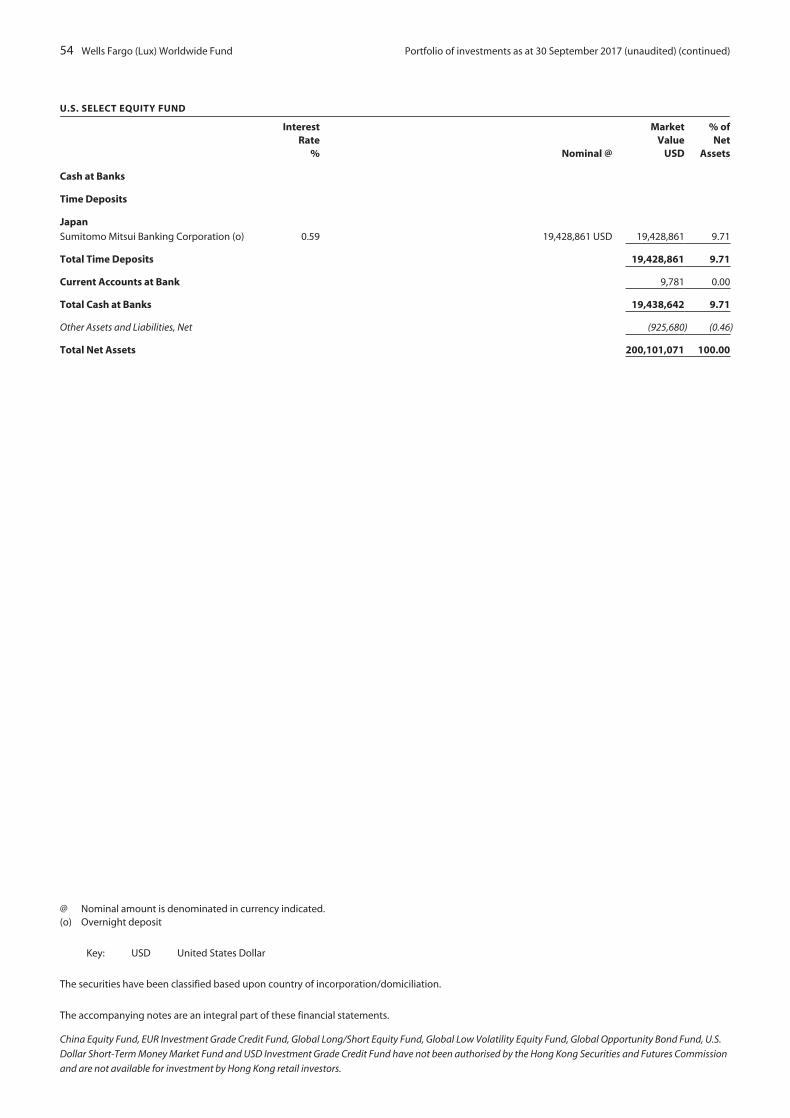
54 Wells Fargo (Lux) Worldwide Fund Portfolio of investments as at 30 September 2017 (unaudited) (continued)
U.S. SELECT EQUITY FUND
InterestRate
% Nominal @
MarketValue
USD
% ofNet
Assets
Cash at Banks
Time Deposits
JapanSumitomo Mitsui Banking Corporation (o) 0.59 19,428,861 USD 19,428,861 9.71
Total Time Deposits 19,428,861 9.71
Current Accounts at Bank 9,781 0.00
Total Cash at Banks 19,438,642 9.71
Other Assets and Liabilities, Net (925,680) (0.46)
Total Net Assets 200,101,071 100.00
@ Nominal amount is denominated in currency indicated.(o) Overnight deposit
Key: USD United States Dollar
The securities have been classified based upon country of incorporation/domiciliation.
The accompanying notes are an integral part of these financial statements.
China Equity Fund, EUR Investment Grade Credit Fund, Global Long/Short Equity Fund, Global Low Volatility Equity Fund, Global Opportunity Bond Fund, U.S.
Dollar Short-Term Money Market Fund and USD Investment Grade Credit Fund have not been authorised by the Hong Kong Securities and Futures Commission
and are not available for investment by Hong Kong retail investors.
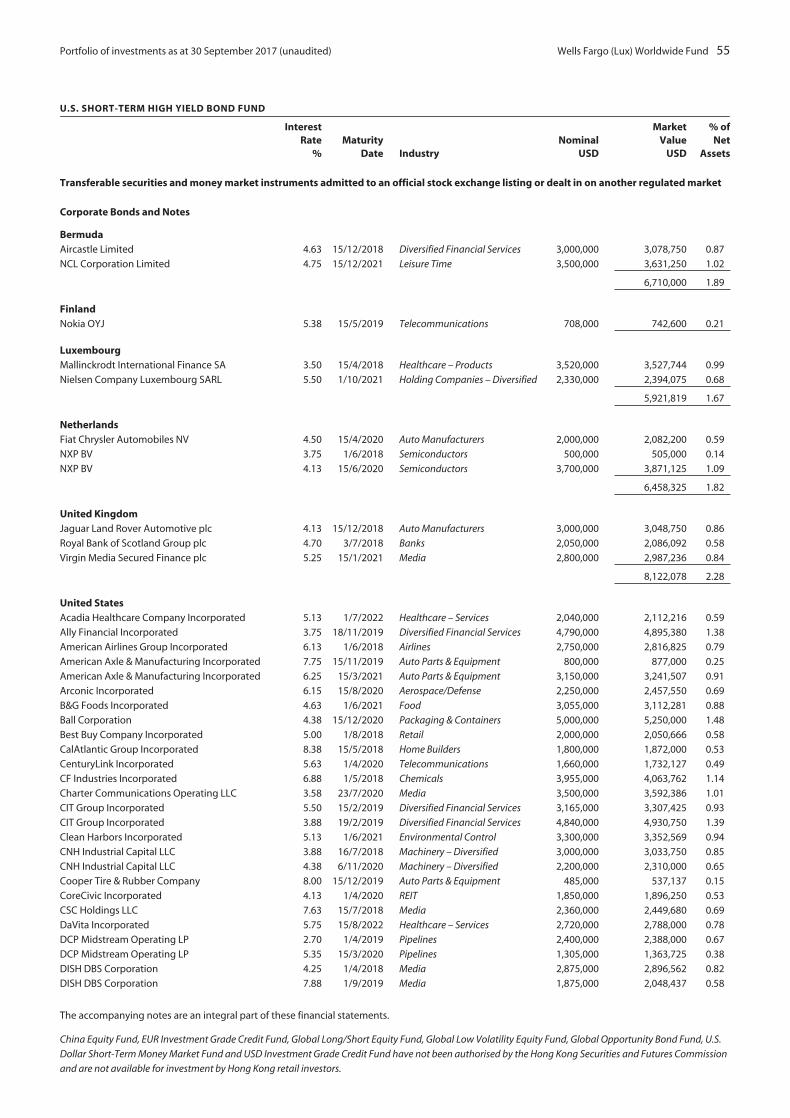
Portfolio of investments as at 30 September 2017 (unaudited) Wells Fargo (Lux) Worldwide Fund 55
U.S. SHORT-TERM HIGH YIELD BOND FUND
InterestRate
%Maturity
Date IndustryNominal
USD
MarketValue
USD
% ofNet
Assets
Transferable securities and money market instruments admitted to an official stock exchange listing or dealt in on another regulated market
Corporate Bonds and Notes
BermudaAircastle Limited 4.63 15/12/2018 Diversified Financial Services 3,000,000 3,078,750 0.87
NCL Corporation Limited 4.75 15/12/2021 Leisure Time 3,500,000 3,631,250 1.02
6,710,000 1.89
FinlandNokia OYJ 5.38 15/5/2019 Telecommunications 708,000 742,600 0.21
LuxembourgMallinckrodt International Finance SA 3.50 15/4/2018 Healthcare – Products 3,520,000 3,527,744 0.99
Nielsen Company Luxembourg SARL 5.50 1/10/2021 Holding Companies – Diversified 2,330,000 2,394,075 0.68
5,921,819 1.67
NetherlandsFiat Chrysler Automobiles NV 4.50 15/4/2020 Auto Manufacturers 2,000,000 2,082,200 0.59
NXP BV 3.75 1/6/2018 Semiconductors 500,000 505,000 0.14
NXP BV 4.13 15/6/2020 Semiconductors 3,700,000 3,871,125 1.09
6,458,325 1.82
United KingdomJaguar Land Rover Automotive plc 4.13 15/12/2018 Auto Manufacturers 3,000,000 3,048,750 0.86
Royal Bank of Scotland Group plc 4.70 3/7/2018 Banks 2,050,000 2,086,092 0.58
Virgin Media Secured Finance plc 5.25 15/1/2021 Media 2,800,000 2,987,236 0.84
8,122,078 2.28
United StatesAcadia Healthcare Company Incorporated 5.13 1/7/2022 Healthcare – Services 2,040,000 2,112,216 0.59
Ally Financial Incorporated 3.75 18/11/2019 Diversified Financial Services 4,790,000 4,895,380 1.38
American Airlines Group Incorporated 6.13 1/6/2018 Airlines 2,750,000 2,816,825 0.79
American Axle & Manufacturing Incorporated 7.75 15/11/2019 Auto Parts & Equipment 800,000 877,000 0.25
American Axle & Manufacturing Incorporated 6.25 15/3/2021 Auto Parts & Equipment 3,150,000 3,241,507 0.91
Arconic Incorporated 6.15 15/8/2020 Aerospace/Defense 2,250,000 2,457,550 0.69
B&G Foods Incorporated 4.63 1/6/2021 Food 3,055,000 3,112,281 0.88
Ball Corporation 4.38 15/12/2020 Packaging & Containers 5,000,000 5,250,000 1.48
Best Buy Company Incorporated 5.00 1/8/2018 Retail 2,000,000 2,050,666 0.58
CalAtlantic Group Incorporated 8.38 15/5/2018 Home Builders 1,800,000 1,872,000 0.53
CenturyLink Incorporated 5.63 1/4/2020 Telecommunications 1,660,000 1,732,127 0.49
CF Industries Incorporated 6.88 1/5/2018 Chemicals 3,955,000 4,063,762 1.14
Charter Communications Operating LLC 3.58 23/7/2020 Media 3,500,000 3,592,386 1.01
CIT Group Incorporated 5.50 15/2/2019 Diversified Financial Services 3,165,000 3,307,425 0.93
CIT Group Incorporated 3.88 19/2/2019 Diversified Financial Services 4,840,000 4,930,750 1.39
Clean Harbors Incorporated 5.13 1/6/2021 Environmental Control 3,300,000 3,352,569 0.94
CNH Industrial Capital LLC 3.88 16/7/2018 Machinery – Diversified 3,000,000 3,033,750 0.85
CNH Industrial Capital LLC 4.38 6/11/2020 Machinery – Diversified 2,200,000 2,310,000 0.65
Cooper Tire & Rubber Company 8.00 15/12/2019 Auto Parts & Equipment 485,000 537,137 0.15
CoreCivic Incorporated 4.13 1/4/2020 REIT 1,850,000 1,896,250 0.53
CSC Holdings LLC 7.63 15/7/2018 Media 2,360,000 2,449,680 0.69
DaVita Incorporated 5.75 15/8/2022 Healthcare – Services 2,720,000 2,788,000 0.78
DCP Midstream Operating LP 2.70 1/4/2019 Pipelines 2,400,000 2,388,000 0.67
DCP Midstream Operating LP 5.35 15/3/2020 Pipelines 1,305,000 1,363,725 0.38
DISH DBS Corporation 4.25 1/4/2018 Media 2,875,000 2,896,562 0.82
DISH DBS Corporation 7.88 1/9/2019 Media 1,875,000 2,048,437 0.58
The accompanying notes are an integral part of these financial statements.
China Equity Fund, EUR Investment Grade Credit Fund, Global Long/Short Equity Fund, Global Low Volatility Equity Fund, Global Opportunity Bond Fund, U.S.
Dollar Short-Term Money Market Fund and USD Investment Grade Credit Fund have not been authorised by the Hong Kong Securities and Futures Commission
and are not available for investment by Hong Kong retail investors.
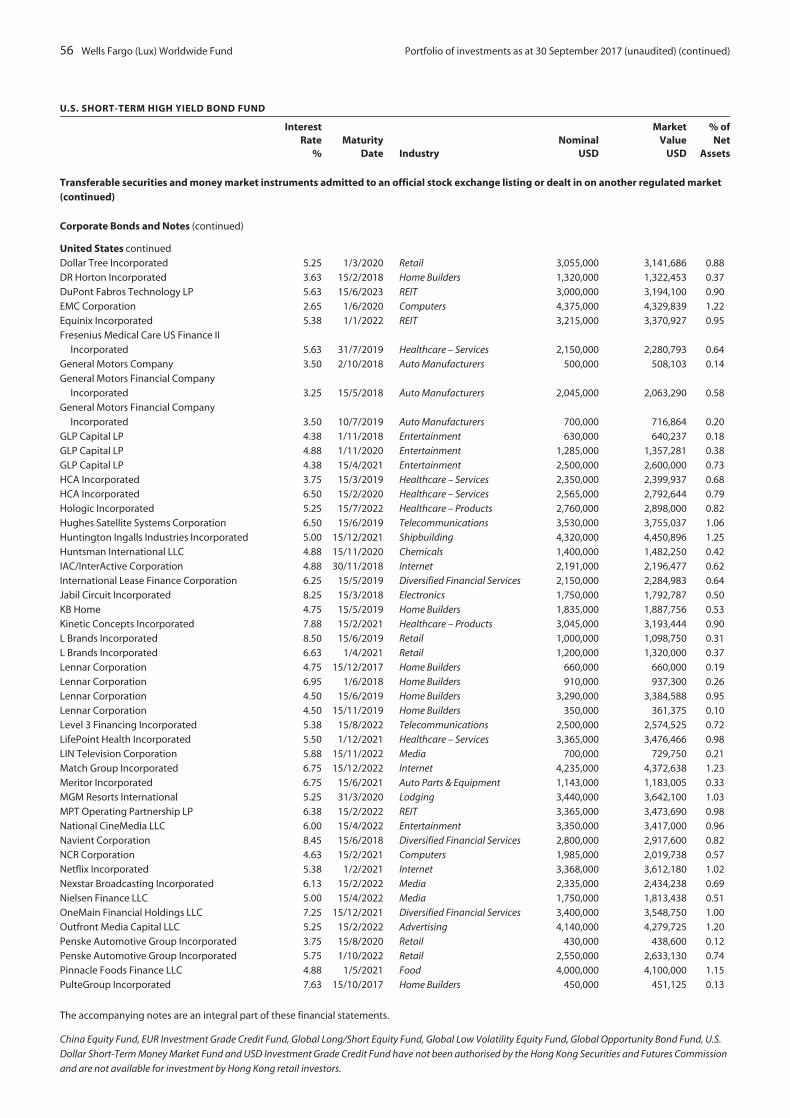
56 Wells Fargo (Lux) Worldwide Fund Portfolio of investments as at 30 September 2017 (unaudited) (continued)
U.S. SHORT-TERM HIGH YIELD BOND FUND
InterestRate
%Maturity
Date IndustryNominal
USD
MarketValue
USD
% ofNet
Assets
Transferable securities and money market instruments admitted to an official stock exchange listing or dealt in on another regulated market(continued)
Corporate Bonds and Notes (continued)
United States continued
Dollar Tree Incorporated 5.25 1/3/2020 Retail 3,055,000 3,141,686 0.88
DR Horton Incorporated 3.63 15/2/2018 Home Builders 1,320,000 1,322,453 0.37
DuPont Fabros Technology LP 5.63 15/6/2023 REIT 3,000,000 3,194,100 0.90
EMC Corporation 2.65 1/6/2020 Computers 4,375,000 4,329,839 1.22
Equinix Incorporated 5.38 1/1/2022 REIT 3,215,000 3,370,927 0.95
Fresenius Medical Care US Finance II
Incorporated 5.63 31/7/2019 Healthcare – Services 2,150,000 2,280,793 0.64
General Motors Company 3.50 2/10/2018 Auto Manufacturers 500,000 508,103 0.14
General Motors Financial Company
Incorporated 3.25 15/5/2018 Auto Manufacturers 2,045,000 2,063,290 0.58
General Motors Financial Company
Incorporated 3.50 10/7/2019 Auto Manufacturers 700,000 716,864 0.20
GLP Capital LP 4.38 1/11/2018 Entertainment 630,000 640,237 0.18
GLP Capital LP 4.88 1/11/2020 Entertainment 1,285,000 1,357,281 0.38
GLP Capital LP 4.38 15/4/2021 Entertainment 2,500,000 2,600,000 0.73
HCA Incorporated 3.75 15/3/2019 Healthcare – Services 2,350,000 2,399,937 0.68
HCA Incorporated 6.50 15/2/2020 Healthcare – Services 2,565,000 2,792,644 0.79
Hologic Incorporated 5.25 15/7/2022 Healthcare – Products 2,760,000 2,898,000 0.82
Hughes Satellite Systems Corporation 6.50 15/6/2019 Telecommunications 3,530,000 3,755,037 1.06
Huntington Ingalls Industries Incorporated 5.00 15/12/2021 Shipbuilding 4,320,000 4,450,896 1.25
Huntsman International LLC 4.88 15/11/2020 Chemicals 1,400,000 1,482,250 0.42
IAC/InterActive Corporation 4.88 30/11/2018 Internet 2,191,000 2,196,477 0.62
International Lease Finance Corporation 6.25 15/5/2019 Diversified Financial Services 2,150,000 2,284,983 0.64
Jabil Circuit Incorporated 8.25 15/3/2018 Electronics 1,750,000 1,792,787 0.50
KB Home 4.75 15/5/2019 Home Builders 1,835,000 1,887,756 0.53
Kinetic Concepts Incorporated 7.88 15/2/2021 Healthcare – Products 3,045,000 3,193,444 0.90
L Brands Incorporated 8.50 15/6/2019 Retail 1,000,000 1,098,750 0.31
L Brands Incorporated 6.63 1/4/2021 Retail 1,200,000 1,320,000 0.37
Lennar Corporation 4.75 15/12/2017 Home Builders 660,000 660,000 0.19
Lennar Corporation 6.95 1/6/2018 Home Builders 910,000 937,300 0.26
Lennar Corporation 4.50 15/6/2019 Home Builders 3,290,000 3,384,588 0.95
Lennar Corporation 4.50 15/11/2019 Home Builders 350,000 361,375 0.10
Level 3 Financing Incorporated 5.38 15/8/2022 Telecommunications 2,500,000 2,574,525 0.72
LifePoint Health Incorporated 5.50 1/12/2021 Healthcare – Services 3,365,000 3,476,466 0.98
LIN Television Corporation 5.88 15/11/2022 Media 700,000 729,750 0.21
Match Group Incorporated 6.75 15/12/2022 Internet 4,235,000 4,372,638 1.23
Meritor Incorporated 6.75 15/6/2021 Auto Parts & Equipment 1,143,000 1,183,005 0.33
MGM Resorts International 5.25 31/3/2020 Lodging 3,440,000 3,642,100 1.03
MPT Operating Partnership LP 6.38 15/2/2022 REIT 3,365,000 3,473,690 0.98
National CineMedia LLC 6.00 15/4/2022 Entertainment 3,350,000 3,417,000 0.96
Navient Corporation 8.45 15/6/2018 Diversified Financial Services 2,800,000 2,917,600 0.82
NCR Corporation 4.63 15/2/2021 Computers 1,985,000 2,019,738 0.57
Netflix Incorporated 5.38 1/2/2021 Internet 3,368,000 3,612,180 1.02
Nexstar Broadcasting Incorporated 6.13 15/2/2022 Media 2,335,000 2,434,238 0.69
Nielsen Finance LLC 5.00 15/4/2022 Media 1,750,000 1,813,438 0.51
OneMain Financial Holdings LLC 7.25 15/12/2021 Diversified Financial Services 3,400,000 3,548,750 1.00
Outfront Media Capital LLC 5.25 15/2/2022 Advertising 4,140,000 4,279,725 1.20
Penske Automotive Group Incorporated 3.75 15/8/2020 Retail 430,000 438,600 0.12
Penske Automotive Group Incorporated 5.75 1/10/2022 Retail 2,550,000 2,633,130 0.74
Pinnacle Foods Finance LLC 4.88 1/5/2021 Food 4,000,000 4,100,000 1.15
PulteGroup Incorporated 7.63 15/10/2017 Home Builders 450,000 451,125 0.13
The accompanying notes are an integral part of these financial statements.
China Equity Fund, EUR Investment Grade Credit Fund, Global Long/Short Equity Fund, Global Low Volatility Equity Fund, Global Opportunity Bond Fund, U.S.
Dollar Short-Term Money Market Fund and USD Investment Grade Credit Fund have not been authorised by the Hong Kong Securities and Futures Commission
and are not available for investment by Hong Kong retail investors.
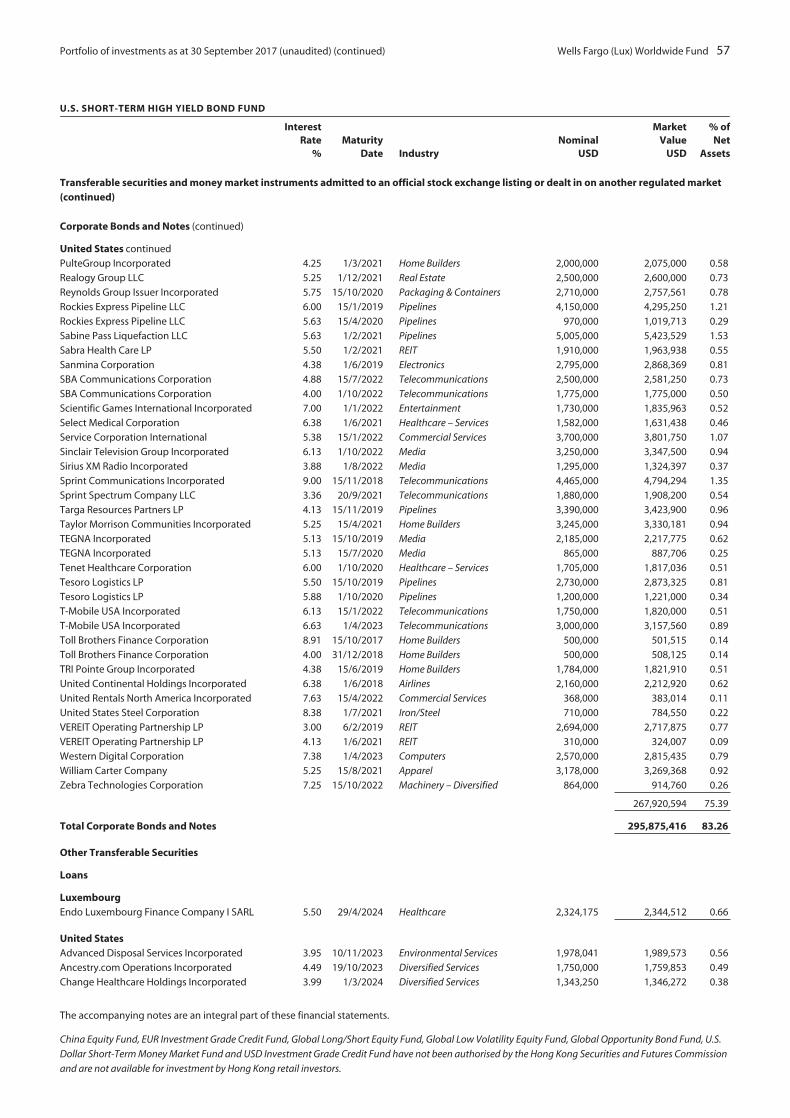
Portfolio of investments as at 30 September 2017 (unaudited) (continued) Wells Fargo (Lux) Worldwide Fund 57
U.S. SHORT-TERM HIGH YIELD BOND FUND
InterestRate
%Maturity
Date IndustryNominal
USD
MarketValue
USD
% ofNet
Assets
Transferable securities and money market instruments admitted to an official stock exchange listing or dealt in on another regulated market(continued)
Corporate Bonds and Notes (continued)
United States continued
PulteGroup Incorporated 4.25 1/3/2021 Home Builders 2,000,000 2,075,000 0.58
Realogy Group LLC 5.25 1/12/2021 Real Estate 2,500,000 2,600,000 0.73
Reynolds Group Issuer Incorporated 5.75 15/10/2020 Packaging & Containers 2,710,000 2,757,561 0.78
Rockies Express Pipeline LLC 6.00 15/1/2019 Pipelines 4,150,000 4,295,250 1.21
Rockies Express Pipeline LLC 5.63 15/4/2020 Pipelines 970,000 1,019,713 0.29
Sabine Pass Liquefaction LLC 5.63 1/2/2021 Pipelines 5,005,000 5,423,529 1.53
Sabra Health Care LP 5.50 1/2/2021 REIT 1,910,000 1,963,938 0.55
Sanmina Corporation 4.38 1/6/2019 Electronics 2,795,000 2,868,369 0.81
SBA Communications Corporation 4.88 15/7/2022 Telecommunications 2,500,000 2,581,250 0.73
SBA Communications Corporation 4.00 1/10/2022 Telecommunications 1,775,000 1,775,000 0.50
Scientific Games International Incorporated 7.00 1/1/2022 Entertainment 1,730,000 1,835,963 0.52
Select Medical Corporation 6.38 1/6/2021 Healthcare – Services 1,582,000 1,631,438 0.46
Service Corporation International 5.38 15/1/2022 Commercial Services 3,700,000 3,801,750 1.07
Sinclair Television Group Incorporated 6.13 1/10/2022 Media 3,250,000 3,347,500 0.94
Sirius XM Radio Incorporated 3.88 1/8/2022 Media 1,295,000 1,324,397 0.37
Sprint Communications Incorporated 9.00 15/11/2018 Telecommunications 4,465,000 4,794,294 1.35
Sprint Spectrum Company LLC 3.36 20/9/2021 Telecommunications 1,880,000 1,908,200 0.54
Targa Resources Partners LP 4.13 15/11/2019 Pipelines 3,390,000 3,423,900 0.96
Taylor Morrison Communities Incorporated 5.25 15/4/2021 Home Builders 3,245,000 3,330,181 0.94
TEGNA Incorporated 5.13 15/10/2019 Media 2,185,000 2,217,775 0.62
TEGNA Incorporated 5.13 15/7/2020 Media 865,000 887,706 0.25
Tenet Healthcare Corporation 6.00 1/10/2020 Healthcare – Services 1,705,000 1,817,036 0.51
Tesoro Logistics LP 5.50 15/10/2019 Pipelines 2,730,000 2,873,325 0.81
Tesoro Logistics LP 5.88 1/10/2020 Pipelines 1,200,000 1,221,000 0.34
T-Mobile USA Incorporated 6.13 15/1/2022 Telecommunications 1,750,000 1,820,000 0.51
T-Mobile USA Incorporated 6.63 1/4/2023 Telecommunications 3,000,000 3,157,560 0.89
Toll Brothers Finance Corporation 8.91 15/10/2017 Home Builders 500,000 501,515 0.14
Toll Brothers Finance Corporation 4.00 31/12/2018 Home Builders 500,000 508,125 0.14
TRI Pointe Group Incorporated 4.38 15/6/2019 Home Builders 1,784,000 1,821,910 0.51
United Continental Holdings Incorporated 6.38 1/6/2018 Airlines 2,160,000 2,212,920 0.62
United Rentals North America Incorporated 7.63 15/4/2022 Commercial Services 368,000 383,014 0.11
United States Steel Corporation 8.38 1/7/2021 Iron/Steel 710,000 784,550 0.22
VEREIT Operating Partnership LP 3.00 6/2/2019 REIT 2,694,000 2,717,875 0.77
VEREIT Operating Partnership LP 4.13 1/6/2021 REIT 310,000 324,007 0.09
Western Digital Corporation 7.38 1/4/2023 Computers 2,570,000 2,815,435 0.79
William Carter Company 5.25 15/8/2021 Apparel 3,178,000 3,269,368 0.92
Zebra Technologies Corporation 7.25 15/10/2022 Machinery – Diversified 864,000 914,760 0.26
267,920,594 75.39
Total Corporate Bonds and Notes 295,875,416 83.26
Other Transferable Securities
Loans
LuxembourgEndo Luxembourg Finance Company I SARL 5.50 29/4/2024 Healthcare 2,324,175 2,344,512 0.66
United StatesAdvanced Disposal Services Incorporated 3.95 10/11/2023 Environmental Services 1,978,041 1,989,573 0.56
Ancestry.com Operations Incorporated 4.49 19/10/2023 Diversified Services 1,750,000 1,759,853 0.49
Change Healthcare Holdings Incorporated 3.99 1/3/2024 Diversified Services 1,343,250 1,346,272 0.38
The accompanying notes are an integral part of these financial statements.
China Equity Fund, EUR Investment Grade Credit Fund, Global Long/Short Equity Fund, Global Low Volatility Equity Fund, Global Opportunity Bond Fund, U.S.
Dollar Short-Term Money Market Fund and USD Investment Grade Credit Fund have not been authorised by the Hong Kong Securities and Futures Commission
and are not available for investment by Hong Kong retail investors.
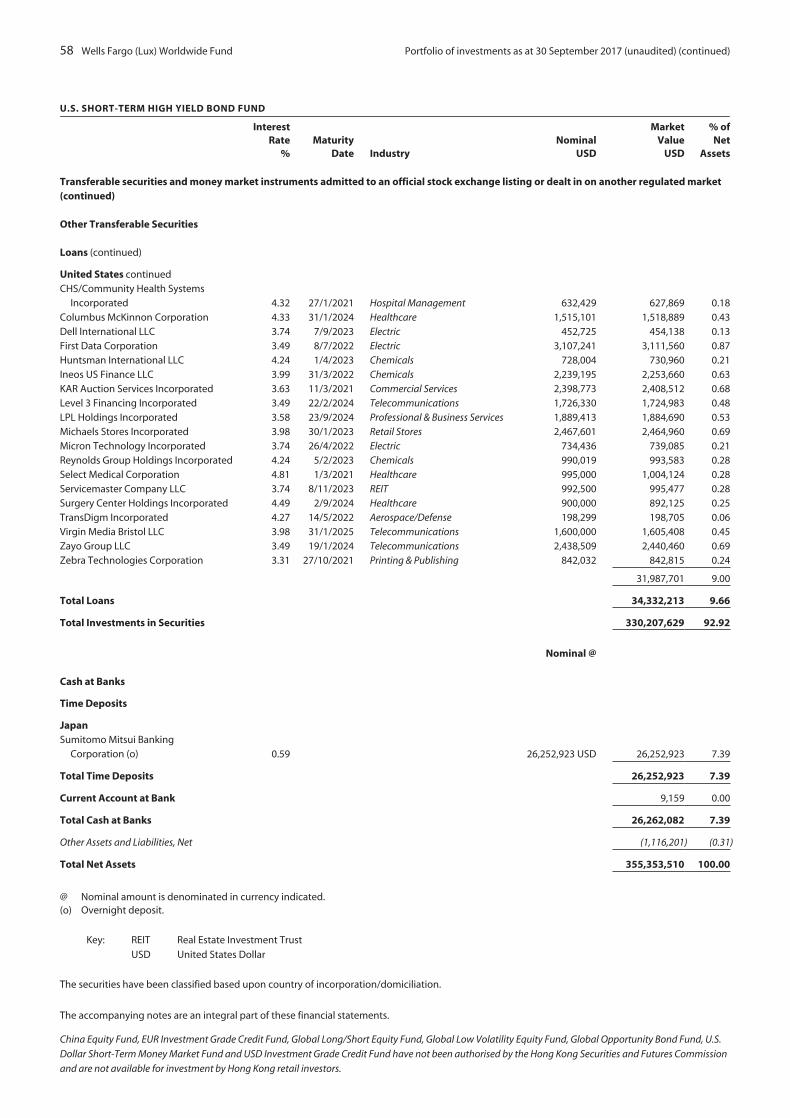
58 Wells Fargo (Lux) Worldwide Fund Portfolio of investments as at 30 September 2017 (unaudited) (continued)
U.S. SHORT-TERM HIGH YIELD BOND FUND
InterestRate
%Maturity
Date IndustryNominal
USD
MarketValue
USD
% ofNet
Assets
Transferable securities and money market instruments admitted to an official stock exchange listing or dealt in on another regulated market(continued)
Other Transferable Securities
Loans (continued)
United States continuedCHS/Community Health Systems
Incorporated 4.32 27/1/2021 Hospital Management 632,429 627,869 0.18Columbus McKinnon Corporation 4.33 31/1/2024 Healthcare 1,515,101 1,518,889 0.43Dell International LLC 3.74 7/9/2023 Electric 452,725 454,138 0.13First Data Corporation 3.49 8/7/2022 Electric 3,107,241 3,111,560 0.87Huntsman International LLC 4.24 1/4/2023 Chemicals 728,004 730,960 0.21Ineos US Finance LLC 3.99 31/3/2022 Chemicals 2,239,195 2,253,660 0.63KAR Auction Services Incorporated 3.63 11/3/2021 Commercial Services 2,398,773 2,408,512 0.68Level 3 Financing Incorporated 3.49 22/2/2024 Telecommunications 1,726,330 1,724,983 0.48LPL Holdings Incorporated 3.58 23/9/2024 Professional & Business Services 1,889,413 1,884,690 0.53Michaels Stores Incorporated 3.98 30/1/2023 Retail Stores 2,467,601 2,464,960 0.69Micron Technology Incorporated 3.74 26/4/2022 Electric 734,436 739,085 0.21Reynolds Group Holdings Incorporated 4.24 5/2/2023 Chemicals 990,019 993,583 0.28Select Medical Corporation 4.81 1/3/2021 Healthcare 995,000 1,004,124 0.28Servicemaster Company LLC 3.74 8/11/2023 REIT 992,500 995,477 0.28Surgery Center Holdings Incorporated 4.49 2/9/2024 Healthcare 900,000 892,125 0.25TransDigm Incorporated 4.27 14/5/2022 Aerospace/Defense 198,299 198,705 0.06Virgin Media Bristol LLC 3.98 31/1/2025 Telecommunications 1,600,000 1,605,408 0.45Zayo Group LLC 3.49 19/1/2024 Telecommunications 2,438,509 2,440,460 0.69Zebra Technologies Corporation 3.31 27/10/2021 Printing & Publishing 842,032 842,815 0.24
31,987,701 9.00
Total Loans 34,332,213 9.66
Total Investments in Securities 330,207,629 92.92
Nominal @
Cash at Banks
Time Deposits
JapanSumitomo Mitsui Banking
Corporation (o) 0.59 26,252,923 USD 26,252,923 7.39
Total Time Deposits 26,252,923 7.39
Current Account at Bank 9,159 0.00
Total Cash at Banks 26,262,082 7.39
Other Assets and Liabilities, Net (1,116,201) (0.31)
Total Net Assets 355,353,510 100.00
@ Nominal amount is denominated in currency indicated.(o) Overnight deposit.
Key: REIT Real Estate Investment Trust
USD United States Dollar
The securities have been classified based upon country of incorporation/domiciliation.
The accompanying notes are an integral part of these financial statements.
China Equity Fund, EUR Investment Grade Credit Fund, Global Long/Short Equity Fund, Global Low Volatility Equity Fund, Global Opportunity Bond Fund, U.S.
Dollar Short-Term Money Market Fund and USD Investment Grade Credit Fund have not been authorised by the Hong Kong Securities and Futures Commission
and are not available for investment by Hong Kong retail investors.

Portfolio of investments as at 30 September 2017 (unaudited) Wells Fargo (Lux) Worldwide Fund 59
U.S. SMALL CAP VALUE FUND
Industry Shares
MarketValue
USD
% ofNet
Assets
Transferable securities and money market instruments admitted to an official stock exchange listing or dealt in on another regulated market
Common Shares
CanadaAlgonquin Power & Utilities Corporation Electric 10,946 115,699 0.26
Mercer International Incorporated Forest Products & Paper 33,431 396,157 0.89
Tucows Incorporated Internet 2,483 145,380 0.33
657,236 1.48
IsraelSilicom Limited Telecommunications 7,098 415,304 0.93
Tower Semiconductor Limited Semiconductors 13,492 414,879 0.93
830,183 1.86
TaiwanSilicon Motion Technology Corporation ADR Semiconductors 8,925 428,668 0.96
United StatesAddus HomeCare Corporation Healthcare – Services 5,011 176,888 0.40
American Eagle Outfitters Incorporated Retail 21,861 312,612 0.70
American Equity Investment Life Holding Company Insurance 12,374 359,836 0.81
AMN Healthcare Services Incorporated Commercial Services 9,027 412,534 0.93
Applied Optoelectronics Incorporated Electronics 4,352 281,444 0.63
Aqua America Incorporated Water 10,285 341,359 0.77
Armada Hoffler Properties Incorporated REIT 22,486 310,532 0.70
Banc of California Incorporated Savings & Loans 19,258 399,603 0.90
BankUnited Incorporated Banks 12,175 433,065 0.97
Banner Corporation Banks 7,416 454,452 1.02
Barrett Business Services Incorporated Commercial Services 1,673 94,575 0.21
BG Staffing Incorporated Commercial Services 4,147 68,633 0.15
Big Lots Incorporated Retail 5,578 298,813 0.67
Blucora Incorporated Internet 15,335 387,975 0.87
Boise Cascade Company Building Materials 12,877 449,407 1.01
Brookdale Senior Living Incorporated Healthcare – Services 12,767 135,330 0.30
CAI International Incorporated Commercial Services 13,044 395,494 0.89
Callon Petroleum Company Oil & Gas Services 31,120 349,789 0.78
CareTrust REIT Incorporated REIT 20,274 386,017 0.87
Carriage Services Incorporated Commercial Services 10,287 263,347 0.59
Carrizo Oil & Gas Incorporated Oil & Gas Services 17,977 307,946 0.69
Carter’s Incorporated Apparel 3,050 301,187 0.68
Casella Waste Systems Incorporated Environmental Control 23,852 448,418 1.01
CBIZ Incorporated Commercial Services 28,163 457,649 1.03
Charles & Colvard Limited Mining 23,791 20,698 0.05
Children’s Place Incorporated Retail 2,376 280,724 0.63
Collectors Universe Incorporated Commercial Services 8,492 203,553 0.46
Columbia Sportswear Company Apparel 3,513 216,331 0.49
Computer Programs & Systems Incorporated Software 1,382 40,838 0.09
Cooper-Standard Holdings Incorporated Auto Parts & Equipment 3,807 441,498 0.99
Core Molding Technologies Incorporated Miscellaneous Manufacturers 13,352 292,943 0.66
CoreSite Realty Corporation REIT 2,454 274,603 0.62
Covenant Transportation Group Incorporated Transportation 5,763 167,012 0.37
Crawford & Company Insurance 21,168 253,169 0.57
Crown Crafts Incorporated Textiles 6,129 39,838 0.09
Customers Bancorp Incorporated Banks 14,429 470,674 1.06
Cypress Semiconductor Corporation Semiconductors 26,116 392,262 0.88
The accompanying notes are an integral part of these financial statements.
China Equity Fund, EUR Investment Grade Credit Fund, Global Long/Short Equity Fund, Global Low Volatility Equity Fund, Global Opportunity Bond Fund, U.S.
Dollar Short-Term Money Market Fund and USD Investment Grade Credit Fund have not been authorised by the Hong Kong Securities and Futures Commission
and are not available for investment by Hong Kong retail investors.
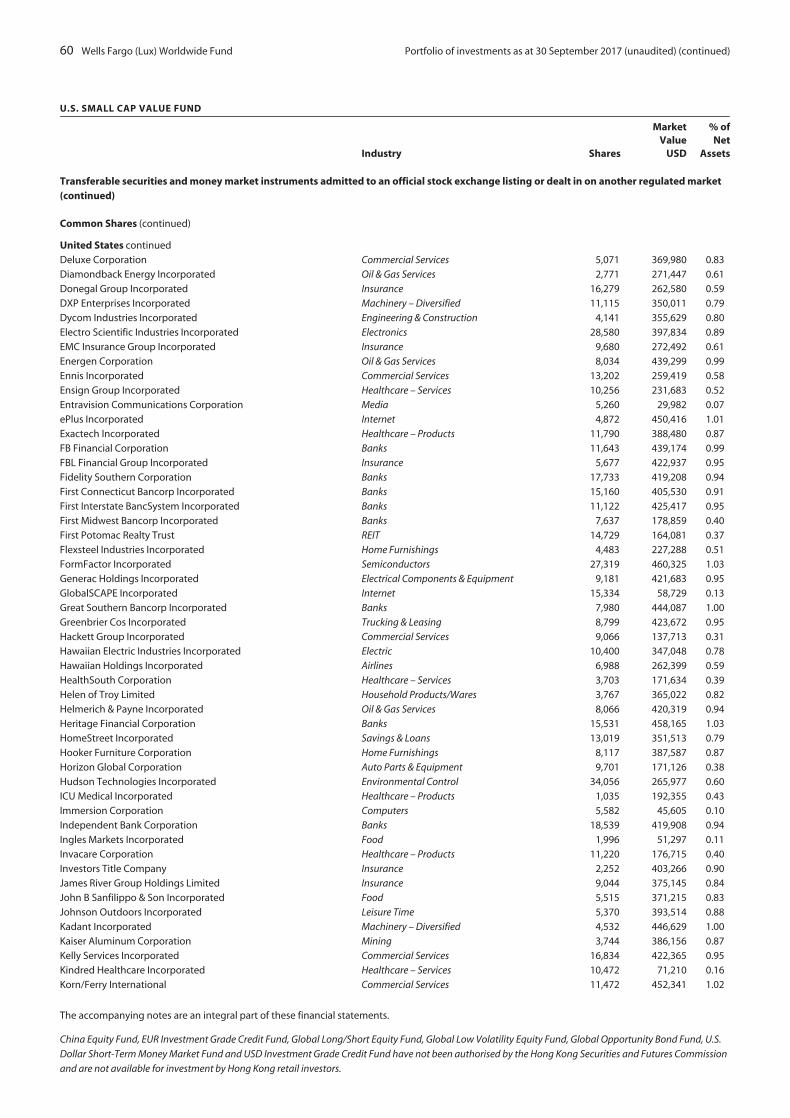
60 Wells Fargo (Lux) Worldwide Fund Portfolio of investments as at 30 September 2017 (unaudited) (continued)
U.S. SMALL CAP VALUE FUND
Industry Shares
MarketValue
USD
% ofNet
Assets
Transferable securities and money market instruments admitted to an official stock exchange listing or dealt in on another regulated market(continued)
Common Shares (continued)
United States continued
Deluxe Corporation Commercial Services 5,071 369,980 0.83
Diamondback Energy Incorporated Oil & Gas Services 2,771 271,447 0.61
Donegal Group Incorporated Insurance 16,279 262,580 0.59
DXP Enterprises Incorporated Machinery – Diversified 11,115 350,011 0.79
Dycom Industries Incorporated Engineering & Construction 4,141 355,629 0.80
Electro Scientific Industries Incorporated Electronics 28,580 397,834 0.89
EMC Insurance Group Incorporated Insurance 9,680 272,492 0.61
Energen Corporation Oil & Gas Services 8,034 439,299 0.99
Ennis Incorporated Commercial Services 13,202 259,419 0.58
Ensign Group Incorporated Healthcare – Services 10,256 231,683 0.52
Entravision Communications Corporation Media 5,260 29,982 0.07
ePlus Incorporated Internet 4,872 450,416 1.01
Exactech Incorporated Healthcare – Products 11,790 388,480 0.87
FB Financial Corporation Banks 11,643 439,174 0.99
FBL Financial Group Incorporated Insurance 5,677 422,937 0.95
Fidelity Southern Corporation Banks 17,733 419,208 0.94
First Connecticut Bancorp Incorporated Banks 15,160 405,530 0.91
First Interstate BancSystem Incorporated Banks 11,122 425,417 0.95
First Midwest Bancorp Incorporated Banks 7,637 178,859 0.40
First Potomac Realty Trust REIT 14,729 164,081 0.37
Flexsteel Industries Incorporated Home Furnishings 4,483 227,288 0.51
FormFactor Incorporated Semiconductors 27,319 460,325 1.03
Generac Holdings Incorporated Electrical Components & Equipment 9,181 421,683 0.95
GlobalSCAPE Incorporated Internet 15,334 58,729 0.13
Great Southern Bancorp Incorporated Banks 7,980 444,087 1.00
Greenbrier Cos Incorporated Trucking & Leasing 8,799 423,672 0.95
Hackett Group Incorporated Commercial Services 9,066 137,713 0.31
Hawaiian Electric Industries Incorporated Electric 10,400 347,048 0.78
Hawaiian Holdings Incorporated Airlines 6,988 262,399 0.59
HealthSouth Corporation Healthcare – Services 3,703 171,634 0.39
Helen of Troy Limited Household Products/Wares 3,767 365,022 0.82
Helmerich & Payne Incorporated Oil & Gas Services 8,066 420,319 0.94
Heritage Financial Corporation Banks 15,531 458,165 1.03
HomeStreet Incorporated Savings & Loans 13,019 351,513 0.79
Hooker Furniture Corporation Home Furnishings 8,117 387,587 0.87
Horizon Global Corporation Auto Parts & Equipment 9,701 171,126 0.38
Hudson Technologies Incorporated Environmental Control 34,056 265,977 0.60
ICU Medical Incorporated Healthcare – Products 1,035 192,355 0.43
Immersion Corporation Computers 5,582 45,605 0.10
Independent Bank Corporation Banks 18,539 419,908 0.94
Ingles Markets Incorporated Food 1,996 51,297 0.11
Invacare Corporation Healthcare – Products 11,220 176,715 0.40
Investors Title Company Insurance 2,252 403,266 0.90
James River Group Holdings Limited Insurance 9,044 375,145 0.84
John B Sanfilippo & Son Incorporated Food 5,515 371,215 0.83
Johnson Outdoors Incorporated Leisure Time 5,370 393,514 0.88
Kadant Incorporated Machinery – Diversified 4,532 446,629 1.00
Kaiser Aluminum Corporation Mining 3,744 386,156 0.87
Kelly Services Incorporated Commercial Services 16,834 422,365 0.95
Kindred Healthcare Incorporated Healthcare – Services 10,472 71,210 0.16
Korn/Ferry International Commercial Services 11,472 452,341 1.02
The accompanying notes are an integral part of these financial statements.
China Equity Fund, EUR Investment Grade Credit Fund, Global Long/Short Equity Fund, Global Low Volatility Equity Fund, Global Opportunity Bond Fund, U.S.
Dollar Short-Term Money Market Fund and USD Investment Grade Credit Fund have not been authorised by the Hong Kong Securities and Futures Commission
and are not available for investment by Hong Kong retail investors.

Portfolio of investments as at 30 September 2017 (unaudited) (continued) Wells Fargo (Lux) Worldwide Fund 61
U.S. SMALL CAP VALUE FUND
Industry Shares
MarketValue
USD
% ofNet
Assets
Transferable securities and money market instruments admitted to an official stock exchange listing or dealt in on another regulated market(continued)
Common Shares (continued)
United States continuedLakeland Industries Incorporated Apparel 14,216 200,446 0.45Laredo Petroleum Incorporated Oil & Gas Services 33,563 433,970 0.97LHC Group Incorporated Healthcare – Services 5,193 368,288 0.83Limbach Holdings Incorporated Engineering & Construction 3,798 50,286 0.11Malibu Boats Incorporated Leisure Time 13,728 434,354 0.97Marcus & Millichap Incorporated Real Estate 3,688 99,539 0.22Methode Electronics Incorporated Electronics 9,178 388,688 0.87Michaels Cos Incorporated Retail 14,533 312,024 0.70Midland States Bancorp Incorporated Banks 11,948 378,513 0.85Miller Industries Incorporated Auto Parts & Equipment 13,394 374,362 0.84Molina Healthcare Incorporated Healthcare – Services 1,378 94,751 0.21Monmouth Real Estate Investment Corporation REIT 23,939 387,572 0.87Mueller Industries Incorporated Metal Fabricate/Hardware 7,212 252,059 0.57Multi-Color Corporation Packaging & Containers 4,570 374,512 0.84MYR Group Incorporated Engineering & Construction 11,041 321,735 0.72Napco Security Technologies Incorporated Electronics 28,800 279,360 0.63National Storage Affiliates Trust REIT 16,819 407,693 0.91Nautilus Incorporated Leisure Time 7,478 126,378 0.28NCI Building Systems Incorporated Building Materials 19,915 310,674 0.70Newpark Resources Incorporated Oil & Gas Services 46,387 463,870 1.04OceanFirst Financial Corporation Savings & Loans 14,722 404,708 0.91Omega Protein Corporation Pharmaceuticals 6,474 107,792 0.24One Liberty Properties Incorporated REIT 12,062 293,830 0.66Orrstown Financial Services Incorporated Banks 13,156 327,584 0.74Owens & Minor Incorporated Pharmaceuticals 5,063 147,840 0.33Owens-Illinois Incorporated Packaging & Containers 17,967 452,050 1.01Patrick Industries Incorporated Building Materials 5,149 433,031 0.97Potlatch Corporation REIT 4,320 220,320 0.49QTS Realty Trust Incorporated REIT 3,904 204,413 0.46Revolution Lighting Technologies Incorporated Electrical Components & Equipment 9,953 64,695 0.14Rocky Brands Incorporated Apparel 4,650 62,310 0.14Rudolph Technologies Incorporated Semiconductors 16,546 435,160 0.98Schnitzer Steel Industries Incorporated Iron/Steel 14,178 399,111 0.90Seneca Foods Corporation Food 2,371 81,800 0.18Signet Jewelers Limited Retail 2,404 159,986 0.36Skechers USA Incorporated Apparel 9,599 240,839 0.54SpartanNash Company Food 5,793 152,761 0.34Standex International Corporation Miscellaneous Manufacturers 2,807 298,103 0.67State Auto Financial Corporation Insurance 9,810 257,316 0.58Steelcase Incorporated Office Furnishings 12,021 185,123 0.42Sterling Construction Company Incorporated Engineering & Construction 20,737 315,825 0.71Super Micro Computer Incorporated Computers 5,759 127,274 0.29TCF Financial Corporation Banks 26,491 451,407 1.01Terreno Realty Corporation REIT 2,288 82,780 0.19Townsquare Media Incorporated Media 4,285 42,850 0.10Trecora Resources Oil & Gas Services 3,219 42,813 0.10TreeHouse Foods Incorporated Food 2,604 176,369 0.40Tutor Perini Corporation Engineering & Construction 13,212 375,221 0.84Union Bankshares Corporation Banks 12,561 443,403 1.00United States Steel Corporation Iron/Steel 11,078 284,261 0.64Univest Corporation of Pennsylvania Banks 13,968 446,976 1.00
The accompanying notes are an integral part of these financial statements.
China Equity Fund, EUR Investment Grade Credit Fund, Global Long/Short Equity Fund, Global Low Volatility Equity Fund, Global Opportunity Bond Fund, U.S.
Dollar Short-Term Money Market Fund and USD Investment Grade Credit Fund have not been authorised by the Hong Kong Securities and Futures Commission
and are not available for investment by Hong Kong retail investors.
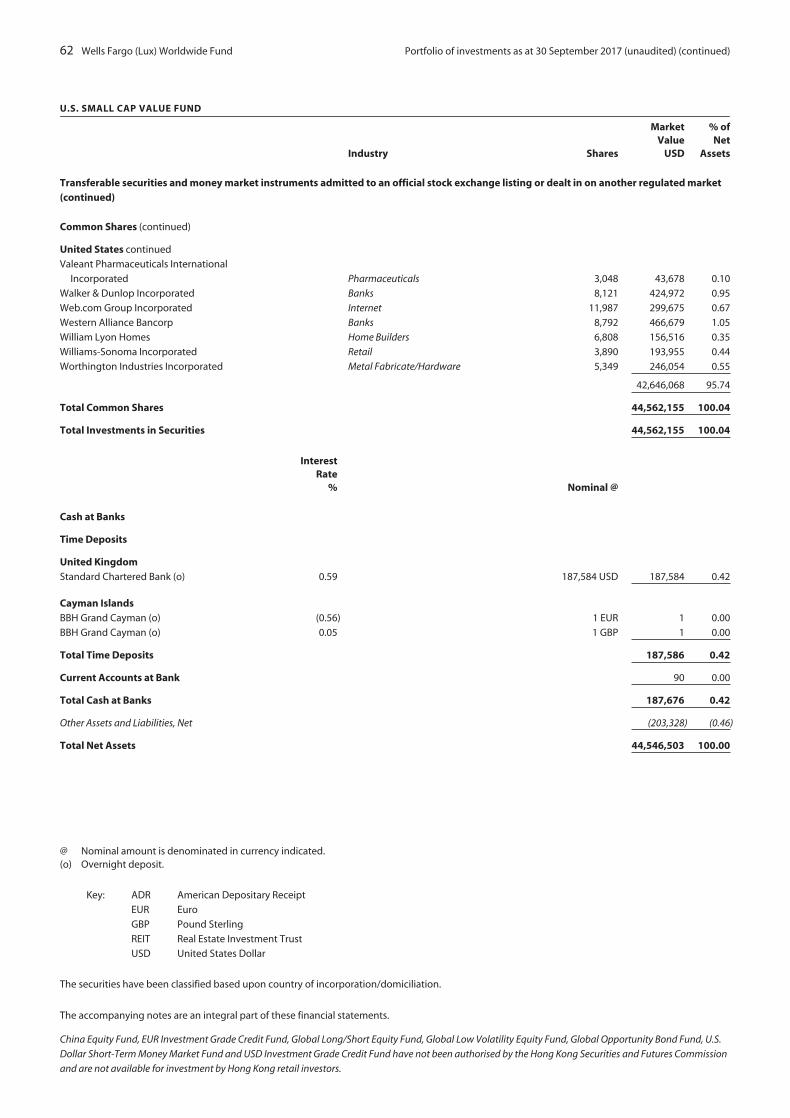
62 Wells Fargo (Lux) Worldwide Fund Portfolio of investments as at 30 September 2017 (unaudited) (continued)
U.S. SMALL CAP VALUE FUND
Industry Shares
MarketValue
USD
% ofNet
Assets
Transferable securities and money market instruments admitted to an official stock exchange listing or dealt in on another regulated market(continued)
Common Shares (continued)
United States continued
Valeant Pharmaceuticals International
Incorporated Pharmaceuticals 3,048 43,678 0.10
Walker & Dunlop Incorporated Banks 8,121 424,972 0.95
Web.com Group Incorporated Internet 11,987 299,675 0.67
Western Alliance Bancorp Banks 8,792 466,679 1.05
William Lyon Homes Home Builders 6,808 156,516 0.35
Williams-Sonoma Incorporated Retail 3,890 193,955 0.44
Worthington Industries Incorporated Metal Fabricate/Hardware 5,349 246,054 0.55
42,646,068 95.74
Total Common Shares 44,562,155 100.04
Total Investments in Securities 44,562,155 100.04
InterestRate
% Nominal @
Cash at Banks
Time Deposits
United KingdomStandard Chartered Bank (o) 0.59 187,584 USD 187,584 0.42
Cayman IslandsBBH Grand Cayman (o) (0.56) 1 EUR 1 0.00
BBH Grand Cayman (o) 0.05 1 GBP 1 0.00
Total Time Deposits 187,586 0.42
Current Accounts at Bank 90 0.00
Total Cash at Banks 187,676 0.42
Other Assets and Liabilities, Net (203,328) (0.46)
Total Net Assets 44,546,503 100.00
@ Nominal amount is denominated in currency indicated.(o) Overnight deposit.
Key: ADR American Depositary Receipt
EUR Euro
GBP Pound Sterling
REIT Real Estate Investment Trust
USD United States Dollar
The securities have been classified based upon country of incorporation/domiciliation.
The accompanying notes are an integral part of these financial statements.
China Equity Fund, EUR Investment Grade Credit Fund, Global Long/Short Equity Fund, Global Low Volatility Equity Fund, Global Opportunity Bond Fund, U.S.
Dollar Short-Term Money Market Fund and USD Investment Grade Credit Fund have not been authorised by the Hong Kong Securities and Futures Commission
and are not available for investment by Hong Kong retail investors.

Portfolio of investments as at 30 September 2017 (unaudited) Wells Fargo (Lux) Worldwide Fund 63
USD INVESTMENT GRADE CREDIT FUND
InterestRate
%Maturity
Date IndustryNominal
USD
MarketValue
USD
% ofNet
Assets
Transferable securities and money market instruments admitted to an official stock exchange listing or dealt in on another regulated market
Corporate Bonds and Notes
Bermuda
Allied World Assurance Company Holdings
Limited 4.35 29/10/2025 Insurance 1,175,000 1,193,504 0.66
Validus Holdings Limited 8.88 26/1/2040 Insurance 1,185,000 1,713,481 0.94
2,906,985 1.60
Canada
Husky Energy Incorporated 3.95 15/4/2022 Oil & Gas Services 1,300,000 1,356,978 0.75
Cayman Islands
XLIT Limited 5.50 31/3/2045 Insurance 1,650,000 1,734,305 0.95
France
BPCE SA 2.75 2/12/2021 Banks 1,070,000 1,081,544 0.59
BPCE SA 4.50 15/3/2025 Banks 1,100,000 1,141,380 0.63
Credit Agricole SA 2.38 1/7/2021 Banks 890,000 889,699 0.49
3,112,623 1.71
Guernsey
Credit Suisse Group Funding Guernsey Limited 3.75 26/3/2025 Banks 1,425,000 1,451,032 0.80
Japan
Mitsubishi UFJ Financial Group Incorporated 2.95 1/3/2021 Banks 720,000 731,805 0.40
Sumitomo Mitsui Financial Group Incorporated 2.85 11/1/2022 Banks 780,000 787,064 0.43
Sumitomo Mitsui Financial Group Incorporated 2.78 12/7/2022 Banks 860,000 862,129 0.48
2,380,998 1.31
Luxembourg
SES SA 3.60 4/4/2023 Telecommunications 875,000 884,975 0.49
Mexico
Mexico City Airport Trust 5.50 31/7/2047 Engineering & Construction 1,260,000 1,275,624 0.70
Netherlands
ING Groep NV 2.48 29/3/2022 Banks 1,230,000 1,251,898 0.69
Singapore
Flex Limited 5.00 15/2/2023 Electronics 900,000 978,196 0.54
Spain
Banco Santander SA 2.87 11/4/2022 Banks 1,800,000 1,857,083 1.02
Sweden
Svenska Handelsbanken AB 1.68 8/9/2020 Banks 1,400,000 1,402,534 0.77
Switzerland
UBS Group Funding Switzerland AG 2.53 23/5/2023 Diversified Financial Services 2,430,000 2,467,908 1.36
The accompanying notes are an integral part of these financial statements.
China Equity Fund, EUR Investment Grade Credit Fund, Global Long/Short Equity Fund, Global Low Volatility Equity Fund, Global Opportunity Bond Fund, U.S.
Dollar Short-Term Money Market Fund and USD Investment Grade Credit Fund have not been authorised by the Hong Kong Securities and Futures Commission
and are not available for investment by Hong Kong retail investors.

64 Wells Fargo (Lux) Worldwide Fund Portfolio of investments as at 30 September 2017 (unaudited) (continued)
USD INVESTMENT GRADE CREDIT FUND
InterestRate
%Maturity
Date IndustryNominal
USD
MarketValue
USD
% ofNet
Assets
Transferable securities and money market instruments admitted to an official stock exchange listing or dealt in on another regulated market(continued)
Corporate Bonds and Notes (continued)
United KingdomBP Capital Markets plc 2.75 10/5/2023 Oil & Gas Services 790,000 792,371 0.44
HSBC Holdings plc 4.30 8/3/2026 Banks 1,720,000 1,847,379 1.02
Invesco Finance plc 3.13 30/11/2022 Diversified Financial Services 500,000 510,838 0.28
Invesco Finance plc 3.75 15/1/2026 Diversified Financial Services 750,000 780,900 0.43
Reckitt Benckiser Treasury Services plc 2.75 26/6/2024 Household Products/Wares 1,930,000 1,915,269 1.05
Royal Bank of Scotland Group plc 3.88 12/9/2023 Banks 2,035,000 2,081,639 1.15
Santander UK Group Holdings plc 3.57 10/1/2023 Banks 1,395,000 1,426,651 0.78
9,355,047 5.15
United StatesAir Lease Corporation 3.00 15/9/2023 Diversified Financial Services 860,000 857,602 0.47
Amazon.com Incorporated 4.25 22/8/2057 Internet 1,720,000 1,763,585 0.97
American Airlines Class AA Pass-Through Trust 3.60 22/9/2027 Airlines 1,586,694 1,635,961 0.90
American Express Credit Corporation 3.30 3/5/2027 Diversified Financial Services 2,310,000 2,330,839 1.28
American Tower Corporation 2.25 15/1/2022 REIT 1,650,000 1,622,789 0.89
Analog Devices Incorporated 3.50 5/12/2026 Semiconductors 900,000 908,518 0.50
Analog Devices Incorporated 4.50 5/12/2036 Semiconductors 1,285,000 1,338,221 0.74
Anheuser-Busch InBev Finance Incorporated 3.65 1/2/2026 Beverages 3,010,000 3,112,717 1.71
Apple Incorporated 3.20 11/5/2027 Computers 1,770,000 1,801,283 0.99
Apple Incorporated 4.25 9/2/2047 Computers 1,560,000 1,676,892 0.92
Arrow Electronics Incorporated 3.50 1/4/2022 Electronics 500,000 509,609 0.28
Arrow Electronics Incorporated 4.50 1/3/2023 Electronics 500,000 533,620 0.29
AT&T Incorporated 3.40 15/5/2025 Telecommunications 880,000 865,920 0.48
AT&T Incorporated 3.90 14/8/2027 Telecommunications 920,000 921,039 0.51
AT&T Incorporated 4.75 15/5/2046 Telecommunications 1,525,000 1,468,293 0.81
AT&T Incorporated 5.15 14/2/2050 Telecommunications 2,090,000 2,105,994 1.16
Autodesk Incorporated 4.38 15/6/2025 Software 1,345,000 1,426,945 0.79
Aviation Capital Group Corporation 2.88 20/1/2022 Trucking & Leasing 2,350,000 2,349,760 1.29
Bank of America Corporation 2.63 19/4/2021 Banks 1,490,000 1,501,174 0.83
Bank of America Corporation 3.50 19/4/2026 Banks 1,730,000 1,758,492 0.97
Bank of America Corporation ± 3.82 20/1/2028 Banks 3,485,000 3,577,419 1.97
BAT Capital Corporation 4.54 15/8/2047 Agriculture 2,040,000 2,097,775 1.15
BB&T Corporation 2.63 29/6/2020 Banks 830,000 843,382 0.46
Branch Banking & Trust Company 1.75 15/1/2020 Banks 2,000,000 2,006,876 1.10
Brighthouse Financial Incorporated 4.70 22/6/2047 Insurance 1,770,000 1,728,050 0.95
Cardinal Health Incorporated 3.41 15/6/2027 Pharmaceuticals 640,000 641,912 0.35
CBOE Holdings Incorporated 3.65 12/1/2027 Diversified Financial Services 1,720,000 1,760,524 0.97
CBS Corporation 2.90 15/1/2027 Media 750,000 708,851 0.39
Charter Communications Operating LLC 4.91 23/7/2025 Media 1,640,000 1,752,591 0.96
Chubb Corporation ± 3.55 15/4/2037 Insurance 1,000,000 994,500 0.55
Chubb INA Holdings Incorporated 3.35 3/5/2026 Insurance 1,000,000 1,024,825 0.56
Citigroup Incorporated 2.65 26/10/2020 Banks 735,000 742,406 0.41
Citigroup Incorporated 2.41 17/5/2024 Banks 1,500,000 1,503,320 0.83
Citigroup Incorporated 3.40 1/5/2026 Banks 1,700,000 1,702,996 0.94
Comcast Corporation 3.38 15/8/2025 Media 785,000 809,687 0.45
Continental Airlines Class A Pass Through Trust 4.00 29/10/2024 Airlines 205,579 215,344 0.12
Cox Communications Incorporated 4.60 15/8/2047 Media 1,050,000 1,043,744 0.57
Crown Castle International Corporation 3.70 15/6/2026 REIT 1,050,000 1,057,161 0.58
Cytec Industries Incorporated 3.95 1/5/2025 Chemicals 1,495,000 1,534,985 0.85
Dell International LLC 4.42 15/6/2021 Computers 1,550,000 1,627,198 0.90
Discovery Communications LLC 2.95 20/3/2023 Media 650,000 650,509 0.36
The accompanying notes are an integral part of these financial statements.
China Equity Fund, EUR Investment Grade Credit Fund, Global Long/Short Equity Fund, Global Low Volatility Equity Fund, Global Opportunity Bond Fund, U.S.
Dollar Short-Term Money Market Fund and USD Investment Grade Credit Fund have not been authorised by the Hong Kong Securities and Futures Commission
and are not available for investment by Hong Kong retail investors.
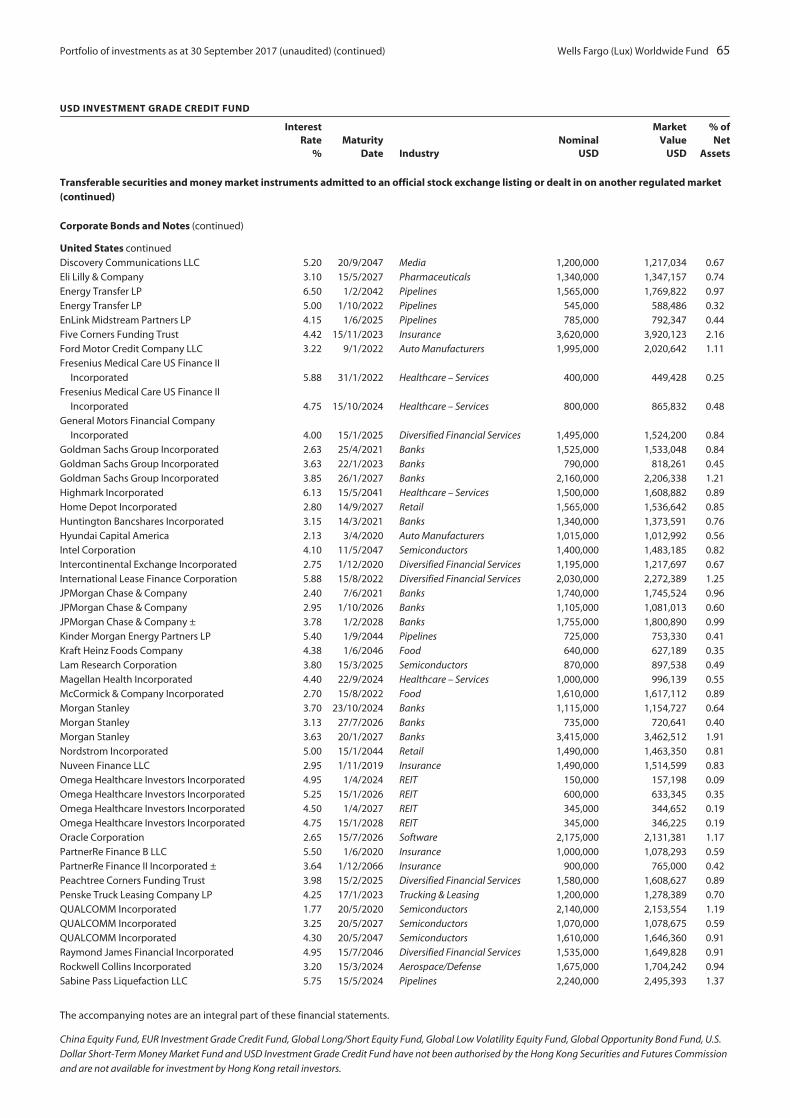
Portfolio of investments as at 30 September 2017 (unaudited) (continued) Wells Fargo (Lux) Worldwide Fund 65
USD INVESTMENT GRADE CREDIT FUND
InterestRate
%Maturity
Date IndustryNominal
USD
MarketValue
USD
% ofNet
Assets
Transferable securities and money market instruments admitted to an official stock exchange listing or dealt in on another regulated market(continued)
Corporate Bonds and Notes (continued)
United States continuedDiscovery Communications LLC 5.20 20/9/2047 Media 1,200,000 1,217,034 0.67Eli Lilly & Company 3.10 15/5/2027 Pharmaceuticals 1,340,000 1,347,157 0.74Energy Transfer LP 6.50 1/2/2042 Pipelines 1,565,000 1,769,822 0.97Energy Transfer LP 5.00 1/10/2022 Pipelines 545,000 588,486 0.32EnLink Midstream Partners LP 4.15 1/6/2025 Pipelines 785,000 792,347 0.44Five Corners Funding Trust 4.42 15/11/2023 Insurance 3,620,000 3,920,123 2.16Ford Motor Credit Company LLC 3.22 9/1/2022 Auto Manufacturers 1,995,000 2,020,642 1.11Fresenius Medical Care US Finance II
Incorporated 5.88 31/1/2022 Healthcare – Services 400,000 449,428 0.25Fresenius Medical Care US Finance II
Incorporated 4.75 15/10/2024 Healthcare – Services 800,000 865,832 0.48General Motors Financial Company
Incorporated 4.00 15/1/2025 Diversified Financial Services 1,495,000 1,524,200 0.84Goldman Sachs Group Incorporated 2.63 25/4/2021 Banks 1,525,000 1,533,048 0.84Goldman Sachs Group Incorporated 3.63 22/1/2023 Banks 790,000 818,261 0.45Goldman Sachs Group Incorporated 3.85 26/1/2027 Banks 2,160,000 2,206,338 1.21Highmark Incorporated 6.13 15/5/2041 Healthcare – Services 1,500,000 1,608,882 0.89Home Depot Incorporated 2.80 14/9/2027 Retail 1,565,000 1,536,642 0.85Huntington Bancshares Incorporated 3.15 14/3/2021 Banks 1,340,000 1,373,591 0.76Hyundai Capital America 2.13 3/4/2020 Auto Manufacturers 1,015,000 1,012,992 0.56Intel Corporation 4.10 11/5/2047 Semiconductors 1,400,000 1,483,185 0.82Intercontinental Exchange Incorporated 2.75 1/12/2020 Diversified Financial Services 1,195,000 1,217,697 0.67International Lease Finance Corporation 5.88 15/8/2022 Diversified Financial Services 2,030,000 2,272,389 1.25JPMorgan Chase & Company 2.40 7/6/2021 Banks 1,740,000 1,745,524 0.96JPMorgan Chase & Company 2.95 1/10/2026 Banks 1,105,000 1,081,013 0.60JPMorgan Chase & Company ± 3.78 1/2/2028 Banks 1,755,000 1,800,890 0.99Kinder Morgan Energy Partners LP 5.40 1/9/2044 Pipelines 725,000 753,330 0.41Kraft Heinz Foods Company 4.38 1/6/2046 Food 640,000 627,189 0.35Lam Research Corporation 3.80 15/3/2025 Semiconductors 870,000 897,538 0.49Magellan Health Incorporated 4.40 22/9/2024 Healthcare – Services 1,000,000 996,139 0.55McCormick & Company Incorporated 2.70 15/8/2022 Food 1,610,000 1,617,112 0.89Morgan Stanley 3.70 23/10/2024 Banks 1,115,000 1,154,727 0.64Morgan Stanley 3.13 27/7/2026 Banks 735,000 720,641 0.40Morgan Stanley 3.63 20/1/2027 Banks 3,415,000 3,462,512 1.91Nordstrom Incorporated 5.00 15/1/2044 Retail 1,490,000 1,463,350 0.81Nuveen Finance LLC 2.95 1/11/2019 Insurance 1,490,000 1,514,599 0.83Omega Healthcare Investors Incorporated 4.95 1/4/2024 REIT 150,000 157,198 0.09Omega Healthcare Investors Incorporated 5.25 15/1/2026 REIT 600,000 633,345 0.35Omega Healthcare Investors Incorporated 4.50 1/4/2027 REIT 345,000 344,652 0.19Omega Healthcare Investors Incorporated 4.75 15/1/2028 REIT 345,000 346,225 0.19Oracle Corporation 2.65 15/7/2026 Software 2,175,000 2,131,381 1.17PartnerRe Finance B LLC 5.50 1/6/2020 Insurance 1,000,000 1,078,293 0.59PartnerRe Finance II Incorporated ± 3.64 1/12/2066 Insurance 900,000 765,000 0.42Peachtree Corners Funding Trust 3.98 15/2/2025 Diversified Financial Services 1,580,000 1,608,627 0.89Penske Truck Leasing Company LP 4.25 17/1/2023 Trucking & Leasing 1,200,000 1,278,389 0.70QUALCOMM Incorporated 1.77 20/5/2020 Semiconductors 2,140,000 2,153,554 1.19QUALCOMM Incorporated 3.25 20/5/2027 Semiconductors 1,070,000 1,078,675 0.59QUALCOMM Incorporated 4.30 20/5/2047 Semiconductors 1,610,000 1,646,360 0.91Raymond James Financial Incorporated 4.95 15/7/2046 Diversified Financial Services 1,535,000 1,649,828 0.91Rockwell Collins Incorporated 3.20 15/3/2024 Aerospace/Defense 1,675,000 1,704,242 0.94Sabine Pass Liquefaction LLC 5.75 15/5/2024 Pipelines 2,240,000 2,495,393 1.37
The accompanying notes are an integral part of these financial statements.
China Equity Fund, EUR Investment Grade Credit Fund, Global Long/Short Equity Fund, Global Low Volatility Equity Fund, Global Opportunity Bond Fund, U.S.
Dollar Short-Term Money Market Fund and USD Investment Grade Credit Fund have not been authorised by the Hong Kong Securities and Futures Commission
and are not available for investment by Hong Kong retail investors.
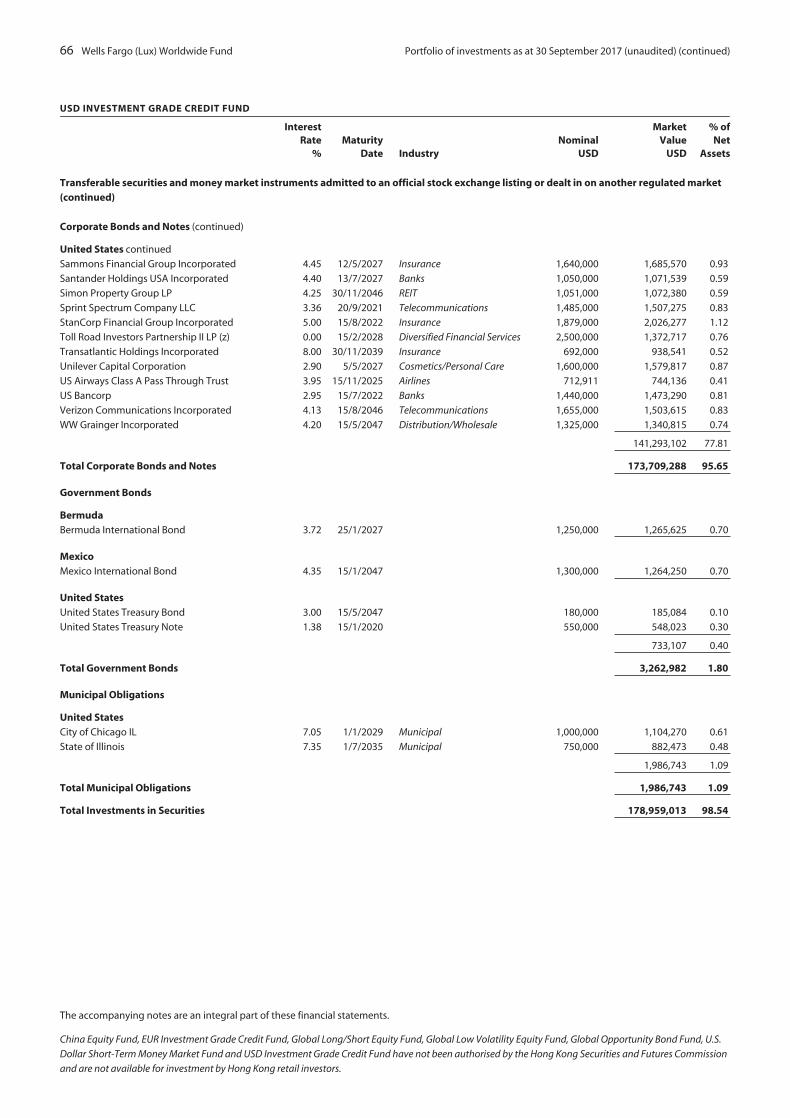
66 Wells Fargo (Lux) Worldwide Fund Portfolio of investments as at 30 September 2017 (unaudited) (continued)
USD INVESTMENT GRADE CREDIT FUND
InterestRate
%Maturity
Date IndustryNominal
USD
MarketValue
USD
% ofNet
Assets
Transferable securities and money market instruments admitted to an official stock exchange listing or dealt in on another regulated market(continued)
Corporate Bonds and Notes (continued)
United States continued
Sammons Financial Group Incorporated 4.45 12/5/2027 Insurance 1,640,000 1,685,570 0.93
Santander Holdings USA Incorporated 4.40 13/7/2027 Banks 1,050,000 1,071,539 0.59
Simon Property Group LP 4.25 30/11/2046 REIT 1,051,000 1,072,380 0.59
Sprint Spectrum Company LLC 3.36 20/9/2021 Telecommunications 1,485,000 1,507,275 0.83
StanCorp Financial Group Incorporated 5.00 15/8/2022 Insurance 1,879,000 2,026,277 1.12
Toll Road Investors Partnership II LP (z) 0.00 15/2/2028 Diversified Financial Services 2,500,000 1,372,717 0.76
Transatlantic Holdings Incorporated 8.00 30/11/2039 Insurance 692,000 938,541 0.52
Unilever Capital Corporation 2.90 5/5/2027 Cosmetics/Personal Care 1,600,000 1,579,817 0.87
US Airways Class A Pass Through Trust 3.95 15/11/2025 Airlines 712,911 744,136 0.41
US Bancorp 2.95 15/7/2022 Banks 1,440,000 1,473,290 0.81
Verizon Communications Incorporated 4.13 15/8/2046 Telecommunications 1,655,000 1,503,615 0.83
WW Grainger Incorporated 4.20 15/5/2047 Distribution/Wholesale 1,325,000 1,340,815 0.74
141,293,102 77.81
Total Corporate Bonds and Notes 173,709,288 95.65
Government Bonds
BermudaBermuda International Bond 3.72 25/1/2027 1,250,000 1,265,625 0.70
MexicoMexico International Bond 4.35 15/1/2047 1,300,000 1,264,250 0.70
United StatesUnited States Treasury Bond 3.00 15/5/2047 180,000 185,084 0.10
United States Treasury Note 1.38 15/1/2020 550,000 548,023 0.30
733,107 0.40
Total Government Bonds 3,262,982 1.80
Municipal Obligations
United StatesCity of Chicago IL 7.05 1/1/2029 Municipal 1,000,000 1,104,270 0.61
State of Illinois 7.35 1/7/2035 Municipal 750,000 882,473 0.48
1,986,743 1.09
Total Municipal Obligations 1,986,743 1.09
Total Investments in Securities 178,959,013 98.54
The accompanying notes are an integral part of these financial statements.
China Equity Fund, EUR Investment Grade Credit Fund, Global Long/Short Equity Fund, Global Low Volatility Equity Fund, Global Opportunity Bond Fund, U.S.
Dollar Short-Term Money Market Fund and USD Investment Grade Credit Fund have not been authorised by the Hong Kong Securities and Futures Commission
and are not available for investment by Hong Kong retail investors.
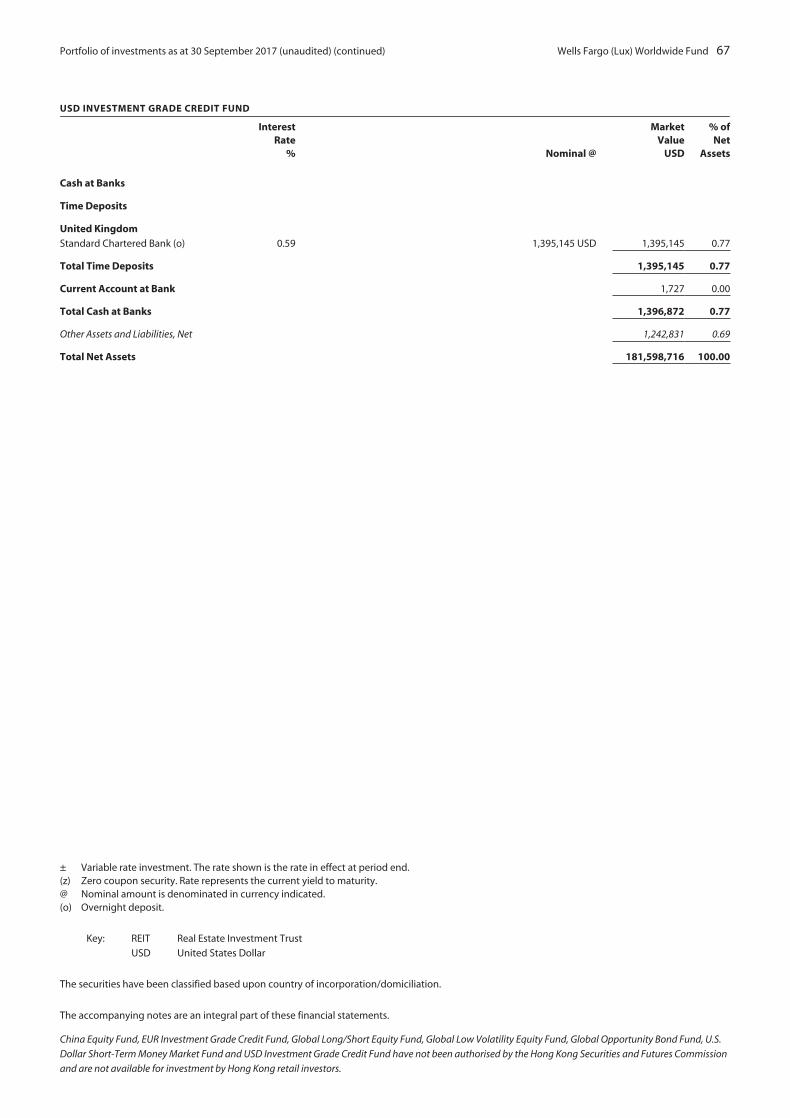
Portfolio of investments as at 30 September 2017 (unaudited) (continued) Wells Fargo (Lux) Worldwide Fund 67
USD INVESTMENT GRADE CREDIT FUND
InterestRate
% Nominal @
MarketValue
USD
% ofNet
Assets
Cash at Banks
Time Deposits
United KingdomStandard Chartered Bank (o) 0.59 1,395,145 USD 1,395,145 0.77
Total Time Deposits 1,395,145 0.77
Current Account at Bank 1,727 0.00
Total Cash at Banks 1,396,872 0.77
Other Assets and Liabilities, Net 1,242,831 0.69
Total Net Assets 181,598,716 100.00
± Variable rate investment. The rate shown is the rate in effect at period end.(z) Zero coupon security. Rate represents the current yield to maturity.@ Nominal amount is denominated in currency indicated.(o) Overnight deposit.
Key: REIT Real Estate Investment Trust
USD United States Dollar
The securities have been classified based upon country of incorporation/domiciliation.
The accompanying notes are an integral part of these financial statements.
China Equity Fund, EUR Investment Grade Credit Fund, Global Long/Short Equity Fund, Global Low Volatility Equity Fund, Global Opportunity Bond Fund, U.S.
Dollar Short-Term Money Market Fund and USD Investment Grade Credit Fund have not been authorised by the Hong Kong Securities and Futures Commission
and are not available for investment by Hong Kong retail investors.
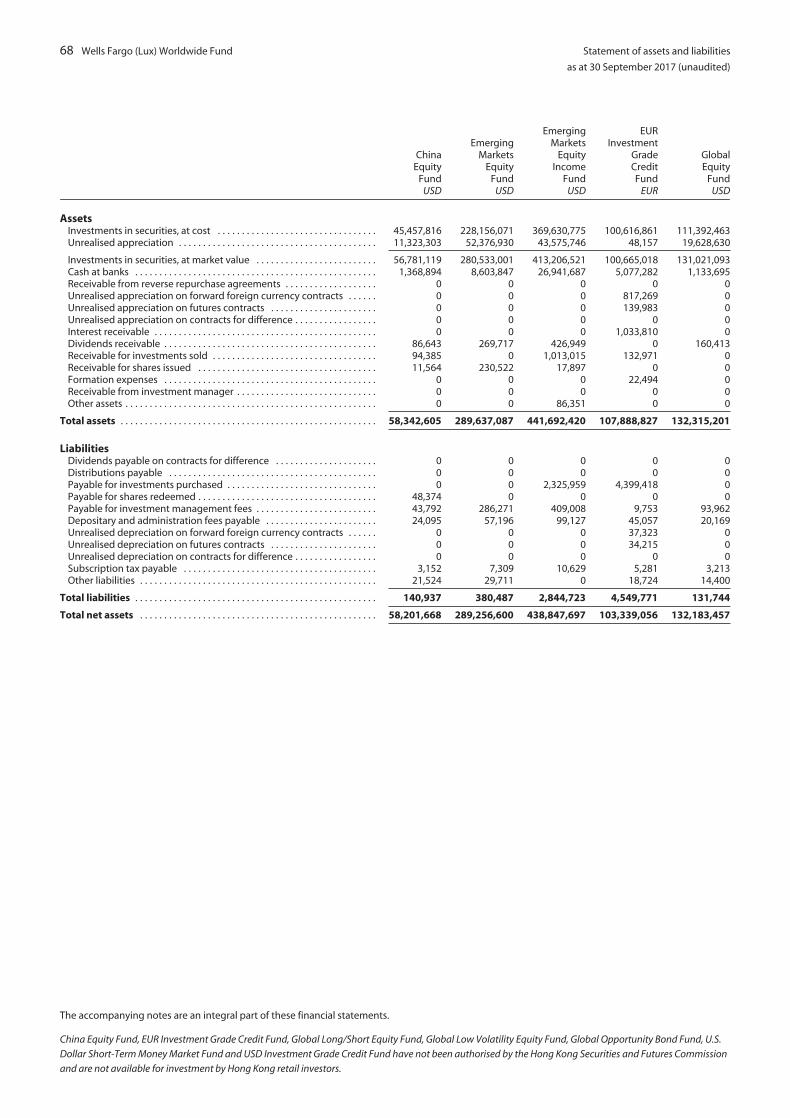
68 Wells Fargo (Lux) Worldwide Fund Statement of assets and liabilities
as at 30 September 2017 (unaudited)
ChinaEquity
FundUSD
EmergingMarkets
EquityFund
USD
EmergingMarkets
EquityIncome
FundUSD
EURInvestment
GradeCreditFund
EUR
GlobalEquity
FundUSD
AssetsInvestments in securities, at cost . . . . . . . . . . . . . . . . . . . . . . . . . . . . . . . . . 45,457,816 228,156,071 369,630,775 100,616,861 111,392,463Unrealised appreciation . . . . . . . . . . . . . . . . . . . . . . . . . . . . . . . . . . . . . . . . . 11,323,303 52,376,930 43,575,746 48,157 19,628,630
Investments in securities, at market value . . . . . . . . . . . . . . . . . . . . . . . . . 56,781,119 280,533,001 413,206,521 100,665,018 131,021,093Cash at banks . . . . . . . . . . . . . . . . . . . . . . . . . . . . . . . . . . . . . . . . . . . . . . . . . . 1,368,894 8,603,847 26,941,687 5,077,282 1,133,695Receivable from reverse repurchase agreements . . . . . . . . . . . . . . . . . . . 0 0 0 0 0Unrealised appreciation on forward foreign currency contracts . . . . . . 0 0 0 817,269 0Unrealised appreciation on futures contracts . . . . . . . . . . . . . . . . . . . . . . 0 0 0 139,983 0Unrealised appreciation on contracts for difference . . . . . . . . . . . . . . . . . 0 0 0 0 0Interest receivable . . . . . . . . . . . . . . . . . . . . . . . . . . . . . . . . . . . . . . . . . . . . . . 0 0 0 1,033,810 0Dividends receivable . . . . . . . . . . . . . . . . . . . . . . . . . . . . . . . . . . . . . . . . . . . . 86,643 269,717 426,949 0 160,413Receivable for investments sold . . . . . . . . . . . . . . . . . . . . . . . . . . . . . . . . . . 94,385 0 1,013,015 132,971 0Receivable for shares issued . . . . . . . . . . . . . . . . . . . . . . . . . . . . . . . . . . . . . 11,564 230,522 17,897 0 0Formation expenses . . . . . . . . . . . . . . . . . . . . . . . . . . . . . . . . . . . . . . . . . . . . 0 0 0 22,494 0Receivable from investment manager . . . . . . . . . . . . . . . . . . . . . . . . . . . . . 0 0 0 0 0Other assets . . . . . . . . . . . . . . . . . . . . . . . . . . . . . . . . . . . . . . . . . . . . . . . . . . . . 0 0 86,351 0 0
Total assets . . . . . . . . . . . . . . . . . . . . . . . . . . . . . . . . . . . . . . . . . . . . . . . . . . . . . 58,342,605 289,637,087 441,692,420 107,888,827 132,315,201
LiabilitiesDividends payable on contracts for difference . . . . . . . . . . . . . . . . . . . . . 0 0 0 0 0Distributions payable . . . . . . . . . . . . . . . . . . . . . . . . . . . . . . . . . . . . . . . . . . . 0 0 0 0 0Payable for investments purchased . . . . . . . . . . . . . . . . . . . . . . . . . . . . . . . 0 0 2,325,959 4,399,418 0Payable for shares redeemed . . . . . . . . . . . . . . . . . . . . . . . . . . . . . . . . . . . . . 48,374 0 0 0 0Payable for investment management fees . . . . . . . . . . . . . . . . . . . . . . . . . 43,792 286,271 409,008 9,753 93,962Depositary and administration fees payable . . . . . . . . . . . . . . . . . . . . . . . 24,095 57,196 99,127 45,057 20,169Unrealised depreciation on forward foreign currency contracts . . . . . . 0 0 0 37,323 0Unrealised depreciation on futures contracts . . . . . . . . . . . . . . . . . . . . . . 0 0 0 34,215 0Unrealised depreciation on contracts for difference . . . . . . . . . . . . . . . . . 0 0 0 0 0Subscription tax payable . . . . . . . . . . . . . . . . . . . . . . . . . . . . . . . . . . . . . . . . 3,152 7,309 10,629 5,281 3,213Other liabilities . . . . . . . . . . . . . . . . . . . . . . . . . . . . . . . . . . . . . . . . . . . . . . . . . 21,524 29,711 0 18,724 14,400
Total liabilities . . . . . . . . . . . . . . . . . . . . . . . . . . . . . . . . . . . . . . . . . . . . . . . . . . 140,937 380,487 2,844,723 4,549,771 131,744
Total net assets . . . . . . . . . . . . . . . . . . . . . . . . . . . . . . . . . . . . . . . . . . . . . . . . . 58,201,668 289,256,600 438,847,697 103,339,056 132,183,457
The accompanying notes are an integral part of these financial statements.
China Equity Fund, EUR Investment Grade Credit Fund, Global Long/Short Equity Fund, Global Low Volatility Equity Fund, Global Opportunity Bond Fund, U.S.
Dollar Short-Term Money Market Fund and USD Investment Grade Credit Fund have not been authorised by the Hong Kong Securities and Futures Commission
and are not available for investment by Hong Kong retail investors.

Statement of assets and liabilities
as at 30 September 2017 (unaudited)
Wells Fargo (Lux) Worldwide Fund 69
GlobalFocused
EquityFund
USD
GlobalLong/Short
EquityFund
USD
GlobalLow
VolatilityEquity
FundUSD
GlobalOpportunity
BondFund
USD
U.S.All Cap
GrowthFund
USD
U.S.DollarShort-Term
MoneyMarket
FundUSD
U.S.HighYieldBondFund
USD
U.S.Large
CapGrowth
FundUSD
10,616,640 70,673,430 148,305,552 18,289,914 488,440,523 834,023,842 217,769,377 74,313,4301,931,095 2,381,916 20,126,856 200,709 227,391,999 0 9,459,214 24,486,053
12,547,735 73,055,346 168,432,408 18,490,623 715,832,522 834,023,842 227,228,591 98,799,483868,027 2,680,558 1,229,661 464,258 5,263,625 121,173,545 12,246,968 1,640,793
0 0 0 0 0 95,000,000 0 00 0 0 67,172 0 0 0 00 0 0 0 0 0 0 00 218,113 0 0 0 0 0 00 0 0 187,530 0 350,356 3,795,058 0
23,993 218,954 668,912 0 77,632 0 0 9,8820 0 0 0 144,173 0 1,672,830 00 0 0 1,000 3,224,796 0 0 2,459
41,196 30,094 39,824 0 0 0 0 06,459 0 0 9,611 0 0 0 0
0 0 2,920 0 0 0 0 0
13,487,410 76,203,065 170,373,725 19,220,194 724,542,748 1,050,547,743 244,943,447 100,452,617
0 33,185 0 0 0 0 0 00 0 0 0 0 416,793 0 00 0 0 0 1,290,528 0 3,540,000 366,9280 0 0 0 1,317,232 0 54,541 6,1890 33,648 90,503 0 532,535 675,793 132,926 60,336
9,037 24,121 26,632 41,880 95,086 160,653 54,457 13,69039,509 0 0 61,016 0 0 9,301 0
0 0 0 0 0 0 0 00 259,477 0 0 0 0 0 0
323 1,903 4,951 3,671 55,238 26,611 5,888 2,62535,117 365,335 86,995 9,636 2,283 52,008 13,804 14,455
83,986 717,669 209,081 116,203 3,292,902 1,331,858 3,810,917 464,223
13,403,424 75,485,396 170,164,644 19,103,991 721,249,846 1,049,215,885 241,132,530 99,988,394
The accompanying notes are an integral part of these financial statements.
China Equity Fund, EUR Investment Grade Credit Fund, Global Long/Short Equity Fund, Global Low Volatility Equity Fund, Global Opportunity Bond Fund, U.S.
Dollar Short-Term Money Market Fund and USD Investment Grade Credit Fund have not been authorised by the Hong Kong Securities and Futures Commission
and are not available for investment by Hong Kong retail investors.
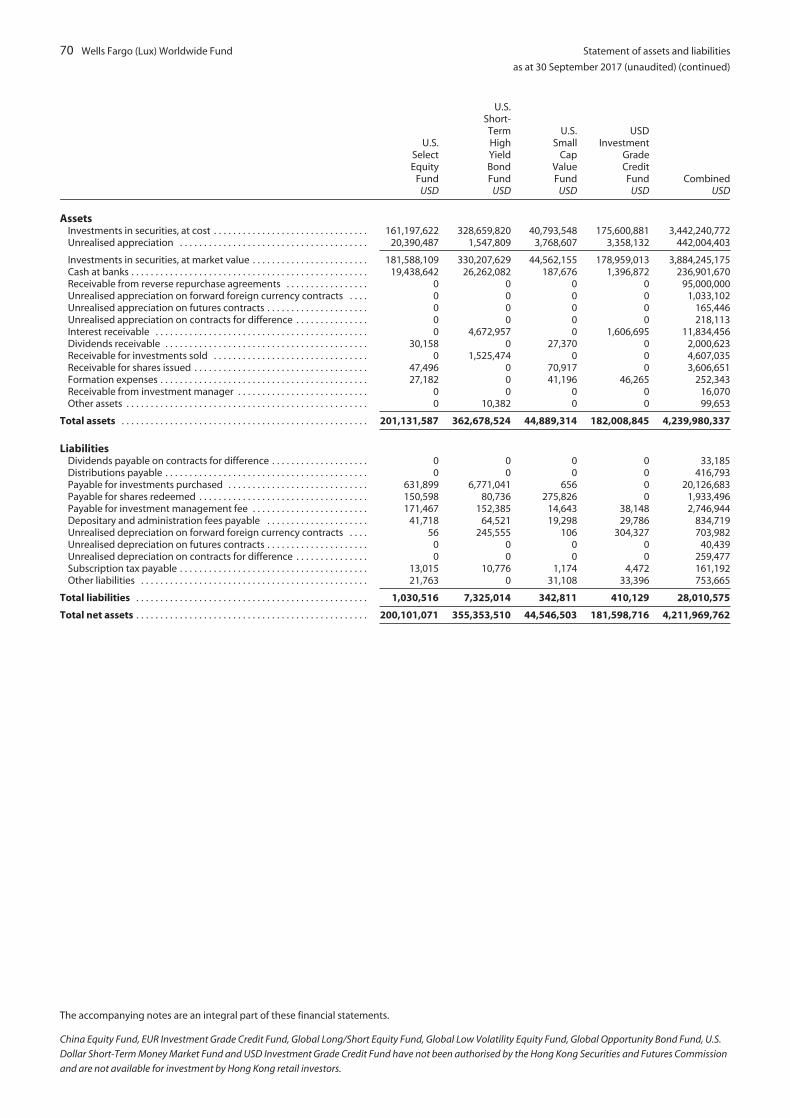
70 Wells Fargo (Lux) Worldwide Fund Statement of assets and liabilities
as at 30 September 2017 (unaudited) (continued)
U.S.SelectEquity
FundUSD
U.S.Short-TermHighYieldBondFund
USD
U.S.Small
CapValueFund
USD
USDInvestment
GradeCreditFund
USDCombined
USD
AssetsInvestments in securities, at cost . . . . . . . . . . . . . . . . . . . . . . . . . . . . . . . . 161,197,622 328,659,820 40,793,548 175,600,881 3,442,240,772Unrealised appreciation . . . . . . . . . . . . . . . . . . . . . . . . . . . . . . . . . . . . . . . 20,390,487 1,547,809 3,768,607 3,358,132 442,004,403
Investments in securities, at market value . . . . . . . . . . . . . . . . . . . . . . . . 181,588,109 330,207,629 44,562,155 178,959,013 3,884,245,175Cash at banks . . . . . . . . . . . . . . . . . . . . . . . . . . . . . . . . . . . . . . . . . . . . . . . . . 19,438,642 26,262,082 187,676 1,396,872 236,901,670Receivable from reverse repurchase agreements . . . . . . . . . . . . . . . . . 0 0 0 0 95,000,000Unrealised appreciation on forward foreign currency contracts . . . . 0 0 0 0 1,033,102Unrealised appreciation on futures contracts . . . . . . . . . . . . . . . . . . . . . 0 0 0 0 165,446Unrealised appreciation on contracts for difference . . . . . . . . . . . . . . . 0 0 0 0 218,113Interest receivable . . . . . . . . . . . . . . . . . . . . . . . . . . . . . . . . . . . . . . . . . . . . 0 4,672,957 0 1,606,695 11,834,456Dividends receivable . . . . . . . . . . . . . . . . . . . . . . . . . . . . . . . . . . . . . . . . . . 30,158 0 27,370 0 2,000,623Receivable for investments sold . . . . . . . . . . . . . . . . . . . . . . . . . . . . . . . . 0 1,525,474 0 0 4,607,035Receivable for shares issued . . . . . . . . . . . . . . . . . . . . . . . . . . . . . . . . . . . . 47,496 0 70,917 0 3,606,651Formation expenses . . . . . . . . . . . . . . . . . . . . . . . . . . . . . . . . . . . . . . . . . . . 27,182 0 41,196 46,265 252,343Receivable from investment manager . . . . . . . . . . . . . . . . . . . . . . . . . . . 0 0 0 0 16,070Other assets . . . . . . . . . . . . . . . . . . . . . . . . . . . . . . . . . . . . . . . . . . . . . . . . . . 0 10,382 0 0 99,653
Total assets . . . . . . . . . . . . . . . . . . . . . . . . . . . . . . . . . . . . . . . . . . . . . . . . . . . 201,131,587 362,678,524 44,889,314 182,008,845 4,239,980,337
LiabilitiesDividends payable on contracts for difference . . . . . . . . . . . . . . . . . . . . 0 0 0 0 33,185Distributions payable . . . . . . . . . . . . . . . . . . . . . . . . . . . . . . . . . . . . . . . . . . 0 0 0 0 416,793Payable for investments purchased . . . . . . . . . . . . . . . . . . . . . . . . . . . . . 631,899 6,771,041 656 0 20,126,683Payable for shares redeemed . . . . . . . . . . . . . . . . . . . . . . . . . . . . . . . . . . . 150,598 80,736 275,826 0 1,933,496Payable for investment management fee . . . . . . . . . . . . . . . . . . . . . . . . 171,467 152,385 14,643 38,148 2,746,944Depositary and administration fees payable . . . . . . . . . . . . . . . . . . . . . 41,718 64,521 19,298 29,786 834,719Unrealised depreciation on forward foreign currency contracts . . . . 56 245,555 106 304,327 703,982Unrealised depreciation on futures contracts . . . . . . . . . . . . . . . . . . . . . 0 0 0 0 40,439Unrealised depreciation on contracts for difference . . . . . . . . . . . . . . . 0 0 0 0 259,477Subscription tax payable . . . . . . . . . . . . . . . . . . . . . . . . . . . . . . . . . . . . . . . 13,015 10,776 1,174 4,472 161,192Other liabilities . . . . . . . . . . . . . . . . . . . . . . . . . . . . . . . . . . . . . . . . . . . . . . . 21,763 0 31,108 33,396 753,665
Total liabilities . . . . . . . . . . . . . . . . . . . . . . . . . . . . . . . . . . . . . . . . . . . . . . . . 1,030,516 7,325,014 342,811 410,129 28,010,575
Total net assets . . . . . . . . . . . . . . . . . . . . . . . . . . . . . . . . . . . . . . . . . . . . . . . . 200,101,071 355,353,510 44,546,503 181,598,716 4,211,969,762
The accompanying notes are an integral part of these financial statements.
China Equity Fund, EUR Investment Grade Credit Fund, Global Long/Short Equity Fund, Global Low Volatility Equity Fund, Global Opportunity Bond Fund, U.S.
Dollar Short-Term Money Market Fund and USD Investment Grade Credit Fund have not been authorised by the Hong Kong Securities and Futures Commission
and are not available for investment by Hong Kong retail investors.

[THIS PAGE INTENTIONALLY LEFT BLANK]
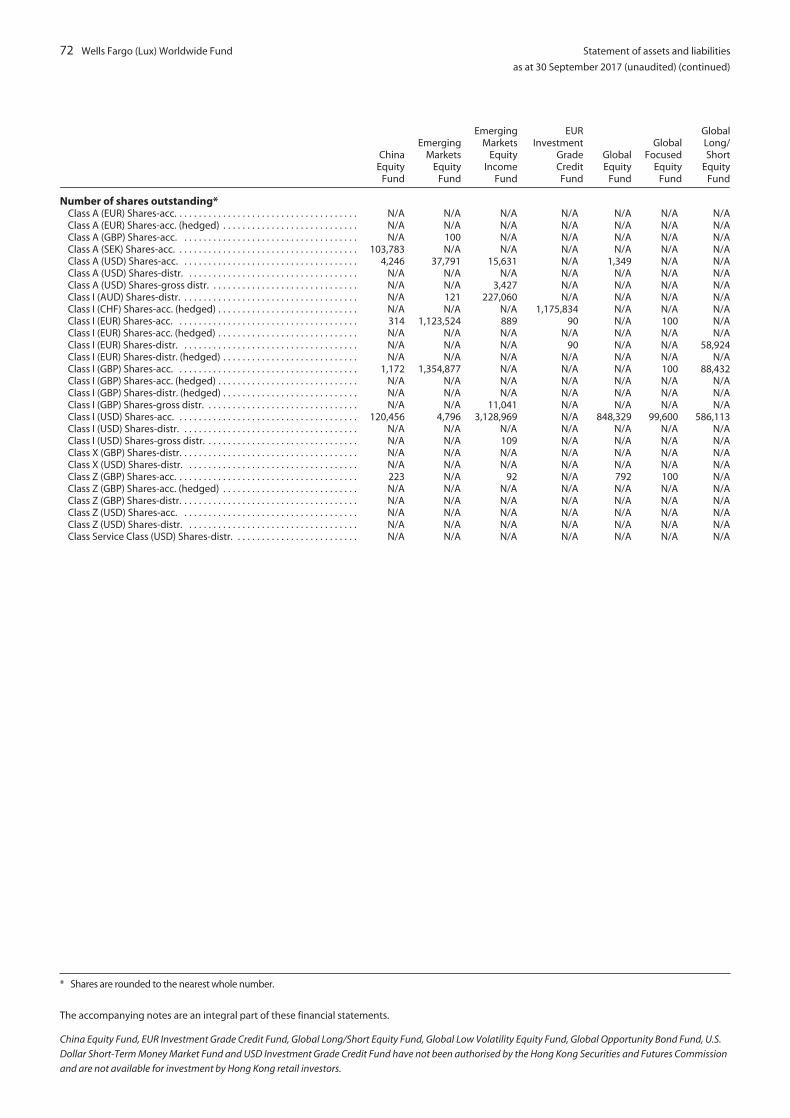
72 Wells Fargo (Lux) Worldwide Fund Statement of assets and liabilities
as at 30 September 2017 (unaudited) (continued)
ChinaEquity
Fund
EmergingMarkets
EquityFund
EmergingMarkets
EquityIncome
Fund
EURInvestment
GradeCreditFund
GlobalEquity
Fund
GlobalFocused
EquityFund
GlobalLong/Short
EquityFund
Number of shares outstanding*Class A (EUR) Shares-acc. . . . . . . . . . . . . . . . . . . . . . . . . . . . . . . . . . . . . . N/A N/A N/A N/A N/A N/A N/AClass A (EUR) Shares-acc. (hedged) . . . . . . . . . . . . . . . . . . . . . . . . . . . . N/A N/A N/A N/A N/A N/A N/AClass A (GBP) Shares-acc. . . . . . . . . . . . . . . . . . . . . . . . . . . . . . . . . . . . . N/A 100 N/A N/A N/A N/A N/AClass A (SEK) Shares-acc. . . . . . . . . . . . . . . . . . . . . . . . . . . . . . . . . . . . . . 103,783 N/A N/A N/A N/A N/A N/AClass A (USD) Shares-acc. . . . . . . . . . . . . . . . . . . . . . . . . . . . . . . . . . . . . 4,246 37,791 15,631 N/A 1,349 N/A N/AClass A (USD) Shares-distr. . . . . . . . . . . . . . . . . . . . . . . . . . . . . . . . . . . . N/A N/A N/A N/A N/A N/A N/AClass A (USD) Shares-gross distr. . . . . . . . . . . . . . . . . . . . . . . . . . . . . . . N/A N/A 3,427 N/A N/A N/A N/AClass I (AUD) Shares-distr. . . . . . . . . . . . . . . . . . . . . . . . . . . . . . . . . . . . . N/A 121 227,060 N/A N/A N/A N/AClass I (CHF) Shares-acc. (hedged) . . . . . . . . . . . . . . . . . . . . . . . . . . . . . N/A N/A N/A 1,175,834 N/A N/A N/AClass I (EUR) Shares-acc. . . . . . . . . . . . . . . . . . . . . . . . . . . . . . . . . . . . . . 314 1,123,524 889 90 N/A 100 N/AClass I (EUR) Shares-acc. (hedged) . . . . . . . . . . . . . . . . . . . . . . . . . . . . . N/A N/A N/A N/A N/A N/A N/AClass I (EUR) Shares-distr. . . . . . . . . . . . . . . . . . . . . . . . . . . . . . . . . . . . . N/A N/A N/A 90 N/A N/A 58,924Class I (EUR) Shares-distr. (hedged) . . . . . . . . . . . . . . . . . . . . . . . . . . . . N/A N/A N/A N/A N/A N/A N/AClass I (GBP) Shares-acc. . . . . . . . . . . . . . . . . . . . . . . . . . . . . . . . . . . . . . 1,172 1,354,877 N/A N/A N/A 100 88,432Class I (GBP) Shares-acc. (hedged) . . . . . . . . . . . . . . . . . . . . . . . . . . . . . N/A N/A N/A N/A N/A N/A N/AClass I (GBP) Shares-distr. (hedged) . . . . . . . . . . . . . . . . . . . . . . . . . . . . N/A N/A N/A N/A N/A N/A N/AClass I (GBP) Shares-gross distr. . . . . . . . . . . . . . . . . . . . . . . . . . . . . . . . N/A N/A 11,041 N/A N/A N/A N/AClass I (USD) Shares-acc. . . . . . . . . . . . . . . . . . . . . . . . . . . . . . . . . . . . . . 120,456 4,796 3,128,969 N/A 848,329 99,600 586,113Class I (USD) Shares-distr. . . . . . . . . . . . . . . . . . . . . . . . . . . . . . . . . . . . . N/A N/A N/A N/A N/A N/A N/AClass I (USD) Shares-gross distr. . . . . . . . . . . . . . . . . . . . . . . . . . . . . . . . N/A N/A 109 N/A N/A N/A N/AClass X (GBP) Shares-distr. . . . . . . . . . . . . . . . . . . . . . . . . . . . . . . . . . . . . N/A N/A N/A N/A N/A N/A N/AClass X (USD) Shares-distr. . . . . . . . . . . . . . . . . . . . . . . . . . . . . . . . . . . . N/A N/A N/A N/A N/A N/A N/AClass Z (GBP) Shares-acc. . . . . . . . . . . . . . . . . . . . . . . . . . . . . . . . . . . . . . 223 N/A 92 N/A 792 100 N/AClass Z (GBP) Shares-acc. (hedged) . . . . . . . . . . . . . . . . . . . . . . . . . . . . N/A N/A N/A N/A N/A N/A N/AClass Z (GBP) Shares-distr. . . . . . . . . . . . . . . . . . . . . . . . . . . . . . . . . . . . . N/A N/A N/A N/A N/A N/A N/AClass Z (USD) Shares-acc. . . . . . . . . . . . . . . . . . . . . . . . . . . . . . . . . . . . . N/A N/A N/A N/A N/A N/A N/AClass Z (USD) Shares-distr. . . . . . . . . . . . . . . . . . . . . . . . . . . . . . . . . . . . N/A N/A N/A N/A N/A N/A N/AClass Service Class (USD) Shares-distr. . . . . . . . . . . . . . . . . . . . . . . . . . N/A N/A N/A N/A N/A N/A N/A
* Shares are rounded to the nearest whole number.
The accompanying notes are an integral part of these financial statements.
China Equity Fund, EUR Investment Grade Credit Fund, Global Long/Short Equity Fund, Global Low Volatility Equity Fund, Global Opportunity Bond Fund, U.S.
Dollar Short-Term Money Market Fund and USD Investment Grade Credit Fund have not been authorised by the Hong Kong Securities and Futures Commission
and are not available for investment by Hong Kong retail investors.

Statement of assets and liabilities
as at 30 September 2017 (unaudited) (continued)
Wells Fargo (Lux) Worldwide Fund 73
GlobalLow
VolatilityEquity
Fund
GlobalOpportunity
BondFund
U.S.All Cap
GrowthFund
U.S.DollarShort-Term
MoneyMarket
Fund
U.S.HighYieldBondFund
U.S.Large
CapGrowth
Fund
U.S.SelectEquity
Fund
U.S.Short-TermHighYieldBondFund
U.S.Small
CapValueFund
USDInvestment
GradeCreditFund
N/A N/A N/A N/A N/A N/A 227 N/A N/A N/AN/A 1,442 N/A N/A N/A N/A N/A N/A N/A N/AN/A N/A 2,336 N/A N/A N/A N/A N/A N/A N/AN/A N/A N/A N/A N/A N/A N/A N/A N/A N/AN/A 396 401,439 N/A 6,362 10,658 68,799 22,182 N/A 100N/A N/A N/A 668,217,644 N/A N/A N/A N/A N/A N/AN/A N/A N/A N/A 1,014 N/A N/A N/A N/A N/AN/A N/A N/A N/A N/A N/A N/A N/A N/A N/AN/A N/A N/A N/A N/A N/A N/A N/A N/A N/A
1,052,218 N/A 7,486 N/A 93,983 467,419 N/A N/A N/A N/AN/A 424 N/A N/A 9,569 N/A 89 N/A N/A N/AN/A N/A N/A N/A N/A N/A N/A N/A N/A N/AN/A N/A N/A N/A N/A N/A N/A 130,578 N/A 499,614
7,661,058 N/A 11,187 N/A N/A N/A N/A N/A 271,736 N/AN/A 52,886 N/A N/A N/A N/A N/A N/A N/A N/AN/A N/A N/A N/A N/A N/A N/A 257,733 N/A N/AN/A N/A N/A N/A N/A N/A N/A N/A N/A N/A756 122,552 1,294,731 N/A 1,101,798 5,326 1,047,270 2,705,439 62,085 60,100N/A N/A N/A 381,399,989 N/A N/A N/A N/A N/A 991,172N/A N/A N/A N/A 69 N/A N/A 39,830 N/A 99,553N/A N/A N/A N/A N/A N/A 66 N/A N/A N/AN/A N/A N/A N/A N/A N/A 639,233 N/A N/A N/AN/A N/A 298,730 N/A 236 205 N/A N/A N/A N/AN/A N/A N/A N/A N/A N/A N/A N/A 100 N/AN/A N/A 20,888 N/A N/A N/A N/A N/A N/A N/AN/A 1,598 135,178 N/A N/A N/A N/A N/A 6,089 N/AN/A N/A 371,246 N/A N/A N/A N/A N/A N/A N/AN/A N/A N/A 51,459 N/A N/A N/A N/A N/A N/A
The accompanying notes are an integral part of these financial statements.
China Equity Fund, EUR Investment Grade Credit Fund, Global Long/Short Equity Fund, Global Low Volatility Equity Fund, Global Opportunity Bond Fund, U.S.
Dollar Short-Term Money Market Fund and USD Investment Grade Credit Fund have not been authorised by the Hong Kong Securities and Futures Commission
and are not available for investment by Hong Kong retail investors.

74 Wells Fargo (Lux) Worldwide Fund Statement of operations and changes in net assets
for the six months ended 30 September 2017 (unaudited)
ChinaEquity
FundUSD
EmergingMarkets
EquityFund
USD
EmergingMarkets
EquityIncome
FundUSD
EURInvestment
GradeCreditFund*
EUR
GlobalEquity
FundUSD
IncomeDividends . . . . . . . . . . . . . . . . . . . . . . . . . . . . . . . . . . . . . . . . . . . . . . . . . . . . . 919,710 3,542,362 10,004,816 0 1,455,676Interest . . . . . . . . . . . . . . . . . . . . . . . . . . . . . . . . . . . . . . . . . . . . . . . . . . . . . . . 0 0 0 449,668 0Interest on reverse repurchase agreements . . . . . . . . . . . . . . . . . . . . . . . 0 0 0 0 0
Total income . . . . . . . . . . . . . . . . . . . . . . . . . . . . . . . . . . . . . . . . . . . . . . . . . . . 919,710 3,542,362 10,004,816 449,668 1,455,676
ExpensesManagement company fee . . . . . . . . . . . . . . . . . . . . . . . . . . . . . . . . . . . . . . 13,046 45,667 61,226 11,786 25,935Investment management fee . . . . . . . . . . . . . . . . . . . . . . . . . . . . . . . . . . . . 283,044 1,600,696 2,319,304 89,367 555,392Depositary and administration fees . . . . . . . . . . . . . . . . . . . . . . . . . . . . . . 47,017 110,737 196,623 52,575 39,789Registrar, transfer agent and paying agent fees . . . . . . . . . . . . . . . . . . . . 9,793 8,797 10,630 4,854 8,615Directors fees . . . . . . . . . . . . . . . . . . . . . . . . . . . . . . . . . . . . . . . . . . . . . . . . . . 4,531 4,531 4,531 2,481 4,531Performance fees . . . . . . . . . . . . . . . . . . . . . . . . . . . . . . . . . . . . . . . . . . . . . . N/A N/A N/A N/A N/ADividend expense on contracts for difference . . . . . . . . . . . . . . . . . . . . . 0 0 0 0 0Audit fees and tax services . . . . . . . . . . . . . . . . . . . . . . . . . . . . . . . . . . . . . . 6,069 5,886 6,619 3,072 6,069Subscription tax . . . . . . . . . . . . . . . . . . . . . . . . . . . . . . . . . . . . . . . . . . . . . . . 6,334 14,784 21,634 5,281 6,745Amortisation of formation expenses . . . . . . . . . . . . . . . . . . . . . . . . . . . . . 0 0 1,356 2,884 0Other expenses . . . . . . . . . . . . . . . . . . . . . . . . . . . . . . . . . . . . . . . . . . . . . . . . 48,171 84,054 75,083 22,211 52,438
Total expenses . . . . . . . . . . . . . . . . . . . . . . . . . . . . . . . . . . . . . . . . . . . . . . . . . 418,005 1,875,152 2,697,006 194,511 699,514
LessWaived fees and/or reimbursed expenses . . . . . . . . . . . . . . . . . . . . . . . . . (51,931) 0 0 (57,512) 0
Net expenses . . . . . . . . . . . . . . . . . . . . . . . . . . . . . . . . . . . . . . . . . . . . . . . . . . . 366,074 1,875,152 2,697,006 136,999 699,514
Net investment profit/(loss) . . . . . . . . . . . . . . . . . . . . . . . . . . . . . . . . . . . . . 553,636 1,667,210 7,307,810 312,669 756,162
Realised and unrealised profit/(loss)Net realised profit/(loss) on
Investments . . . . . . . . . . . . . . . . . . . . . . . . . . . . . . . . . . . . . . . . . . . . . . . . . 4,183,600 295,781 2,711,121 (36,257) 2,863,991Forward foreign currency contracts . . . . . . . . . . . . . . . . . . . . . . . . . . . . 0 0 0 (5,998,498) 0Futures contracts . . . . . . . . . . . . . . . . . . . . . . . . . . . . . . . . . . . . . . . . . . . . . 0 0 0 (9,595) 0Swaps contracts . . . . . . . . . . . . . . . . . . . . . . . . . . . . . . . . . . . . . . . . . . . . . . 0 0 0 0 0Foreign currency on other transactions . . . . . . . . . . . . . . . . . . . . . . . . . (3,919) (22,991) (3,365) 11,999 3,427
Net realised profit/(loss) . . . . . . . . . . . . . . . . . . . . . . . . . . . . . . . . . . . . . . . 4,179,681 272,790 2,707,756 (6,032,351) 2,867,418
Net change in unrealised appreciation/(depreciation) onInvestments . . . . . . . . . . . . . . . . . . . . . . . . . . . . . . . . . . . . . . . . . . . . . . . . . 5,973,179 36,810,867 20,359,765 48,157 9,888,101Forward foreign currency contracts . . . . . . . . . . . . . . . . . . . . . . . . . . . . 0 0 0 779,946 0Futures contracts . . . . . . . . . . . . . . . . . . . . . . . . . . . . . . . . . . . . . . . . . . . . . 0 0 0 105,768 0Swaps contracts . . . . . . . . . . . . . . . . . . . . . . . . . . . . . . . . . . . . . . . . . . . . . . 0 0 0 0 0Foreign currency on other transactions . . . . . . . . . . . . . . . . . . . . . . . . . (7) (23,046) (65,810) (1,753) 1,841
Net change in unrealised appreciation/(depreciation) . . . . . . . . . . . 5,973,172 36,787,821 20,293,955 932,118 9,889,942
Net realised and unrealised profit/(loss) . . . . . . . . . . . . . . . . . . . . . . . . . 10,152,853 37,060,611 23,001,711 (5,100,233) 12,757,360
Net increase/(decrease) in net assets as a result of operations . . . . . 10,706,489 38,727,821 30,309,521 (4,787,564) 13,513,522
Distributions to shareholders fromNet investment income . . . . . . . . . . . . . . . . . . . . . . . . . . . . . . . . . . . . . . . . . 0 (480) (608,007) (18) (260)
Capital share transactionsReceipts from the issuance of shares . . . . . . . . . . . . . . . . . . . . . . . . . . . . . 2,975,562 13,152,228 15,344,257 108,126,620 9,645,016Reinvestment of distributions . . . . . . . . . . . . . . . . . . . . . . . . . . . . . . . . . . . 0 480 599,337 18 260Payments from redemption of shares . . . . . . . . . . . . . . . . . . . . . . . . . . . . (17,752,238) (14,772,038) (16,428,388) 0 (13,903,916)
Net increase/(decrease) in net assets resulting from capital sharetransactions . . . . . . . . . . . . . . . . . . . . . . . . . . . . . . . . . . . . . . . . . . . . . . . . . . (14,776,676) (1,619,330) (484,794) 108,126,638 (4,258,640)
Total increase/(decrease) in net assets . . . . . . . . . . . . . . . . . . . . . . . . . . . (4,070,187) 37,108,011 29,216,720 103,339,056 9,254,622
Net assets at the beginning of the period . . . . . . . . . . . . . . . . . . . . . . . . . . . 62,271,855 252,148,589 409,630,977 0 122,928,835
Net assets at the end of the period . . . . . . . . . . . . . . . . . . . . . . . . . . . . . . . 58,201,668 289,256,600 438,847,697 103,339,056 132,183,457
* For the period from 19 June 2017 (commencement of operations) to 30 September 2017.** For the period from 31 July 2017 (commencement of operations) to 30 September 2017.*** For the period from 16 June 2017 (commencement of operations) to 30 September 2017.
The accompanying notes are an integral part of these financial statements.
China Equity Fund, EUR Investment Grade Credit Fund, Global Long/Short Equity Fund, Global Low Volatility Equity Fund, Global Opportunity Bond Fund, U.S.
Dollar Short-Term Money Market Fund and USD Investment Grade Credit Fund have not been authorised by the Hong Kong Securities and Futures Commission
and are not available for investment by Hong Kong retail investors.
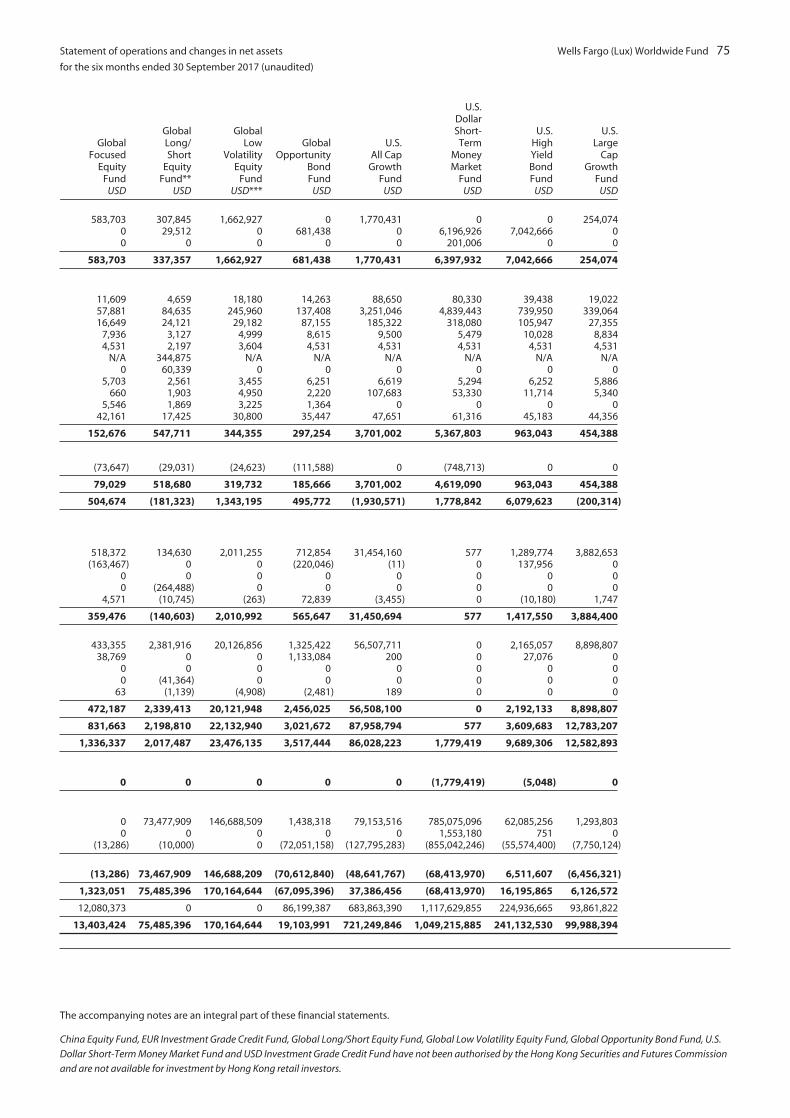
Statement of operations and changes in net assets
for the six months ended 30 September 2017 (unaudited)
Wells Fargo (Lux) Worldwide Fund 75
GlobalFocused
EquityFund
USD
GlobalLong/Short
EquityFund**
USD
GlobalLow
VolatilityEquity
FundUSD***
GlobalOpportunity
BondFund
USD
U.S.All Cap
GrowthFund
USD
U.S.DollarShort-Term
MoneyMarket
FundUSD
U.S.HighYieldBondFund
USD
U.S.Large
CapGrowth
FundUSD
583,703 307,845 1,662,927 0 1,770,431 0 0 254,0740 29,512 0 681,438 0 6,196,926 7,042,666 00 0 0 0 0 201,006 0 0
583,703 337,357 1,662,927 681,438 1,770,431 6,397,932 7,042,666 254,074
11,609 4,659 18,180 14,263 88,650 80,330 39,438 19,02257,881 84,635 245,960 137,408 3,251,046 4,839,443 739,950 339,06416,649 24,121 29,182 87,155 185,322 318,080 105,947 27,355
7,936 3,127 4,999 8,615 9,500 5,479 10,028 8,8344,531 2,197 3,604 4,531 4,531 4,531 4,531 4,531
N/A 344,875 N/A N/A N/A N/A N/A N/A0 60,339 0 0 0 0 0 0
5,703 2,561 3,455 6,251 6,619 5,294 6,252 5,886660 1,903 4,950 2,220 107,683 53,330 11,714 5,340
5,546 1,869 3,225 1,364 0 0 0 042,161 17,425 30,800 35,447 47,651 61,316 45,183 44,356
152,676 547,711 344,355 297,254 3,701,002 5,367,803 963,043 454,388
(73,647) (29,031) (24,623) (111,588) 0 (748,713) 0 0
79,029 518,680 319,732 185,666 3,701,002 4,619,090 963,043 454,388
504,674 (181,323) 1,343,195 495,772 (1,930,571) 1,778,842 6,079,623 (200,314)
518,372 134,630 2,011,255 712,854 31,454,160 577 1,289,774 3,882,653(163,467) 0 0 (220,046) (11) 0 137,956 0
0 0 0 0 0 0 0 00 (264,488) 0 0 0 0 0 0
4,571 (10,745) (263) 72,839 (3,455) 0 (10,180) 1,747
359,476 (140,603) 2,010,992 565,647 31,450,694 577 1,417,550 3,884,400
433,355 2,381,916 20,126,856 1,325,422 56,507,711 0 2,165,057 8,898,80738,769 0 0 1,133,084 200 0 27,076 0
0 0 0 0 0 0 0 00 (41,364) 0 0 0 0 0 0
63 (1,139) (4,908) (2,481) 189 0 0 0
472,187 2,339,413 20,121,948 2,456,025 56,508,100 0 2,192,133 8,898,807
831,663 2,198,810 22,132,940 3,021,672 87,958,794 577 3,609,683 12,783,207
1,336,337 2,017,487 23,476,135 3,517,444 86,028,223 1,779,419 9,689,306 12,582,893
0 0 0 0 0 (1,779,419) (5,048) 0
0 73,477,909 146,688,509 1,438,318 79,153,516 785,075,096 62,085,256 1,293,8030 0 0 0 0 1,553,180 751 0
(13,286) (10,000) 0 (72,051,158) (127,795,283) (855,042,246) (55,574,400) (7,750,124)
(13,286) 73,467,909 146,688,209 (70,612,840) (48,641,767) (68,413,970) 6,511,607 (6,456,321)
1,323,051 75,485,396 170,164,644 (67,095,396) 37,386,456 (68,413,970) 16,195,865 6,126,572
12,080,373 0 0 86,199,387 683,863,390 1,117,629,855 224,936,665 93,861,822
13,403,424 75,485,396 170,164,644 19,103,991 721,249,846 1,049,215,885 241,132,530 99,988,394
The accompanying notes are an integral part of these financial statements.
China Equity Fund, EUR Investment Grade Credit Fund, Global Long/Short Equity Fund, Global Low Volatility Equity Fund, Global Opportunity Bond Fund, U.S.
Dollar Short-Term Money Market Fund and USD Investment Grade Credit Fund have not been authorised by the Hong Kong Securities and Futures Commission
and are not available for investment by Hong Kong retail investors.
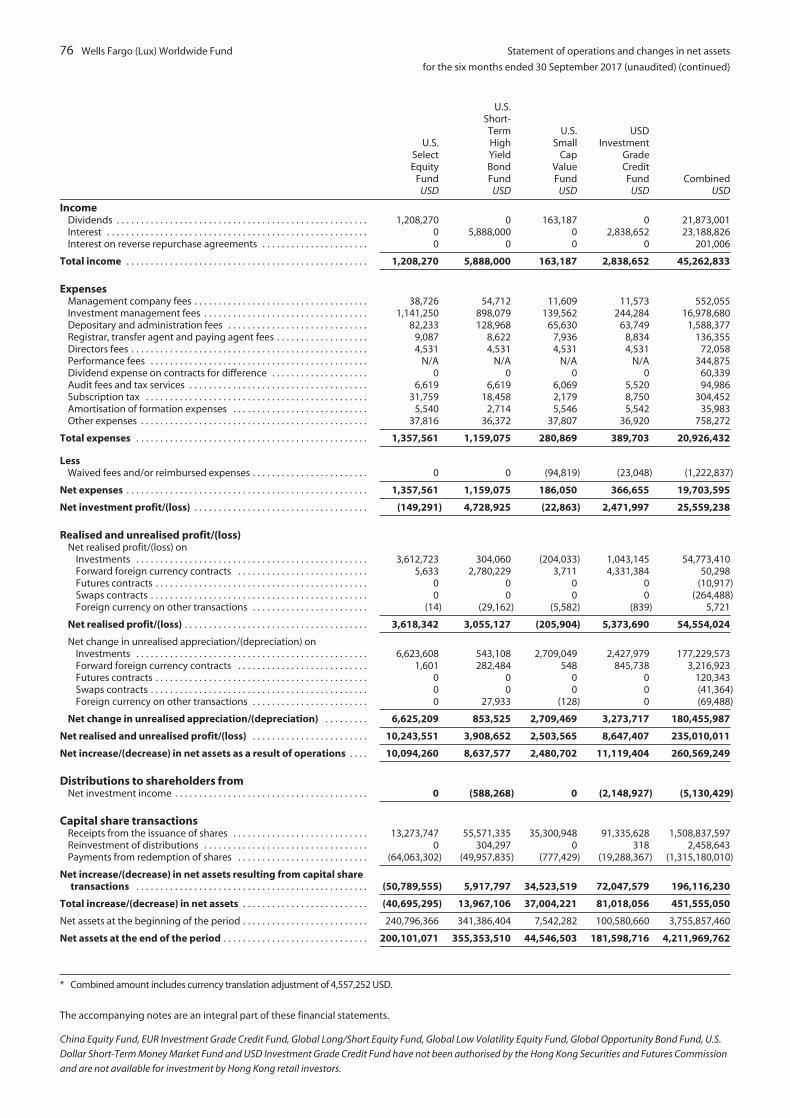
76 Wells Fargo (Lux) Worldwide Fund Statement of operations and changes in net assets
for the six months ended 30 September 2017 (unaudited) (continued)
U.S.SelectEquity
FundUSD
U.S.Short-TermHighYieldBondFund
USD
U.S.Small
CapValueFund
USD
USDInvestment
GradeCreditFund
USDCombined
USD
IncomeDividends . . . . . . . . . . . . . . . . . . . . . . . . . . . . . . . . . . . . . . . . . . . . . . . . . . . . 1,208,270 0 163,187 0 21,873,001Interest . . . . . . . . . . . . . . . . . . . . . . . . . . . . . . . . . . . . . . . . . . . . . . . . . . . . . . 0 5,888,000 0 2,838,652 23,188,826Interest on reverse repurchase agreements . . . . . . . . . . . . . . . . . . . . . . 0 0 0 0 201,006
Total income . . . . . . . . . . . . . . . . . . . . . . . . . . . . . . . . . . . . . . . . . . . . . . . . . . 1,208,270 5,888,000 163,187 2,838,652 45,262,833
ExpensesManagement company fees . . . . . . . . . . . . . . . . . . . . . . . . . . . . . . . . . . . . 38,726 54,712 11,609 11,573 552,055Investment management fees . . . . . . . . . . . . . . . . . . . . . . . . . . . . . . . . . . 1,141,250 898,079 139,562 244,284 16,978,680Depositary and administration fees . . . . . . . . . . . . . . . . . . . . . . . . . . . . . 82,233 128,968 65,630 63,749 1,588,377Registrar, transfer agent and paying agent fees . . . . . . . . . . . . . . . . . . . 9,087 8,622 7,936 8,834 136,355Directors fees . . . . . . . . . . . . . . . . . . . . . . . . . . . . . . . . . . . . . . . . . . . . . . . . . 4,531 4,531 4,531 4,531 72,058Performance fees . . . . . . . . . . . . . . . . . . . . . . . . . . . . . . . . . . . . . . . . . . . . . N/A N/A N/A N/A 344,875Dividend expense on contracts for difference . . . . . . . . . . . . . . . . . . . . 0 0 0 0 60,339Audit fees and tax services . . . . . . . . . . . . . . . . . . . . . . . . . . . . . . . . . . . . . 6,619 6,619 6,069 5,520 94,986Subscription tax . . . . . . . . . . . . . . . . . . . . . . . . . . . . . . . . . . . . . . . . . . . . . . 31,759 18,458 2,179 8,750 304,452Amortisation of formation expenses . . . . . . . . . . . . . . . . . . . . . . . . . . . . 5,540 2,714 5,546 5,542 35,983Other expenses . . . . . . . . . . . . . . . . . . . . . . . . . . . . . . . . . . . . . . . . . . . . . . . 37,816 36,372 37,807 36,920 758,272
Total expenses . . . . . . . . . . . . . . . . . . . . . . . . . . . . . . . . . . . . . . . . . . . . . . . . 1,357,561 1,159,075 280,869 389,703 20,926,432
LessWaived fees and/or reimbursed expenses . . . . . . . . . . . . . . . . . . . . . . . . 0 0 (94,819) (23,048) (1,222,837)
Net expenses . . . . . . . . . . . . . . . . . . . . . . . . . . . . . . . . . . . . . . . . . . . . . . . . . . 1,357,561 1,159,075 186,050 366,655 19,703,595
Net investment profit/(loss) . . . . . . . . . . . . . . . . . . . . . . . . . . . . . . . . . . . . (149,291) 4,728,925 (22,863) 2,471,997 25,559,238
Realised and unrealised profit/(loss)Net realised profit/(loss) on
Investments . . . . . . . . . . . . . . . . . . . . . . . . . . . . . . . . . . . . . . . . . . . . . . . . 3,612,723 304,060 (204,033) 1,043,145 54,773,410Forward foreign currency contracts . . . . . . . . . . . . . . . . . . . . . . . . . . . 5,633 2,780,229 3,711 4,331,384 50,298Futures contracts . . . . . . . . . . . . . . . . . . . . . . . . . . . . . . . . . . . . . . . . . . . . 0 0 0 0 (10,917)Swaps contracts . . . . . . . . . . . . . . . . . . . . . . . . . . . . . . . . . . . . . . . . . . . . . 0 0 0 0 (264,488)Foreign currency on other transactions . . . . . . . . . . . . . . . . . . . . . . . . (14) (29,162) (5,582) (839) 5,721
Net realised profit/(loss) . . . . . . . . . . . . . . . . . . . . . . . . . . . . . . . . . . . . . . 3,618,342 3,055,127 (205,904) 5,373,690 54,554,024
Net change in unrealised appreciation/(depreciation) onInvestments . . . . . . . . . . . . . . . . . . . . . . . . . . . . . . . . . . . . . . . . . . . . . . . . 6,623,608 543,108 2,709,049 2,427,979 177,229,573Forward foreign currency contracts . . . . . . . . . . . . . . . . . . . . . . . . . . . 1,601 282,484 548 845,738 3,216,923Futures contracts . . . . . . . . . . . . . . . . . . . . . . . . . . . . . . . . . . . . . . . . . . . . 0 0 0 0 120,343Swaps contracts . . . . . . . . . . . . . . . . . . . . . . . . . . . . . . . . . . . . . . . . . . . . . 0 0 0 0 (41,364)Foreign currency on other transactions . . . . . . . . . . . . . . . . . . . . . . . . 0 27,933 (128) 0 (69,488)
Net change in unrealised appreciation/(depreciation) . . . . . . . . . 6,625,209 853,525 2,709,469 3,273,717 180,455,987
Net realised and unrealised profit/(loss) . . . . . . . . . . . . . . . . . . . . . . . . 10,243,551 3,908,652 2,503,565 8,647,407 235,010,011
Net increase/(decrease) in net assets as a result of operations . . . . 10,094,260 8,637,577 2,480,702 11,119,404 260,569,249
Distributions to shareholders fromNet investment income . . . . . . . . . . . . . . . . . . . . . . . . . . . . . . . . . . . . . . . . 0 (588,268) 0 (2,148,927) (5,130,429)
Capital share transactionsReceipts from the issuance of shares . . . . . . . . . . . . . . . . . . . . . . . . . . . . 13,273,747 55,571,335 35,300,948 91,335,628 1,508,837,597Reinvestment of distributions . . . . . . . . . . . . . . . . . . . . . . . . . . . . . . . . . . 0 304,297 0 318 2,458,643Payments from redemption of shares . . . . . . . . . . . . . . . . . . . . . . . . . . . (64,063,302) (49,957,835) (777,429) (19,288,367) (1,315,180,010)
Net increase/(decrease) in net assets resulting from capital sharetransactions . . . . . . . . . . . . . . . . . . . . . . . . . . . . . . . . . . . . . . . . . . . . . . . . (50,789,555) 5,917,797 34,523,519 72,047,579 196,116,230
Total increase/(decrease) in net assets . . . . . . . . . . . . . . . . . . . . . . . . . . (40,695,295) 13,967,106 37,004,221 81,018,056 451,555,050
Net assets at the beginning of the period . . . . . . . . . . . . . . . . . . . . . . . . . . 240,796,366 341,386,404 7,542,282 100,580,660 3,755,857,460
Net assets at the end of the period . . . . . . . . . . . . . . . . . . . . . . . . . . . . . . 200,101,071 355,353,510 44,546,503 181,598,716 4,211,969,762
* Combined amount includes currency translation adjustment of 4,557,252 USD.
The accompanying notes are an integral part of these financial statements.
China Equity Fund, EUR Investment Grade Credit Fund, Global Long/Short Equity Fund, Global Low Volatility Equity Fund, Global Opportunity Bond Fund, U.S.
Dollar Short-Term Money Market Fund and USD Investment Grade Credit Fund have not been authorised by the Hong Kong Securities and Futures Commission
and are not available for investment by Hong Kong retail investors.
[THIS PAGE INTENTIONALLY LEFT BLANK]
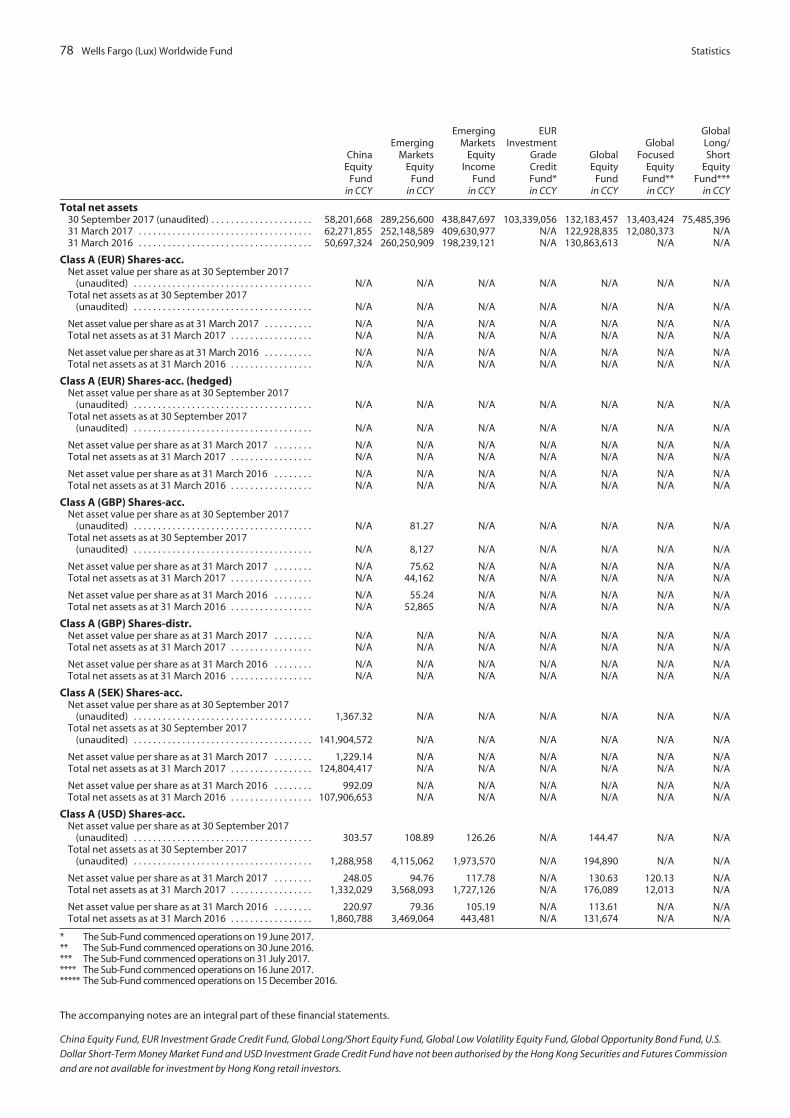
78 Wells Fargo (Lux) Worldwide Fund Statistics
ChinaEquity
Fundin CCY
EmergingMarkets
EquityFund
in CCY
EmergingMarkets
EquityIncome
Fundin CCY
EURInvestment
GradeCreditFund*in CCY
GlobalEquity
Fundin CCY
GlobalFocused
EquityFund**
in CCY
GlobalLong/Short
EquityFund***
in CCY
Total net assets30 September 2017 (unaudited) . . . . . . . . . . . . . . . . . . . . . 58,201,668 289,256,600 438,847,697 103,339,056 132,183,457 13,403,424 75,485,39631 March 2017 . . . . . . . . . . . . . . . . . . . . . . . . . . . . . . . . . . . . 62,271,855 252,148,589 409,630,977 N/A 122,928,835 12,080,373 N/A31 March 2016 . . . . . . . . . . . . . . . . . . . . . . . . . . . . . . . . . . . . 50,697,324 260,250,909 198,239,121 N/A 130,863,613 N/A N/A
Class A (EUR) Shares-acc.Net asset value per share as at 30 September 2017
(unaudited) . . . . . . . . . . . . . . . . . . . . . . . . . . . . . . . . . . . . . N/A N/A N/A N/A N/A N/A N/ATotal net assets as at 30 September 2017
(unaudited) . . . . . . . . . . . . . . . . . . . . . . . . . . . . . . . . . . . . . N/A N/A N/A N/A N/A N/A N/A
Net asset value per share as at 31 March 2017 . . . . . . . . . . N/A N/A N/A N/A N/A N/A N/ATotal net assets as at 31 March 2017 . . . . . . . . . . . . . . . . . N/A N/A N/A N/A N/A N/A N/A
Net asset value per share as at 31 March 2016 . . . . . . . . . . N/A N/A N/A N/A N/A N/A N/ATotal net assets as at 31 March 2016 . . . . . . . . . . . . . . . . . N/A N/A N/A N/A N/A N/A N/A
Class A (EUR) Shares-acc. (hedged)Net asset value per share as at 30 September 2017
(unaudited) . . . . . . . . . . . . . . . . . . . . . . . . . . . . . . . . . . . . . N/A N/A N/A N/A N/A N/A N/ATotal net assets as at 30 September 2017
(unaudited) . . . . . . . . . . . . . . . . . . . . . . . . . . . . . . . . . . . . . N/A N/A N/A N/A N/A N/A N/A
Net asset value per share as at 31 March 2017 . . . . . . . . N/A N/A N/A N/A N/A N/A N/ATotal net assets as at 31 March 2017 . . . . . . . . . . . . . . . . . N/A N/A N/A N/A N/A N/A N/A
Net asset value per share as at 31 March 2016 . . . . . . . . N/A N/A N/A N/A N/A N/A N/ATotal net assets as at 31 March 2016 . . . . . . . . . . . . . . . . . N/A N/A N/A N/A N/A N/A N/A
Class A (GBP) Shares-acc.Net asset value per share as at 30 September 2017
(unaudited) . . . . . . . . . . . . . . . . . . . . . . . . . . . . . . . . . . . . . N/A 81.27 N/A N/A N/A N/A N/ATotal net assets as at 30 September 2017
(unaudited) . . . . . . . . . . . . . . . . . . . . . . . . . . . . . . . . . . . . . N/A 8,127 N/A N/A N/A N/A N/A
Net asset value per share as at 31 March 2017 . . . . . . . . N/A 75.62 N/A N/A N/A N/A N/ATotal net assets as at 31 March 2017 . . . . . . . . . . . . . . . . . N/A 44,162 N/A N/A N/A N/A N/A
Net asset value per share as at 31 March 2016 . . . . . . . . N/A 55.24 N/A N/A N/A N/A N/ATotal net assets as at 31 March 2016 . . . . . . . . . . . . . . . . . N/A 52,865 N/A N/A N/A N/A N/A
Class A (GBP) Shares-distr.Net asset value per share as at 31 March 2017 . . . . . . . . N/A N/A N/A N/A N/A N/A N/ATotal net assets as at 31 March 2017 . . . . . . . . . . . . . . . . . N/A N/A N/A N/A N/A N/A N/A
Net asset value per share as at 31 March 2016 . . . . . . . . N/A N/A N/A N/A N/A N/A N/ATotal net assets as at 31 March 2016 . . . . . . . . . . . . . . . . . N/A N/A N/A N/A N/A N/A N/A
Class A (SEK) Shares-acc.Net asset value per share as at 30 September 2017
(unaudited) . . . . . . . . . . . . . . . . . . . . . . . . . . . . . . . . . . . . . 1,367.32 N/A N/A N/A N/A N/A N/ATotal net assets as at 30 September 2017
(unaudited) . . . . . . . . . . . . . . . . . . . . . . . . . . . . . . . . . . . . . 141,904,572 N/A N/A N/A N/A N/A N/A
Net asset value per share as at 31 March 2017 . . . . . . . . 1,229.14 N/A N/A N/A N/A N/A N/ATotal net assets as at 31 March 2017 . . . . . . . . . . . . . . . . . 124,804,417 N/A N/A N/A N/A N/A N/A
Net asset value per share as at 31 March 2016 . . . . . . . . 992.09 N/A N/A N/A N/A N/A N/ATotal net assets as at 31 March 2016 . . . . . . . . . . . . . . . . . 107,906,653 N/A N/A N/A N/A N/A N/A
Class A (USD) Shares-acc.Net asset value per share as at 30 September 2017
(unaudited) . . . . . . . . . . . . . . . . . . . . . . . . . . . . . . . . . . . . . 303.57 108.89 126.26 N/A 144.47 N/A N/ATotal net assets as at 30 September 2017
(unaudited) . . . . . . . . . . . . . . . . . . . . . . . . . . . . . . . . . . . . . 1,288,958 4,115,062 1,973,570 N/A 194,890 N/A N/A
Net asset value per share as at 31 March 2017 . . . . . . . . 248.05 94.76 117.78 N/A 130.63 120.13 N/ATotal net assets as at 31 March 2017 . . . . . . . . . . . . . . . . . 1,332,029 3,568,093 1,727,126 N/A 176,089 12,013 N/A
Net asset value per share as at 31 March 2016 . . . . . . . . 220.97 79.36 105.19 N/A 113.61 N/A N/ATotal net assets as at 31 March 2016 . . . . . . . . . . . . . . . . . 1,860,788 3,469,064 443,481 N/A 131,674 N/A N/A
* The Sub-Fund commenced operations on 19 June 2017.** The Sub-Fund commenced operations on 30 June 2016.*** The Sub-Fund commenced operations on 31 July 2017.**** The Sub-Fund commenced operations on 16 June 2017.***** The Sub-Fund commenced operations on 15 December 2016.
The accompanying notes are an integral part of these financial statements.
China Equity Fund, EUR Investment Grade Credit Fund, Global Long/Short Equity Fund, Global Low Volatility Equity Fund, Global Opportunity Bond Fund, U.S.
Dollar Short-Term Money Market Fund and USD Investment Grade Credit Fund have not been authorised by the Hong Kong Securities and Futures Commission
and are not available for investment by Hong Kong retail investors.
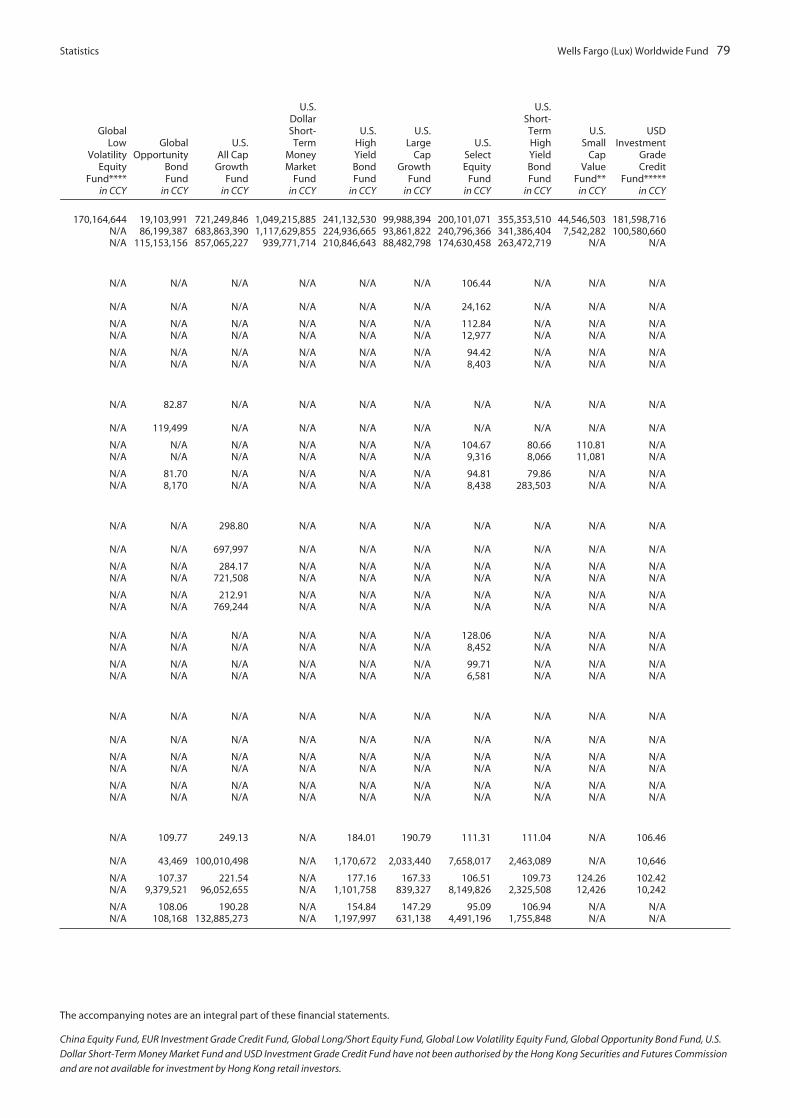
Statistics Wells Fargo (Lux) Worldwide Fund 79
GlobalLow
VolatilityEquity
Fund****in CCY
GlobalOpportunity
BondFund
in CCY
U.S.All Cap
GrowthFund
in CCY
U.S.DollarShort-Term
MoneyMarket
Fundin CCY
U.S.HighYieldBondFund
in CCY
U.S.Large
CapGrowth
Fundin CCY
U.S.SelectEquity
Fundin CCY
U.S.Short-TermHighYieldBondFund
in CCY
U.S.Small
CapValue
Fund**in CCY
USDInvestment
GradeCredit
Fund*****in CCY
170,164,644 19,103,991 721,249,846 1,049,215,885 241,132,530 99,988,394 200,101,071 355,353,510 44,546,503 181,598,716N/A 86,199,387 683,863,390 1,117,629,855 224,936,665 93,861,822 240,796,366 341,386,404 7,542,282 100,580,660N/A 115,153,156 857,065,227 939,771,714 210,846,643 88,482,798 174,630,458 263,472,719 N/A N/A
N/A N/A N/A N/A N/A N/A 106.44 N/A N/A N/A
N/A N/A N/A N/A N/A N/A 24,162 N/A N/A N/A
N/A N/A N/A N/A N/A N/A 112.84 N/A N/A N/AN/A N/A N/A N/A N/A N/A 12,977 N/A N/A N/A
N/A N/A N/A N/A N/A N/A 94.42 N/A N/A N/AN/A N/A N/A N/A N/A N/A 8,403 N/A N/A N/A
N/A 82.87 N/A N/A N/A N/A N/A N/A N/A N/A
N/A 119,499 N/A N/A N/A N/A N/A N/A N/A N/A
N/A N/A N/A N/A N/A N/A 104.67 80.66 110.81 N/AN/A N/A N/A N/A N/A N/A 9,316 8,066 11,081 N/A
N/A 81.70 N/A N/A N/A N/A 94.81 79.86 N/A N/AN/A 8,170 N/A N/A N/A N/A 8,438 283,503 N/A N/A
N/A N/A 298.80 N/A N/A N/A N/A N/A N/A N/A
N/A N/A 697,997 N/A N/A N/A N/A N/A N/A N/A
N/A N/A 284.17 N/A N/A N/A N/A N/A N/A N/AN/A N/A 721,508 N/A N/A N/A N/A N/A N/A N/A
N/A N/A 212.91 N/A N/A N/A N/A N/A N/A N/AN/A N/A 769,244 N/A N/A N/A N/A N/A N/A N/A
N/A N/A N/A N/A N/A N/A 128.06 N/A N/A N/AN/A N/A N/A N/A N/A N/A 8,452 N/A N/A N/A
N/A N/A N/A N/A N/A N/A 99.71 N/A N/A N/AN/A N/A N/A N/A N/A N/A 6,581 N/A N/A N/A
N/A N/A N/A N/A N/A N/A N/A N/A N/A N/A
N/A N/A N/A N/A N/A N/A N/A N/A N/A N/A
N/A N/A N/A N/A N/A N/A N/A N/A N/A N/AN/A N/A N/A N/A N/A N/A N/A N/A N/A N/A
N/A N/A N/A N/A N/A N/A N/A N/A N/A N/AN/A N/A N/A N/A N/A N/A N/A N/A N/A N/A
N/A 109.77 249.13 N/A 184.01 190.79 111.31 111.04 N/A 106.46
N/A 43,469 100,010,498 N/A 1,170,672 2,033,440 7,658,017 2,463,089 N/A 10,646
N/A 107.37 221.54 N/A 177.16 167.33 106.51 109.73 124.26 102.42N/A 9,379,521 96,052,655 N/A 1,101,758 839,327 8,149,826 2,325,508 12,426 10,242
N/A 108.06 190.28 N/A 154.84 147.29 95.09 106.94 N/A N/AN/A 108,168 132,885,273 N/A 1,197,997 631,138 4,491,196 1,755,848 N/A N/A
The accompanying notes are an integral part of these financial statements.
China Equity Fund, EUR Investment Grade Credit Fund, Global Long/Short Equity Fund, Global Low Volatility Equity Fund, Global Opportunity Bond Fund, U.S.
Dollar Short-Term Money Market Fund and USD Investment Grade Credit Fund have not been authorised by the Hong Kong Securities and Futures Commission
and are not available for investment by Hong Kong retail investors.

80 Wells Fargo (Lux) Worldwide Fund Statistics (continued)
ChinaEquity
Fundin CCY
EmergingMarkets
EquityFund
in CCY
EmergingMarkets
EquityIncome
Fundin CCY
EURInvestment
GradeCreditFund*in CCY
GlobalEquity
Fundin CCY
GlobalFocused
EquityFund**
in CCY
GlobalLong/Short
EquityFund***
in CCY
Class A (USD) Shares-distr.Net asset value per share as at 30 September 2017
(unaudited) . . . . . . . . . . . . . . . . . . . . . . . . . . . . . . . . . . . . . . . . . . . . . N/A N/A N/A N/A N/A N/A N/ATotal net assets as at 30 September 2017 (unaudited) . . . . . . . . . . N/A N/A N/A N/A N/A N/A N/A
Net asset value per share as at 31 March 2017 . . . . . . . . . . . . . . . . N/A N/A N/A N/A N/A N/A N/ATotal net assets as at 31 March 2017 . . . . . . . . . . . . . . . . . . . . . . . . . N/A N/A N/A N/A N/A N/A N/A
Net asset value per share as at 31 March 2016 . . . . . . . . . . . . . . . . N/A N/A N/A N/A N/A N/A N/ATotal net assets as at 31 March 2016 . . . . . . . . . . . . . . . . . . . . . . . . . N/A N/A N/A N/A N/A N/A N/A
Class A (USD) Shares-gross distr.Net asset value per share as at 30 September 2017
(unaudited) . . . . . . . . . . . . . . . . . . . . . . . . . . . . . . . . . . . . . . . . . . . . . N/A N/A 117.70 N/A N/A N/A N/ATotal net assets as at 30 September 2017 (unaudited) . . . . . . . . . . N/A N/A 403,358 N/A N/A N/A N/A
Net asset value per share as at 31 March 2017 . . . . . . . . . . . . . . . . N/A N/A 112.86 N/A N/A N/A N/ATotal net assets as at 31 March 2017 . . . . . . . . . . . . . . . . . . . . . . . . . N/A N/A 345,577 N/A N/A N/A N/A
Net asset value per share as at 31 March 2016 . . . . . . . . . . . . . . . . N/A N/A 105.22 N/A N/A N/A N/ATotal net assets as at 31 March 2016 . . . . . . . . . . . . . . . . . . . . . . . . . N/A N/A 10,943 N/A N/A N/A N/A
Class I (AUD) Shares-distr.Net asset value per share as at 30 September 2017
(unaudited) . . . . . . . . . . . . . . . . . . . . . . . . . . . . . . . . . . . . . . . . . . . . . N/A 171.46 132.67 N/A N/A N/A N/ATotal net assets as at 30 September 2017 (unaudited) . . . . . . . . . . N/A 20,747 30,124,050 N/A N/A N/A N/A
Net asset value per share as at 31 March 2017 . . . . . . . . . . . . . . . . N/A 158.89 129.73 N/A N/A N/A N/ATotal net assets as at 31 March 2017 . . . . . . . . . . . . . . . . . . . . . . . . . N/A 15,889 31,973,126 N/A N/A N/A N/A
Net asset value per share as at 31 March 2016 . . . . . . . . . . . . . . . . N/A 130.67 118.25 N/A N/A N/A N/ATotal net assets as at 31 March 2016 . . . . . . . . . . . . . . . . . . . . . . . . . N/A 24,516,305 30,875,903 N/A N/A N/A N/A
Class I (CHF) Shares-acc. (hedged)Net asset value per share as at 30 September 2017
(unaudited) . . . . . . . . . . . . . . . . . . . . . . . . . . . . . . . . . . . . . . . . . . . . . N/A N/A N/A 100.57 N/A N/A N/ATotal net assets as at 30 September 2017 (unaudited) . . . . . . . . . . N/A N/A N/A 118,253,625 N/A N/A N/A
Net asset value per share as at 31 March 2017 . . . . . . . . . . . . . . . . N/A N/A N/A N/A N/A N/A N/ATotal net assets as at 31 March 2017 . . . . . . . . . . . . . . . . . . . . . . . . . N/A N/A N/A N/A N/A N/A N/A
Net asset value per share as at 31 March 2016 . . . . . . . . . . . . . . . . N/A N/A N/A N/A N/A N/A N/ATotal net assets as at 31 March 2016 . . . . . . . . . . . . . . . . . . . . . . . . . N/A N/A N/A N/A N/A N/A N/A
Class I (CHF) Shares-distr. (hedged)Net asset value per share as at 31 March 2017 . . . . . . . . . . . . . . . . N/A N/A N/A N/A N/A N/A N/ATotal net assets as at 31 March 2017 . . . . . . . . . . . . . . . . . . . . . . . . . N/A N/A N/A N/A N/A N/A N/A
Net asset value per share as at 31 March 2016 . . . . . . . . . . . . . . . . N/A N/A N/A N/A N/A N/A N/ATotal net assets as at 31 March 2016 . . . . . . . . . . . . . . . . . . . . . . . . . N/A N/A N/A N/A N/A N/A N/A
Class I (EUR) Shares-acc.Net asset value per share as at 30 September 2017
(unaudited) . . . . . . . . . . . . . . . . . . . . . . . . . . . . . . . . . . . . . . . . . . . . . 273.87 97.14 111.25 100.72 N/A 113.51 N/ATotal net assets as at 30 September 2017 (unaudited) . . . . . . . . . . 85,995 109,139,121 98,901 9,065 N/A 11,351 N/A
Net asset value per share as at 31 March 2017 . . . . . . . . . . . . . . . . 247.12 93.28 114.52 N/A N/A 113.24 N/ATotal net assets as at 31 March 2017 . . . . . . . . . . . . . . . . . . . . . . . . . 87,975 104,577,607 2,702,787 N/A N/A 11,324 N/A
Net asset value per share as at 31 March 2016 . . . . . . . . . . . . . . . . 204.92 72.67 95.13 N/A 106.09 N/A N/ATotal net assets as at 31 March 2016 . . . . . . . . . . . . . . . . . . . . . . . . . 81,148 88,151,399 798,521 N/A 10,609 N/A N/A
Class I (EUR) Shares-acc. (hedged)Net asset value per share as at 30 September 2017
(unaudited) . . . . . . . . . . . . . . . . . . . . . . . . . . . . . . . . . . . . . . . . . . . . . N/A N/A N/A N/A N/A N/A N/ATotal net assets as at 30 September 2017 (unaudited) . . . . . . . . . . N/A N/A N/A N/A N/A N/A N/A
Net asset value per share as at 31 March 2017 . . . . . . . . . . . . . . . . N/A N/A N/A N/A N/A N/A N/ATotal net assets as at 31 March 2017 . . . . . . . . . . . . . . . . . . . . . . . . . N/A N/A N/A N/A N/A N/A N/A
Net asset value per share as at 31 March 2016 . . . . . . . . . . . . . . . . N/A N/A N/A N/A N/A N/A N/ATotal net assets as at 31 March 2016 . . . . . . . . . . . . . . . . . . . . . . . . . N/A N/A N/A N/A N/A N/A N/A
* The Sub-Fund commenced operations on 19 June 2017.** The Sub-Fund commenced operations on 30 June 2016.*** The Sub-Fund commenced operations on 31 July 2017.**** The Sub-Fund commenced operations on 16 June 2017.***** The Sub-Fund commenced operations on 15 December 2016.
The accompanying notes are an integral part of these financial statements.
China Equity Fund, EUR Investment Grade Credit Fund, Global Long/Short Equity Fund, Global Low Volatility Equity Fund, Global Opportunity Bond Fund, U.S.
Dollar Short-Term Money Market Fund and USD Investment Grade Credit Fund have not been authorised by the Hong Kong Securities and Futures Commission
and are not available for investment by Hong Kong retail investors.
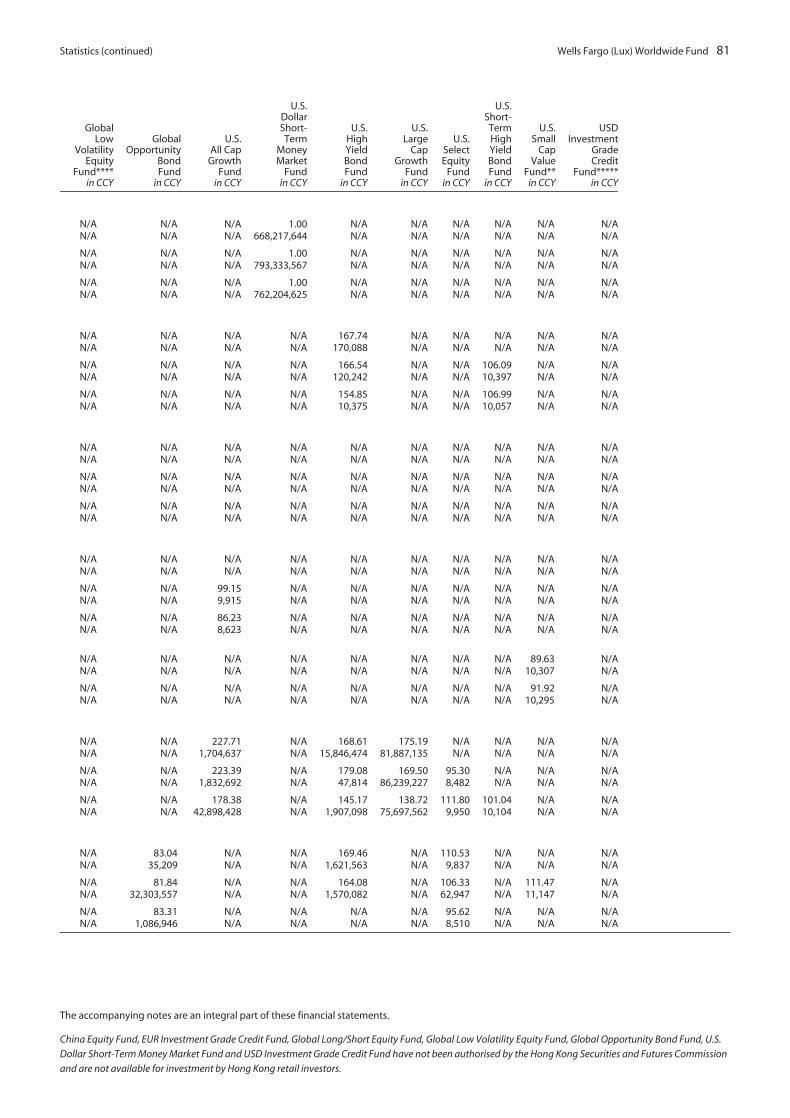
Statistics (continued) Wells Fargo (Lux) Worldwide Fund 81
GlobalLow
VolatilityEquity
Fund****in CCY
GlobalOpportunity
BondFund
in CCY
U.S.All Cap
GrowthFund
in CCY
U.S.DollarShort-Term
MoneyMarket
Fundin CCY
U.S.HighYieldBondFund
in CCY
U.S.Large
CapGrowth
Fundin CCY
U.S.SelectEquity
Fundin CCY
U.S.Short-TermHighYieldBondFund
in CCY
U.S.Small
CapValue
Fund**in CCY
USDInvestment
GradeCredit
Fund*****in CCY
N/A N/A N/A 1.00 N/A N/A N/A N/A N/A N/AN/A N/A N/A 668,217,644 N/A N/A N/A N/A N/A N/A
N/A N/A N/A 1.00 N/A N/A N/A N/A N/A N/AN/A N/A N/A 793,333,567 N/A N/A N/A N/A N/A N/A
N/A N/A N/A 1.00 N/A N/A N/A N/A N/A N/AN/A N/A N/A 762,204,625 N/A N/A N/A N/A N/A N/A
N/A N/A N/A N/A 167.74 N/A N/A N/A N/A N/AN/A N/A N/A N/A 170,088 N/A N/A N/A N/A N/A
N/A N/A N/A N/A 166.54 N/A N/A 106.09 N/A N/AN/A N/A N/A N/A 120,242 N/A N/A 10,397 N/A N/A
N/A N/A N/A N/A 154.85 N/A N/A 106.99 N/A N/AN/A N/A N/A N/A 10,375 N/A N/A 10,057 N/A N/A
N/A N/A N/A N/A N/A N/A N/A N/A N/A N/AN/A N/A N/A N/A N/A N/A N/A N/A N/A N/A
N/A N/A N/A N/A N/A N/A N/A N/A N/A N/AN/A N/A N/A N/A N/A N/A N/A N/A N/A N/A
N/A N/A N/A N/A N/A N/A N/A N/A N/A N/AN/A N/A N/A N/A N/A N/A N/A N/A N/A N/A
N/A N/A N/A N/A N/A N/A N/A N/A N/A N/AN/A N/A N/A N/A N/A N/A N/A N/A N/A N/A
N/A N/A 99.15 N/A N/A N/A N/A N/A N/A N/AN/A N/A 9,915 N/A N/A N/A N/A N/A N/A N/A
N/A N/A 86.23 N/A N/A N/A N/A N/A N/A N/AN/A N/A 8,623 N/A N/A N/A N/A N/A N/A N/A
N/A N/A N/A N/A N/A N/A N/A N/A 89.63 N/AN/A N/A N/A N/A N/A N/A N/A N/A 10,307 N/A
N/A N/A N/A N/A N/A N/A N/A N/A 91.92 N/AN/A N/A N/A N/A N/A N/A N/A N/A 10,295 N/A
N/A N/A 227.71 N/A 168.61 175.19 N/A N/A N/A N/AN/A N/A 1,704,637 N/A 15,846,474 81,887,135 N/A N/A N/A N/A
N/A N/A 223.39 N/A 179.08 169.50 95.30 N/A N/A N/AN/A N/A 1,832,692 N/A 47,814 86,239,227 8,482 N/A N/A N/A
N/A N/A 178.38 N/A 145.17 138.72 111.80 101.04 N/A N/AN/A N/A 42,898,428 N/A 1,907,098 75,697,562 9,950 10,104 N/A N/A
N/A 83.04 N/A N/A 169.46 N/A 110.53 N/A N/A N/AN/A 35,209 N/A N/A 1,621,563 N/A 9,837 N/A N/A N/A
N/A 81.84 N/A N/A 164.08 N/A 106.33 N/A 111.47 N/AN/A 32,303,557 N/A N/A 1,570,082 N/A 62,947 N/A 11,147 N/A
N/A 83.31 N/A N/A N/A N/A 95.62 N/A N/A N/AN/A 1,086,946 N/A N/A N/A N/A 8,510 N/A N/A N/A
The accompanying notes are an integral part of these financial statements.
China Equity Fund, EUR Investment Grade Credit Fund, Global Long/Short Equity Fund, Global Low Volatility Equity Fund, Global Opportunity Bond Fund, U.S.
Dollar Short-Term Money Market Fund and USD Investment Grade Credit Fund have not been authorised by the Hong Kong Securities and Futures Commission
and are not available for investment by Hong Kong retail investors.
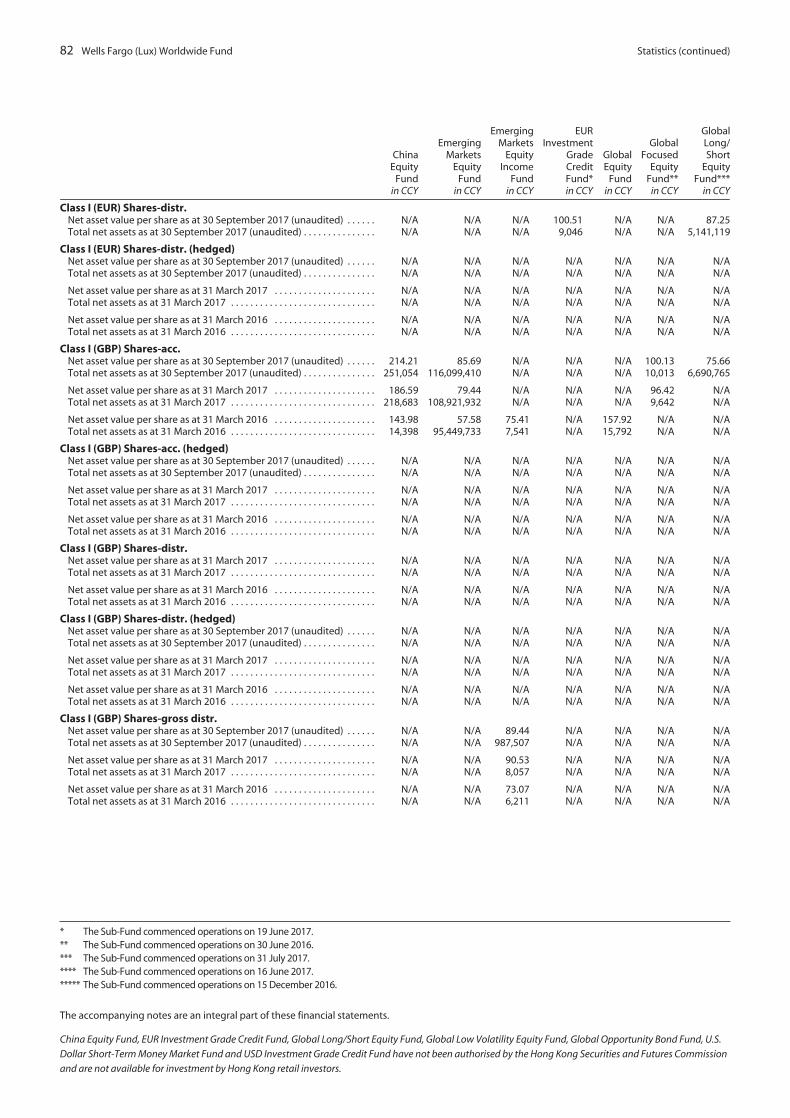
82 Wells Fargo (Lux) Worldwide Fund Statistics (continued)
ChinaEquity
Fundin CCY
EmergingMarkets
EquityFund
in CCY
EmergingMarkets
EquityIncome
Fundin CCY
EURInvestment
GradeCreditFund*in CCY
GlobalEquity
Fundin CCY
GlobalFocused
EquityFund**
in CCY
GlobalLong/Short
EquityFund***
in CCY
Class I (EUR) Shares-distr.Net asset value per share as at 30 September 2017 (unaudited) . . . . . . N/A N/A N/A 100.51 N/A N/A 87.25Total net assets as at 30 September 2017 (unaudited) . . . . . . . . . . . . . . . N/A N/A N/A 9,046 N/A N/A 5,141,119
Class I (EUR) Shares-distr. (hedged)Net asset value per share as at 30 September 2017 (unaudited) . . . . . . N/A N/A N/A N/A N/A N/A N/ATotal net assets as at 30 September 2017 (unaudited) . . . . . . . . . . . . . . . N/A N/A N/A N/A N/A N/A N/A
Net asset value per share as at 31 March 2017 . . . . . . . . . . . . . . . . . . . . . N/A N/A N/A N/A N/A N/A N/ATotal net assets as at 31 March 2017 . . . . . . . . . . . . . . . . . . . . . . . . . . . . . . N/A N/A N/A N/A N/A N/A N/A
Net asset value per share as at 31 March 2016 . . . . . . . . . . . . . . . . . . . . . N/A N/A N/A N/A N/A N/A N/ATotal net assets as at 31 March 2016 . . . . . . . . . . . . . . . . . . . . . . . . . . . . . . N/A N/A N/A N/A N/A N/A N/A
Class I (GBP) Shares-acc.Net asset value per share as at 30 September 2017 (unaudited) . . . . . . 214.21 85.69 N/A N/A N/A 100.13 75.66Total net assets as at 30 September 2017 (unaudited) . . . . . . . . . . . . . . . 251,054 116,099,410 N/A N/A N/A 10,013 6,690,765
Net asset value per share as at 31 March 2017 . . . . . . . . . . . . . . . . . . . . . 186.59 79.44 N/A N/A N/A 96.42 N/ATotal net assets as at 31 March 2017 . . . . . . . . . . . . . . . . . . . . . . . . . . . . . . 218,683 108,921,932 N/A N/A N/A 9,642 N/A
Net asset value per share as at 31 March 2016 . . . . . . . . . . . . . . . . . . . . . 143.98 57.58 75.41 N/A 157.92 N/A N/ATotal net assets as at 31 March 2016 . . . . . . . . . . . . . . . . . . . . . . . . . . . . . . 14,398 95,449,733 7,541 N/A 15,792 N/A N/A
Class I (GBP) Shares-acc. (hedged)Net asset value per share as at 30 September 2017 (unaudited) . . . . . . N/A N/A N/A N/A N/A N/A N/ATotal net assets as at 30 September 2017 (unaudited) . . . . . . . . . . . . . . . N/A N/A N/A N/A N/A N/A N/A
Net asset value per share as at 31 March 2017 . . . . . . . . . . . . . . . . . . . . . N/A N/A N/A N/A N/A N/A N/ATotal net assets as at 31 March 2017 . . . . . . . . . . . . . . . . . . . . . . . . . . . . . . N/A N/A N/A N/A N/A N/A N/A
Net asset value per share as at 31 March 2016 . . . . . . . . . . . . . . . . . . . . . N/A N/A N/A N/A N/A N/A N/ATotal net assets as at 31 March 2016 . . . . . . . . . . . . . . . . . . . . . . . . . . . . . . N/A N/A N/A N/A N/A N/A N/A
Class I (GBP) Shares-distr.Net asset value per share as at 31 March 2017 . . . . . . . . . . . . . . . . . . . . . N/A N/A N/A N/A N/A N/A N/ATotal net assets as at 31 March 2017 . . . . . . . . . . . . . . . . . . . . . . . . . . . . . . N/A N/A N/A N/A N/A N/A N/A
Net asset value per share as at 31 March 2016 . . . . . . . . . . . . . . . . . . . . . N/A N/A N/A N/A N/A N/A N/ATotal net assets as at 31 March 2016 . . . . . . . . . . . . . . . . . . . . . . . . . . . . . . N/A N/A N/A N/A N/A N/A N/A
Class I (GBP) Shares-distr. (hedged)Net asset value per share as at 30 September 2017 (unaudited) . . . . . . N/A N/A N/A N/A N/A N/A N/ATotal net assets as at 30 September 2017 (unaudited) . . . . . . . . . . . . . . . N/A N/A N/A N/A N/A N/A N/A
Net asset value per share as at 31 March 2017 . . . . . . . . . . . . . . . . . . . . . N/A N/A N/A N/A N/A N/A N/ATotal net assets as at 31 March 2017 . . . . . . . . . . . . . . . . . . . . . . . . . . . . . . N/A N/A N/A N/A N/A N/A N/A
Net asset value per share as at 31 March 2016 . . . . . . . . . . . . . . . . . . . . . N/A N/A N/A N/A N/A N/A N/ATotal net assets as at 31 March 2016 . . . . . . . . . . . . . . . . . . . . . . . . . . . . . . N/A N/A N/A N/A N/A N/A N/A
Class I (GBP) Shares-gross distr.Net asset value per share as at 30 September 2017 (unaudited) . . . . . . N/A N/A 89.44 N/A N/A N/A N/ATotal net assets as at 30 September 2017 (unaudited) . . . . . . . . . . . . . . . N/A N/A 987,507 N/A N/A N/A N/A
Net asset value per share as at 31 March 2017 . . . . . . . . . . . . . . . . . . . . . N/A N/A 90.53 N/A N/A N/A N/ATotal net assets as at 31 March 2017 . . . . . . . . . . . . . . . . . . . . . . . . . . . . . . N/A N/A 8,057 N/A N/A N/A N/A
Net asset value per share as at 31 March 2016 . . . . . . . . . . . . . . . . . . . . . N/A N/A 73.07 N/A N/A N/A N/ATotal net assets as at 31 March 2016 . . . . . . . . . . . . . . . . . . . . . . . . . . . . . . N/A N/A 6,211 N/A N/A N/A N/A
* The Sub-Fund commenced operations on 19 June 2017.** The Sub-Fund commenced operations on 30 June 2016.*** The Sub-Fund commenced operations on 31 July 2017.**** The Sub-Fund commenced operations on 16 June 2017.***** The Sub-Fund commenced operations on 15 December 2016.
The accompanying notes are an integral part of these financial statements.
China Equity Fund, EUR Investment Grade Credit Fund, Global Long/Short Equity Fund, Global Low Volatility Equity Fund, Global Opportunity Bond Fund, U.S.
Dollar Short-Term Money Market Fund and USD Investment Grade Credit Fund have not been authorised by the Hong Kong Securities and Futures Commission
and are not available for investment by Hong Kong retail investors.
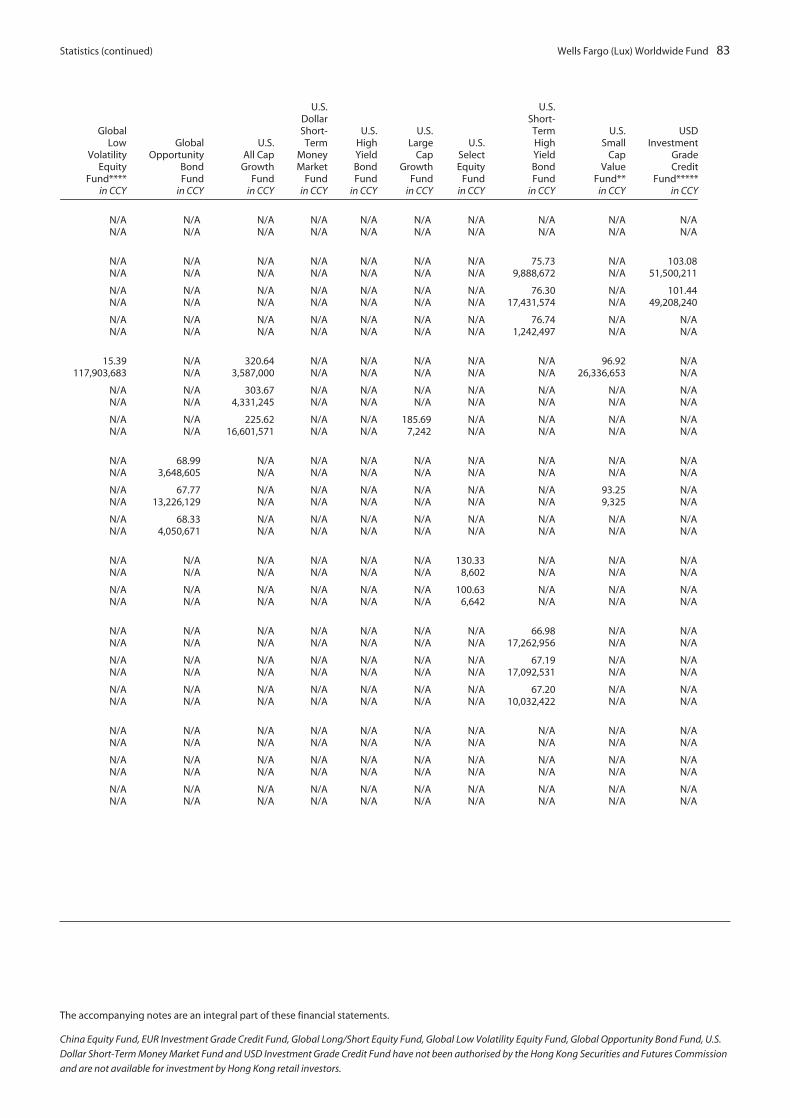
Statistics (continued) Wells Fargo (Lux) Worldwide Fund 83
GlobalLow
VolatilityEquity
Fund****in CCY
GlobalOpportunity
BondFund
in CCY
U.S.All Cap
GrowthFund
in CCY
U.S.DollarShort-Term
MoneyMarket
Fundin CCY
U.S.HighYieldBondFund
in CCY
U.S.Large
CapGrowth
Fundin CCY
U.S.SelectEquity
Fundin CCY
U.S.Short-TermHighYieldBondFund
in CCY
U.S.Small
CapValue
Fund**in CCY
USDInvestment
GradeCredit
Fund*****in CCY
N/A N/A N/A N/A N/A N/A N/A N/A N/A N/AN/A N/A N/A N/A N/A N/A N/A N/A N/A N/A
N/A N/A N/A N/A N/A N/A N/A 75.73 N/A 103.08N/A N/A N/A N/A N/A N/A N/A 9,888,672 N/A 51,500,211
N/A N/A N/A N/A N/A N/A N/A 76.30 N/A 101.44N/A N/A N/A N/A N/A N/A N/A 17,431,574 N/A 49,208,240
N/A N/A N/A N/A N/A N/A N/A 76.74 N/A N/AN/A N/A N/A N/A N/A N/A N/A 1,242,497 N/A N/A
15.39 N/A 320.64 N/A N/A N/A N/A N/A 96.92 N/A117,903,683 N/A 3,587,000 N/A N/A N/A N/A N/A 26,336,653 N/A
N/A N/A 303.67 N/A N/A N/A N/A N/A N/A N/AN/A N/A 4,331,245 N/A N/A N/A N/A N/A N/A N/A
N/A N/A 225.62 N/A N/A 185.69 N/A N/A N/A N/AN/A N/A 16,601,571 N/A N/A 7,242 N/A N/A N/A N/A
N/A 68.99 N/A N/A N/A N/A N/A N/A N/A N/AN/A 3,648,605 N/A N/A N/A N/A N/A N/A N/A N/A
N/A 67.77 N/A N/A N/A N/A N/A N/A 93.25 N/AN/A 13,226,129 N/A N/A N/A N/A N/A N/A 9,325 N/A
N/A 68.33 N/A N/A N/A N/A N/A N/A N/A N/AN/A 4,050,671 N/A N/A N/A N/A N/A N/A N/A N/A
N/A N/A N/A N/A N/A N/A 130.33 N/A N/A N/AN/A N/A N/A N/A N/A N/A 8,602 N/A N/A N/A
N/A N/A N/A N/A N/A N/A 100.63 N/A N/A N/AN/A N/A N/A N/A N/A N/A 6,642 N/A N/A N/A
N/A N/A N/A N/A N/A N/A N/A 66.98 N/A N/AN/A N/A N/A N/A N/A N/A N/A 17,262,956 N/A N/A
N/A N/A N/A N/A N/A N/A N/A 67.19 N/A N/AN/A N/A N/A N/A N/A N/A N/A 17,092,531 N/A N/A
N/A N/A N/A N/A N/A N/A N/A 67.20 N/A N/AN/A N/A N/A N/A N/A N/A N/A 10,032,422 N/A N/A
N/A N/A N/A N/A N/A N/A N/A N/A N/A N/AN/A N/A N/A N/A N/A N/A N/A N/A N/A N/A
N/A N/A N/A N/A N/A N/A N/A N/A N/A N/AN/A N/A N/A N/A N/A N/A N/A N/A N/A N/A
N/A N/A N/A N/A N/A N/A N/A N/A N/A N/AN/A N/A N/A N/A N/A N/A N/A N/A N/A N/A
The accompanying notes are an integral part of these financial statements.
China Equity Fund, EUR Investment Grade Credit Fund, Global Long/Short Equity Fund, Global Low Volatility Equity Fund, Global Opportunity Bond Fund, U.S.
Dollar Short-Term Money Market Fund and USD Investment Grade Credit Fund have not been authorised by the Hong Kong Securities and Futures Commission
and are not available for investment by Hong Kong retail investors.

84 Wells Fargo (Lux) Worldwide Fund Statistics (continued)
ChinaEquity
Fundin CCY
EmergingMarkets
EquityFund
in CCY
EmergingMarkets
EquityIncome
Fundin CCY
EURInvestment
GradeCreditFund*in CCY
GlobalEquity
Fundin CCY
GlobalFocused
EquityFund**
in CCY
GlobalLong/Short
EquityFund***
in CCY
Class I (NOK) Shares-acc. (hedged)Net asset value per share as at 31 March 2017 . . . . . . . . . . . . N/A N/A N/A N/A N/A N/A N/ATotal net assets as at 31 March 2017 . . . . . . . . . . . . . . . . . . . . . N/A N/A N/A N/A N/A N/A N/A
Net asset value per share as at 31 March 2016 . . . . . . . . . . . . N/A N/A N/A N/A N/A N/A N/ATotal net assets as at 31 March 2016 . . . . . . . . . . . . . . . . . . . . . N/A N/A N/A N/A N/A N/A N/A
Class I (USD) Shares-acc.Net asset value per share as at 30 September 2017
(unaudited) . . . . . . . . . . . . . . . . . . . . . . . . . . . . . . . . . . . . . . . . . 323.69 114.88 131.47 N/A 155.32 134.17 103.13Total net assets as at 30 September 2017 (unaudited) . . . . . 38,990,403 550,964 411,365,554 N/A 131,762,460 13,363,332 60,445,834
Net asset value per share as at 31 March 2017 . . . . . . . . . . . . 263.62 99.58 122.16 N/A 139.88 120.80 N/ATotal net assets as at 31 March 2017 . . . . . . . . . . . . . . . . . . . . . 46,589,035 477,586 380,147,872 N/A 122,499,350 12,031,680 N/A
Net asset value per share as at 31 March 2016 . . . . . . . . . . . . 233.18 82.74 108.24 N/A 120.70 N/A N/ATotal net assets as at 31 March 2016 . . . . . . . . . . . . . . . . . . . . . 35,312,546 520,600 172,895,216 N/A 130,381,951 N/A N/A
Class I (USD) Shares-distr.Net asset value per share as at 30 September 2017
(unaudited) . . . . . . . . . . . . . . . . . . . . . . . . . . . . . . . . . . . . . . . . . N/A N/A N/A N/A N/A N/A N/ATotal net assets as at 30 September 2017 (unaudited) . . . . . N/A N/A N/A N/A N/A N/A N/A
Net asset value per share as at 31 March 2017 . . . . . . . . . . . . N/A N/A N/A N/A N/A N/A N/ATotal net assets as at 31 March 2017 . . . . . . . . . . . . . . . . . . . . . N/A N/A N/A N/A N/A N/A N/A
Net asset value per share as at 31 March 2016 . . . . . . . . . . . . N/A N/A N/A N/A N/A N/A N/ATotal net assets as at 31 March 2016 . . . . . . . . . . . . . . . . . . . . . N/A N/A N/A N/A N/A N/A N/A
Class I (USD) Shares-gross distr.Net asset value per share as at 30 September 2017
(unaudited) . . . . . . . . . . . . . . . . . . . . . . . . . . . . . . . . . . . . . . . . . N/A N/A 122.42 N/A N/A N/A N/ATotal net assets as at 30 September 2017 (unaudited) . . . . . N/A N/A 13,344 N/A N/A N/A N/A
Net asset value per share as at 31 March 2017 . . . . . . . . . . . . N/A N/A 116.92 N/A 139.60 N/A N/ATotal net assets as at 31 March 2017 . . . . . . . . . . . . . . . . . . . . . N/A N/A 12,394 N/A 12,424 N/A N/A
Net asset value per share as at 31 March 2016 . . . . . . . . . . . . N/A N/A 108.28 N/A 120.71 N/A N/ATotal net assets as at 31 March 2016 . . . . . . . . . . . . . . . . . . . . . N/A N/A 10,936 N/A 10,743 N/A N/A
Class X (GBP) Shares-distr.Net asset value per share as at 30 September 2017
(unaudited) . . . . . . . . . . . . . . . . . . . . . . . . . . . . . . . . . . . . . . . . . N/A N/A N/A N/A N/A N/A N/ATotal net assets as at 30 September 2017 (unaudited) . . . . . N/A N/A N/A N/A N/A N/A N/A
Net asset value per share as at 31 March 2017 . . . . . . . . . . . . N/A N/A N/A N/A N/A N/A N/ATotal net assets as at 31 March 2017 . . . . . . . . . . . . . . . . . . . . . N/A N/A N/A N/A N/A N/A N/A
Net asset value per share as at 31 March 2016 . . . . . . . . . . . . N/A N/A N/A N/A N/A N/A N/ATotal net assets as at 31 March 2016 . . . . . . . . . . . . . . . . . . . . . N/A N/A N/A N/A N/A N/A N/A
Class X (USD) Shares-distr.Net asset value per share as at 30 September 2017
(unaudited) . . . . . . . . . . . . . . . . . . . . . . . . . . . . . . . . . . . . . . . . . N/A N/A N/A N/A N/A N/A N/ATotal net assets as at 30 September 2017 (unaudited) . . . . . N/A N/A N/A N/A N/A N/A N/A
Net asset value per share as at 31 March 2017 . . . . . . . . . . . . N/A N/A N/A N/A N/A N/A N/ATotal net assets as at 31 March 2017 . . . . . . . . . . . . . . . . . . . . . N/A N/A N/A N/A N/A N/A N/A
Net asset value per share as at 31 March 2016 . . . . . . . . . . . . N/A N/A N/A N/A N/A N/A N/ATotal net assets as at 31 March 2016 . . . . . . . . . . . . . . . . . . . . . N/A N/A N/A N/A N/A N/A N/A
* The Sub-Fund commenced operations on 19 June 2017.** The Sub-Fund commenced operations on 30 June 2016.*** The Sub-Fund commenced operations on 31 July 2017.**** The Sub-Fund commenced operations on 16 June 2017.***** The Sub-Fund commenced operations on 15 December 2016.
The accompanying notes are an integral part of these financial statements.
China Equity Fund, EUR Investment Grade Credit Fund, Global Long/Short Equity Fund, Global Low Volatility Equity Fund, Global Opportunity Bond Fund, U.S.
Dollar Short-Term Money Market Fund and USD Investment Grade Credit Fund have not been authorised by the Hong Kong Securities and Futures Commission
and are not available for investment by Hong Kong retail investors.
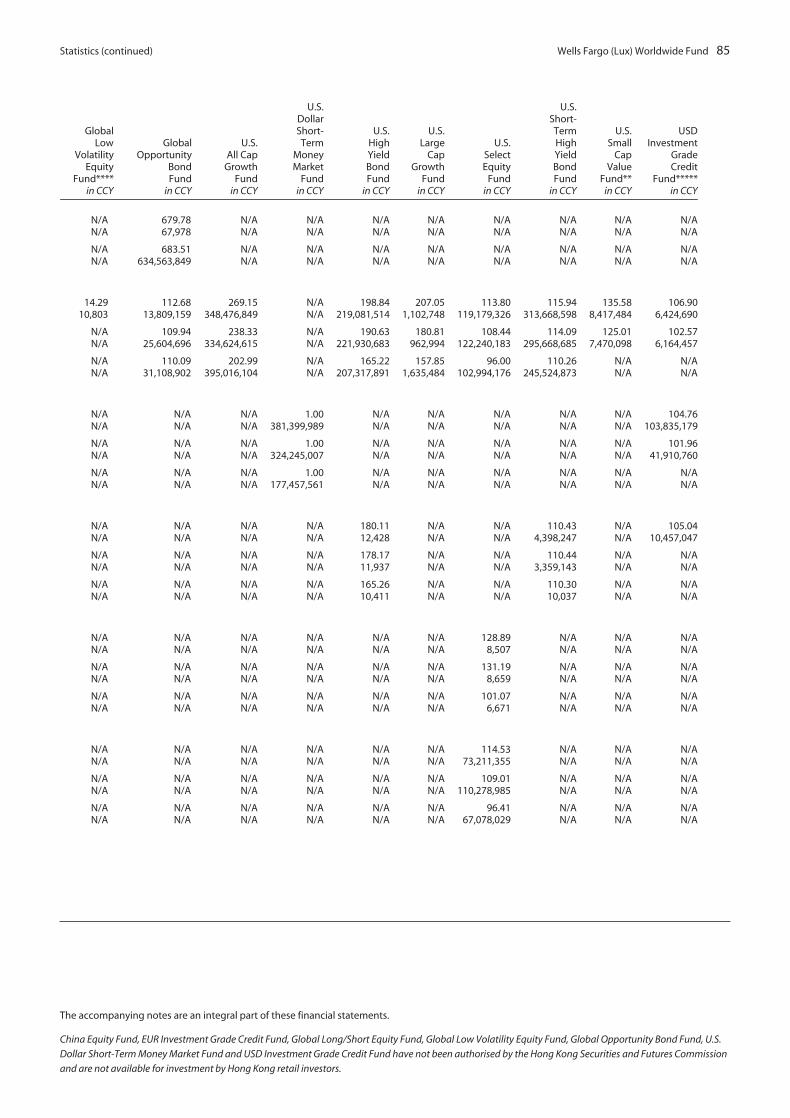
Statistics (continued) Wells Fargo (Lux) Worldwide Fund 85
GlobalLow
VolatilityEquity
Fund****in CCY
GlobalOpportunity
BondFund
in CCY
U.S.All Cap
GrowthFund
in CCY
U.S.DollarShort-Term
MoneyMarket
Fundin CCY
U.S.HighYieldBondFund
in CCY
U.S.Large
CapGrowth
Fundin CCY
U.S.SelectEquity
Fundin CCY
U.S.Short-TermHighYieldBondFund
in CCY
U.S.Small
CapValue
Fund**in CCY
USDInvestment
GradeCredit
Fund*****in CCY
N/A 679.78 N/A N/A N/A N/A N/A N/A N/A N/AN/A 67,978 N/A N/A N/A N/A N/A N/A N/A N/A
N/A 683.51 N/A N/A N/A N/A N/A N/A N/A N/AN/A 634,563,849 N/A N/A N/A N/A N/A N/A N/A N/A
14.29 112.68 269.15 N/A 198.84 207.05 113.80 115.94 135.58 106.9010,803 13,809,159 348,476,849 N/A 219,081,514 1,102,748 119,179,326 313,668,598 8,417,484 6,424,690
N/A 109.94 238.33 N/A 190.63 180.81 108.44 114.09 125.01 102.57N/A 25,604,696 334,624,615 N/A 221,930,683 962,994 122,240,183 295,668,685 7,470,098 6,164,457
N/A 110.09 202.99 N/A 165.22 157.85 96.00 110.26 N/A N/AN/A 31,108,902 395,016,104 N/A 207,317,891 1,635,484 102,994,176 245,524,873 N/A N/A
N/A N/A N/A 1.00 N/A N/A N/A N/A N/A 104.76N/A N/A N/A 381,399,989 N/A N/A N/A N/A N/A 103,835,179
N/A N/A N/A 1.00 N/A N/A N/A N/A N/A 101.96N/A N/A N/A 324,245,007 N/A N/A N/A N/A N/A 41,910,760
N/A N/A N/A 1.00 N/A N/A N/A N/A N/A N/AN/A N/A N/A 177,457,561 N/A N/A N/A N/A N/A N/A
N/A N/A N/A N/A 180.11 N/A N/A 110.43 N/A 105.04N/A N/A N/A N/A 12,428 N/A N/A 4,398,247 N/A 10,457,047
N/A N/A N/A N/A 178.17 N/A N/A 110.44 N/A N/AN/A N/A N/A N/A 11,937 N/A N/A 3,359,143 N/A N/A
N/A N/A N/A N/A 165.26 N/A N/A 110.30 N/A N/AN/A N/A N/A N/A 10,411 N/A N/A 10,037 N/A N/A
N/A N/A N/A N/A N/A N/A 128.89 N/A N/A N/AN/A N/A N/A N/A N/A N/A 8,507 N/A N/A N/A
N/A N/A N/A N/A N/A N/A 131.19 N/A N/A N/AN/A N/A N/A N/A N/A N/A 8,659 N/A N/A N/A
N/A N/A N/A N/A N/A N/A 101.07 N/A N/A N/AN/A N/A N/A N/A N/A N/A 6,671 N/A N/A N/A
N/A N/A N/A N/A N/A N/A 114.53 N/A N/A N/AN/A N/A N/A N/A N/A N/A 73,211,355 N/A N/A N/A
N/A N/A N/A N/A N/A N/A 109.01 N/A N/A N/AN/A N/A N/A N/A N/A N/A 110,278,985 N/A N/A N/A
N/A N/A N/A N/A N/A N/A 96.41 N/A N/A N/AN/A N/A N/A N/A N/A N/A 67,078,029 N/A N/A N/A
The accompanying notes are an integral part of these financial statements.
China Equity Fund, EUR Investment Grade Credit Fund, Global Long/Short Equity Fund, Global Low Volatility Equity Fund, Global Opportunity Bond Fund, U.S.
Dollar Short-Term Money Market Fund and USD Investment Grade Credit Fund have not been authorised by the Hong Kong Securities and Futures Commission
and are not available for investment by Hong Kong retail investors.

86 Wells Fargo (Lux) Worldwide Fund Statistics (continued)
ChinaEquity
Fundin CCY
EmergingMarkets
EquityFund
in CCY
EmergingMarkets
EquityIncome
Fundin CCY
EURInvestment
GradeCreditFund*in CCY
GlobalEquity
Fundin CCY
GlobalFocused
EquityFund**
in CCY
GlobalLong/Short
EquityFund***
in CCY
Class Z (GBP) Shares-acc.Net asset value per share as at 30 September 2017 (unaudited) . . . . 207.92 N/A 98.28 N/A 212.25 100.13 N/ATotal net assets as at 30 September 2017 (unaudited) . . . . . . . . . . . . 46,366 N/A 9,042 N/A 168,102 10,013 N/A
Net asset value per share as at 31 March 2017 . . . . . . . . . . . . . . . . . . . 181.10 N/A 97.61 N/A 204.47 96.42 N/ATotal net assets as at 31 March 2017 . . . . . . . . . . . . . . . . . . . . . . . . . . . . 43,826 N/A 57,785 N/A 183,410 9,642 N/A
Net asset value per share as at 31 March 2016 . . . . . . . . . . . . . . . . . . . 139.74 N/A 75.46 N/A 153.98 N/A N/ATotal net assets as at 31 March 2016 . . . . . . . . . . . . . . . . . . . . . . . . . . . . 74,342 N/A 188,122 N/A 204,177 N/A N/A
Class Z (GBP) Shares-acc. (hedged)Net asset value per share as at 30 September 2017 (unaudited) . . . . N/A N/A N/A N/A N/A N/A N/ATotal net assets as at 30 September 2017 (unaudited) . . . . . . . . . . . . N/A N/A N/A N/A N/A N/A N/A
Net asset value per share as at 31 March 2017 . . . . . . . . . . . . . . . . . . . N/A N/A N/A N/A N/A N/A N/ATotal net assets as at 31 March 2017 . . . . . . . . . . . . . . . . . . . . . . . . . . . . N/A N/A N/A N/A N/A N/A N/A
Net asset value per share as at 31 March 2016 . . . . . . . . . . . . . . . . . . . N/A N/A N/A N/A N/A N/A N/ATotal net assets as at 31 March 2016 . . . . . . . . . . . . . . . . . . . . . . . . . . . . N/A N/A N/A N/A N/A N/A N/A
Class Z (GBP) Shares-distr.Net asset value per share as at 30 September 2017 (unaudited) . . . . N/A N/A N/A N/A N/A N/A N/ATotal net assets as at 30 September 2017 (unaudited) . . . . . . . . . . . . N/A N/A N/A N/A N/A N/A N/A
Net asset value per share as at 31 March 2017 . . . . . . . . . . . . . . . . . . . N/A N/A N/A N/A N/A N/A N/ATotal net assets as at 31 March 2017 . . . . . . . . . . . . . . . . . . . . . . . . . . . . N/A N/A N/A N/A N/A N/A N/A
Net asset value per share as at 31 March 2016 . . . . . . . . . . . . . . . . . . . N/A N/A N/A N/A N/A N/A N/ATotal net assets as at 31 March 2016 . . . . . . . . . . . . . . . . . . . . . . . . . . . . N/A N/A N/A N/A N/A N/A N/A
Class Z (GBP) Shares-distr. (hedged)Net asset value per share as at 31 March 2016 . . . . . . . . . . . . . . . . . . . N/A N/A N/A N/A N/A N/A N/ATotal net assets as at 31 March 2016 . . . . . . . . . . . . . . . . . . . . . . . . . . . . N/A N/A N/A N/A N/A N/A N/A
Class Z (USD) Shares-acc.Net asset value per share as at 30 September 2017 (unaudited) . . . . N/A N/A N/A N/A N/A N/A N/ATotal net assets as at 30 September 2017 (unaudited) . . . . . . . . . . . . N/A N/A N/A N/A N/A N/A N/A
Net asset value per share as at 31 March 2017 . . . . . . . . . . . . . . . . . . . N/A N/A N/A N/A 134.96 N/A N/ATotal net assets as at 31 March 2017 . . . . . . . . . . . . . . . . . . . . . . . . . . . . N/A N/A N/A N/A 14,441 N/A N/A
Net asset value per share as at 31 March 2016 . . . . . . . . . . . . . . . . . . . 225.29 N/A 108.10 N/A 116.48 N/A N/ATotal net assets as at 31 March 2016 . . . . . . . . . . . . . . . . . . . . . . . . . . . . 12,842 N/A 9,945 N/A 12,463 N/A N/A
Class Z (USD) Shares-distr.Net asset value per share as at 30 September 2017 (unaudited) . . . . N/A N/A N/A N/A N/A N/A N/ATotal net assets as at 30 September 2017 (unaudited) . . . . . . . . . . . . N/A N/A N/A N/A N/A N/A N/A
Net asset value per share as at 31 March 2017 . . . . . . . . . . . . . . . . . . . N/A N/A N/A N/A N/A N/A N/ATotal net assets as at 31 March 2017 . . . . . . . . . . . . . . . . . . . . . . . . . . . . N/A N/A N/A N/A N/A N/A N/A
Net asset value per share as at 31 March 2016 . . . . . . . . . . . . . . . . . . . N/A N/A N/A N/A N/A N/A N/ATotal net assets as at 31 March 2016 . . . . . . . . . . . . . . . . . . . . . . . . . . . . N/A N/A N/A N/A N/A N/A N/A
Service Class (USD) Shares-distr.Net asset value per share as at 30 September 2017 (unaudited) . . . . N/A N/A N/A N/A N/A N/A N/ATotal net assets as at 30 September 2017 (unaudited) . . . . . . . . . . . . N/A N/A N/A N/A N/A N/A N/A
Net asset value per share as at 31 March 2017 . . . . . . . . . . . . . . . . . . . N/A N/A N/A N/A N/A N/A N/ATotal net assets as at 31 March 2017 . . . . . . . . . . . . . . . . . . . . . . . . . . . . N/A N/A N/A N/A N/A N/A N/A
Net asset value per share as at 31 March 2016 . . . . . . . . . . . . . . . . . . . N/A N/A N/A N/A N/A N/A N/ATotal net assets as at 31 March 2016 . . . . . . . . . . . . . . . . . . . . . . . . . . . . N/A N/A N/A N/A N/A N/A N/A
* The Sub-Fund commenced operations on 19 June 2017.** The Sub-Fund commenced operations on 30 June 2016.*** The Sub-Fund commenced operations on 31 July 2017.**** The Sub-Fund commenced operations on 16 June 2017.***** The Sub-Fund commenced operations on 15 December 2016.
The accompanying notes are an integral part of these financial statements.
China Equity Fund, EUR Investment Grade Credit Fund, Global Long/Short Equity Fund, Global Low Volatility Equity Fund, Global Opportunity Bond Fund, U.S.
Dollar Short-Term Money Market Fund and USD Investment Grade Credit Fund have not been authorised by the Hong Kong Securities and Futures Commission
and are not available for investment by Hong Kong retail investors.
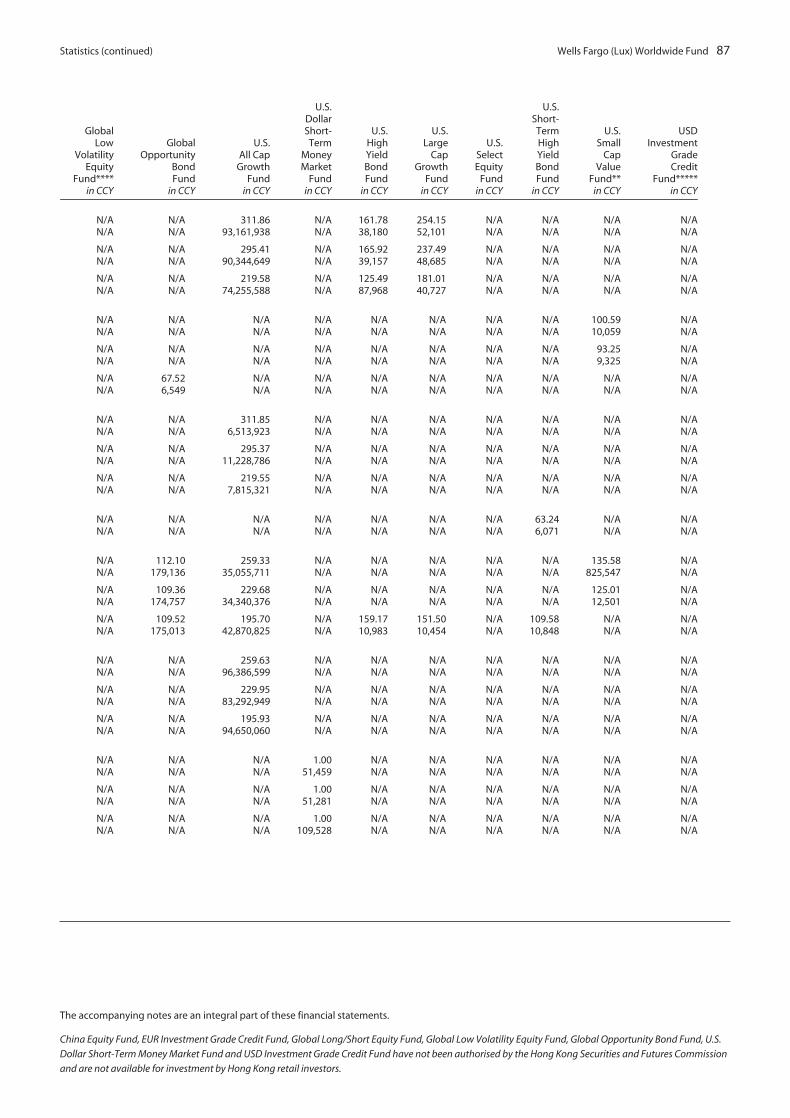
Statistics (continued) Wells Fargo (Lux) Worldwide Fund 87
GlobalLow
VolatilityEquity
Fund****in CCY
GlobalOpportunity
BondFund
in CCY
U.S.All Cap
GrowthFund
in CCY
U.S.DollarShort-Term
MoneyMarket
Fundin CCY
U.S.HighYieldBondFund
in CCY
U.S.Large
CapGrowth
Fundin CCY
U.S.SelectEquity
Fundin CCY
U.S.Short-TermHighYieldBondFund
in CCY
U.S.Small
CapValue
Fund**in CCY
USDInvestment
GradeCredit
Fund*****in CCY
N/A N/A 311.86 N/A 161.78 254.15 N/A N/A N/A N/AN/A N/A 93,161,938 N/A 38,180 52,101 N/A N/A N/A N/A
N/A N/A 295.41 N/A 165.92 237.49 N/A N/A N/A N/AN/A N/A 90,344,649 N/A 39,157 48,685 N/A N/A N/A N/A
N/A N/A 219.58 N/A 125.49 181.01 N/A N/A N/A N/AN/A N/A 74,255,588 N/A 87,968 40,727 N/A N/A N/A N/A
N/A N/A N/A N/A N/A N/A N/A N/A 100.59 N/AN/A N/A N/A N/A N/A N/A N/A N/A 10,059 N/A
N/A N/A N/A N/A N/A N/A N/A N/A 93.25 N/AN/A N/A N/A N/A N/A N/A N/A N/A 9,325 N/A
N/A 67.52 N/A N/A N/A N/A N/A N/A N/A N/AN/A 6,549 N/A N/A N/A N/A N/A N/A N/A N/A
N/A N/A 311.85 N/A N/A N/A N/A N/A N/A N/AN/A N/A 6,513,923 N/A N/A N/A N/A N/A N/A N/A
N/A N/A 295.37 N/A N/A N/A N/A N/A N/A N/AN/A N/A 11,228,786 N/A N/A N/A N/A N/A N/A N/A
N/A N/A 219.55 N/A N/A N/A N/A N/A N/A N/AN/A N/A 7,815,321 N/A N/A N/A N/A N/A N/A N/A
N/A N/A N/A N/A N/A N/A N/A 63.24 N/A N/AN/A N/A N/A N/A N/A N/A N/A 6,071 N/A N/A
N/A 112.10 259.33 N/A N/A N/A N/A N/A 135.58 N/AN/A 179,136 35,055,711 N/A N/A N/A N/A N/A 825,547 N/A
N/A 109.36 229.68 N/A N/A N/A N/A N/A 125.01 N/AN/A 174,757 34,340,376 N/A N/A N/A N/A N/A 12,501 N/A
N/A 109.52 195.70 N/A 159.17 151.50 N/A 109.58 N/A N/AN/A 175,013 42,870,825 N/A 10,983 10,454 N/A 10,848 N/A N/A
N/A N/A 259.63 N/A N/A N/A N/A N/A N/A N/AN/A N/A 96,386,599 N/A N/A N/A N/A N/A N/A N/A
N/A N/A 229.95 N/A N/A N/A N/A N/A N/A N/AN/A N/A 83,292,949 N/A N/A N/A N/A N/A N/A N/A
N/A N/A 195.93 N/A N/A N/A N/A N/A N/A N/AN/A N/A 94,650,060 N/A N/A N/A N/A N/A N/A N/A
N/A N/A N/A 1.00 N/A N/A N/A N/A N/A N/AN/A N/A N/A 51,459 N/A N/A N/A N/A N/A N/A
N/A N/A N/A 1.00 N/A N/A N/A N/A N/A N/AN/A N/A N/A 51,281 N/A N/A N/A N/A N/A N/A
N/A N/A N/A 1.00 N/A N/A N/A N/A N/A N/AN/A N/A N/A 109,528 N/A N/A N/A N/A N/A N/A
The accompanying notes are an integral part of these financial statements.
China Equity Fund, EUR Investment Grade Credit Fund, Global Long/Short Equity Fund, Global Low Volatility Equity Fund, Global Opportunity Bond Fund, U.S.
Dollar Short-Term Money Market Fund and USD Investment Grade Credit Fund have not been authorised by the Hong Kong Securities and Futures Commission
and are not available for investment by Hong Kong retail investors.

88 Wells Fargo (Lux) Worldwide Fund Notes to financial statements (unaudited)
1. ORGANISATION
Wells Fargo (Lux) Worldwide Fund (the “Fund”) was incorporated for an unlimited period on 20 March 2008 as a sociétéanonyme under the laws of the Grand Duchy of Luxembourg and qualifies as an open-ended Société d’Investissement àCapital Variable under part I of the Grand Duchy of Luxembourg law dated 17 December 2010 concerning undertakingsfor collective investment, as amended. The Fund is registered with the Registre de Commerce et des Sociétés ofLuxembourg under Number B 137.479.
The Fund has adopted an umbrella structure, which allows its capital to be divided into different portfolios of securitiesand other assets permitted by law with specific investment objectives and various risk or other characteristics (each a“Sub-Fund”, collectively the “Sub-Funds”).
EUR Investment Grade Credit Fund and Global Low Volatility Fund commenced operations on 19 June 2017. Global Long/Short Equity Fund commenced operations on 31 July 2017.
Global Long/Short Equity Fund, Class I (GBP) Shares-acc. commenced operations on 31 August 2017, U.S. Small Cap ValueFund, Class I (GBP) Shares-acc. commenced operations on 26 April 2017 and USD Investment Grade Credit Fund, Class I(USD) Shares-gross distr. commenced operations on 24 August 2017.
Global Opportunity Bond Fund, Class A (EUR) Shares-acc. (hedged) was re-opened on 19 April 2017.
On 21 September 2017, the following share classes were redeemed and closed:
Sub-Fund Share Class
Global Equity Fund Class I (USD) Shares-gross distr.
Class Z (USD) Shares-acc.
Global Focused Equity Fund Class A (USD) Shares-acc.
Global Opportunity Bond Fund Class I (NOK) Shares-acc. (hedged)
U.S. All Cap Growth Fund Class I (CHF) Shares-acc. (hedged)
U.S. Select Equity Fund Class A (EUR) Shares-acc. (hedged)
Class A (GBP) Shares-distr.
Class I (EUR) Shares-acc.
Class I (GBP) Shares-distr.
U.S. Short-Term High Yield Bond Fund Class A (EUR) Shares-acc. (hedged)
Class A (USD) Shares-gross distr.
U.S. Small Cap Value Fund Class A (EUR) Shares-acc. (hedged)
Class A (USD) Shares-acc.
Class I (EUR) Shares-acc. (hedged)
Class I (GBP) Shares-acc. (hedged)
China Equity Fund, EUR Investment Grade Credit Fund, Global Long/Short Equity Fund, Global Low Volatility Equity Fund, Global Opportunity Bond Fund, U.S.
Dollar Short-Term Money Market Fund and USD Investment Grade Credit Fund have not been authorised by the Hong Kong Securities and Futures Commission
and are not available for investment by Hong Kong retail investors.

Notes to financial statements (unaudited) Wells Fargo (Lux) Worldwide Fund 89
As at 30 September 2017, the Fund had seventeen Sub-Funds which have the following classes available:
ChinaEquityFund
EmergingMarketsEquityFund
EmergingMarketsEquity
IncomeFund
EURInvestment
GradeCreditFund
GlobalEquityFund
GlobalFocused
EquityFund
Class A (EUR)Shares-acc. N/A N/A N/A N/A N/A N/A
Class A (EUR)Shares-acc. (hedged) N/A N/A N/A N/A N/A N/A
Class A (GBP) Shares-acc. N/A � N/A N/A N/A N/A
Class A (SEK) Shares-acc. � N/A N/A N/A N/A N/A
Class A (USD) Shares-acc. � � � N/A � N/A
Class A (USD) Shares-distr. N/A N/A N/A N/A N/A N/A
Class A (USD) Shares-gross distr. N/A N/A � N/A N/A N/A
Class I (AUD) Shares-distr. N/A � � N/A N/A N/A
Class I (CHF) Shares-acc. (hedged) N/A N/A N/A � N/A N/A
Class I (EUR) Shares-acc. � � � � N/A �
Class I (EUR) Shares-acc. (hedged) N/A N/A N/A N/A N/A N/A
Class I (EUR) Shares-distr. N/A N/A N/A � N/A N/A
Class I (EUR) Shares-distr. (hedged) N/A N/A N/A N/A N/A N/A
Class I (GBP) Shares-acc. � � N/A N/A N/A �
Class I (GBP) Shares-acc. (hedged) N/A N/A N/A N/A N/A N/A
Class I (GBP) Shares-distr. (hedged) N/A N/A N/A N/A N/A N/A
Class I (GBP) Shares-gross distr. N/A N/A � N/A N/A N/A
Class I (USD) Shares-acc. � � � N/A � �
Class I (USD) Shares-distr. N/A N/A N/A N/A N/A N/A
Class I (USD) Shares-gross distr. N/A N/A � N/A N/A N/A
Class X (GBP) Shares-distr. N/A N/A N/A N/A N/A N/A
Class X (USD) Shares-distr. N/A N/A N/A N/A N/A N/A
Class Z (GBP) Shares-acc. � N/A � N/A � �
Class Z (GBP) Shares-acc. (hedged) N/A N/A N/A N/A N/A N/A
Class Z (GBP) Shares-distr. N/A N/A N/A N/A N/A N/A
Class Z (USD) Shares-acc. N/A N/A N/A N/A N/A N/A
Class Z (USD) Shares-distr. N/A N/A N/A N/A N/A N/A
Service Class(USD) Shares-distr. N/A N/A N/A N/A N/A N/A
China Equity Fund, EUR Investment Grade Credit Fund, Global Long/Short Equity Fund, Global Low Volatility Equity Fund, Global Opportunity Bond Fund, U.S.
Dollar Short-Term Money Market Fund and USD Investment Grade Credit Fund have not been authorised by the Hong Kong Securities and Futures Commission
and are not available for investment by Hong Kong retail investors.

90 Wells Fargo (Lux) Worldwide Fund Notes to financial statements (unaudited)
GlobalLong/ShortEquityFund
GlobalLow
VolatilityEquityFund
GlobalOpportunity
BondFund
U.S.All CapGrowth
Fund
U.S.DollarShort-Term
MoneyMarketFund
U.S.HighYieldBondFund
U.S.LargeCap
GrowthFund
U.S.SelectEquityFund
U.S.Short-TermHighYieldBondFund
U.S.SmallCap
ValueFund
USDInvestment
GradeCreditFund
Class A (EUR)Shares-acc. N/A N/A N/A N/A N/A N/A N/A � N/A N/A N/A
Class A (EUR)Shares-acc.(hedged) N/A N/A � N/A N/A N/A N/A N/A N/A N/A N/A
Class A (GBP) Shares-acc. N/A N/A N/A � N/A N/A N/A N/A N/A N/A N/A
Class A (SEK) Shares-acc. N/A N/A N/A N/A N/A N/A N/A N/A N/A N/A N/A
Class A (USD) Shares-acc. N/A N/A � � N/A � � � � N/A �
Class A (USD) Shares-distr. N/A N/A N/A N/A � N/A N/A N/A N/A N/A N/A
Class A (USD) Shares-grossdistr. N/A N/A N/A N/A N/A � N/A N/A N/A N/A N/A
Class I (AUD) Shares-distr. N/A N/A N/A N/A N/A N/A N/A N/A N/A N/A N/A
Class I (CHF) Shares-acc.(hedged) N/A N/A N/A N/A N/A N/A N/A N/A N/A N/A N/A
Class I (EUR) Shares-acc. N/A � N/A � N/A � � N/A N/A N/A N/A
Class I (EUR) Shares-acc.(hedged) N/A N/A � N/A N/A � N/A � N/A N/A N/A
Class I (EUR) Shares-distr. � N/A N/A N/A N/A N/A N/A N/A N/A N/A N/A
Class I (EUR) Shares-distr.(hedged) N/A N/A N/A N/A N/A N/A N/A N/A � N/A �
Class I (GBP) Shares-acc. � � N/A � N/A N/A N/A N/A N/A � N/A
Class I (GBP) Shares-acc.(hedged) N/A N/A � N/A N/A N/A N/A N/A N/A N/A N/A
Class I (GBP) Shares-distr.(hedged) N/A N/A N/A N/A N/A N/A N/A N/A � N/A N/A
Class I (GBP) Shares-grossdistr. N/A N/A N/A N/A N/A N/A N/A N/A N/A N/A N/A
Class I (USD) Shares-acc. � � � � N/A � � � � � �
Class I (USD) Shares-distr. N/A N/A N/A N/A � N/A N/A N/A N/A N/A �
Class I (USD) Shares-grossdistr. N/A N/A N/A N/A N/A � N/A N/A � N/A �
Class X (GBP) Shares-distr. N/A N/A N/A N/A N/A N/A N/A � N/A N/A N/A
Class X (USD) Shares-distr. N/A N/A N/A N/A N/A N/A N/A � N/A N/A N/A
Class Z (GBP) Shares-acc. N/A N/A N/A � N/A � � N/A N/A N/A N/A
Class Z (GBP) Shares-acc.(hedged) N/A N/A N/A N/A N/A N/A N/A N/A N/A � N/A
Class Z (GBP) Shares-distr. N/A N/A N/A � N/A N/A N/A N/A N/A N/A N/A
Class Z (USD) Shares-acc. N/A N/A � � N/A N/A N/A N/A N/A � N/A
Class Z (USD) Shares-distr. N/A N/A N/A � N/A N/A N/A N/A N/A N/A N/A
Service Class(USD) Shares-distr. N/A N/A N/A N/A � N/A N/A N/A N/A N/A N/A
2. SIGNIFICANT ACCOUNTING POLICIES
The accompanying financial statements have been prepared in accordance with the format prescribed by the Luxembourgregulations relating to undertakings for collective investment. The financial statements are expressed in the base currency ofthe Sub-Funds which is USD for each Sub-Fund, except EUR Investment Grade Credit Fund. The base currency of EURInvestment Grade Credit Fund is EUR. The net asset value (“NAV“) per share as calculated on 30 September 2017 is based onthe last available market prices of the investments in which the respective Sub-Funds are invested as of this date.
China Equity Fund, EUR Investment Grade Credit Fund, Global Long/Short Equity Fund, Global Low Volatility Equity Fund, Global Opportunity Bond Fund, U.S.
Dollar Short-Term Money Market Fund and USD Investment Grade Credit Fund have not been authorised by the Hong Kong Securities and Futures Commission
and are not available for investment by Hong Kong retail investors.
Notes to financial statements (unaudited) Wells Fargo (Lux) Worldwide Fund 91
Investment valuationsAll investments are valued each business day as of the close of regular trading on the New York Stock Exchange(generally 4:00 p.m. US Eastern Time).
Equity securities that are listed on an exchange or market are valued at the official closing price or, if none, the last salesprice. If no sale occurs on the primary exchange or market for the security that day, fair values will be determined inaccordance with the Fund’s Pricing and Valuation Policies & Procedures.
Unlisted securities, for which over-the-counter market quotations are readily available (including listed securities forwhich the primary market is believed to be the over-the-counter market), shall be valued at a price equal to the lastreported price as supplied by the recognised quotation services or broker-dealers.
Many securities markets and exchanges outside the US close prior to the close of the New York Stock Exchange and thereforemay not fully reflect trading or events that occur after the close of the principal exchange in which the non-US securities aretraded, but before the close of the New York Stock Exchange. If such trading or events are expected to materially affect thevalue of securities, then fair value pricing procedures approved by the Board of Directors of the Fund (the “Board of Directors”)are applied. These procedures take into account multiple factors, including movements in US securities markets after non-USexchanges close. Depending on market activity, such fair valuations may be frequent. Such fair value pricing may result in NAVsthat are higher or lower than NAVs based on the last reported sales price or latest quoted bid price.
Debt securities are valued at the evaluated bid price provided by an independent pricing service or, if a reliable price isnot available, the quoted bid price from an independent broker-dealer.
Short-term securities, with remaining maturities of 60 days or less at time of purchase, generally are valued at amortisedcost which approximates fair value. The amortised cost method involves valuing a security at its cost, plus accretion ofdiscount or minus amortisation of premium over the period until maturity.
The values of securities not denominated in the base currency of each Sub-Fund were converted to the applicablecurrency at rates provided by an independent currency pricing source.
Investments which are not valued using any of the methods discussed above are valued at their fair value, in accordance withthe Fund’s Pricing and Valuation Policies & Procedures established in good faith and approved by the Board of Directors.
Cash, bills and demand notes, accounts receivable, prepaid expenses, cash dividends, bank interest, dividends and bondsare valued at nominal value.
Repurchase agreements and reverse repurchase agreementsCertain Sub-Fund may enter into repurchase agreements and reverse repurchase agreements.
Repurchase agreements are similar to secured borrowings of cash equal to the sale price of a portfolio of securitiesrepresenting the collateral. The underlying securities are accounted for in the investment portfolio of the Sub-Fund,which remains exposed to the risk of depreciation in value.
Reverse repurchase agreements are similar to secured lending of cash and must be fully collateralised based on valuesthat are marked to market daily. The collateral may be held by an agent bank under a tri-party agreement. It is theresponsibility of the Fund’s depositary and administrator to value collateral daily and to take action to obtain additionalcollateral as necessary to maintain a market value equal to or greater than the resale price. The reverse repurchaseagreements are collateralised by instruments such as US Treasury, federal agency, or high-grade corporate obligations.There could be potential loss to a Sub-Fund in the event that the Sub-Fund is delayed or prevented from exercising itsrights to dispose of the collateral, including the risk of a possible decline in the value of the underlying obligations duringthe period in which the Sub-Fund seeks to assert its rights.
There are no direct or indirect operational costs and fees incurred from repurchase agreements or reverse repurchasetransactions entered into by the Sub-Fund. Managing such transactions is part of the daily portfolio management activityand, as such, related costs are covered through the investment management fees. The interest on the repurchase agreementand reverse repurchase agreement transactions is included in the Statement of operations and changes in net assets.
Futures contractsCertain Sub-Funds may invest in futures contracts and may be subject to interest rate risk, equity price risk and foreigncurrency risk in the normal course of pursuing their investment objectives. The Sub-Funds may buy and sell futures
China Equity Fund, EUR Investment Grade Credit Fund, Global Long/Short Equity Fund, Global Low Volatility Equity Fund, Global Opportunity Bond Fund, U.S.
Dollar Short-Term Money Market Fund and USD Investment Grade Credit Fund have not been authorised by the Hong Kong Securities and Futures Commission
and are not available for investment by Hong Kong retail investors.
92 Wells Fargo (Lux) Worldwide Fund Notes to financial statements (unaudited)
contracts in order to gain exposure to, or protect against, changes in interest rates, security values and foreign exchangerates. The primary risks associated with the use of futures contracts are the imperfect correlation between changes inmarket values of securities held by the Sub-Fund and the prices of futures contracts, and the possibility of an illiquidmarket. The aggregate principal amounts of the contracts are not recorded in the financial statements. Fluctuations in thevalue of the contracts are recorded in the Statement of assets and liabilities as an asset or liability and in the Statement ofoperations and changes in net assets as unrealised appreciation/(depreciation) until the contracts are closed, at whichpoint they are recorded as net realised profit or loss on futures contracts. With futures contracts, there is minimalcounterparty risk to the Sub-Fund since futures are exchange traded and the exchange’s clearinghouse, as counterpartyto all exchange traded futures, guarantees the futures against default.
LoansCertain Sub-Fund may invest in direct debt instruments which are interests in amounts owed to lenders by corporate orother borrowers. The loans pay interest at rates which are periodically reset by reference to a base lending rate plus aspread. Investments in loans may be in the form of participations in loans or assignments of all or a portion of loans fromthird parties. When a Sub-Fund purchases participations, it generally has no rights to enforce compliance with terms ofthe loan agreement with the borrower. As a result, a Sub-Fund assumes the credit risk of both the borrower and thelender that is selling the participation. When a Sub-Fund purchases assignments from lenders, it acquires direct rightsagainst the borrower on the loan and may enforce compliance by the borrower with the terms of the loan agreement.Loans may include fully funded term loans or unfunded loan commitments, which are contractual obligations for futurefunding. Investment in such term loans are allowed up to the limits specified in the prospectus of the Fund.
Forward foreign currency contractsCertain Sub-Fund may invest in forward foreign currency contracts and may be subject to foreign currency risk in thenormal course of pursuing its investment objectives. A forward foreign currency contract is an agreement between twoparties to purchase or sell a specific currency for an agreed-upon price at a future date. A Sub-Fund enters into forwardforeign currency contracts to facilitate transactions in non-USD or non-EUR denominated securities and to attempt tominimise the risk to the Sub-Fund from adverse changes in the relationship between currencies. Forward foreigncurrency contracts are recorded at the forward rate and marked to market daily. When the contracts are closed, realisedprofits and losses arising from such transactions are recorded as realised profits or losses on forward foreign currencycontracts. A Sub-Fund could be exposed to risks if the counterparties to the contracts are unable to meet the terms oftheir contracts or if the value of the foreign currency changes unfavourably. A Sub-Fund’s maximum risk of loss fromcounterparty credit risk is the unrealised appreciation on the contracts. This risk may be mitigated if there is a masternetting arrangement between the Sub-Fund and the counterparty.
Contracts for differenceCertain Sub-Funds may purchase or sell contracts for difference and may be subject to equity risk in the normal course ofpursing its investment objectives to gain exposure to an underlying security. A contract for difference is an agreementwhere one party pays the other party an amount determined by the difference between the opening and closing price ofthe underlying security. The buyer of the contract pays the seller the positive difference and the seller of the contractpays the buyer the negative difference. The value of the contract is marked to market daily based upon quotations froman independent pricing service or an independent broker-dealer, and any change in value is recorded as an unrealizedgain or loss until the contract is closed, at which point it is recorded as a net realized gain or loss. Any interest ordividends accrued on the underlying security during the period of the contract is recorded as income for a purchasecontract and as expense for a sell contract. The Sub-Fund could be exposed to risks if the counterparty defaults on itsobligation to perform, or if there are unfavorable changes in the fluctuation in the price of the underlying security.
Security transactions and income recognitionSecurities transactions are recorded on a trade date basis. Realised profit or loss is based on the average cost of securities.Interest and dividends are credited to investment on an accruals basis, net of withholding tax.
Foreign currencyTransactions expressed in currencies other than each Sub-Fund’s base currency are translated into each Sub-Fund’s basecurrency at the exchange rates at the date of the transactions. Assets and liabilities in currencies other than the basecurrency of each Sub-Fund are translated into each Sub-Fund’s base currency at the rates at the end of the period. Aforeign currency adjustment is included in the Statement of operations and changes in net assets in determining theresults for the accounting period.
China Equity Fund, EUR Investment Grade Credit Fund, Global Long/Short Equity Fund, Global Low Volatility Equity Fund, Global Opportunity Bond Fund, U.S.
Dollar Short-Term Money Market Fund and USD Investment Grade Credit Fund have not been authorised by the Hong Kong Securities and Futures Commission
and are not available for investment by Hong Kong retail investors.
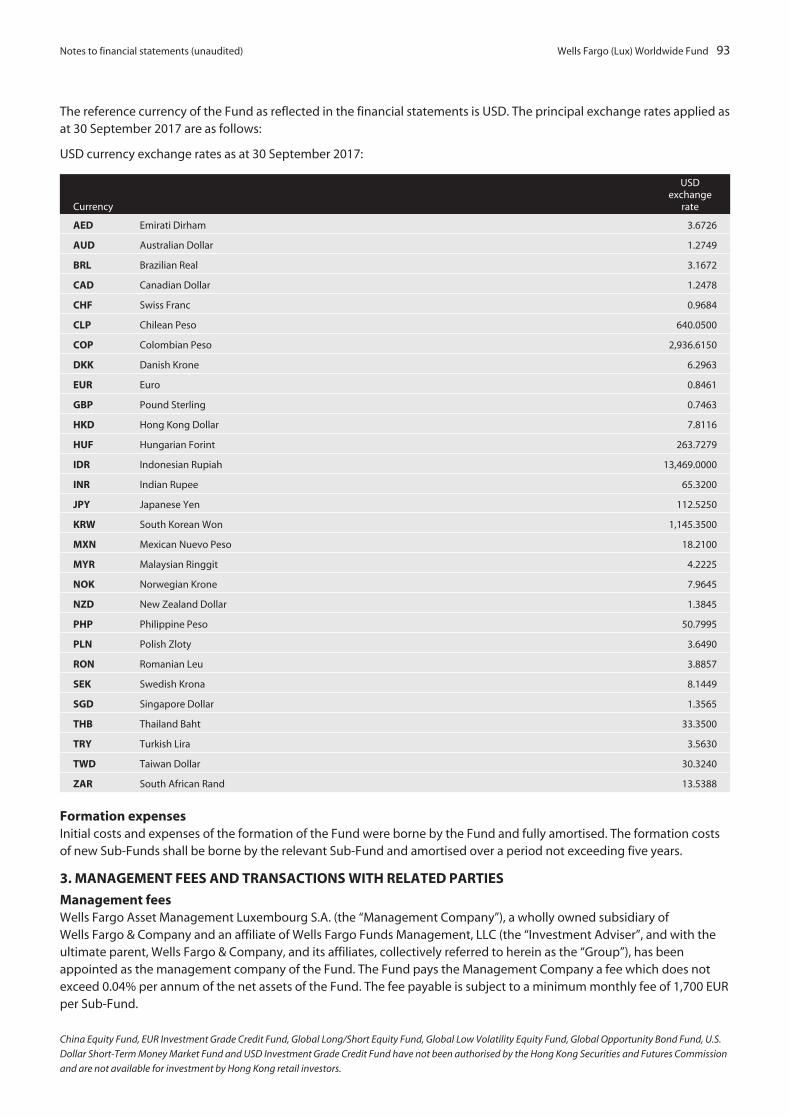
Notes to financial statements (unaudited) Wells Fargo (Lux) Worldwide Fund 93
The reference currency of the Fund as reflected in the financial statements is USD. The principal exchange rates applied asat 30 September 2017 are as follows:
USD currency exchange rates as at 30 September 2017:
Currency
USDexchange
rate
AED Emirati Dirham 3.6726
AUD Australian Dollar 1.2749
BRL Brazilian Real 3.1672
CAD Canadian Dollar 1.2478
CHF Swiss Franc 0.9684
CLP Chilean Peso 640.0500
COP Colombian Peso 2,936.6150
DKK Danish Krone 6.2963
EUR Euro 0.8461
GBP Pound Sterling 0.7463
HKD Hong Kong Dollar 7.8116
HUF Hungarian Forint 263.7279
IDR Indonesian Rupiah 13,469.0000
INR Indian Rupee 65.3200
JPY Japanese Yen 112.5250
KRW South Korean Won 1,145.3500
MXN Mexican Nuevo Peso 18.2100
MYR Malaysian Ringgit 4.2225
NOK Norwegian Krone 7.9645
NZD New Zealand Dollar 1.3845
PHP Philippine Peso 50.7995
PLN Polish Zloty 3.6490
RON Romanian Leu 3.8857
SEK Swedish Krona 8.1449
SGD Singapore Dollar 1.3565
THB Thailand Baht 33.3500
TRY Turkish Lira 3.5630
TWD Taiwan Dollar 30.3240
ZAR South African Rand 13.5388
Formation expensesInitial costs and expenses of the formation of the Fund were borne by the Fund and fully amortised. The formation costsof new Sub-Funds shall be borne by the relevant Sub-Fund and amortised over a period not exceeding five years.
3. MANAGEMENT FEES AND TRANSACTIONS WITH RELATED PARTIES
Management feesWells Fargo Asset Management Luxembourg S.A. (the “Management Company”), a wholly owned subsidiary ofWells Fargo & Company and an affiliate of Wells Fargo Funds Management, LLC (the “Investment Adviser”, and with theultimate parent, Wells Fargo & Company, and its affiliates, collectively referred to herein as the “Group”), has beenappointed as the management company of the Fund. The Fund pays the Management Company a fee which does notexceed 0.04% per annum of the net assets of the Fund. The fee payable is subject to a minimum monthly fee of 1,700 EURper Sub-Fund.
China Equity Fund, EUR Investment Grade Credit Fund, Global Long/Short Equity Fund, Global Low Volatility Equity Fund, Global Opportunity Bond Fund, U.S.
Dollar Short-Term Money Market Fund and USD Investment Grade Credit Fund have not been authorised by the Hong Kong Securities and Futures Commission
and are not available for investment by Hong Kong retail investors.

94 Wells Fargo (Lux) Worldwide Fund Notes to financial statements (unaudited)
The list of funds managed by the Management Company may be obtained, on simple request, at the registered office ofthe Management Company.
Investment management feesThe Management Company also receives an investment management fee from each Sub-Fund, payable monthly inarrears, which does not exceed a percentage per annum of the net assets of each class as follows:
Class A Class I Class X Class Z Service Class
China Equity Fund 1.50% 0.85% N/A 0.85% N/A
Emerging Markets Equity Fund 1.90% 1.15% N/A N/A N/A
Emerging Markets Equity Income Fund 1.85% 1.10% N/A 1.10% N/A
EUR Investment Grade Credit Fund 0.80% 0.30% N/A 0.30% N/A
Global Equity Fund 1.60% 0.85% N/A 0.85% N/A
Global Focused Equity Fund 1.65% 0.90% N/A 0.90% N/A
Global Long/Short Equity Fund 1.50% 0.75% N/A N/A N/A
Global Low Volatility Equity Fund 0.95% 0.50% N/A 0.50% N/A
Global Opportunity Bond Fund 1.00% 0.50% 0.25% 0.50% N/A
U.S. All Cap Growth Fund 1.60% 0.80% N/A 0.80% N/A
U.S. Dollar Short-Term Money Market Fund 1.20% 0.20% N/A N/A 0.45%
U.S. High Yield Bond Fund 1.45% 0.65% N/A 0.65% N/A
U.S. Large Cap Growth Fund 1.50% 0.70% N/A 0.75% N/A
U.S. Select Equity Fund 1.90% 1.10% 0.85% 1.10% 1.10%
U.S. Short-Term High Yield Bond Fund 1.30% 0.50% N/A 0.60% 0.60%
U.S. Small Cap Value Fund 1.70% 0.90% N/A 0.90% N/A
USD Investment Grade Credit Fund 0.80% 0.30% N/A 0.30% N/A
The Investment Adviser manages the investment and reinvestment of the assets of the Sub-Funds in accordance with theinvestment objectives and restrictions of each Sub-Fund, under the overall responsibility of the Board of Directors, and isremunerated for such services by the Management Company.
The Investment Adviser has delegated certain of its functions to sub-advisers within the Group (each a “Sub-Adviser”,collectively the “Sub-Advisers”). Each Sub-Adviser serves to assist it in the day-to-day asset management of the respectiveSub-Funds.
As at 30 September 2017, the Sub-Adviser(s) for each Sub-Fund was as follows:
China Equity Fund Wells Capital Management Incorporated
Emerging Markets Equity Fund Wells Capital Management Incorporated
Emerging Markets Equity Income Fund Wells Capital Management Incorporated
EUR Investment Grade Credit Fund ECM Asset Management Limited
Global Equity Fund Wells Capital Management Incorporated
Global Focused Equity Fund Wells Capital Management Incorporated
Global Long/ Short Equity Fund Analytic Investors, LLC
Global Low Volatility Equity Fund Analytic Investors, LLC
Global Opportunity Bond Fund First International Advisors, LLC
U.S. All Cap Growth Fund Wells Capital Management Incorporated
U.S. Dollar Short-Term Money Market Fund Wells Capital Management Incorporated
Wells Capital Management Singapore
U.S. High Yield Bond Fund Wells Capital Management Incorporated
U.S. Large Cap Growth Fund Wells Capital Management Incorporated
China Equity Fund, EUR Investment Grade Credit Fund, Global Long/Short Equity Fund, Global Low Volatility Equity Fund, Global Opportunity Bond Fund, U.S.
Dollar Short-Term Money Market Fund and USD Investment Grade Credit Fund have not been authorised by the Hong Kong Securities and Futures Commission
and are not available for investment by Hong Kong retail investors.

Notes to financial statements (unaudited) Wells Fargo (Lux) Worldwide Fund 95
U.S. Select Equity Fund Wells Capital Management Incorporated
U.S. Short-Term High Yield Bond Fund Wells Capital Management Incorporated
U.S. Small Cap Value Fund Wells Capital Management Incorporated
USD Investment Grade Credit Fund Wells Capital Management Incorporated
The fees of the Sub-Advisers, except for Wells Capital Management Singapore, are borne by the Investment Adviser. Thefees of Wells Capital Management Singapore are borne by Wells Capital Management Incorporated.
Performance feeClass A Shares and Class I Shares of Global Long/Short Fund each pays a performance fee to the Management Company.The Management Company may pay part or all of the performance fee to the Investment Adviser and the InvestmentAdviser may in turn pay part or all of any portion of the performance fee it receives from the Management Company tothe Sub-Adviser. The performance fee is equal to 20% of the appreciation of the NAV per share (prior to the deduction ofthe performance fee) at the end of each fiscal year when the NAV per share exceeds the high watermark after deductionof the hurdle rate. The high watermark is the highest end of fiscal year NAV per share for the relevant class since inceptionof the Sub-Fund. The first high watermark will be the initial NAV per share for the relevant class. The hurdle rate applied is50% MSCI World Index / 50% 3 Month Libor (or the currency or currency-hedged equivalent index for non-USDdenominated and currency-hedged share classes, respectively).
The performance fee is calculated and accrued daily and paid annually in arrears at the end of the fiscal year, except that,when a redemption is made on any valuation day other than the fiscal year end, a performance fee (if accrued as of thedate of such redemption) shall be recognised in respect of the shares being redeemed and paid to the ManagementCompany on a quarterly basis.
Transactions with other related partiesThe Management Company also acts as the principal distributor of the Fund (referred to herein in such capacity as the“Principal Distributor”). The Principal Distributor has entered into sub-distribution agreements with the followingaffiliated entities (each an “Affiliated Sub-Distributor”, collectively the “Affiliated Sub-Distributors”) pursuant to whicheach Affiliated Sub-Distributor has been appointed as a non-exclusive sub-distributor in respect of the promotion,marketing and sale of shares of one or more of the Sub-Funds:
• Wells Fargo Funds Distributor, LLC ,• Wells Fargo Advisors, LLC ,• Wells Fargo Securities, LLC,• Wells Fargo Securities Asia Limited, and• Wells Fargo Securities International Limited.
Each of the Affiliated Sub-Distributors is an affiliate of the Principal Distributor and may receive compensation from thePrincipal Distributor for the services they provide, if any, in connection with the promotion, marketing and sale of shares.
The Directors who are also officers and/or directors of the Investment Adviser and/or its affiliates do not receiveseparate remuneration from the Fund. Richard Goddard, Jürgen Meisch and Yves Wagner, who are Directors with noaffiliation with the Investment Adviser and/or its affiliates, each receive remuneration at a flat rate with no variableelement. The aggregate Directors’ remuneration relating to the Fund amounted to 72,058 USD for the six monthsended 30 September 2017.
No transactions of the Fund were effected through a broker who is an affiliate of the Fund, the Management Company/Principal Distributor, the Investment Adviser, the Sub-Advisers or the Directors of the Fund. All transactions withconnected persons were entered into in the ordinary course of business and under normal commercial terms.
4. DEPOSITARY AND ADMINISTRATION FEES
Brown Brothers Harriman (Luxembourg) S.C.A. has been appointed as the depositary and administrator for the Fund. Thedepositary fee is calculated based on an agreed upon schedule. Under the depositary agreement, Brown BrothersHarriman (Luxembourg) S.C.A. receives annual safekeeping and servicing fees with rates varying according to the countryof investment. Under the administrative agreement, Brown Brothers Harriman (Luxembourg) S.C.A. receives a fee for its
China Equity Fund, EUR Investment Grade Credit Fund, Global Long/Short Equity Fund, Global Low Volatility Equity Fund, Global Opportunity Bond Fund, U.S.
Dollar Short-Term Money Market Fund and USD Investment Grade Credit Fund have not been authorised by the Hong Kong Securities and Futures Commission
and are not available for investment by Hong Kong retail investors.

96 Wells Fargo (Lux) Worldwide Fund Notes to financial statements (unaudited)
services according to an agreed upon schedule and is reimbursed for out-of-pocket expenses. The depositary andadministration fees are accrued on each valuation day based on the previous day’s NAV and are paid at the end of eachmonth.
5. REGISTRAR, TRANSFER AGENT AND PAYING AGENT FEES
Brown Brothers Harriman (Luxembourg) S.C.A. also serves as the registrar, transfer agent and paying agent of the Fund.The registrar fees are payable monthly in arrears and are in accordance with relevant agreements.
6. WAIVED FEES AND REIMBURSED EXPENSES
The waived fees and/or reimbursed expenses represent amounts exceeding the total expense ratio caps of eachSub-Fund during the financial period. These amounts are reimbursed by the Investment Adviser to each relevantSub-Fund when the actual total expense ratio of each class exceeds the following rates:
Class A Class I Class X Class Z Service Class
China Equity Fund 1.80% 1.15% N/A 1.15% N/A
Emerging Markets Equity Fund 2.20% 1.45% N/A N/A N/A
Emerging Markets Equity Income Fund 2.15% 1.40% N/A 1.40% N/A
EUR Investment Grade Credit Fund 0.95% 0.45% N/A 0.45% N/A
Global Equity Fund 1.90% 1.15% N/A 1.15% N/A
Global Focused Equity Fund 1.95% 1.20% N/A 1.20% N/A
Global Long/Short Equity Fund 1.75% 1.00% N/A N/A N/A
Global Low Volatility Equity Fund 1.10% 0.65% N/A 0.65% N/A
Global Opportunity Bond Fund 1.20% 0.70% 0.45% 0.70% N/A
U.S. All Cap Growth Fund 1.90% 1.10% N/A 1.10% N/A
U.S. Dollar Short-Term Money Market Fund 1.20% 0.20% N/A N/A 0.45%
U.S. High Yield Bond Fund 1.75% 0.95% N/A 0.95% N/A
U.S. Large Cap Growth Fund 1.80% 1.00% N/A 1.05% N/A
U.S. Select Equity Fund 2.20% 1.40% 1.15% 1.40% 1.40%
U.S. Short-Term High Yield Bond Fund 1.60% 0.80% N/A 0.90% 0.90%
U.S. Small Cap Value Fund 2.00% 1.20% N/A 1.20% N/A
USD Investment Grade Credit Fund 0.95% 0.45% N/A 0.45% N/A
7. DERIVATIVE TRANSACTIONS
During the six months ended 30 September 2017, the Sub-Funds entered into forward foreign currency contracts, futurescontracts and contracts for difference.
As at 30 September 2017, the Sub-Funds had forward foreign currency contracts outstanding as follows:
Contract type Purpose CounterpartyMaturity
dateContracts
to receive/deliverIn exchange
for USDUSD/EUR value at
30/9/2017
USD/EUR value ofunrealised
appreciation/(depreciation)
EUR Investment Grade Credit Fund
Buy Currency hedging Brown Brothers Harriman 30/10/2017 117,376,501 CHF 101,805,783 102,592,083 786,300
Sell Economic hedging JP Morgan 25/10/2017 (7,900,000) GBP 8,983,561 8,952,592 30,969
Economic hedging JP Morgan 25/10/2017 (9,200,000) USD 7,737,380 7,774,703 (37,323)
Global Focused Equity Fund
Sell Economic hedging Brown Brothers Harriman 10/10/2017 (426,000) GBP 552,360 570,974 (18,614)
Economic hedging Brown Brothers Harriman 27/10/2017 (1,080,000) EUR 1,264,929 1,278,131 (13,202)
Economic hedging Brown Brothers Harriman 12/12/2017 (409,400) GBP 542,098 549,791 (7,693)
China Equity Fund, EUR Investment Grade Credit Fund, Global Long/Short Equity Fund, Global Low Volatility Equity Fund, Global Opportunity Bond Fund, U.S.
Dollar Short-Term Money Market Fund and USD Investment Grade Credit Fund have not been authorised by the Hong Kong Securities and Futures Commission
and are not available for investment by Hong Kong retail investors.

Notes to financial statements (unaudited) Wells Fargo (Lux) Worldwide Fund 97
Contract type Purpose CounterpartyMaturity
dateContracts
to receive/deliverIn exchange
for USDUSD/EUR value at
30/9/2017
USD/EUR value ofunrealised
appreciation/(depreciation)
Global Opportunity Bond Fund
Buy Currency hedging Brown Brothers Harriman 30/10/2017 120,173 EUR 142,951 142,244 (707)
Currency hedging Brown Brothers Harriman 30/10/2017 35,275 EUR 41,961 41,753 (208)
Currency hedging Brown Brothers Harriman 30/10/2017 3,654,400 GBP 4,940,742 4,900,889 (39,853)
Economic hedging State Street Bank 13/12/2017 105,000 GBP 142,316 141,012 (1,304)
Economic hedging State Street Bank 13/12/2017 300,000 DKK 48,560 47,853 (707)
Economic hedging State Street Bank 6/12/2017 800,000 ZAR 60,557 58,470 (2,087)
Economic hedging State Street Bank 22/11/2017 275,000 PLN 76,631 75,361 (1,270)
Economic hedging State Street Bank 16/11/2017 1,600,000 THB 48,401 47,997 (404)
Sell Economic hedging State Street Bank 17/11/2017 (820,000) RON 211,949 210,945 1,004
Economic hedging State Street Bank 22/11/2017 (2,300,000) PLN 631,010 630,292 718
Economic hedging State Street Bank 15/11/2017 (600,000) CAD 471,759 481,003 (9,244)
Economic hedging State Street Bank 16/11/2017 (13,850,000) THB 416,856 415,482 1,374
Economic hedging State Street Bank 22/11/2017 (55,000,000) HUF 213,426 209,003 4,423
Economic hedging State Street Bank 6/11/2017 (5,750,000) ZAR 439,448 422,302 17,146
Economic hedging State Street Bank 20/11/2017 (1,550,000) AUD 1,242,860 1,215,097 27,763
Economic hedging State Street Bank 18/12/2017 (600,000) EUR 717,119 712,224 4,895
Economic hedging State Street Bank 30/11/2017 (1,325,000) BRL 413,894 414,977 (1,083)
Economic hedging State Street Bank 14/11/2017 (525,000) NZD 382,990 378,880 4,110
Economic hedging State Street Bank 13/12/2017 (240,000) GBP 318,163 322,312 (4,149)
Economic hedging State Street Bank 13/12/2017 (2,050,000) DKK 332,733 326,994 5,739
U.S. High Yield Bond Fund
Buy Currency hedging Brown Brothers Harriman 30/10/2017 1,616,680 EUR 1,922,898 1,913,597 (9,301)
U.S. Select Equity Fund
Buy Currency hedging Brown Brothers Harriman 30/10/2017 9,550 EUR 11,360 11,304 (56)
U.S. Short-Term High Yield Bond Fund
Buy Currency hedging Brown Brothers Harriman 30/10/2017 9,857,767 EUR 11,726,209 11,668,233 (57,976)
Currency hedging Brown Brothers Harriman 30/10/2017 17,215,185 GBP 23,277,013 23,089,434 (187,579)
U.S. Small Cap Value Fund
Buy Currency hedging Brown Brothers Harriman 30/10/2017 10,036 GBP 13,567 13,461 (106)
USD Investment Grade Credit Fund
Buy Currency hedging Brown Brothers Harriman 30/10/2017 51,630,626 EUR 61,417,368 61,113,041 (304,327)
As at 30 September 2017, the Sub-Funds had futures contracts as follows:
Contract type Type CounterpartyMaturity
dateEUR
Commitment
EUR value ofunrealised
appreciation/(depreciation)
EUR Investment Grade Credit Fund
34 Short 5 Year US Treasury Note Newedge Group 29/12/2017 (2,876,494) 26,969
36 Short 10 Year US Treasury Note Newedge Group 19/12/2017 (3,079,448) 39,330
20 Short Long Gilt Futures Newedge Group 27/12/2017 (2,888,386) 73,684
57 Long Euro-Bund Futures Newedge Group 7/12/2017 5,548,380 (29,100)
6 Long Euro-BOBL Futures Newedge Group 7/12/2017 660,060 (2,340)
37 Long Euro-Schatz Futures Newedge Group 7/12/2017 3,750,320 (2,775)
China Equity Fund, EUR Investment Grade Credit Fund, Global Long/Short Equity Fund, Global Low Volatility Equity Fund, Global Opportunity Bond Fund, U.S.
Dollar Short-Term Money Market Fund and USD Investment Grade Credit Fund have not been authorised by the Hong Kong Securities and Futures Commission
and are not available for investment by Hong Kong retail investors.

98 Wells Fargo (Lux) Worldwide Fund Notes to financial statements (unaudited)
As at 30 September 2017, the Sub-Funds had contracts for difference as follows:
Currency DescriptionUSD
Notional
USD value ofunrealisedgain/(loss)
Global Long/Short Equity Fund
JPY Acom Co. Ltd. 134,900 1,362
JPY AEON Financial Service Co. Ltd. 1,400 114
USD Antero Resources Corp. 1,817 491
USD Ball Corp. 2,350 (1,152)
EUR Boskalis Westminster 1,773 (1,343)
USD CarMax Incorporated 527 (801)
USD CF Industries Holdings, Inc. 15,503 11,627
USD Cheniere Energy, Inc. 28,286 (26,023)
USD Continental Resources, Inc. 27,648 (1,659)
USD DexCom, Inc. 5,661 114,493
USD EOG Resources Incorporated 1,191 (536)
USD Equinix, Inc. 2,135 (19,407)
EUR Ferrovial S.A. 1,211 (252)
CAD First Quantum Minerals Ltd. 79,600 (11,762)
USD Halliburton Co. 18,154 (24,326)
USD Hess Corp. 7,446 (5,882)
EUR Industria de Diseno Textil S.A. 32,481 (8,598)
JPY Isetan Mitsukoshi Holdings Ltd. 14,000 (4,234)
USD LKQ Corp. 603 (549)
SEK Lundin Petroleum AB 56,922 6,394
USD Martin Marietta Materials, Inc. 167 (1,685)
JPY Mitsubishi Estate Co. Ltd. 2,100 928
USD National Oilwell Varco, Inc. 15,525 2,018
USD Palo Alto Networks, Inc. 1,990 (11,661)
USD Parsley Energy, Inc. 4,510 3,743
CAD PrairieSky Royalty Ltd. 7,700 9,181
USD Range Resources Corp 27,364 (9,304)
EUR Saipem SpA 280,896 (1,442)
USD SBA Communications Corp. 8,284 (21,456)
USD Schlumberger Limited 8,856 (974)
CAD Seven Generations Energy Ltd. 2,300 44
EUR Tenaris S.A. 103,610 16,180
USD Tesla, Inc. 2,612 10,161
USD Tractor Supply Co. 603 (271)
CAD Turquoise Hill Resources Ltd. 46,200 (80)
EUR UniCredit SpA 29,263 (13,289)
USD VEREIT, Inc. 229,105 41,239
CHF Vifor Pharma AG 346 (353)
USD Vulcan Materials Co. 11,316 (43,793)
USD Weatherford International PLC 152,015 (48,645)
USD Zayo Group Holdings, Inc. 1,528 138
China Equity Fund, EUR Investment Grade Credit Fund, Global Long/Short Equity Fund, Global Low Volatility Equity Fund, Global Opportunity Bond Fund, U.S.
Dollar Short-Term Money Market Fund and USD Investment Grade Credit Fund have not been authorised by the Hong Kong Securities and Futures Commission
and are not available for investment by Hong Kong retail investors.

Notes to financial statements (unaudited) Wells Fargo (Lux) Worldwide Fund 99
8. TAX STATUS
The Fund is not liable for any Luxembourg tax on income, profits or gains, but it is liable in Luxembourg for an annualsubscription tax (“taxe d’abonnement”).
U.S. Dollar Short-Term Money Market Fund is liable in Luxembourg for a taxe d’abonnement at a rate of 0.01% per annumof its net assets, provided, however, that it is exempt from a taxe d’abonnement with respect to each class which isrestricted to institutional investors to the extent its weighted residual portfolio maturity does not exceed 90 days and ithas obtained the highest possible rating from a recognised credit rating agency.
The other Sub-Funds are liable in Luxembourg for a taxe d’abonnement at a rate of (i) 0.05% per annum of the net assetsof each class which is available to all investors and (ii) 0.01% per annum of the net assets of each class which is restrictedto institutional investors.
Each Sub-Fund is liable for value added taxes applicable to certain services, which are applied and incorporated in thefees incurred by each Sub-Fund.
No stamp duty or other tax is payable in Luxembourg on the issue or redemption of shares.
No Luxembourg tax is payable on the realised capital gains or unrealised capital appreciation of the assets of the Fund.
Dividends and interest received by the Fund on its investments are in many cases subject to irrecoverable withholdingtaxes at their source.
9. DISTRIBUTION POLICY
Under normal circumstances, the Board of Directors does not intend to declare and make distributions with respect tothe net investment income and realised capital gains, if any, attributable to the Accumulation Classes, which arerepresented with the suffix “acc.”. Accordingly, the net investment income of the Accumulation Classes will neither bedeclared nor distributed. However, the NAV per share of these Accumulation Classes will reflect any net investmentincome or capital gains.
Under normal circumstances, the Board of Directors intends to make distributions at least annually as at the end of thefinancial year, or at other time(s) to be determined by the Board of Directors, with respect to the net income, if any,attributable to certain Distribution Classes and with respect to gross income, if any, attributable to certain otherDistribution Classes. Distribution Classes that distribute net income will be represented with the suffix “distr.” in the classname and Distribution Classes that distribute gross income will be represented with the suffix “gross distr.” in the classname. A Sub-Fund will re-invest all distributions in additional shares of the same class of shares of the Sub-Fund givingrise to the distribution, and not distribute cash to shareholders in connection with any distributions, unless otherwiseexpressly requested by the relevant shareholder. The frequency of distributions for each Sub-Fund is available underwellsfargoworldwidefund.com.
Shareholders should note that Distribution Classes distributing gross income may result in the shareholder receiving ahigher dividend than they would have otherwise received and therefore may be subject to a higher income tax liability asa result. Shareholders should seek their own professional tax advice in this regard.
Also, with respect to such gross income Distribution Classes, since fees and expenses are applied to capital rather than toincome, the potential for future appreciation of NAV of such shares may be eroded, and, under normal circumstances, theNAV of a gross income Distribution Class will typically be smaller than the NAV of a net income Distribution Class. Asmaller NAV can result in performance variance when comparing gross income versus net income Distribution Classes.
The Board of Directors may amend this policy at any time upon notice without prior shareholder approval.
No distribution may be made which would result in the net assets of the Fund falling below the minimum provided for byLuxembourg law.
Dividends not claimed within five years from their payment date will lapse and revert to the relevant Sub-Fund.
China Equity Fund, EUR Investment Grade Credit Fund, Global Long/Short Equity Fund, Global Low Volatility Equity Fund, Global Opportunity Bond Fund, U.S.
Dollar Short-Term Money Market Fund and USD Investment Grade Credit Fund have not been authorised by the Hong Kong Securities and Futures Commission
and are not available for investment by Hong Kong retail investors.

100 Wells Fargo (Lux) Worldwide Fund Notes to financial statements (unaudited)
10. SOFT COMMISSION ARRANGEMENTS
Each Sub-Adviser may, in circumstances in which two or more broker-dealers are in a position to offer comparable resultsfor a portfolio transaction, give preference to a broker-dealer that has provided statistical or other research services to theSub-Adviser. In selecting a broker-dealer under these circumstances, each Sub-Adviser will consider, in addition to thefactors listed above, the quality of the research provided by the broker-dealer. Each Sub-Adviser may cause a Sub-Fund topay higher commissions than those obtainable from other broker-dealers in exchange for such research services. Theresearch services generally include: (1) furnishing advice as to the value of securities, the advisability of investing in,purchasing, or selling securities, and the advisability of securities or purchasers or sellers of securities; (2) furnishinganalyses and reports concerning issuers, industries, securities, economic factors and trends, portfolio strategy, and theperformance of accounts; and (3) effecting securities transactions and performing functions incidental thereto. Byallocating transactions in this manner, each Sub-Adviser is able to supplement its research and analysis with the viewsand information of securities firms. Information so received will be in addition to, and not in lieu of, the services requiredto be performed by the Sub-Adviser under the sub-advisory contracts, and the expenses of each Sub-Adviser will notnecessarily be reduced as a result of the receipt of this supplemental research information.
Furthermore, research services furnished by broker-dealers through which each Sub-Adviser places securitiestransactions for a Sub-Fund may be used by the Sub-Adviser in servicing its other accounts, and although not all ofthese services may be used by the Sub-Adviser in connection with advising the Sub-Fund, they will always be in theinterest of the Sub-Fund.
During the six months ended 30 September 2017, the following Sub-Funds participated in soft commission arrangements:
China Equity Fund
Emerging Markets Equity Fund
Emerging Markets Equity Income Fund
Global Equity Fund
Global Focused Equity Fund
U.S. All Cap Growth Fund
U.S. Large Cap Growth Fund
U.S. Select Equity Fund
U.S. Small Cap Value Fund
11. TRANSACTION COSTS
Each Sub-Fund’s transaction costs incurred during the six months ended 30 September 2017 relate to the purchase or saleof transferable securities, derivatives or other eligible assets. Transaction costs include commission costs, settlement feesand broker fees. Any depositary transaction costs of each Sub-Fund are included on the Statement of operations andchanges in net assets under “Depositary and administration fees”. Not all transaction costs are separately identifiable. Forfixed income investments, forward currency contracts and other derivative contracts, transaction costs are included in thepurchase and sales price of the investment. These transactions costs are captured within the performance of each Sub-Fund.
The transaction costs incurred for the six months ended 30 September 2017 are as follows:
USD
China Equity Fund 34,435
Emerging Markets Equity Fund 47,277
Emerging Markets Equity Income Fund 569,822
EUR Investment Grade Credit Fund 0
Global Equity Fund 18,798
Global Focused Equity Fund 10,402
Global Long/Short Equity Fund 18,588
Global Low Volatility Equity Fund 7,861
Global Opportunity Bond Fund 0
China Equity Fund, EUR Investment Grade Credit Fund, Global Long/Short Equity Fund, Global Low Volatility Equity Fund, Global Opportunity Bond Fund, U.S.
Dollar Short-Term Money Market Fund and USD Investment Grade Credit Fund have not been authorised by the Hong Kong Securities and Futures Commission
and are not available for investment by Hong Kong retail investors.

Notes to financial statements (unaudited) Wells Fargo (Lux) Worldwide Fund 101
USD
U.S. All Cap Growth Fund 154,304
U.S. Dollar Short-Term Money Market Fund 0
U.S. High Yield Bond Fund 15
U.S. Large Cap Growth Fund 14,697
U.S. Select Equity Fund 175,018
U.S. Short-Term High Yield Bond Fund 0
U.S. Small Cap Value Fund 60,295
USD Investment Grade Credit Fund 0
12. SWING PRICING
If on any valuation day the aggregate transactions in shares of a Sub-Fund result in a net increase or decrease in net assets which exceeds a certain percentage of total net assets, as established by the Board of Directors, the NAV of the relevant Sub-Fund will be adjusted by an amount not exceeding 1.50% of that NAV, which reflects the estimated dealing costs that may be incurred by the Sub-Fund and the estimated bid/offer spread of the assets in which the Sub-Fund invests. The adjustment will be an addition when the net movement results in a net increase in total net assets of the Sub-Fund and a deduction when it results in a net decrease. Where a Sub-Fund invests substantially in government bonds or money market securities, the Board of Directors may decide that it is not appropriate to make such an adjustment.
As at 30 September 2017, the NAV of each share class of each Sub-Fund was not subject to any swing pricing adjustment.
13. MERGER TRANSACTION
After the close of business on 16 June 2017, Global Low Volatility Fund acquire the net assets of Analytic Global Low Volatility Equity UCITS Fund were acquired by Global Low Volatility Fund. Shareholders of Analytic Global Low Volatility Equity UCITS Fund received one corresponding shares Global Low Volatility Fund in the transaction.
14. GOVERNANCE STATEMENT
The Board of Directors adheres to the Association of the Luxembourg Fund Industry (“ALFI”) Code of Conduct for Luxembourg investment funds. The code of conduct sets a framework of high-level principles and best practice recommendations for the governance of Luxembourg investment funds.
15. SUBSEQUENT EVENTS
There were no significant events occurring after the date of the Statement of assets and liabilities which would require revision of the figures or disclosure in the financial statements.
China Equity Fund, EUR Investment Grade Credit Fund, Global Long/Short Equity Fund, Global Low Volatility Equity Fund, Global Opportunity Bond Fund, U.S. Dollar Short-Term Money Market Fund and USD Investment Grade Credit Fund have not been authorised by the Hong Kong Securities and Futures Commission and are not available for investment by Hong Kong retail investors.

102 Wells Fargo (Lux) Worldwide Fund Directors, Administration and Management (unaudited)
Registered Office80, route d’EschL-1470 LuxembourgGrand Duchy of Luxembourg
Board of DirectorsNicolaas Marais (starting 4 August 2017)Chairperson of the Board of Directors,President,Wells Fargo Funds Management, LLC
Michael Hogan (until 15 June 2017)Senior Vice President,Head of International Strategy and BusinessDevelopment,Wells Fargo Funds Management, LLC
Jürgen MeischAchalm Capital GmbH
Yves WagnerThe Directors’ Office S.A.
Richard GoddardThe Directors’ Office S.A.
Management CompanyWells Fargo Asset Management Luxembourg S.A.19, rue de BitbourgL-1273 LuxembourgGrand Duchy of Luxembourg
Investment AdviserWells Fargo Funds Management, LLC525 Market StreetSan Francisco, CA 94105United States of America
Sub-AdvisersAnalytic Investors, LLC555 W 5th St Fl 50Los Angeles, CA 90013United States of America
ECM Asset Management Limited34 Grosvenor StreetLondon W1K 4QUUnited Kingdom
First International Advisors, LLCOne Plantation Place30 Fenchurch StreetLondon EC3M 3BDUnited Kingdom
Wells Capital Management Incorporated525 Market StreetSan Francisco, CA 94105United States of America
Wells Capital Management Singapore(a department of Wells Fargo Bank, N.A.)80 Raffles Place #26-20/21UOB Plaza TwoSingapore 048624
Principal DistributorWells Fargo Asset Management Luxembourg S.A.19, rue de BitbourgL-1273 LuxembourgGrand Duchy of Luxembourg
Legal AdvisersElvinger Hoss Prussen, Société anonyme2, Place Winston ChurchillL-1340 LuxembourgGrand Duchy of Luxembourg
Depositary Bank, Administrator, Domiciliary, ListingAgent, Paying Agent, Registrar and Transfer AgentBrown Brothers Harriman (Luxembourg) S.C.A.80, route d’EschL-1470 LuxembourgGrand Duchy of Luxembourg
Auditors (Cabinet de révision agréé)KPMG Luxembourg, Société cooperative39, Avenue John F. KennedyL-1855 LuxembourgGrand Duchy of Luxembourg
Austrian Paying AgentUniCredit Bank Austria AGSchottengasse 6-81010 ViennaAustria
French Representative and Paying AgentCACEIS Bank France1-3 Place Valhubert75103 ParisFrance
German Paying and Information AgentMarcard, Stein & Co AGBallindamm 3620095 HamburgGermany
China Equity Fund, EUR Investment Grade Credit Fund, Global Long/Short Equity Fund, Global Low Volatility Equity Fund, Global Opportunity Bond Fund, U.S.
Dollar Short-Term Money Market Fund and USD Investment Grade Credit Fund have not been authorised by the Hong Kong Securities and Futures Commission
and are not available for investment by Hong Kong retail investors.
Directors, Administration and Management (unaudited) Wells Fargo (Lux) Worldwide Fund 103
Hong Kong RepresentativeBrown Brothers Harriman (Hong Kong) Limited13/F Man Yee Building68 Des Voeux Road CentralHong Kong
Irish Facilities AgentSociété Générale, Dublin BranchIFSC House, 3rd FloorIFSCDublin 1Ireland
Italian Paying AgentSociété Générale Securities Services S.p.A.Via Benigno Crespi 19/A-MAC 220159 MilanItaly
Singapore RepresentativeRBC Investor Services Trust Singapore Limited77 Robinson Road#18-00 Robinson 77Singapore 068896Singapore
Spanish Representative AgentAllfunds Bank S.A.Estafeta, 6, La MoralejaComplejo Plaza de la Fuente Edificio 328109, AlcobendasMadridSpain
Swedish Paying AgentSkandinaviska Enskilda Banken ABSergels Torg H1, SE-106 40 StockholmSweden
Swiss Paying and Representative AgentBNP Paribas Securities Services, S.A.*Succursale de ZurichSelnaustrasse 168002 ZurichSwitzerland
UK RepresentativeWells Fargo Securities International LimitedOne Plantation Place30 Fenchurch StreetLondon EC3M 3BDUnited Kingdom
* BNP Paribas Securities Services, Paris, Succursale de Zurich, Selnaustrasse 16, 8002 Zurich has been authorised by the Swiss Financial MarketSupervisory Authority (FINMA) as Swiss Paying and Representative Agent of the Wells Fargo (Lux) Worldwide Fund. The Wells Fargo (Lux) WorldwideFund’s prospectus, key investor information documents, articles of incorporation, and annual and semi-annual reports, as well as the list ofsubscriptions and redemptions, are available at the office of the Swiss Paying and Representative Agent, free of charge.
China Equity Fund, EUR Investment Grade Credit Fund, Global Long/Short Equity Fund, Global Low Volatility Equity Fund, Global Opportunity Bond Fund, U.S.
Dollar Short-Term Money Market Fund and USD Investment Grade Credit Fund have not been authorised by the Hong Kong Securities and Futures Commission
and are not available for investment by Hong Kong retail investors.
104 Wells Fargo (Lux) Worldwide Fund General Information (unaudited)
Current Prospectus
The Fund’s most recent prospectus and KIIDs may be obtained upon request and free of charge from the InvestmentAdviser, the Administrator and registered office of the Fund or under www.wellsfargoworldwidefund.com.
Publication of Prices and Notices to Shareholders
Notice of general meetings and notices to shareholders are given in accordance with Luxembourg law and regulations.The issue and redemption prices are available from the registered office on each dealing day.
Purchases and Sales
A detailed list of investments purchased and sold for each Sub-Fund during the financial year is available upon request,free of charge, from the registered office of the Fund.*
Reports and Articles of Incorporation of the Fund
Copies of the articles of incorporation of the Fund, this unaudited semi-annual report and the latest audited annualreport may also be obtained free of charge from the registered office of the Fund.
* A detailed list of investments purchased and sold for each Sub-Fund registered in Germany during the financial period is also available on request, free of charge,at the offices of the German Paying and Information Agent, Marcard, Stein & Co AG, Ballindamm 36, 30095 Hamburg.
China Equity Fund, EUR Investment Grade Credit Fund, Global Long/Short Equity Fund, Global Low Volatility Equity Fund, Global Opportunity Bond Fund, U.S.
Dollar Short-Term Money Market Fund and USD Investment Grade Credit Fund have not been authorised by the Hong Kong Securities and Futures Commission
and are not available for investment by Hong Kong retail investors.

Appendix I (unaudited) Wells Fargo (Lux) Worldwide Fund 105
Total Expense Ratios
Total Expense Ratio (TER) is calculated as the total of all expenses (excluding bank interest), divided by the average netassets of the Sub-Fund, expressed as a percentage. The ratios are annualised and in the process of the average net assetscalculation, week-ends are included. The TER excludes the transaction costs disclosed in Note 11 in the Notes to theFinancial Statements.
For the six months ended 30 September 2017, the TERs are as follows:
China Equity Fund
Gross TER Waiver Net TERCapped
Expense Ratio
Class A (SEK) Shares-acc. 2.02% (0.22)% 1.80% 1.80%
Class A (USD) Shares-acc. 2.02% (0.22)% 1.80% 1.80%
Class I (EUR) Shares-acc. 1.33% (0.18)% 1.15% 1.15%
Class I (GBP) Shares-acc. 1.33% (0.18)% 1.15% 1.15%
Class I (USD) Shares-acc. 1.33% (0.18)% 1.15% 1.15%
Class Z (GBP) Shares-acc. 1.37% (0.22)% 1.15% 1.15%
Emerging Markets Equity Fund
Gross TER Waiver Net TERCapped
Expense Ratio
Class A (GBP) Shares-acc. 2.11% 0.00% 2.11% 2.20%
Class A (USD) Shares-acc. 2.12% 0.00% 2.12% 2.20%
Class I (AUD) Shares-distr. 1.30% 0.00% 1.30% 1.45%
Class I (EUR) Shares-acc. 1.33% 0.00% 1.33% 1.45%
Class I (GBP) Shares-acc. 1.33% 0.00% 1.33% 1.45%
Class I (USD) Shares-acc. 1.33% 0.00% 1.33% 1.45%
Emerging Markets Equity Income Fund
Gross TER Waiver Net TERCapped
Expense Ratio
Class A (USD) Shares-acc. 2.06% 0.00% 2.06% 2.15%
Class A (USD) Shares-gross distr. 2.06% 0.00% 2.06% 2.15%
Class I (AUD) Shares-distr. 1.27% 0.00% 1.27% 1.40%
Class I (EUR) Shares-acc. 1.26% 0.00% 1.26% 1.40%
Class I (GBP) Shares-gross distr. 0.87% 0.00% 0.87% 1.40%
Class I (USD) Shares-acc. 1.27% 0.00% 1.27% 1.40%
Class I (USD) Shares-gross distr. 1.23% 0.00% 1.23% 1.40%
Class Z (GBP) Shares-acc. 1.26% 0.00% 1.26% 1.40%
EUR Investment Grade Credit Fund1
Gross TER Waiver Net TERCapped
Expense Ratio
Class I (CHF) Shares-acc. (hedged) 1 0.64% (0.19)% 0.45% 0.45%
Class I (EUR) Shares-acc. 1 0.59% (0.14)% 0.45% 0.45%
Class I (EUR) Shares-distr. 1 0.59% (0.14)% 0.45% 0.45%
1 The Sub-Fund and each class commenced operations on 19 June 2017. Data for the TER calculation is and based on information for the period from
19 June 2017 to 30 September 2017 and annualised.
China Equity Fund, EUR Investment Grade Credit Fund, Global Long/Short Equity Fund, Global Low Volatility Equity Fund, Global Opportunity Bond Fund, U.S.
Dollar Short-Term Money Market Fund and USD Investment Grade Credit Fund have not been authorised by the Hong Kong Securities and Futures Commission
and are not available for investment by Hong Kong retail investors.
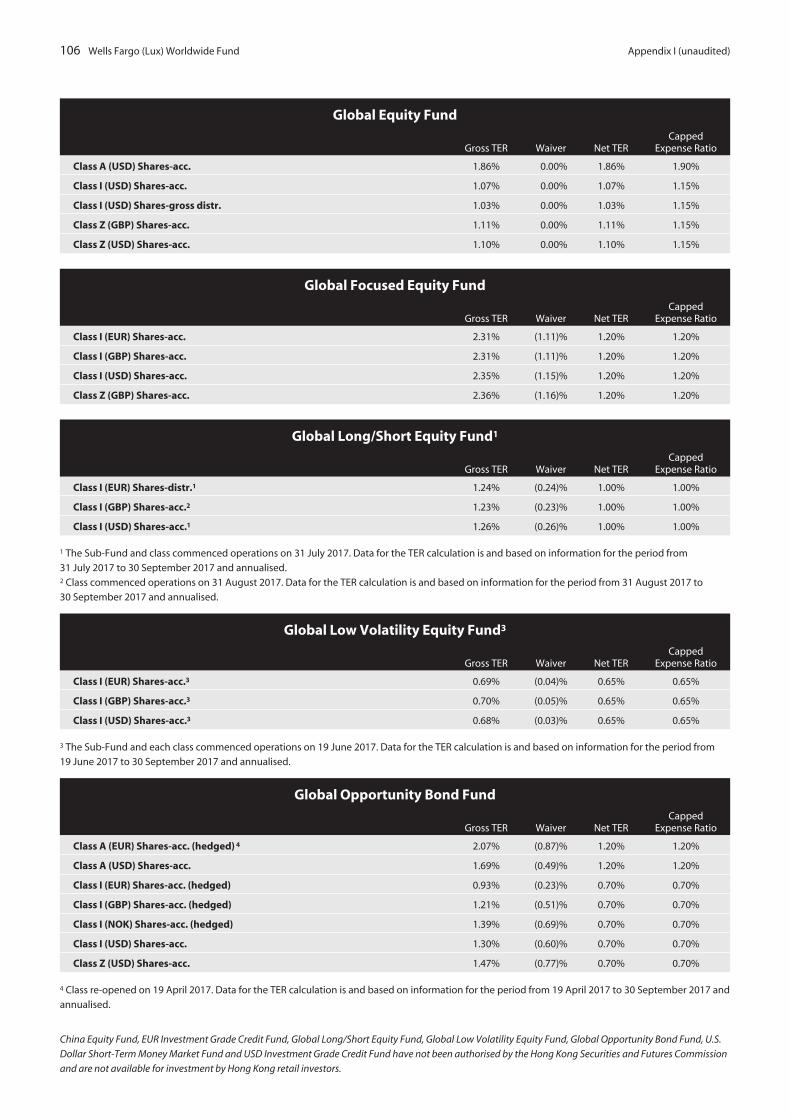
106 Wells Fargo (Lux) Worldwide Fund Appendix I (unaudited)
Global Equity Fund
Gross TER Waiver Net TERCapped
Expense Ratio
Class A (USD) Shares-acc. 1.86% 0.00% 1.86% 1.90%
Class I (USD) Shares-acc. 1.07% 0.00% 1.07% 1.15%
Class I (USD) Shares-gross distr. 1.03% 0.00% 1.03% 1.15%
Class Z (GBP) Shares-acc. 1.11% 0.00% 1.11% 1.15%
Class Z (USD) Shares-acc. 1.10% 0.00% 1.10% 1.15%
Global Focused Equity Fund
Gross TER Waiver Net TERCapped
Expense Ratio
Class I (EUR) Shares-acc. 2.31% (1.11)% 1.20% 1.20%
Class I (GBP) Shares-acc. 2.31% (1.11)% 1.20% 1.20%
Class I (USD) Shares-acc. 2.35% (1.15)% 1.20% 1.20%
Class Z (GBP) Shares-acc. 2.36% (1.16)% 1.20% 1.20%
Global Long/Short Equity Fund1
Gross TER Waiver Net TERCapped
Expense Ratio
Class I (EUR) Shares-distr.1 1.24% (0.24)% 1.00% 1.00%
Class I (GBP) Shares-acc.2 1.23% (0.23)% 1.00% 1.00%
Class I (USD) Shares-acc.1 1.26% (0.26)% 1.00% 1.00%
1 The Sub-Fund and class commenced operations on 31 July 2017. Data for the TER calculation is and based on information for the period from
31 July 2017 to 30 September 2017 and annualised.2 Class commenced operations on 31 August 2017. Data for the TER calculation is and based on information for the period from 31 August 2017 to
30 September 2017 and annualised.
Global Low Volatility Equity Fund3
Gross TER Waiver Net TERCapped
Expense Ratio
Class I (EUR) Shares-acc.3 0.69% (0.04)% 0.65% 0.65%
Class I (GBP) Shares-acc.3 0.70% (0.05)% 0.65% 0.65%
Class I (USD) Shares-acc.3 0.68% (0.03)% 0.65% 0.65%
3 The Sub-Fund and each class commenced operations on 19 June 2017. Data for the TER calculation is and based on information for the period from
19 June 2017 to 30 September 2017 and annualised.
Global Opportunity Bond Fund
Gross TER Waiver Net TERCapped
Expense Ratio
Class A (EUR) Shares-acc. (hedged) 4 2.07% (0.87)% 1.20% 1.20%
Class A (USD) Shares-acc. 1.69% (0.49)% 1.20% 1.20%
Class I (EUR) Shares-acc. (hedged) 0.93% (0.23)% 0.70% 0.70%
Class I (GBP) Shares-acc. (hedged) 1.21% (0.51)% 0.70% 0.70%
Class I (NOK) Shares-acc. (hedged) 1.39% (0.69)% 0.70% 0.70%
Class I (USD) Shares-acc. 1.30% (0.60)% 0.70% 0.70%
Class Z (USD) Shares-acc. 1.47% (0.77)% 0.70% 0.70%
4 Class re-opened on 19 April 2017. Data for the TER calculation is and based on information for the period from 19 April 2017 to 30 September 2017 and
annualised.
China Equity Fund, EUR Investment Grade Credit Fund, Global Long/Short Equity Fund, Global Low Volatility Equity Fund, Global Opportunity Bond Fund, U.S.
Dollar Short-Term Money Market Fund and USD Investment Grade Credit Fund have not been authorised by the Hong Kong Securities and Futures Commission
and are not available for investment by Hong Kong retail investors.

Appendix I (unaudited) Wells Fargo (Lux) Worldwide Fund 107
U.S. All Cap Growth Fund
Gross TER Waiver Net TERCapped
Expense Ratio
Class A (GBP) Shares-acc. 1.75% 0.00% 1.75% 1.90%
Class A (USD) Shares-acc. 1.75% 0.00% 1.75% 1.90%
Class I (CHF) Shares-acc. (hedged) 0.89% 0.00% 0.89% 1.10%
Class I (EUR) Shares-acc. 0.91% 0.00% 0.91% 1.10%
Class I (GBP) Shares-acc. 0.91% 0.00% 0.91% 1.10%
Class I (USD) Shares-acc. 0.91% 0.00% 0.91% 1.10%
Class Z (GBP) Shares-acc. 0.95% 0.00% 0.95% 1.10%
Class Z (GBP) Shares-distr. 0.94% 0.00% 0.94% 1.10%
Class Z (USD) Shares-acc. 0.95% 0.00% 0.95% 1.10%
Class Z (USD) Shares-distr. 0.95% 0.00% 0.95% 1.10%
U.S. Dollar Short-Term Money Market Fund
Gross TER Waiver Net TERCapped
Expense Ratio
Class A (USD) Shares-distr. 1.30% (0.16)% 1.14% 1.20%
Class I (USD) Shares-distr. 0.30% (0.10)% 0.20% 0.20%
Service Class (USD) Shares-distr. 0.54% (0.09)% 0.45% 0.45%
U.S. High Yield Bond Fund
Gross TER Waiver Net TERCapped
Expense Ratio
Class A (USD) Shares-acc. 1.69% 0.00% 1.69% 1.75%
Class A (USD) Shares-gross distr. 1.69% 0.00% 1.69% 1.75%
Class I (EUR) Shares-acc. 0.84% 0.00% 0.84% 0.95%
Class I (EUR) Shares-acc. (hedged) 0.85% 0.00% 0.85% 0.95%
Class I (USD) Shares-acc. 0.85% 0.00% 0.85% 0.95%
Class I (USD) Shares-gross distr. 0.82% 0.00% 0.82% 0.95%
Class Z (GBP) Shares-acc. 0.89% 0.00% 0.89% 0.95%
U.S. Large Cap Growth Fund
Gross TER Waiver Net TERCapped
Expense Ratio
Class A (USD) Shares-acc. 1.80% 0.00% 1.80% 1.80%
Class I (EUR) Shares-acc. 0.94% 0.00% 0.94% 1.00%
Class I (USD) Shares-acc. 0.94% 0.00% 0.94% 1.00%
Class Z (GBP) Shares-acc. 1.03% 0.00% 1.03% 1.05%
China Equity Fund, EUR Investment Grade Credit Fund, Global Long/Short Equity Fund, Global Low Volatility Equity Fund, Global Opportunity Bond Fund, U.S.
Dollar Short-Term Money Market Fund and USD Investment Grade Credit Fund have not been authorised by the Hong Kong Securities and Futures Commission
and are not available for investment by Hong Kong retail investors.

108 Wells Fargo (Lux) Worldwide Fund Appendix I (unaudited)
U.S. Select Equity Fund
Gross TER Waiver Net TERCapped
Expense Ratio
Class A (EUR) Shares-acc. 2.12% 0.00% 2.12% 2.20%
Class A (EUR) Shares-acc. (hedged) 2.08% 0.00% 2.08% 2.20%
Class A (GBP) Shares-distr. 2.07% 0.00% 2.07% 2.20%
Class A (USD) Shares-acc. 2.11% 0.00% 2.11% 2.20%
Class I (EUR) Shares-acc. 1.23% 0.00% 1.23% 1.40%
Class I (EUR) Shares-acc. (hedged) 1.26% 0.00% 1.26% 1.40%
Class I (GBP) Shares-distr. 1.23% 0.00% 1.23% 1.40%
Class I (USD) Shares-acc. 1.28% 0.00% 1.28% 1.40%
Class X (GBP) Shares-distr. 1.03% 0.00% 1.03% 1.15%
Class X (USD) Shares-distr. 1.06% 0.00% 1.06% 1.15%
U.S. Short-Term High Yield Bond Fund
Gross TER Waiver Net TERCapped
Expense Ratio
Class A (EUR) Shares-acc. (hedged) 1.46% 0.00% 1.46% 1.60%
Class A (USD) Shares-acc. 1.49% 0.00% 1.49% 1.60%
Class A (USD) Shares-gross distr. 1.45% 0.00% 1.45% 1.60%
Class I (EUR) Shares-distr. (hedged) 0.65% 0.00% 0.65% 0.80%
Class I (GBP) Shares-distr. (hedged) 0.65% 0.00% 0.65% 0.80%
Class I (USD) Shares-acc. 0.65% 0.00% 0.65% 0.80%
Class I (USD) Shares-gross distr. 0.65% 0.00% 0.65% 0.80%
U.S. Small Cap Value Fund
Gross TER Waiver Net TERCapped
Expense Ratio
Class I (EUR) Shares-acc. (hedged) 2.12% (0.92)% 1.20% 1.20%
Class I (GBP) Shares-acc.1 1.71% (0.51)% 1.20% 1.20%
Class I (GBP) Shares-acc. (hedged) 2.14% (0.94)% 1.20% 1.20%
Class I (USD) Shares-acc. 2.11% (0.91)% 1.20% 1.20%
Class Z (GBP) Shares-acc. (hedged) 2.16% (0.96)% 1.20% 1.20%
Class Z (USD) Shares-acc. 1.74% (0.54)% 1.20% 1.20%
1 Class commenced operations on 26 April 2017. Data for the TER calculation is and based on information for the period from 26 April 2017 to
30 September 2017 and annualised.
USD Investment Grade Credit Fund
Gross TER Waiver Net TERCapped
Expense Ratio
Class A (USD) Shares-acc. 0.97% (0.02)% 0.95% 0.95%
Class I (EUR) Shares-distr. (hedged) 0.48% (0.03)% 0.45% 0.45%
Class I (USD) Shares-distr. 0.48% (0.03)% 0.45% 0.45%
Class I (USD) Shares-gross distr. 2 0.46% (0.06)% 0.40% 0.45%
2 Class commenced operations on 18 August 2017. Data for the TER calculation is and based on information for the period from 18 August 2017 to
30 September 2017 and annualised.
China Equity Fund, EUR Investment Grade Credit Fund, Global Long/Short Equity Fund, Global Low Volatility Equity Fund, Global Opportunity Bond Fund, U.S.
Dollar Short-Term Money Market Fund and USD Investment Grade Credit Fund have not been authorised by the Hong Kong Securities and Futures Commission
and are not available for investment by Hong Kong retail investors.

Appendix II (unaudited) Wells Fargo (Lux) Worldwide Fund 109
Performance
Past performance may not be a reliable guide to future performance. The value of investments and the income fromthem can fall as well as rise and is not guaranteed. Income may fluctuate in accordance with market conditions andtaxation arrangements. You may not get back the amount originally invested. Changes in the rates of exchange betweencurrencies may cause the value of investments or the income from them to diminish or increase. Fluctuation may beparticularly marked in the case of a higher volatility Sub-Fund, whose value may fall suddenly and substantially. You maylose the total value of your initial investment. The performance figures do not consider charges and fees that may belevied at the time of subscription or redemption of shares. Levels and bases of taxation may change from time to time.
Subscriptions may be made only on the basis of the current prospectus, of which the most recent unaudited interimreport and accounts form an integral part, and key investor information documents of the Fund. Copies are available fromthe registered office of the Fund.
Calculation methodology is based on industry standards.
Returns for periods of less than one year are not annualised. All returns are as at 30 September 2017 unless otherwise noted.
Return excluding sales charges
1 Year 5 Year
SinceInception
Date
1 year*(from
1/1/2016 to31/12/2016)
ActualInception
Date
China Equity Fund
Class A (SEK) Shares-acc. 20.47% 18.22% 3.33% 28/6/2013
Class A (USD) Shares-acc. 26.90% 12.07% 13.67% (4.25)% 30/1/2009
Class I (EUR) Shares-acc. 21.41% 14.80% 15.65% (0.41)% 30/1/2009
Class I (GBP) Shares-acc. 23.56% 17.19% 13.84% 15.39% 2/4/2009
Class I (USD) Shares-acc. 27.74% 12.90% 14.52% (3.54)% 30/1/2009
Class Z (GBP) Shares-acc. 23.56% 16.62% 15.38% 31/10/2012
Emerging Markets Equity Fund
Class A (GBP) Shares-acc. 16.38% 7.89% 3.64% 33.46% 15/12/2010
Class A (USD) Shares-acc. 20.28% 3.93% 1.26% 11.53% 15/12/2010
Class I (AUD) Shares-distr. 18.26% 11.64% 10.23% 18.00% 30/9/2011
Class I (EUR) Shares-acc. 15.23% 6.53% 3.85% 16.05% 15/12/2010
Class I (GBP) Shares-acc. 17.25% 8.74% 4.46% 34.45% 15/12/2010
Class I (USD) Shares-acc. 21.22% 4.77% 2.06% 12.49% 15/12/2010
Emerging Markets Equity Income Fund
Class A (USD) Shares-acc. 13.73% 3.13% 4.54% 5.26% 29/6/2012
Class A (USD) Shares-gross distr. 13.71% 18.83% 10.85% 29/2/2016
Class I (AUD) Shares-distr. 11.87% 8.54% 7.17% 2/6/2014
Class I (EUR) Shares-acc. 8.96% 5.69% 6.73% 9.51% 29/6/2012
Class I (GBP) Shares-gross distr. 10.99% 9.47% 26.93% 29/5/2015
Class I (USD) Shares-acc. 14.63% 3.93% 5.34% 6.10% 29/6/2012
Class I (USD) Shares-gross distr. 14.65% 19.80% 11.61% 29/2/2016
Class Z (GBP) Shares-acc. 10.95% 8.05% 26.91% 31/10/2012
EUR Investment Grade Credit Fund
Class I (CHF) Shares-acc. (hedged) 0.57% 19/6/2017
Class I (EUR) Shares-acc. 0.72% 19/6/2017
Class I (EUR) Shares-distr. 0.71% 19/6/2017
Global Equity Fund**
Class A (USD) Shares-acc. 20.88% 9.02% 9.36% 4.29% 1/4/2008
Class I (USD) Shares-acc. 21.83% 9.87% 10.20% 5.12% 1/4/2008
Class Z (GBP) Shares-acc. 17.80% 14.23% 25.69% 31/10/2012
China Equity Fund, EUR Investment Grade Credit Fund, Global Long/Short Equity Fund, Global Low Volatility Equity Fund, Global Opportunity Bond Fund, U.S.
Dollar Short-Term Money Market Fund and USD Investment Grade Credit Fund have not been authorised by the Hong Kong Securities and Futures Commission
and are not available for investment by Hong Kong retail investors.

110 Wells Fargo (Lux) Worldwide Fund Appendix II (unaudited)
Return excluding sales charges
1 Year 5 Year
SinceInception
Date
1 Year*(from
1/1/2016 to31/12/2016)
ActualInception
Date
Global Focused Equity Fund
Class I (EUR) Shares-acc. 19.22% 20.25% 18.88% 30/6/2016
Class I (GBP) Shares-acc. 21.33% 25.80% 21.80% 30/6/2016
Class I (USD) Shares-acc. 25.44% 26.46% 12.76% 30/6/2016
Class Z (GBP) Shares-acc. 21.33% 25.80% 21.80% 30/6/2016
Global Long/Short Equity Fund
Class I (EUR) Shares-distr. 3.39% 31/7/2017
Class I (GBP) Shares-acc. (2.16)% 31/8/2017
Class I (USD) Shares-acc. 3.13% 31/7/2017
Global Low Volatility Equity Fund
Class I (EUR) Shares-acc.*** (1.90)% 28/4/2017
Class I (GBP) Shares-acc.*** 6.37% 9.79% 24.89% 1/3/2013
Class I (USD) Shares-acc.*** 9.67% 7.87% 4.70% 14/1/2013
Global Opportunity Bond Fund
Class A (EUR) Shares-acc. (hedged) (2.03)% 0.17% 0.44% (0.39)% 29/6/2012
Class A (USD) Shares-acc. (0.20)% 1.42% 1.79% 1.13% 29/6/2012
Class I (EUR) Shares-acc. (hedged) (1.61)% 0.67% 0.95% 0.14% 29/6/2012
Class I (GBP) Shares-acc. (hedged) (0.88)% 1.29% 1.48% 1.16% 29/6/2012
Class I (USD) Shares-acc. 0.31% 1.92% 2.30% 1.64% 29/6/2012
Class Z (USD) Shares-acc. 0.31% 1.85% 1.63% 31/10/2012
U.S. All Cap Growth Fund
Class A (GBP) Shares-acc. 16.07% 15.08% 18.88% 17.79% 2/4/2009
Class A (USD) Shares-acc. 19.98% 10.86% 10.18% (1.54)% 2/5/2008
Class I (EUR) Shares-acc. 15.00% 13.68% 14.31% 2.50% 2/5/2008
Class I (GBP) Shares-acc. 17.03% 16.05% 19.88% 18.77% 2/4/2009
Class I (USD) Shares-acc. 20.99% 11.80% 11.09% (0.71)% 2/5/2008
Class Z (GBP) Shares-acc. 16.98% 17.35% 18.72% 31/10/2012
Class Z (GBP) Shares-distr. 16.99% 15.04% 18.72% 13/1/2014
Class Z (USD) Shares-acc. 20.94% 13.00% (0.75)% 31/10/2012
Class Z (USD) Shares-distr. 20.94% 8.79% (0.75)% 29/5/2015
U.S. Dollar Short-Term Money Market Fund
Class A (USD) Shares-distr. 0.03% 0.01% 0.01% 0.01% 20/6/2011
Class I (USD) Shares-distr. 0.80% 0.22% 0.18% 0.36% 20/6/2011
Service Class (USD) Shares-distr. 0.55% 0.13% 0.10% 0.11% 20/6/2011
U.S. High Yield Bond Fund
Class A (USD) Shares-acc. 7.94% 5.19% 6.63% 13.40% 1/4/2008
Class A (USD) Shares-gross distr. 7.93% 13.91% 15.62% 29/2/2016
Class I (EUR) Shares-acc. 3.46% 7.90% 10.74% 18.30% 1/4/2008
Class I (EUR) Shares-acc. (hedged) 6.88% 9.82% 8.29% 29/4/2016
Class I (USD) Shares-acc. 8.85% 6.06% 7.50% 14.34% 1/4/2008
Class I (USD) Shares-gross distr. 8.87% 14.90% 16.46% 29/2/2016
Class Z (GBP) Shares-acc. 5.24% 10.06% 36.73% 31/10/2012
China Equity Fund, EUR Investment Grade Credit Fund, Global Long/Short Equity Fund, Global Low Volatility Equity Fund, Global Opportunity Bond Fund, U.S.
Dollar Short-Term Money Market Fund and USD Investment Grade Credit Fund have not been authorised by the Hong Kong Securities and Futures Commission
and are not available for investment by Hong Kong retail investors.

Appendix II (unaudited) Wells Fargo (Lux) Worldwide Fund 111
Return excluding sales charges
1 Year 5 Year
SinceInception
Date
1 Year*(from
1/1/2016 to31/12/2016)
ActualInception
Date
U.S. Large Cap Growth Fund
Class A (USD) Shares-acc. 22.48% 13.00% 7.04% (1.61)% 1/4/2008
Class I (EUR) Shares-acc. 17.40% 15.99% 11.19% 2.41% 1/4/2008
Class I (USD) Shares-acc. 23.52% 14.07% 7.96% (0.81)% 1/4/2008
Class Z (GBP) Shares-acc. 19.37% 19.58% 18.56% 31/10/2012
U.S. Select Equity Fund
Class A (EUR) Shares-acc. 4.31% 2.37% 20.79% 30/1/2015
Class A (USD) Shares-acc. 9.74% 4.10% 16.95% 30/1/2015
Class I (EUR) Shares-acc. (hedged) 8.77% 3.83% 16.43% 30/1/2015
Class I (USD) Shares-acc. 10.66% 4.97% 17.97% 30/1/2015
Class X (GBP) Shares-distr. 7.29% 10.03% 41.44% 30/1/2015
Class X (USD) Shares-distr. 10.90% 5.30% 18.23% 30/1/2015
U.S. Short-Term High Yield Bond Fund
Class A (USD) Shares-acc. 1.87% 1.95% 2.01% 3.20% 29/6/2012
Class I (EUR) Shares-distr. (hedged) 0.85% 1.94% 2.68% 31/7/2013
Class I (GBP) Shares-distr. (hedged) 1.63% 2.42% 3.54% 31/7/2013
Class I (USD) Shares-acc. 2.73% 2.79% 2.85% 4.08% 29/6/2012
Class I (USD) Shares-gross distr. 2.73% 3.78% 3.73% 29/2/2016
U.S. Small Cap Value Fund
Class I (GBP) Shares-acc. 0.23% 26/4/2017
Class I (USD) Shares-acc. 22.46% 27.52% 26.77% 30/6/2016
Class Z (GBP) Shares-acc. (hedged) 21.21% 26.26% 26.28% 30/6/2016
Class Z (USD) Shares-acc. 22.46% 27.52% 26.77% 30/6/2016
USD Investment Grade Credit Fund
Class A (USD) Shares-acc. 6.46% 0.92% 15/12/2016
Class I (EUR) Shares-distr. (hedged) 5.19% 0.82% 15/12/2016
Class I (USD) Shares-acc. 6.90% 0.94% 15/12/2016
Class I (USD) Shares- distr. 6.88% 0.94% 15/12/2016
Class I (USD) Shares-gross distr. 0.23% 24/8/2017
* If a class is less than 1 year old as of 31 December 2016, then inception date through 31 December 2016 return is shown.
** Global Equity Fund was renamed and repositioned on 17 May 2010. Performance figures, excluding sales charges, include the performance of the
Sub-Fund prior to its repositioning. The performance of each share class prior to and after the repositioning is as follows:
Return excluding sales charges
Inception through16/5/2010
17/5/2010 through30/9/2017
Class A (USD) Shares-acc. . . . . . . . . . . . . . . . . . . . . . . . (12.75)% 9.36%
Class I (USD) Shares-acc. . . . . . . . . . . . . . . . . . . . . . . . . (12.09)% 10.20%
*** Performance prior to 19 June 2017 represents the past performance of Analytic Global Low Volatility Equity UCITS Fund which merged with Global
Low Volatility Equity Fund, at close of business on 16 June 2017.
China Equity Fund, EUR Investment Grade Credit Fund, Global Long/Short Equity Fund, Global Low Volatility Equity Fund, Global Opportunity Bond Fund, U.S.
Dollar Short-Term Money Market Fund and USD Investment Grade Credit Fund have not been authorised by the Hong Kong Securities and Futures Commission
and are not available for investment by Hong Kong retail investors.
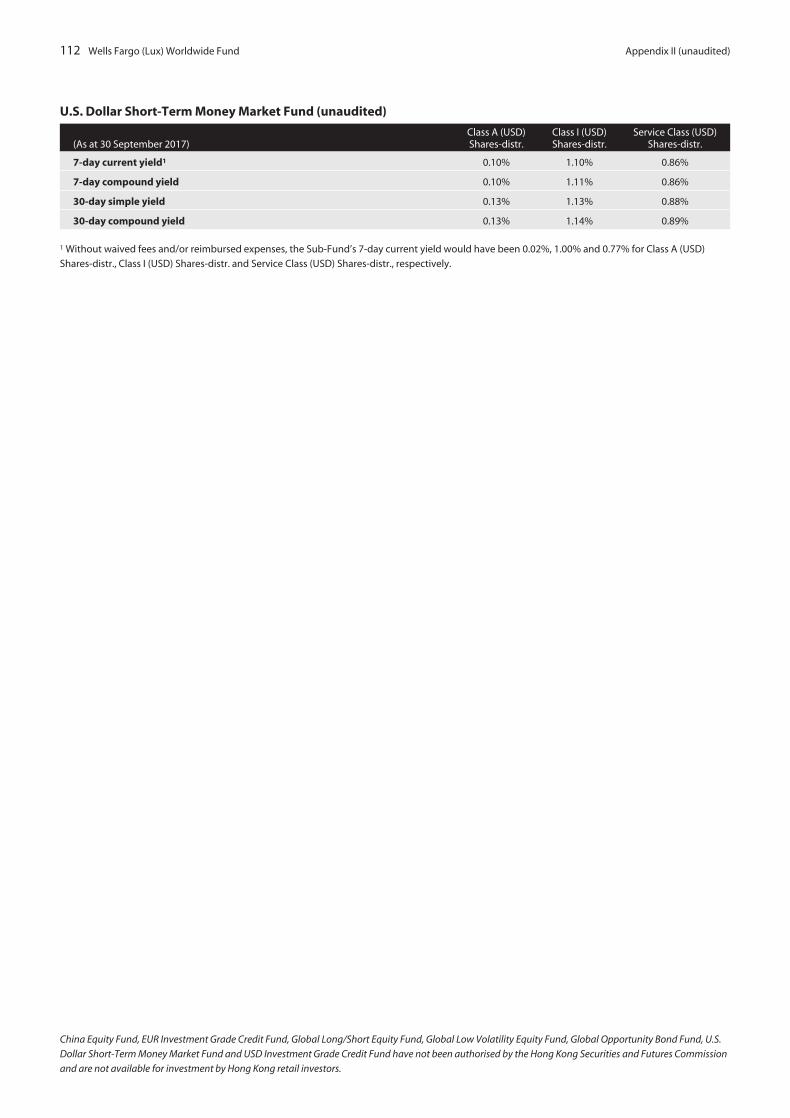
112 Wells Fargo (Lux) Worldwide Fund Appendix II (unaudited)
U.S. Dollar Short-Term Money Market Fund (unaudited)
(As at 30 September 2017)Class A (USD)Shares-distr.
Class I (USD)Shares-distr.
Service Class (USD)Shares-distr.
7-day current yield1 0.10% 1.10% 0.86%
7-day compound yield 0.10% 1.11% 0.86%
30-day simple yield 0.13% 1.13% 0.88%
30-day compound yield 0.13% 1.14% 0.89%
1 Without waived fees and/or reimbursed expenses, the Sub-Fund’s 7-day current yield would have been 0.02%, 1.00% and 0.77% for Class A (USD)
Shares-distr., Class I (USD) Shares-distr. and Service Class (USD) Shares-distr., respectively.
China Equity Fund, EUR Investment Grade Credit Fund, Global Long/Short Equity Fund, Global Low Volatility Equity Fund, Global Opportunity Bond Fund, U.S.
Dollar Short-Term Money Market Fund and USD Investment Grade Credit Fund have not been authorised by the Hong Kong Securities and Futures Commission
and are not available for investment by Hong Kong retail investors.
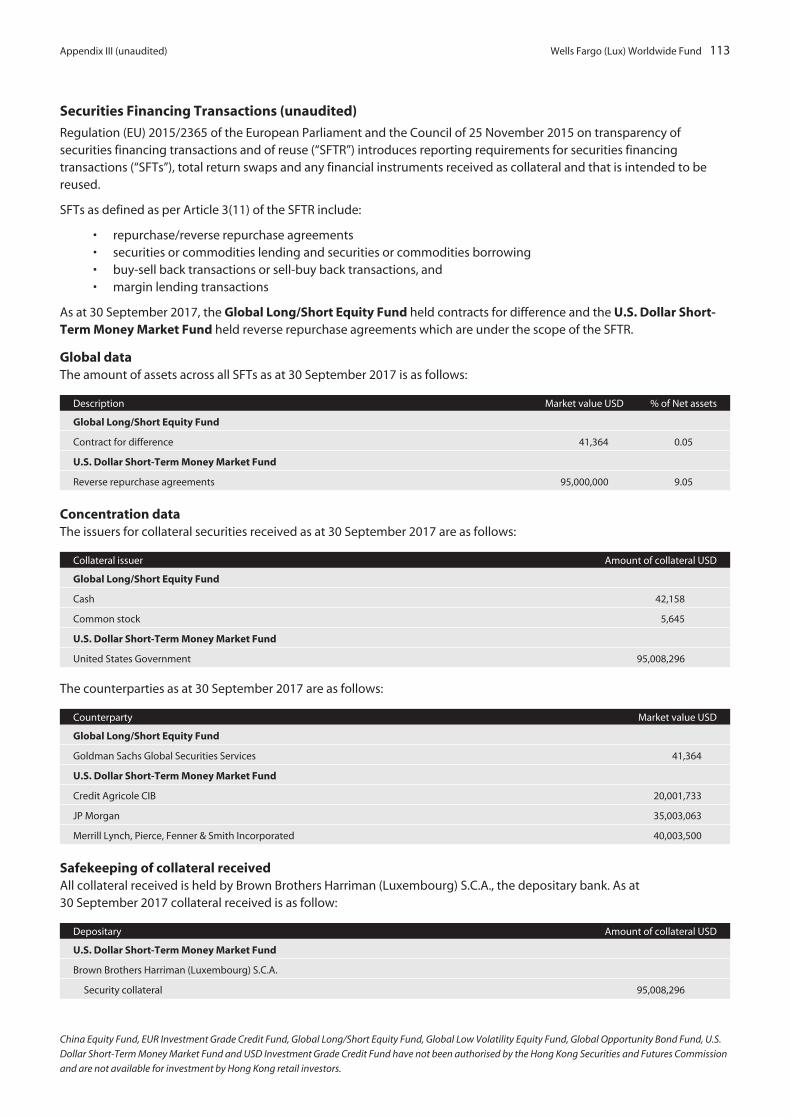
Appendix III (unaudited) Wells Fargo (Lux) Worldwide Fund 113
Securities Financing Transactions (unaudited)
Regulation (EU) 2015/2365 of the European Parliament and the Council of 25 November 2015 on transparency ofsecurities financing transactions and of reuse (“SFTR”) introduces reporting requirements for securities financingtransactions (“SFTs”), total return swaps and any financial instruments received as collateral and that is intended to bereused.
SFTs as defined as per Article 3(11) of the SFTR include:
• repurchase/reverse repurchase agreements• securities or commodities lending and securities or commodities borrowing• buy-sell back transactions or sell-buy back transactions, and• margin lending transactions
As at 30 September 2017, the Global Long/Short Equity Fund held contracts for difference and the U.S. Dollar Short-Term Money Market Fund held reverse repurchase agreements which are under the scope of the SFTR.
Global dataThe amount of assets across all SFTs as at 30 September 2017 is as follows:
Description Market value USD % of Net assets
Global Long/Short Equity Fund
Contract for difference 41,364 0.05
U.S. Dollar Short-Term Money Market Fund
Reverse repurchase agreements 95,000,000 9.05
Concentration dataThe issuers for collateral securities received as at 30 September 2017 are as follows:
Collateral issuer Amount of collateral USD
Global Long/Short Equity Fund
Cash 42,158
Common stock 5,645
U.S. Dollar Short-Term Money Market Fund
United States Government 95,008,296
The counterparties as at 30 September 2017 are as follows:
Counterparty Market value USD
Global Long/Short Equity Fund
Goldman Sachs Global Securities Services 41,364
U.S. Dollar Short-Term Money Market Fund
Credit Agricole CIB 20,001,733
JP Morgan 35,003,063
Merrill Lynch, Pierce, Fenner & Smith Incorporated 40,003,500
Safekeeping of collateral receivedAll collateral received is held by Brown Brothers Harriman (Luxembourg) S.C.A., the depositary bank. As at30 September 2017 collateral received is as follow:
Depositary Amount of collateral USD
U.S. Dollar Short-Term Money Market Fund
Brown Brothers Harriman (Luxembourg) S.C.A.
Security collateral 95,008,296
China Equity Fund, EUR Investment Grade Credit Fund, Global Long/Short Equity Fund, Global Low Volatility Equity Fund, Global Opportunity Bond Fund, U.S.
Dollar Short-Term Money Market Fund and USD Investment Grade Credit Fund have not been authorised by the Hong Kong Securities and Futures Commission
and are not available for investment by Hong Kong retail investors.
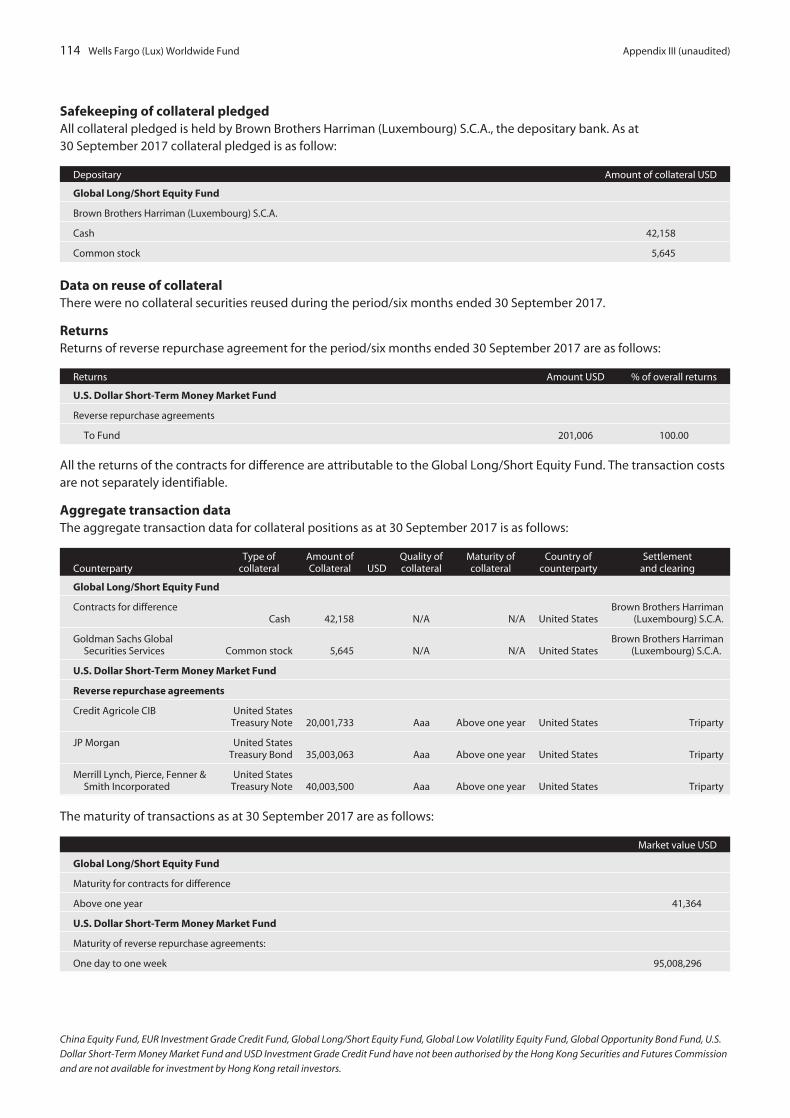
114 Wells Fargo (Lux) Worldwide Fund Appendix III (unaudited)
Safekeeping of collateral pledgedAll collateral pledged is held by Brown Brothers Harriman (Luxembourg) S.C.A., the depositary bank. As at30 September 2017 collateral pledged is as follow:
Depositary Amount of collateral USD
Global Long/Short Equity Fund
Brown Brothers Harriman (Luxembourg) S.C.A.
Cash 42,158
Common stock 5,645
Data on reuse of collateralThere were no collateral securities reused during the period/six months ended 30 September 2017.
ReturnsReturns of reverse repurchase agreement for the period/six months ended 30 September 2017 are as follows:
Returns Amount USD % of overall returns
U.S. Dollar Short-Term Money Market Fund
Reverse repurchase agreements
To Fund 201,006 100.00
All the returns of the contracts for difference are attributable to the Global Long/Short Equity Fund. The transaction costsare not separately identifiable.
Aggregate transaction dataThe aggregate transaction data for collateral positions as at 30 September 2017 is as follows:
CounterpartyType of
collateralAmount ofCollateral USD
Quality ofcollateral
Maturity ofcollateral
Country ofcounterparty
Settlementand clearing
Global Long/Short Equity Fund
Contracts for differenceCash 42,158 N/A N/A United States
Brown Brothers Harriman(Luxembourg) S.C.A.
Goldman Sachs GlobalSecurities Services Common stock 5,645 N/A N/A United States
Brown Brothers Harriman(Luxembourg) S.C.A.
U.S. Dollar Short-Term Money Market Fund
Reverse repurchase agreements
Credit Agricole CIB United StatesTreasury Note 20,001,733 Aaa Above one year United States Triparty
JP Morgan United StatesTreasury Bond 35,003,063 Aaa Above one year United States Triparty
Merrill Lynch, Pierce, Fenner &Smith Incorporated
United StatesTreasury Note 40,003,500 Aaa Above one year United States Triparty
The maturity of transactions as at 30 September 2017 are as follows:
Market value USD
Global Long/Short Equity Fund
Maturity for contracts for difference
Above one year 41,364
U.S. Dollar Short-Term Money Market Fund
Maturity of reverse repurchase agreements:
One day to one week 95,008,296
China Equity Fund, EUR Investment Grade Credit Fund, Global Long/Short Equity Fund, Global Low Volatility Equity Fund, Global Opportunity Bond Fund, U.S.
Dollar Short-Term Money Market Fund and USD Investment Grade Credit Fund have not been authorised by the Hong Kong Securities and Futures Commission
and are not available for investment by Hong Kong retail investors.


More information about the Wells Fargo (Lux)
Worldwide Fund is available free upon request
at its registered office.

Annual Report31 March 2017
Wells Fargo (Lux) Worldwide Fund
▪ China Equity Fund
▪ Emerging Markets Equity Fund
▪ Emerging Markets Equity Income Fund
▪ Global Equity Fund
▪ Global Focused Equity Fund
▪ Global Opportunity Bond Fund
▪ U.S. All Cap Growth Fund*
▪ U.S. Dollar Short-Term Money Market Fund
▪ U.S. High Yield Bond Fund
▪ U.S. Large Cap Growth Fund
▪ U.S. Premier Growth Fund**
▪ U.S. Select Equity Fund
▪ U.S. Short-Term High Yield Bond Fund
▪ U.S. Small Cap Value Fund
▪ USD Investment Grade Credit Fund
* On 31 May 2016, the Board reopened U.S. All Cap Growth Fund to all new investors.
** U.S. Premier Growth Fund merged into U.S. All Cap Growth Fund on 6 January 2017.
China Equity Fund, Emerging Markets Equity Income Fund, Global Focused Equity Fund, Global Opportunity BondFund, U.S. Dollar Short-Term Money Market Fund, U.S. Select Equity Fund, U.S. Short-Term High Yield Bond Fund,U.S. Small Cap Value Fund and USD Investment Grade Credit Fund have not been authorised by the Hong KongSecurities and Futures Commission and are not available for investment by Hong Kong retail investors.
Wells Fargo (Lux) Worldwide Fund is incorporated with limited liability in the Grand Duchy of Luxembourg asa Société d’Investissement à Capital Variable under number RCS Luxembourg B 137.479.
Registered office of Wells Fargo (Lux) Worldwide Fund: 80, route d’Esch, L-1470 Luxembourg, Grand Duchy ofLuxembourg.


Table of Contents
Directors’ report to shareholders . . . . . . . . . . . . . . . . . . . . . . . . . . . . . . . . . . . . . . . . . . . . 1Portfolios of investments
China Equity Fund . . . . . . . . . . . . . . . . . . . . . . . . . . . . . . . . . . . . . . . . . . . . . . . . . . . . . 3Emerging Markets Equity Fund . . . . . . . . . . . . . . . . . . . . . . . . . . . . . . . . . . . . . . . . . . 6Emerging Markets Equity Income Fund . . . . . . . . . . . . . . . . . . . . . . . . . . . . . . . . . . 10Global Equity Fund . . . . . . . . . . . . . . . . . . . . . . . . . . . . . . . . . . . . . . . . . . . . . . . . . . . . . 15Global Focused Equity Fund . . . . . . . . . . . . . . . . . . . . . . . . . . . . . . . . . . . . . . . . . . . . 17Global Opportunity Bond Fund . . . . . . . . . . . . . . . . . . . . . . . . . . . . . . . . . . . . . . . . . . 19U.S. All Cap Growth Fund . . . . . . . . . . . . . . . . . . . . . . . . . . . . . . . . . . . . . . . . . . . . . . . 23U.S. Dollar Short-Term Money Market Fund . . . . . . . . . . . . . . . . . . . . . . . . . . . . . . . 26U.S. High Yield Bond Fund . . . . . . . . . . . . . . . . . . . . . . . . . . . . . . . . . . . . . . . . . . . . . . 29U.S. Large Cap Growth Fund . . . . . . . . . . . . . . . . . . . . . . . . . . . . . . . . . . . . . . . . . . . . 37U.S. Select Equity Fund . . . . . . . . . . . . . . . . . . . . . . . . . . . . . . . . . . . . . . . . . . . . . . . . . 39U.S. Short-Term High Yield Bond Fund . . . . . . . . . . . . . . . . . . . . . . . . . . . . . . . . . . . 41U.S. Small Cap Value Fund . . . . . . . . . . . . . . . . . . . . . . . . . . . . . . . . . . . . . . . . . . . . . . 45USD Investment Grade Credit Fund . . . . . . . . . . . . . . . . . . . . . . . . . . . . . . . . . . . . . . 49
Statement of assets and liabilities . . . . . . . . . . . . . . . . . . . . . . . . . . . . . . . . . . . . . . . . . . . . 54Statement of operations and changes in net assets . . . . . . . . . . . . . . . . . . . . . . . . . . . . 58Statistics . . . . . . . . . . . . . . . . . . . . . . . . . . . . . . . . . . . . . . . . . . . . . . . . . . . . . . . . . . . . . . . . . . 60Notes to financial statements . . . . . . . . . . . . . . . . . . . . . . . . . . . . . . . . . . . . . . . . . . . . . . . . 70Directors, administration and management . . . . . . . . . . . . . . . . . . . . . . . . . . . . . . . . . . . 81Report of the Réviseur d’entreprises agréé . . . . . . . . . . . . . . . . . . . . . . . . . . . . . . . . . . . . . . 83General information . . . . . . . . . . . . . . . . . . . . . . . . . . . . . . . . . . . . . . . . . . . . . . . . . . . . . . . . 85Appendix I: Total expense ratios . . . . . . . . . . . . . . . . . . . . . . . . . . . . . . . . . . . . . . . . . . . . . 86Appendix II: Performance . . . . . . . . . . . . . . . . . . . . . . . . . . . . . . . . . . . . . . . . . . . . . . . . . . . 90Appendix III: Risk management . . . . . . . . . . . . . . . . . . . . . . . . . . . . . . . . . . . . . . . . . . . . . . 94Appendix IV: Securities financing transactions . . . . . . . . . . . . . . . . . . . . . . . . . . . . . . . . . 96
China Equity Fund, Emerging Markets Equity Income Fund, Global Focused Equity Fund, Global Opportunity Bond Fund, U.S. Dollar Short-Term Money Market
Fund, U.S. Select Equity Fund, U.S. Short-Term High Yield Bond Fund, U.S. Small Cap Value Fund and USD Investment Grade Credit Fund have not been
authorised by the Hong Kong Securities and Futures Commission and are not available for investment by Hong Kong retail investors.

[THIS PAGE INTENTIONALLY LEFT BLANK]
Directors’ report to shareholders Wells Fargo (Lux) Worldwide Fund 1
Dear Shareholders:
We are pleased to offer you this annual report for the Wells Fargo (Lux) Worldwide Fund for the 12-month period thatended on 31 March 2017. Global shares delivered positive returns for investors during the period. Bond returns trailedthose of shares, and bonds outside the US were negative.
Emerging markets shares, as measured by the MSCI Emerging Markets Index (Net)1, led the way, gaining 17.22%. USshares returned 17.17%, as measured by the S&P 500 Index2. A broader measure of international share returns, the MSCIAll Country World Index ex USA Index (Net)3, earned a 13.13% return. Within fixed income, the Bloomberg Barclays U.S.Aggregate Bond Index4 earned 0.44%, the Bloomberg Barclays Global Aggregate ex USD Index5 posted a return of -3.93%and the BofA Merrill Lynch U.S. High Yield Constrained Index6 earned 16.87%.
Interest rates and the UK’s Brexit vote largely drove markets from March 2016 through the end of June 2016.In March, China’s government set an anticipated growth rate of 6.5% to 7.0% for 2016, an acknowledgment of weakeninggrowth. In emerging markets, although central-bank stimulus and improved prices for oil and other commodities led toshare rallies in March, many of these countries’ economies faced the potential of credit downgrades due to challengessuch as the likelihood of a stronger US dollar, which would make dollar-denominated debt more expensive. US sharesoverall were in positive territory in March and April, plunged briefly in May on worries of a possible June interest-rateincrease and then rallied until early June.
The UK’s Brexit vote on 23 June shocked markets and shares fell as investors worried that a UK departure from the EUwould slow global growth and prolong the low-interest-rate environment. Following the initial rout, however, US sharesrose as investors seemed to decide that any negative effects would be more localised and not create a serious risk forglobal growth.
Within fixed income, government bonds rallied immediately post-Brexit, and non-Treasury sectors rallied soon after asinvestors re-gained their appetite for risk. As a result, most bond markets remained in a situation of ultralow yields andtight credit spreads. Interestingly, demand from both domestic and non-US buyers looking for positive yield supportedUS bonds because US interest rates were some of the highest among developed-country bonds.
Globally, shares delivered positive results in the third quarter of 2016; bond interest rates remained low.Comments by several US Federal Reserve (Fed) officials in the US during early September appeared to suggest animminent interest-rate increase. Share and bond prices fell. However, global shares surged following the Fed’s20 September meeting when it decided to delay a rate increase to later in 2016.
In bond markets, interest rates rose during the quarter but remained at historically low levels as a result of easy monetarypolicies, subdued global growth and modest inflation expectations. Yields began to rise again as investors became lessconcerned about the risks associated with Brexit and economic activity strengthened. At the front end of the yield curve,anticipation of new money market fund rules resulted in significantly higher yields on many short-term securities.
During the fourth quarter of 2016, prospects for faster growth and higher interest rates in the US influencedmarkets.Following Donald Trump’s election as US president in early November, shares rallied. Investors appeared optimistic thatthe new administration would favour progrowth policies, and supportive economic news helped the rally carry throughthe quarter.
The buoyant environment sent interest rates higher as well. At its mid-December meeting, Fed officials raised their short-term target interest rate for the first time in a year by a quarter percentage point to between 0.50% and 0.75%.
The fourth quarter also saw the implementation of the US Securities and Exchange Commission’s new rules for moneymarket funds, which included floating net asset values (NAVs) for institutional prime and municipal money market fundsas well as liquidity fees and redemption gates. In the year leading up to money market fund reform implementation,nearly US$1 trillion in assets moved from these types of money market funds into government money market funds,which continued to transact at a stable US$1 NAV.
Outside the US, the prospects for faster US growth appeared to trigger acceleration in Europe. The improvement may bepartly attributable to expectations for further strengthening of the US dollar, which in turn could improve demand forEuropean goods in the US due to a weakening euro relative to the dollar.
2 Wells Fargo (Lux) Worldwide Fund Directors’ report to shareholders (continued)
Investor optimism in 2017 moderated in March.January and February brought continued strength in global share markets. Factors such as strong trade data from Japan,favourable earnings reports by businesses globally and investors’ hopes for regulations and legislation that would favourbusinesses in the US markets lifted markets.
Within fixed income, short-term interest rates rose modestly during these two months in anticipation of additional Fedinterest-rate hikes. Meanwhilst, 10-year Treasury yields ranged between 2.30% and 2.55%, appearing to plateau after thefourth quarter’s sell-off. Spreads of both investment-grade and high yield bonds narrowed slightly, and both taxable andmunicipal bond mutual fund flows were positive.
Our goal is to meet the financial needs of our shareholders.We are committed to providing our shareholders with long-term investment strategies and focusing on appropriate riskwhilst seeking to deliver consistent returns. We know that your ability to meet your long-term investment goals dependson the investment decisions you make today. Despite economic uncertainties and investment challenges, stayinginvested and adapting to emerging opportunities and risks will help you manage investment risk.
Thank you for choosing the Wells Fargo (Lux) Worldwide Fund. We appreciate your confidence in us and remaincommitted to helping you meet your financial needs.
Sincerely,
Richard GoddardBoard of Directors of the Fund
1 The Morgan Stanley Capital International (MSCI) Emerging Markets (EM) Index (Net) is a free-float-adjusted market-capitalization-weighted index that is designedto measure the equity market performance of emerging markets. The MSCI EM Index (Net) consists of the following 23 emerging markets country indexes: Brazil,Chile, China, Colombia, Czech Republic, Egypt, Greece, Hungary, India, Indonesia, Korea, Malaysia, Mexico, Peru, the Philippines, Poland, Qatar, Russia, SouthAfrica, Taiwan, Thailand, Turkey, and United Arab Emirates. You cannot invest directly in an index. Source: MSCI. MSCI makes no express or implied warranties orrepresentations and shall have no liability whatsoever with respect to any MSCI data contained herein. The MSCI data may not be further redistributed or used asa basis for other indexes or any securities or financial products. This report is not approved, reviewed, or produced by MSCI.
2 The S&P 500 Index consists of 500 stocks chosen for market size, liquidity and industry group representation. It is a market-value-weighted index with eachstock’s weight in the index proportionate to its market value. You cannot invest directly in an index.
3 The Morgan Stanley Capital International (MSCI) All Country World Index (ACWI) ex USA Index (Net) is a free-float-adjusted market-capitalization- weighted indexthat is designed to measure the equity market performance of developed markets, excluding the U.S. and Canada. You cannot invest directly in an index.
4 The Bloomberg Barclays U.S. Aggregate Bond Index (formerly known as Barclays U.S. Aggregate Bond Index) is a broad-based benchmark that measures theinvestment-grade, US dollar–denominated, fixed-rate taxable bond market, including Treasuries, government-related and corporate securities, mortgage-backed securities (agency fixed-rate and hybrid adjustable-rate mortgage pass-throughs), asset-backed securities and commercial mortgage-backed securities.You cannot invest directly in an index.
5 The Bloomberg Barclays Global Aggregate ex U.S. Dollar Bond Index (formerly known as Barclays Global Aggregate ex U.S. Dollar Bond Index) tracks aninternational basket of government, corporate, agency and mortgage-related bonds. You cannot invest directly in an index.
6 The BofA Merrill Lynch U.S. High Yield Constrained Index is a market-capitalisation-weighted index of domestic and Yankee high yield bonds. The index tracks theperformance of high yield securities traded in the US bond market. You cannot invest directly in an index.
Portfolio of investments as at 31 March 2017 Wells Fargo (Lux) Worldwide Fund 3
CHINA EQUITY FUND
Industry Shares
MarketValue
USD
% ofNet
Assets
Transferable securities and money market instruments admitted to an official stock exchange listing or dealt in on another regulated market
Common Shares
ChinaAgricultural Bank of China Limited Banks 1,059,500 488,067 0.78
Alibaba Group Holding Limited ADR Internet 53,270 5,744,104 9.23
Anhui Conch Cement Company Limited Building Materials 133,000 451,805 0.73
AviChina Industry & Technology Company
Limited Aerospace/Defense 1,811,000 1,256,037 2.02
Baidu Incorporated ADR Internet 9,690 1,671,719 2.69
Bank of China Limited Banks 4,542,000 2,255,951 3.62
Beijing Capital International Airport Company
Limited Engineering & Construction 970,000 1,160,780 1.86
Beijing Urban Construction Design &
Development Group Company Limited Engineering & Construction 728,000 456,200 0.73
BYD Company Limited Auto Manufacturers 81,000 449,218 0.72
China Communications Construction Company
Limited Engineering & Construction 265,000 373,725 0.60
China Construction Bank Corporation Banks 3,811,000 3,064,884 4.92
China Galaxy Securities Company Limited Diversified Financial Services 762,000 703,023 1.13
China Life Insurance Company Limited Insurance 560,000 1,718,587 2.76
China Longyuan Power Group Corporation
Limited Energy – Alternate Sources 442,000 343,522 0.55
China Merchants Bank Company Limited Banks 363,500 961,195 1.54
China Petroleum & Chemical Corporation Oil & Gas Services 1,616,200 1,310,179 2.10
China Railway Group Limited Engineering & Construction 338,000 302,271 0.49
China Resources Phoenix Healthcare Holdings
Company Limited Healthcare – Services 569,000 699,215 1.12
China Telecom Corporation Limited Telecommunications 1,872,000 912,936 1.47
CNOOC Limited Oil & Gas Services 861,000 1,028,126 1.65
Ctrip.com International Limited ADR Internet 15,500 761,825 1.22
ENN Energy Holdings Limited Oil & Gas Services 72,000 405,327 0.65
Goodbaby International Holdings Limited Household Products/Wares 1,335,000 647,616 1.04
Huaneng Renewables Corporation Limited Electric 2,112,000 731,040 1.17
Industrial & Commercial Bank of China Limited Banks 4,408,991 2,882,027 4.63
JD.com Incorporated ADR Internet 16,100 500,871 0.81
New Oriental Education & Technology Group
Incorporated ADR Commercial Services 9,500 573,610 0.92
PetroChina Company Limited Oil & Gas Services 1,924,000 1,408,680 2.26
PICC Property & Casualty Company Limited Insurance 382,000 588,864 0.95
Ping An Insurance Group Company of China
Limited Insurance 267,900 1,499,537 2.41
Shanghai Electric Group Company Limited Machinery – Diversified 590,000 292,286 0.47
Shanghai Fosun Pharmaceutical Group Company
Limited Pharmaceuticals 303,000 1,115,074 1.79
Tencent Holdings Limited Internet 179,300 5,140,326 8.26
Tianneng Power International Limited Electrical Component & Equipment 366,000 332,492 0.53
Vipshop Holdings Limited ADR Internet 35,300 470,902 0.76
Zijin Mining Group Company Limited Mining 1,452,000 538,089 0.86
43,240,110 69.44
Hong KongBeijing Enterprises Holdings Limited Oil & Gas Services 58,000 300,019 0.48
Beijing Enterprises Water Group Limited Water 1,624,000 1,203,660 1.93
China Mobile Limited Telecommunications 188,700 2,065,101 3.32
The accompanying notes are an integral part of these financial statements.
China Equity Fund, Emerging Markets Equity Income Fund, Global Focused Equity Fund, Global Opportunity Bond Fund, U.S. Dollar Short-Term Money Market
Fund, U.S. Select Equity Fund, U.S. Short-Term High Yield Bond Fund, U.S. Small Cap Value Fund and USD Investment Grade Credit Fund have not been
authorised by the Hong Kong Securities and Futures Commission and are not available for investment by Hong Kong retail investors.
4 Wells Fargo (Lux) Worldwide Fund Portfolio of investments as at 31 March 2017 (continued)
CHINA EQUITY FUND
Industry Shares
MarketValue
USD
% ofNet
Assets
Transferable securities and money market instruments admitted to an official stock exchange listing or dealt in on another regulatedmarket (continued)
Common Shares (continued)
Hong Kong continued
China Overseas Land & Investment Limited Real Estate 264,000 754,140 1.21
China Resources Land Limited Real Estate 261,555 706,769 1.13
China State Construction International Holdings
Limited Engineering & Construction 270,000 482,919 0.78
China Traditional Chinese Medicine Holdings
Company Limited Pharmaceuticals 1,216,000 669,688 1.07
China Unicom Hong Kong Limited Telecommunications 656,000 877,874 1.41
Guangdong Investment Limited Water 224,000 319,362 0.51
IMAX China Holding Incorporated Entertainment 100,600 517,789 0.83
Luk Fook Holdings International Limited Retail 111,000 352,789 0.57
Sino Biopharmaceutical Limited Pharmaceuticals 452,000 372,232 0.60
8,622,342 13.84
United StatesYum China Holdings Incorporated Retail 24,100 655,520 1.05
Total Common Shares 52,517,972 84.33
Equity Linked Notes
ChinaHSBC Bank plc (Expiring 18/6/2018)
(Hangzhou Hikvision Digital Technology
Company Limited) Hardware 98,400 455,661 0.73
HSBC Bank plc (Expiring 18/3/2019)
(Han’s Laser Technology Industry Group
Company Limited) Capital Goods 190,900 727,985 1.17
HSBC Bank plc (Expiring 9/8/2019)
(Huayu Automotive Systems Company Limited) Auto Parts & Equipment 123,000 325,141 0.52
HSBC Bank plc (Expiring 9/8/2019)
(Ningbo Joyson Electronic Corporation) Auto Parts & Equipment 93,000 436,326 0.70
HSBC Bank plc (Expiring 1/11/2019)
(Tasly Pharmaceutical Group Company Limited) Pharmaceuticals 74,493 432,005 0.69
HSBC Bank plc (Expiring 14/9/2020)
(GoerTek Incorporated) Hardware 107,100 529,219 0.85
HSBC Bank plc (Expiring 25/9/2023)
(Inner Mongolia Yili Industrial Group
Company Limited) Food 189,800 521,008 0.84
HSBC Bank plc (Expiring 23/12/2024)
(China International Travel Service
Corporation Limited) Consumer Services 48,100 395,829 0.64
UBS AG London (Expiring 26/7/2017)
(Goertek Incorporated) Hardware 96,800 478,323 0.77
UBS AG London (Expiring 12/10/2017)
(Hangzhou Hikvision Digital) Hardware 175,919 814,629 1.31
UBS AG London (Expiring 26/10/2017)
(Baoshan Iron & Steel Company) Materials 786,000 742,779 1.19
UBS AG London (Expiring 27/10/2017)
(Midea Group Company Limited) Home & Office Products 235,381 1,137,816 1.83
UBS AG London (Expiring 20/11/2017)
(Dong-E-E-Jiao Company) Pharmaceuticals 56,600 538,985 0.86
The accompanying notes are an integral part of these financial statements.
China Equity Fund, Emerging Markets Equity Income Fund, Global Focused Equity Fund, Global Opportunity Bond Fund, U.S. Dollar Short-Term Money Market
Fund, U.S. Select Equity Fund, U.S. Short-Term High Yield Bond Fund, U.S. Small Cap Value Fund and USD Investment Grade Credit Fund have not been
authorised by the Hong Kong Securities and Futures Commission and are not available for investment by Hong Kong retail investors.
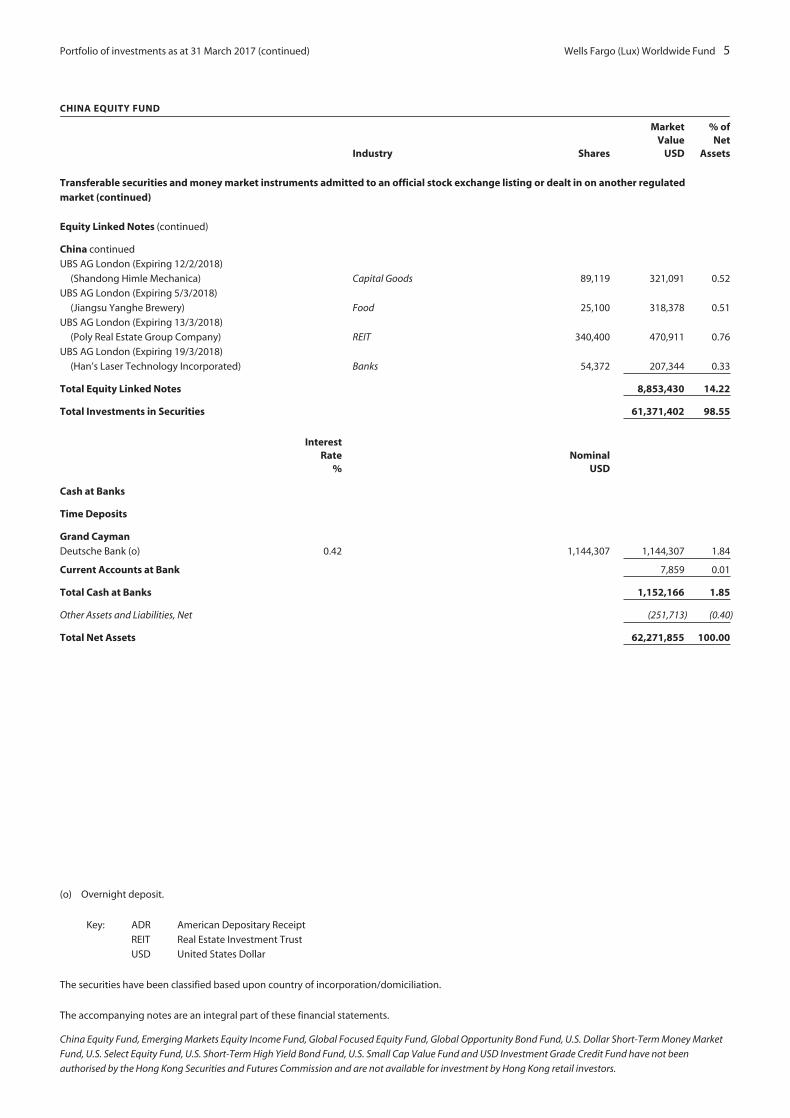
Portfolio of investments as at 31 March 2017 (continued) Wells Fargo (Lux) Worldwide Fund 5
CHINA EQUITY FUND
Industry Shares
MarketValue
USD
% ofNet
Assets
Transferable securities and money market instruments admitted to an official stock exchange listing or dealt in on another regulatedmarket (continued)
Equity Linked Notes (continued)
China continued
UBS AG London (Expiring 12/2/2018)
(Shandong Himle Mechanica) Capital Goods 89,119 321,091 0.52
UBS AG London (Expiring 5/3/2018)
(Jiangsu Yanghe Brewery) Food 25,100 318,378 0.51
UBS AG London (Expiring 13/3/2018)
(Poly Real Estate Group Company) REIT 340,400 470,911 0.76
UBS AG London (Expiring 19/3/2018)
(Han’s Laser Technology Incorporated) Banks 54,372 207,344 0.33
Total Equity Linked Notes 8,853,430 14.22
Total Investments in Securities 61,371,402 98.55
InterestRate
%Nominal
USD
Cash at Banks
Time Deposits
Grand CaymanDeutsche Bank (o) 0.42 1,144,307 1,144,307 1.84
Current Accounts at Bank 7,859 0.01
Total Cash at Banks 1,152,166 1.85
Other Assets and Liabilities, Net (251,713) (0.40)
Total Net Assets 62,271,855 100.00
(o) Overnight deposit.
Key: ADR American Depositary Receipt
REIT Real Estate Investment Trust
USD United States Dollar
The securities have been classified based upon country of incorporation/domiciliation.
The accompanying notes are an integral part of these financial statements.
China Equity Fund, Emerging Markets Equity Income Fund, Global Focused Equity Fund, Global Opportunity Bond Fund, U.S. Dollar Short-Term Money Market
Fund, U.S. Select Equity Fund, U.S. Short-Term High Yield Bond Fund, U.S. Small Cap Value Fund and USD Investment Grade Credit Fund have not been
authorised by the Hong Kong Securities and Futures Commission and are not available for investment by Hong Kong retail investors.

6 Wells Fargo (Lux) Worldwide Fund Portfolio of investments as at 31 March 2017
EMERGING MARKETS EQUITY FUND
Industry Shares
MarketValue
USD
% ofNet
Assets
Transferable securities and money market instruments admitted to an official stock exchange listing or dealt in on another regulated market
Common Shares
Argentina
MercadoLibre Incorporated Internet 5,945 1,257,189 0.50
Brazil
AmBev SA ADR Beverages 470,700 2,711,232 1.07
B2W Compania Digital Internet 240,974 950,626 0.38
Banco Bradesco SA ADR Banks 243,028 2,488,607 0.99
BM&FBovespa SA Diversified Financial Services 426,300 2,626,757 1.04
BRF SA ADR Food 86,150 1,055,337 0.42
Lojas Renner SA Retail 225,950 2,006,456 0.80
Multiplan Empreendimentos Imobiliarios SA Real Estate 61,002 1,291,903 0.51
Raia Drogasil SA Retail 56,100 1,051,360 0.42
14,182,278 5.63
Chile
AES Gener SA Electric 609,427 246,264 0.10
Banco Santander Chile ADR Banks 99,400 2,492,952 0.99
SACI Falabella Retail 297,447 2,501,688 0.99
5,240,904 2.08
China
51job Incorporated ADR Internet 68,020 2,493,613 0.99
Alibaba Group Holding Limited ADR Internet 36,218 3,905,387 1.55
Baidu Incorporated ADR Internet 9,240 1,594,085 0.63
Belle International Holdings Limited Retail 4,050,000 2,631,731 1.04
China International Capital Corporation Limited Diversified Financial Services 145,283 218,724 0.09
China Life Insurance Company Limited Insurance 1,810,000 5,554,719 2.20
CNOOC Limited Oil & Gas Services 2,062,000 2,462,248 0.98
Ctrip.com International Limited ADR Internet 82,868 4,072,962 1.62
Gridsum Holding Incorporated ADR Software 45,700 607,353 0.24
Hengan International Group Company Limited Healthcare – Products 334,000 2,484,102 0.98
Li Ning Company Limited Retail 2,479,827 1,455,062 0.58
New Oriental Education & Technology Group
Incorporated ADR Commercial Services 82,788 4,998,739 1.98
PetroChina Company Limited Oil & Gas Services 910,000 666,268 0.26
Shandong Weigao Group Medical Polymer
Company Limited Healthcare – Products 1,580,000 1,130,387 0.45
SINA Corporation Internet 74,723 5,389,023 2.14
Tencent Holdings Limited Internet 189,600 5,435,615 2.16
Tingyi Cayman Islands Holding Corporation Food 146,000 183,357 0.07
Tsingtao Brewery Company Limited Beverages 441,520 2,033,895 0.81
Vipshop Holdings Limited ADR Internet 323,592 4,316,717 1.71
Want Want China Holdings Limited Food 3,393,000 2,348,882 0.93
Weibo Corporation ADR Internet 65,172 3,400,675 1.35
Zhou Hei Ya International Holdings Company
Limited Food 1,222,437 1,239,504 0.49
58,623,048 23.25
Colombia
Bancolombia SA ADR Banks 32,500 1,295,775 0.51
The accompanying notes are an integral part of these financial statements.
China Equity Fund, Emerging Markets Equity Income Fund, Global Focused Equity Fund, Global Opportunity Bond Fund, U.S. Dollar Short-Term Money Market
Fund, U.S. Select Equity Fund, U.S. Short-Term High Yield Bond Fund, U.S. Small Cap Value Fund and USD Investment Grade Credit Fund have not been
authorised by the Hong Kong Securities and Futures Commission and are not available for investment by Hong Kong retail investors.

Portfolio of investments as at 31 March 2017 (continued) Wells Fargo (Lux) Worldwide Fund 7
EMERGING MARKETS EQUITY FUND
Industry Shares
MarketValue
USD
% ofNet
Assets
Transferable securities and money market instruments admitted to an official stock exchange listing or dealt in on another regulatedmarket (continued)
Common Shares (continued)
Hong KongAIA Group Limited Insurance 680,000 4,287,461 1.70China Mobile Limited Telecommunications 658,000 7,201,042 2.86Johnson Electric Holdings Limited Electrical Components & Equipment 380,825 1,136,864 0.45Sun Art Retail Group Limited Retail 2,167,500 2,030,419 0.81WH Group Limited Food 5,683,000 4,899,453 1.94
19,555,239 7.76
IndiaBharti Airtel Limited Telecommunications 250,849 1,352,271 0.54Bharti Infratel Limited Telecommunications 277,474 1,392,605 0.55HDFC Bank Limited ADR Banks 20,361 1,531,554 0.61Housing Development Finance Corporation
Limited Diversified Financial Services 98,400 2,276,225 0.90ICICI Bank Limited ADR Banks 260,575 2,240,945 0.89IndusInd Bank Limited Banks 73,377 1,610,429 0.64Infosys Limited ADR Computers 146,936 2,321,589 0.92ITC Limited Agriculture 881,500 3,805,104 1.51Laurus Labs Limited Pharmaceuticals 34,873 277,223 0.11Max Financial Services Limited Insurance 49,310 438,121 0.17PNB Housing Finance Limited Diversified Financial Services 17,437 319,658 0.13Reliance Industries Limited Oil & Gas Services 246,900 5,022,410 1.99
22,588,134 8.96
IndonesiaPT Astra International Tbk Retail 1,817,700 1,176,516 0.47PT Bank Central Asia Tbk Banks 1,144,000 1,420,825 0.56PT Blue Bird Tbk Transportation 1,552,410 449,687 0.18PT Link Net Tbk Internet 2,128,993 866,743 0.34PT Matahari Department Store Tbk Retail 869,100 859,284 0.34PT Telekomunikasi Indonesia Persero Tbk ADR Telecommunications 72,860 2,271,046 0.90
7,044,101 2.79
MalaysiaGenting Bhd Lodging 637,100 1,380,587 0.55Genting Malaysia Bhd Lodging 1,090,900 1,343,443 0.53
2,724,030 1.08
MexicoAmerica Movil SAB de CV ADR Telecommunications 126,560 1,793,355 0.71Becle SAB de CV Beverages 412,998 732,145 0.29Cemex SAB de CV ADR Building Materials 153,567 1,392,853 0.55Fibra Uno Administracion SA de CV REIT 1,979,010 3,383,573 1.34Fomento Economico Mexicano SAB de CV ADR Beverages 62,860 5,564,367 2.21Grupo Financiero Banorte SAB de CV Banks 517,544 2,978,285 1.18Grupo Financiero Santander Mexico SAB de
CV ADR Banks 146,502 1,322,913 0.53Wal-Mart de Mexico SAB de CV Retail 648,500 1,496,359 0.59
18,663,850 7.40
PeruCompania de Minas Buenaventura SAA ADR Mining 83,030 999,681 0.40
The accompanying notes are an integral part of these financial statements.
China Equity Fund, Emerging Markets Equity Income Fund, Global Focused Equity Fund, Global Opportunity Bond Fund, U.S. Dollar Short-Term Money Market
Fund, U.S. Select Equity Fund, U.S. Short-Term High Yield Bond Fund, U.S. Small Cap Value Fund and USD Investment Grade Credit Fund have not been
authorised by the Hong Kong Securities and Futures Commission and are not available for investment by Hong Kong retail investors.
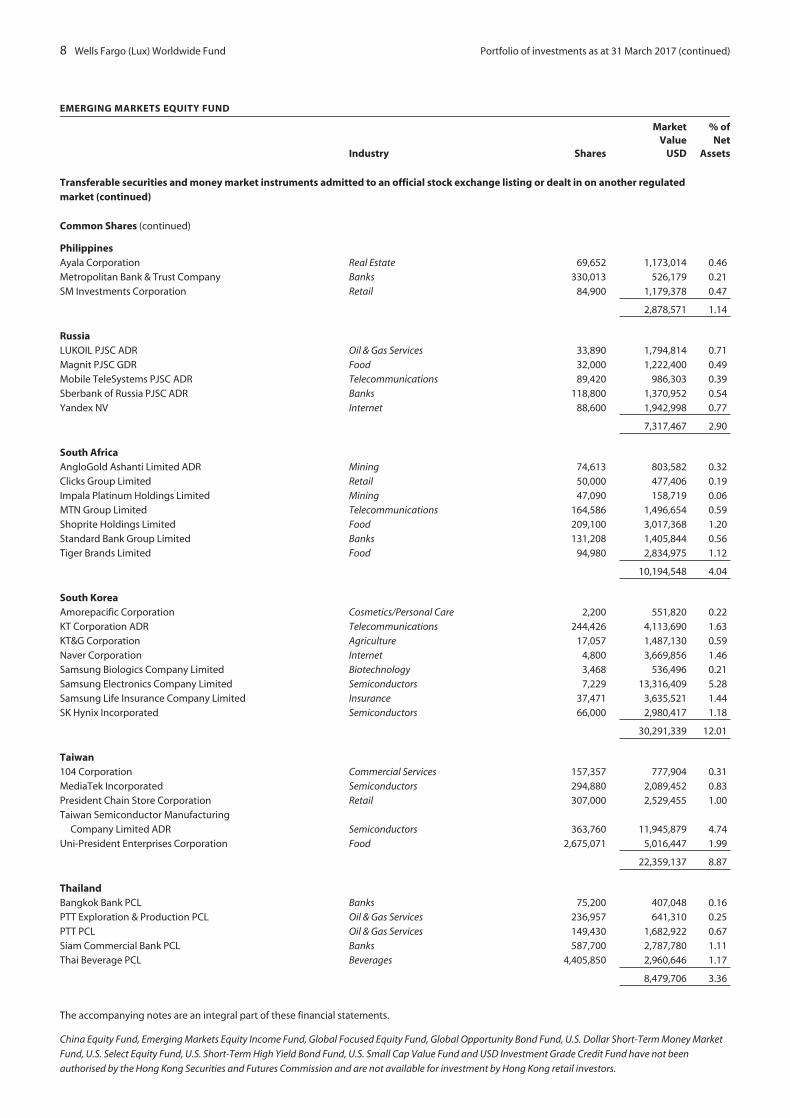
8 Wells Fargo (Lux) Worldwide Fund Portfolio of investments as at 31 March 2017 (continued)
EMERGING MARKETS EQUITY FUND
Industry Shares
MarketValue
USD
% ofNet
Assets
Transferable securities and money market instruments admitted to an official stock exchange listing or dealt in on another regulatedmarket (continued)
Common Shares (continued)
PhilippinesAyala Corporation Real Estate 69,652 1,173,014 0.46Metropolitan Bank & Trust Company Banks 330,013 526,179 0.21SM Investments Corporation Retail 84,900 1,179,378 0.47
2,878,571 1.14
RussiaLUKOIL PJSC ADR Oil & Gas Services 33,890 1,794,814 0.71Magnit PJSC GDR Food 32,000 1,222,400 0.49Mobile TeleSystems PJSC ADR Telecommunications 89,420 986,303 0.39Sberbank of Russia PJSC ADR Banks 118,800 1,370,952 0.54Yandex NV Internet 88,600 1,942,998 0.77
7,317,467 2.90
South AfricaAngloGold Ashanti Limited ADR Mining 74,613 803,582 0.32Clicks Group Limited Retail 50,000 477,406 0.19Impala Platinum Holdings Limited Mining 47,090 158,719 0.06MTN Group Limited Telecommunications 164,586 1,496,654 0.59Shoprite Holdings Limited Food 209,100 3,017,368 1.20Standard Bank Group Limited Banks 131,208 1,405,844 0.56Tiger Brands Limited Food 94,980 2,834,975 1.12
10,194,548 4.04
South KoreaAmorepacific Corporation Cosmetics/Personal Care 2,200 551,820 0.22KT Corporation ADR Telecommunications 244,426 4,113,690 1.63KT&G Corporation Agriculture 17,057 1,487,130 0.59Naver Corporation Internet 4,800 3,669,856 1.46Samsung Biologics Company Limited Biotechnology 3,468 536,496 0.21Samsung Electronics Company Limited Semiconductors 7,229 13,316,409 5.28Samsung Life Insurance Company Limited Insurance 37,471 3,635,521 1.44SK Hynix Incorporated Semiconductors 66,000 2,980,417 1.18
30,291,339 12.01
Taiwan104 Corporation Commercial Services 157,357 777,904 0.31MediaTek Incorporated Semiconductors 294,880 2,089,452 0.83President Chain Store Corporation Retail 307,000 2,529,455 1.00Taiwan Semiconductor Manufacturing
Company Limited ADR Semiconductors 363,760 11,945,879 4.74Uni-President Enterprises Corporation Food 2,675,071 5,016,447 1.99
22,359,137 8.87
ThailandBangkok Bank PCL Banks 75,200 407,048 0.16PTT Exploration & Production PCL Oil & Gas Services 236,957 641,310 0.25PTT PCL Oil & Gas Services 149,430 1,682,922 0.67Siam Commercial Bank PCL Banks 587,700 2,787,780 1.11Thai Beverage PCL Beverages 4,405,850 2,960,646 1.17
8,479,706 3.36
The accompanying notes are an integral part of these financial statements.
China Equity Fund, Emerging Markets Equity Income Fund, Global Focused Equity Fund, Global Opportunity Bond Fund, U.S. Dollar Short-Term Money Market
Fund, U.S. Select Equity Fund, U.S. Short-Term High Yield Bond Fund, U.S. Small Cap Value Fund and USD Investment Grade Credit Fund have not been
authorised by the Hong Kong Securities and Futures Commission and are not available for investment by Hong Kong retail investors.
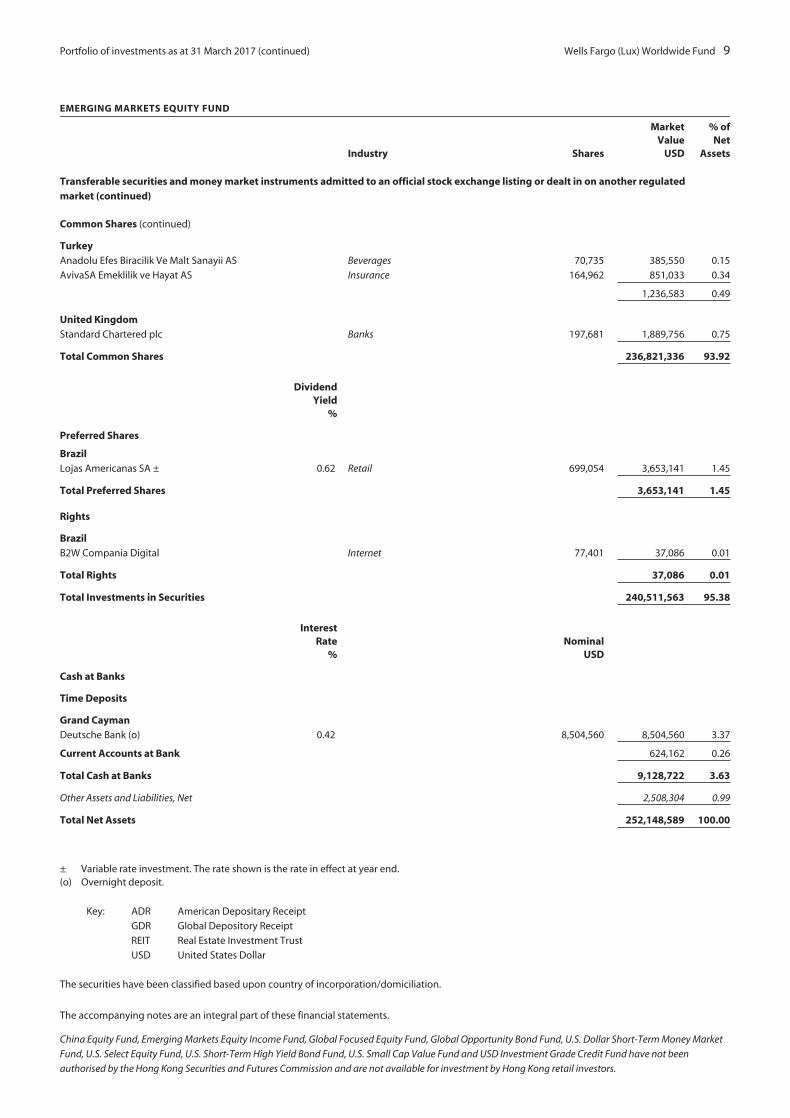
Portfolio of investments as at 31 March 2017 (continued) Wells Fargo (Lux) Worldwide Fund 9
EMERGING MARKETS EQUITY FUND
Industry Shares
MarketValue
USD
% ofNet
Assets
Transferable securities and money market instruments admitted to an official stock exchange listing or dealt in on another regulatedmarket (continued)
Common Shares (continued)
TurkeyAnadolu Efes Biracilik Ve Malt Sanayii AS Beverages 70,735 385,550 0.15
AvivaSA Emeklilik ve Hayat AS Insurance 164,962 851,033 0.34
1,236,583 0.49
United KingdomStandard Chartered plc Banks 197,681 1,889,756 0.75
Total Common Shares 236,821,336 93.92
DividendYield
%
Preferred Shares
BrazilLojas Americanas SA ± 0.62 Retail 699,054 3,653,141 1.45
Total Preferred Shares 3,653,141 1.45
Rights
BrazilB2W Compania Digital Internet 77,401 37,086 0.01
Total Rights 37,086 0.01
Total Investments in Securities 240,511,563 95.38
InterestRate
%Nominal
USD
Cash at Banks
Time Deposits
Grand CaymanDeutsche Bank (o) 0.42 8,504,560 8,504,560 3.37
Current Accounts at Bank 624,162 0.26
Total Cash at Banks 9,128,722 3.63
Other Assets and Liabilities, Net 2,508,304 0.99
Total Net Assets 252,148,589 100.00
± Variable rate investment. The rate shown is the rate in effect at year end.(o) Overnight deposit.
Key: ADR American Depositary Receipt
GDR Global Depository Receipt
REIT Real Estate Investment Trust
USD United States Dollar
The securities have been classified based upon country of incorporation/domiciliation.
The accompanying notes are an integral part of these financial statements.
China Equity Fund, Emerging Markets Equity Income Fund, Global Focused Equity Fund, Global Opportunity Bond Fund, U.S. Dollar Short-Term Money Market
Fund, U.S. Select Equity Fund, U.S. Short-Term High Yield Bond Fund, U.S. Small Cap Value Fund and USD Investment Grade Credit Fund have not been
authorised by the Hong Kong Securities and Futures Commission and are not available for investment by Hong Kong retail investors.
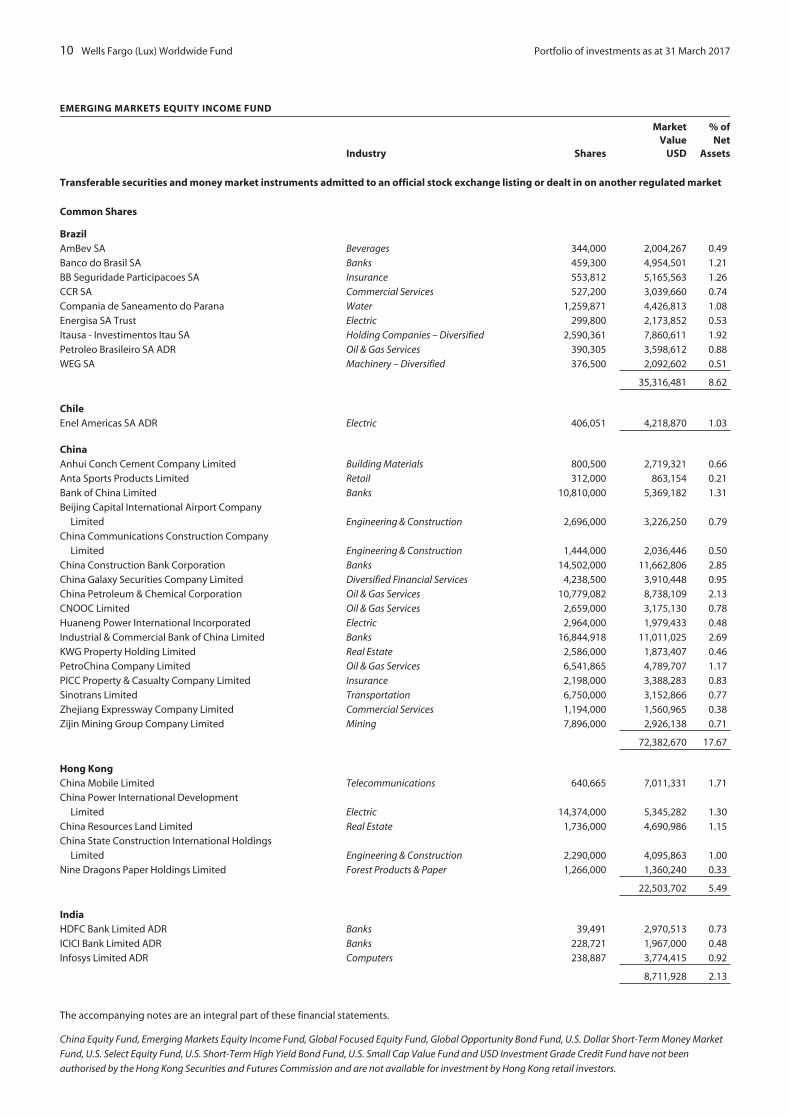
10 Wells Fargo (Lux) Worldwide Fund Portfolio of investments as at 31 March 2017
EMERGING MARKETS EQUITY INCOME FUND
Industry Shares
MarketValue
USD
% ofNet
Assets
Transferable securities and money market instruments admitted to an official stock exchange listing or dealt in on another regulated market
Common Shares
BrazilAmBev SA Beverages 344,000 2,004,267 0.49
Banco do Brasil SA Banks 459,300 4,954,501 1.21
BB Seguridade Participacoes SA Insurance 553,812 5,165,563 1.26
CCR SA Commercial Services 527,200 3,039,660 0.74
Compania de Saneamento do Parana Water 1,259,871 4,426,813 1.08
Energisa SA Trust Electric 299,800 2,173,852 0.53
Itausa - Investimentos Itau SA Holding Companies – Diversified 2,590,361 7,860,611 1.92
Petroleo Brasileiro SA ADR Oil & Gas Services 390,305 3,598,612 0.88
WEG SA Machinery – Diversified 376,500 2,092,602 0.51
35,316,481 8.62
ChileEnel Americas SA ADR Electric 406,051 4,218,870 1.03
ChinaAnhui Conch Cement Company Limited Building Materials 800,500 2,719,321 0.66
Anta Sports Products Limited Retail 312,000 863,154 0.21
Bank of China Limited Banks 10,810,000 5,369,182 1.31
Beijing Capital International Airport Company
Limited Engineering & Construction 2,696,000 3,226,250 0.79
China Communications Construction Company
Limited Engineering & Construction 1,444,000 2,036,446 0.50
China Construction Bank Corporation Banks 14,502,000 11,662,806 2.85
China Galaxy Securities Company Limited Diversified Financial Services 4,238,500 3,910,448 0.95
China Petroleum & Chemical Corporation Oil & Gas Services 10,779,082 8,738,109 2.13
CNOOC Limited Oil & Gas Services 2,659,000 3,175,130 0.78
Huaneng Power International Incorporated Electric 2,964,000 1,979,433 0.48
Industrial & Commercial Bank of China Limited Banks 16,844,918 11,011,025 2.69
KWG Property Holding Limited Real Estate 2,586,000 1,873,407 0.46
PetroChina Company Limited Oil & Gas Services 6,541,865 4,789,707 1.17
PICC Property & Casualty Company Limited Insurance 2,198,000 3,388,283 0.83
Sinotrans Limited Transportation 6,750,000 3,152,866 0.77
Zhejiang Expressway Company Limited Commercial Services 1,194,000 1,560,965 0.38
Zijin Mining Group Company Limited Mining 7,896,000 2,926,138 0.71
72,382,670 17.67
Hong KongChina Mobile Limited Telecommunications 640,665 7,011,331 1.71
China Power International Development
Limited Electric 14,374,000 5,345,282 1.30
China Resources Land Limited Real Estate 1,736,000 4,690,986 1.15
China State Construction International Holdings
Limited Engineering & Construction 2,290,000 4,095,863 1.00
Nine Dragons Paper Holdings Limited Forest Products & Paper 1,266,000 1,360,240 0.33
22,503,702 5.49
IndiaHDFC Bank Limited ADR Banks 39,491 2,970,513 0.73
ICICI Bank Limited ADR Banks 228,721 1,967,000 0.48
Infosys Limited ADR Computers 238,887 3,774,415 0.92
8,711,928 2.13
The accompanying notes are an integral part of these financial statements.
China Equity Fund, Emerging Markets Equity Income Fund, Global Focused Equity Fund, Global Opportunity Bond Fund, U.S. Dollar Short-Term Money Market
Fund, U.S. Select Equity Fund, U.S. Short-Term High Yield Bond Fund, U.S. Small Cap Value Fund and USD Investment Grade Credit Fund have not been
authorised by the Hong Kong Securities and Futures Commission and are not available for investment by Hong Kong retail investors.
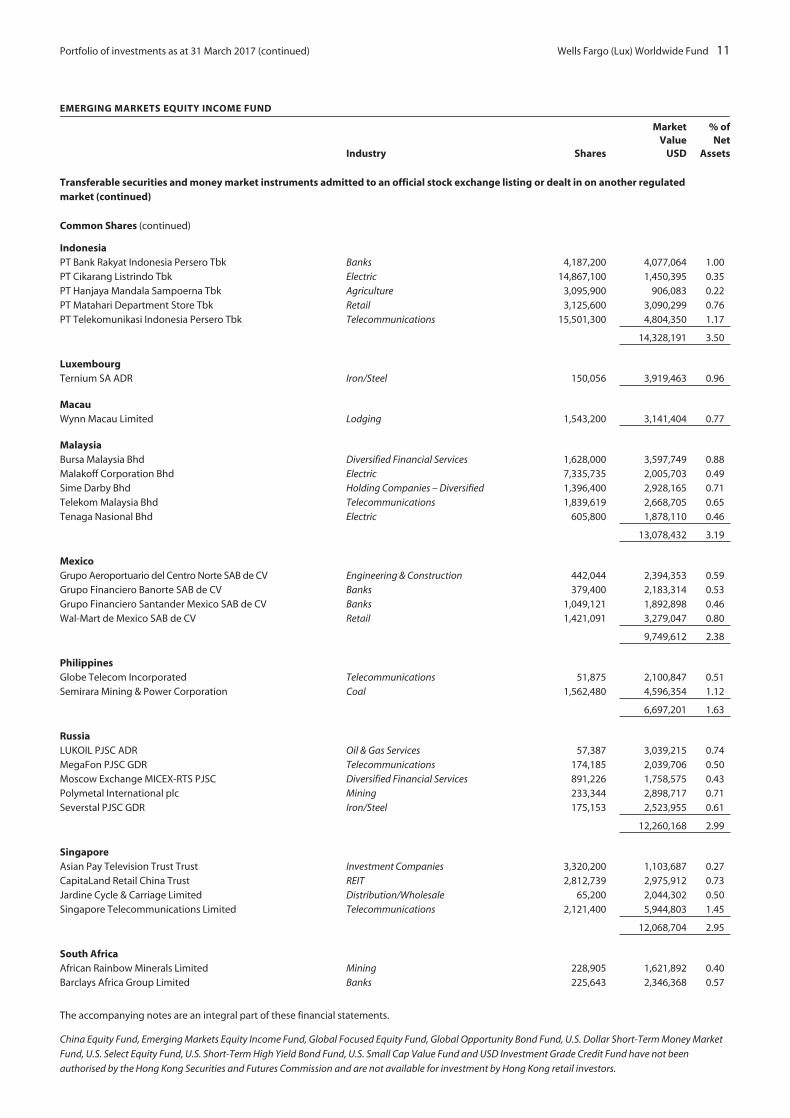
Portfolio of investments as at 31 March 2017 (continued) Wells Fargo (Lux) Worldwide Fund 11
EMERGING MARKETS EQUITY INCOME FUND
Industry Shares
MarketValue
USD
% ofNet
Assets
Transferable securities and money market instruments admitted to an official stock exchange listing or dealt in on another regulatedmarket (continued)
Common Shares (continued)
IndonesiaPT Bank Rakyat Indonesia Persero Tbk Banks 4,187,200 4,077,064 1.00PT Cikarang Listrindo Tbk Electric 14,867,100 1,450,395 0.35PT Hanjaya Mandala Sampoerna Tbk Agriculture 3,095,900 906,083 0.22PT Matahari Department Store Tbk Retail 3,125,600 3,090,299 0.76PT Telekomunikasi Indonesia Persero Tbk Telecommunications 15,501,300 4,804,350 1.17
14,328,191 3.50
LuxembourgTernium SA ADR Iron/Steel 150,056 3,919,463 0.96
MacauWynn Macau Limited Lodging 1,543,200 3,141,404 0.77
MalaysiaBursa Malaysia Bhd Diversified Financial Services 1,628,000 3,597,749 0.88Malakoff Corporation Bhd Electric 7,335,735 2,005,703 0.49Sime Darby Bhd Holding Companies – Diversified 1,396,400 2,928,165 0.71Telekom Malaysia Bhd Telecommunications 1,839,619 2,668,705 0.65Tenaga Nasional Bhd Electric 605,800 1,878,110 0.46
13,078,432 3.19
MexicoGrupo Aeroportuario del Centro Norte SAB de CV Engineering & Construction 442,044 2,394,353 0.59Grupo Financiero Banorte SAB de CV Banks 379,400 2,183,314 0.53Grupo Financiero Santander Mexico SAB de CV Banks 1,049,121 1,892,898 0.46Wal-Mart de Mexico SAB de CV Retail 1,421,091 3,279,047 0.80
9,749,612 2.38
PhilippinesGlobe Telecom Incorporated Telecommunications 51,875 2,100,847 0.51Semirara Mining & Power Corporation Coal 1,562,480 4,596,354 1.12
6,697,201 1.63
RussiaLUKOIL PJSC ADR Oil & Gas Services 57,387 3,039,215 0.74MegaFon PJSC GDR Telecommunications 174,185 2,039,706 0.50Moscow Exchange MICEX-RTS PJSC Diversified Financial Services 891,226 1,758,575 0.43Polymetal International plc Mining 233,344 2,898,717 0.71Severstal PJSC GDR Iron/Steel 175,153 2,523,955 0.61
12,260,168 2.99
SingaporeAsian Pay Television Trust Trust Investment Companies 3,320,200 1,103,687 0.27CapitaLand Retail China Trust REIT 2,812,739 2,975,912 0.73Jardine Cycle & Carriage Limited Distribution/Wholesale 65,200 2,044,302 0.50Singapore Telecommunications Limited Telecommunications 2,121,400 5,944,803 1.45
12,068,704 2.95
South AfricaAfrican Rainbow Minerals Limited Mining 228,905 1,621,892 0.40Barclays Africa Group Limited Banks 225,643 2,346,368 0.57
The accompanying notes are an integral part of these financial statements.
China Equity Fund, Emerging Markets Equity Income Fund, Global Focused Equity Fund, Global Opportunity Bond Fund, U.S. Dollar Short-Term Money Market
Fund, U.S. Select Equity Fund, U.S. Short-Term High Yield Bond Fund, U.S. Small Cap Value Fund and USD Investment Grade Credit Fund have not been
authorised by the Hong Kong Securities and Futures Commission and are not available for investment by Hong Kong retail investors.
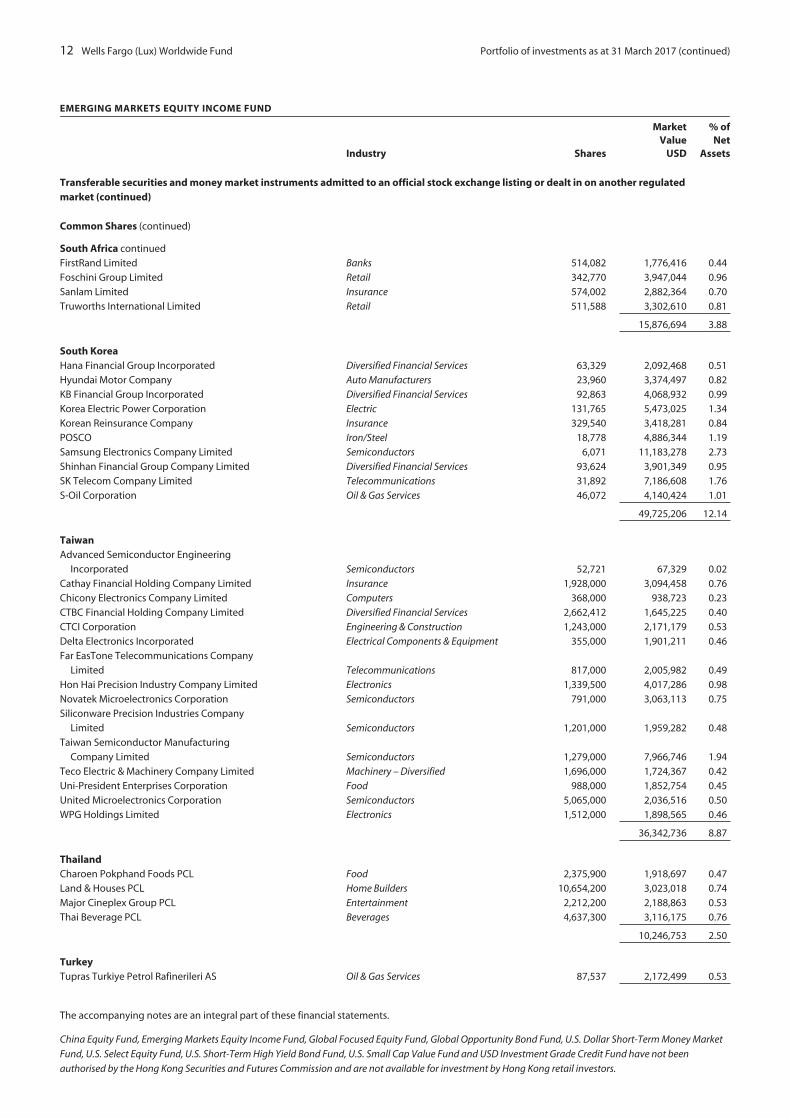
12 Wells Fargo (Lux) Worldwide Fund Portfolio of investments as at 31 March 2017 (continued)
EMERGING MARKETS EQUITY INCOME FUND
Industry Shares
MarketValue
USD
% ofNet
Assets
Transferable securities and money market instruments admitted to an official stock exchange listing or dealt in on another regulatedmarket (continued)
Common Shares (continued)
South Africa continued
FirstRand Limited Banks 514,082 1,776,416 0.44
Foschini Group Limited Retail 342,770 3,947,044 0.96
Sanlam Limited Insurance 574,002 2,882,364 0.70
Truworths International Limited Retail 511,588 3,302,610 0.81
15,876,694 3.88
South KoreaHana Financial Group Incorporated Diversified Financial Services 63,329 2,092,468 0.51
Hyundai Motor Company Auto Manufacturers 23,960 3,374,497 0.82
KB Financial Group Incorporated Diversified Financial Services 92,863 4,068,932 0.99
Korea Electric Power Corporation Electric 131,765 5,473,025 1.34
Korean Reinsurance Company Insurance 329,540 3,418,281 0.84
POSCO Iron/Steel 18,778 4,886,344 1.19
Samsung Electronics Company Limited Semiconductors 6,071 11,183,278 2.73
Shinhan Financial Group Company Limited Diversified Financial Services 93,624 3,901,349 0.95
SK Telecom Company Limited Telecommunications 31,892 7,186,608 1.76
S-Oil Corporation Oil & Gas Services 46,072 4,140,424 1.01
49,725,206 12.14
TaiwanAdvanced Semiconductor Engineering
Incorporated Semiconductors 52,721 67,329 0.02
Cathay Financial Holding Company Limited Insurance 1,928,000 3,094,458 0.76
Chicony Electronics Company Limited Computers 368,000 938,723 0.23
CTBC Financial Holding Company Limited Diversified Financial Services 2,662,412 1,645,225 0.40
CTCI Corporation Engineering & Construction 1,243,000 2,171,179 0.53
Delta Electronics Incorporated Electrical Components & Equipment 355,000 1,901,211 0.46
Far EasTone Telecommunications Company
Limited Telecommunications 817,000 2,005,982 0.49
Hon Hai Precision Industry Company Limited Electronics 1,339,500 4,017,286 0.98
Novatek Microelectronics Corporation Semiconductors 791,000 3,063,113 0.75
Siliconware Precision Industries Company
Limited Semiconductors 1,201,000 1,959,282 0.48
Taiwan Semiconductor Manufacturing
Company Limited Semiconductors 1,279,000 7,966,746 1.94
Teco Electric & Machinery Company Limited Machinery – Diversified 1,696,000 1,724,367 0.42
Uni-President Enterprises Corporation Food 988,000 1,852,754 0.45
United Microelectronics Corporation Semiconductors 5,065,000 2,036,516 0.50
WPG Holdings Limited Electronics 1,512,000 1,898,565 0.46
36,342,736 8.87
ThailandCharoen Pokphand Foods PCL Food 2,375,900 1,918,697 0.47
Land & Houses PCL Home Builders 10,654,200 3,023,018 0.74
Major Cineplex Group PCL Entertainment 2,212,200 2,188,863 0.53
Thai Beverage PCL Beverages 4,637,300 3,116,175 0.76
10,246,753 2.50
TurkeyTupras Turkiye Petrol Rafinerileri AS Oil & Gas Services 87,537 2,172,499 0.53
The accompanying notes are an integral part of these financial statements.
China Equity Fund, Emerging Markets Equity Income Fund, Global Focused Equity Fund, Global Opportunity Bond Fund, U.S. Dollar Short-Term Money Market
Fund, U.S. Select Equity Fund, U.S. Short-Term High Yield Bond Fund, U.S. Small Cap Value Fund and USD Investment Grade Credit Fund have not been
authorised by the Hong Kong Securities and Futures Commission and are not available for investment by Hong Kong retail investors.
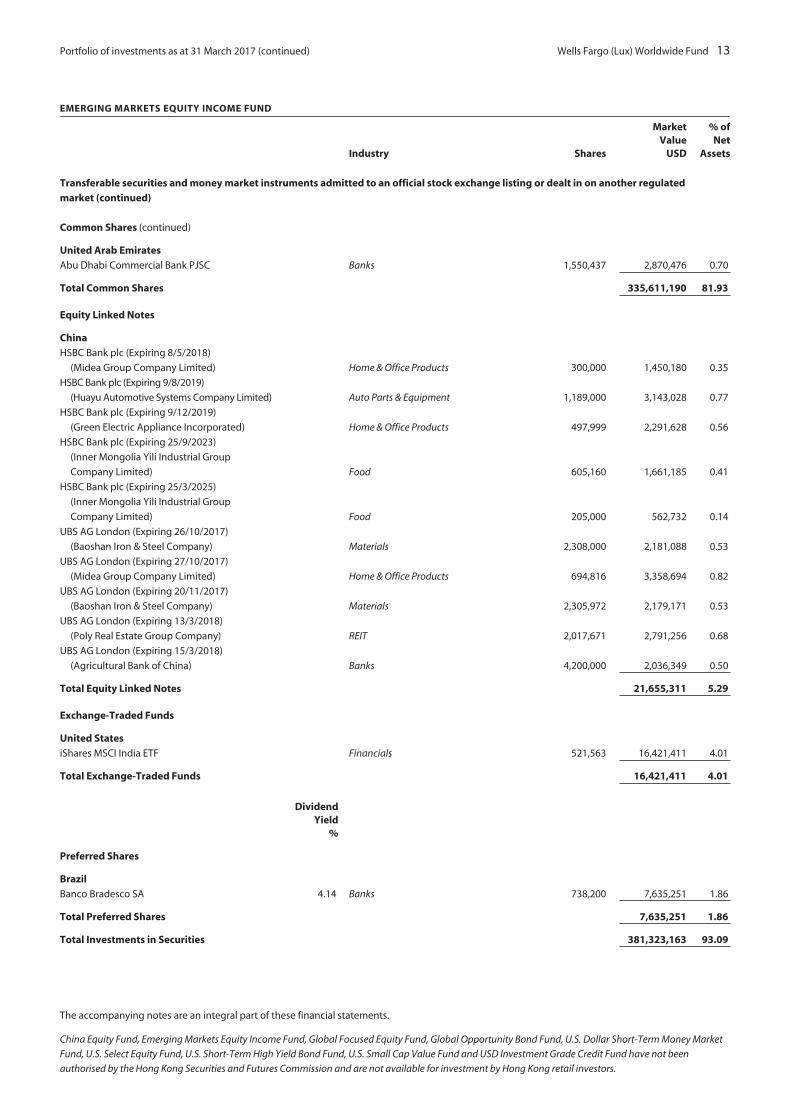
Portfolio of investments as at 31 March 2017 (continued) Wells Fargo (Lux) Worldwide Fund 13
EMERGING MARKETS EQUITY INCOME FUND
Industry Shares
MarketValue
USD
% ofNet
Assets
Transferable securities and money market instruments admitted to an official stock exchange listing or dealt in on another regulated
market (continued)
Common Shares (continued)
United Arab Emirates
Abu Dhabi Commercial Bank PJSC Banks 1,550,437 2,870,476 0.70
Total Common Shares 335,611,190 81.93
Equity Linked Notes
China
HSBC Bank plc (Expiring 8/5/2018)
(Midea Group Company Limited) Home & Office Products 300,000 1,450,180 0.35
HSBC Bank plc (Expiring 9/8/2019)
(Huayu Automotive Systems Company Limited) Auto Parts & Equipment 1,189,000 3,143,028 0.77
HSBC Bank plc (Expiring 9/12/2019)
(Green Electric Appliance Incorporated) Home & Office Products 497,999 2,291,628 0.56
HSBC Bank plc (Expiring 25/9/2023)
(Inner Mongolia Yili Industrial Group
Company Limited) Food 605,160 1,661,185 0.41
HSBC Bank plc (Expiring 25/3/2025)
(Inner Mongolia Yili Industrial Group
Company Limited) Food 205,000 562,732 0.14
UBS AG London (Expiring 26/10/2017)
(Baoshan Iron & Steel Company) Materials 2,308,000 2,181,088 0.53
UBS AG London (Expiring 27/10/2017)
(Midea Group Company Limited) Home & Office Products 694,816 3,358,694 0.82
UBS AG London (Expiring 20/11/2017)
(Baoshan Iron & Steel Company) Materials 2,305,972 2,179,171 0.53
UBS AG London (Expiring 13/3/2018)
(Poly Real Estate Group Company) REIT 2,017,671 2,791,256 0.68
UBS AG London (Expiring 15/3/2018)
(Agricultural Bank of China) Banks 4,200,000 2,036,349 0.50
Total Equity Linked Notes 21,655,311 5.29
Exchange-Traded Funds
United States
iShares MSCI India ETF Financials 521,563 16,421,411 4.01
Total Exchange-Traded Funds 16,421,411 4.01
DividendYield
%
Preferred Shares
Brazil
Banco Bradesco SA 4.14 Banks 738,200 7,635,251 1.86
Total Preferred Shares 7,635,251 1.86
Total Investments in Securities 381,323,163 93.09
The accompanying notes are an integral part of these financial statements.
China Equity Fund, Emerging Markets Equity Income Fund, Global Focused Equity Fund, Global Opportunity Bond Fund, U.S. Dollar Short-Term Money Market
Fund, U.S. Select Equity Fund, U.S. Short-Term High Yield Bond Fund, U.S. Small Cap Value Fund and USD Investment Grade Credit Fund have not been
authorised by the Hong Kong Securities and Futures Commission and are not available for investment by Hong Kong retail investors.
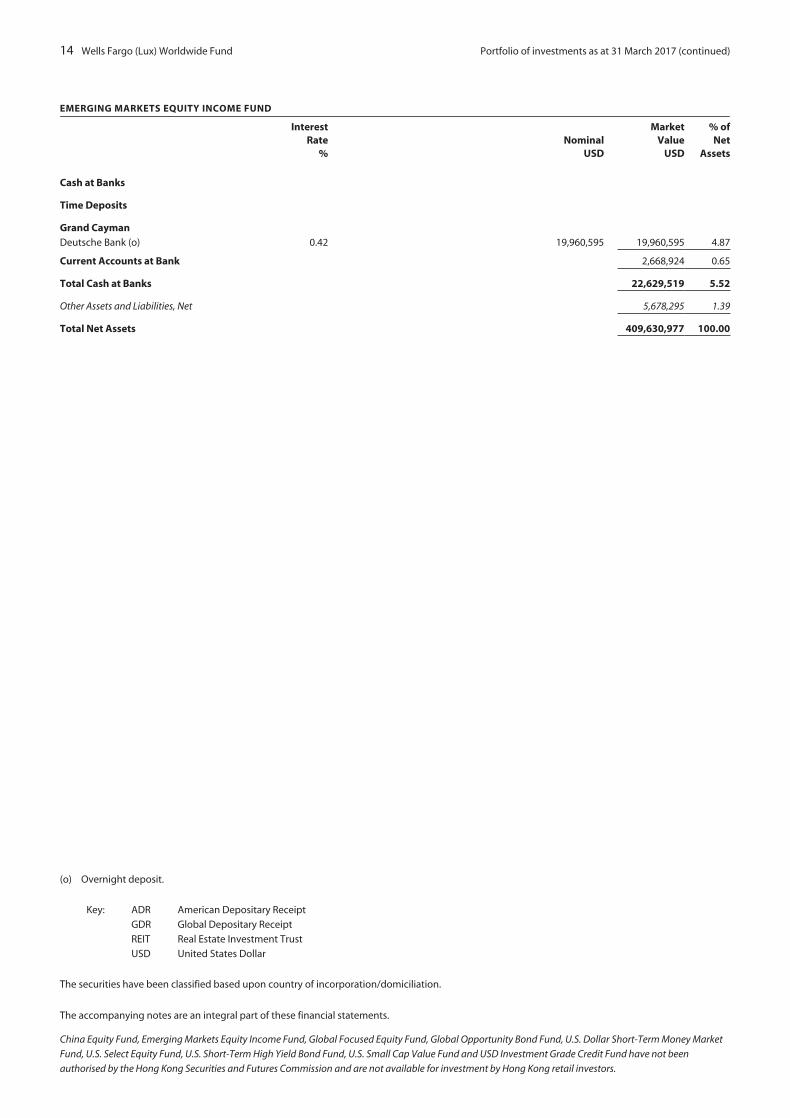
14 Wells Fargo (Lux) Worldwide Fund Portfolio of investments as at 31 March 2017 (continued)
EMERGING MARKETS EQUITY INCOME FUND
InterestRate
%Nominal
USD
MarketValue
USD
% ofNet
Assets
Cash at Banks
Time Deposits
Grand CaymanDeutsche Bank (o) 0.42 19,960,595 19,960,595 4.87
Current Accounts at Bank 2,668,924 0.65
Total Cash at Banks 22,629,519 5.52
Other Assets and Liabilities, Net 5,678,295 1.39
Total Net Assets 409,630,977 100.00
(o) Overnight deposit.
Key: ADR American Depositary Receipt
GDR Global Depositary Receipt
REIT Real Estate Investment Trust
USD United States Dollar
The securities have been classified based upon country of incorporation/domiciliation.
The accompanying notes are an integral part of these financial statements.
China Equity Fund, Emerging Markets Equity Income Fund, Global Focused Equity Fund, Global Opportunity Bond Fund, U.S. Dollar Short-Term Money Market
Fund, U.S. Select Equity Fund, U.S. Short-Term High Yield Bond Fund, U.S. Small Cap Value Fund and USD Investment Grade Credit Fund have not been
authorised by the Hong Kong Securities and Futures Commission and are not available for investment by Hong Kong retail investors.
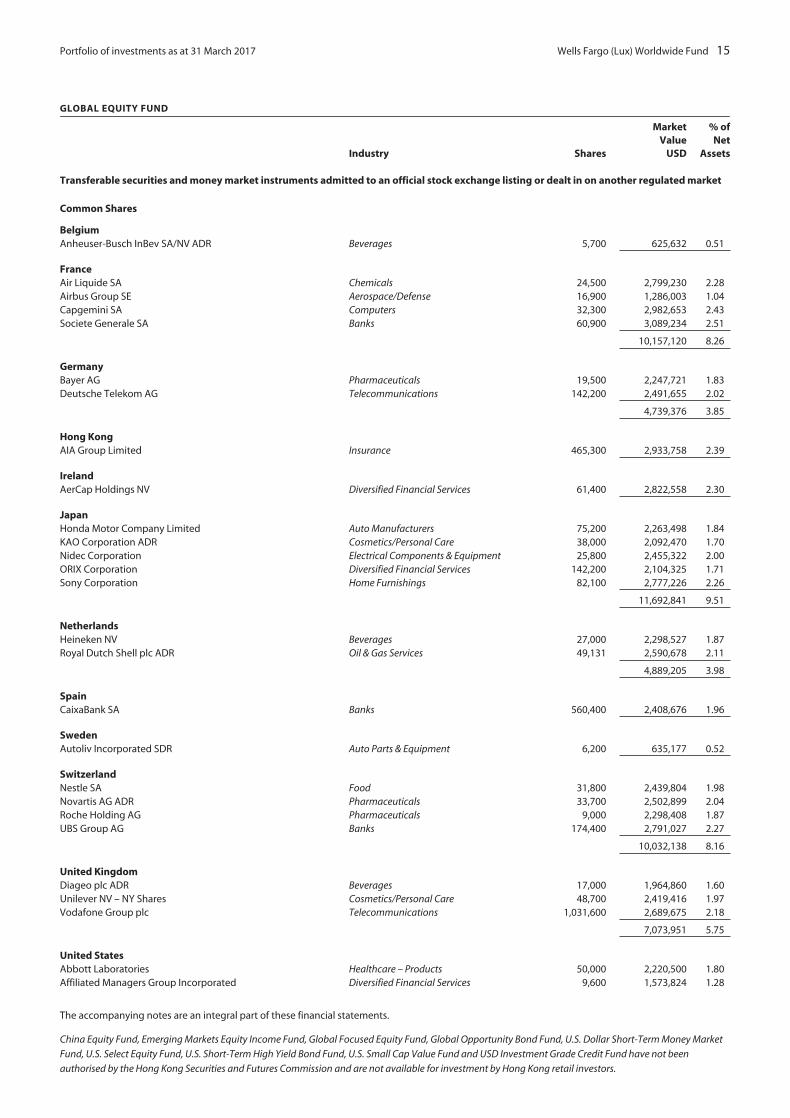
Portfolio of investments as at 31 March 2017 Wells Fargo (Lux) Worldwide Fund 15
GLOBAL EQUITY FUND
Industry Shares
MarketValue
USD
% ofNet
Assets
Transferable securities and money market instruments admitted to an official stock exchange listing or dealt in on another regulated market
Common Shares
BelgiumAnheuser-Busch InBev SA/NV ADR Beverages 5,700 625,632 0.51
FranceAir Liquide SA Chemicals 24,500 2,799,230 2.28Airbus Group SE Aerospace/Defense 16,900 1,286,003 1.04Capgemini SA Computers 32,300 2,982,653 2.43Societe Generale SA Banks 60,900 3,089,234 2.51
10,157,120 8.26
GermanyBayer AG Pharmaceuticals 19,500 2,247,721 1.83Deutsche Telekom AG Telecommunications 142,200 2,491,655 2.02
4,739,376 3.85
Hong KongAIA Group Limited Insurance 465,300 2,933,758 2.39
IrelandAerCap Holdings NV Diversified Financial Services 61,400 2,822,558 2.30
JapanHonda Motor Company Limited Auto Manufacturers 75,200 2,263,498 1.84KAO Corporation ADR Cosmetics/Personal Care 38,000 2,092,470 1.70Nidec Corporation Electrical Components & Equipment 25,800 2,455,322 2.00ORIX Corporation Diversified Financial Services 142,200 2,104,325 1.71Sony Corporation Home Furnishings 82,100 2,777,226 2.26
11,692,841 9.51
NetherlandsHeineken NV Beverages 27,000 2,298,527 1.87Royal Dutch Shell plc ADR Oil & Gas Services 49,131 2,590,678 2.11
4,889,205 3.98
SpainCaixaBank SA Banks 560,400 2,408,676 1.96
SwedenAutoliv Incorporated SDR Auto Parts & Equipment 6,200 635,177 0.52
SwitzerlandNestle SA Food 31,800 2,439,804 1.98Novartis AG ADR Pharmaceuticals 33,700 2,502,899 2.04Roche Holding AG Pharmaceuticals 9,000 2,298,408 1.87UBS Group AG Banks 174,400 2,791,027 2.27
10,032,138 8.16
United KingdomDiageo plc ADR Beverages 17,000 1,964,860 1.60Unilever NV – NY Shares Cosmetics/Personal Care 48,700 2,419,416 1.97Vodafone Group plc Telecommunications 1,031,600 2,689,675 2.18
7,073,951 5.75
United StatesAbbott Laboratories Healthcare – Products 50,000 2,220,500 1.80Affiliated Managers Group Incorporated Diversified Financial Services 9,600 1,573,824 1.28
The accompanying notes are an integral part of these financial statements.
China Equity Fund, Emerging Markets Equity Income Fund, Global Focused Equity Fund, Global Opportunity Bond Fund, U.S. Dollar Short-Term Money Market
Fund, U.S. Select Equity Fund, U.S. Short-Term High Yield Bond Fund, U.S. Small Cap Value Fund and USD Investment Grade Credit Fund have not been
authorised by the Hong Kong Securities and Futures Commission and are not available for investment by Hong Kong retail investors.
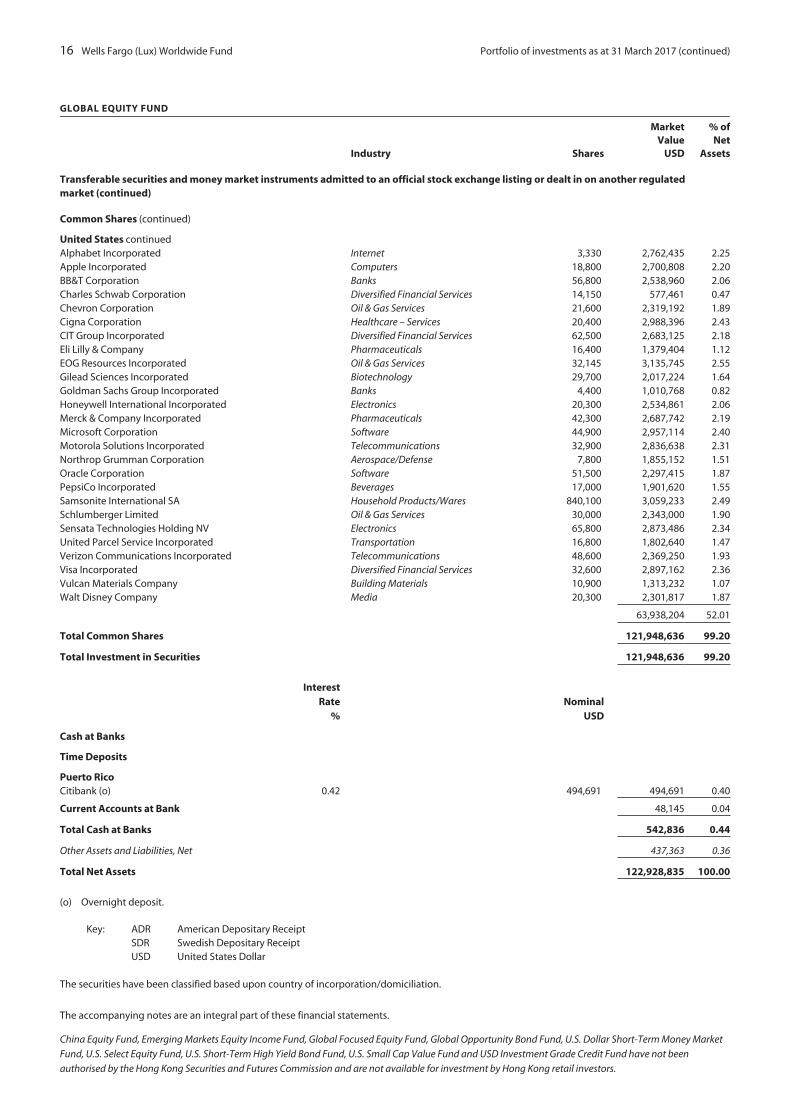
16 Wells Fargo (Lux) Worldwide Fund Portfolio of investments as at 31 March 2017 (continued)
GLOBAL EQUITY FUND
Industry Shares
MarketValue
USD
% ofNet
Assets
Transferable securities and money market instruments admitted to an official stock exchange listing or dealt in on another regulatedmarket (continued)
Common Shares (continued)
United States continuedAlphabet Incorporated Internet 3,330 2,762,435 2.25Apple Incorporated Computers 18,800 2,700,808 2.20BB&T Corporation Banks 56,800 2,538,960 2.06Charles Schwab Corporation Diversified Financial Services 14,150 577,461 0.47Chevron Corporation Oil & Gas Services 21,600 2,319,192 1.89Cigna Corporation Healthcare – Services 20,400 2,988,396 2.43CIT Group Incorporated Diversified Financial Services 62,500 2,683,125 2.18Eli Lilly & Company Pharmaceuticals 16,400 1,379,404 1.12EOG Resources Incorporated Oil & Gas Services 32,145 3,135,745 2.55Gilead Sciences Incorporated Biotechnology 29,700 2,017,224 1.64Goldman Sachs Group Incorporated Banks 4,400 1,010,768 0.82Honeywell International Incorporated Electronics 20,300 2,534,861 2.06Merck & Company Incorporated Pharmaceuticals 42,300 2,687,742 2.19Microsoft Corporation Software 44,900 2,957,114 2.40Motorola Solutions Incorporated Telecommunications 32,900 2,836,638 2.31Northrop Grumman Corporation Aerospace/Defense 7,800 1,855,152 1.51Oracle Corporation Software 51,500 2,297,415 1.87PepsiCo Incorporated Beverages 17,000 1,901,620 1.55Samsonite International SA Household Products/Wares 840,100 3,059,233 2.49Schlumberger Limited Oil & Gas Services 30,000 2,343,000 1.90Sensata Technologies Holding NV Electronics 65,800 2,873,486 2.34United Parcel Service Incorporated Transportation 16,800 1,802,640 1.47Verizon Communications Incorporated Telecommunications 48,600 2,369,250 1.93Visa Incorporated Diversified Financial Services 32,600 2,897,162 2.36Vulcan Materials Company Building Materials 10,900 1,313,232 1.07Walt Disney Company Media 20,300 2,301,817 1.87
63,938,204 52.01
Total Common Shares 121,948,636 99.20
Total Investment in Securities 121,948,636 99.20
InterestRate
%Nominal
USD
Cash at Banks
Time Deposits
Puerto RicoCitibank (o) 0.42 494,691 494,691 0.40
Current Accounts at Bank 48,145 0.04
Total Cash at Banks 542,836 0.44
Other Assets and Liabilities, Net 437,363 0.36
Total Net Assets 122,928,835 100.00
(o) Overnight deposit.
Key: ADR American Depositary ReceiptSDR Swedish Depositary ReceiptUSD United States Dollar
The securities have been classified based upon country of incorporation/domiciliation.
The accompanying notes are an integral part of these financial statements.
China Equity Fund, Emerging Markets Equity Income Fund, Global Focused Equity Fund, Global Opportunity Bond Fund, U.S. Dollar Short-Term Money Market
Fund, U.S. Select Equity Fund, U.S. Short-Term High Yield Bond Fund, U.S. Small Cap Value Fund and USD Investment Grade Credit Fund have not been
authorised by the Hong Kong Securities and Futures Commission and are not available for investment by Hong Kong retail investors.
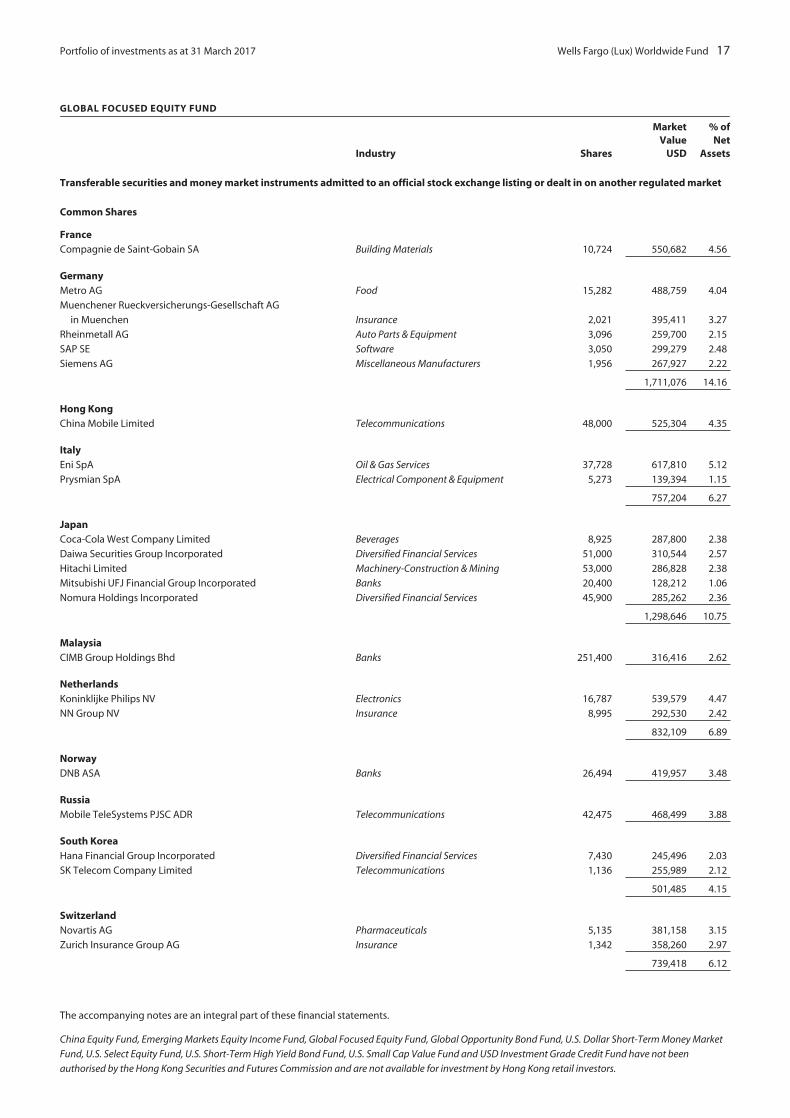
Portfolio of investments as at 31 March 2017 Wells Fargo (Lux) Worldwide Fund 17
GLOBAL FOCUSED EQUITY FUND
Industry Shares
MarketValue
USD
% ofNet
Assets
Transferable securities and money market instruments admitted to an official stock exchange listing or dealt in on another regulated market
Common Shares
FranceCompagnie de Saint-Gobain SA Building Materials 10,724 550,682 4.56
GermanyMetro AG Food 15,282 488,759 4.04
Muenchener Rueckversicherungs-Gesellschaft AG
in Muenchen Insurance 2,021 395,411 3.27
Rheinmetall AG Auto Parts & Equipment 3,096 259,700 2.15
SAP SE Software 3,050 299,279 2.48
Siemens AG Miscellaneous Manufacturers 1,956 267,927 2.22
1,711,076 14.16
Hong KongChina Mobile Limited Telecommunications 48,000 525,304 4.35
ItalyEni SpA Oil & Gas Services 37,728 617,810 5.12
Prysmian SpA Electrical Component & Equipment 5,273 139,394 1.15
757,204 6.27
JapanCoca-Cola West Company Limited Beverages 8,925 287,800 2.38
Daiwa Securities Group Incorporated Diversified Financial Services 51,000 310,544 2.57
Hitachi Limited Machinery-Construction & Mining 53,000 286,828 2.38
Mitsubishi UFJ Financial Group Incorporated Banks 20,400 128,212 1.06
Nomura Holdings Incorporated Diversified Financial Services 45,900 285,262 2.36
1,298,646 10.75
MalaysiaCIMB Group Holdings Bhd Banks 251,400 316,416 2.62
NetherlandsKoninklijke Philips NV Electronics 16,787 539,579 4.47
NN Group NV Insurance 8,995 292,530 2.42
832,109 6.89
NorwayDNB ASA Banks 26,494 419,957 3.48
RussiaMobile TeleSystems PJSC ADR Telecommunications 42,475 468,499 3.88
South KoreaHana Financial Group Incorporated Diversified Financial Services 7,430 245,496 2.03
SK Telecom Company Limited Telecommunications 1,136 255,989 2.12
501,485 4.15
SwitzerlandNovartis AG Pharmaceuticals 5,135 381,158 3.15
Zurich Insurance Group AG Insurance 1,342 358,260 2.97
739,418 6.12
The accompanying notes are an integral part of these financial statements.
China Equity Fund, Emerging Markets Equity Income Fund, Global Focused Equity Fund, Global Opportunity Bond Fund, U.S. Dollar Short-Term Money Market
Fund, U.S. Select Equity Fund, U.S. Short-Term High Yield Bond Fund, U.S. Small Cap Value Fund and USD Investment Grade Credit Fund have not been
authorised by the Hong Kong Securities and Futures Commission and are not available for investment by Hong Kong retail investors.
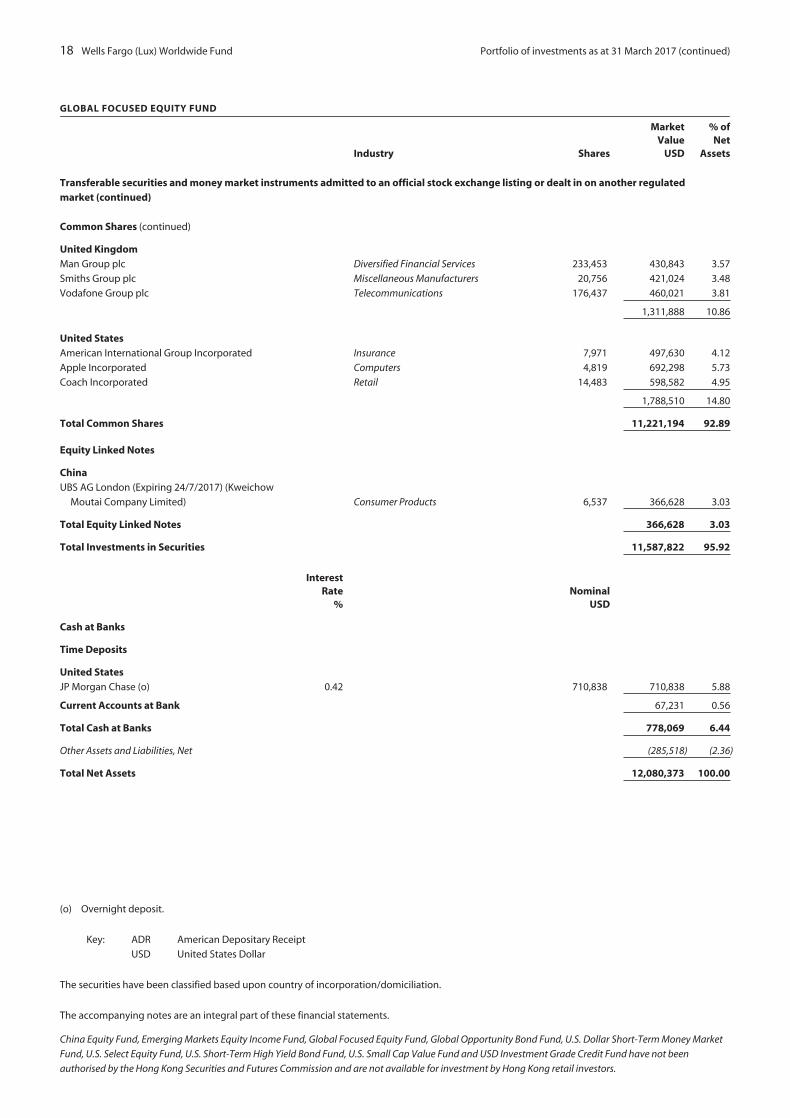
18 Wells Fargo (Lux) Worldwide Fund Portfolio of investments as at 31 March 2017 (continued)
GLOBAL FOCUSED EQUITY FUND
Industry Shares
MarketValue
USD
% ofNet
Assets
Transferable securities and money market instruments admitted to an official stock exchange listing or dealt in on another regulatedmarket (continued)
Common Shares (continued)
United KingdomMan Group plc Diversified Financial Services 233,453 430,843 3.57
Smiths Group plc Miscellaneous Manufacturers 20,756 421,024 3.48
Vodafone Group plc Telecommunications 176,437 460,021 3.81
1,311,888 10.86
United StatesAmerican International Group Incorporated Insurance 7,971 497,630 4.12
Apple Incorporated Computers 4,819 692,298 5.73
Coach Incorporated Retail 14,483 598,582 4.95
1,788,510 14.80
Total Common Shares 11,221,194 92.89
Equity Linked Notes
ChinaUBS AG London (Expiring 24/7/2017) (Kweichow
Moutai Company Limited) Consumer Products 6,537 366,628 3.03
Total Equity Linked Notes 366,628 3.03
Total Investments in Securities 11,587,822 95.92
InterestRate
%Nominal
USD
Cash at Banks
Time Deposits
United StatesJP Morgan Chase (o) 0.42 710,838 710,838 5.88
Current Accounts at Bank 67,231 0.56
Total Cash at Banks 778,069 6.44
Other Assets and Liabilities, Net (285,518) (2.36)
Total Net Assets 12,080,373 100.00
(o) Overnight deposit.
Key: ADR American Depositary Receipt
USD United States Dollar
The securities have been classified based upon country of incorporation/domiciliation.
The accompanying notes are an integral part of these financial statements.
China Equity Fund, Emerging Markets Equity Income Fund, Global Focused Equity Fund, Global Opportunity Bond Fund, U.S. Dollar Short-Term Money Market
Fund, U.S. Select Equity Fund, U.S. Short-Term High Yield Bond Fund, U.S. Small Cap Value Fund and USD Investment Grade Credit Fund have not been
authorised by the Hong Kong Securities and Futures Commission and are not available for investment by Hong Kong retail investors.

Portfolio of investments as at 31 March 2017 Wells Fargo (Lux) Worldwide Fund 19
GLOBAL OPPORTUNITY BOND FUND
InterestRate
%Maturity
Date Industry Nominal @
MarketValue
USD
% ofNet
Assets
Transferable securities and money market instruments admitted to an official stock exchange listing or dealt in on another regulated market
Agency Securities
United StatesFHLMC 3.00 1/2/2030 982,941 USD 1,008,821 1.17
FNMA 2.50 1/5/2030 1,141,356 USD 1,147,406 1.33
Total Agency Securities 2,156,227 2.50
Corporate Bonds and Notes
AustraliaOptus Finance Proprietary Limited 4.63 15/10/2019 Telecommunications 150,000 USD 158,156 0.18
BrazilBRF SA 7.75 22/5/2018 Food 300,000 BRL 91,276 0.11
CanadaAlimentation Couche-Tard Incorporated 1.88 6/5/2026 Retail 250,000 EUR 271,451 0.31
Cayman IslandsHPHT Finance 15 Limited 2.88 17/3/2020 Commercial Services 200,000 USD 200,664 0.23
UPCB Finance IV Limited 5.38 15/1/2025 Media 200,000 USD 201,250 0.24
401,914 0.47
DenmarkNordea Kredit Realkreditaktieselskab 2.00 1/10/2047 Diversified Financial Services 5,700,000 DKK 798,978 0.93
Nykredit Realkredit 2.00 1/10/2047 Banks 12,850,000 DKK 1,800,743 2.09
2,599,721 3.02
FranceCasino Guichard Perrachon SA 4.50 7/3/2024 Food 200,000 EUR 231,207 0.27
Danone SA 2.95 2/11/2026 Food 390,000 USD 372,782 0.43
Total Capital International SA 2.70 25/1/2023 Oil & Gas Services 300,000 USD 297,455 0.35
901,444 1.05
GermanyHP Pelzer Holding GmbH 4.13 1/4/2024 Auto Parts & Equipment 100,000 EUR 107,368 0.12
IrelandArdagh Packaging Finance plc 4.63 15/5/2023 Packaging & Containers 300,000 USD 302,250 0.35
Virgin Media Receivables Financing
Notes I DAC 5.50 15/9/2024 Media 200,000 GBP 260,165 0.30
562,415 0.65
JerseyAdient Global Holdings Limited 3.50 15/8/2024 Auto Parts & Equipment 200,000 EUR 214,736 0.25
Heathrow Funding Limited 7.13 14/2/2024 Engineering & Construction 200,000 GBP 325,692 0.38
540,428 0.63
MexicoSigma Alimentos SA de CV 2.63 7/2/2024 Food 150,000 EUR 164,156 0.19
NetherlandsABN AMRO Bank NV 2.45 4/6/2020 Banks 450,000 USD 450,024 0.52
Fiat Chrysler Automobiles NV 5.25 15/4/2023 Auto Manufacturers 200,000 USD 205,700 0.24
Heineken NV 3.40 1/4/2022 Beverages 250,000 USD 257,847 0.30
Siemens Financieringsmaatschappij NV 2.35 15/10/2026 Miscellaneous Manufacturers 475,000 USD 441,115 0.51
1,354,686 1.57
The accompanying notes are an integral part of these financial statements.
China Equity Fund, Emerging Markets Equity Income Fund, Global Focused Equity Fund, Global Opportunity Bond Fund, U.S. Dollar Short-Term Money Market
Fund, U.S. Select Equity Fund, U.S. Short-Term High Yield Bond Fund, U.S. Small Cap Value Fund and USD Investment Grade Credit Fund have not been
authorised by the Hong Kong Securities and Futures Commission and are not available for investment by Hong Kong retail investors.

20 Wells Fargo (Lux) Worldwide Fund Portfolio of investments as at 31 March 2017 (continued)
GLOBAL OPPORTUNITY BOND FUND
InterestRate
%Maturity
Date Industry Nominal @
MarketValue
USD
% ofNet
Assets
Transferable securities and money market instruments admitted to an official stock exchange listing or dealt in on another regulatedmarket (continued)
Corporate Bonds and Notes (continued)
SpainEnce Energia y Celulosa SA 5.38 1/11/2022 Forest Products & Paper 200,000 EUR 228,538 0.27Telefonica Emisiones SAU 3.99 23/1/2023 Telecommunications 200,000 EUR 249,082 0.29Telefonica Emisiones SAU 4.10 8/3/2027 Telecommunications 250,000 USD 251,621 0.29
729,241 0.85
United KingdomBP Capital Markets plc 3.22 14/4/2024 Oil & Gas Services 825,000 USD 825,265 0.96Ineos Finance plc 4.00 1/5/2023 Chemicals 275,000 EUR 301,758 0.35International Game Technology plc 6.25 15/2/2022 Entertainment 275,000 USD 293,563 0.34Jaguar Land Rover Automotive plc 3.50 15/3/2020 Auto Manufacturers 200,000 USD 201,500 0.23Nationwide Building Society 2.25 29/4/2022 Savings & Loans 300,000 GBP 392,329 0.46Sky plc 3.75 16/9/2024 Media 350,000 USD 353,493 0.41Tesco plc 6.13 24/2/2022 Food 120,000 GBP 173,125 0.20Travis Perkins plc 4.50 7/9/2023 Retail 250,000 GBP 318,373 0.37
2,859,406 3.32
United StatesAbbott Laboratories 3.40 30/11/2023 Healthcare-Products 350,000 USD 353,095 0.41AbbVie Incorporated 3.20 14/5/2026 Pharmaceuticals 450,000 USD 432,529 0.50Amazon.com Incorporated 3.30 5/12/2021 Internet 300,000 USD 311,584 0.36Anheuser-Busch InBev Finance
Incorporated 3.65 1/2/2026 Beverages 400,000 USD 404,440 0.47Apple Incorporated 2.45 4/8/2026 Computers 275,000 USD 260,106 0.30AT&T Incorporated 3.60 17/2/2023 Telecommunications 425,000 USD 430,385 0.50Bank of America Corporation 4.00 1/4/2024 Banks 400,000 USD 414,685 0.48Chubb INA Holdings Incorporated 3.35 3/5/2026 Insurance 100,000 USD 101,146 0.12Comcast Corporation 3.30 1/2/2027 Media 425,000 USD 420,719 0.49Federal-Mogul Holdings LLC 4.88 15/4/2022 Auto Parts & Equipment 100,000 EUR 105,960 0.12FedEx Corporation 1.63 11/1/2027 Transportation 225,000 EUR 241,963 0.28Ford Motor Credit Company LLC 2.46 27/3/2020 Auto Manufacturers 250,000 USD 249,125 0.29Gilead Sciences Incorporated 2.95 1/3/2027 Biotechnology 425,000 USD 402,976 0.47Goldman Sachs Group Incorporated 3.75 25/2/2026 Banks 275,000 USD 276,737 0.32Home Depot Incorporated 2.13 15/9/2026 Retail 400,000 USD 371,129 0.43Johnson & Johnson 2.95 3/3/2027 Pharmaceuticals 400,000 USD 399,923 0.46JPMorgan Chase & Company 3.25 23/9/2022 Banks 400,000 USD 407,229 0.47Kraft Heinz Foods Company 3.00 1/6/2026 Food 400,000 USD 375,857 0.44Lam Research Corporation 2.75 15/3/2020 Semiconductors 500,000 USD 505,753 0.59Microsoft Corporation 2.40 8/8/2026 Software 275,000 USD 260,015 0.30Morgan Stanley 3.88 29/4/2024 Banks 400,000 USD 411,620 0.48Novartis Capital Corporation 3.00 20/11/2025 Pharmaceuticals 350,000 USD 349,680 0.40Oracle Corporation 2.65 15/7/2026 Software 225,000 USD 214,223 0.25Thermo Fisher Scientific Incorporated 2.95 19/9/2026 Healthcare-Products 400,000 USD 380,806 0.44Verizon Communications Incorporated 4.15 15/3/2024 Telecommunications 250,000 USD 259,349 0.30Walgreens Boots Alliance Incorporated 3.45 1/6/2026 Retail 200,000 USD 194,965 0.23
8,535,999 9.90
Total Corporate Bonds and Notes 19,277,661 22.37
Government Bonds
AustraliaAustralia Bond 3.25 21/4/2025 3,535,000 AUD 2,830,570 3.28Australia Bond 2.75 21/11/2027 1,950,000 AUD 1,487,383 1.73
The accompanying notes are an integral part of these financial statements.
China Equity Fund, Emerging Markets Equity Income Fund, Global Focused Equity Fund, Global Opportunity Bond Fund, U.S. Dollar Short-Term Money Market
Fund, U.S. Select Equity Fund, U.S. Short-Term High Yield Bond Fund, U.S. Small Cap Value Fund and USD Investment Grade Credit Fund have not been
authorised by the Hong Kong Securities and Futures Commission and are not available for investment by Hong Kong retail investors.

Portfolio of investments as at 31 March 2017 (continued) Wells Fargo (Lux) Worldwide Fund 21
GLOBAL OPPORTUNITY BOND FUND
InterestRate
%Maturity
Date Nominal @
MarketValue
USD
% ofNet
Assets
Transferable securities and money market instruments admitted to an official stock exchange listing or dealt in on another regulatedmarket (continued)
Government Bonds (continued)
Australia continued
Australia Bond 3.25 21/4/2029 1,100,000 AUD 873,171 1.01
New South Wales Treasury Corporation 4.00 20/4/2023 1,750,000 AUD 1,444,690 1.68
Queensland Treasury Corporation 4.75 21/7/2025 1,600,000 AUD 1,381,342 1.60
8,017,156 9.30
BrazilBrazil Notas do Tesouro Nacional Serie F 10.00 1/1/2019 2,305,000 BRL 760,910 0.88
Brazil Notas do Tesouro Nacional Serie F 10.00 1/1/2025 2,715,000 BRL 888,766 1.03
1,649,676 1.91
HungaryHungary Bond 7.00 24/6/2022 110,000,000 HUF 473,906 0.55
Hungary Bond 1.75 26/10/2022 80,000,000 HUF 269,932 0.31
743,838 0.86
MalaysiaMalaysia Bond 3.96 15/9/2025 4,200,000 MYR 932,693 1.08
Malaysia Bond 3.90 30/11/2026 4,300,000 MYR 951,674 1.11
Malaysia Bond 4.50 15/4/2030 1,950,000 MYR 440,724 0.51
2,325,091 2.70
MexicoMexican Bonos 7.75 13/11/2042 47,000,000 MXN 2,597,015 3.01
New ZealandNew Zealand Bond 4.50 15/4/2027 4,080,000 NZD 3,174,320 3.68
PolandPoland Bond 1.50 25/4/2020 9,550,000 PLN 2,347,946 2.72
QatarQatar International Bond 4.50 20/1/2022 300,000 USD 322,440 0.38
RomaniaRomania Bond 5.75 29/4/2020 2,800,000 RON 726,759 0.84
SingaporeSingapore Bond 3.00 1/9/2024 1,095,000 SGD 831,319 0.96
Singapore Bond 2.88 1/9/2030 1,035,000 SGD 781,283 0.91
1,612,602 1.87
South AfricaSouth Africa Bond 7.75 28/2/2023 14,230,000 ZAR 1,033,629 1.20
South Africa Bond 10.50 21/12/2026 5,500,000 ZAR 453,282 0.53
1,486,911 1.73
South KoreaKorea Treasury Bond 2.00 10/3/2020 625,000,000 KRW 563,658 0.66
Korea Treasury Bond 3.00 10/9/2024 600,000,000 KRW 569,689 0.66
1,133,347 1.32
ThailandThailand Bond 3.85 12/12/2025 50,500,000 THB 1,612,798 1.87
The accompanying notes are an integral part of these financial statements.
China Equity Fund, Emerging Markets Equity Income Fund, Global Focused Equity Fund, Global Opportunity Bond Fund, U.S. Dollar Short-Term Money Market
Fund, U.S. Select Equity Fund, U.S. Short-Term High Yield Bond Fund, U.S. Small Cap Value Fund and USD Investment Grade Credit Fund have not been
authorised by the Hong Kong Securities and Futures Commission and are not available for investment by Hong Kong retail investors.

22 Wells Fargo (Lux) Worldwide Fund Portfolio of investments as at 31 March 2017 (continued)
GLOBAL OPPORTUNITY BOND FUND
InterestRate
%Maturity
Date Nominal @
MarketValue
USD
% ofNet
Assets
Transferable securities and money market instruments admitted to an official stock exchange listing or dealt in on another regulatedmarket (continued)
Government Bonds (continued)
United KingdomUnited Kingdom Gilt 2.00 7/9/2025 600,000 GBP 817,506 0.95
United Kingdom Gilt 1.50 22/7/2026 1,050,000 GBP 1,366,733 1.58
2,184,239 2.53
United StatesUnited States Treasury Bond 3.00 15/11/2045 1,800,000 USD 1,788,329 2.08
United States Treasury Note 1.38 28/2/2019 7,200,000 USD 7,216,596 8.37
United States Treasury Note 1.63 30/4/2019 5,500,000 USD 5,537,384 6.43
United States Treasury Note 1.88 30/11/2021 4,375,000 USD 4,369,531 5.07
United States Treasury Note 2.13 31/12/2021 4,100,000 USD 4,138,118 4.80
United States Treasury Note 2.13 31/12/2022 6,350,000 USD 6,364,141 7.38United States Treasury Note 1.50 15/8/2026 4,000,000 USD 3,700,468 4.29
33,114,567 38.42
Total Government Bonds 63,048,705 73.14
Total Investments in Securities 84,482,593 98.01
Cash at Banks
Time Deposits
Grand CaymanDeutsche Bank (o) 0.42 1,897,168 USD 1,897,168 2.20
Current Accounts at Bank 409,646 0.48
Total Cash at Banks 2,306,814 2.68
Other assets and liabilities, Net (590,020) (0.69)
Total Net Assets 86,199,387 100.00
@ Nominal amount is denominated in currency indicated.(o) Overnight deposit.
Key: AUD Australian Dollar
BRL Brazilian Real
DKK Danish Krone
EUR Euro
GBP Pound Sterling
HUF Hungarian Forint
KRW South Korean Won
MXN Mexican Peso
MYR Malaysian Ringgit
NZD New Zealand Dollar
PLN Polish Zloty
RON Romanian New Leu
SGD Singapore Dollar
THB Thai Baht
USD United States Dollar
ZAR South African Rand
The securities have been classified based upon country of incorporation/domiciliation.
The accompanying notes are an integral part of these financial statements.
China Equity Fund, Emerging Markets Equity Income Fund, Global Focused Equity Fund, Global Opportunity Bond Fund, U.S. Dollar Short-Term Money Market
Fund, U.S. Select Equity Fund, U.S. Short-Term High Yield Bond Fund, U.S. Small Cap Value Fund and USD Investment Grade Credit Fund have not been
authorised by the Hong Kong Securities and Futures Commission and are not available for investment by Hong Kong retail investors.
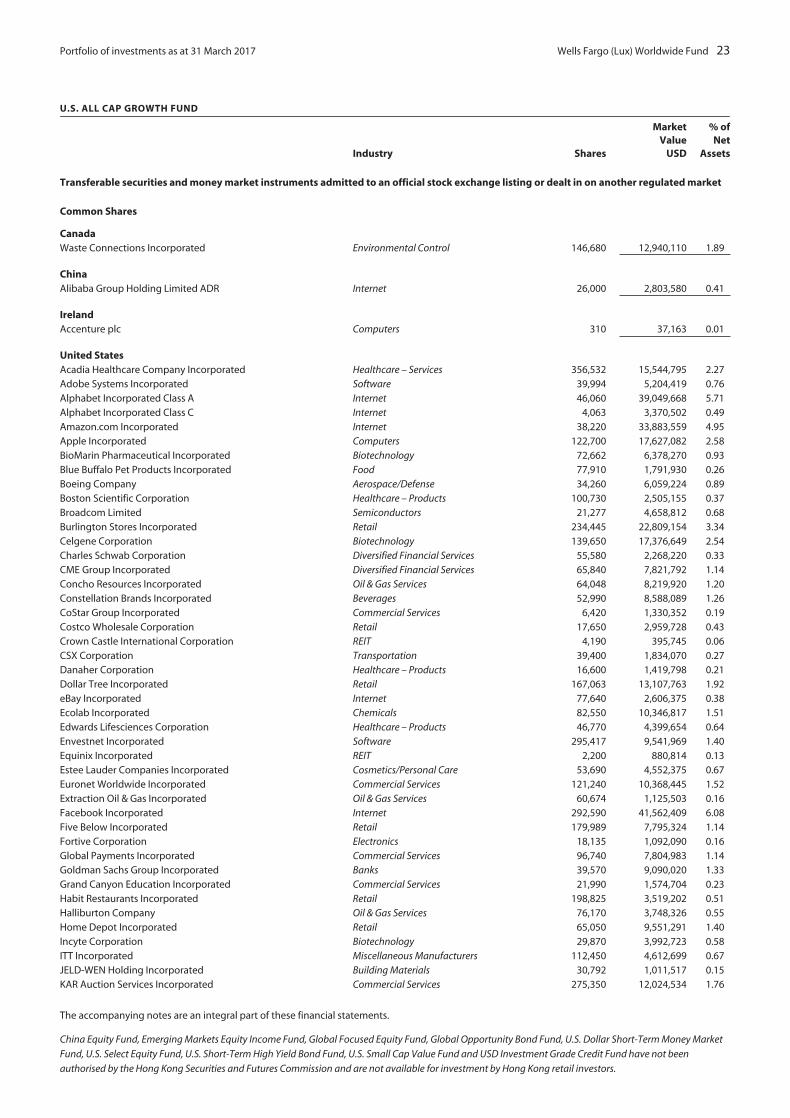
Portfolio of investments as at 31 March 2017 Wells Fargo (Lux) Worldwide Fund 23
U.S. ALL CAP GROWTH FUND
Industry Shares
MarketValue
USD
% ofNet
Assets
Transferable securities and money market instruments admitted to an official stock exchange listing or dealt in on another regulated market
Common Shares
CanadaWaste Connections Incorporated Environmental Control 146,680 12,940,110 1.89
ChinaAlibaba Group Holding Limited ADR Internet 26,000 2,803,580 0.41
IrelandAccenture plc Computers 310 37,163 0.01
United StatesAcadia Healthcare Company Incorporated Healthcare – Services 356,532 15,544,795 2.27Adobe Systems Incorporated Software 39,994 5,204,419 0.76Alphabet Incorporated Class A Internet 46,060 39,049,668 5.71Alphabet Incorporated Class C Internet 4,063 3,370,502 0.49Amazon.com Incorporated Internet 38,220 33,883,559 4.95Apple Incorporated Computers 122,700 17,627,082 2.58BioMarin Pharmaceutical Incorporated Biotechnology 72,662 6,378,270 0.93Blue Buffalo Pet Products Incorporated Food 77,910 1,791,930 0.26Boeing Company Aerospace/Defense 34,260 6,059,224 0.89Boston Scientific Corporation Healthcare – Products 100,730 2,505,155 0.37Broadcom Limited Semiconductors 21,277 4,658,812 0.68Burlington Stores Incorporated Retail 234,445 22,809,154 3.34Celgene Corporation Biotechnology 139,650 17,376,649 2.54Charles Schwab Corporation Diversified Financial Services 55,580 2,268,220 0.33CME Group Incorporated Diversified Financial Services 65,840 7,821,792 1.14Concho Resources Incorporated Oil & Gas Services 64,048 8,219,920 1.20Constellation Brands Incorporated Beverages 52,990 8,588,089 1.26CoStar Group Incorporated Commercial Services 6,420 1,330,352 0.19Costco Wholesale Corporation Retail 17,650 2,959,728 0.43Crown Castle International Corporation REIT 4,190 395,745 0.06CSX Corporation Transportation 39,400 1,834,070 0.27Danaher Corporation Healthcare – Products 16,600 1,419,798 0.21Dollar Tree Incorporated Retail 167,063 13,107,763 1.92eBay Incorporated Internet 77,640 2,606,375 0.38Ecolab Incorporated Chemicals 82,550 10,346,817 1.51Edwards Lifesciences Corporation Healthcare – Products 46,770 4,399,654 0.64Envestnet Incorporated Software 295,417 9,541,969 1.40Equinix Incorporated REIT 2,200 880,814 0.13Estee Lauder Companies Incorporated Cosmetics/Personal Care 53,690 4,552,375 0.67Euronet Worldwide Incorporated Commercial Services 121,240 10,368,445 1.52Extraction Oil & Gas Incorporated Oil & Gas Services 60,674 1,125,503 0.16Facebook Incorporated Internet 292,590 41,562,409 6.08Five Below Incorporated Retail 179,989 7,795,324 1.14Fortive Corporation Electronics 18,135 1,092,090 0.16Global Payments Incorporated Commercial Services 96,740 7,804,983 1.14Goldman Sachs Group Incorporated Banks 39,570 9,090,020 1.33Grand Canyon Education Incorporated Commercial Services 21,990 1,574,704 0.23Habit Restaurants Incorporated Retail 198,825 3,519,202 0.51Halliburton Company Oil & Gas Services 76,170 3,748,326 0.55Home Depot Incorporated Retail 65,050 9,551,291 1.40Incyte Corporation Biotechnology 29,870 3,992,723 0.58ITT Incorporated Miscellaneous Manufacturers 112,450 4,612,699 0.67JELD-WEN Holding Incorporated Building Materials 30,792 1,011,517 0.15KAR Auction Services Incorporated Commercial Services 275,350 12,024,534 1.76
The accompanying notes are an integral part of these financial statements.
China Equity Fund, Emerging Markets Equity Income Fund, Global Focused Equity Fund, Global Opportunity Bond Fund, U.S. Dollar Short-Term Money Market
Fund, U.S. Select Equity Fund, U.S. Short-Term High Yield Bond Fund, U.S. Small Cap Value Fund and USD Investment Grade Credit Fund have not been
authorised by the Hong Kong Securities and Futures Commission and are not available for investment by Hong Kong retail investors.

24 Wells Fargo (Lux) Worldwide Fund Portfolio of investments as at 31 March 2017 (continued)
U.S. ALL CAP GROWTH FUND
Industry Shares
MarketValue
USD
% ofNet
Assets
Transferable securities and money market instruments admitted to an official stock exchange listing or dealt in on another regulatedmarket (continued)
Common Shares (continued)
United States continued
LogMeIn Incorporated Telecommunications 36,690 3,577,275 0.52
MarketAxess Holdings Incorporated Commercial Services 85,588 16,046,894 2.35
MasterCard Incorporated Commercial Services 137,050 15,414,013 2.25
Microchip Technology Incorporated Semiconductors 298,519 22,024,732 3.22
Microsoft Corporation Software 225,590 14,857,357 2.17
Monolithic Power Systems Incorporated Semiconductors 80,282 7,393,972 1.08
Morgan Stanley Banks 159,630 6,838,549 1.00
Nevro Corporation Healthcare – Products 26,714 2,503,102 0.37
Norfolk Southern Corporation Transportation 66,040 7,394,499 1.08
NuVasive Incorporated Healthcare – Products 93,670 6,995,276 1.02
NVIDIA Corporation Semiconductors 11,100 1,209,123 0.18
Panera Bread Company Retail 3,300 864,171 0.13
Parsley Energy Incorporated Oil & Gas Services 34,600 1,124,846 0.16
Paycom Software Incorporated Software 70,907 4,077,862 0.60
Paylocity Holding Corporation Commercial Services 166,217 6,420,963 0.94
PayPal Holdings Incorporated Commercial Services 98,790 4,249,946 0.62
Pioneer Natural Resources Company Oil & Gas Services 11,400 2,123,022 0.31
PolyOne Corporation Chemicals 90,110 3,071,850 0.45
Praxair Incorporated Chemicals 105,290 12,487,394 1.83
Proofpoint Incorporated Internet 126,413 9,400,071 1.37
Raymond James Financial Incorporated Diversified Financial Services 47,910 3,653,617 0.53
Regeneron Pharmaceuticals Incorporated Biotechnology 10,520 4,076,605 0.60
REV Group Incorporated Auto Manufacturers 46,188 1,273,403 0.19
Salesforce.com Incorporated Software 73,210 6,039,093 0.88
Schlumberger Limited Oil & Gas Services 24,190 1,889,239 0.28
ServiceNow Incorporated Software 23,180 2,027,555 0.30
Snap-on Incorporated Hand/Machine Tools 20,050 3,381,833 0.49
Spark Therapeutics Incorporated Biotechnology 33,800 1,802,892 0.26
Splunk Incorporated Software 165,659 10,318,899 1.51
Square Incorporated Commercial Services 114,700 1,982,016 0.29
Starbucks Corporation Restaurant 96,612 5,641,175 0.83
TD Ameritrade Holding Corporation Diversified Financial Services 75,010 2,914,889 0.43
TESARO Incorporated Pharmaceuticals 3,060 470,842 0.07
Texas Instruments Incorporated Semiconductors 62,850 5,063,196 0.74
Tractor Supply Company Retail 29,961 2,066,410 0.30
ULTA Salon Cosmetics & Fragrance Incorporated Retail 10,610 3,026,290 0.44
Ultimate Software Group Incorporated Software 40,999 8,003,415 1.17
Ultragenyx Pharmaceutical Incorporated Biotechnology 36,929 2,503,048 0.37
Union Pacific Corporation Transportation 122,112 12,934,103 1.89
United Parcel Service Incorporated Transportation 31,800 3,412,140 0.50
Vantiv Incorporated Commercial Services 111,160 7,127,579 1.04
Veeva Systems Incorporated Software 246,509 12,640,982 1.85
Vertex Pharmaceuticals Incorporated Biotechnology 52,210 5,709,164 0.83
Visa Incorporated Diversified Financial Services 223,150 19,831,341 2.90
YELP Incorporated Internet 141,890 4,646,898 0.68
Zoetis Incorporated Pharmaceuticals 76,823 4,100,044 0.60
660,018,055 96.51
Total Common Shares 675,798,908 98.82
Total Investment in Securities 675,798,908 98.82
The accompanying notes are an integral part of these financial statements.
China Equity Fund, Emerging Markets Equity Income Fund, Global Focused Equity Fund, Global Opportunity Bond Fund, U.S. Dollar Short-Term Money Market
Fund, U.S. Select Equity Fund, U.S. Short-Term High Yield Bond Fund, U.S. Small Cap Value Fund and USD Investment Grade Credit Fund have not been
authorised by the Hong Kong Securities and Futures Commission and are not available for investment by Hong Kong retail investors.
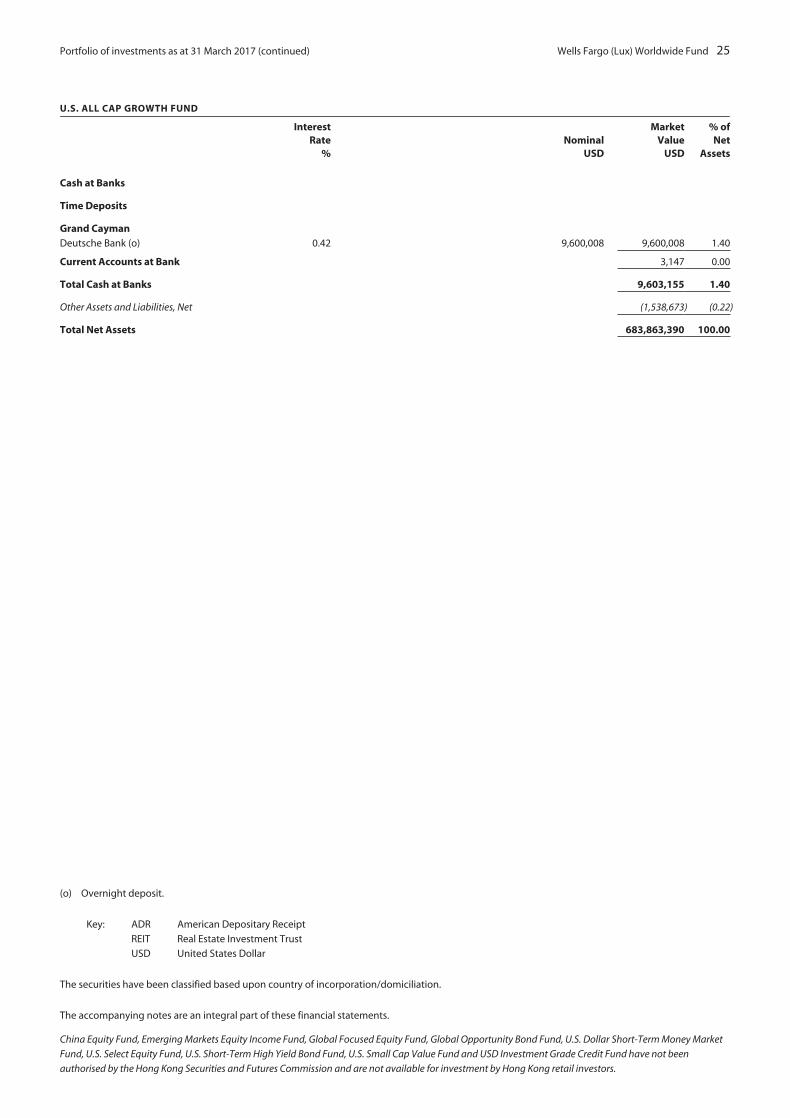
Portfolio of investments as at 31 March 2017 (continued) Wells Fargo (Lux) Worldwide Fund 25
U.S. ALL CAP GROWTH FUND
InterestRate
%Nominal
USD
MarketValue
USD
% ofNet
Assets
Cash at Banks
Time Deposits
Grand CaymanDeutsche Bank (o) 0.42 9,600,008 9,600,008 1.40
Current Accounts at Bank 3,147 0.00
Total Cash at Banks 9,603,155 1.40
Other Assets and Liabilities, Net (1,538,673) (0.22)
Total Net Assets 683,863,390 100.00
(o) Overnight deposit.
Key: ADR American Depositary Receipt
REIT Real Estate Investment Trust
USD United States Dollar
The securities have been classified based upon country of incorporation/domiciliation.
The accompanying notes are an integral part of these financial statements.
China Equity Fund, Emerging Markets Equity Income Fund, Global Focused Equity Fund, Global Opportunity Bond Fund, U.S. Dollar Short-Term Money Market
Fund, U.S. Select Equity Fund, U.S. Short-Term High Yield Bond Fund, U.S. Small Cap Value Fund and USD Investment Grade Credit Fund have not been
authorised by the Hong Kong Securities and Futures Commission and are not available for investment by Hong Kong retail investors.

26 Wells Fargo (Lux) Worldwide Fund Portfolio of investments as at 31 March 2017
U.S. DOLLAR SHORT-TERM MONEY MARKET FUND
InterestRate
%Maturity
DateNominal
USD
MarketValue
USD
% ofNet
Assets
Transferable securities and money market instruments admitted to an official stock exchange listing or dealt in on another regulated market
Certificates of DepositBanco Estado 1.10 18/4/2017 10,000,000 10,000,000 0.89
Banco Estado 1.00 20/4/2017 20,000,000 20,000,000 1.79
Chibe Bank Limited 1.23 5/5/2017 25,000,000 25,000,000 2.24
Citibank 1.06 4/4/2017 15,000,000 15,000,000 1.34
Credit Suisse ± 1.58 12/5/2017 5,000,000 5,000,000 0.45
Credit Suisse ± 1.56 10/7/2017 5,000,000 5,000,000 0.44
Erste Abwicklungs Anstalt ± 1.20 27/10/2017 10,000,000 10,000,000 0.90
Norinchukin Bank 1.03 16/5/2017 30,000,000 30,000,349 2.68
Standard Chartered Bank 1.40 2/6/2017 28,330,000 28,342,602 2.54
Swedbank ± 1.32 22/5/2017 9,000,000 9,000,000 0.81
Toronto-Dominion Bank ± 1.32 5/3/2018 5,000,000 5,000,000 0.45
Total Certificates of Deposit 162,342,951 14.53
Commercial Paper
Asset-Backed Commercial PaperAlpine Securitization Limited (z) 1.11 31/5/2017 5,000,000 4,991,058 0.45
Anglesea Fund LLC ± 1.21 30/6/2017 8,000,000 8,000,000 0.72
Anglesea Fund LLC ± 1.21 4/10/2017 5,000,000 5,000,000 0.45
Bennington Stark Capital Company (z) 1.04 3/4/2017 10,000,000 10,000,000 0.89
Cedar Springs Capital Company (z) 1.18 9/5/2017 4,000,000 3,995,280 0.36
Concord Minutemen Capital Company (z) 1.10 20/4/2017 10,815,000 10,809,382 0.97
Gotham Funding Corporation (z) 1.00 18/4/2017 15,000,000 14,993,750 1.34
Institutional Secured Funding LLC (z) 1.04 3/4/2017 19,455,000 19,455,000 1.74
Legacy Capital LLC (z) 0.94 18/4/2017 7,000,000 6,997,258 0.63
Legacy Capital LLC (z) 1.12 10/5/2017 5,000,000 4,994,244 0.45
Lexington Parker Capital Company (z) 1.10 9/5/2017 10,000,000 9,989,000 0.89
LMA Americas LLC (z) 1.24 3/7/2017 3,000,000 2,990,673 0.27
LMA Americas LLC (z) 1.31 5/7/2017 5,000,000 4,983,208 0.45
LMA Americas LLC (z) 1.31 7/7/2017 5,000,000 4,982,847 0.45
Manhattan Asset Funding Company LLC (z) 1.05 24/4/2017 11,028,000 11,021,245 0.99
Mountcliff Funding LLC ± 0.93 3/4/2017 30,000,000 30,000,000 2.68
RegencyMarkets No.1 LLC (z) 0.98 18/4/2017 20,000,000 19,991,833 1.79
Ridgefield Funding Company LLC (z) 1.12 3/4/2017 5,000,000 5,000,000 0.45
Versailles Commercial Paper LLC (z) 1.10 1/5/2017 11,000,000 10,990,589 0.98
Versailles Commercial Paper LLC ± 1.03 1/6/2017 10,000,000 10,000,000 0.89
Victory Receivables Corporation (z) 0.95 4/4/2017 900,000 899,976 0.08
200,085,343 17.92
Financial Company Commercial PaperBanco de Credito e Inversiones (z) 1.00 3/4/2017 10,000,000 10,000,000 0.89
Banco de Credito e Inversiones (z) 1.05 10/4/2017 10,000,000 9,997,958 0.89
Banco de Credito e Inversiones (z) 1.23 17/4/2017 10,000,000 9,995,217 0.89
Bank of Nova Scotia ± 1.27 4/8/2017 8,000,000 8,000,000 0.72
Charles Schwab Corporation (z) 0.98 6/4/2017 32,000,000 31,997,387 2.86
Commonwealth Bank of Australia ± 1.41 19/4/2017 8,000,000 8,001,270 0.72
Commonwealth Bank of Australia ± 1.23 4/8/2017 8,000,000 8,000,000 0.72
Commonwealth Bank of Australia ± 1.17 1/3/2018 5,000,000 5,000,000 0.45
DBS Bank Limited (z) 1.04 4/4/2017 28,000,000 27,999,191 2.50
HSBC USA Incorporated ± 1.23 7/6/2017 5,000,000 5,000,000 0.45
ING (US) Funding LLC ± 1.22 30/5/2017 10,000,000 10,000,000 0.89
JP Morgan Securities LLC (z) 1.03 3/4/2017 15,000,000 15,000,000 1.34
Macquarie Bank Limited (z) 0.95 11/4/2017 10,000,000 9,997,889 0.89
The accompanying notes are an integral part of these financial statements.
China Equity Fund, Emerging Markets Equity Income Fund, Global Focused Equity Fund, Global Opportunity Bond Fund, U.S. Dollar Short-Term Money Market
Fund, U.S. Select Equity Fund, U.S. Short-Term High Yield Bond Fund, U.S. Small Cap Value Fund and USD Investment Grade Credit Fund have not been
authorised by the Hong Kong Securities and Futures Commission and are not available for investment by Hong Kong retail investors.
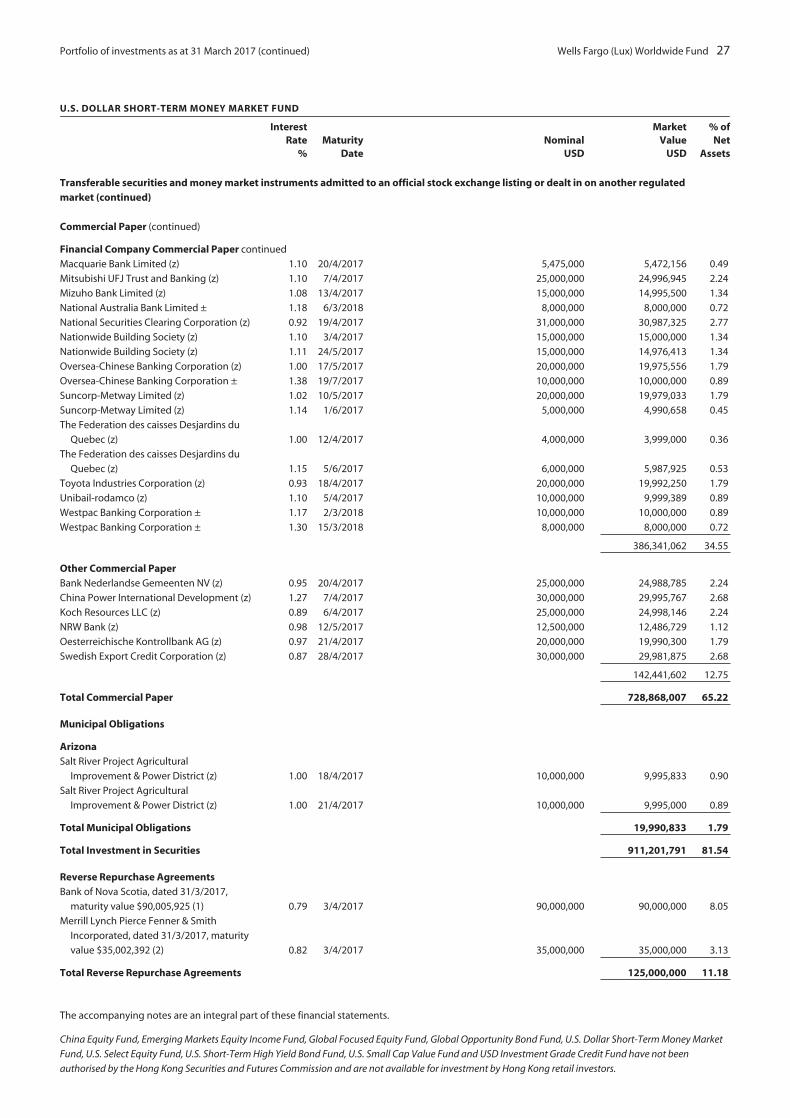
Portfolio of investments as at 31 March 2017 (continued) Wells Fargo (Lux) Worldwide Fund 27
U.S. DOLLAR SHORT-TERM MONEY MARKET FUND
InterestRate
%Maturity
DateNominal
USD
MarketValue
USD
% ofNet
Assets
Transferable securities and money market instruments admitted to an official stock exchange listing or dealt in on another regulatedmarket (continued)
Commercial Paper (continued)
Financial Company Commercial Paper continued
Macquarie Bank Limited (z) 1.10 20/4/2017 5,475,000 5,472,156 0.49
Mitsubishi UFJ Trust and Banking (z) 1.10 7/4/2017 25,000,000 24,996,945 2.24
Mizuho Bank Limited (z) 1.08 13/4/2017 15,000,000 14,995,500 1.34
National Australia Bank Limited ± 1.18 6/3/2018 8,000,000 8,000,000 0.72
National Securities Clearing Corporation (z) 0.92 19/4/2017 31,000,000 30,987,325 2.77
Nationwide Building Society (z) 1.10 3/4/2017 15,000,000 15,000,000 1.34
Nationwide Building Society (z) 1.11 24/5/2017 15,000,000 14,976,413 1.34
Oversea-Chinese Banking Corporation (z) 1.00 17/5/2017 20,000,000 19,975,556 1.79
Oversea-Chinese Banking Corporation ± 1.38 19/7/2017 10,000,000 10,000,000 0.89
Suncorp-Metway Limited (z) 1.02 10/5/2017 20,000,000 19,979,033 1.79
Suncorp-Metway Limited (z) 1.14 1/6/2017 5,000,000 4,990,658 0.45
The Federation des caisses Desjardins du
Quebec (z) 1.00 12/4/2017 4,000,000 3,999,000 0.36
The Federation des caisses Desjardins du
Quebec (z) 1.15 5/6/2017 6,000,000 5,987,925 0.53
Toyota Industries Corporation (z) 0.93 18/4/2017 20,000,000 19,992,250 1.79
Unibail-rodamco (z) 1.10 5/4/2017 10,000,000 9,999,389 0.89
Westpac Banking Corporation ± 1.17 2/3/2018 10,000,000 10,000,000 0.89
Westpac Banking Corporation ± 1.30 15/3/2018 8,000,000 8,000,000 0.72
386,341,062 34.55
Other Commercial PaperBank Nederlandse Gemeenten NV (z) 0.95 20/4/2017 25,000,000 24,988,785 2.24
China Power International Development (z) 1.27 7/4/2017 30,000,000 29,995,767 2.68
Koch Resources LLC (z) 0.89 6/4/2017 25,000,000 24,998,146 2.24
NRW Bank (z) 0.98 12/5/2017 12,500,000 12,486,729 1.12
Oesterreichische Kontrollbank AG (z) 0.97 21/4/2017 20,000,000 19,990,300 1.79
Swedish Export Credit Corporation (z) 0.87 28/4/2017 30,000,000 29,981,875 2.68
142,441,602 12.75
Total Commercial Paper 728,868,007 65.22
Municipal Obligations
ArizonaSalt River Project Agricultural
Improvement & Power District (z) 1.00 18/4/2017 10,000,000 9,995,833 0.90
Salt River Project Agricultural
Improvement & Power District (z) 1.00 21/4/2017 10,000,000 9,995,000 0.89
Total Municipal Obligations 19,990,833 1.79
Total Investment in Securities 911,201,791 81.54
Reverse Repurchase AgreementsBank of Nova Scotia, dated 31/3/2017,
maturity value $90,005,925 (1) 0.79 3/4/2017 90,000,000 90,000,000 8.05
Merrill Lynch Pierce Fenner & Smith
Incorporated, dated 31/3/2017, maturity
value $35,002,392 (2) 0.82 3/4/2017 35,000,000 35,000,000 3.13
Total Reverse Repurchase Agreements 125,000,000 11.18
The accompanying notes are an integral part of these financial statements.
China Equity Fund, Emerging Markets Equity Income Fund, Global Focused Equity Fund, Global Opportunity Bond Fund, U.S. Dollar Short-Term Money Market
Fund, U.S. Select Equity Fund, U.S. Short-Term High Yield Bond Fund, U.S. Small Cap Value Fund and USD Investment Grade Credit Fund have not been
authorised by the Hong Kong Securities and Futures Commission and are not available for investment by Hong Kong retail investors.
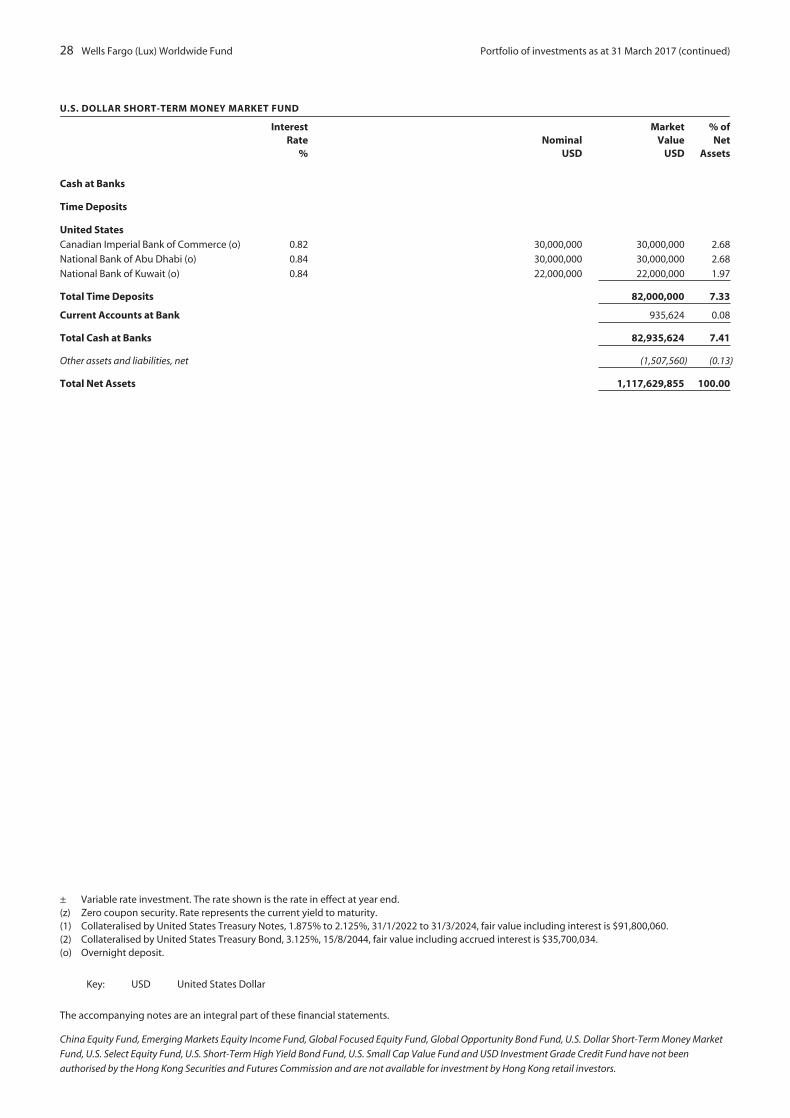
28 Wells Fargo (Lux) Worldwide Fund Portfolio of investments as at 31 March 2017 (continued)
U.S. DOLLAR SHORT-TERM MONEY MARKET FUND
InterestRate
%Nominal
USD
MarketValue
USD
% ofNet
Assets
Cash at Banks
Time Deposits
United StatesCanadian Imperial Bank of Commerce (o) 0.82 30,000,000 30,000,000 2.68
National Bank of Abu Dhabi (o) 0.84 30,000,000 30,000,000 2.68
National Bank of Kuwait (o) 0.84 22,000,000 22,000,000 1.97
Total Time Deposits 82,000,000 7.33
Current Accounts at Bank 935,624 0.08
Total Cash at Banks 82,935,624 7.41
Other assets and liabilities, net (1,507,560) (0.13)
Total Net Assets 1,117,629,855 100.00
± Variable rate investment. The rate shown is the rate in effect at year end.(z) Zero coupon security. Rate represents the current yield to maturity.(1) Collateralised by United States Treasury Notes, 1.875% to 2.125%, 31/1/2022 to 31/3/2024, fair value including interest is $91,800,060.(2) Collateralised by United States Treasury Bond, 3.125%, 15/8/2044, fair value including accrued interest is $35,700,034.(o) Overnight deposit.
Key: USD United States Dollar
The accompanying notes are an integral part of these financial statements.
China Equity Fund, Emerging Markets Equity Income Fund, Global Focused Equity Fund, Global Opportunity Bond Fund, U.S. Dollar Short-Term Money Market
Fund, U.S. Select Equity Fund, U.S. Short-Term High Yield Bond Fund, U.S. Small Cap Value Fund and USD Investment Grade Credit Fund have not been
authorised by the Hong Kong Securities and Futures Commission and are not available for investment by Hong Kong retail investors.

Portfolio of investments as at 31 March 2017 Wells Fargo (Lux) Worldwide Fund 29
U.S. HIGH YIELD BOND FUND
InterestRate
%Maturity
Date IndustryNominal
USD
MarketValue
USD
% ofNet
Assets
Transferable securities and money market instruments admitted to an official stock exchange listing or dealt in on another regulated market
Common Shares
United StatesSwift Energy Company Oil & Gas Services 2,924 80,410 0.04
Total Common Shares 80,410 0.04
Corporate Bonds and Notes
BermudaIHS Markit Limited 5.00 1/11/2022 Commercial Services 925,000 968,938 0.43
IHS Markit Limited 4.75 15/2/2025 Commercial Services 1,125,000 1,158,750 0.52
2,127,688 0.95
CanadaBaytex Energy Corporation 5.13 1/6/2021 Oil & Gas Services 850,000 767,125 0.34
Baytex Energy Corporation 5.63 1/6/2024 Oil & Gas Services 500,000 440,000 0.20
GFL Environmental Incorporated 7.88 1/4/2020 Environmental Control 775,000 804,062 0.36
GFL Environmental Incorporated 9.88 1/2/2021 Environmental Control 625,000 676,562 0.30
Ritchie Bros Auctioneers Incorporated 5.38 15/1/2025 Commercial Services 2,225,000 2,275,062 1.01
Trinidad Drilling Limited 6.63 15/2/2025 Oil & Gas Services 25,000 24,969 0.01
Valeant Pharmaceuticals International
Incorporated 7.50 15/7/2021 Pharmaceuticals 35,000 30,669 0.01
Valeant Pharmaceuticals International
Incorporated 5.63 1/12/2021 Pharmaceuticals 275,000 221,375 0.10
Valeant Pharmaceuticals International
Incorporated 6.50 15/3/2022 Pharmaceuticals 125,000 128,594 0.06
Valeant Pharmaceuticals International
Incorporated 5.88 15/5/2023 Pharmaceuticals 535,000 415,294 0.18
Valeant Pharmaceuticals International
Incorporated 7.00 15/3/2024 Pharmaceuticals 250,000 256,563 0.11
Valeant Pharmaceuticals International
Incorporated 6.13 15/4/2025 Pharmaceuticals 2,880,000 2,217,600 0.99
Vermilion Energy Incorporated 5.63 15/3/2025 Oil & Gas Services 300,000 297,000 0.13
8,554,875 3.80
IrelandAllegion plc 5.88 15/9/2023 Electronics 40,000 42,700 0.02
Ardagh Packaging Finance plc 4.29 15/5/2021 Packaging & Containers 350,000 358,313 0.16
Ardagh Packaging Finance plc 4.25 15/9/2022 Packaging & Containers 200,000 201,940 0.09
Ardagh Packaging Finance plc 4.63 15/5/2023 Packaging & Containers 475,000 478,562 0.21
Ardagh Packaging Finance plc 7.25 15/5/2024 Packaging & Containers 300,000 321,000 0.14
Ardagh Packaging Finance plc 6.00 15/2/2025 Packaging & Containers 700,000 707,875 0.32
2,110,390 0.94
LuxembourgArcelorMittal 6.13 1/6/2025 Iron/Steel 275,000 305,250 0.13
Intelsat (Luxembourg) SA 7.75 1/6/2021 Telecommunications 2,800,000 1,680,000 0.75
Intelsat (Luxembourg) SA 8.13 1/6/2023 Telecommunications 25,000 15,109 0.01
Intelsat Jackson Holdings SA 7.25 1/4/2019 Telecommunications 725,000 691,469 0.31
Intelsat Jackson Holdings SA 5.50 1/8/2023 Telecommunications 2,200,000 1,806,750 0.80
Mallinckrodt International Finance SA 5.63 15/10/2023 Healthcare – Products 50,000 47,500 0.02
Mallinckrodt International Finance SA 5.50 15/4/2025 Healthcare – Products 300,000 276,000 0.12
Nielsen Company Luxembourg SARL 5.50 1/10/2021 Holding Companies – Diversified 865,000 898,519 0.40
Nielsen Company Luxembourg SARL 5.00 1/2/2025 Holding Companies – Diversified 450,000 448,312 0.20
6,168,909 2.74
The accompanying notes are an integral part of these financial statements.
China Equity Fund, Emerging Markets Equity Income Fund, Global Focused Equity Fund, Global Opportunity Bond Fund, U.S. Dollar Short-Term Money Market
Fund, U.S. Select Equity Fund, U.S. Short-Term High Yield Bond Fund, U.S. Small Cap Value Fund and USD Investment Grade Credit Fund have not been
authorised by the Hong Kong Securities and Futures Commission and are not available for investment by Hong Kong retail investors.
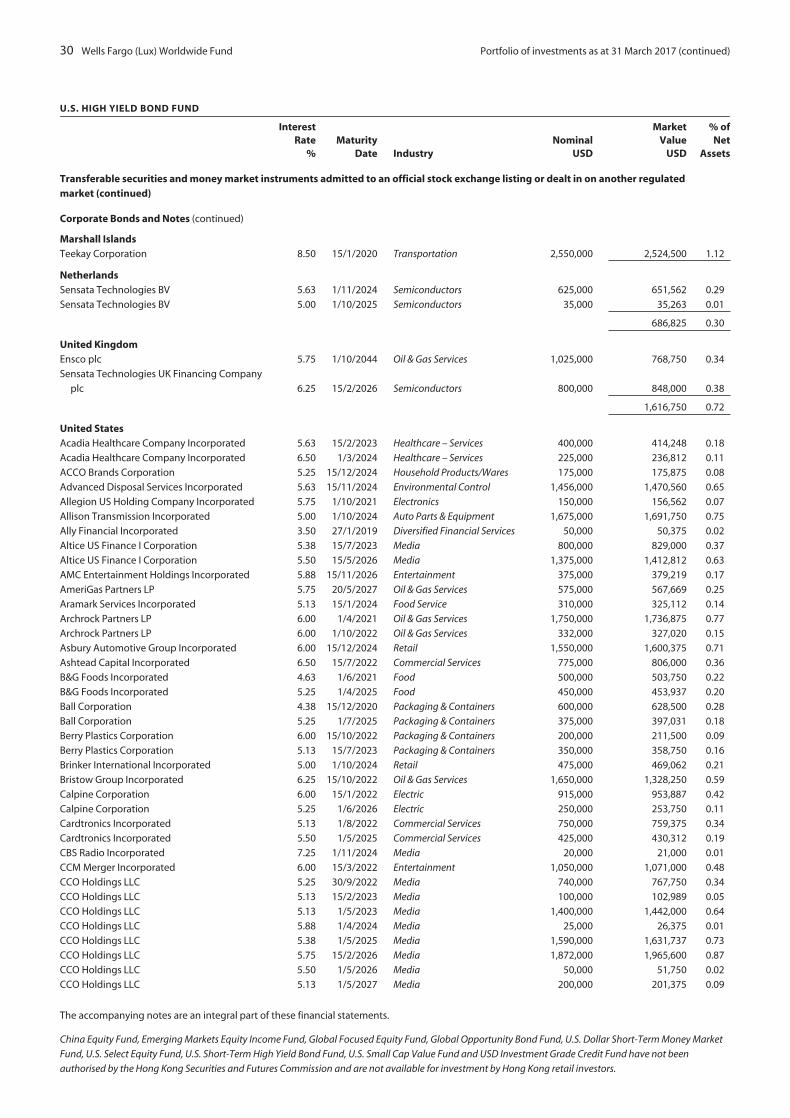
30 Wells Fargo (Lux) Worldwide Fund Portfolio of investments as at 31 March 2017 (continued)
U.S. HIGH YIELD BOND FUND
InterestRate
%Maturity
Date IndustryNominal
USD
MarketValue
USD
% ofNet
Assets
Transferable securities and money market instruments admitted to an official stock exchange listing or dealt in on another regulatedmarket (continued)
Corporate Bonds and Notes (continued)
Marshall IslandsTeekay Corporation 8.50 15/1/2020 Transportation 2,550,000 2,524,500 1.12
NetherlandsSensata Technologies BV 5.63 1/11/2024 Semiconductors 625,000 651,562 0.29
Sensata Technologies BV 5.00 1/10/2025 Semiconductors 35,000 35,263 0.01
686,825 0.30
United KingdomEnsco plc 5.75 1/10/2044 Oil & Gas Services 1,025,000 768,750 0.34
Sensata Technologies UK Financing Company
plc 6.25 15/2/2026 Semiconductors 800,000 848,000 0.38
1,616,750 0.72
United StatesAcadia Healthcare Company Incorporated 5.63 15/2/2023 Healthcare – Services 400,000 414,248 0.18
Acadia Healthcare Company Incorporated 6.50 1/3/2024 Healthcare – Services 225,000 236,812 0.11
ACCO Brands Corporation 5.25 15/12/2024 Household Products/Wares 175,000 175,875 0.08
Advanced Disposal Services Incorporated 5.63 15/11/2024 Environmental Control 1,456,000 1,470,560 0.65
Allegion US Holding Company Incorporated 5.75 1/10/2021 Electronics 150,000 156,562 0.07
Allison Transmission Incorporated 5.00 1/10/2024 Auto Parts & Equipment 1,675,000 1,691,750 0.75
Ally Financial Incorporated 3.50 27/1/2019 Diversified Financial Services 50,000 50,375 0.02
Altice US Finance I Corporation 5.38 15/7/2023 Media 800,000 829,000 0.37
Altice US Finance I Corporation 5.50 15/5/2026 Media 1,375,000 1,412,812 0.63
AMC Entertainment Holdings Incorporated 5.88 15/11/2026 Entertainment 375,000 379,219 0.17
AmeriGas Partners LP 5.75 20/5/2027 Oil & Gas Services 575,000 567,669 0.25
Aramark Services Incorporated 5.13 15/1/2024 Food Service 310,000 325,112 0.14
Archrock Partners LP 6.00 1/4/2021 Oil & Gas Services 1,750,000 1,736,875 0.77
Archrock Partners LP 6.00 1/10/2022 Oil & Gas Services 332,000 327,020 0.15
Asbury Automotive Group Incorporated 6.00 15/12/2024 Retail 1,550,000 1,600,375 0.71
Ashtead Capital Incorporated 6.50 15/7/2022 Commercial Services 775,000 806,000 0.36
B&G Foods Incorporated 4.63 1/6/2021 Food 500,000 503,750 0.22
B&G Foods Incorporated 5.25 1/4/2025 Food 450,000 453,937 0.20
Ball Corporation 4.38 15/12/2020 Packaging & Containers 600,000 628,500 0.28
Ball Corporation 5.25 1/7/2025 Packaging & Containers 375,000 397,031 0.18
Berry Plastics Corporation 6.00 15/10/2022 Packaging & Containers 200,000 211,500 0.09
Berry Plastics Corporation 5.13 15/7/2023 Packaging & Containers 350,000 358,750 0.16
Brinker International Incorporated 5.00 1/10/2024 Retail 475,000 469,062 0.21
Bristow Group Incorporated 6.25 15/10/2022 Oil & Gas Services 1,650,000 1,328,250 0.59
Calpine Corporation 6.00 15/1/2022 Electric 915,000 953,887 0.42
Calpine Corporation 5.25 1/6/2026 Electric 250,000 253,750 0.11
Cardtronics Incorporated 5.13 1/8/2022 Commercial Services 750,000 759,375 0.34
Cardtronics Incorporated 5.50 1/5/2025 Commercial Services 425,000 430,312 0.19
CBS Radio Incorporated 7.25 1/11/2024 Media 20,000 21,000 0.01
CCM Merger Incorporated 6.00 15/3/2022 Entertainment 1,050,000 1,071,000 0.48
CCO Holdings LLC 5.25 30/9/2022 Media 740,000 767,750 0.34
CCO Holdings LLC 5.13 15/2/2023 Media 100,000 102,989 0.05
CCO Holdings LLC 5.13 1/5/2023 Media 1,400,000 1,442,000 0.64
CCO Holdings LLC 5.88 1/4/2024 Media 25,000 26,375 0.01
CCO Holdings LLC 5.38 1/5/2025 Media 1,590,000 1,631,737 0.73
CCO Holdings LLC 5.75 15/2/2026 Media 1,872,000 1,965,600 0.87
CCO Holdings LLC 5.50 1/5/2026 Media 50,000 51,750 0.02
CCO Holdings LLC 5.13 1/5/2027 Media 200,000 201,375 0.09
The accompanying notes are an integral part of these financial statements.
China Equity Fund, Emerging Markets Equity Income Fund, Global Focused Equity Fund, Global Opportunity Bond Fund, U.S. Dollar Short-Term Money Market
Fund, U.S. Select Equity Fund, U.S. Short-Term High Yield Bond Fund, U.S. Small Cap Value Fund and USD Investment Grade Credit Fund have not been
authorised by the Hong Kong Securities and Futures Commission and are not available for investment by Hong Kong retail investors.
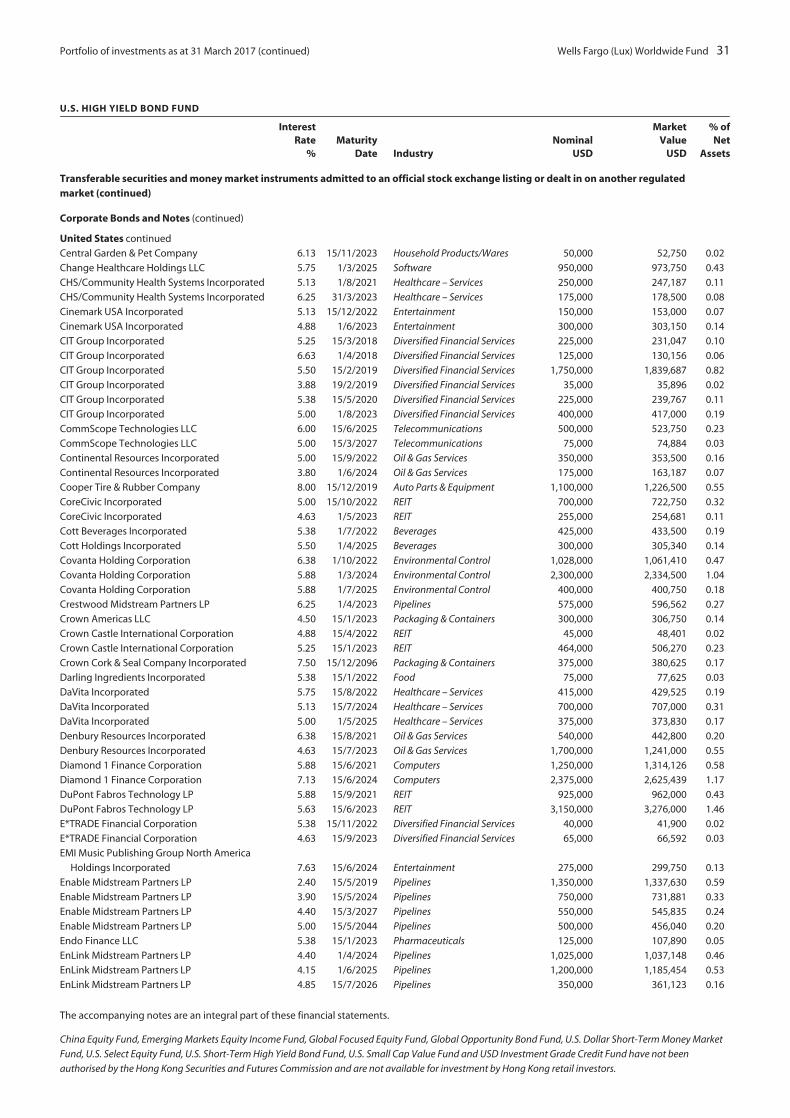
Portfolio of investments as at 31 March 2017 (continued) Wells Fargo (Lux) Worldwide Fund 31
U.S. HIGH YIELD BOND FUND
InterestRate
%Maturity
Date IndustryNominal
USD
MarketValue
USD
% ofNet
Assets
Transferable securities and money market instruments admitted to an official stock exchange listing or dealt in on another regulatedmarket (continued)
Corporate Bonds and Notes (continued)
United States continued
Central Garden & Pet Company 6.13 15/11/2023 Household Products/Wares 50,000 52,750 0.02
Change Healthcare Holdings LLC 5.75 1/3/2025 Software 950,000 973,750 0.43
CHS/Community Health Systems Incorporated 5.13 1/8/2021 Healthcare – Services 250,000 247,187 0.11
CHS/Community Health Systems Incorporated 6.25 31/3/2023 Healthcare – Services 175,000 178,500 0.08
Cinemark USA Incorporated 5.13 15/12/2022 Entertainment 150,000 153,000 0.07
Cinemark USA Incorporated 4.88 1/6/2023 Entertainment 300,000 303,150 0.14
CIT Group Incorporated 5.25 15/3/2018 Diversified Financial Services 225,000 231,047 0.10
CIT Group Incorporated 6.63 1/4/2018 Diversified Financial Services 125,000 130,156 0.06
CIT Group Incorporated 5.50 15/2/2019 Diversified Financial Services 1,750,000 1,839,687 0.82
CIT Group Incorporated 3.88 19/2/2019 Diversified Financial Services 35,000 35,896 0.02
CIT Group Incorporated 5.38 15/5/2020 Diversified Financial Services 225,000 239,767 0.11
CIT Group Incorporated 5.00 1/8/2023 Diversified Financial Services 400,000 417,000 0.19
CommScope Technologies LLC 6.00 15/6/2025 Telecommunications 500,000 523,750 0.23
CommScope Technologies LLC 5.00 15/3/2027 Telecommunications 75,000 74,884 0.03
Continental Resources Incorporated 5.00 15/9/2022 Oil & Gas Services 350,000 353,500 0.16
Continental Resources Incorporated 3.80 1/6/2024 Oil & Gas Services 175,000 163,187 0.07
Cooper Tire & Rubber Company 8.00 15/12/2019 Auto Parts & Equipment 1,100,000 1,226,500 0.55
CoreCivic Incorporated 5.00 15/10/2022 REIT 700,000 722,750 0.32
CoreCivic Incorporated 4.63 1/5/2023 REIT 255,000 254,681 0.11
Cott Beverages Incorporated 5.38 1/7/2022 Beverages 425,000 433,500 0.19
Cott Holdings Incorporated 5.50 1/4/2025 Beverages 300,000 305,340 0.14
Covanta Holding Corporation 6.38 1/10/2022 Environmental Control 1,028,000 1,061,410 0.47
Covanta Holding Corporation 5.88 1/3/2024 Environmental Control 2,300,000 2,334,500 1.04
Covanta Holding Corporation 5.88 1/7/2025 Environmental Control 400,000 400,750 0.18
Crestwood Midstream Partners LP 6.25 1/4/2023 Pipelines 575,000 596,562 0.27
Crown Americas LLC 4.50 15/1/2023 Packaging & Containers 300,000 306,750 0.14
Crown Castle International Corporation 4.88 15/4/2022 REIT 45,000 48,401 0.02
Crown Castle International Corporation 5.25 15/1/2023 REIT 464,000 506,270 0.23
Crown Cork & Seal Company Incorporated 7.50 15/12/2096 Packaging & Containers 375,000 380,625 0.17
Darling Ingredients Incorporated 5.38 15/1/2022 Food 75,000 77,625 0.03
DaVita Incorporated 5.75 15/8/2022 Healthcare – Services 415,000 429,525 0.19
DaVita Incorporated 5.13 15/7/2024 Healthcare – Services 700,000 707,000 0.31
DaVita Incorporated 5.00 1/5/2025 Healthcare – Services 375,000 373,830 0.17
Denbury Resources Incorporated 6.38 15/8/2021 Oil & Gas Services 540,000 442,800 0.20
Denbury Resources Incorporated 4.63 15/7/2023 Oil & Gas Services 1,700,000 1,241,000 0.55
Diamond 1 Finance Corporation 5.88 15/6/2021 Computers 1,250,000 1,314,126 0.58
Diamond 1 Finance Corporation 7.13 15/6/2024 Computers 2,375,000 2,625,439 1.17
DuPont Fabros Technology LP 5.88 15/9/2021 REIT 925,000 962,000 0.43
DuPont Fabros Technology LP 5.63 15/6/2023 REIT 3,150,000 3,276,000 1.46
E*TRADE Financial Corporation 5.38 15/11/2022 Diversified Financial Services 40,000 41,900 0.02
E*TRADE Financial Corporation 4.63 15/9/2023 Diversified Financial Services 65,000 66,592 0.03
EMI Music Publishing Group North America
Holdings Incorporated 7.63 15/6/2024 Entertainment 275,000 299,750 0.13
Enable Midstream Partners LP 2.40 15/5/2019 Pipelines 1,350,000 1,337,630 0.59
Enable Midstream Partners LP 3.90 15/5/2024 Pipelines 750,000 731,881 0.33
Enable Midstream Partners LP 4.40 15/3/2027 Pipelines 550,000 545,835 0.24
Enable Midstream Partners LP 5.00 15/5/2044 Pipelines 500,000 456,040 0.20
Endo Finance LLC 5.38 15/1/2023 Pharmaceuticals 125,000 107,890 0.05
EnLink Midstream Partners LP 4.40 1/4/2024 Pipelines 1,025,000 1,037,148 0.46
EnLink Midstream Partners LP 4.15 1/6/2025 Pipelines 1,200,000 1,185,454 0.53
EnLink Midstream Partners LP 4.85 15/7/2026 Pipelines 350,000 361,123 0.16
The accompanying notes are an integral part of these financial statements.
China Equity Fund, Emerging Markets Equity Income Fund, Global Focused Equity Fund, Global Opportunity Bond Fund, U.S. Dollar Short-Term Money Market
Fund, U.S. Select Equity Fund, U.S. Short-Term High Yield Bond Fund, U.S. Small Cap Value Fund and USD Investment Grade Credit Fund have not been
authorised by the Hong Kong Securities and Futures Commission and are not available for investment by Hong Kong retail investors.
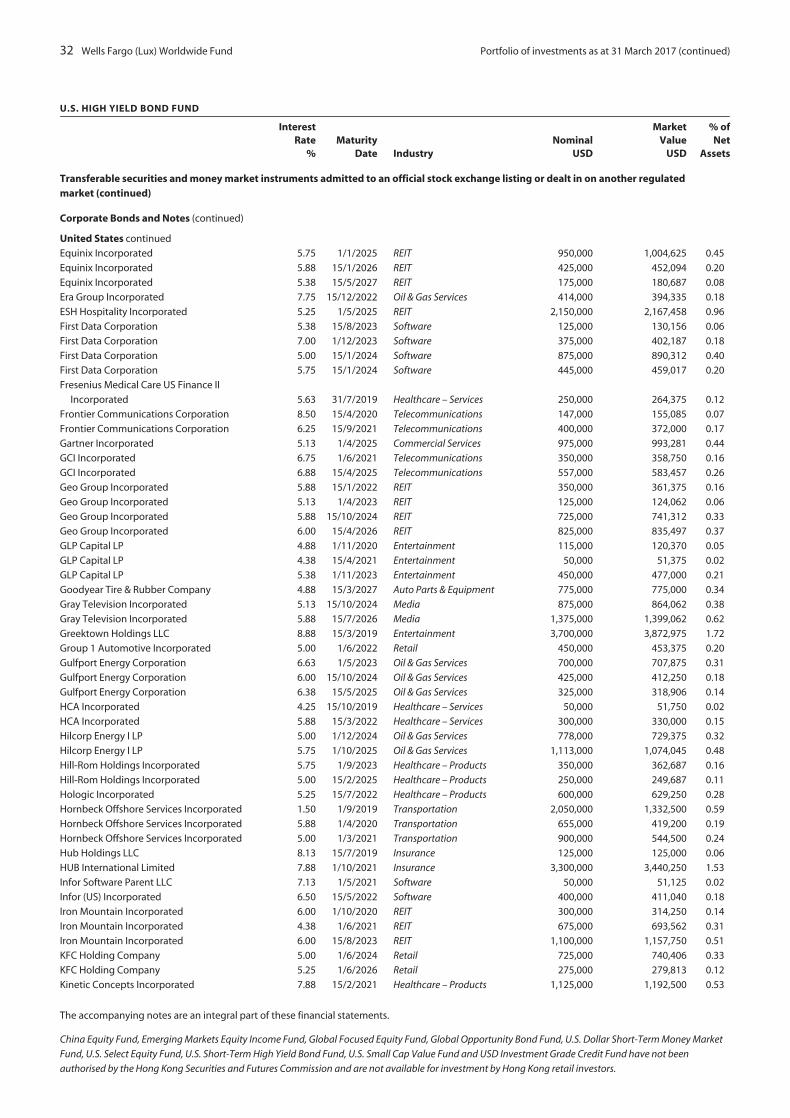
32 Wells Fargo (Lux) Worldwide Fund Portfolio of investments as at 31 March 2017 (continued)
U.S. HIGH YIELD BOND FUND
InterestRate
%Maturity
Date IndustryNominal
USD
MarketValue
USD
% ofNet
Assets
Transferable securities and money market instruments admitted to an official stock exchange listing or dealt in on another regulatedmarket (continued)
Corporate Bonds and Notes (continued)
United States continued
Equinix Incorporated 5.75 1/1/2025 REIT 950,000 1,004,625 0.45
Equinix Incorporated 5.88 15/1/2026 REIT 425,000 452,094 0.20
Equinix Incorporated 5.38 15/5/2027 REIT 175,000 180,687 0.08
Era Group Incorporated 7.75 15/12/2022 Oil & Gas Services 414,000 394,335 0.18
ESH Hospitality Incorporated 5.25 1/5/2025 REIT 2,150,000 2,167,458 0.96
First Data Corporation 5.38 15/8/2023 Software 125,000 130,156 0.06
First Data Corporation 7.00 1/12/2023 Software 375,000 402,187 0.18
First Data Corporation 5.00 15/1/2024 Software 875,000 890,312 0.40
First Data Corporation 5.75 15/1/2024 Software 445,000 459,017 0.20
Fresenius Medical Care US Finance II
Incorporated 5.63 31/7/2019 Healthcare – Services 250,000 264,375 0.12
Frontier Communications Corporation 8.50 15/4/2020 Telecommunications 147,000 155,085 0.07
Frontier Communications Corporation 6.25 15/9/2021 Telecommunications 400,000 372,000 0.17
Gartner Incorporated 5.13 1/4/2025 Commercial Services 975,000 993,281 0.44
GCI Incorporated 6.75 1/6/2021 Telecommunications 350,000 358,750 0.16
GCI Incorporated 6.88 15/4/2025 Telecommunications 557,000 583,457 0.26
Geo Group Incorporated 5.88 15/1/2022 REIT 350,000 361,375 0.16
Geo Group Incorporated 5.13 1/4/2023 REIT 125,000 124,062 0.06
Geo Group Incorporated 5.88 15/10/2024 REIT 725,000 741,312 0.33
Geo Group Incorporated 6.00 15/4/2026 REIT 825,000 835,497 0.37
GLP Capital LP 4.88 1/11/2020 Entertainment 115,000 120,370 0.05
GLP Capital LP 4.38 15/4/2021 Entertainment 50,000 51,375 0.02
GLP Capital LP 5.38 1/11/2023 Entertainment 450,000 477,000 0.21
Goodyear Tire & Rubber Company 4.88 15/3/2027 Auto Parts & Equipment 775,000 775,000 0.34
Gray Television Incorporated 5.13 15/10/2024 Media 875,000 864,062 0.38
Gray Television Incorporated 5.88 15/7/2026 Media 1,375,000 1,399,062 0.62
Greektown Holdings LLC 8.88 15/3/2019 Entertainment 3,700,000 3,872,975 1.72
Group 1 Automotive Incorporated 5.00 1/6/2022 Retail 450,000 453,375 0.20
Gulfport Energy Corporation 6.63 1/5/2023 Oil & Gas Services 700,000 707,875 0.31
Gulfport Energy Corporation 6.00 15/10/2024 Oil & Gas Services 425,000 412,250 0.18
Gulfport Energy Corporation 6.38 15/5/2025 Oil & Gas Services 325,000 318,906 0.14
HCA Incorporated 4.25 15/10/2019 Healthcare – Services 50,000 51,750 0.02
HCA Incorporated 5.88 15/3/2022 Healthcare – Services 300,000 330,000 0.15
Hilcorp Energy I LP 5.00 1/12/2024 Oil & Gas Services 778,000 729,375 0.32
Hilcorp Energy I LP 5.75 1/10/2025 Oil & Gas Services 1,113,000 1,074,045 0.48
Hill-Rom Holdings Incorporated 5.75 1/9/2023 Healthcare – Products 350,000 362,687 0.16
Hill-Rom Holdings Incorporated 5.00 15/2/2025 Healthcare – Products 250,000 249,687 0.11
Hologic Incorporated 5.25 15/7/2022 Healthcare – Products 600,000 629,250 0.28
Hornbeck Offshore Services Incorporated 1.50 1/9/2019 Transportation 2,050,000 1,332,500 0.59
Hornbeck Offshore Services Incorporated 5.88 1/4/2020 Transportation 655,000 419,200 0.19
Hornbeck Offshore Services Incorporated 5.00 1/3/2021 Transportation 900,000 544,500 0.24
Hub Holdings LLC 8.13 15/7/2019 Insurance 125,000 125,000 0.06
HUB International Limited 7.88 1/10/2021 Insurance 3,300,000 3,440,250 1.53
Infor Software Parent LLC 7.13 1/5/2021 Software 50,000 51,125 0.02
Infor (US) Incorporated 6.50 15/5/2022 Software 400,000 411,040 0.18
Iron Mountain Incorporated 6.00 1/10/2020 REIT 300,000 314,250 0.14
Iron Mountain Incorporated 4.38 1/6/2021 REIT 675,000 693,562 0.31
Iron Mountain Incorporated 6.00 15/8/2023 REIT 1,100,000 1,157,750 0.51
KFC Holding Company 5.00 1/6/2024 Retail 725,000 740,406 0.33
KFC Holding Company 5.25 1/6/2026 Retail 275,000 279,813 0.12
Kinetic Concepts Incorporated 7.88 15/2/2021 Healthcare – Products 1,125,000 1,192,500 0.53
The accompanying notes are an integral part of these financial statements.
China Equity Fund, Emerging Markets Equity Income Fund, Global Focused Equity Fund, Global Opportunity Bond Fund, U.S. Dollar Short-Term Money Market
Fund, U.S. Select Equity Fund, U.S. Short-Term High Yield Bond Fund, U.S. Small Cap Value Fund and USD Investment Grade Credit Fund have not been
authorised by the Hong Kong Securities and Futures Commission and are not available for investment by Hong Kong retail investors.

Portfolio of investments as at 31 March 2017 (continued) Wells Fargo (Lux) Worldwide Fund 33
U.S. HIGH YIELD BOND FUND
InterestRate
%Maturity
Date IndustryNominal
USD
MarketValue
USD
% ofNet
Assets
Transferable securities and money market instruments admitted to an official stock exchange listing or dealt in on another regulatedmarket (continued)
Corporate Bonds and Notes (continued)
United States continued
Lamar Media Corporation 5.88 1/2/2022 Advertising 200,000 206,660 0.09
Lamar Media Corporation 5.00 1/5/2023 Advertising 50,000 51,500 0.02
Lamar Media Corporation 5.38 15/1/2024 Advertising 25,000 25,813 0.01
Lamb Weston Holdings Incorporated 4.63 1/11/2024 Food 25,000 25,500 0.01
Lamb Weston Holdings Incorporated 4.88 1/11/2026 Food 25,000 25,500 0.01
Level 3 Financing Incorporated 6.13 15/1/2021 Telecommunications 100,000 103,500 0.05
Level 3 Financing Incorporated 5.38 15/8/2022 Telecommunications 750,000 775,313 0.34
Level 3 Financing Incorporated 5.63 1/2/2023 Telecommunications 840,000 869,400 0.39
Level 3 Financing Incorporated 5.13 1/5/2023 Telecommunications 150,000 153,375 0.07
Level 3 Financing Incorporated 5.38 15/1/2024 Telecommunications 150,000 153,563 0.07
Level 3 Financing Incorporated 5.38 1/5/2025 Telecommunications 300,000 305,250 0.14
Level 3 Financing Incorporated 5.25 15/3/2026 Telecommunications 725,000 729,531 0.32
Levi Strauss & Company 5.00 1/5/2025 Apparel 950,000 973,940 0.43
LifePoint Health Incorporated 5.50 1/12/2021 Healthcare – Services 350,000 363,125 0.16
LIN Television Corporation 5.88 15/11/2022 Media 325,000 336,375 0.15
Live Nation Entertainment Incorporated 4.88 1/11/2024 Commercial Services 550,000 550,000 0.24
LKQ Corporation 4.75 15/5/2023 Distribution/Wholesale 1,300,000 1,293,500 0.58
LPL Holdings Incorporated 5.75 15/9/2025 Diversified Financial Services 4,325,000 4,386,631 1.95
Matador Resources Company 6.88 15/4/2023 Oil & Gas Services 175,000 182,875 0.08
MEDNAX Incorporated 5.25 1/12/2023 Healthcare – Services 1,075,000 1,096,500 0.49
Micron Technology Incorporated 5.88 15/2/2022 Semiconductors 530,000 553,850 0.25
Micron Technology Incorporated 5.25 15/1/2024 Semiconductors 200,000 205,438 0.09
Micron Technology Incorporated 5.50 1/2/2025 Semiconductors 225,000 233,438 0.10
Micron Technology Incorporated 5.63 15/1/2026 Semiconductors 675,000 710,438 0.32
MPH Acquisition Holdings LLC 7.13 1/6/2024 Healthcare – Services 1,225,000 1,317,028 0.59
MPT Operating Partnership LP 6.38 15/2/2022 REIT 600,000 620,250 0.28
MPT Operating Partnership LP 6.38 1/3/2024 REIT 30,000 32,250 0.01
MPT Operating Partnership LP 5.50 1/5/2024 REIT 1,060,000 1,078,550 0.48
MPT Operating Partnership LP 5.25 1/8/2026 REIT 25,000 24,625 0.01
MSCI Incorporated 4.75 1/8/2026 Software 400,000 404,000 0.18
Murphy Oil Corporation 4.70 1/12/2022 Oil & Gas Services 725,000 703,250 0.31
Murphy Oil Corporation 6.88 15/8/2024 Oil & Gas Services 360,000 381,600 0.17
Nabors Industries Incorporated 5.50 15/1/2023 Oil & Gas Services 150,000 153,094 0.07
NAI Entertainment Holdings 5.00 1/8/2018 Entertainment 130,000 130,975 0.06
National CineMedia LLC 6.00 15/4/2022 Entertainment 1,050,000 1,078,875 0.48
National CineMedia LLC 5.75 15/8/2026 Entertainment 300,000 303,598 0.14
Navient Corporation 8.45 15/6/2018 Diversified Financial Services 400,000 426,000 0.19
Navient Corporation 8.00 25/3/2020 Diversified Financial Services 675,000 733,219 0.33
NCR Corporation 4.63 15/2/2021 Computers 75,000 76,696 0.03
NCR Corporation 5.88 15/12/2021 Computers 270,000 281,475 0.13
NCR Corporation 5.00 15/7/2022 Computers 600,000 609,000 0.27
NCR Corporation 6.38 15/12/2023 Computers 1,750,000 1,841,875 0.82
NewStar Financial Incorporated 7.25 1/5/2020 Diversified Financial Services 600,000 610,500 0.27
Nexstar Broadcasting Incorporated 6.13 15/2/2022 Media 863,000 897,520 0.40
Nexstar Broadcasting Incorporated 5.63 1/8/2024 Media 375,000 380,625 0.17
NGPL PipeCo LLC 7.12 15/12/2017 Pipelines 400,000 411,000 0.18
NGPL PipeCo LLC 7.77 15/12/2037 Pipelines 3,605,000 4,073,650 1.81
Nielsen Finance LLC 5.00 15/4/2022 Media 1,200,000 1,227,000 0.55
Novelis Corporation 6.25 15/8/2024 Metal Fabricate/Hardware 75,000 78,188 0.04
NSG Holdings LLC 7.75 15/12/2025 Electric 2,145,911 2,306,855 1.03
OneMain Financial Holdings LLC 7.25 15/12/2021 Diversified Financial Services 1,800,000 1,885,500 0.84
The accompanying notes are an integral part of these financial statements.
China Equity Fund, Emerging Markets Equity Income Fund, Global Focused Equity Fund, Global Opportunity Bond Fund, U.S. Dollar Short-Term Money Market
Fund, U.S. Select Equity Fund, U.S. Short-Term High Yield Bond Fund, U.S. Small Cap Value Fund and USD Investment Grade Credit Fund have not been
authorised by the Hong Kong Securities and Futures Commission and are not available for investment by Hong Kong retail investors.

34 Wells Fargo (Lux) Worldwide Fund Portfolio of investments as at 31 March 2017 (continued)
U.S. HIGH YIELD BOND FUND
InterestRate
%Maturity
Date IndustryNominal
USD
MarketValue
USD
% ofNet
Assets
Transferable securities and money market instruments admitted to an official stock exchange listing or dealt in on another regulatedmarket (continued)
Corporate Bonds and Notes (continued)
United States continued
Outfront Media Capital LLC 5.25 15/2/2022 Advertising 335,000 346,725 0.15
Outfront Media Capital LLC 5.63 15/2/2024 Advertising 500,000 522,500 0.23
Outfront Media Capital LLC 5.88 15/3/2025 Advertising 45,000 47,137 0.02
Overseas Shipholding Group Incorporated 8.13 30/3/2018 Transportation 550,000 573,375 0.26
Owens-Brockway Glass Container Incorporated 5.00 15/1/2022 Packaging & Containers 900,000 925,875 0.41
Owens-Brockway Glass Container Incorporated 5.88 15/8/2023 Packaging & Containers 175,000 185,172 0.08
Owens-Brockway Glass Container Incorporated 5.38 15/1/2025 Packaging & Containers 1,195,000 1,212,925 0.54
Owens-Brockway Glass Container Incorporated 6.38 15/8/2025 Packaging & Containers 250,000 267,188 0.12
Pattern Energy Group Incorporated 5.88 1/2/2024 Energy-Alternate Sources 2,025,000 2,050,313 0.91
PDC Energy Incorporated 6.13 15/9/2024 Oil & Gas Services 250,000 256,250 0.11
Penske Automotive Group Incorporated 5.75 1/10/2022 Retail 1,100,000 1,138,500 0.51
Penske Automotive Group Incorporated 5.38 1/12/2024 Retail 1,425,000 1,428,563 0.64
PHI Incorporated 5.25 15/3/2019 Oil & Gas Services 2,452,000 2,317,140 1.03
Pilgrim’s Pride Corporation 5.75 15/3/2025 Food 650,000 654,875 0.29
Pinnacle Entertainment Incorporated 5.63 1/5/2024 Entertainment 175,000 177,406 0.08
Pinnacle Foods Finance LLC 4.88 1/5/2021 Food 225,000 229,163 0.10
Pinnacle Foods Finance LLC 5.88 15/1/2024 Food 150,000 156,375 0.07
Post Holdings Incorporated 5.50 1/3/2025 Food 225,000 224,438 0.10
Post Holdings Incorporated 5.00 15/8/2026 Food 775,000 742,063 0.33
Post Holdings Incorporated 5.75 1/3/2027 Food 225,000 224,438 0.10
Prestige Brands Incorporated 6.38 1/3/2024 Household Products/Wares 280,000 294,000 0.13
Rockies Express Pipeline LLC 5.63 15/4/2020 Pipelines 1,950,000 2,052,375 0.91
Rockies Express Pipeline LLC 7.50 15/7/2038 Pipelines 270,000 291,600 0.13
Rockies Express Pipeline LLC 6.88 15/4/2040 Pipelines 2,000,000 2,085,000 0.93
Rose Rock Midstream LP 5.63 15/7/2022 Pipelines 550,000 543,472 0.24
Rose Rock Midstream LP 5.63 15/11/2023 Pipelines 850,000 833,000 0.37
Sabine Pass Liquefaction LLC 5.63 1/2/2021 Pipelines 275,000 296,277 0.13
Sabine Pass Liquefaction LLC 6.25 15/3/2022 Pipelines 1,425,000 1,579,806 0.70
Sabine Pass Liquefaction LLC 5.63 15/4/2023 Pipelines 960,000 1,041,376 0.46
Sabine Pass Liquefaction LLC 5.75 15/5/2024 Pipelines 1,050,000 1,144,481 0.51
Sabine Pass Liquefaction LLC 5.88 30/6/2026 Pipelines 500,000 551,242 0.25
Sabra Health Care LP 5.50 1/2/2021 REIT 800,000 824,000 0.37
Sabra Health Care LP 5.38 1/6/2023 REIT 800,000 788,000 0.35
SBA Communications Corporation 4.88 15/7/2022 Telecommunications 900,000 913,500 0.41
SBA Communications Corporation 4.88 1/9/2024 Telecommunications 275,000 271,508 0.12
Scotts Miracle-Gro Company 6.00 15/10/2023 Housewares 100,000 106,250 0.05
Sealed Air Corporation 4.88 1/12/2022 Packaging & Containers 100,000 104,187 0.05
Sealed Air Corporation 5.25 1/4/2023 Packaging & Containers 350,000 367,500 0.16
Sealed Air Corporation 5.13 1/12/2024 Packaging & Containers 200,000 207,750 0.09
Select Medical Corporation 6.38 1/6/2021 Healthcare – Services 1,453,000 1,467,530 0.65
SemGroup Corporation 6.38 15/3/2025 Pipelines 1,475,000 1,449,188 0.64
Service Corporation International 7.63 1/10/2018 Commercial Services 615,000 662,663 0.29
Service Corporation International 8.00 15/11/2021 Commercial Services 325,000 378,625 0.17
Service Corporation International 7.50 1/4/2027 Commercial Services 725,000 842,813 0.37
ServiceMaster Company LLC 5.13 15/11/2024 Commercial Services 375,000 384,375 0.17
Silgan Holdings Incorporated 5.00 1/4/2020 Packaging & Containers 140,000 141,050 0.06
Silgan Holdings Incorporated 5.50 1/2/2022 Packaging & Containers 600,000 616,500 0.27
Simmons Foods Incorporated 7.88 1/10/2021 Food 150,000 157,500 0.07
Sonic Automotive Incorporated 5.00 15/5/2023 Retail 340,000 330,439 0.15
Sonic Automotive Incorporated 6.13 15/3/2027 Retail 600,000 600,750 0.27
Southern Star Central Corporation 5.13 15/7/2022 Oil & Gas Services 1,050,000 1,052,625 0.47
The accompanying notes are an integral part of these financial statements.
China Equity Fund, Emerging Markets Equity Income Fund, Global Focused Equity Fund, Global Opportunity Bond Fund, U.S. Dollar Short-Term Money Market
Fund, U.S. Select Equity Fund, U.S. Short-Term High Yield Bond Fund, U.S. Small Cap Value Fund and USD Investment Grade Credit Fund have not been
authorised by the Hong Kong Securities and Futures Commission and are not available for investment by Hong Kong retail investors.
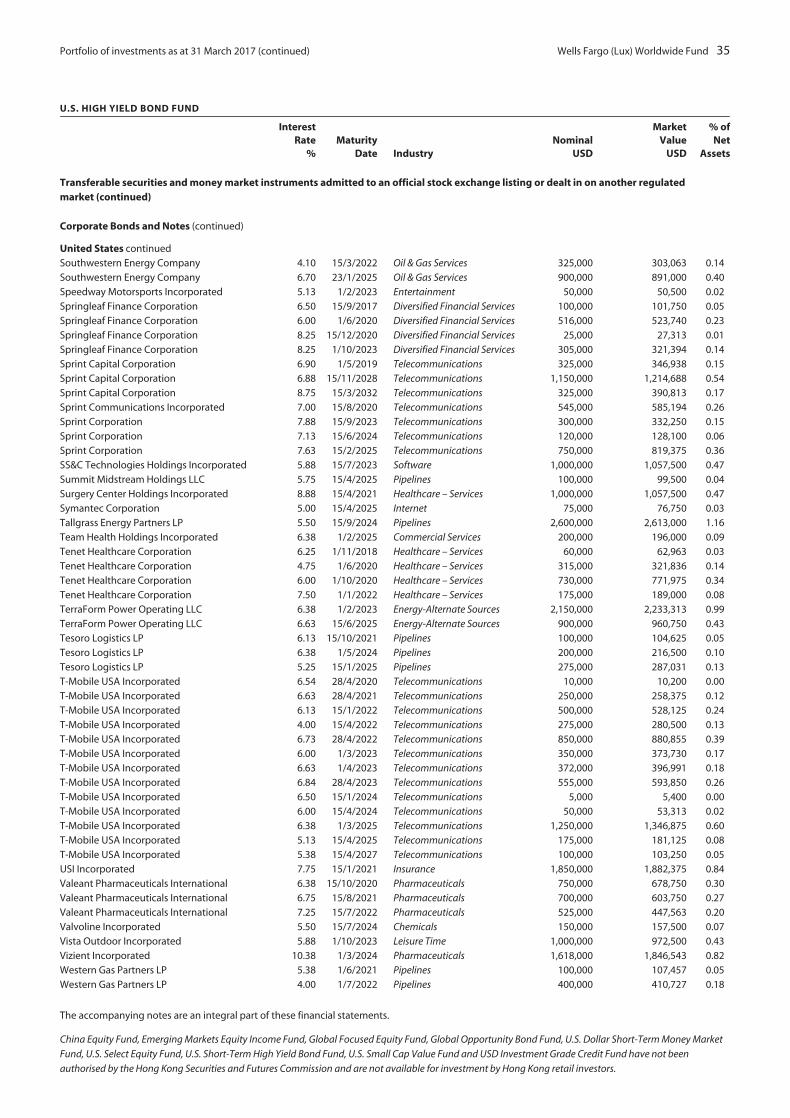
Portfolio of investments as at 31 March 2017 (continued) Wells Fargo (Lux) Worldwide Fund 35
U.S. HIGH YIELD BOND FUND
InterestRate
%Maturity
Date IndustryNominal
USD
MarketValue
USD
% ofNet
Assets
Transferable securities and money market instruments admitted to an official stock exchange listing or dealt in on another regulatedmarket (continued)
Corporate Bonds and Notes (continued)
United States continued
Southwestern Energy Company 4.10 15/3/2022 Oil & Gas Services 325,000 303,063 0.14
Southwestern Energy Company 6.70 23/1/2025 Oil & Gas Services 900,000 891,000 0.40
Speedway Motorsports Incorporated 5.13 1/2/2023 Entertainment 50,000 50,500 0.02
Springleaf Finance Corporation 6.50 15/9/2017 Diversified Financial Services 100,000 101,750 0.05
Springleaf Finance Corporation 6.00 1/6/2020 Diversified Financial Services 516,000 523,740 0.23
Springleaf Finance Corporation 8.25 15/12/2020 Diversified Financial Services 25,000 27,313 0.01
Springleaf Finance Corporation 8.25 1/10/2023 Diversified Financial Services 305,000 321,394 0.14
Sprint Capital Corporation 6.90 1/5/2019 Telecommunications 325,000 346,938 0.15
Sprint Capital Corporation 6.88 15/11/2028 Telecommunications 1,150,000 1,214,688 0.54
Sprint Capital Corporation 8.75 15/3/2032 Telecommunications 325,000 390,813 0.17
Sprint Communications Incorporated 7.00 15/8/2020 Telecommunications 545,000 585,194 0.26
Sprint Corporation 7.88 15/9/2023 Telecommunications 300,000 332,250 0.15
Sprint Corporation 7.13 15/6/2024 Telecommunications 120,000 128,100 0.06
Sprint Corporation 7.63 15/2/2025 Telecommunications 750,000 819,375 0.36
SS&C Technologies Holdings Incorporated 5.88 15/7/2023 Software 1,000,000 1,057,500 0.47
Summit Midstream Holdings LLC 5.75 15/4/2025 Pipelines 100,000 99,500 0.04
Surgery Center Holdings Incorporated 8.88 15/4/2021 Healthcare – Services 1,000,000 1,057,500 0.47
Symantec Corporation 5.00 15/4/2025 Internet 75,000 76,750 0.03
Tallgrass Energy Partners LP 5.50 15/9/2024 Pipelines 2,600,000 2,613,000 1.16
Team Health Holdings Incorporated 6.38 1/2/2025 Commercial Services 200,000 196,000 0.09
Tenet Healthcare Corporation 6.25 1/11/2018 Healthcare – Services 60,000 62,963 0.03
Tenet Healthcare Corporation 4.75 1/6/2020 Healthcare – Services 315,000 321,836 0.14
Tenet Healthcare Corporation 6.00 1/10/2020 Healthcare – Services 730,000 771,975 0.34
Tenet Healthcare Corporation 7.50 1/1/2022 Healthcare – Services 175,000 189,000 0.08
TerraForm Power Operating LLC 6.38 1/2/2023 Energy-Alternate Sources 2,150,000 2,233,313 0.99
TerraForm Power Operating LLC 6.63 15/6/2025 Energy-Alternate Sources 900,000 960,750 0.43
Tesoro Logistics LP 6.13 15/10/2021 Pipelines 100,000 104,625 0.05
Tesoro Logistics LP 6.38 1/5/2024 Pipelines 200,000 216,500 0.10
Tesoro Logistics LP 5.25 15/1/2025 Pipelines 275,000 287,031 0.13
T-Mobile USA Incorporated 6.54 28/4/2020 Telecommunications 10,000 10,200 0.00
T-Mobile USA Incorporated 6.63 28/4/2021 Telecommunications 250,000 258,375 0.12
T-Mobile USA Incorporated 6.13 15/1/2022 Telecommunications 500,000 528,125 0.24
T-Mobile USA Incorporated 4.00 15/4/2022 Telecommunications 275,000 280,500 0.13
T-Mobile USA Incorporated 6.73 28/4/2022 Telecommunications 850,000 880,855 0.39
T-Mobile USA Incorporated 6.00 1/3/2023 Telecommunications 350,000 373,730 0.17
T-Mobile USA Incorporated 6.63 1/4/2023 Telecommunications 372,000 396,991 0.18
T-Mobile USA Incorporated 6.84 28/4/2023 Telecommunications 555,000 593,850 0.26
T-Mobile USA Incorporated 6.50 15/1/2024 Telecommunications 5,000 5,400 0.00
T-Mobile USA Incorporated 6.00 15/4/2024 Telecommunications 50,000 53,313 0.02
T-Mobile USA Incorporated 6.38 1/3/2025 Telecommunications 1,250,000 1,346,875 0.60
T-Mobile USA Incorporated 5.13 15/4/2025 Telecommunications 175,000 181,125 0.08
T-Mobile USA Incorporated 5.38 15/4/2027 Telecommunications 100,000 103,250 0.05
USI Incorporated 7.75 15/1/2021 Insurance 1,850,000 1,882,375 0.84
Valeant Pharmaceuticals International 6.38 15/10/2020 Pharmaceuticals 750,000 678,750 0.30
Valeant Pharmaceuticals International 6.75 15/8/2021 Pharmaceuticals 700,000 603,750 0.27
Valeant Pharmaceuticals International 7.25 15/7/2022 Pharmaceuticals 525,000 447,563 0.20
Valvoline Incorporated 5.50 15/7/2024 Chemicals 150,000 157,500 0.07
Vista Outdoor Incorporated 5.88 1/10/2023 Leisure Time 1,000,000 972,500 0.43
Vizient Incorporated 10.38 1/3/2024 Pharmaceuticals 1,618,000 1,846,543 0.82
Western Gas Partners LP 5.38 1/6/2021 Pipelines 100,000 107,457 0.05
Western Gas Partners LP 4.00 1/7/2022 Pipelines 400,000 410,727 0.18
The accompanying notes are an integral part of these financial statements.
China Equity Fund, Emerging Markets Equity Income Fund, Global Focused Equity Fund, Global Opportunity Bond Fund, U.S. Dollar Short-Term Money Market
Fund, U.S. Select Equity Fund, U.S. Short-Term High Yield Bond Fund, U.S. Small Cap Value Fund and USD Investment Grade Credit Fund have not been
authorised by the Hong Kong Securities and Futures Commission and are not available for investment by Hong Kong retail investors.
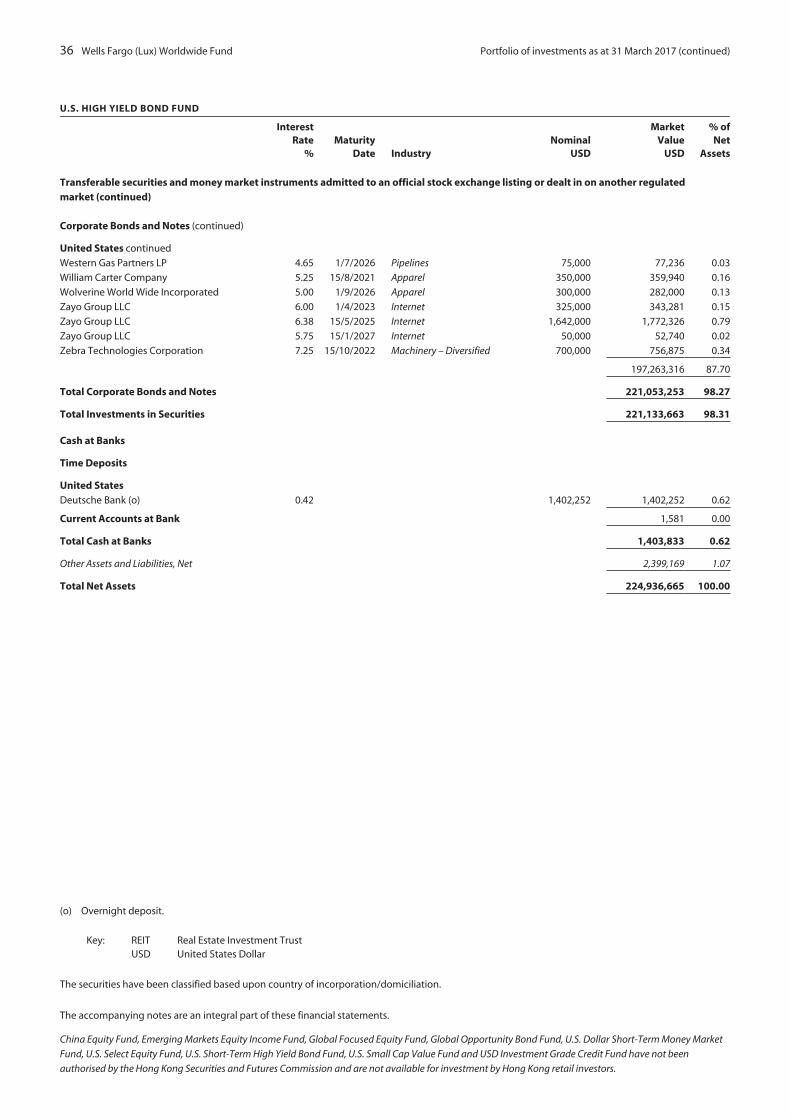
36 Wells Fargo (Lux) Worldwide Fund Portfolio of investments as at 31 March 2017 (continued)
U.S. HIGH YIELD BOND FUND
InterestRate
%Maturity
Date IndustryNominal
USD
MarketValue
USD
% ofNet
Assets
Transferable securities and money market instruments admitted to an official stock exchange listing or dealt in on another regulatedmarket (continued)
Corporate Bonds and Notes (continued)
United States continued
Western Gas Partners LP 4.65 1/7/2026 Pipelines 75,000 77,236 0.03
William Carter Company 5.25 15/8/2021 Apparel 350,000 359,940 0.16
Wolverine World Wide Incorporated 5.00 1/9/2026 Apparel 300,000 282,000 0.13
Zayo Group LLC 6.00 1/4/2023 Internet 325,000 343,281 0.15
Zayo Group LLC 6.38 15/5/2025 Internet 1,642,000 1,772,326 0.79
Zayo Group LLC 5.75 15/1/2027 Internet 50,000 52,740 0.02
Zebra Technologies Corporation 7.25 15/10/2022 Machinery – Diversified 700,000 756,875 0.34
197,263,316 87.70
Total Corporate Bonds and Notes 221,053,253 98.27
Total Investments in Securities 221,133,663 98.31
Cash at Banks
Time Deposits
United StatesDeutsche Bank (o) 0.42 1,402,252 1,402,252 0.62
Current Accounts at Bank 1,581 0.00
Total Cash at Banks 1,403,833 0.62
Other Assets and Liabilities, Net 2,399,169 1.07
Total Net Assets 224,936,665 100.00
(o) Overnight deposit.
Key: REIT Real Estate Investment TrustUSD United States Dollar
The securities have been classified based upon country of incorporation/domiciliation.
The accompanying notes are an integral part of these financial statements.
China Equity Fund, Emerging Markets Equity Income Fund, Global Focused Equity Fund, Global Opportunity Bond Fund, U.S. Dollar Short-Term Money Market
Fund, U.S. Select Equity Fund, U.S. Short-Term High Yield Bond Fund, U.S. Small Cap Value Fund and USD Investment Grade Credit Fund have not been
authorised by the Hong Kong Securities and Futures Commission and are not available for investment by Hong Kong retail investors.

Portfolio of investments as at 31 March 2017 Wells Fargo (Lux) Worldwide Fund 37
U.S. LARGE CAP GROWTH FUND
Industry Shares
MarketValue
USD
% ofNet
Assets
Transferable securities and money market instruments admitted to an official stock exchange listing or dealt in on another regulated market
Common Shares
Canada
Waste Connections Incorporated Environmental Control 37,770 3,332,069 3.55
China
Tencent Holdings Limited ADR Internet 70,310 2,029,147 2.16
United States
Activision Blizzard Incorporated Software 53,720 2,678,479 2.85
Alphabet Incorporated Class A Internet 5,830 4,942,674 5.27
Alphabet Incorporated Class C Internet 2,237 1,855,726 1.98
Amazon.com Incorporated Internet 7,035 6,236,809 6.65
Baxter International Incorporated Healthcare – Products 34,600 1,794,356 1.91
Boston Scientific Corporation Healthcare – Products 67,700 1,683,699 1.79
Broadcom Limited Semiconductors 9,520 2,084,499 2.22
Celgene Corporation Biotechnology 25,030 3,114,483 3.32
Charter Communications Incorporated Media 5,730 1,875,544 2.00
Electronic Arts Incorporated Software 26,890 2,407,193 2.57
Facebook Incorporated Internet 21,680 3,079,644 3.28
Fidelity National Information Services
Incorporated Software 34,500 2,746,890 2.93
Gilead Sciences Incorporated Biotechnology 10,810 734,215 0.78
Harris Corporation Aerospace/Defense 17,440 1,940,549 2.07
Home Depot Incorporated Retail 24,690 3,625,233 3.86
Intercontinental Exchange Incorporated Diversified Financial Services 41,095 2,460,358 2.62
Intuitive Surgical Incorporated Healthcare – Products 2,180 1,670,905 1.78
Johnson Controls International plc Building Materials 48,383 2,037,892 2.17
Microsoft Corporation Software 61,720 4,064,879 4.33
Monster Beverage Corporation Beverages 26,860 1,240,126 1.32
Northrop Grumman Corporation Aerospace/Defense 6,960 1,655,366 1.76
PayPal Holdings Incorporated Commercial Services 62,920 2,706,818 2.88
Raymond James Financial Incorporated Diversified Financial Services 15,270 1,164,490 1.24
S&P Global Incorporated Commercial Services 13,480 1,762,375 1.88
Salesforce.com Incorporated Software 33,610 2,772,489 2.95
SBA Communications Corporation Telecommunications 12,570 1,513,051 1.61
Sherwin-Williams Company Chemicals 8,030 2,490,826 2.65
SLM Corporation Diversified Financial Services 120,830 1,462,043 1.56
Spirit Airlines Incorporated Airlines 29,810 1,582,017 1.69
Starbucks Corporation Restaurant 51,960 3,033,944 3.23
TJX Companies Incorporated Retail 34,560 2,733,005 2.91
TransUnion Commercial Services 63,630 2,440,210 2.60
UnitedHealth Group Incorporated Healthcare – Services 26,900 4,411,869 4.70
Visa Incorporated Diversified Financial Services 51,860 4,608,798 4.91
Vulcan Materials Company Building Materials 12,680 1,527,686 1.63
88,139,140 93.90
Total Common Shares 93,500,356 99.61
Total Investments in Securities 93,500,356 99.61
The accompanying notes are an integral part of these financial statements.
China Equity Fund, Emerging Markets Equity Income Fund, Global Focused Equity Fund, Global Opportunity Bond Fund, U.S. Dollar Short-Term Money Market
Fund, U.S. Select Equity Fund, U.S. Short-Term High Yield Bond Fund, U.S. Small Cap Value Fund and USD Investment Grade Credit Fund have not been
authorised by the Hong Kong Securities and Futures Commission and are not available for investment by Hong Kong retail investors.
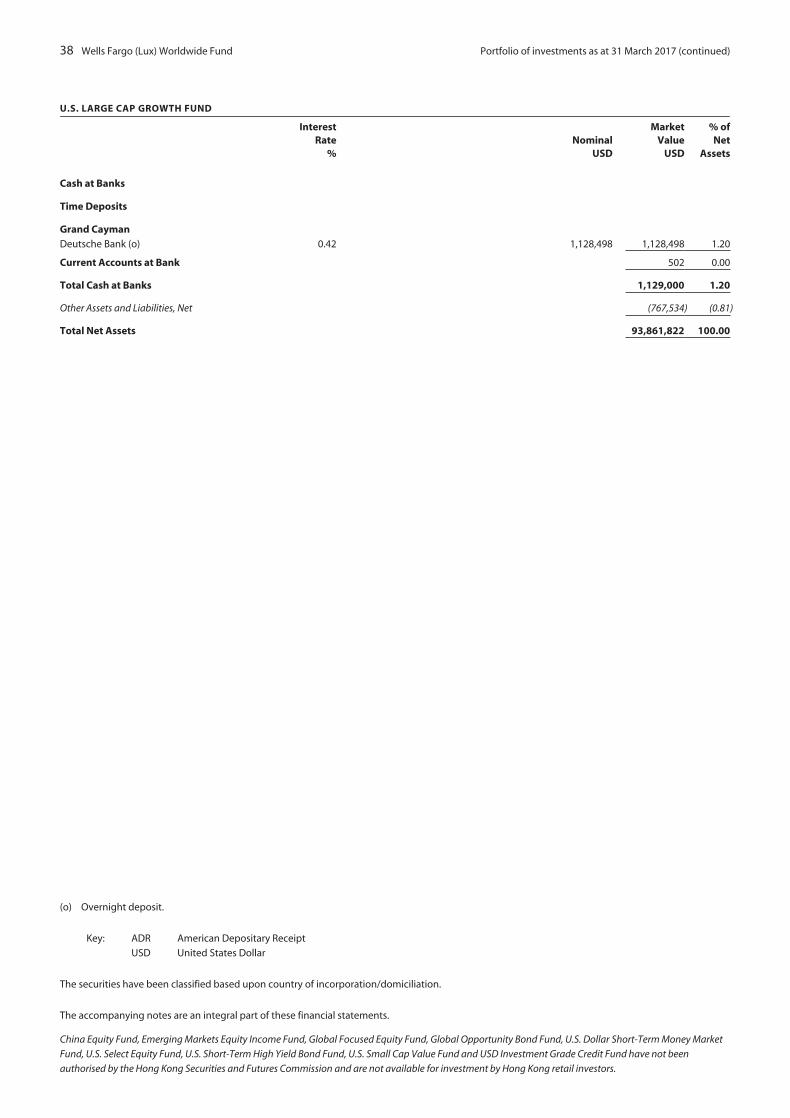
38 Wells Fargo (Lux) Worldwide Fund Portfolio of investments as at 31 March 2017 (continued)
U.S. LARGE CAP GROWTH FUND
InterestRate
%Nominal
USD
MarketValue
USD
% ofNet
Assets
Cash at Banks
Time Deposits
Grand CaymanDeutsche Bank (o) 0.42 1,128,498 1,128,498 1.20
Current Accounts at Bank 502 0.00
Total Cash at Banks 1,129,000 1.20
Other Assets and Liabilities, Net (767,534) (0.81)
Total Net Assets 93,861,822 100.00
(o) Overnight deposit.
Key: ADR American Depositary Receipt
USD United States Dollar
The securities have been classified based upon country of incorporation/domiciliation.
The accompanying notes are an integral part of these financial statements.
China Equity Fund, Emerging Markets Equity Income Fund, Global Focused Equity Fund, Global Opportunity Bond Fund, U.S. Dollar Short-Term Money Market
Fund, U.S. Select Equity Fund, U.S. Short-Term High Yield Bond Fund, U.S. Small Cap Value Fund and USD Investment Grade Credit Fund have not been
authorised by the Hong Kong Securities and Futures Commission and are not available for investment by Hong Kong retail investors.
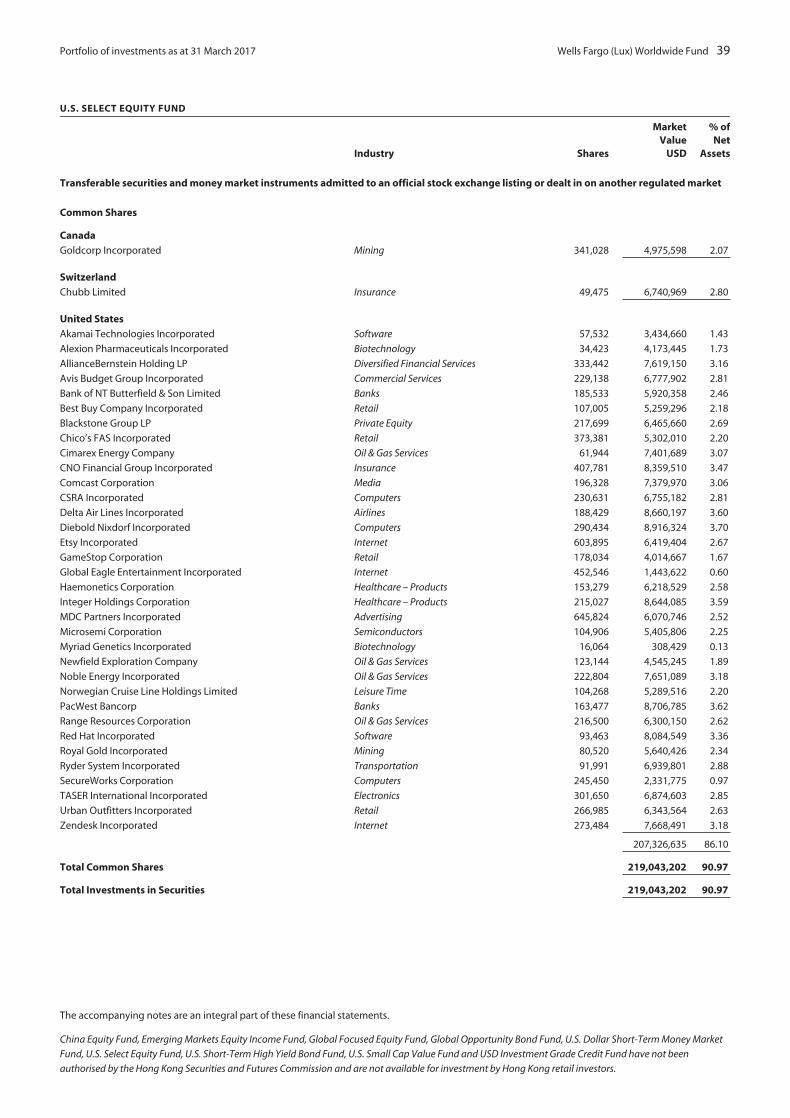
Portfolio of investments as at 31 March 2017 Wells Fargo (Lux) Worldwide Fund 39
U.S. SELECT EQUITY FUND
Industry Shares
MarketValue
USD
% ofNet
Assets
Transferable securities and money market instruments admitted to an official stock exchange listing or dealt in on another regulated market
Common Shares
Canada
Goldcorp Incorporated Mining 341,028 4,975,598 2.07
Switzerland
Chubb Limited Insurance 49,475 6,740,969 2.80
United States
Akamai Technologies Incorporated Software 57,532 3,434,660 1.43
Alexion Pharmaceuticals Incorporated Biotechnology 34,423 4,173,445 1.73
AllianceBernstein Holding LP Diversified Financial Services 333,442 7,619,150 3.16
Avis Budget Group Incorporated Commercial Services 229,138 6,777,902 2.81
Bank of NT Butterfield & Son Limited Banks 185,533 5,920,358 2.46
Best Buy Company Incorporated Retail 107,005 5,259,296 2.18
Blackstone Group LP Private Equity 217,699 6,465,660 2.69
Chico’s FAS Incorporated Retail 373,381 5,302,010 2.20
Cimarex Energy Company Oil & Gas Services 61,944 7,401,689 3.07
CNO Financial Group Incorporated Insurance 407,781 8,359,510 3.47
Comcast Corporation Media 196,328 7,379,970 3.06
CSRA Incorporated Computers 230,631 6,755,182 2.81
Delta Air Lines Incorporated Airlines 188,429 8,660,197 3.60
Diebold Nixdorf Incorporated Computers 290,434 8,916,324 3.70
Etsy Incorporated Internet 603,895 6,419,404 2.67
GameStop Corporation Retail 178,034 4,014,667 1.67
Global Eagle Entertainment Incorporated Internet 452,546 1,443,622 0.60
Haemonetics Corporation Healthcare – Products 153,279 6,218,529 2.58
Integer Holdings Corporation Healthcare – Products 215,027 8,644,085 3.59
MDC Partners Incorporated Advertising 645,824 6,070,746 2.52
Microsemi Corporation Semiconductors 104,906 5,405,806 2.25
Myriad Genetics Incorporated Biotechnology 16,064 308,429 0.13
Newfield Exploration Company Oil & Gas Services 123,144 4,545,245 1.89
Noble Energy Incorporated Oil & Gas Services 222,804 7,651,089 3.18
Norwegian Cruise Line Holdings Limited Leisure Time 104,268 5,289,516 2.20
PacWest Bancorp Banks 163,477 8,706,785 3.62
Range Resources Corporation Oil & Gas Services 216,500 6,300,150 2.62
Red Hat Incorporated Software 93,463 8,084,549 3.36
Royal Gold Incorporated Mining 80,520 5,640,426 2.34
Ryder System Incorporated Transportation 91,991 6,939,801 2.88
SecureWorks Corporation Computers 245,450 2,331,775 0.97
TASER International Incorporated Electronics 301,650 6,874,603 2.85
Urban Outfitters Incorporated Retail 266,985 6,343,564 2.63
Zendesk Incorporated Internet 273,484 7,668,491 3.18
207,326,635 86.10
Total Common Shares 219,043,202 90.97
Total Investments in Securities 219,043,202 90.97
The accompanying notes are an integral part of these financial statements.
China Equity Fund, Emerging Markets Equity Income Fund, Global Focused Equity Fund, Global Opportunity Bond Fund, U.S. Dollar Short-Term Money Market
Fund, U.S. Select Equity Fund, U.S. Short-Term High Yield Bond Fund, U.S. Small Cap Value Fund and USD Investment Grade Credit Fund have not been
authorised by the Hong Kong Securities and Futures Commission and are not available for investment by Hong Kong retail investors.
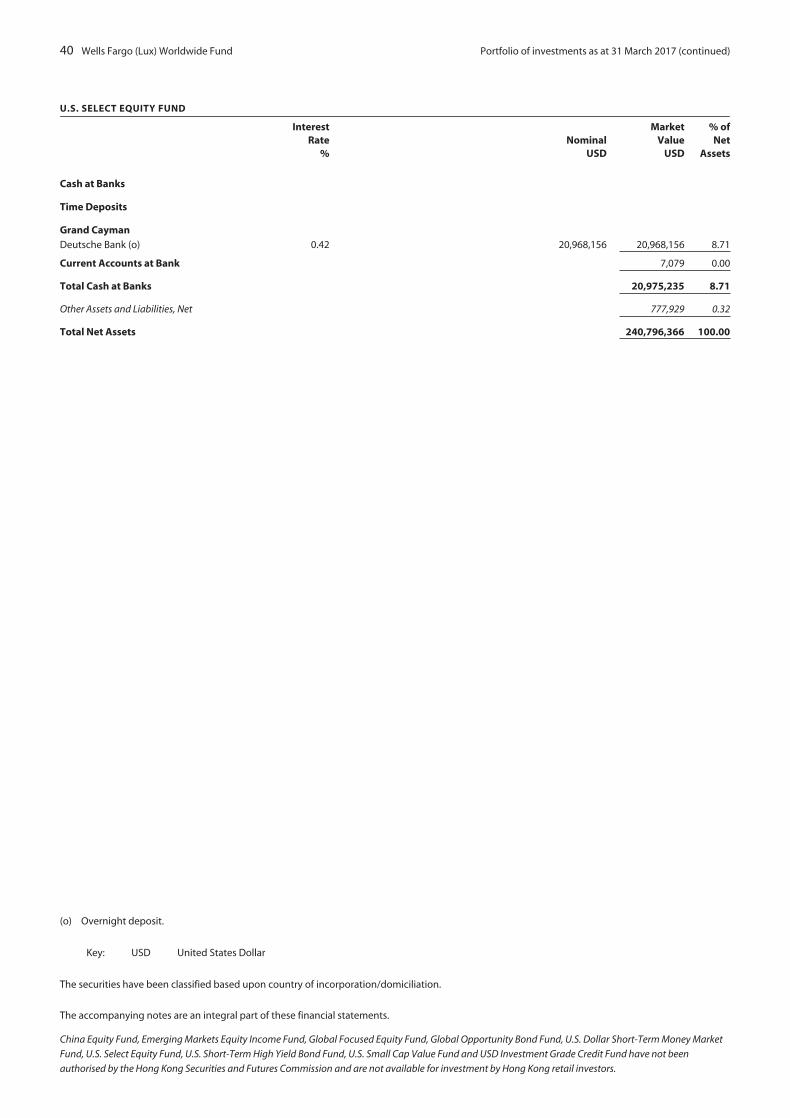
40 Wells Fargo (Lux) Worldwide Fund Portfolio of investments as at 31 March 2017 (continued)
U.S. SELECT EQUITY FUND
InterestRate
%Nominal
USD
MarketValue
USD
% ofNet
Assets
Cash at Banks
Time Deposits
Grand CaymanDeutsche Bank (o) 0.42 20,968,156 20,968,156 8.71
Current Accounts at Bank 7,079 0.00
Total Cash at Banks 20,975,235 8.71
Other Assets and Liabilities, Net 777,929 0.32
Total Net Assets 240,796,366 100.00
(o) Overnight deposit.
Key: USD United States Dollar
The securities have been classified based upon country of incorporation/domiciliation.
The accompanying notes are an integral part of these financial statements.
China Equity Fund, Emerging Markets Equity Income Fund, Global Focused Equity Fund, Global Opportunity Bond Fund, U.S. Dollar Short-Term Money Market
Fund, U.S. Select Equity Fund, U.S. Short-Term High Yield Bond Fund, U.S. Small Cap Value Fund and USD Investment Grade Credit Fund have not been
authorised by the Hong Kong Securities and Futures Commission and are not available for investment by Hong Kong retail investors.
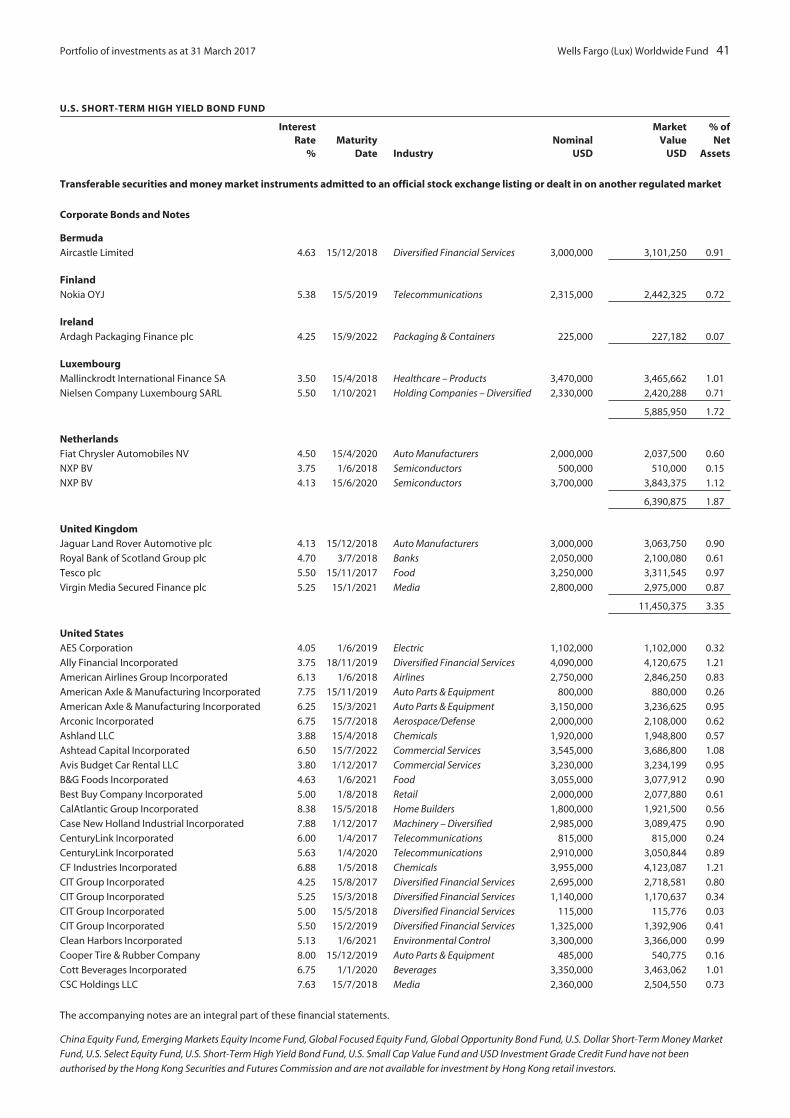
Portfolio of investments as at 31 March 2017 Wells Fargo (Lux) Worldwide Fund 41
U.S. SHORT-TERM HIGH YIELD BOND FUND
InterestRate
%Maturity
Date IndustryNominal
USD
MarketValue
USD
% ofNet
Assets
Transferable securities and money market instruments admitted to an official stock exchange listing or dealt in on another regulated market
Corporate Bonds and Notes
BermudaAircastle Limited 4.63 15/12/2018 Diversified Financial Services 3,000,000 3,101,250 0.91
FinlandNokia OYJ 5.38 15/5/2019 Telecommunications 2,315,000 2,442,325 0.72
IrelandArdagh Packaging Finance plc 4.25 15/9/2022 Packaging & Containers 225,000 227,182 0.07
LuxembourgMallinckrodt International Finance SA 3.50 15/4/2018 Healthcare – Products 3,470,000 3,465,662 1.01
Nielsen Company Luxembourg SARL 5.50 1/10/2021 Holding Companies – Diversified 2,330,000 2,420,288 0.71
5,885,950 1.72
NetherlandsFiat Chrysler Automobiles NV 4.50 15/4/2020 Auto Manufacturers 2,000,000 2,037,500 0.60
NXP BV 3.75 1/6/2018 Semiconductors 500,000 510,000 0.15
NXP BV 4.13 15/6/2020 Semiconductors 3,700,000 3,843,375 1.12
6,390,875 1.87
United KingdomJaguar Land Rover Automotive plc 4.13 15/12/2018 Auto Manufacturers 3,000,000 3,063,750 0.90
Royal Bank of Scotland Group plc 4.70 3/7/2018 Banks 2,050,000 2,100,080 0.61
Tesco plc 5.50 15/11/2017 Food 3,250,000 3,311,545 0.97
Virgin Media Secured Finance plc 5.25 15/1/2021 Media 2,800,000 2,975,000 0.87
11,450,375 3.35
United StatesAES Corporation 4.05 1/6/2019 Electric 1,102,000 1,102,000 0.32
Ally Financial Incorporated 3.75 18/11/2019 Diversified Financial Services 4,090,000 4,120,675 1.21
American Airlines Group Incorporated 6.13 1/6/2018 Airlines 2,750,000 2,846,250 0.83
American Axle & Manufacturing Incorporated 7.75 15/11/2019 Auto Parts & Equipment 800,000 880,000 0.26
American Axle & Manufacturing Incorporated 6.25 15/3/2021 Auto Parts & Equipment 3,150,000 3,236,625 0.95
Arconic Incorporated 6.75 15/7/2018 Aerospace/Defense 2,000,000 2,108,000 0.62
Ashland LLC 3.88 15/4/2018 Chemicals 1,920,000 1,948,800 0.57
Ashtead Capital Incorporated 6.50 15/7/2022 Commercial Services 3,545,000 3,686,800 1.08
Avis Budget Car Rental LLC 3.80 1/12/2017 Commercial Services 3,230,000 3,234,199 0.95
B&G Foods Incorporated 4.63 1/6/2021 Food 3,055,000 3,077,912 0.90
Best Buy Company Incorporated 5.00 1/8/2018 Retail 2,000,000 2,077,880 0.61
CalAtlantic Group Incorporated 8.38 15/5/2018 Home Builders 1,800,000 1,921,500 0.56
Case New Holland Industrial Incorporated 7.88 1/12/2017 Machinery – Diversified 2,985,000 3,089,475 0.90
CenturyLink Incorporated 6.00 1/4/2017 Telecommunications 815,000 815,000 0.24
CenturyLink Incorporated 5.63 1/4/2020 Telecommunications 2,910,000 3,050,844 0.89
CF Industries Incorporated 6.88 1/5/2018 Chemicals 3,955,000 4,123,087 1.21
CIT Group Incorporated 4.25 15/8/2017 Diversified Financial Services 2,695,000 2,718,581 0.80
CIT Group Incorporated 5.25 15/3/2018 Diversified Financial Services 1,140,000 1,170,637 0.34
CIT Group Incorporated 5.00 15/5/2018 Diversified Financial Services 115,000 115,776 0.03
CIT Group Incorporated 5.50 15/2/2019 Diversified Financial Services 1,325,000 1,392,906 0.41
Clean Harbors Incorporated 5.13 1/6/2021 Environmental Control 3,300,000 3,366,000 0.99
Cooper Tire & Rubber Company 8.00 15/12/2019 Auto Parts & Equipment 485,000 540,775 0.16
Cott Beverages Incorporated 6.75 1/1/2020 Beverages 3,350,000 3,463,062 1.01
CSC Holdings LLC 7.63 15/7/2018 Media 2,360,000 2,504,550 0.73
The accompanying notes are an integral part of these financial statements.
China Equity Fund, Emerging Markets Equity Income Fund, Global Focused Equity Fund, Global Opportunity Bond Fund, U.S. Dollar Short-Term Money Market
Fund, U.S. Select Equity Fund, U.S. Short-Term High Yield Bond Fund, U.S. Small Cap Value Fund and USD Investment Grade Credit Fund have not been
authorised by the Hong Kong Securities and Futures Commission and are not available for investment by Hong Kong retail investors.
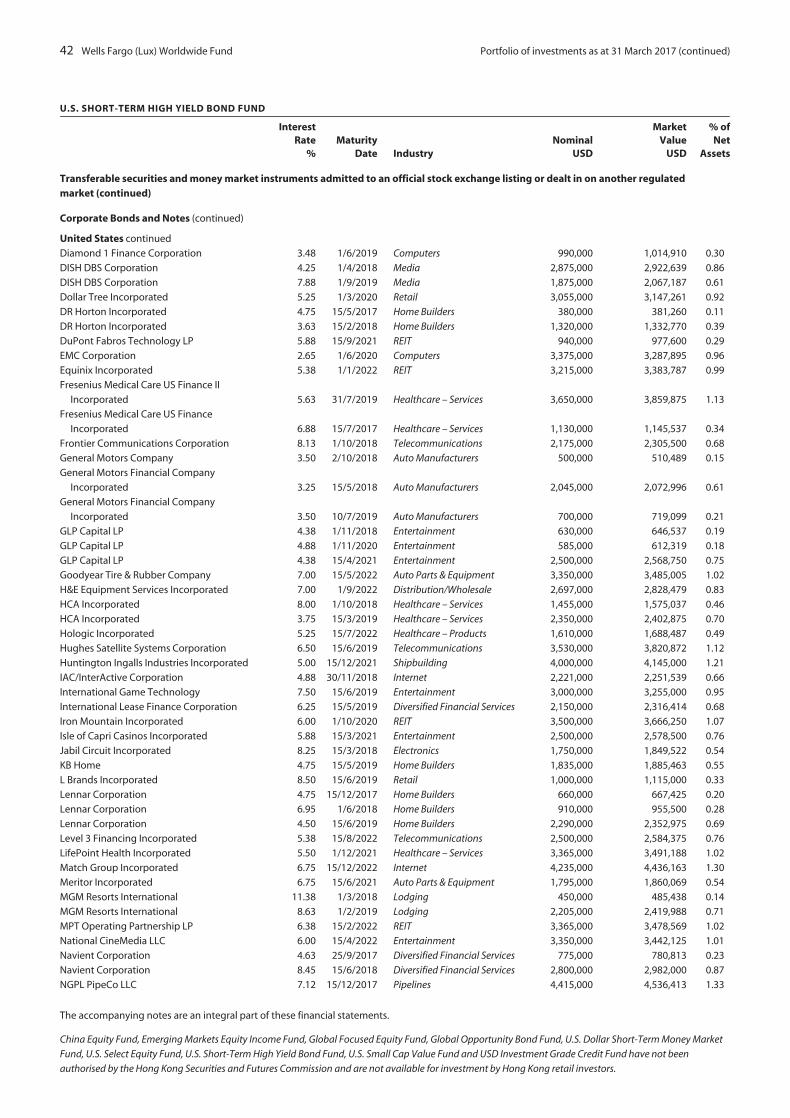
42 Wells Fargo (Lux) Worldwide Fund Portfolio of investments as at 31 March 2017 (continued)
U.S. SHORT-TERM HIGH YIELD BOND FUND
InterestRate
%Maturity
Date IndustryNominal
USD
MarketValue
USD
% ofNet
Assets
Transferable securities and money market instruments admitted to an official stock exchange listing or dealt in on another regulatedmarket (continued)
Corporate Bonds and Notes (continued)
United States continued
Diamond 1 Finance Corporation 3.48 1/6/2019 Computers 990,000 1,014,910 0.30
DISH DBS Corporation 4.25 1/4/2018 Media 2,875,000 2,922,639 0.86
DISH DBS Corporation 7.88 1/9/2019 Media 1,875,000 2,067,187 0.61
Dollar Tree Incorporated 5.25 1/3/2020 Retail 3,055,000 3,147,261 0.92
DR Horton Incorporated 4.75 15/5/2017 Home Builders 380,000 381,260 0.11
DR Horton Incorporated 3.63 15/2/2018 Home Builders 1,320,000 1,332,770 0.39
DuPont Fabros Technology LP 5.88 15/9/2021 REIT 940,000 977,600 0.29
EMC Corporation 2.65 1/6/2020 Computers 3,375,000 3,287,895 0.96
Equinix Incorporated 5.38 1/1/2022 REIT 3,215,000 3,383,787 0.99
Fresenius Medical Care US Finance II
Incorporated 5.63 31/7/2019 Healthcare – Services 3,650,000 3,859,875 1.13
Fresenius Medical Care US Finance
Incorporated 6.88 15/7/2017 Healthcare – Services 1,130,000 1,145,537 0.34
Frontier Communications Corporation 8.13 1/10/2018 Telecommunications 2,175,000 2,305,500 0.68
General Motors Company 3.50 2/10/2018 Auto Manufacturers 500,000 510,489 0.15
General Motors Financial Company
Incorporated 3.25 15/5/2018 Auto Manufacturers 2,045,000 2,072,996 0.61
General Motors Financial Company
Incorporated 3.50 10/7/2019 Auto Manufacturers 700,000 719,099 0.21
GLP Capital LP 4.38 1/11/2018 Entertainment 630,000 646,537 0.19
GLP Capital LP 4.88 1/11/2020 Entertainment 585,000 612,319 0.18
GLP Capital LP 4.38 15/4/2021 Entertainment 2,500,000 2,568,750 0.75
Goodyear Tire & Rubber Company 7.00 15/5/2022 Auto Parts & Equipment 3,350,000 3,485,005 1.02
H&E Equipment Services Incorporated 7.00 1/9/2022 Distribution/Wholesale 2,697,000 2,828,479 0.83
HCA Incorporated 8.00 1/10/2018 Healthcare – Services 1,455,000 1,575,037 0.46
HCA Incorporated 3.75 15/3/2019 Healthcare – Services 2,350,000 2,402,875 0.70
Hologic Incorporated 5.25 15/7/2022 Healthcare – Products 1,610,000 1,688,487 0.49
Hughes Satellite Systems Corporation 6.50 15/6/2019 Telecommunications 3,530,000 3,820,872 1.12
Huntington Ingalls Industries Incorporated 5.00 15/12/2021 Shipbuilding 4,000,000 4,145,000 1.21
IAC/InterActive Corporation 4.88 30/11/2018 Internet 2,221,000 2,251,539 0.66
International Game Technology 7.50 15/6/2019 Entertainment 3,000,000 3,255,000 0.95
International Lease Finance Corporation 6.25 15/5/2019 Diversified Financial Services 2,150,000 2,316,414 0.68
Iron Mountain Incorporated 6.00 1/10/2020 REIT 3,500,000 3,666,250 1.07
Isle of Capri Casinos Incorporated 5.88 15/3/2021 Entertainment 2,500,000 2,578,500 0.76
Jabil Circuit Incorporated 8.25 15/3/2018 Electronics 1,750,000 1,849,522 0.54
KB Home 4.75 15/5/2019 Home Builders 1,835,000 1,885,463 0.55
L Brands Incorporated 8.50 15/6/2019 Retail 1,000,000 1,115,000 0.33
Lennar Corporation 4.75 15/12/2017 Home Builders 660,000 667,425 0.20
Lennar Corporation 6.95 1/6/2018 Home Builders 910,000 955,500 0.28
Lennar Corporation 4.50 15/6/2019 Home Builders 2,290,000 2,352,975 0.69
Level 3 Financing Incorporated 5.38 15/8/2022 Telecommunications 2,500,000 2,584,375 0.76
LifePoint Health Incorporated 5.50 1/12/2021 Healthcare – Services 3,365,000 3,491,188 1.02
Match Group Incorporated 6.75 15/12/2022 Internet 4,235,000 4,436,163 1.30
Meritor Incorporated 6.75 15/6/2021 Auto Parts & Equipment 1,795,000 1,860,069 0.54
MGM Resorts International 11.38 1/3/2018 Lodging 450,000 485,438 0.14
MGM Resorts International 8.63 1/2/2019 Lodging 2,205,000 2,419,988 0.71
MPT Operating Partnership LP 6.38 15/2/2022 REIT 3,365,000 3,478,569 1.02
National CineMedia LLC 6.00 15/4/2022 Entertainment 3,350,000 3,442,125 1.01
Navient Corporation 4.63 25/9/2017 Diversified Financial Services 775,000 780,813 0.23
Navient Corporation 8.45 15/6/2018 Diversified Financial Services 2,800,000 2,982,000 0.87
NGPL PipeCo LLC 7.12 15/12/2017 Pipelines 4,415,000 4,536,413 1.33
The accompanying notes are an integral part of these financial statements.
China Equity Fund, Emerging Markets Equity Income Fund, Global Focused Equity Fund, Global Opportunity Bond Fund, U.S. Dollar Short-Term Money Market
Fund, U.S. Select Equity Fund, U.S. Short-Term High Yield Bond Fund, U.S. Small Cap Value Fund and USD Investment Grade Credit Fund have not been
authorised by the Hong Kong Securities and Futures Commission and are not available for investment by Hong Kong retail investors.

Portfolio of investments as at 31 March 2017 (continued) Wells Fargo (Lux) Worldwide Fund 43
U.S. SHORT-TERM HIGH YIELD BOND FUND
InterestRate
%Maturity
Date IndustryNominal
USD
MarketValue
USD
% ofNet
Assets
Transferable securities and money market instruments admitted to an official stock exchange listing or dealt in on another regulatedmarket (continued)
Corporate Bonds and Notes (continued)
United States continued
Pinnacle Foods Finance LLC 4.88 1/5/2021 Food 4,000,000 4,074,000 1.19
PulteGroup Incorporated 7.63 15/10/2017 Home Builders 450,000 460,125 0.13
Reynolds Group Issuer Incorporated 5.75 15/10/2020 Packaging & Containers 2,710,000 2,787,940 0.82
Rockies Express Pipeline LLC 6.00 15/1/2019 Pipelines 4,150,000 4,326,375 1.27
Sabine Pass Liquefaction LLC 5.63 1/2/2021 Pipelines 2,580,000 2,779,620 0.81
Sabra Health Care LP 5.50 1/2/2021 REIT 1,385,000 1,426,550 0.42
Sally Holdings LLC 5.75 1/6/2022 Retail 3,315,000 3,410,306 1.00
Sanmina Corporation 4.38 1/6/2019 Electronics 2,795,000 2,857,888 0.84
SBA Communications Corporation 4.88 15/7/2022 REIT 2,500,000 2,537,500 0.74
Service Corporation International 5.38 15/1/2022 Commercial Services 3,700,000 3,820,250 1.12
Sinclair Television Group Incorporated 6.13 1/10/2022 Media 3,250,000 3,400,313 1.00
Sirius XM Radio Incorporated 4.25 15/5/2020 Media 4,000,000 4,035,000 1.18
Sirius XM Radio Incorporated 5.75 1/8/2021 Media 425,000 441,575 0.13
Sprint Communications Incorporated 9.00 15/11/2018 Telecommunications 4,275,000 4,654,406 1.36
Sprint Spectrum Company LLC 3.36 20/9/2021 Telecommunications 380,000 380,649 0.11
Steel Dynamics Incorporated 6.38 15/8/2022 Iron/Steel 2,345,000 2,441,731 0.72
Targa Resources Partners LP 4.13 15/11/2019 Pipelines 3,390,000 3,445,088 1.01
Taylor Morrison Communities Incorporated 5.25 15/4/2021 Home Builders 3,245,000 3,342,350 0.98
TEGNA Incorporated 5.13 15/10/2019 Media 2,185,000 2,236,894 0.66
TEGNA Incorporated 5.13 15/7/2020 Media 865,000 894,194 0.26
Tenet Healthcare Corporation 4.63 15/6/2020 Healthcare – Services 4,000,000 4,025,000 1.18
Tesoro Corporation 4.25 1/10/2017 Oil & Gas Services 825,000 830,156 0.24
Tesoro Logistics LP 5.50 15/10/2019 Pipelines 2,730,000 2,880,150 0.84
Tesoro Logistics LP 5.88 1/10/2020 Pipelines 1,200,000 1,233,000 0.36
T-Mobile USA Incorporated 6.54 28/4/2020 Telecommunications 1,000,000 1,020,000 0.30
T-Mobile USA Incorporated 6.25 1/4/2021 Telecommunications 3,535,000 3,645,469 1.07
T-Mobile USA Incorporated 6.13 15/1/2022 Telecommunications 1,750,000 1,848,438 0.54
Toll Brothers Finance Corporation 8.91 15/10/2017 Home Builders 500,000 518,750 0.15
Toll Brothers Finance Corporation 4.00 31/12/2018 Home Builders 500,000 512,500 0.15
TRI Pointe Group Incorporated 4.38 15/6/2019 Home Builders 1,784,000 1,824,140 0.53
United Continental Holdings Incorporated 6.38 1/6/2018 Airlines 2,160,000 2,257,200 0.66
United Rentals North America Incorporated 7.63 15/4/2022 Commercial Services 782,000 814,258 0.24
US Airways 2010-1 Class B Pass-Through Trust 8.50 22/4/2017 Airlines 306,326 307,337 0.09
USG Corporation 8.25 15/1/2018 Building Materials 2,560,000 2,681,600 0.79
VEREIT Operating Partnership LP 3.00 6/2/2019 REIT 2,694,000 2,702,621 0.79
VEREIT Operating Partnership LP 4.13 1/6/2021 REIT 310,000 317,307 0.09
ViaSat Incorporated 6.88 15/6/2020 Telecommunications 1,530,000 1,564,425 0.46
Vulcan Materials Company 7.00 15/6/2018 Building Materials 700,000 740,911 0.22
William Carter Company 5.25 15/8/2021 Apparel 3,178,000 3,268,255 0.96
Zebra Technologies Corporation 7.25 15/10/2022 Machinery – Diversified 2,795,000 3,022,094 0.89
252,650,594 74.01
Total Corporate Bonds and Notes 282,148,551 82.65
Other Transferable Securities
Loans
United StatesAdvanced Disposal Services Incorporated ± 3.70 10/11/2023 Environmental Services 1,994,932 2,005,326 0.59
Calpine Corporation ± 3.90 15/1/2024 Electric 2,885,354 2,896,174 0.85
Change Healthcare Holdings Incorporated ± 3.75 1/3/2024 Diversified Services 1,350,000 1,351,687 0.40
The accompanying notes are an integral part of these financial statements.
China Equity Fund, Emerging Markets Equity Income Fund, Global Focused Equity Fund, Global Opportunity Bond Fund, U.S. Dollar Short-Term Money Market
Fund, U.S. Select Equity Fund, U.S. Short-Term High Yield Bond Fund, U.S. Small Cap Value Fund and USD Investment Grade Credit Fund have not been
authorised by the Hong Kong Securities and Futures Commission and are not available for investment by Hong Kong retail investors.

44 Wells Fargo (Lux) Worldwide Fund Portfolio of investments as at 31 March 2017 (continued)
U.S. SHORT-TERM HIGH YIELD BOND FUND
InterestRate
%Maturity
Date IndustryNominal
USD
MarketValue
USD
% ofNet
Assets
Other Transferable Securities (continued)
Loans (continued)
United States continued
Columbus McKinnon Corporation ± 4.15 31/1/2024 Healthcare 1,600,000 1,613,008 0.47
Community Health Systems Incorporated ± 4.05 27/1/2021 Hospital Management 859,257 847,013 0.25
Dell International LLC ± 3.49 7/9/2023 Electric 455,000 456,515 0.13
First Data Corporation ± 3.98 8/7/2022 Electric 2,145,793 2,161,436 0.63
Huntsman International LLC ± 3.98 1/4/2023 Chemicals 1,634,528 1,647,474 0.48
Ineos US Finance LLC ± 3.73 31/3/2022 Chemicals 2,250,476 2,261,323 0.66
KAR Auction Services Incorporated ± 4.19 11/3/2021 Commercial Services 1,816,527 1,831,659 0.54
Level 3 Financing Incorporated ± 3.23 22/2/2024 Telecommunications 1,726,330 1,728,488 0.51
LPL Holdings Incorporated < 0.00 11/3/2024 Professional & Business Services 2,105,000 2,106,326 0.62
Michaels Stores Incorporated ± 3.75 30/1/2023 Retail Stores 2,481,286 2,473,024 0.72
Micron Technology Incorporated ± 4.74 26/4/2022 Electric 738,145 740,685 0.22
Reynolds Group Holdings Incorporated ± 3.98 5/2/2023 Chemicals 995,006 998,429 0.29
Select Medical Corporation ± 4.50 6/3/2024 Healthcare 1,000,000 1,008,750 0.29
Servicemaster Company LLC ± 3.48 8/11/2023 REIT 997,500 1,006,537 0.29
TransDigm Incorporated ± 4.12 28/2/2020 Aerospace/Defense 1,809,574 1,805,810 0.53
TransDigm Incorporated ± 4.04 14/5/2022 Aerospace/Defense 199,266 198,377 0.06
Virgin Media Bristol LLC ± 3.66 31/1/2025 Telecommunications 1,600,000 1,603,504 0.47
Zayo Group LLC ± 3.50 19/1/2024 Telecommunications 963,000 966,342 0.28
Zebra Technologies Corporation < 0.00 27/10/2021 Printing & Publishing 969,752 976,889 0.29
32,684,776 9.57
Total Loans 32,684,776 9.57
Total Investments in Securities 314,833,327 92.22
Cash at Banks
Time Deposits
Puerto RicoCitibank (o) 0.42 29,549,234 29,549,234 8.66
Current Accounts at Bank 9,567 0.00
Total Cash at Banks 29,558,801 8.66
Other Assets and Liabilities, Net (3,005,724) (0.88)
Total Net Assets 341,386,404 100.00
± Variable rate investment. The rate shown is the rate in effect at year end.< All or portion of the position represents an unsettled loan commitment at year end. Certain details associated with this unsettled purchase may not
be known prior to settlement date, including coupon rate.(o) Overnight deposit.
Key: REIT Real Estate Investment Trust
USD United States Dollar
The securities have been classified based upon country of incorporation/domiciliation.
The accompanying notes are an integral part of these financial statements.
China Equity Fund, Emerging Markets Equity Income Fund, Global Focused Equity Fund, Global Opportunity Bond Fund, U.S. Dollar Short-Term Money Market
Fund, U.S. Select Equity Fund, U.S. Short-Term High Yield Bond Fund, U.S. Small Cap Value Fund and USD Investment Grade Credit Fund have not been
authorised by the Hong Kong Securities and Futures Commission and are not available for investment by Hong Kong retail investors.
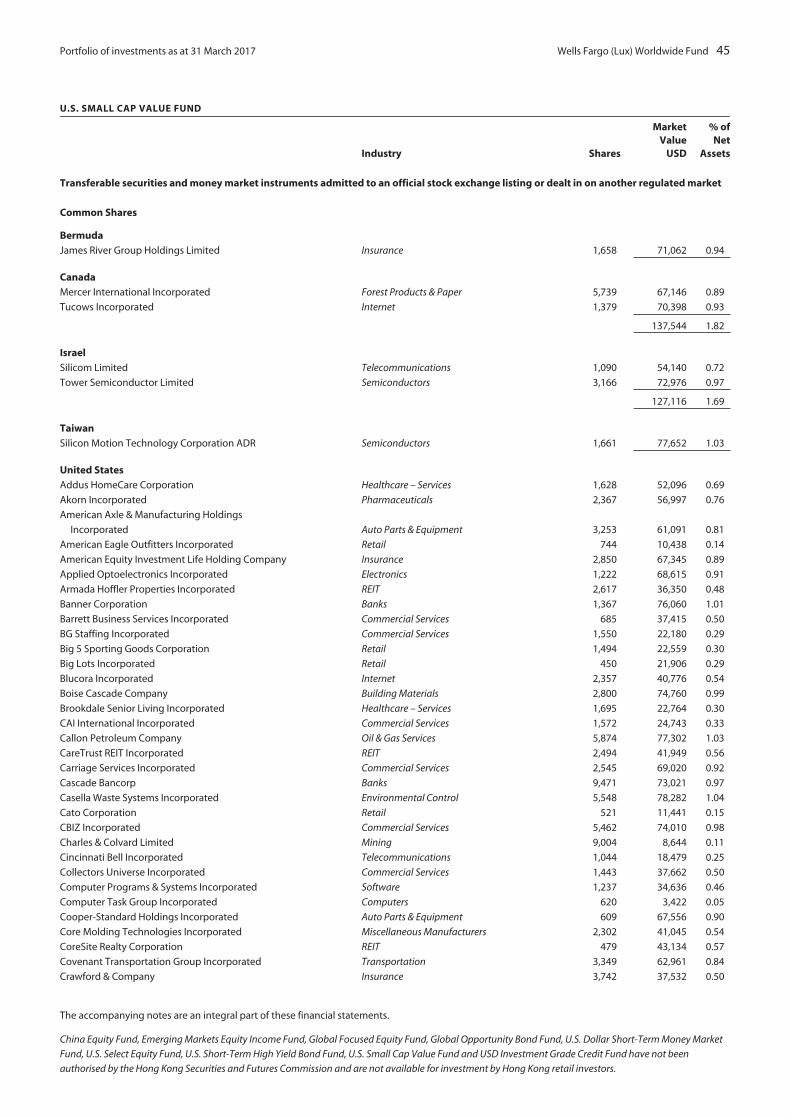
Portfolio of investments as at 31 March 2017 Wells Fargo (Lux) Worldwide Fund 45
U.S. SMALL CAP VALUE FUND
Industry Shares
MarketValue
USD
% ofNet
Assets
Transferable securities and money market instruments admitted to an official stock exchange listing or dealt in on another regulated market
Common Shares
Bermuda
James River Group Holdings Limited Insurance 1,658 71,062 0.94
Canada
Mercer International Incorporated Forest Products & Paper 5,739 67,146 0.89
Tucows Incorporated Internet 1,379 70,398 0.93
137,544 1.82
Israel
Silicom Limited Telecommunications 1,090 54,140 0.72
Tower Semiconductor Limited Semiconductors 3,166 72,976 0.97
127,116 1.69
Taiwan
Silicon Motion Technology Corporation ADR Semiconductors 1,661 77,652 1.03
United States
Addus HomeCare Corporation Healthcare – Services 1,628 52,096 0.69
Akorn Incorporated Pharmaceuticals 2,367 56,997 0.76
American Axle & Manufacturing Holdings
Incorporated Auto Parts & Equipment 3,253 61,091 0.81
American Eagle Outfitters Incorporated Retail 744 10,438 0.14
American Equity Investment Life Holding Company Insurance 2,850 67,345 0.89
Applied Optoelectronics Incorporated Electronics 1,222 68,615 0.91
Armada Hoffler Properties Incorporated REIT 2,617 36,350 0.48
Banner Corporation Banks 1,367 76,060 1.01
Barrett Business Services Incorporated Commercial Services 685 37,415 0.50
BG Staffing Incorporated Commercial Services 1,550 22,180 0.29
Big 5 Sporting Goods Corporation Retail 1,494 22,559 0.30
Big Lots Incorporated Retail 450 21,906 0.29
Blucora Incorporated Internet 2,357 40,776 0.54
Boise Cascade Company Building Materials 2,800 74,760 0.99
Brookdale Senior Living Incorporated Healthcare – Services 1,695 22,764 0.30
CAI International Incorporated Commercial Services 1,572 24,743 0.33
Callon Petroleum Company Oil & Gas Services 5,874 77,302 1.03
CareTrust REIT Incorporated REIT 2,494 41,949 0.56
Carriage Services Incorporated Commercial Services 2,545 69,020 0.92
Cascade Bancorp Banks 9,471 73,021 0.97
Casella Waste Systems Incorporated Environmental Control 5,548 78,282 1.04
Cato Corporation Retail 521 11,441 0.15
CBIZ Incorporated Commercial Services 5,462 74,010 0.98
Charles & Colvard Limited Mining 9,004 8,644 0.11
Cincinnati Bell Incorporated Telecommunications 1,044 18,479 0.25
Collectors Universe Incorporated Commercial Services 1,443 37,662 0.50
Computer Programs & Systems Incorporated Software 1,237 34,636 0.46
Computer Task Group Incorporated Computers 620 3,422 0.05
Cooper-Standard Holdings Incorporated Auto Parts & Equipment 609 67,556 0.90
Core Molding Technologies Incorporated Miscellaneous Manufacturers 2,302 41,045 0.54
CoreSite Realty Corporation REIT 479 43,134 0.57
Covenant Transportation Group Incorporated Transportation 3,349 62,961 0.84
Crawford & Company Insurance 3,742 37,532 0.50
The accompanying notes are an integral part of these financial statements.
China Equity Fund, Emerging Markets Equity Income Fund, Global Focused Equity Fund, Global Opportunity Bond Fund, U.S. Dollar Short-Term Money Market
Fund, U.S. Select Equity Fund, U.S. Short-Term High Yield Bond Fund, U.S. Small Cap Value Fund and USD Investment Grade Credit Fund have not been
authorised by the Hong Kong Securities and Futures Commission and are not available for investment by Hong Kong retail investors.

46 Wells Fargo (Lux) Worldwide Fund Portfolio of investments as at 31 March 2017 (continued)
U.S. SMALL CAP VALUE FUND
Industry Shares
MarketValue
USD
% ofNet
Assets
Transferable securities and money market instruments admitted to an official stock exchange listing or dealt in on another regulatedmarket (continued)
Common Shares (continued)
United States continued
Cross Country Healthcare Incorporated Commercial Services 4,109 59,005 0.78
Crown Crafts Incorporated Textiles 3,554 29,320 0.39
Culp Incorporated Textiles 1,114 34,757 0.46
Customers Bancorp Incorporated Banks 2,300 72,519 0.96
Destination XL Group Incorporated Retail 1,859 5,298 0.07
Diamondback Energy Incorporated Oil & Gas Services 698 72,393 0.96
DineEquity Incorporated Retail 142 7,728 0.10
Donegal Group Incorporated Insurance 2,894 50,992 0.68
DXP Enterprises Incorporated Machinery-Diversified 883 33,439 0.44
Dycom Industries Incorporated Engineering & Construction 749 69,620 0.92
Electro Scientific Industries Incorporated Electronics 3,332 23,224 0.31
EMC Insurance Group Incorporated Insurance 1,777 49,863 0.66
Ennis Incorporated Commercial Services 894 15,198 0.20
Ensign Group Incorporated Healthcare – Services 2,865 53,862 0.71
ePlus Incorporated Internet 513 69,281 0.92
Exactech Incorporated Healthcare – Products 1,981 49,921 0.66
FB Financial Corporation Banks 2,386 84,369 1.12
FBL Financial Group Incorporated Insurance 929 60,803 0.81
Fidelity Southern Corporation Banks 3,402 76,137 1.01
First Business Financial Services Incorporated Banks 2,381 61,811 0.82
First Connecticut Bancorp Incorporated Banks 3,136 77,773 1.03
First Midwest Bancorp Incorporated Banks 2,924 69,240 0.92
First Potomac Realty Trust REIT 3,875 39,835 0.53
Flexsteel Industries Incorporated Home Furnishings 722 36,389 0.48
FormFactor Incorporated Semiconductors 6,483 76,824 1.02
GlobalSCAPE Incorporated Internet 5,807 22,763 0.30
Great Southern Bancorp Incorporated Banks 1,473 74,387 0.99
Greenbrier Cos Incorporated Trucking & Leasing 1,695 73,055 0.97
Gulf Island Fabrication Incorporated Oil & Gas Services 2,594 29,961 0.40
Hackett Group Incorporated Commercial Services 4,011 78,174 1.04
Hain Celestial Group Incorporated Food 1,389 51,671 0.69
Hawaiian Holdings Incorporated Airlines 1,365 63,404 0.84
Helmerich & Payne Incorporated Oil & Gas Services 1,030 68,567 0.91
Heritage Financial Corporation Banks 3,056 75,636 1.00
HomeStreet Incorporated Savings & Loans 2,537 70,909 0.94
Hooker Furniture Corporation Home Furnishings 1,116 34,652 0.46
Horizon Global Corporation Auto Parts & Equipment 217 3,012 0.04
Hudson Technologies Incorporated Environmental Control 6,976 46,042 0.61
ICU Medical Incorporated Healthcare – Products 432 65,966 0.87
Immersion Corporation Computers 2,541 22,005 0.29
Independent Bank Corporation Banks 3,546 73,402 0.97
Ingles Markets Incorporated Food 1,331 57,433 0.76
Investors Title Company Insurance 466 73,698 0.98
John B Sanfilippo & Son Incorporated Food 1,128 82,558 1.09
Johnson Outdoors Incorporated Leisure Time 1,372 50,078 0.66
Kadant Incorporated Machinery-Diversified 1,177 69,855 0.93
Kaiser Aluminum Corporation Mining 944 75,426 1.00
Kelly Services Incorporated Commercial Services 3,437 75,133 1.00
Kindred Healthcare Incorporated Healthcare – Services 1,723 14,387 0.19
Kona Grill Incorporated Retail 1,214 7,648 0.10
Korn/Ferry International Commercial Services 2,336 73,561 0.98
The accompanying notes are an integral part of these financial statements.
China Equity Fund, Emerging Markets Equity Income Fund, Global Focused Equity Fund, Global Opportunity Bond Fund, U.S. Dollar Short-Term Money Market
Fund, U.S. Select Equity Fund, U.S. Short-Term High Yield Bond Fund, U.S. Small Cap Value Fund and USD Investment Grade Credit Fund have not been
authorised by the Hong Kong Securities and Futures Commission and are not available for investment by Hong Kong retail investors.
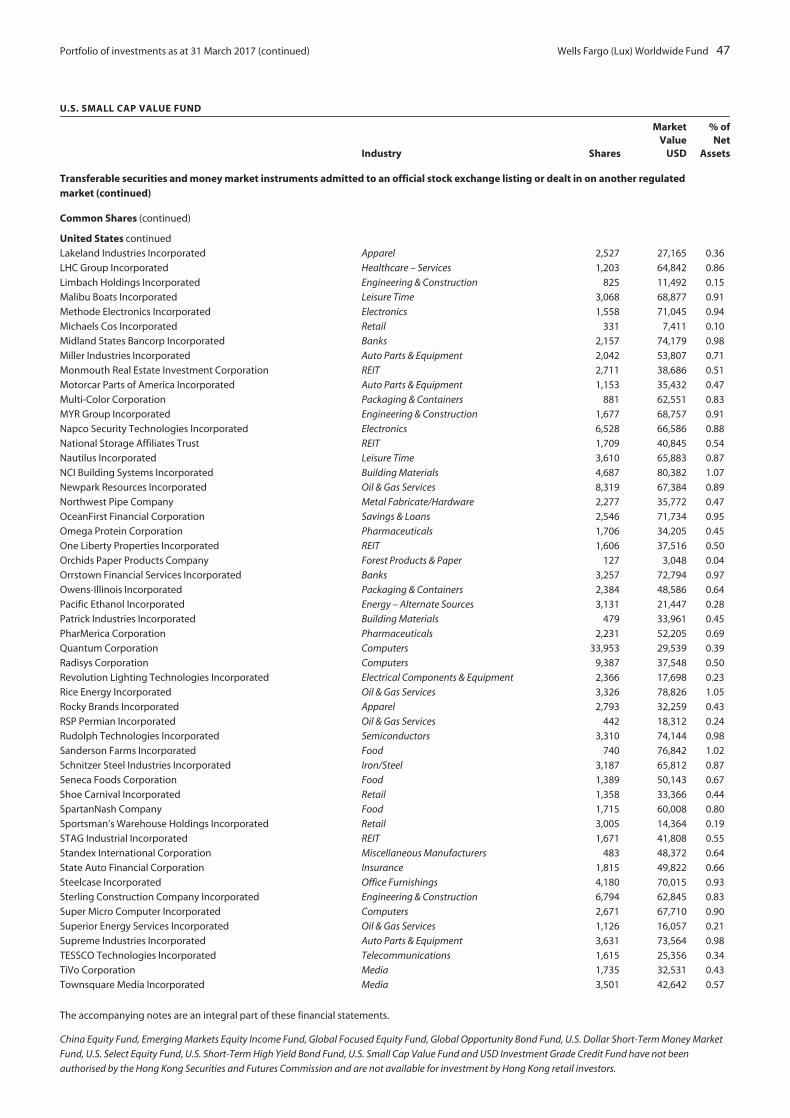
Portfolio of investments as at 31 March 2017 (continued) Wells Fargo (Lux) Worldwide Fund 47
U.S. SMALL CAP VALUE FUND
Industry Shares
MarketValue
USD
% ofNet
Assets
Transferable securities and money market instruments admitted to an official stock exchange listing or dealt in on another regulatedmarket (continued)
Common Shares (continued)
United States continued
Lakeland Industries Incorporated Apparel 2,527 27,165 0.36
LHC Group Incorporated Healthcare – Services 1,203 64,842 0.86
Limbach Holdings Incorporated Engineering & Construction 825 11,492 0.15
Malibu Boats Incorporated Leisure Time 3,068 68,877 0.91
Methode Electronics Incorporated Electronics 1,558 71,045 0.94
Michaels Cos Incorporated Retail 331 7,411 0.10
Midland States Bancorp Incorporated Banks 2,157 74,179 0.98
Miller Industries Incorporated Auto Parts & Equipment 2,042 53,807 0.71
Monmouth Real Estate Investment Corporation REIT 2,711 38,686 0.51
Motorcar Parts of America Incorporated Auto Parts & Equipment 1,153 35,432 0.47
Multi-Color Corporation Packaging & Containers 881 62,551 0.83
MYR Group Incorporated Engineering & Construction 1,677 68,757 0.91
Napco Security Technologies Incorporated Electronics 6,528 66,586 0.88
National Storage Affiliates Trust REIT 1,709 40,845 0.54
Nautilus Incorporated Leisure Time 3,610 65,883 0.87
NCI Building Systems Incorporated Building Materials 4,687 80,382 1.07
Newpark Resources Incorporated Oil & Gas Services 8,319 67,384 0.89
Northwest Pipe Company Metal Fabricate/Hardware 2,277 35,772 0.47
OceanFirst Financial Corporation Savings & Loans 2,546 71,734 0.95
Omega Protein Corporation Pharmaceuticals 1,706 34,205 0.45
One Liberty Properties Incorporated REIT 1,606 37,516 0.50
Orchids Paper Products Company Forest Products & Paper 127 3,048 0.04
Orrstown Financial Services Incorporated Banks 3,257 72,794 0.97
Owens-Illinois Incorporated Packaging & Containers 2,384 48,586 0.64
Pacific Ethanol Incorporated Energy – Alternate Sources 3,131 21,447 0.28
Patrick Industries Incorporated Building Materials 479 33,961 0.45
PharMerica Corporation Pharmaceuticals 2,231 52,205 0.69
Quantum Corporation Computers 33,953 29,539 0.39
Radisys Corporation Computers 9,387 37,548 0.50
Revolution Lighting Technologies Incorporated Electrical Components & Equipment 2,366 17,698 0.23
Rice Energy Incorporated Oil & Gas Services 3,326 78,826 1.05
Rocky Brands Incorporated Apparel 2,793 32,259 0.43
RSP Permian Incorporated Oil & Gas Services 442 18,312 0.24
Rudolph Technologies Incorporated Semiconductors 3,310 74,144 0.98
Sanderson Farms Incorporated Food 740 76,842 1.02
Schnitzer Steel Industries Incorporated Iron/Steel 3,187 65,812 0.87
Seneca Foods Corporation Food 1,389 50,143 0.67
Shoe Carnival Incorporated Retail 1,358 33,366 0.44
SpartanNash Company Food 1,715 60,008 0.80
Sportsman’s Warehouse Holdings Incorporated Retail 3,005 14,364 0.19
STAG Industrial Incorporated REIT 1,671 41,808 0.55
Standex International Corporation Miscellaneous Manufacturers 483 48,372 0.64
State Auto Financial Corporation Insurance 1,815 49,822 0.66
Steelcase Incorporated Office Furnishings 4,180 70,015 0.93
Sterling Construction Company Incorporated Engineering & Construction 6,794 62,845 0.83
Super Micro Computer Incorporated Computers 2,671 67,710 0.90
Superior Energy Services Incorporated Oil & Gas Services 1,126 16,057 0.21
Supreme Industries Incorporated Auto Parts & Equipment 3,631 73,564 0.98
TESSCO Technologies Incorporated Telecommunications 1,615 25,356 0.34
TiVo Corporation Media 1,735 32,531 0.43
Townsquare Media Incorporated Media 3,501 42,642 0.57
The accompanying notes are an integral part of these financial statements.
China Equity Fund, Emerging Markets Equity Income Fund, Global Focused Equity Fund, Global Opportunity Bond Fund, U.S. Dollar Short-Term Money Market
Fund, U.S. Select Equity Fund, U.S. Short-Term High Yield Bond Fund, U.S. Small Cap Value Fund and USD Investment Grade Credit Fund have not been
authorised by the Hong Kong Securities and Futures Commission and are not available for investment by Hong Kong retail investors.

48 Wells Fargo (Lux) Worldwide Fund Portfolio of investments as at 31 March 2017 (continued)
U.S. SMALL CAP VALUE FUND
Industry Shares
MarketValue
USD
% ofNet
Assets
Transferable securities and money market instruments admitted to an official stock exchange listing or dealt in on another regulatedmarket (continued)
Common Shares (continued)
United States continued
TravelCenters of America LLC Retail 2,269 13,841 0.18
Trecora Resources Oil & Gas Services 1,327 14,730 0.20
Tutor Perini Corporation Engineering & Construction 2,198 69,896 0.93
Union Bankshares Corporation Banks 2,176 76,552 1.02
Univest Corporation of Pennsylvania Banks 2,692 69,723 0.92
Urstadt Biddle Properties Incorporated REIT 1,753 36,042 0.48
US Geothermal Incorporated Electric 5,433 22,221 0.29
VeriFone Systems Incorporated Computers 2,311 43,285 0.57
Walker & Dunlop Incorporated Banks 1,620 67,538 0.90
Western Alliance Bancorp Banks 1,560 76,580 1.02
7,115,758 94.35
Total Common Shares 7,529,132 99.83
Total Investments in Securities 7,529,132 99.83
InterestRate
%Nominal
USD
Cash at Banks
Time Deposits
FranceBNP Paribas (o) 0.42 30,469 30,469 0.40
Current Accounts at Bank 26 0.00
Total Cash at Banks 30,495 0.40
Other Assets and Liabilities, Net (17,345) (0.23)
Total Net Assets 7,542,282 100.00
(o) Overnight deposit.
Key: ADR American Depositary Receipt
REIT Real Estate Investment Trust
USD United States Dollar
The securities have been classified based upon country of incorporation/domiciliation.
The accompanying notes are an integral part of these financial statements.
China Equity Fund, Emerging Markets Equity Income Fund, Global Focused Equity Fund, Global Opportunity Bond Fund, U.S. Dollar Short-Term Money Market
Fund, U.S. Select Equity Fund, U.S. Short-Term High Yield Bond Fund, U.S. Small Cap Value Fund and USD Investment Grade Credit Fund have not been
authorised by the Hong Kong Securities and Futures Commission and are not available for investment by Hong Kong retail investors.

Portfolio of investments as at 31 March 2017 Wells Fargo (Lux) Worldwide Fund 49
USD INVESTMENT GRADE CREDIT FUND
InterestRate
%Maturity
Date IndustryNominal
USD
MarketValue
USD
% ofNet
Assets
Transferable securities and money market instruments admitted to an official stock exchange listing or dealt in on another regulated market
Corporate Bonds and Notes
AustraliaMacquarie Bank Limited ±^ 6.13 8/3/2027 Banks 800,000 804,000 0.80
BermudaAllied World Assurance Company Holdings
Limited 4.35 29/10/2025 Insurance 1,000,000 1,001,062 1.00
Validus Holdings Limited 8.88 26/1/2040 Insurance 725,000 1,009,977 1.00
2,011,039 2.00
Cayman IslandsXLIT Limited 4.45 31/3/2025 Insurance 200,000 201,766 0.20
XLIT Limited 5.50 31/3/2045 Insurance 1,250,000 1,248,841 1.24
1,450,607 1.44
FranceBPCE SA 4.50 15/3/2025 Banks 650,000 639,386 0.63
Credit Agricole SA 2.38 1/7/2021 Banks 830,000 813,191 0.81
1,452,577 1.44
GuernseyCredit Suisse Group Funding Guernsey Limited 3.75 26/3/2025 Banks 850,000 836,138 0.83
IrelandShire Acquisitions Investments Ireland DAC 2.40 23/9/2021 Pharmaceuticals 710,000 695,294 0.69
JapanMitsubishi UFJ Financial Group Incorporated 2.95 1/3/2021 Banks 430,000 433,835 0.43
Sumitomo Mitsui Financial Group Incorporated 2.85 11/1/2022 Banks 500,000 500,780 0.50
934,615 0.93
LuxembourgSES SA 3.60 4/4/2023 Telecommunications 875,000 859,337 0.85
NetherlandsING Groep NV 2.30 29/3/2022 Banks 650,000 650,972 0.65
Shell International Finance BV 3.25 11/5/2025 Oil & Gas Services 240,000 242,307 0.24
Shell International Finance BV 4.00 10/5/2046 Oil & Gas Services 320,000 307,623 0.30
1,200,902 1.19
SingaporeFlex Limited 5.00 15/2/2023 Electronics 900,000 961,324 0.96
SwitzerlandUBS Group Funding Switzerland AG 2.38 23/5/2023 Diversified Financial Services 1,450,000 1,453,205 1.45
United KingdomBP Capital Markets plc 2.75 10/5/2023 Oil & Gas Services 470,000 464,054 0.46
HSBC Holdings plc ±^ 6.38 30/3/2025 Banks 1,250,000 1,271,875 1.26
Invesco Finance plc 3.75 15/1/2026 Diversified Financial Services 750,000 771,209 0.77
Royal Bank of Scotland Group plc 3.88 12/9/2023 Banks 1,210,000 1,192,358 1.19
Santander UK Group Holdings plc 3.57 10/1/2023 Banks 890,000 889,865 0.88
4,589,361 4.56
The accompanying notes are an integral part of these financial statements.
China Equity Fund, Emerging Markets Equity Income Fund, Global Focused Equity Fund, Global Opportunity Bond Fund, U.S. Dollar Short-Term Money Market
Fund, U.S. Select Equity Fund, U.S. Short-Term High Yield Bond Fund, U.S. Small Cap Value Fund and USD Investment Grade Credit Fund have not been
authorised by the Hong Kong Securities and Futures Commission and are not available for investment by Hong Kong retail investors.

50 Wells Fargo (Lux) Worldwide Fund Portfolio of investments as at 31 March 2017 (continued)
USD INVESTMENT GRADE CREDIT FUND
InterestRate
%Maturity
Date IndustryNominal
USD
MarketValue
USD
% ofNet
Assets
Transferable securities and money market instruments admitted to an official stock exchange listing or dealt in on another regulatedmarket (continued)
Corporate Bonds and Notes (continued)
United States21st Century Fox America Incorporated 4.75 15/11/2046 Media 530,000 531,085 0.53
Abbott Laboratories 4.90 30/11/2046 Healthcare – Products 480,000 497,675 0.49
AbbVie Incorporated 4.45 14/5/2046 Pharmaceuticals 320,000 306,088 0.30
Air Lease Corporation 3.00 15/9/2023 Diversified Financial Services 560,000 547,158 0.54
American Airlines Class AA Pass-Through Trust 3.60 22/9/2027 Airlines 1,060,279 1,066,111 1.06
American Tower Corporation 2.25 15/1/2022 REIT 600,000 578,959 0.58
Analog Devices Incorporated 4.50 5/12/2036 Semiconductors 820,000 820,335 0.82
Anheuser-Busch InBev Finance Incorporated 3.65 1/2/2026 Beverages 2,270,000 2,295,197 2.28
Apple Incorporated 4.25 9/2/2047 Computers 925,000 935,864 0.93
Arch Capital Finance LLC 5.03 15/12/2046 Insurance 970,000 1,037,178 1.03
Arrow Electronics Incorporated 3.50 1/4/2022 Electronics 500,000 503,915 0.50
Arrow Electronics Incorporated 4.50 1/3/2023 Electronics 500,000 519,642 0.52
AT&T Incorporated 3.40 15/5/2025 Telecommunications 560,000 541,867 0.54
AT&T Incorporated 4.75 15/5/2046 Telecommunications 970,000 907,962 0.90
AT&T Incorporated 5.45 1/3/2047 Telecommunications 450,000 458,176 0.46
Aviation Capital Group Corporation 2.88 20/1/2022 Trucking & Leasing 1,500,000 1,489,464 1.48
Bank of America Corporation 2.63 19/4/2021 Banks 950,000 947,576 0.94
Bank of America Corporation 3.50 19/4/2026 Banks 1,100,000 1,085,135 1.08
Bank of America Corporation ± 3.82 20/1/2028 Banks 2,000,000 2,004,066 1.99
BB&T Corporation 2.63 29/6/2020 Banks 830,000 838,364 0.83
Berkshire Hathaway Incorporated 3.13 15/3/2026 Insurance 560,000 559,405 0.56
Branch Banking & Trust Company 1.48 15/1/2020 Banks 2,000,000 2,004,338 1.99
CA Incorporated 5.38 1/12/2019 Software 710,000 767,019 0.76
CBOE Holdings Incorporated 3.65 12/1/2027 Diversified Financial Services 910,000 914,770 0.91
CBS Corporation 2.90 15/1/2027 Media 450,000 419,074 0.42
Charter Communications Operating LLC 4.91 23/7/2025 Media 970,000 1,024,250 1.02
Chubb Corporation ± 6.38 15/4/2037 Insurance 1,000,000 967,400 0.96
Chubb INA Holdings Incorporated 3.35 3/5/2026 Insurance 590,000 596,761 0.59
Citigroup Incorporated 2.65 26/10/2020 Banks 470,000 472,979 0.47
Citigroup Incorporated 3.40 1/5/2026 Banks 950,000 924,090 0.92
Comcast Corporation 3.38 15/8/2025 Media 470,000 474,177 0.47
Continental Airlines Class A Pass-Through Trust 4.00 29/10/2024 Airlines 211,800 220,007 0.22
Crown Castle International Corporation 3.70 15/6/2026 REIT 625,000 613,277 0.61
Cytec Industries Incorporated 3.95 1/5/2025 Chemicals 950,000 955,290 0.95
Diamond 1 Finance Corporation 4.42 15/6/2021 Computers 920,000 961,994 0.96
Energy Transfer Partners LP 6.50 1/2/2042 Pipelines 1,000,000 1,079,294 1.07
EnLink Midstream Partners LP 4.15 1/6/2025 Pipelines 500,000 493,939 0.49
Five Corners Funding Trust 4.42 15/11/2023 Insurance 1,980,000 2,104,661 2.09
Ford Motor Credit Company LLC 3.22 9/1/2022 Auto Manufacturers 1,190,000 1,197,148 1.19
General Motors Financial Company
Incorporated 4.00 15/1/2025 Diversified Financial Services 890,000 894,384 0.89
Goldman Sachs Group Incorporated 2.63 25/4/2021 Banks 970,000 967,252 0.96
Goldman Sachs Group Incorporated 3.63 22/1/2023 Banks 790,000 809,752 0.81
Goldman Sachs Group Incorporated 3.85 26/1/2027 Banks 1,250,000 1,255,712 1.25
Great Plains Energy Incorporated 4.85 1/4/2047 Electric 750,000 768,653 0.76
Huntington Bancshares Incorporated 3.15 14/3/2021 Banks 800,000 813,761 0.81
Hyundai Capital America 1.94 3/4/2020 Auto Manufacturers 650,000 650,761 0.65
Intercontinental Exchange Incorporated 2.75 1/12/2020 Diversified Financial Services 710,000 721,246 0.72
International Lease Finance Corporation 5.88 15/8/2022 Diversified Financial Services 1,200,000 1,334,896 1.33
JPMorgan Chase & Company 2.40 7/6/2021 Banks 1,110,000 1,103,578 1.10
JPMorgan Chase & Company 2.95 1/10/2026 Banks 710,000 674,976 0.67
The accompanying notes are an integral part of these financial statements.
China Equity Fund, Emerging Markets Equity Income Fund, Global Focused Equity Fund, Global Opportunity Bond Fund, U.S. Dollar Short-Term Money Market
Fund, U.S. Select Equity Fund, U.S. Short-Term High Yield Bond Fund, U.S. Small Cap Value Fund and USD Investment Grade Credit Fund have not been
authorised by the Hong Kong Securities and Futures Commission and are not available for investment by Hong Kong retail investors.
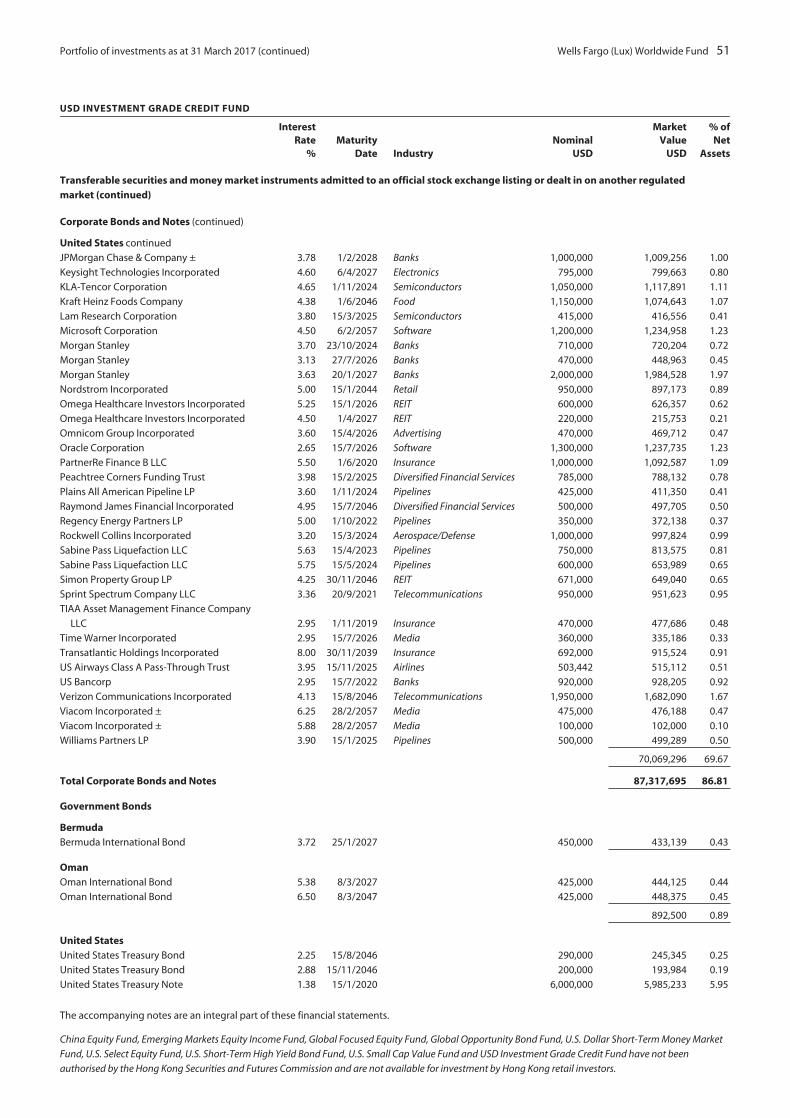
Portfolio of investments as at 31 March 2017 (continued) Wells Fargo (Lux) Worldwide Fund 51
USD INVESTMENT GRADE CREDIT FUND
InterestRate
%Maturity
Date IndustryNominal
USD
MarketValue
USD
% ofNet
Assets
Transferable securities and money market instruments admitted to an official stock exchange listing or dealt in on another regulatedmarket (continued)
Corporate Bonds and Notes (continued)
United States continued
JPMorgan Chase & Company ± 3.78 1/2/2028 Banks 1,000,000 1,009,256 1.00
Keysight Technologies Incorporated 4.60 6/4/2027 Electronics 795,000 799,663 0.80
KLA-Tencor Corporation 4.65 1/11/2024 Semiconductors 1,050,000 1,117,891 1.11
Kraft Heinz Foods Company 4.38 1/6/2046 Food 1,150,000 1,074,643 1.07
Lam Research Corporation 3.80 15/3/2025 Semiconductors 415,000 416,556 0.41
Microsoft Corporation 4.50 6/2/2057 Software 1,200,000 1,234,958 1.23
Morgan Stanley 3.70 23/10/2024 Banks 710,000 720,204 0.72
Morgan Stanley 3.13 27/7/2026 Banks 470,000 448,963 0.45
Morgan Stanley 3.63 20/1/2027 Banks 2,000,000 1,984,528 1.97
Nordstrom Incorporated 5.00 15/1/2044 Retail 950,000 897,173 0.89
Omega Healthcare Investors Incorporated 5.25 15/1/2026 REIT 600,000 626,357 0.62
Omega Healthcare Investors Incorporated 4.50 1/4/2027 REIT 220,000 215,753 0.21
Omnicom Group Incorporated 3.60 15/4/2026 Advertising 470,000 469,712 0.47
Oracle Corporation 2.65 15/7/2026 Software 1,300,000 1,237,735 1.23
PartnerRe Finance B LLC 5.50 1/6/2020 Insurance 1,000,000 1,092,587 1.09
Peachtree Corners Funding Trust 3.98 15/2/2025 Diversified Financial Services 785,000 788,132 0.78
Plains All American Pipeline LP 3.60 1/11/2024 Pipelines 425,000 411,350 0.41
Raymond James Financial Incorporated 4.95 15/7/2046 Diversified Financial Services 500,000 497,705 0.50
Regency Energy Partners LP 5.00 1/10/2022 Pipelines 350,000 372,138 0.37
Rockwell Collins Incorporated 3.20 15/3/2024 Aerospace/Defense 1,000,000 997,824 0.99
Sabine Pass Liquefaction LLC 5.63 15/4/2023 Pipelines 750,000 813,575 0.81
Sabine Pass Liquefaction LLC 5.75 15/5/2024 Pipelines 600,000 653,989 0.65
Simon Property Group LP 4.25 30/11/2046 REIT 671,000 649,040 0.65
Sprint Spectrum Company LLC 3.36 20/9/2021 Telecommunications 950,000 951,623 0.95
TIAA Asset Management Finance Company
LLC 2.95 1/11/2019 Insurance 470,000 477,686 0.48
Time Warner Incorporated 2.95 15/7/2026 Media 360,000 335,186 0.33
Transatlantic Holdings Incorporated 8.00 30/11/2039 Insurance 692,000 915,524 0.91
US Airways Class A Pass-Through Trust 3.95 15/11/2025 Airlines 503,442 515,112 0.51
US Bancorp 2.95 15/7/2022 Banks 920,000 928,205 0.92
Verizon Communications Incorporated 4.13 15/8/2046 Telecommunications 1,950,000 1,682,090 1.67
Viacom Incorporated ± 6.25 28/2/2057 Media 475,000 476,188 0.47
Viacom Incorporated ± 5.88 28/2/2057 Media 100,000 102,000 0.10
Williams Partners LP 3.90 15/1/2025 Pipelines 500,000 499,289 0.50
70,069,296 69.67
Total Corporate Bonds and Notes 87,317,695 86.81
Government Bonds
BermudaBermuda International Bond 3.72 25/1/2027 450,000 433,139 0.43
OmanOman International Bond 5.38 8/3/2027 425,000 444,125 0.44
Oman International Bond 6.50 8/3/2047 425,000 448,375 0.45
892,500 0.89
United StatesUnited States Treasury Bond 2.25 15/8/2046 290,000 245,345 0.25
United States Treasury Bond 2.88 15/11/2046 200,000 193,984 0.19
United States Treasury Note 1.38 15/1/2020 6,000,000 5,985,233 5.95
The accompanying notes are an integral part of these financial statements.
China Equity Fund, Emerging Markets Equity Income Fund, Global Focused Equity Fund, Global Opportunity Bond Fund, U.S. Dollar Short-Term Money Market
Fund, U.S. Select Equity Fund, U.S. Short-Term High Yield Bond Fund, U.S. Small Cap Value Fund and USD Investment Grade Credit Fund have not been
authorised by the Hong Kong Securities and Futures Commission and are not available for investment by Hong Kong retail investors.

52 Wells Fargo (Lux) Worldwide Fund Portfolio of investments as at 31 March 2017 (continued)
USD INVESTMENT GRADE CREDIT FUND
InterestRate
%Maturity
DateNominal
USD
MarketValue
USD
% ofNet
Assets
Transferable securities and money market instruments admitted to an official stock exchange listing or dealt in on another regulatedmarket (continued)
Government Bonds (continued)
United States continued
United States Treasury Note 2.00 31/12/2021 1,400,000 1,405,250 1.40
United States Treasury Note 1.88 31/1/2022 780,000 778,232 0.77
United States Treasury Note 2.00 15/11/2026 175,000 169,012 0.17
United States Treasury Note 2.25 15/2/2027 1,100,000 1,085,820 1.08
9,862,876 9.81
Total Government Bonds 11,188,515 11.13
Municipal Obligations
United StatesCity of Chicago IL 7.05 1/1/2029 1,000,000 1,018,971 1.01
Total Municipal Obligations 1,018,971 1.01
Total Investments in Securities 99,525,181 98.95
Cash at Banks
Time Deposits
United StatesJP Morgan Chase (o) 0.42 3,854,428 3,854,428 3.83
Current Accounts at Bank 945 0.00
Total Cash at Banks 3,855,373 3.83
Other Assets and Liabilities, Net (2,799,894) (2.78)
Total Net Assets 100,580,660 100.00
± Variable rate investment. The rate shown is the rate in effect at year end.^ Investment is perpetual and, thus, does not have a predetermined maturity date. The date shown reflects the next call date.(o) Overnght deposit.
Key: USD United States Dollar
The securities have been classified based upon country of incorporation/domiciliation.
The accompanying notes are an integral part of these financial statements.
China Equity Fund, Emerging Markets Equity Income Fund, Global Focused Equity Fund, Global Opportunity Bond Fund, U.S. Dollar Short-Term Money Market
Fund, U.S. Select Equity Fund, U.S. Short-Term High Yield Bond Fund, U.S. Small Cap Value Fund and USD Investment Grade Credit Fund have not been
authorised by the Hong Kong Securities and Futures Commission and are not available for investment by Hong Kong retail investors.

[THIS PAGE INTENTIONALLY LEFT BLANK]

54 Wells Fargo (Lux) Worldwide Fund Statement of assets and liabilities
as at 31 March 2017
ChinaEquity
FundUSD
EmergingMarkets
EquityFund
USD
EmergingMarkets
EquityIncome
FundUSD
GlobalEquity
FundUSD
GlobalFocused
EquityFund
USD
GlobalOpportunity
BondFund
USD
AssetsInvestments in securities, at cost . . . . . . . . . . . . . . . . . . . . . 56,021,278 224,945,500 358,107,182 112,208,107 10,090,082 85,607,306Unrealised appreciation/(depreciation) . . . . . . . . . . . . . . . 5,350,124 15,566,063 23,215,981 9,740,529 1,497,740 (1,124,713)
Investments in securities, at market value . . . . . . . . . . . . . 61,371,402 240,511,563 381,323,163 121,948,636 11,587,822 84,482,593Cash at banks . . . . . . . . . . . . . . . . . . . . . . . . . . . . . . . . . . . . . 1,152,166 9,128,722 22,629,519 542,836 778,069 2,306,814Receivable from reverse repurchase agreements . . . . . . 0 0 0 0 0 0Unrealised appreciation on open forward foreign
currency contracts . . . . . . . . . . . . . . . . . . . . . . . . . . . . . . . 0 0 0 0 0 77,211Interest receivable . . . . . . . . . . . . . . . . . . . . . . . . . . . . . . . . . 0 0 0 0 0 706,142Dividends receivable . . . . . . . . . . . . . . . . . . . . . . . . . . . . . . . 0 500,555 1,542,226 213,235 47,762 0Receivable for investments sold . . . . . . . . . . . . . . . . . . . . . 118,364 2,392,070 2,462,124 359,330 0 0Receivable for shares issued . . . . . . . . . . . . . . . . . . . . . . . . . 5,065 51,291 4,938,666 0 0 46,789Formation expenses . . . . . . . . . . . . . . . . . . . . . . . . . . . . . . . . 0 0 1,356 0 46,742 1,364Receivable from investment manager . . . . . . . . . . . . . . . . 0 0 0 0 12,257 0
Total assets . . . . . . . . . . . . . . . . . . . . . . . . . . . . . . . . . . . . . . . . 62,646,997 252,584,201 412,897,054 123,064,037 12,472,652 87,620,913
LiabilitiesDistributions payable . . . . . . . . . . . . . . . . . . . . . . . . . . . . . . . 0 0 0 0 0 0Payable for investments purchased . . . . . . . . . . . . . . . . . . 169,271 3,611 2,675,910 0 239,396 106,213Payable for shares redeemed . . . . . . . . . . . . . . . . . . . . . . . . 103,116 62,481 1,020 0 0 1,664Payable for investment management fees . . . . . . . . . . . . 31,395 254,084 374,946 87,940 0 17,728Depositary and administration fees payable . . . . . . . . . . 25,311 52,678 97,774 10,105 9,183 44,777Unrealised depreciation on open forward foreign
currency contracts . . . . . . . . . . . . . . . . . . . . . . . . . . . . . . . 0 0 0 0 78,278 1,204,139Subscription tax payable . . . . . . . . . . . . . . . . . . . . . . . . . . . . 2,939 6,419 10,086 3,015 293 6,296Other liabilities . . . . . . . . . . . . . . . . . . . . . . . . . . . . . . . . . . . . 43,110 56,339 106,341 34,142 65,129 40,709
Total liabilities . . . . . . . . . . . . . . . . . . . . . . . . . . . . . . . . . . . . . 375,142 435,612 3,266,077 135,202 392,279 1,421,526
Total net assets . . . . . . . . . . . . . . . . . . . . . . . . . . . . . . . . . . . . . 62,271,855 252,148,589 409,630,977 122,928,835 12,080,373 86,199,387
The accompanying notes are an integral part of these financial statements.
China Equity Fund, Emerging Markets Equity Income Fund, Global Focused Equity Fund, Global Opportunity Bond Fund, U.S. Dollar Short-Term Money Market
Fund, U.S. Select Equity Fund, U.S. Short-Term High Yield Bond Fund, U.S. Small Cap Value Fund and USD Investment Grade Credit Fund have not been
authorised by the Hong Kong Securities and Futures Commission and are not available for investment by Hong Kong retail investors.
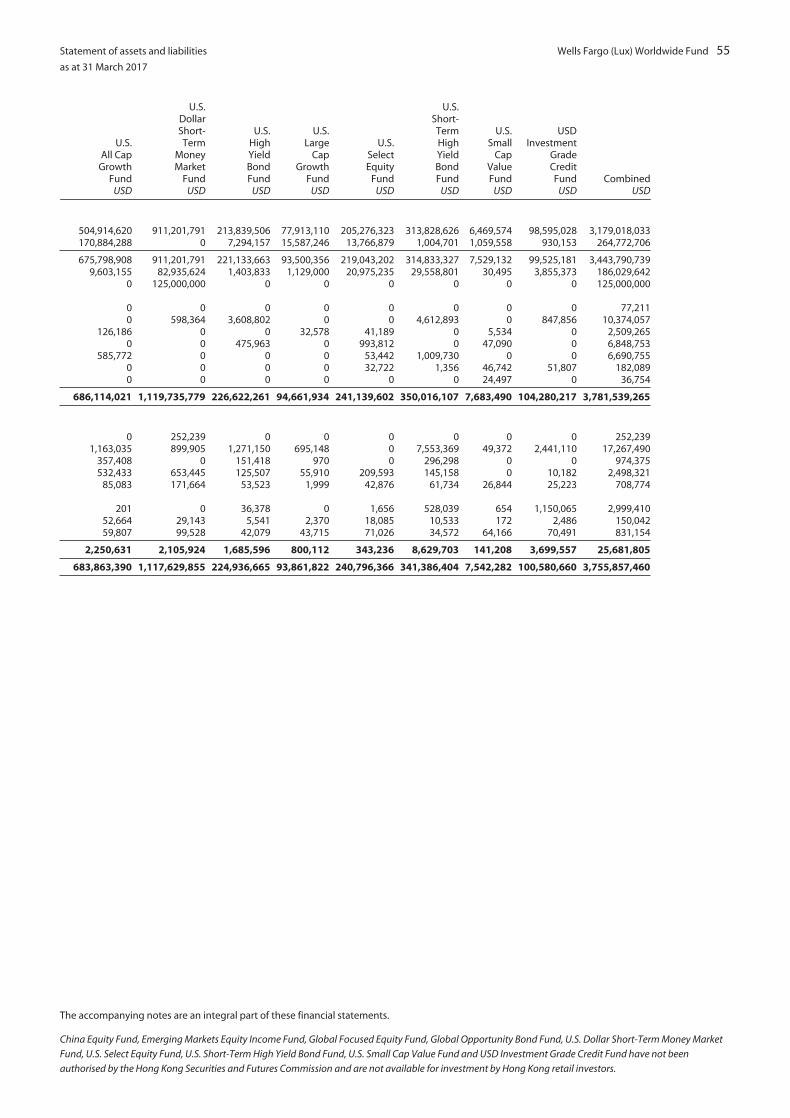
Statement of assets and liabilities
as at 31 March 2017
Wells Fargo (Lux) Worldwide Fund 55
U.S.All Cap
GrowthFund
USD
U.S.DollarShort-Term
MoneyMarket
FundUSD
U.S.HighYieldBondFund
USD
U.S.Large
CapGrowth
FundUSD
U.S.SelectEquity
FundUSD
U.S.Short-TermHighYieldBondFund
USD
U.S.Small
CapValueFund
USD
USDInvestment
GradeCreditFund
USDCombined
USD
504,914,620 911,201,791 213,839,506 77,913,110 205,276,323 313,828,626 6,469,574 98,595,028 3,179,018,033170,884,288 0 7,294,157 15,587,246 13,766,879 1,004,701 1,059,558 930,153 264,772,706
675,798,908 911,201,791 221,133,663 93,500,356 219,043,202 314,833,327 7,529,132 99,525,181 3,443,790,7399,603,155 82,935,624 1,403,833 1,129,000 20,975,235 29,558,801 30,495 3,855,373 186,029,642
0 125,000,000 0 0 0 0 0 0 125,000,000
0 0 0 0 0 0 0 0 77,2110 598,364 3,608,802 0 0 4,612,893 0 847,856 10,374,057
126,186 0 0 32,578 41,189 0 5,534 0 2,509,2650 0 475,963 0 993,812 0 47,090 0 6,848,753
585,772 0 0 0 53,442 1,009,730 0 0 6,690,7550 0 0 0 32,722 1,356 46,742 51,807 182,0890 0 0 0 0 0 24,497 0 36,754
686,114,021 1,119,735,779 226,622,261 94,661,934 241,139,602 350,016,107 7,683,490 104,280,217 3,781,539,265
0 252,239 0 0 0 0 0 0 252,2391,163,035 899,905 1,271,150 695,148 0 7,553,369 49,372 2,441,110 17,267,490
357,408 0 151,418 970 0 296,298 0 0 974,375532,433 653,445 125,507 55,910 209,593 145,158 0 10,182 2,498,321
85,083 171,664 53,523 1,999 42,876 61,734 26,844 25,223 708,774
201 0 36,378 0 1,656 528,039 654 1,150,065 2,999,41052,664 29,143 5,541 2,370 18,085 10,533 172 2,486 150,04259,807 99,528 42,079 43,715 71,026 34,572 64,166 70,491 831,154
2,250,631 2,105,924 1,685,596 800,112 343,236 8,629,703 141,208 3,699,557 25,681,805
683,863,390 1,117,629,855 224,936,665 93,861,822 240,796,366 341,386,404 7,542,282 100,580,660 3,755,857,460
The accompanying notes are an integral part of these financial statements.
China Equity Fund, Emerging Markets Equity Income Fund, Global Focused Equity Fund, Global Opportunity Bond Fund, U.S. Dollar Short-Term Money Market
Fund, U.S. Select Equity Fund, U.S. Short-Term High Yield Bond Fund, U.S. Small Cap Value Fund and USD Investment Grade Credit Fund have not been
authorised by the Hong Kong Securities and Futures Commission and are not available for investment by Hong Kong retail investors.
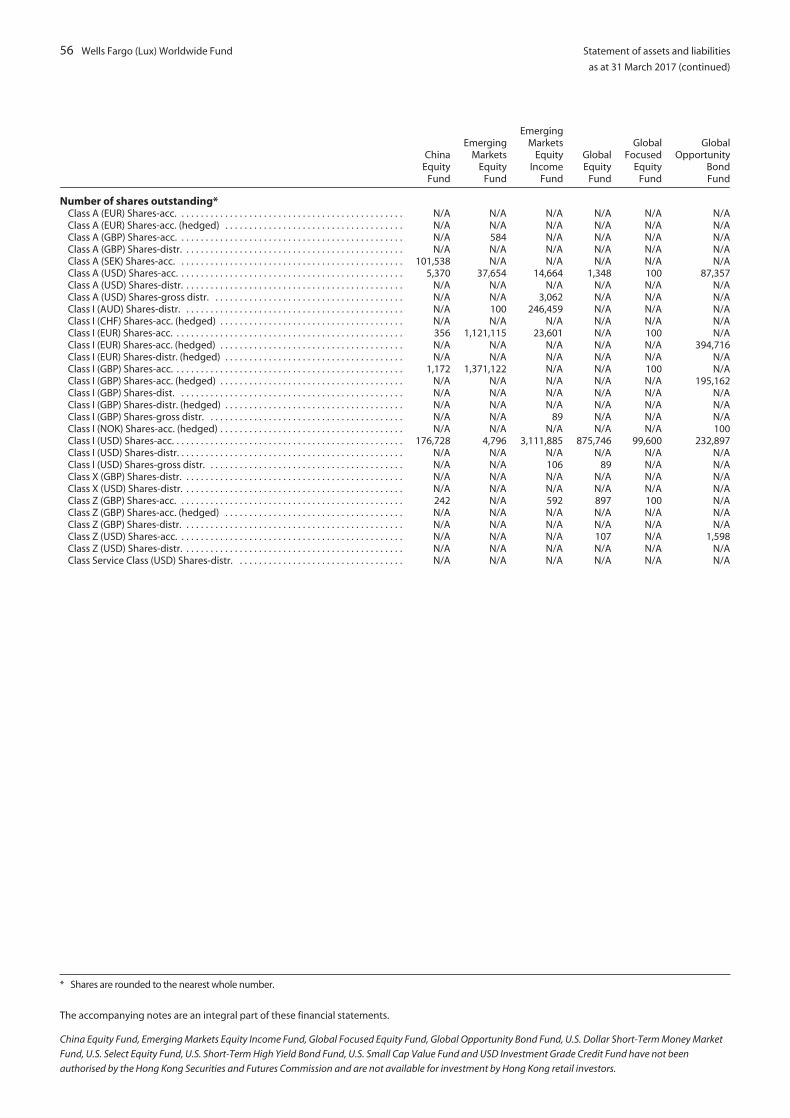
56 Wells Fargo (Lux) Worldwide Fund Statement of assets and liabilities
as at 31 March 2017 (continued)
ChinaEquity
Fund
EmergingMarkets
EquityFund
EmergingMarkets
EquityIncome
Fund
GlobalEquity
Fund
GlobalFocused
EquityFund
GlobalOpportunity
BondFund
Number of shares outstanding*Class A (EUR) Shares-acc. . . . . . . . . . . . . . . . . . . . . . . . . . . . . . . . . . . . . . . . . . . . . . . N/A N/A N/A N/A N/A N/AClass A (EUR) Shares-acc. (hedged) . . . . . . . . . . . . . . . . . . . . . . . . . . . . . . . . . . . . . N/A N/A N/A N/A N/A N/AClass A (GBP) Shares-acc. . . . . . . . . . . . . . . . . . . . . . . . . . . . . . . . . . . . . . . . . . . . . . . N/A 584 N/A N/A N/A N/AClass A (GBP) Shares-distr. . . . . . . . . . . . . . . . . . . . . . . . . . . . . . . . . . . . . . . . . . . . . . N/A N/A N/A N/A N/A N/AClass A (SEK) Shares-acc. . . . . . . . . . . . . . . . . . . . . . . . . . . . . . . . . . . . . . . . . . . . . . . 101,538 N/A N/A N/A N/A N/AClass A (USD) Shares-acc. . . . . . . . . . . . . . . . . . . . . . . . . . . . . . . . . . . . . . . . . . . . . . . 5,370 37,654 14,664 1,348 100 87,357Class A (USD) Shares-distr. . . . . . . . . . . . . . . . . . . . . . . . . . . . . . . . . . . . . . . . . . . . . . N/A N/A N/A N/A N/A N/AClass A (USD) Shares-gross distr. . . . . . . . . . . . . . . . . . . . . . . . . . . . . . . . . . . . . . . . N/A N/A 3,062 N/A N/A N/AClass I (AUD) Shares-distr. . . . . . . . . . . . . . . . . . . . . . . . . . . . . . . . . . . . . . . . . . . . . . N/A 100 246,459 N/A N/A N/AClass I (CHF) Shares-acc. (hedged) . . . . . . . . . . . . . . . . . . . . . . . . . . . . . . . . . . . . . . N/A N/A N/A N/A N/A N/AClass I (EUR) Shares-acc. . . . . . . . . . . . . . . . . . . . . . . . . . . . . . . . . . . . . . . . . . . . . . . . 356 1,121,115 23,601 N/A 100 N/AClass I (EUR) Shares-acc. (hedged) . . . . . . . . . . . . . . . . . . . . . . . . . . . . . . . . . . . . . . N/A N/A N/A N/A N/A 394,716Class I (EUR) Shares-distr. (hedged) . . . . . . . . . . . . . . . . . . . . . . . . . . . . . . . . . . . . . N/A N/A N/A N/A N/A N/AClass I (GBP) Shares-acc. . . . . . . . . . . . . . . . . . . . . . . . . . . . . . . . . . . . . . . . . . . . . . . . 1,172 1,371,122 N/A N/A 100 N/AClass I (GBP) Shares-acc. (hedged) . . . . . . . . . . . . . . . . . . . . . . . . . . . . . . . . . . . . . . N/A N/A N/A N/A N/A 195,162Class I (GBP) Shares-dist. . . . . . . . . . . . . . . . . . . . . . . . . . . . . . . . . . . . . . . . . . . . . . . N/A N/A N/A N/A N/A N/AClass I (GBP) Shares-distr. (hedged) . . . . . . . . . . . . . . . . . . . . . . . . . . . . . . . . . . . . . N/A N/A N/A N/A N/A N/AClass I (GBP) Shares-gross distr. . . . . . . . . . . . . . . . . . . . . . . . . . . . . . . . . . . . . . . . . N/A N/A 89 N/A N/A N/AClass I (NOK) Shares-acc. (hedged) . . . . . . . . . . . . . . . . . . . . . . . . . . . . . . . . . . . . . . N/A N/A N/A N/A N/A 100Class I (USD) Shares-acc. . . . . . . . . . . . . . . . . . . . . . . . . . . . . . . . . . . . . . . . . . . . . . . . 176,728 4,796 3,111,885 875,746 99,600 232,897Class I (USD) Shares-distr. . . . . . . . . . . . . . . . . . . . . . . . . . . . . . . . . . . . . . . . . . . . . . . N/A N/A N/A N/A N/A N/AClass I (USD) Shares-gross distr. . . . . . . . . . . . . . . . . . . . . . . . . . . . . . . . . . . . . . . . . N/A N/A 106 89 N/A N/AClass X (GBP) Shares-distr. . . . . . . . . . . . . . . . . . . . . . . . . . . . . . . . . . . . . . . . . . . . . . N/A N/A N/A N/A N/A N/AClass X (USD) Shares-distr. . . . . . . . . . . . . . . . . . . . . . . . . . . . . . . . . . . . . . . . . . . . . . N/A N/A N/A N/A N/A N/AClass Z (GBP) Shares-acc. . . . . . . . . . . . . . . . . . . . . . . . . . . . . . . . . . . . . . . . . . . . . . . 242 N/A 592 897 100 N/AClass Z (GBP) Shares-acc. (hedged) . . . . . . . . . . . . . . . . . . . . . . . . . . . . . . . . . . . . . N/A N/A N/A N/A N/A N/AClass Z (GBP) Shares-distr. . . . . . . . . . . . . . . . . . . . . . . . . . . . . . . . . . . . . . . . . . . . . . N/A N/A N/A N/A N/A N/AClass Z (USD) Shares-acc. . . . . . . . . . . . . . . . . . . . . . . . . . . . . . . . . . . . . . . . . . . . . . . N/A N/A N/A 107 N/A 1,598Class Z (USD) Shares-distr. . . . . . . . . . . . . . . . . . . . . . . . . . . . . . . . . . . . . . . . . . . . . . N/A N/A N/A N/A N/A N/AClass Service Class (USD) Shares-distr. . . . . . . . . . . . . . . . . . . . . . . . . . . . . . . . . . . N/A N/A N/A N/A N/A N/A
* Shares are rounded to the nearest whole number.
The accompanying notes are an integral part of these financial statements.
China Equity Fund, Emerging Markets Equity Income Fund, Global Focused Equity Fund, Global Opportunity Bond Fund, U.S. Dollar Short-Term Money Market
Fund, U.S. Select Equity Fund, U.S. Short-Term High Yield Bond Fund, U.S. Small Cap Value Fund and USD Investment Grade Credit Fund have not been
authorised by the Hong Kong Securities and Futures Commission and are not available for investment by Hong Kong retail investors.
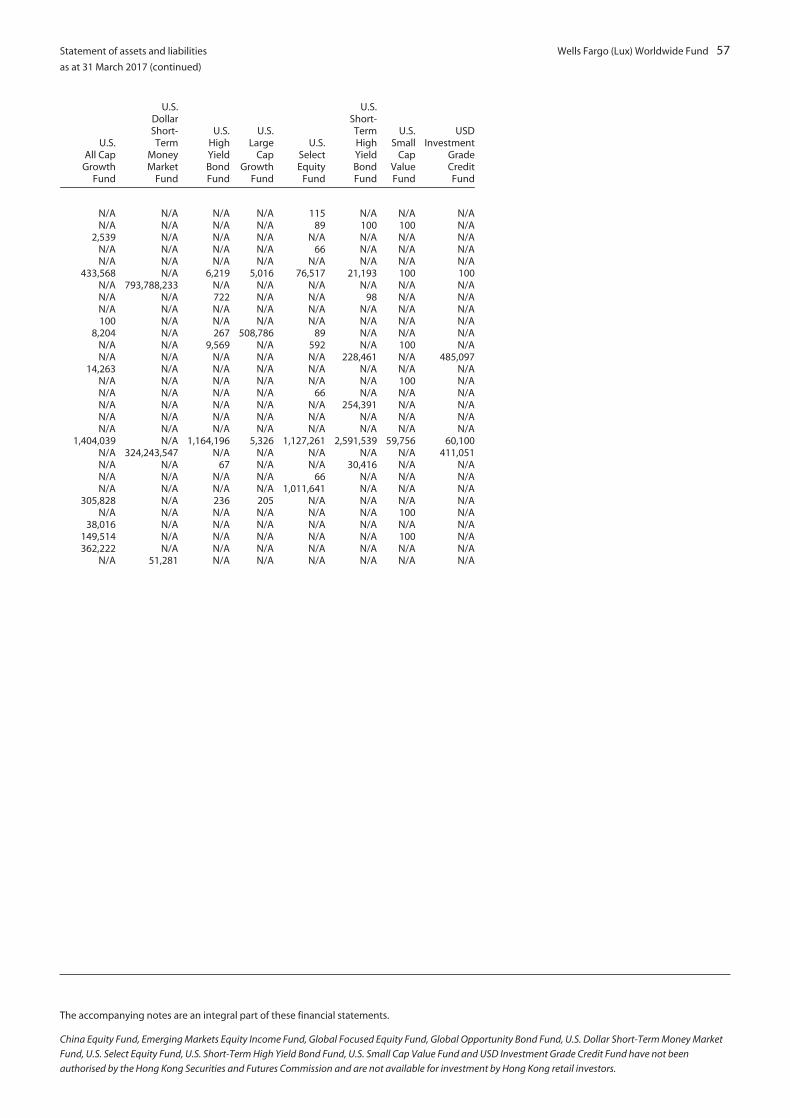
Statement of assets and liabilities
as at 31 March 2017 (continued)
Wells Fargo (Lux) Worldwide Fund 57
U.S.All Cap
GrowthFund
U.S.DollarShort-Term
MoneyMarket
Fund
U.S.HighYieldBondFund
U.S.Large
CapGrowth
Fund
U.S.SelectEquity
Fund
U.S.Short-TermHighYieldBondFund
U.S.Small
CapValueFund
USDInvestment
GradeCreditFund
N/A N/A N/A N/A 115 N/A N/A N/AN/A N/A N/A N/A 89 100 100 N/A
2,539 N/A N/A N/A N/A N/A N/A N/AN/A N/A N/A N/A 66 N/A N/A N/AN/A N/A N/A N/A N/A N/A N/A N/A
433,568 N/A 6,219 5,016 76,517 21,193 100 100N/A 793,788,233 N/A N/A N/A N/A N/A N/AN/A N/A 722 N/A N/A 98 N/A N/AN/A N/A N/A N/A N/A N/A N/A N/A100 N/A N/A N/A N/A N/A N/A N/A
8,204 N/A 267 508,786 89 N/A N/A N/AN/A N/A 9,569 N/A 592 N/A 100 N/AN/A N/A N/A N/A N/A 228,461 N/A 485,097
14,263 N/A N/A N/A N/A N/A N/A N/AN/A N/A N/A N/A N/A N/A 100 N/AN/A N/A N/A N/A 66 N/A N/A N/AN/A N/A N/A N/A N/A 254,391 N/A N/AN/A N/A N/A N/A N/A N/A N/A N/AN/A N/A N/A N/A N/A N/A N/A N/A
1,404,039 N/A 1,164,196 5,326 1,127,261 2,591,539 59,756 60,100N/A 324,243,547 N/A N/A N/A N/A N/A 411,051N/A N/A 67 N/A N/A 30,416 N/A N/AN/A N/A N/A N/A 66 N/A N/A N/AN/A N/A N/A N/A 1,011,641 N/A N/A N/A
305,828 N/A 236 205 N/A N/A N/A N/AN/A N/A N/A N/A N/A N/A 100 N/A
38,016 N/A N/A N/A N/A N/A N/A N/A149,514 N/A N/A N/A N/A N/A 100 N/A362,222 N/A N/A N/A N/A N/A N/A N/A
N/A 51,281 N/A N/A N/A N/A N/A N/A
The accompanying notes are an integral part of these financial statements.
China Equity Fund, Emerging Markets Equity Income Fund, Global Focused Equity Fund, Global Opportunity Bond Fund, U.S. Dollar Short-Term Money Market
Fund, U.S. Select Equity Fund, U.S. Short-Term High Yield Bond Fund, U.S. Small Cap Value Fund and USD Investment Grade Credit Fund have not been
authorised by the Hong Kong Securities and Futures Commission and are not available for investment by Hong Kong retail investors.

58 Wells Fargo (Lux) Worldwide Fund Statement of operations and changes in net assets
for the year ended 31 March 2017
ChinaEquity
FundUSD
EmergingMarkets
EquityFund
USD
EmergingMarkets
EquityIncome
FundUSD
GlobalEquity
FundUSD
GlobalFocused
EquityFund*
USD
GlobalOpportunity
BondFund
USD
IncomeDividends . . . . . . . . . . . . . . . . . . . . . . . . . . . . . . . . . . . . . . . . . . 1,465,971 5,064,723 10,353,458 2,303,461 134,806 0Interest . . . . . . . . . . . . . . . . . . . . . . . . . . . . . . . . . . . . . . . . . . . . 0 0 0 0 0 3,307,867Interest on reverse repurchase agreements . . . . . . . . . . . . 0 0 0 0 0 0
Total income . . . . . . . . . . . . . . . . . . . . . . . . . . . . . . . . . . . . . . . . 1,465,971 5,064,723 10,353,458 2,303,461 134,806 3,307,867
ExpensesManagement company fees . . . . . . . . . . . . . . . . . . . . . . . . . . 21,112 87,648 96,269 44,377 14,848 51,922Investment management fees . . . . . . . . . . . . . . . . . . . . . . . . 758,936 3,035,722 3,323,402 1,046,141 74,576 686,706Depositary and administration fees . . . . . . . . . . . . . . . . . . . 105,362 130,522 358,493 72,738 29,642 227,289Registrar, transfer agent and paying agent fees . . . . . . . . . 23,863 22,109 20,754 19,859 13,871 19,873Directors fees . . . . . . . . . . . . . . . . . . . . . . . . . . . . . . . . . . . . . . . 10,450 10,450 10,450 10,450 8,824 10,450Audit fees and tax services . . . . . . . . . . . . . . . . . . . . . . . . . . . 11,703 11,703 11,703 11,703 11,708 11,690Subscription tax . . . . . . . . . . . . . . . . . . . . . . . . . . . . . . . . . . . . . 12,305 27,095 32,468 12,130 856 13,484Amortisation of formation expenses . . . . . . . . . . . . . . . . . . . 0 0 5,383 0 8,258 5,421Other expenses . . . . . . . . . . . . . . . . . . . . . . . . . . . . . . . . . . . . . 102,534 142,860 168,697 126,853 42,354 107,020
Total expenses . . . . . . . . . . . . . . . . . . . . . . . . . . . . . . . . . . . . . . 1,046,265 3,468,109 4,027,619 1,344,251 204,937 1,133,855
LessWaived fees and/or reimbursed expenses . . . . . . . . . . . . . . (132,451) 0 0 0 (105,542) (177,528)
Net expenses . . . . . . . . . . . . . . . . . . . . . . . . . . . . . . . . . . . . . . . . 913,814 3,468,109 4,027,619 1,344,251 99,395 956,327
Net investment profit/(loss) . . . . . . . . . . . . . . . . . . . . . . . . . . 552,157 1,596,614 6,325,839 959,210 35,411 2,351,540
Realised and unrealised profit/(loss)Net realised profit/(loss) on
Sale of investments . . . . . . . . . . . . . . . . . . . . . . . . . . . . . . . . 724,945 (1,650,376) (1,565,415) 2,260,449 359,987 (5,411,004)Forward foreign currency contracts . . . . . . . . . . . . . . . . . . 0 0 (18,524) 0 275,208 (1,314,136)Foreign currency on other transactions . . . . . . . . . . . . . . 663 (3,912) (31,040) (20,546) (10,718) 78,764
Net realised profit/(loss) . . . . . . . . . . . . . . . . . . . . . . . . . . . . 725,608 (1,654,288) (1,614,979) 2,239,903 624,477 (6,646,376)
Net change in unrealised appreciation/(depreciation) onInvestments . . . . . . . . . . . . . . . . . . . . . . . . . . . . . . . . . . . . . . 6,095,041 49,999,130 33,492,254 15,136,457 1,497,740 (1,419,086)Forward foreign currency contracts . . . . . . . . . . . . . . . . . . 0 0 3,546 0 (78,278) (1,481,468)Foreign currency on other transactions . . . . . . . . . . . . . . (671) (32,107) 53,092 (3,250) 971 12,637
Net change in unrealisedappreciation/(depreciation) . . . . . . . . . . . . . . . . . . . . . . . 6,094,370 49,967,023 33,548,892 15,133,207 1,420,433 (2,887,917)
Net realised and unrealised profit/(loss) . . . . . . . . . . . . . . . 6,819,978 48,312,735 31,933,913 17,373,110 2,044,910 (9,534,293)
Net increase/(decrease) in net assets as a result ofoperations . . . . . . . . . . . . . . . . . . . . . . . . . . . . . . . . . . . . . . . . 7,372,135 49,909,349 38,259,752 18,332,320 2,080,321 (7,182,753)
Distributions to shareholders fromNet investment income . . . . . . . . . . . . . . . . . . . . . . . . . . . . . . 0 (578,535) (734,885) (25) 0 0
Capital share transactionsReceipts from the issuance of shares . . . . . . . . . . . . . . . . . . 31,620,817 32,154,241 217,924,607 12,518,328 10,000,052 114,357,661Reinvestment of distributions . . . . . . . . . . . . . . . . . . . . . . . . 0 578,535 732,875 25 0 0Payments from redemption of shares . . . . . . . . . . . . . . . . . . (27,418,421) (90,165,910) (44,790,493) (38,785,426) 0 (136,128,677)
Net increase/(decrease) in net assets resulting fromcapital share transactions . . . . . . . . . . . . . . . . . . . . . . . . . . 4,202,396 (57,433,134) 173,866,989 (26,267,073) 10,000,052 (21,771,016)
Total increase/(decrease) in net assets . . . . . . . . . . . . . . . . 11,574,531 (8,102,320) 211,391,856 (7,934,778) 12,080,373 (28,953,769)
Net assets at the beginning of the year . . . . . . . . . . . . . . . . . . 50,697,324 260,250,909 198,239,121 130,863,613 0 115,153,156
Net assets at the end of the year . . . . . . . . . . . . . . . . . . . . . . 62,271,855 252,148,589 409,630,977 122,928,835 12,080,373 86,199,387
* For the period from 30 June 2016 (commencement of operations) to 31 March 2017.** For the period from 1 April 2016 to 6 January 2017. This Sub-Fund merged into U.S. All Cap Growth Fund on 6 January 2017.*** For the period from 15 December 2016 (commencement of operations) to 31 March 2017.
The accompanying notes are an integral part of these financial statements.
China Equity Fund, Emerging Markets Equity Income Fund, Global Focused Equity Fund, Global Opportunity Bond Fund, U.S. Dollar Short-Term Money Market
Fund, U.S. Select Equity Fund, U.S. Short-Term High Yield Bond Fund, U.S. Small Cap Value Fund and USD Investment Grade Credit Fund have not been
authorised by the Hong Kong Securities and Futures Commission and are not available for investment by Hong Kong retail investors.

Statement of operations and changes in net assets
for the year ended 31 March 2017
Wells Fargo (Lux) Worldwide Fund 59
U.S.All Cap
GrowthFund
USD
U.S.DollarShort-Term
MoneyMarket
FundUSD
U.S.HighYieldBondFund
USD
U.S.Large
CapGrowth
FundUSD
U.S.PremierGrowthFund**
USD
U.S.SelectEquity
FundUSD
U.S.Short-TermHighYieldBondFund
USD
U.S.Small
CapValue
Fund*USD
USDInvestment
GradeCredit
Fund***USD
CombinedUSD
3,699,208 0 0 825,319 102,208 2,282,910 0 49,291 0 26,281,3550 6,933,340 15,153,107 0 0 0 10,859,331 0 872,213 37,125,8580 294,492 0 0 0 0 0 0 0 294,492
3,699,208 7,227,832 15,153,107 825,319 102,208 2,282,910 10,859,331 49,291 872,213 63,701,705
184,148 161,601 72,349 37,910 19,712 78,269 100,202 14,594 10,785 995,7467,017,481 10,337,779 1,456,751 691,385 118,729 2,295,430 1,586,412 40,513 76,769 32,546,732
367,489 665,354 210,883 44,881 94,298 166,522 264,069 82,152 29,504 2,849,19815,450 15,005 20,146 20,658 12,135 23,689 19,873 13,860 9,966 271,11110,450 10,450 10,450 10,450 10,450 10,450 10,450 8,824 2,426 145,47411,446 11,765 11,703 11,703 14,165 11,695 11,675 11,708 3,334 169,404
215,490 107,632 22,639 10,013 1,055 67,669 33,140 496 4,172 560,6440 0 0 0 4,174 10,990 5,383 8,258 3,193 51,060
72,427 128,651 128,629 75,678 48,356 105,190 114,079 42,356 26,847 1,432,531
7,894,381 11,438,237 1,933,550 902,678 323,074 2,769,904 2,145,283 222,761 166,996 39,021,900
0 (5,579,352) 0 0 (153,694) 0 0 (168,812) (52,045) (6,369,424)
7,894,381 5,858,885 1,933,550 902,678 169,380 2,769,904 2,145,283 53,949 114,951 32,652,476
(4,195,173) 1,368,947 13,219,557 (77,359) (67,172) (486,994) 8,714,048 (4,658) 757,262 31,049,229
92,082,668 464 4,659,626 5,547,876 9,274,264 7,258,196 832,296 191,880 236,199 114,802,055(250) 0 29,092 0 (125) (2,313) (1,761,381) (1,953) 1,623,059 (1,171,323)
(54,014) 0 (3,132) 4,991 (12,647) 31 31,762 (5) 641 (19,162)
92,028,404 464 4,685,586 5,552,867 9,261,492 7,255,914 (897,323) 189,922 1,859,899 113,611,570
32,019,216 0 13,832,882 7,866,241 (7,523,432) 20,335,136 828,620 1,059,558 930,153 174,149,910(303) 0 (36,378) 0 (1,024) (1,983) (792,804) (654) (1,150,065) (3,539,411)
73 0 0 0 (12) 0 (27,340) 0 0 3,393
32,018,986 0 13,796,504 7,866,241 (7,524,468) 20,333,153 8,476 1,058,904 (219,912) 170,613,892
124,047,390 464 18,482,090 13,419,108 1,737,024 27,589,067 (888,847) 1,248,826 1,639,987 284,225,462
119,852,217 1,369,411 31,701,647 13,341,749 1,669,852 27,102,073 7,825,201 1,244,168 2,397,249 315,274,691
0 (1,369,411) (1,854) 0 (8) (72,401) (695,063) 0 (498,226) (3,950,408)
128,739,281 1,581,987,695 51,208,135 7,440,343 2,152,734 99,916,364 165,828,633 6,298,114 98,681,523 2,560,828,5280 1,111,800 1,451 0 8 10 389,955 0 114 2,814,773
(421,793,335) (1,405,241,354) (68,819,357) (15,403,068) (100,349,668) (60,780,138) (95,435,041) 0 0 (2,505,110,888)
(293,054,054) 177,858,141 (17,609,771) (7,962,725) (98,196,926) 39,136,236 70,783,547 6,298,114 98,681,637 58,532,413
(173,201,837) 177,858,141 14,090,022 5,379,024 (96,527,082) 66,165,908 77,913,685 7,542,282 100,580,660 369,856,696
857,065,227 939,771,714 210,846,643 88,482,798 96,527,082 174,630,458 263,472,719 0 0 3,386,000,764
683,863,390 1,117,629,855 224,936,665 93,861,822 0 240,796,366 341,386,404 7,542,282 100,580,660 3,755,857,460
The accompanying notes are an integral part of these financial statements.
China Equity Fund, Emerging Markets Equity Income Fund, Global Focused Equity Fund, Global Opportunity Bond Fund, U.S. Dollar Short-Term Money Market
Fund, U.S. Select Equity Fund, U.S. Short-Term High Yield Bond Fund, U.S. Small Cap Value Fund and USD Investment Grade Credit Fund have not been
authorised by the Hong Kong Securities and Futures Commission and are not available for investment by Hong Kong retail investors.
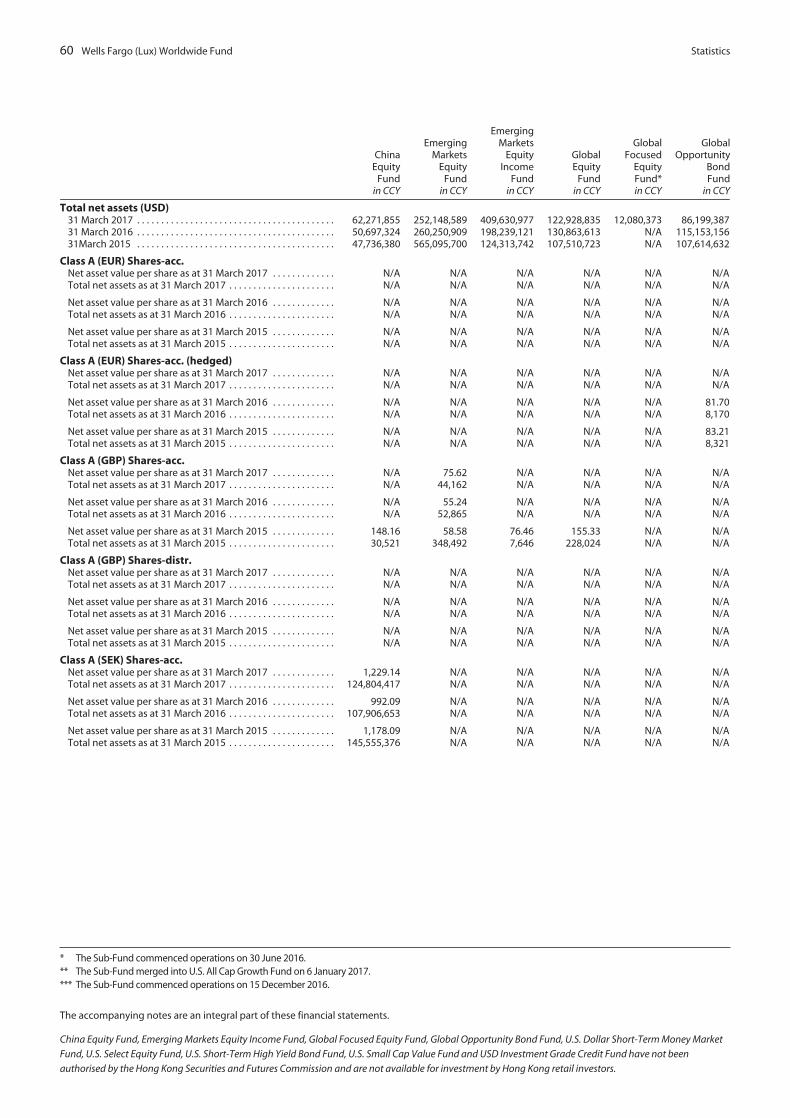
60 Wells Fargo (Lux) Worldwide Fund Statistics
ChinaEquity
Fundin CCY
EmergingMarkets
EquityFund
in CCY
EmergingMarkets
EquityIncome
Fundin CCY
GlobalEquity
Fundin CCY
GlobalFocused
EquityFund*in CCY
GlobalOpportunity
BondFund
in CCY
Total net assets (USD)31 March 2017 . . . . . . . . . . . . . . . . . . . . . . . . . . . . . . . . . . . . . . . . . 62,271,855 252,148,589 409,630,977 122,928,835 12,080,373 86,199,38731 March 2016 . . . . . . . . . . . . . . . . . . . . . . . . . . . . . . . . . . . . . . . . . 50,697,324 260,250,909 198,239,121 130,863,613 N/A 115,153,15631March 2015 . . . . . . . . . . . . . . . . . . . . . . . . . . . . . . . . . . . . . . . . . 47,736,380 565,095,700 124,313,742 107,510,723 N/A 107,614,632
Class A (EUR) Shares-acc.Net asset value per share as at 31 March 2017 . . . . . . . . . . . . . N/A N/A N/A N/A N/A N/ATotal net assets as at 31 March 2017 . . . . . . . . . . . . . . . . . . . . . . N/A N/A N/A N/A N/A N/A
Net asset value per share as at 31 March 2016 . . . . . . . . . . . . . N/A N/A N/A N/A N/A N/ATotal net assets as at 31 March 2016 . . . . . . . . . . . . . . . . . . . . . . N/A N/A N/A N/A N/A N/A
Net asset value per share as at 31 March 2015 . . . . . . . . . . . . . N/A N/A N/A N/A N/A N/ATotal net assets as at 31 March 2015 . . . . . . . . . . . . . . . . . . . . . . N/A N/A N/A N/A N/A N/A
Class A (EUR) Shares-acc. (hedged)Net asset value per share as at 31 March 2017 . . . . . . . . . . . . . N/A N/A N/A N/A N/A N/ATotal net assets as at 31 March 2017 . . . . . . . . . . . . . . . . . . . . . . N/A N/A N/A N/A N/A N/A
Net asset value per share as at 31 March 2016 . . . . . . . . . . . . . N/A N/A N/A N/A N/A 81.70Total net assets as at 31 March 2016 . . . . . . . . . . . . . . . . . . . . . . N/A N/A N/A N/A N/A 8,170
Net asset value per share as at 31 March 2015 . . . . . . . . . . . . . N/A N/A N/A N/A N/A 83.21Total net assets as at 31 March 2015 . . . . . . . . . . . . . . . . . . . . . . N/A N/A N/A N/A N/A 8,321
Class A (GBP) Shares-acc.Net asset value per share as at 31 March 2017 . . . . . . . . . . . . . N/A 75.62 N/A N/A N/A N/ATotal net assets as at 31 March 2017 . . . . . . . . . . . . . . . . . . . . . . N/A 44,162 N/A N/A N/A N/A
Net asset value per share as at 31 March 2016 . . . . . . . . . . . . . N/A 55.24 N/A N/A N/A N/ATotal net assets as at 31 March 2016 . . . . . . . . . . . . . . . . . . . . . . N/A 52,865 N/A N/A N/A N/A
Net asset value per share as at 31 March 2015 . . . . . . . . . . . . . 148.16 58.58 76.46 155.33 N/A N/ATotal net assets as at 31 March 2015 . . . . . . . . . . . . . . . . . . . . . . 30,521 348,492 7,646 228,024 N/A N/A
Class A (GBP) Shares-distr.Net asset value per share as at 31 March 2017 . . . . . . . . . . . . . N/A N/A N/A N/A N/A N/ATotal net assets as at 31 March 2017 . . . . . . . . . . . . . . . . . . . . . . N/A N/A N/A N/A N/A N/A
Net asset value per share as at 31 March 2016 . . . . . . . . . . . . . N/A N/A N/A N/A N/A N/ATotal net assets as at 31 March 2016 . . . . . . . . . . . . . . . . . . . . . . N/A N/A N/A N/A N/A N/A
Net asset value per share as at 31 March 2015 . . . . . . . . . . . . . N/A N/A N/A N/A N/A N/ATotal net assets as at 31 March 2015 . . . . . . . . . . . . . . . . . . . . . . N/A N/A N/A N/A N/A N/A
Class A (SEK) Shares-acc.Net asset value per share as at 31 March 2017 . . . . . . . . . . . . . 1,229.14 N/A N/A N/A N/A N/ATotal net assets as at 31 March 2017 . . . . . . . . . . . . . . . . . . . . . . 124,804,417 N/A N/A N/A N/A N/A
Net asset value per share as at 31 March 2016 . . . . . . . . . . . . . 992.09 N/A N/A N/A N/A N/ATotal net assets as at 31 March 2016 . . . . . . . . . . . . . . . . . . . . . . 107,906,653 N/A N/A N/A N/A N/A
Net asset value per share as at 31 March 2015 . . . . . . . . . . . . . 1,178.09 N/A N/A N/A N/A N/ATotal net assets as at 31 March 2015 . . . . . . . . . . . . . . . . . . . . . . 145,555,376 N/A N/A N/A N/A N/A
* The Sub-Fund commenced operations on 30 June 2016.** The Sub-Fund merged into U.S. All Cap Growth Fund on 6 January 2017.*** The Sub-Fund commenced operations on 15 December 2016.
The accompanying notes are an integral part of these financial statements.
China Equity Fund, Emerging Markets Equity Income Fund, Global Focused Equity Fund, Global Opportunity Bond Fund, U.S. Dollar Short-Term Money Market
Fund, U.S. Select Equity Fund, U.S. Short-Term High Yield Bond Fund, U.S. Small Cap Value Fund and USD Investment Grade Credit Fund have not been
authorised by the Hong Kong Securities and Futures Commission and are not available for investment by Hong Kong retail investors.
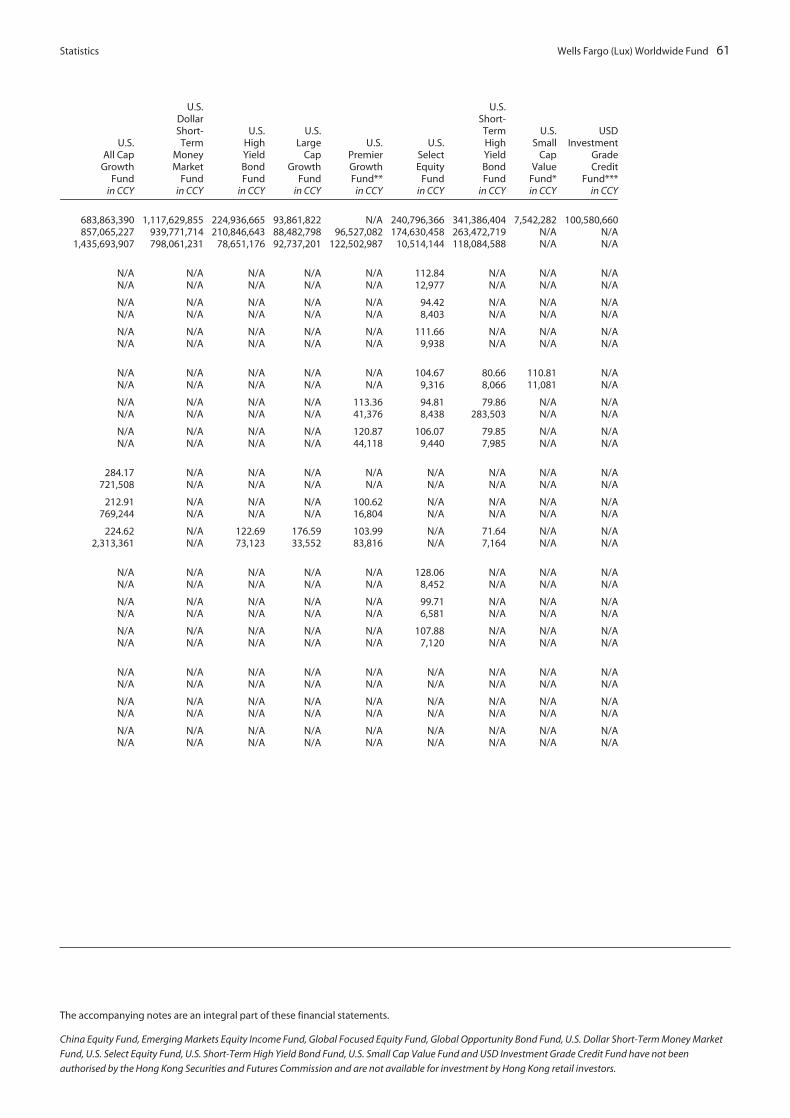
Statistics Wells Fargo (Lux) Worldwide Fund 61
U.S.All Cap
GrowthFund
in CCY
U.S.DollarShort-Term
MoneyMarket
Fundin CCY
U.S.HighYieldBondFund
in CCY
U.S.Large
CapGrowth
Fundin CCY
U.S.PremierGrowthFund**
in CCY
U.S.SelectEquity
Fundin CCY
U.S.Short-TermHighYieldBondFund
in CCY
U.S.Small
CapValue
Fund*in CCY
USDInvestment
GradeCredit
Fund***in CCY
683,863,390 1,117,629,855 224,936,665 93,861,822 N/A 240,796,366 341,386,404 7,542,282 100,580,660857,065,227 939,771,714 210,846,643 88,482,798 96,527,082 174,630,458 263,472,719 N/A N/A
1,435,693,907 798,061,231 78,651,176 92,737,201 122,502,987 10,514,144 118,084,588 N/A N/A
N/A N/A N/A N/A N/A 112.84 N/A N/A N/AN/A N/A N/A N/A N/A 12,977 N/A N/A N/A
N/A N/A N/A N/A N/A 94.42 N/A N/A N/AN/A N/A N/A N/A N/A 8,403 N/A N/A N/A
N/A N/A N/A N/A N/A 111.66 N/A N/A N/AN/A N/A N/A N/A N/A 9,938 N/A N/A N/A
N/A N/A N/A N/A N/A 104.67 80.66 110.81 N/AN/A N/A N/A N/A N/A 9,316 8,066 11,081 N/A
N/A N/A N/A N/A 113.36 94.81 79.86 N/A N/AN/A N/A N/A N/A 41,376 8,438 283,503 N/A N/A
N/A N/A N/A N/A 120.87 106.07 79.85 N/A N/AN/A N/A N/A N/A 44,118 9,440 7,985 N/A N/A
284.17 N/A N/A N/A N/A N/A N/A N/A N/A721,508 N/A N/A N/A N/A N/A N/A N/A N/A
212.91 N/A N/A N/A 100.62 N/A N/A N/A N/A769,244 N/A N/A N/A 16,804 N/A N/A N/A N/A
224.62 N/A 122.69 176.59 103.99 N/A 71.64 N/A N/A2,313,361 N/A 73,123 33,552 83,816 N/A 7,164 N/A N/A
N/A N/A N/A N/A N/A 128.06 N/A N/A N/AN/A N/A N/A N/A N/A 8,452 N/A N/A N/A
N/A N/A N/A N/A N/A 99.71 N/A N/A N/AN/A N/A N/A N/A N/A 6,581 N/A N/A N/A
N/A N/A N/A N/A N/A 107.88 N/A N/A N/AN/A N/A N/A N/A N/A 7,120 N/A N/A N/A
N/A N/A N/A N/A N/A N/A N/A N/A N/AN/A N/A N/A N/A N/A N/A N/A N/A N/A
N/A N/A N/A N/A N/A N/A N/A N/A N/AN/A N/A N/A N/A N/A N/A N/A N/A N/A
N/A N/A N/A N/A N/A N/A N/A N/A N/AN/A N/A N/A N/A N/A N/A N/A N/A N/A
The accompanying notes are an integral part of these financial statements.
China Equity Fund, Emerging Markets Equity Income Fund, Global Focused Equity Fund, Global Opportunity Bond Fund, U.S. Dollar Short-Term Money Market
Fund, U.S. Select Equity Fund, U.S. Short-Term High Yield Bond Fund, U.S. Small Cap Value Fund and USD Investment Grade Credit Fund have not been
authorised by the Hong Kong Securities and Futures Commission and are not available for investment by Hong Kong retail investors.

62 Wells Fargo (Lux) Worldwide Fund Statistics (continued)
ChinaEquity
Fundin CCY
EmergingMarkets
EquityFund
in CCY
EmergingMarkets
EquityIncome
Fundin CCY
GlobalEquity
Fundin CCY
GlobalFocused
EquityFund*in CCY
GlobalOpportunity
BondFund
in CCY
Class A (USD) Shares-acc.Net asset value per share as at 31 March 2017 . . . . . . . . . . . . . . . . . . . . . . . 248.05 94.76 117.78 130.63 120.13 107.37Total net assets as at 31 March 2017 . . . . . . . . . . . . . . . . . . . . . . . . . . . . . . . 1,332,029 3,568,093 1,727,126 176,089 12,013 9,379,521
Net asset value per share as at 31 March 2016 . . . . . . . . . . . . . . . . . . . . . . . 220.97 79.36 105.19 113.61 N/A 108.06Total net assets as at 31 March 2016 . . . . . . . . . . . . . . . . . . . . . . . . . . . . . . . 1,860,788 3,469,064 443,481 131,674 N/A 108,168
Net asset value per share as at 31 March 2015 . . . . . . . . . . . . . . . . . . . . . . . 247.37 86.94 113.41 121.70 N/A 109.16Total net assets as at 31 March 2015 . . . . . . . . . . . . . . . . . . . . . . . . . . . . . . . 3,527,744 2,836,591 356,334 138,981 N/A 1,456,740
Class A (USD) Shares-distr.Net asset value per share as at 31 March 2017 . . . . . . . . . . . . . . . . . . . . . . . N/A N/A N/A N/A N/A N/ATotal net assets as at 31 March 2017 . . . . . . . . . . . . . . . . . . . . . . . . . . . . . . . N/A N/A N/A N/A N/A N/A
Net asset value per share as at 31 March 2016 . . . . . . . . . . . . . . . . . . . . . . . N/A N/A N/A N/A N/A N/ATotal net assets as at 31 March 2016 . . . . . . . . . . . . . . . . . . . . . . . . . . . . . . . N/A N/A N/A N/A N/A N/A
Net asset value per share as at 31 March 2015 . . . . . . . . . . . . . . . . . . . . . . . N/A N/A N/A N/A N/A N/ATotal net assets as at 31 March 2015 . . . . . . . . . . . . . . . . . . . . . . . . . . . . . . . N/A N/A N/A N/A N/A N/A
Class A (USD) Shares-gross distr.Net asset value per share as at 31 March 2017 . . . . . . . . . . . . . . . . . . . . . . . N/A N/A 112.86 N/A N/A N/ATotal net assets as at 31 March 2017 . . . . . . . . . . . . . . . . . . . . . . . . . . . . . . . N/A N/A 345,577 N/A N/A N/A
Net asset value per share as at 31 March 2016 . . . . . . . . . . . . . . . . . . . . . . . N/A N/A 105.22 N/A N/A N/ATotal net assets as at 31 March 2016 . . . . . . . . . . . . . . . . . . . . . . . . . . . . . . . N/A N/A 10,943 N/A N/A N/A
Class I (AUD) Shares-distr.Net asset value per share as at 31 March 2017 . . . . . . . . . . . . . . . . . . . . . . . N/A 158.89 129.73 N/A N/A N/ATotal net assets as at 31 March 2017 . . . . . . . . . . . . . . . . . . . . . . . . . . . . . . . N/A 15,889 31,973,126 N/A N/A N/A
Net asset value per share as at 31 March 2016 . . . . . . . . . . . . . . . . . . . . . . . N/A 130.67 118.25 N/A N/A N/ATotal net assets as at 31 March 2016 . . . . . . . . . . . . . . . . . . . . . . . . . . . . . . . N/A 24,516,305 30,875,903 N/A N/A N/A
Net asset value per share as at 31 March 2015 . . . . . . . . . . . . . . . . . . . . . . . N/A 142.94 128.84 N/A N/A N/ATotal net assets as at 31 March 2015 . . . . . . . . . . . . . . . . . . . . . . . . . . . . . . . N/A 261,667,250 34,021,490 N/A N/A N/A
Class I (CHF) Shares-acc. (hedged)Net asset value per share as at 31 March 2017 . . . . . . . . . . . . . . . . . . . . . . . N/A N/A N/A N/A N/A N/ATotal net assets as at 31 March 2017 . . . . . . . . . . . . . . . . . . . . . . . . . . . . . . . N/A N/A N/A N/A N/A N/A
Net asset value per share as at 31 March 2016 . . . . . . . . . . . . . . . . . . . . . . . N/A N/A N/A N/A N/A N/ATotal net assets as at 31 March 2016 . . . . . . . . . . . . . . . . . . . . . . . . . . . . . . . N/A N/A N/A N/A N/A N/A
Class I (CHF) Shares-distr. (hedged)****Net asset value per share as at 31 March 2016 . . . . . . . . . . . . . . . . . . . . . . . N/A N/A N/A N/A N/A N/ATotal net assets as at 31 March 2016 . . . . . . . . . . . . . . . . . . . . . . . . . . . . . . . N/A N/A N/A N/A N/A N/A
Net asset value per share as at 31 March 2015 . . . . . . . . . . . . . . . . . . . . . . . N/A N/A N/A N/A N/A N/ATotal net assets as at 31 March 2015 . . . . . . . . . . . . . . . . . . . . . . . . . . . . . . . N/A N/A N/A N/A N/A N/A
Class I (EUR) Shares-acc.Net asset value per share as at 31 March 2017 . . . . . . . . . . . . . . . . . . . . . . . 247.12 93.28 114.52 N/A 113.24 N/ATotal net assets as at 31 March 2017 . . . . . . . . . . . . . . . . . . . . . . . . . . . . . . . 87,975 104,577,607 2,702,787 N/A 11,324 N/A
Net asset value per share as at 31 March 2016 . . . . . . . . . . . . . . . . . . . . . . . 204.92 72.67 95.13 106.09 N/A N/ATotal net assets as at 31 March 2016 . . . . . . . . . . . . . . . . . . . . . . . . . . . . . . . 81,148 88,151,399 798,521 10,609 N/A N/A
Net asset value per share as at 31 March 2015 . . . . . . . . . . . . . . . . . . . . . . . 240.93 83.60 107.68 119.30 N/A N/ATotal net assets as at 31 March 2015 . . . . . . . . . . . . . . . . . . . . . . . . . . . . . . . 92,758 88,776,763 10,768 11,930 N/A N/A
* The Sub-Fund commenced operations on 30 June 2016.** The Sub-Fund merged into U.S. All Cap Growth Fund on 6 January 2017.*** The Sub-Fund commenced operations on 15 December 2016.**** Class was closed on 25 August 2016.
The accompanying notes are an integral part of these financial statements.
China Equity Fund, Emerging Markets Equity Income Fund, Global Focused Equity Fund, Global Opportunity Bond Fund, U.S. Dollar Short-Term Money Market
Fund, U.S. Select Equity Fund, U.S. Short-Term High Yield Bond Fund, U.S. Small Cap Value Fund and USD Investment Grade Credit Fund have not been
authorised by the Hong Kong Securities and Futures Commission and are not available for investment by Hong Kong retail investors.
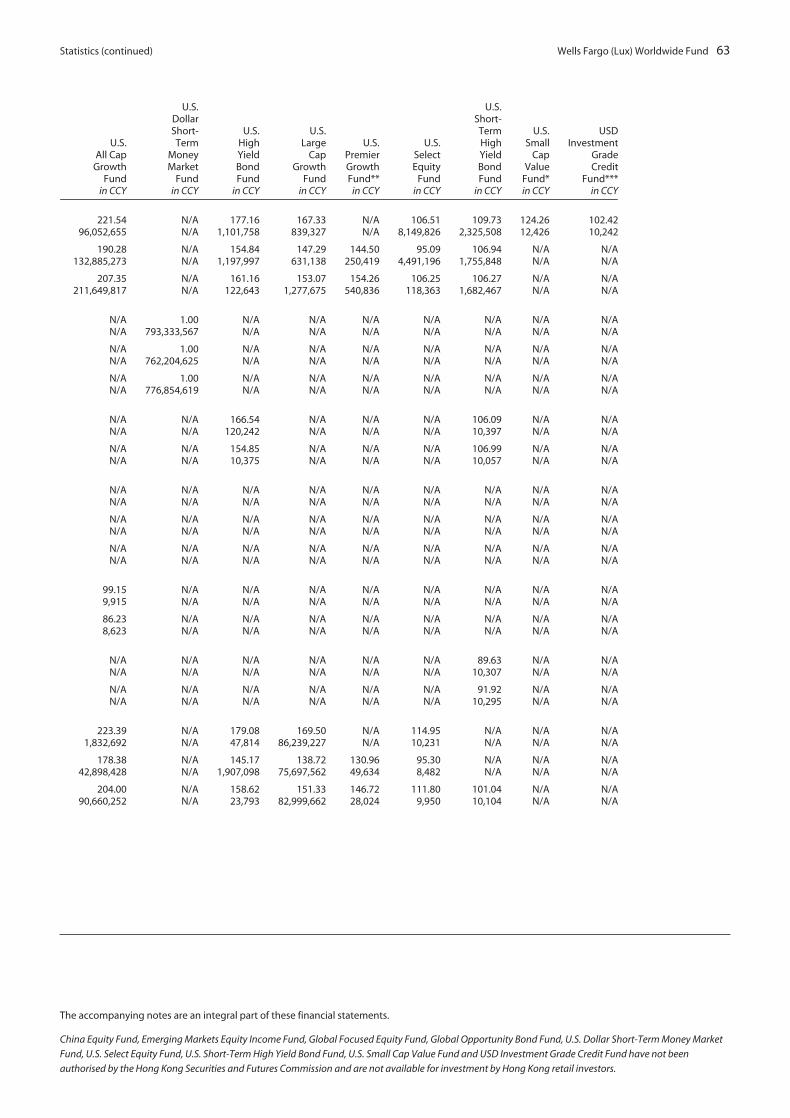
Statistics (continued) Wells Fargo (Lux) Worldwide Fund 63
U.S.All Cap
GrowthFund
in CCY
U.S.DollarShort-Term
MoneyMarket
Fundin CCY
U.S.HighYieldBondFund
in CCY
U.S.Large
CapGrowth
Fundin CCY
U.S.PremierGrowthFund**
in CCY
U.S.SelectEquity
Fundin CCY
U.S.Short-TermHighYieldBondFund
in CCY
U.S.Small
CapValue
Fund*in CCY
USDInvestment
GradeCredit
Fund***in CCY
221.54 N/A 177.16 167.33 N/A 106.51 109.73 124.26 102.4296,052,655 N/A 1,101,758 839,327 N/A 8,149,826 2,325,508 12,426 10,242
190.28 N/A 154.84 147.29 144.50 95.09 106.94 N/A N/A132,885,273 N/A 1,197,997 631,138 250,419 4,491,196 1,755,848 N/A N/A
207.35 N/A 161.16 153.07 154.26 106.25 106.27 N/A N/A211,649,817 N/A 122,643 1,277,675 540,836 118,363 1,682,467 N/A N/A
N/A 1.00 N/A N/A N/A N/A N/A N/A N/AN/A 793,333,567 N/A N/A N/A N/A N/A N/A N/A
N/A 1.00 N/A N/A N/A N/A N/A N/A N/AN/A 762,204,625 N/A N/A N/A N/A N/A N/A N/A
N/A 1.00 N/A N/A N/A N/A N/A N/A N/AN/A 776,854,619 N/A N/A N/A N/A N/A N/A N/A
N/A N/A 166.54 N/A N/A N/A 106.09 N/A N/AN/A N/A 120,242 N/A N/A N/A 10,397 N/A N/A
N/A N/A 154.85 N/A N/A N/A 106.99 N/A N/AN/A N/A 10,375 N/A N/A N/A 10,057 N/A N/A
N/A N/A N/A N/A N/A N/A N/A N/A N/AN/A N/A N/A N/A N/A N/A N/A N/A N/A
N/A N/A N/A N/A N/A N/A N/A N/A N/AN/A N/A N/A N/A N/A N/A N/A N/A N/A
N/A N/A N/A N/A N/A N/A N/A N/A N/AN/A N/A N/A N/A N/A N/A N/A N/A N/A
99.15 N/A N/A N/A N/A N/A N/A N/A N/A9,915 N/A N/A N/A N/A N/A N/A N/A N/A
86.23 N/A N/A N/A N/A N/A N/A N/A N/A8,623 N/A N/A N/A N/A N/A N/A N/A N/A
N/A N/A N/A N/A N/A N/A 89.63 N/A N/AN/A N/A N/A N/A N/A N/A 10,307 N/A N/A
N/A N/A N/A N/A N/A N/A 91.92 N/A N/AN/A N/A N/A N/A N/A N/A 10,295 N/A N/A
223.39 N/A 179.08 169.50 N/A 114.95 N/A N/A N/A1,832,692 N/A 47,814 86,239,227 N/A 10,231 N/A N/A N/A
178.38 N/A 145.17 138.72 130.96 95.30 N/A N/A N/A42,898,428 N/A 1,907,098 75,697,562 49,634 8,482 N/A N/A N/A
204.00 N/A 158.62 151.33 146.72 111.80 101.04 N/A N/A90,660,252 N/A 23,793 82,999,662 28,024 9,950 10,104 N/A N/A
The accompanying notes are an integral part of these financial statements.
China Equity Fund, Emerging Markets Equity Income Fund, Global Focused Equity Fund, Global Opportunity Bond Fund, U.S. Dollar Short-Term Money Market
Fund, U.S. Select Equity Fund, U.S. Short-Term High Yield Bond Fund, U.S. Small Cap Value Fund and USD Investment Grade Credit Fund have not been
authorised by the Hong Kong Securities and Futures Commission and are not available for investment by Hong Kong retail investors.

64 Wells Fargo (Lux) Worldwide Fund Statistics (continued)
ChinaEquity
Fundin CCY
EmergingMarkets
EquityFund
in CCY
EmergingMarkets
EquityIncome
Fundin CCY
GlobalEquity
Fundin CCY
GlobalFocused
EquityFund*in CCY
GlobalOpportunity
BondFund
in CCY
Class I (EUR) Shares-acc. (hedged)Net asset value per share as at 31 March 2017 . . . . . . . . . . . . . . . . . . . . . . . . . . N/A N/A N/A N/A N/A 81.84Total net assets as at 31 March 2017 . . . . . . . . . . . . . . . . . . . . . . . . . . . . . . . . . . . N/A N/A N/A N/A N/A 32,303,557
Net asset value per share as at 31 March 2016 . . . . . . . . . . . . . . . . . . . . . . . . . . N/A N/A N/A N/A N/A 83.31Total net assets as at 31 March 2016 . . . . . . . . . . . . . . . . . . . . . . . . . . . . . . . . . . . N/A N/A N/A N/A N/A 1,086,946
Net asset value per share as at 31 March 2015 . . . . . . . . . . . . . . . . . . . . . . . . . . N/A N/A N/A N/A N/A 84.37Total net assets as at 31 March 2015 . . . . . . . . . . . . . . . . . . . . . . . . . . . . . . . . . . . N/A N/A N/A N/A N/A 359,416
Class I (EUR) Shares-distr. (hedged)Net asset value per share as at 31 March 2017 . . . . . . . . . . . . . . . . . . . . . . . . . . N/A N/A N/A N/A N/A N/ATotal net assets as at 31 March 2017 . . . . . . . . . . . . . . . . . . . . . . . . . . . . . . . . . . . N/A N/A N/A N/A N/A N/A
Net asset value per share as at 31 March 2016 . . . . . . . . . . . . . . . . . . . . . . . . . . N/A N/A N/A N/A N/A N/ATotal net assets as at 31 March 2016 . . . . . . . . . . . . . . . . . . . . . . . . . . . . . . . . . . . N/A N/A N/A N/A N/A N/A
Net asset value per share as at 31 March 2015 . . . . . . . . . . . . . . . . . . . . . . . . . . N/A N/A N/A N/A N/A N/ATotal net assets as at 31 March 2015 . . . . . . . . . . . . . . . . . . . . . . . . . . . . . . . . . . . N/A N/A N/A N/A N/A N/A
Class I (GBP) Shares-acc.Net asset value per share as at 31 March 2017 . . . . . . . . . . . . . . . . . . . . . . . . . . 186.59 79.44 N/A N/A 96.42 N/ATotal net assets as at 31 March 2017 . . . . . . . . . . . . . . . . . . . . . . . . . . . . . . . . . . . 218,683 108,921,932 N/A N/A 9,642 N/A
Net asset value per share as at 31 March 2016 . . . . . . . . . . . . . . . . . . . . . . . . . . 143.98 57.58 75.41 157.92 N/A N/ATotal net assets as at 31 March 2016 . . . . . . . . . . . . . . . . . . . . . . . . . . . . . . . . . . . 14,398 95,449,733 7,541 15,792 N/A N/A
Net asset value per share as at 31 March 2015 . . . . . . . . . . . . . . . . . . . . . . . . . . 154.87 60.61 78.05 162.51 N/A N/ATotal net assets as at 31 March 2015 . . . . . . . . . . . . . . . . . . . . . . . . . . . . . . . . . . . 15,487 122,923,626 7,805 16,251 N/A N/A
Class I (GBP) Shares-acc. (hedged)Net asset value per share as at 31 March 2017 . . . . . . . . . . . . . . . . . . . . . . . . . . N/A N/A N/A N/A N/A 67.77Total net assets as at 31 March 2017 . . . . . . . . . . . . . . . . . . . . . . . . . . . . . . . . . . . N/A N/A N/A N/A N/A 13,226,129
Net asset value per share as at 31 March 2016 . . . . . . . . . . . . . . . . . . . . . . . . . . N/A N/A N/A N/A N/A 68.33Total net assets as at 31 March 2016 . . . . . . . . . . . . . . . . . . . . . . . . . . . . . . . . . . . N/A N/A N/A N/A N/A 4,050,671
Net asset value per share as at 31 March 2015 . . . . . . . . . . . . . . . . . . . . . . . . . . N/A N/A N/A N/A N/A 68.66Total net assets as at 31 March 2015 . . . . . . . . . . . . . . . . . . . . . . . . . . . . . . . . . . . N/A N/A N/A N/A N/A 610,250
Class I (GBP) Shares-distr.Net asset value per share as at 31 March 2017 . . . . . . . . . . . . . . . . . . . . . . . . . . N/A N/A N/A N/A N/A N/ATotal net assets as at 31 March 2017 . . . . . . . . . . . . . . . . . . . . . . . . . . . . . . . . . . . N/A N/A N/A N/A N/A N/A
Net asset value per share as at 31 March 2016 . . . . . . . . . . . . . . . . . . . . . . . . . . N/A N/A N/A N/A N/A N/ATotal net assets as at 31 March 2016 . . . . . . . . . . . . . . . . . . . . . . . . . . . . . . . . . . . N/A N/A N/A N/A N/A N/A
Net asset value per share as at 31 March 2015 . . . . . . . . . . . . . . . . . . . . . . . . . . N/A N/A N/A N/A N/A N/ATotal net assets as at 31 March 2015 . . . . . . . . . . . . . . . . . . . . . . . . . . . . . . . . . . . N/A N/A N/A N/A N/A N/A
Class I (GBP) Shares-distr. (hedged)Net asset value per share as at 31 March 2017 . . . . . . . . . . . . . . . . . . . . . . . . . . N/A N/A N/A N/A N/A N/ATotal net assets as at 31 March 2017 . . . . . . . . . . . . . . . . . . . . . . . . . . . . . . . . . . . N/A N/A N/A N/A N/A N/A
Net asset value per share as at 31 March 2016 . . . . . . . . . . . . . . . . . . . . . . . . . . N/A N/A N/A N/A N/A N/ATotal net assets as at 31 March 2016 . . . . . . . . . . . . . . . . . . . . . . . . . . . . . . . . . . . N/A N/A N/A N/A N/A N/A
Net asset value per share as at 31 March 2015 . . . . . . . . . . . . . . . . . . . . . . . . . . N/A N/A N/A N/A N/A N/ATotal net assets as at 31 March 2015 . . . . . . . . . . . . . . . . . . . . . . . . . . . . . . . . . . . N/A N/A N/A N/A N/A N/A
Class I (GBP) Shares-gross distr.Net asset value per share as at 31 March 2017 . . . . . . . . . . . . . . . . . . . . . . . . . . N/A N/A 90.53 N/A N/A N/ATotal net assets as at 31 March 2017 . . . . . . . . . . . . . . . . . . . . . . . . . . . . . . . . . . . N/A N/A 8,057 N/A N/A N/A
Net asset value per share as at 31 March 2016 . . . . . . . . . . . . . . . . . . . . . . . . . . N/A N/A 73.07 N/A N/A N/ATotal net assets as at 31 March 2016 . . . . . . . . . . . . . . . . . . . . . . . . . . . . . . . . . . . N/A N/A 6,211 N/A N/A N/A
* The Sub-Fund commenced operations on 30 June 2016.** The Sub-Fund merged into U.S. All Cap Growth Fund on 6 January 2017.*** The Sub-Fund commenced operations on 15 December 2016.
The accompanying notes are an integral part of these financial statements.
China Equity Fund, Emerging Markets Equity Income Fund, Global Focused Equity Fund, Global Opportunity Bond Fund, U.S. Dollar Short-Term Money Market
Fund, U.S. Select Equity Fund, U.S. Short-Term High Yield Bond Fund, U.S. Small Cap Value Fund and USD Investment Grade Credit Fund have not been
authorised by the Hong Kong Securities and Futures Commission and are not available for investment by Hong Kong retail investors.

Statistics (continued) Wells Fargo (Lux) Worldwide Fund 65
U.S.All Cap
GrowthFund
in CCY
U.S.DollarShort-Term
MoneyMarket
Fundin CCY
U.S.HighYieldBondFund
in CCY
U.S.Large
CapGrowth
Fundin CCY
U.S.PremierGrowthFund**
in CCY
U.S.SelectEquity
Fundin CCY
U.S.Short-TermHighYieldBondFund
in CCY
U.S.Small
CapValue
Fund*in CCY
USDInvestment
GradeCredit
Fund***in CCY
N/A N/A 164.08 N/A N/A 106.33 N/A 111.47 N/AN/A N/A 1,570,082 N/A N/A 62,947 N/A 11,147 N/A
N/A N/A N/A N/A 115.84 95.62 N/A N/A N/AN/A N/A N/A N/A 11,584 8,510 N/A N/A N/A
N/A N/A N/A N/A 122.54 106.21 N/A N/A N/AN/A N/A N/A N/A 12,254 9,453 N/A N/A N/A
N/A N/A N/A N/A N/A N/A 76.30 N/A 101.44N/A N/A N/A N/A N/A N/A 17,431,574 N/A 49,208,240
N/A N/A N/A N/A N/A N/A 76.74 N/A N/AN/A N/A N/A N/A N/A N/A 1,242,497 N/A N/A
N/A N/A N/A N/A N/A N/A 78.08 N/A N/AN/A N/A N/A N/A N/A N/A 10,307 N/A N/A
303.67 N/A N/A N/A N/A N/A N/A N/A N/A4,331,245 N/A N/A N/A N/A N/A N/A N/A N/A
225.62 N/A N/A 185.69 103.73 N/A N/A N/A N/A16,601,571 N/A N/A 7,242 12,165,143 N/A N/A N/A N/A
236.06 N/A 129.26 185.35 106.34 N/A 73.23 N/A N/A14,092,074 N/A 12,926 7,229 1,546,928 N/A 7,323 N/A N/A
N/A N/A N/A N/A N/A N/A N/A 93.25 N/AN/A N/A N/A N/A N/A N/A N/A 9,325 N/A
N/A N/A N/A N/A N/A N/A N/A N/A N/AN/A N/A N/A N/A N/A N/A N/A N/A N/A
N/A N/A N/A N/A N/A N/A N/A N/A N/AN/A N/A N/A N/A N/A N/A N/A N/A N/A
N/A N/A N/A N/A N/A 130.33 N/A N/A N/AN/A N/A N/A N/A N/A 8,602 N/A N/A N/A
N/A N/A N/A N/A N/A 100.63 N/A N/A N/AN/A N/A N/A N/A N/A 6,642 N/A N/A N/A
N/A N/A N/A N/A N/A 108.01 N/A N/A N/AN/A N/A N/A N/A N/A 1,307,569 N/A N/A N/A
N/A N/A N/A N/A N/A N/A 67.19 N/A N/AN/A N/A N/A N/A N/A N/A 17,092,531 N/A N/A
N/A N/A N/A N/A N/A N/A 67.20 N/A N/AN/A N/A N/A N/A N/A N/A 10,032,422 N/A N/A
N/A N/A N/A N/A N/A N/A 67.93 N/A N/AN/A N/A N/A N/A N/A N/A 9,880,079 N/A N/A
N/A N/A N/A N/A N/A N/A N/A N/A N/AN/A N/A N/A N/A N/A N/A N/A N/A N/A
N/A N/A N/A N/A N/A N/A N/A N/A N/AN/A N/A N/A N/A N/A N/A N/A N/A N/A
The accompanying notes are an integral part of these financial statements.
China Equity Fund, Emerging Markets Equity Income Fund, Global Focused Equity Fund, Global Opportunity Bond Fund, U.S. Dollar Short-Term Money Market
Fund, U.S. Select Equity Fund, U.S. Short-Term High Yield Bond Fund, U.S. Small Cap Value Fund and USD Investment Grade Credit Fund have not been
authorised by the Hong Kong Securities and Futures Commission and are not available for investment by Hong Kong retail investors.

66 Wells Fargo (Lux) Worldwide Fund Statistics (continued)
ChinaEquity
Fundin CCY
EmergingMarkets
EquityFund
in CCY
EmergingMarkets
EquityIncome
Fundin CCY
GlobalEquity
Fundin CCY
GlobalFocused
EquityFund*in CCY
GlobalOpportunity
BondFund
in CCY
Class I (NOK) Shares-acc. (hedged)Net asset value per share as at 31 March 2017 . . . . . . . . . . . . . . . N/A N/A N/A N/A N/A 679.78Total net assets as at 31 March 2017 . . . . . . . . . . . . . . . . . . . . . . . . N/A N/A N/A N/A N/A 67,978
Net asset value per share as at 31 March 2016 . . . . . . . . . . . . . . . N/A N/A N/A N/A N/A 683.51Total net assets as at 31 March 2016 . . . . . . . . . . . . . . . . . . . . . . . . N/A N/A N/A N/A N/A 634,563,849
Net asset value per share as at 31 March 2015 . . . . . . . . . . . . . . . N/A N/A N/A N/A N/A 683.27Total net assets as at 31 March 2015 . . . . . . . . . . . . . . . . . . . . . . . . N/A N/A N/A N/A N/A 547,742,029
Class I (USD) Shares-acc.Net asset value per share as at 31 March 2017 . . . . . . . . . . . . . . . 263.62 99.58 122.16 139.88 120.80 109.94Total net assets as at 31 March 2017 . . . . . . . . . . . . . . . . . . . . . . . . 46,589,035 477,586 380,147,872 122,499,350 12,031,680 25,604,696
Net asset value per share as at 31 March 2016 . . . . . . . . . . . . . . . 233.18 82.74 108.24 120.70 N/A 110.09Total net assets as at 31 March 2016 . . . . . . . . . . . . . . . . . . . . . . . . 35,312,546 520,600 172,895,216 130,381,951 N/A 31,108,902
Net asset value per share as at 31 March 2015 . . . . . . . . . . . . . . . 259.06 89.89 115.78 128.28 N/A 110.66Total net assets as at 31 March 2015 . . . . . . . . . . . . . . . . . . . . . . . . 27,106,484 84,659,750 97,879,602 106,867,887 N/A 36,831,189
Class I (USD) Shares-distr.Net asset value per share as at 31 March 2017 . . . . . . . . . . . . . . . N/A N/A N/A N/A N/A N/ATotal net assets as at 31 March 2017 . . . . . . . . . . . . . . . . . . . . . . . . N/A N/A N/A N/A N/A N/A
Net asset value per share as at 31 March 2016 . . . . . . . . . . . . . . . N/A N/A N/A N/A N/A N/ATotal net assets as at 31 March 2016 . . . . . . . . . . . . . . . . . . . . . . . . N/A N/A N/A N/A N/A N/A
Net asset value per share as at 31 March 2015 . . . . . . . . . . . . . . . N/A N/A N/A N/A N/A N/ATotal net assets as at 31 March 2015 . . . . . . . . . . . . . . . . . . . . . . . . N/A N/A N/A N/A N/A N/A
Class I (USD) Shares-gross distr.Net asset value per share as at 31 March 2017 . . . . . . . . . . . . . . . N/A N/A 116.92 139.60 N/A N/ATotal net assets as at 31 March 2017 . . . . . . . . . . . . . . . . . . . . . . . . N/A N/A 12,394 12,424 N/A N/A
Net asset value per share as at 31 March 2016 . . . . . . . . . . . . . . . N/A N/A 108.28 120.71 N/A N/ATotal net assets as at 31 March 2016 . . . . . . . . . . . . . . . . . . . . . . . . N/A N/A 10,936 10,743 N/A N/A
Class X (GBP) Shares-distr.Net asset value per share as at 31 March 2017 . . . . . . . . . . . . . . . N/A N/A N/A N/A N/A N/ATotal net assets as at 31 March 2017 . . . . . . . . . . . . . . . . . . . . . . . . N/A N/A N/A N/A N/A N/A
Net asset value per share as at 31 March 2016 . . . . . . . . . . . . . . . N/A N/A N/A N/A N/A N/ATotal net assets as at 31 March 2016 . . . . . . . . . . . . . . . . . . . . . . . . N/A N/A N/A N/A N/A N/A
Net asset value per share as at 31 March 2015 . . . . . . . . . . . . . . . N/A N/A N/A N/A N/A N/ATotal net assets as at 31 March 2015 . . . . . . . . . . . . . . . . . . . . . . . . N/A N/A N/A N/A N/A N/A
Class X (USD) Shares-distr.Net asset value per share as at 31 March 2017 . . . . . . . . . . . . . . . N/A N/A N/A N/A N/A N/ATotal net assets as at 31 March 2017 . . . . . . . . . . . . . . . . . . . . . . . . N/A N/A N/A N/A N/A N/A
Net asset value per share as at 31 March 2016 . . . . . . . . . . . . . . . N/A N/A N/A N/A N/A N/ATotal net assets as at 31 March 2016 . . . . . . . . . . . . . . . . . . . . . . . . N/A N/A N/A N/A N/A N/A
Net asset value per share as at 31 March 2015 . . . . . . . . . . . . . . . N/A N/A N/A N/A N/A N/ATotal net assets as at 31 March 2015 . . . . . . . . . . . . . . . . . . . . . . . . N/A N/A N/A N/A N/A N/A
Class Z (GBP) Shares-acc.Net asset value per share as at 31 March 2017 . . . . . . . . . . . . . . . 181.10 N/A 97.61 204.47 96.42 N/ATotal net assets as at 31 March 2017 . . . . . . . . . . . . . . . . . . . . . . . . 43,826 N/A 57,785 183,410 9,642 N/A
Net asset value per share as at 31 March 2016 . . . . . . . . . . . . . . . 139.74 N/A 75.46 153.98 N/A N/ATotal net assets as at 31 March 2016 . . . . . . . . . . . . . . . . . . . . . . . . 74,342 N/A 188,122 204,177 N/A N/A
Net asset value per share as at 31 March 2015 . . . . . . . . . . . . . . . 150.32 N/A 78.16 158.50 N/A N/ATotal net assets as at 31 March 2015 . . . . . . . . . . . . . . . . . . . . . . . . 12,627 N/A 82,771 79,726 N/A N/A
* The Sub-Fund commenced operations on 30 June 2016.** The Sub-Fund merged into U.S. All Cap Growth Fund on 6 January 2017.*** The Sub-Fund commenced operations on 15 December 2016.
The accompanying notes are an integral part of these financial statements.
China Equity Fund, Emerging Markets Equity Income Fund, Global Focused Equity Fund, Global Opportunity Bond Fund, U.S. Dollar Short-Term Money Market
Fund, U.S. Select Equity Fund, U.S. Short-Term High Yield Bond Fund, U.S. Small Cap Value Fund and USD Investment Grade Credit Fund have not been
authorised by the Hong Kong Securities and Futures Commission and are not available for investment by Hong Kong retail investors.

Statistics (continued) Wells Fargo (Lux) Worldwide Fund 67
U.S.All Cap
GrowthFund
in CCY
U.S.DollarShort-Term
MoneyMarket
Fundin CCY
U.S.HighYieldBondFund
in CCY
U.S.Large
CapGrowth
Fundin CCY
U.S.PremierGrowthFund**
in CCY
U.S.SelectEquity
Fundin CCY
U.S.Short-TermHighYieldBondFund
in CCY
U.S.Small
CapValue
Fund*in CCY
USDInvestment
GradeCredit
Fund***in CCY
N/A N/A N/A N/A N/A N/A N/A N/A N/AN/A N/A N/A N/A N/A N/A N/A N/A N/A
N/A N/A N/A N/A N/A N/A N/A N/A N/AN/A N/A N/A N/A N/A N/A N/A N/A N/A
N/A N/A N/A N/A N/A N/A N/A N/A N/AN/A N/A N/A N/A N/A N/A N/A N/A N/A
238.33 N/A 190.63 180.81 N/A 108.44 114.09 125.01 102.57334,624,615 N/A 221,930,683 962,994 N/A 122,240,183 295,668,685 7,470,098 6,164,457
202.99 N/A 165.22 157.85 149.01 96.00 110.26 N/A N/A395,016,104 N/A 207,317,891 1,635,484 78,095,843 102,994,176 245,524,873 N/A N/A
219.35 N/A 170.56 162.72 157.76 106.39 108.65 N/A N/A941,798,089 N/A 78,344,689 2,068,985 119,175,532 8,382,894 101,654,352 N/A N/A
N/A 1.00 N/A N/A N/A N/A N/A N/A 101.96N/A 324,245,007 N/A N/A N/A N/A N/A N/A 41,910,760
N/A 1.00 N/A N/A N/A N/A N/A N/A N/AN/A 177,457,561 N/A N/A N/A N/A N/A N/A N/A
N/A 1.00 N/A N/A N/A N/A N/A N/A N/AN/A 21,427,790 N/A N/A N/A N/A N/A N/A N/A
N/A N/A 178.17 N/A N/A N/A 110.44 N/A N/AN/A N/A 11,937 N/A N/A N/A 3,359,143 N/A N/A
N/A N/A 165.26 N/A 149.03 N/A 110.30 N/A N/AN/A N/A 10,411 N/A 10,581 N/A 10,037 N/A N/A
N/A N/A N/A N/A N/A 131.19 N/A N/A N/AN/A N/A N/A N/A N/A 8,659 N/A N/A N/A
N/A N/A N/A N/A N/A 101.07 N/A N/A N/AN/A N/A N/A N/A N/A 6,671 N/A N/A N/A
N/A N/A N/A N/A N/A 108.11 N/A N/A N/AN/A N/A N/A N/A N/A 7,135 N/A N/A N/A
N/A N/A N/A N/A N/A 109.01 N/A N/A N/AN/A N/A N/A N/A N/A 110,278,985 N/A N/A N/A
N/A N/A N/A N/A N/A 96.41 N/A N/A N/AN/A N/A N/A N/A N/A 67,078,029 N/A N/A N/A
N/A N/A N/A N/A N/A 106.48 N/A N/A N/AN/A N/A N/A N/A N/A 10,648 N/A N/A N/A
295.41 N/A 165.92 237.49 N/A N/A N/A N/A N/A90,344,649 N/A 39,157 48,685 N/A N/A N/A N/A N/A
219.58 N/A 125.49 181.01 103.81 N/A N/A N/A N/A74,255,588 N/A 87,968 40,727 62,597 N/A N/A N/A N/A
229.83 N/A 125.46 180.78 106.49 N/A 73.08 N/A N/A71,507,008 N/A 13,550 48,991 15,015 N/A 7,162 N/A N/A
The accompanying notes are an integral part of these financial statements.
China Equity Fund, Emerging Markets Equity Income Fund, Global Focused Equity Fund, Global Opportunity Bond Fund, U.S. Dollar Short-Term Money Market
Fund, U.S. Select Equity Fund, U.S. Short-Term High Yield Bond Fund, U.S. Small Cap Value Fund and USD Investment Grade Credit Fund have not been
authorised by the Hong Kong Securities and Futures Commission and are not available for investment by Hong Kong retail investors.
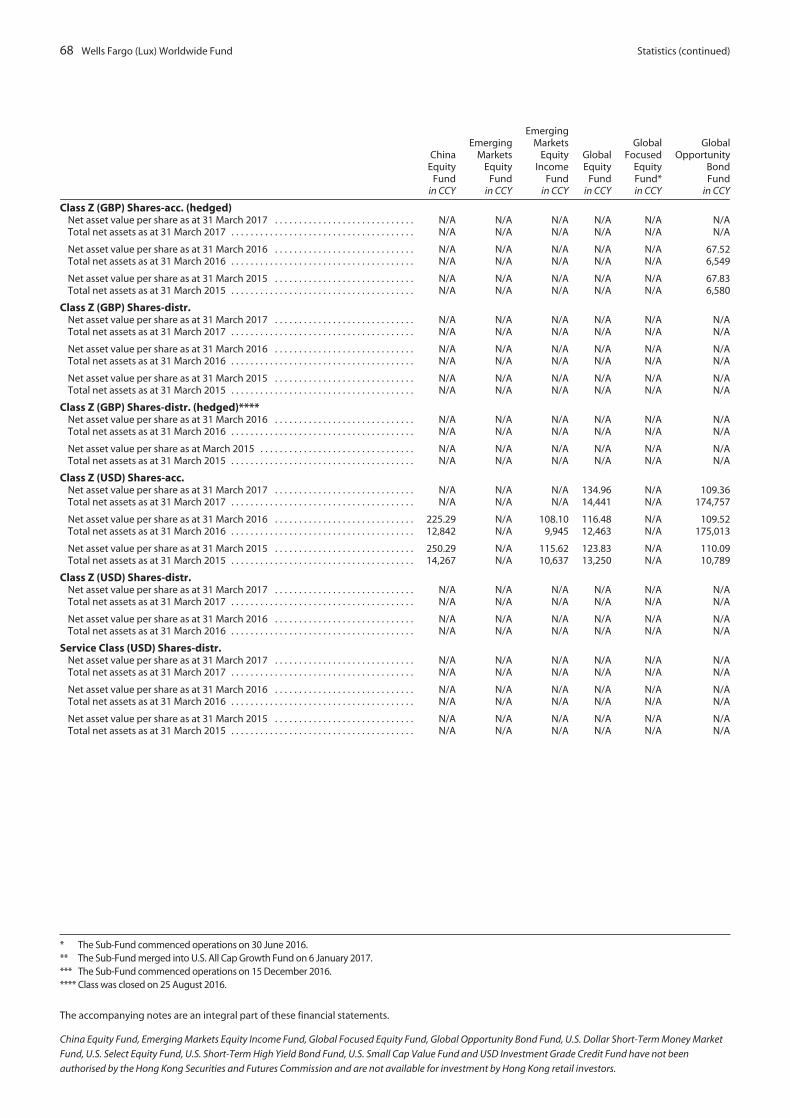
68 Wells Fargo (Lux) Worldwide Fund Statistics (continued)
ChinaEquity
Fundin CCY
EmergingMarkets
EquityFund
in CCY
EmergingMarkets
EquityIncome
Fundin CCY
GlobalEquity
Fundin CCY
GlobalFocused
EquityFund*in CCY
GlobalOpportunity
BondFund
in CCY
Class Z (GBP) Shares-acc. (hedged)Net asset value per share as at 31 March 2017 . . . . . . . . . . . . . . . . . . . . . . . . . . . . . N/A N/A N/A N/A N/A N/ATotal net assets as at 31 March 2017 . . . . . . . . . . . . . . . . . . . . . . . . . . . . . . . . . . . . . . N/A N/A N/A N/A N/A N/A
Net asset value per share as at 31 March 2016 . . . . . . . . . . . . . . . . . . . . . . . . . . . . . N/A N/A N/A N/A N/A 67.52Total net assets as at 31 March 2016 . . . . . . . . . . . . . . . . . . . . . . . . . . . . . . . . . . . . . . N/A N/A N/A N/A N/A 6,549
Net asset value per share as at 31 March 2015 . . . . . . . . . . . . . . . . . . . . . . . . . . . . . N/A N/A N/A N/A N/A 67.83Total net assets as at 31 March 2015 . . . . . . . . . . . . . . . . . . . . . . . . . . . . . . . . . . . . . . N/A N/A N/A N/A N/A 6,580
Class Z (GBP) Shares-distr.Net asset value per share as at 31 March 2017 . . . . . . . . . . . . . . . . . . . . . . . . . . . . . N/A N/A N/A N/A N/A N/ATotal net assets as at 31 March 2017 . . . . . . . . . . . . . . . . . . . . . . . . . . . . . . . . . . . . . . N/A N/A N/A N/A N/A N/A
Net asset value per share as at 31 March 2016 . . . . . . . . . . . . . . . . . . . . . . . . . . . . . N/A N/A N/A N/A N/A N/ATotal net assets as at 31 March 2016 . . . . . . . . . . . . . . . . . . . . . . . . . . . . . . . . . . . . . . N/A N/A N/A N/A N/A N/A
Net asset value per share as at 31 March 2015 . . . . . . . . . . . . . . . . . . . . . . . . . . . . . N/A N/A N/A N/A N/A N/ATotal net assets as at 31 March 2015 . . . . . . . . . . . . . . . . . . . . . . . . . . . . . . . . . . . . . . N/A N/A N/A N/A N/A N/A
Class Z (GBP) Shares-distr. (hedged)****Net asset value per share as at 31 March 2016 . . . . . . . . . . . . . . . . . . . . . . . . . . . . . N/A N/A N/A N/A N/A N/ATotal net assets as at 31 March 2016 . . . . . . . . . . . . . . . . . . . . . . . . . . . . . . . . . . . . . . N/A N/A N/A N/A N/A N/A
Net asset value per share as at March 2015 . . . . . . . . . . . . . . . . . . . . . . . . . . . . . . . . N/A N/A N/A N/A N/A N/ATotal net assets as at 31 March 2015 . . . . . . . . . . . . . . . . . . . . . . . . . . . . . . . . . . . . . . N/A N/A N/A N/A N/A N/A
Class Z (USD) Shares-acc.Net asset value per share as at 31 March 2017 . . . . . . . . . . . . . . . . . . . . . . . . . . . . . N/A N/A N/A 134.96 N/A 109.36Total net assets as at 31 March 2017 . . . . . . . . . . . . . . . . . . . . . . . . . . . . . . . . . . . . . . N/A N/A N/A 14,441 N/A 174,757
Net asset value per share as at 31 March 2016 . . . . . . . . . . . . . . . . . . . . . . . . . . . . . 225.29 N/A 108.10 116.48 N/A 109.52Total net assets as at 31 March 2016 . . . . . . . . . . . . . . . . . . . . . . . . . . . . . . . . . . . . . . 12,842 N/A 9,945 12,463 N/A 175,013
Net asset value per share as at 31 March 2015 . . . . . . . . . . . . . . . . . . . . . . . . . . . . . 250.29 N/A 115.62 123.83 N/A 110.09Total net assets as at 31 March 2015 . . . . . . . . . . . . . . . . . . . . . . . . . . . . . . . . . . . . . . 14,267 N/A 10,637 13,250 N/A 10,789
Class Z (USD) Shares-distr.Net asset value per share as at 31 March 2017 . . . . . . . . . . . . . . . . . . . . . . . . . . . . . N/A N/A N/A N/A N/A N/ATotal net assets as at 31 March 2017 . . . . . . . . . . . . . . . . . . . . . . . . . . . . . . . . . . . . . . N/A N/A N/A N/A N/A N/A
Net asset value per share as at 31 March 2016 . . . . . . . . . . . . . . . . . . . . . . . . . . . . . N/A N/A N/A N/A N/A N/ATotal net assets as at 31 March 2016 . . . . . . . . . . . . . . . . . . . . . . . . . . . . . . . . . . . . . . N/A N/A N/A N/A N/A N/A
Service Class (USD) Shares-distr.Net asset value per share as at 31 March 2017 . . . . . . . . . . . . . . . . . . . . . . . . . . . . . N/A N/A N/A N/A N/A N/ATotal net assets as at 31 March 2017 . . . . . . . . . . . . . . . . . . . . . . . . . . . . . . . . . . . . . . N/A N/A N/A N/A N/A N/A
Net asset value per share as at 31 March 2016 . . . . . . . . . . . . . . . . . . . . . . . . . . . . . N/A N/A N/A N/A N/A N/ATotal net assets as at 31 March 2016 . . . . . . . . . . . . . . . . . . . . . . . . . . . . . . . . . . . . . . N/A N/A N/A N/A N/A N/A
Net asset value per share as at 31 March 2015 . . . . . . . . . . . . . . . . . . . . . . . . . . . . . N/A N/A N/A N/A N/A N/ATotal net assets as at 31 March 2015 . . . . . . . . . . . . . . . . . . . . . . . . . . . . . . . . . . . . . . N/A N/A N/A N/A N/A N/A
* The Sub-Fund commenced operations on 30 June 2016.** The Sub-Fund merged into U.S. All Cap Growth Fund on 6 January 2017.*** The Sub-Fund commenced operations on 15 December 2016.**** Class was closed on 25 August 2016.
The accompanying notes are an integral part of these financial statements.
China Equity Fund, Emerging Markets Equity Income Fund, Global Focused Equity Fund, Global Opportunity Bond Fund, U.S. Dollar Short-Term Money Market
Fund, U.S. Select Equity Fund, U.S. Short-Term High Yield Bond Fund, U.S. Small Cap Value Fund and USD Investment Grade Credit Fund have not been
authorised by the Hong Kong Securities and Futures Commission and are not available for investment by Hong Kong retail investors.
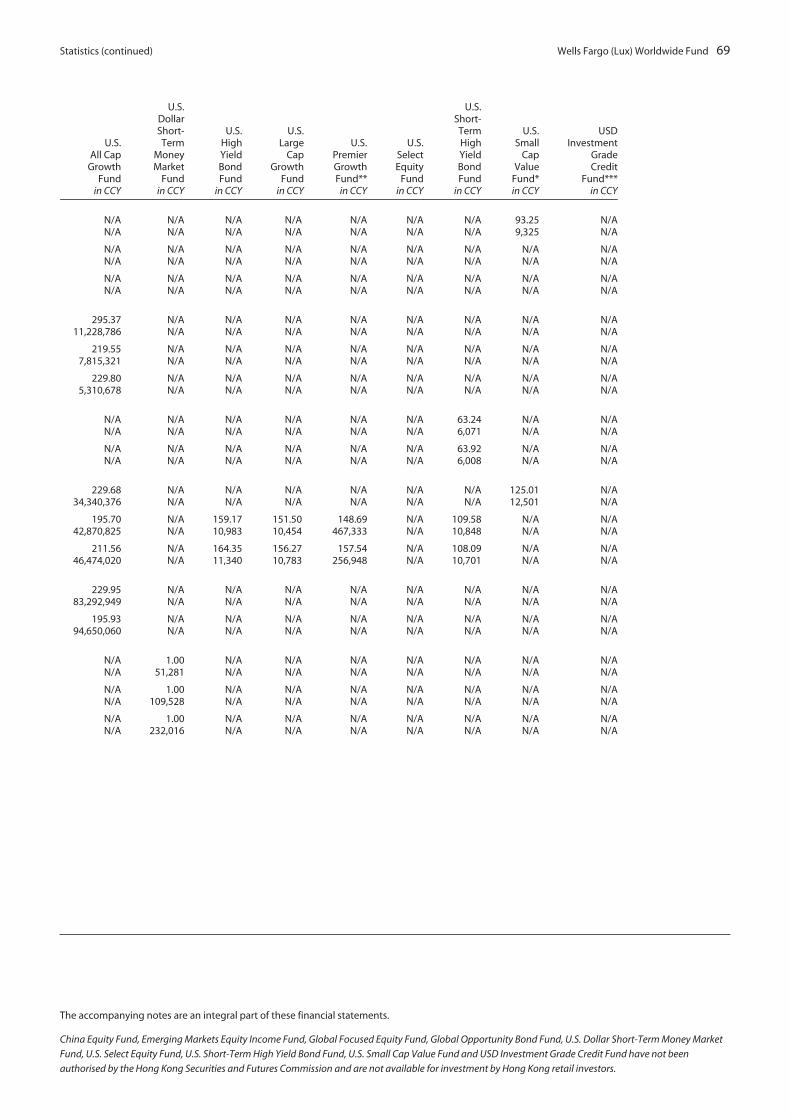
Statistics (continued) Wells Fargo (Lux) Worldwide Fund 69
U.S.All Cap
GrowthFund
in CCY
U.S.DollarShort-Term
MoneyMarket
Fundin CCY
U.S.HighYieldBondFund
in CCY
U.S.Large
CapGrowth
Fundin CCY
U.S.PremierGrowthFund**
in CCY
U.S.SelectEquity
Fundin CCY
U.S.Short-TermHighYieldBondFund
in CCY
U.S.Small
CapValue
Fund*in CCY
USDInvestment
GradeCredit
Fund***in CCY
N/A N/A N/A N/A N/A N/A N/A 93.25 N/AN/A N/A N/A N/A N/A N/A N/A 9,325 N/A
N/A N/A N/A N/A N/A N/A N/A N/A N/AN/A N/A N/A N/A N/A N/A N/A N/A N/A
N/A N/A N/A N/A N/A N/A N/A N/A N/AN/A N/A N/A N/A N/A N/A N/A N/A N/A
295.37 N/A N/A N/A N/A N/A N/A N/A N/A11,228,786 N/A N/A N/A N/A N/A N/A N/A N/A
219.55 N/A N/A N/A N/A N/A N/A N/A N/A7,815,321 N/A N/A N/A N/A N/A N/A N/A N/A
229.80 N/A N/A N/A N/A N/A N/A N/A N/A5,310,678 N/A N/A N/A N/A N/A N/A N/A N/A
N/A N/A N/A N/A N/A N/A 63.24 N/A N/AN/A N/A N/A N/A N/A N/A 6,071 N/A N/A
N/A N/A N/A N/A N/A N/A 63.92 N/A N/AN/A N/A N/A N/A N/A N/A 6,008 N/A N/A
229.68 N/A N/A N/A N/A N/A N/A 125.01 N/A34,340,376 N/A N/A N/A N/A N/A N/A 12,501 N/A
195.70 N/A 159.17 151.50 148.69 N/A 109.58 N/A N/A42,870,825 N/A 10,983 10,454 467,333 N/A 10,848 N/A N/A
211.56 N/A 164.35 156.27 157.54 N/A 108.09 N/A N/A46,474,020 N/A 11,340 10,783 256,948 N/A 10,701 N/A N/A
229.95 N/A N/A N/A N/A N/A N/A N/A N/A83,292,949 N/A N/A N/A N/A N/A N/A N/A N/A
195.93 N/A N/A N/A N/A N/A N/A N/A N/A94,650,060 N/A N/A N/A N/A N/A N/A N/A N/A
N/A 1.00 N/A N/A N/A N/A N/A N/A N/AN/A 51,281 N/A N/A N/A N/A N/A N/A N/A
N/A 1.00 N/A N/A N/A N/A N/A N/A N/AN/A 109,528 N/A N/A N/A N/A N/A N/A N/A
N/A 1.00 N/A N/A N/A N/A N/A N/A N/AN/A 232,016 N/A N/A N/A N/A N/A N/A N/A
The accompanying notes are an integral part of these financial statements.
China Equity Fund, Emerging Markets Equity Income Fund, Global Focused Equity Fund, Global Opportunity Bond Fund, U.S. Dollar Short-Term Money Market
Fund, U.S. Select Equity Fund, U.S. Short-Term High Yield Bond Fund, U.S. Small Cap Value Fund and USD Investment Grade Credit Fund have not been
authorised by the Hong Kong Securities and Futures Commission and are not available for investment by Hong Kong retail investors.

70 Wells Fargo (Lux) Worldwide Fund Notes to financial statements
1. ORGANISATION
Wells Fargo (Lux) Worldwide Fund (the “Fund”) was incorporated for an unlimited period on 20 March 2008 as a société anonymeunder the laws of the Grand Duchy of Luxembourg and qualifies as an open-ended Société d’Investissement à Capital Variableunder part I of the Grand Duchy of Luxembourg law dated 17 December 2010 concerning undertakings for collective investment,as amended. The Fund is registered with the Registre de Commerce et des Sociétés of Luxembourg under Number B 137.479.
The Fund has adopted an umbrella structure, which allows its capital to be divided into different portfolios of securitiesand other assets permitted by law with specific investment objectives and various risk or other characteristics (each a“Sub-Fund”, collectively the “Sub-Funds”).
Global Focused Equity Fund and U.S. Small Cap Value Fund commenced operations on 30 June 2016. USD InvestmentGrade Credit Fund commenced operations on 15 December 2016.
For U.S. Short-Term High Yield Bond Fund, Class I (CHF) Shares-distr. (hedged) and Class Z (GBP) Shares-distr. (hedged)were closed on 25 August 2016.
U.S. Premier Growth Fund merged into U.S. All Cap Growth Fund on 6 January 2017 and shareholders of U.S. PremierGrowth Fund became shareholders of U.S. All Cap Growth Fund. The exchange ratios are disclosed under Note 14.
As at 31 March 2017, the Fund has fourteen Sub-Funds which have the following classes available:
ChinaEquityFund
EmergingMarketsEquityFund
EmergingMarketsEquity
IncomeFund
GlobalEquityFund
GlobalFocused
EquityFund
GlobalOpportunity
BondFund
U.S.All CapGrowth
Fund
U.S.DollarShort-Term
MoneyMarketFund
U.S.HighYieldBondFund
U.S.LargeCap
GrowthFund
U.S.SelectEquityFund
U.S.Short-TermHighYieldBondFund
U.S.SmallCap
ValueFund
USDInvestment
GradeCreditFund
Class A (EUR)Shares-acc. N/A N/A N/A N/A N/A N/A N/A N/A N/A N/A � N/A N/A N/A
Class A (EUR)Shares-acc.(hedged) N/A N/A N/A N/A N/A N/A N/A N/A N/A N/A � � � N/A
Class A (GBP)Shares-acc. N/A � N/A N/A N/A N/A � N/A N/A N/A N/A N/A N/A N/A
Class A (GBP)Shares-distr. N/A N/A N/A N/A N/A N/A N/A N/A N/A N/A � N/A N/A N/A
Class A (SEK)Shares-acc. � N/A N/A N/A N/A N/A N/A N/A N/A N/A N/A N/A N/A N/A
Class A (USD)Shares-acc. � � � � � � � N/A � � � � � �
Class A (USD)Shares-distr. N/A N/A N/A N/A N/A N/A N/A � N/A N/A N/A N/A N/A N/A
Class A (USD)Shares-grossdistr. N/A N/A � N/A N/A N/A N/A N/A � N/A N/A � N/A N/A
Class I (AUD)Shares-distr. N/A � � N/A N/A N/A N/A N/A N/A N/A N/A N/A N/A N/A
Class I (CHF)Shares-acc.(hedged) N/A N/A N/A N/A N/A N/A � N/A N/A N/A N/A N/A N/A N/A
Class I (EUR)Shares-acc. � � � N/A � N/A � N/A � � � N/A N/A N/A
Class I (EUR)Shares-acc.(hedged) N/A N/A N/A N/A N/A � N/A N/A � N/A � N/A � N/A
Class I (EUR)Shares-distr.(hedged) N/A N/A N/A N/A N/A N/A N/A N/A N/A N/A N/A � N/A �
Class I (GBP)Shares-acc. � � N/A N/A � N/A � N/A N/A N/A N/A N/A N/A N/A
Class I (GBP)Shares-acc.(hedged) N/A N/A N/A N/A N/A � N/A N/A N/A N/A N/A N/A � N/A
China Equity Fund, Emerging Markets Equity Income Fund, Global Focused Equity Fund, Global Opportunity Bond Fund, U.S. Dollar Short-Term Money Market
Fund, U.S. Select Equity Fund, U.S. Short-Term High Yield Bond Fund, U.S. Small Cap Value Fund and USD Investment Grade Credit Fund have not been
authorised by the Hong Kong Securities and Futures Commission and are not available for investment by Hong Kong retail investors.
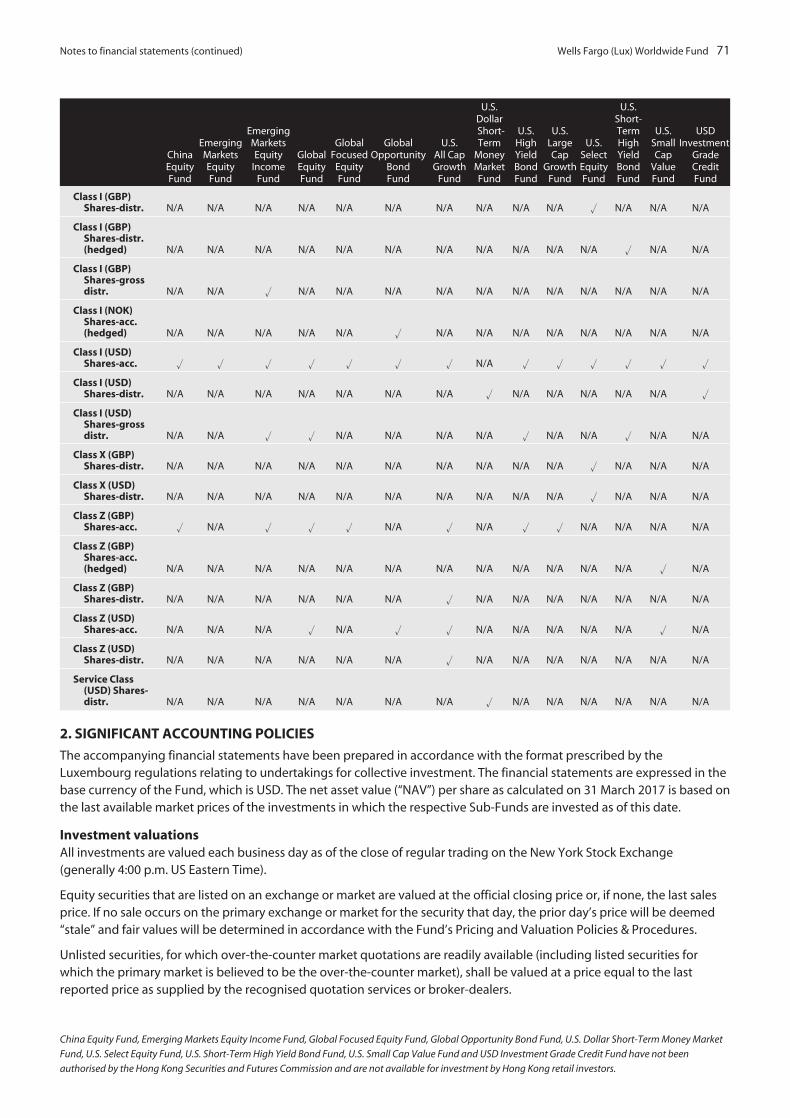
Notes to financial statements (continued) Wells Fargo (Lux) Worldwide Fund 71
ChinaEquityFund
EmergingMarketsEquityFund
EmergingMarketsEquity
IncomeFund
GlobalEquityFund
GlobalFocused
EquityFund
GlobalOpportunity
BondFund
U.S.All CapGrowth
Fund
U.S.DollarShort-Term
MoneyMarketFund
U.S.HighYieldBondFund
U.S.LargeCap
GrowthFund
U.S.SelectEquityFund
U.S.Short-TermHighYieldBondFund
U.S.SmallCap
ValueFund
USDInvestment
GradeCreditFund
Class I (GBP)Shares-distr. N/A N/A N/A N/A N/A N/A N/A N/A N/A N/A � N/A N/A N/A
Class I (GBP)Shares-distr.(hedged) N/A N/A N/A N/A N/A N/A N/A N/A N/A N/A N/A � N/A N/A
Class I (GBP)Shares-grossdistr. N/A N/A � N/A N/A N/A N/A N/A N/A N/A N/A N/A N/A N/A
Class I (NOK)Shares-acc.(hedged) N/A N/A N/A N/A N/A � N/A N/A N/A N/A N/A N/A N/A N/A
Class I (USD)Shares-acc. � � � � � � � N/A � � � � � �
Class I (USD)Shares-distr. N/A N/A N/A N/A N/A N/A N/A � N/A N/A N/A N/A N/A �
Class I (USD)Shares-grossdistr. N/A N/A � � N/A N/A N/A N/A � N/A N/A � N/A N/A
Class X (GBP)Shares-distr. N/A N/A N/A N/A N/A N/A N/A N/A N/A N/A � N/A N/A N/A
Class X (USD)Shares-distr. N/A N/A N/A N/A N/A N/A N/A N/A N/A N/A � N/A N/A N/A
Class Z (GBP)Shares-acc. � N/A � � � N/A � N/A � � N/A N/A N/A N/A
Class Z (GBP)Shares-acc.(hedged) N/A N/A N/A N/A N/A N/A N/A N/A N/A N/A N/A N/A � N/A
Class Z (GBP)Shares-distr. N/A N/A N/A N/A N/A N/A � N/A N/A N/A N/A N/A N/A N/A
Class Z (USD)Shares-acc. N/A N/A N/A � N/A � � N/A N/A N/A N/A N/A � N/A
Class Z (USD)Shares-distr. N/A N/A N/A N/A N/A N/A � N/A N/A N/A N/A N/A N/A N/A
Service Class(USD) Shares-distr. N/A N/A N/A N/A N/A N/A N/A � N/A N/A N/A N/A N/A N/A
2. SIGNIFICANT ACCOUNTING POLICIES
The accompanying financial statements have been prepared in accordance with the format prescribed by theLuxembourg regulations relating to undertakings for collective investment. The financial statements are expressed in thebase currency of the Fund, which is USD. The net asset value (“NAV”) per share as calculated on 31 March 2017 is based onthe last available market prices of the investments in which the respective Sub-Funds are invested as of this date.
Investment valuationsAll investments are valued each business day as of the close of regular trading on the New York Stock Exchange(generally 4:00 p.m. US Eastern Time).
Equity securities that are listed on an exchange or market are valued at the official closing price or, if none, the last salesprice. If no sale occurs on the primary exchange or market for the security that day, the prior day’s price will be deemed“stale” and fair values will be determined in accordance with the Fund’s Pricing and Valuation Policies & Procedures.
Unlisted securities, for which over-the-counter market quotations are readily available (including listed securities forwhich the primary market is believed to be the over-the-counter market), shall be valued at a price equal to the lastreported price as supplied by the recognised quotation services or broker-dealers.
China Equity Fund, Emerging Markets Equity Income Fund, Global Focused Equity Fund, Global Opportunity Bond Fund, U.S. Dollar Short-Term Money Market
Fund, U.S. Select Equity Fund, U.S. Short-Term High Yield Bond Fund, U.S. Small Cap Value Fund and USD Investment Grade Credit Fund have not been
authorised by the Hong Kong Securities and Futures Commission and are not available for investment by Hong Kong retail investors.
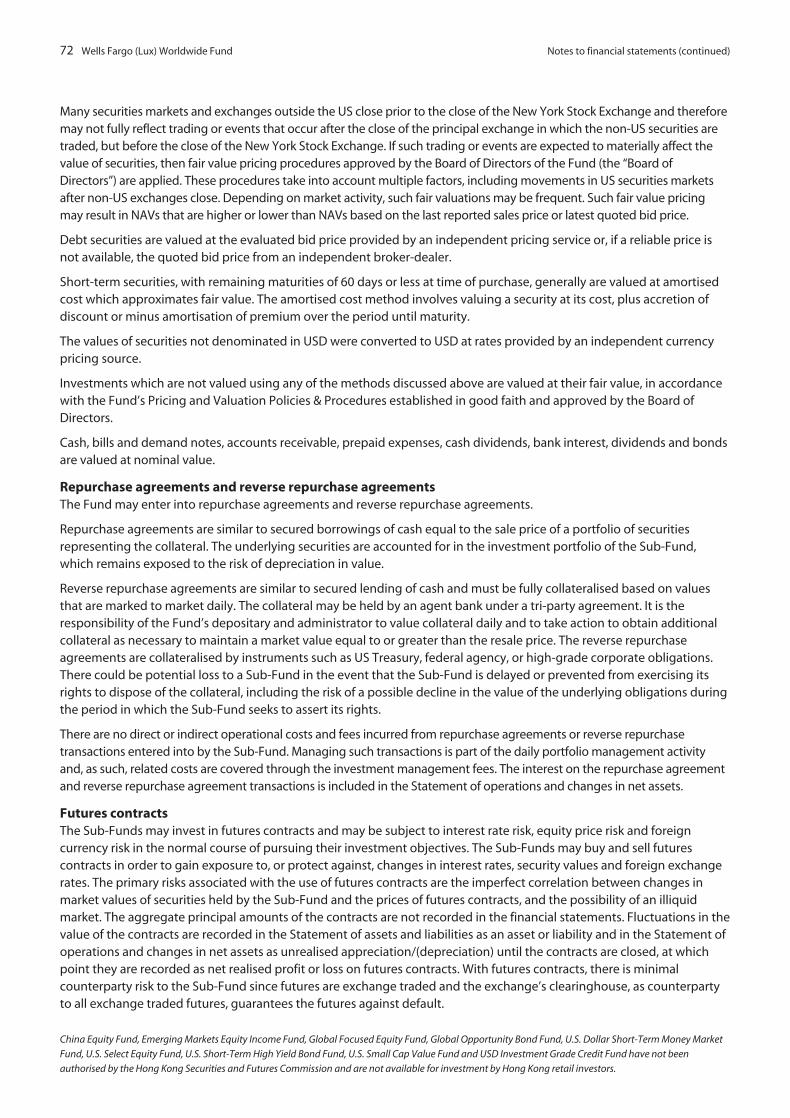
72 Wells Fargo (Lux) Worldwide Fund Notes to financial statements (continued)
Many securities markets and exchanges outside the US close prior to the close of the New York Stock Exchange and thereforemay not fully reflect trading or events that occur after the close of the principal exchange in which the non-US securities aretraded, but before the close of the New York Stock Exchange. If such trading or events are expected to materially affect thevalue of securities, then fair value pricing procedures approved by the Board of Directors of the Fund (the “Board ofDirectors”) are applied. These procedures take into account multiple factors, including movements in US securities marketsafter non-US exchanges close. Depending on market activity, such fair valuations may be frequent. Such fair value pricingmay result in NAVs that are higher or lower than NAVs based on the last reported sales price or latest quoted bid price.
Debt securities are valued at the evaluated bid price provided by an independent pricing service or, if a reliable price isnot available, the quoted bid price from an independent broker-dealer.
Short-term securities, with remaining maturities of 60 days or less at time of purchase, generally are valued at amortisedcost which approximates fair value. The amortised cost method involves valuing a security at its cost, plus accretion ofdiscount or minus amortisation of premium over the period until maturity.
The values of securities not denominated in USD were converted to USD at rates provided by an independent currencypricing source.
Investments which are not valued using any of the methods discussed above are valued at their fair value, in accordancewith the Fund’s Pricing and Valuation Policies & Procedures established in good faith and approved by the Board ofDirectors.
Cash, bills and demand notes, accounts receivable, prepaid expenses, cash dividends, bank interest, dividends and bondsare valued at nominal value.
Repurchase agreements and reverse repurchase agreementsThe Fund may enter into repurchase agreements and reverse repurchase agreements.
Repurchase agreements are similar to secured borrowings of cash equal to the sale price of a portfolio of securitiesrepresenting the collateral. The underlying securities are accounted for in the investment portfolio of the Sub-Fund,which remains exposed to the risk of depreciation in value.
Reverse repurchase agreements are similar to secured lending of cash and must be fully collateralised based on valuesthat are marked to market daily. The collateral may be held by an agent bank under a tri-party agreement. It is theresponsibility of the Fund’s depositary and administrator to value collateral daily and to take action to obtain additionalcollateral as necessary to maintain a market value equal to or greater than the resale price. The reverse repurchaseagreements are collateralised by instruments such as US Treasury, federal agency, or high-grade corporate obligations.There could be potential loss to a Sub-Fund in the event that the Sub-Fund is delayed or prevented from exercising itsrights to dispose of the collateral, including the risk of a possible decline in the value of the underlying obligations duringthe period in which the Sub-Fund seeks to assert its rights.
There are no direct or indirect operational costs and fees incurred from repurchase agreements or reverse repurchasetransactions entered into by the Sub-Fund. Managing such transactions is part of the daily portfolio management activityand, as such, related costs are covered through the investment management fees. The interest on the repurchase agreementand reverse repurchase agreement transactions is included in the Statement of operations and changes in net assets.
Futures contractsThe Sub-Funds may invest in futures contracts and may be subject to interest rate risk, equity price risk and foreigncurrency risk in the normal course of pursuing their investment objectives. The Sub-Funds may buy and sell futurescontracts in order to gain exposure to, or protect against, changes in interest rates, security values and foreign exchangerates. The primary risks associated with the use of futures contracts are the imperfect correlation between changes inmarket values of securities held by the Sub-Fund and the prices of futures contracts, and the possibility of an illiquidmarket. The aggregate principal amounts of the contracts are not recorded in the financial statements. Fluctuations in thevalue of the contracts are recorded in the Statement of assets and liabilities as an asset or liability and in the Statement ofoperations and changes in net assets as unrealised appreciation/(depreciation) until the contracts are closed, at whichpoint they are recorded as net realised profit or loss on futures contracts. With futures contracts, there is minimalcounterparty risk to the Sub-Fund since futures are exchange traded and the exchange’s clearinghouse, as counterpartyto all exchange traded futures, guarantees the futures against default.
China Equity Fund, Emerging Markets Equity Income Fund, Global Focused Equity Fund, Global Opportunity Bond Fund, U.S. Dollar Short-Term Money Market
Fund, U.S. Select Equity Fund, U.S. Short-Term High Yield Bond Fund, U.S. Small Cap Value Fund and USD Investment Grade Credit Fund have not been
authorised by the Hong Kong Securities and Futures Commission and are not available for investment by Hong Kong retail investors.
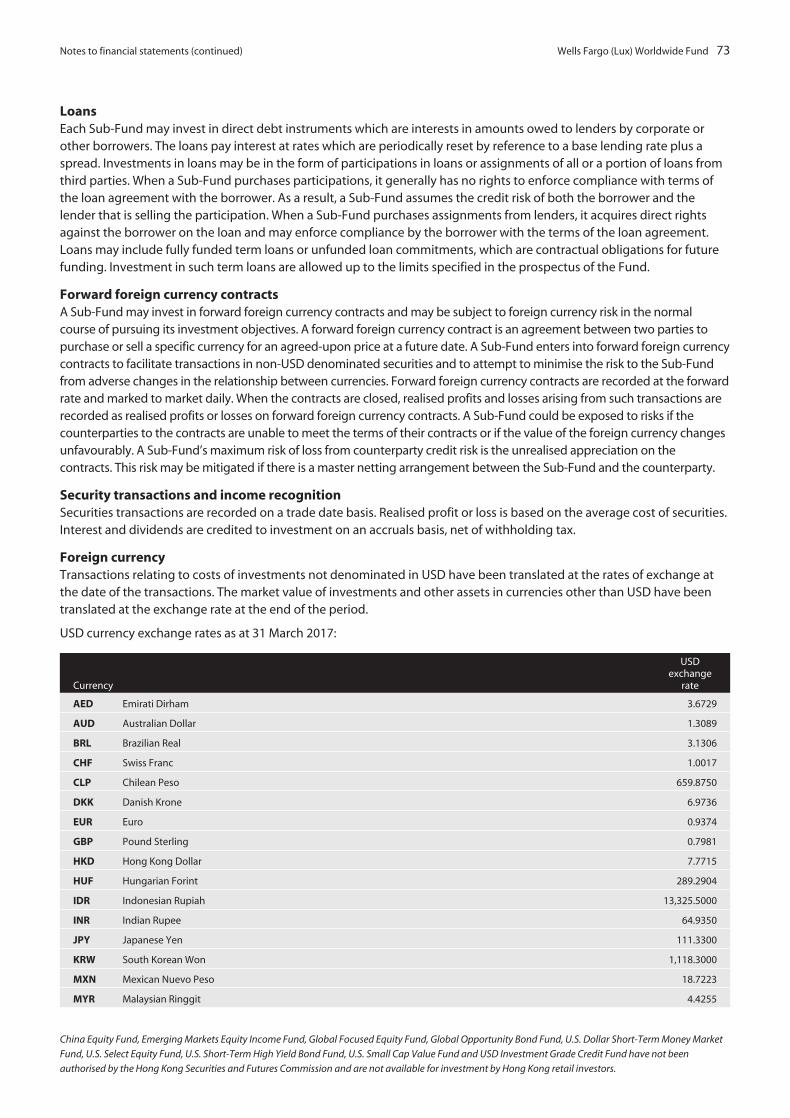
Notes to financial statements (continued) Wells Fargo (Lux) Worldwide Fund 73
LoansEach Sub-Fund may invest in direct debt instruments which are interests in amounts owed to lenders by corporate orother borrowers. The loans pay interest at rates which are periodically reset by reference to a base lending rate plus aspread. Investments in loans may be in the form of participations in loans or assignments of all or a portion of loans fromthird parties. When a Sub-Fund purchases participations, it generally has no rights to enforce compliance with terms ofthe loan agreement with the borrower. As a result, a Sub-Fund assumes the credit risk of both the borrower and thelender that is selling the participation. When a Sub-Fund purchases assignments from lenders, it acquires direct rightsagainst the borrower on the loan and may enforce compliance by the borrower with the terms of the loan agreement.Loans may include fully funded term loans or unfunded loan commitments, which are contractual obligations for futurefunding. Investment in such term loans are allowed up to the limits specified in the prospectus of the Fund.
Forward foreign currency contractsA Sub-Fund may invest in forward foreign currency contracts and may be subject to foreign currency risk in the normalcourse of pursuing its investment objectives. A forward foreign currency contract is an agreement between two parties topurchase or sell a specific currency for an agreed-upon price at a future date. A Sub-Fund enters into forward foreign currencycontracts to facilitate transactions in non-USD denominated securities and to attempt to minimise the risk to the Sub-Fundfrom adverse changes in the relationship between currencies. Forward foreign currency contracts are recorded at the forwardrate and marked to market daily. When the contracts are closed, realised profits and losses arising from such transactions arerecorded as realised profits or losses on forward foreign currency contracts. A Sub-Fund could be exposed to risks if thecounterparties to the contracts are unable to meet the terms of their contracts or if the value of the foreign currency changesunfavourably. A Sub-Fund’s maximum risk of loss from counterparty credit risk is the unrealised appreciation on thecontracts. This risk may be mitigated if there is a master netting arrangement between the Sub-Fund and the counterparty.
Security transactions and income recognitionSecurities transactions are recorded on a trade date basis. Realised profit or loss is based on the average cost of securities.Interest and dividends are credited to investment on an accruals basis, net of withholding tax.
Foreign currencyTransactions relating to costs of investments not denominated in USD have been translated at the rates of exchange atthe date of the transactions. The market value of investments and other assets in currencies other than USD have beentranslated at the exchange rate at the end of the period.
USD currency exchange rates as at 31 March 2017:
Currency
USDexchange
rate
AED Emirati Dirham 3.6729
AUD Australian Dollar 1.3089
BRL Brazilian Real 3.1306
CHF Swiss Franc 1.0017
CLP Chilean Peso 659.8750
DKK Danish Krone 6.9736
EUR Euro 0.9374
GBP Pound Sterling 0.7981
HKD Hong Kong Dollar 7.7715
HUF Hungarian Forint 289.2904
IDR Indonesian Rupiah 13,325.5000
INR Indian Rupee 64.9350
JPY Japanese Yen 111.3300
KRW South Korean Won 1,118.3000
MXN Mexican Nuevo Peso 18.7223
MYR Malaysian Ringgit 4.4255
China Equity Fund, Emerging Markets Equity Income Fund, Global Focused Equity Fund, Global Opportunity Bond Fund, U.S. Dollar Short-Term Money Market
Fund, U.S. Select Equity Fund, U.S. Short-Term High Yield Bond Fund, U.S. Small Cap Value Fund and USD Investment Grade Credit Fund have not been
authorised by the Hong Kong Securities and Futures Commission and are not available for investment by Hong Kong retail investors.
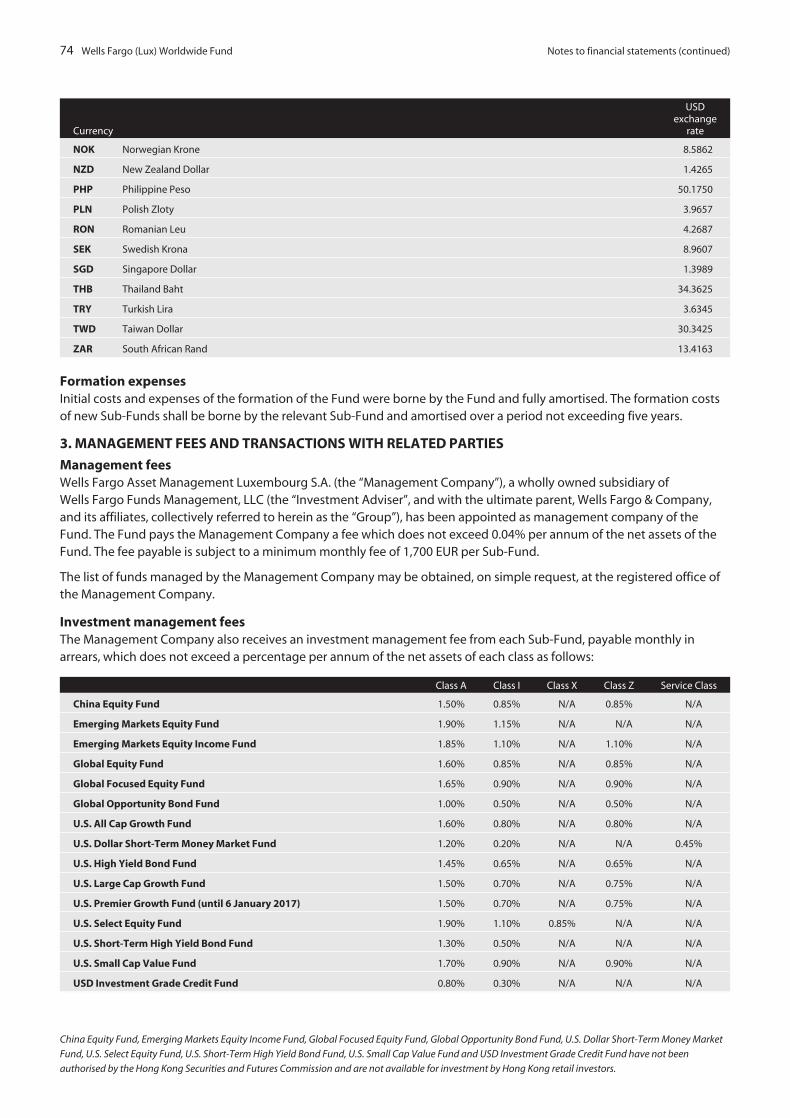
74 Wells Fargo (Lux) Worldwide Fund Notes to financial statements (continued)
Currency
USDexchange
rate
NOK Norwegian Krone 8.5862
NZD New Zealand Dollar 1.4265
PHP Philippine Peso 50.1750
PLN Polish Zloty 3.9657
RON Romanian Leu 4.2687
SEK Swedish Krona 8.9607
SGD Singapore Dollar 1.3989
THB Thailand Baht 34.3625
TRY Turkish Lira 3.6345
TWD Taiwan Dollar 30.3425
ZAR South African Rand 13.4163
Formation expensesInitial costs and expenses of the formation of the Fund were borne by the Fund and fully amortised. The formation costsof new Sub-Funds shall be borne by the relevant Sub-Fund and amortised over a period not exceeding five years.
3. MANAGEMENT FEES AND TRANSACTIONS WITH RELATED PARTIES
Management feesWells Fargo Asset Management Luxembourg S.A. (the “Management Company”), a wholly owned subsidiary ofWells Fargo Funds Management, LLC (the “Investment Adviser”, and with the ultimate parent, Wells Fargo & Company,and its affiliates, collectively referred to herein as the “Group”), has been appointed as management company of theFund. The Fund pays the Management Company a fee which does not exceed 0.04% per annum of the net assets of theFund. The fee payable is subject to a minimum monthly fee of 1,700 EUR per Sub-Fund.
The list of funds managed by the Management Company may be obtained, on simple request, at the registered office ofthe Management Company.
Investment management feesThe Management Company also receives an investment management fee from each Sub-Fund, payable monthly inarrears, which does not exceed a percentage per annum of the net assets of each class as follows:
Class A Class I Class X Class Z Service Class
China Equity Fund 1.50% 0.85% N/A 0.85% N/A
Emerging Markets Equity Fund 1.90% 1.15% N/A N/A N/A
Emerging Markets Equity Income Fund 1.85% 1.10% N/A 1.10% N/A
Global Equity Fund 1.60% 0.85% N/A 0.85% N/A
Global Focused Equity Fund 1.65% 0.90% N/A 0.90% N/A
Global Opportunity Bond Fund 1.00% 0.50% N/A 0.50% N/A
U.S. All Cap Growth Fund 1.60% 0.80% N/A 0.80% N/A
U.S. Dollar Short-Term Money Market Fund 1.20% 0.20% N/A N/A 0.45%
U.S. High Yield Bond Fund 1.45% 0.65% N/A 0.65% N/A
U.S. Large Cap Growth Fund 1.50% 0.70% N/A 0.75% N/A
U.S. Premier Growth Fund (until 6 January 2017) 1.50% 0.70% N/A 0.75% N/A
U.S. Select Equity Fund 1.90% 1.10% 0.85% N/A N/A
U.S. Short-Term High Yield Bond Fund 1.30% 0.50% N/A N/A N/A
U.S. Small Cap Value Fund 1.70% 0.90% N/A 0.90% N/A
USD Investment Grade Credit Fund 0.80% 0.30% N/A N/A N/A
China Equity Fund, Emerging Markets Equity Income Fund, Global Focused Equity Fund, Global Opportunity Bond Fund, U.S. Dollar Short-Term Money Market
Fund, U.S. Select Equity Fund, U.S. Short-Term High Yield Bond Fund, U.S. Small Cap Value Fund and USD Investment Grade Credit Fund have not been
authorised by the Hong Kong Securities and Futures Commission and are not available for investment by Hong Kong retail investors.
Notes to financial statements (continued) Wells Fargo (Lux) Worldwide Fund 75
The Investment Adviser manages the investment and reinvestment of the assets of the Sub-Funds in accordance with theinvestment objectives and restrictions of the Fund, under the overall responsibility of the Board of Directors, and isremunerated for such services by the Management Company.
The Investment Adviser has delegated certain of its functions to sub-advisers within the Group (each a “Sub-Adviser”,collectively the “Sub-Advisers”). Each Sub-Fund (except Global Opportunity Bond Fund) is sub-advised by Wells CapitalManagement Incorporated. Global Opportunity Bond Fund is sub-advised by First International Advisors, LLC. WellsCapital Management Singapore serves as a sub-adviser to Wells Capital Management Incorporated to assist it in the day-to-day asset management of U.S. Dollar Short-Term Money Market Fund. The fees of the Sub-Advisers, except for WellsCapital Management Singapore, are borne by the Investment Adviser. The fees of Wells Capital Management Singaporeare borne by Wells Capital Management Incorporated.
Transactions with other related partiesThe Management Company also acts as the principal distributor of the Fund (referred to herein in such capacity as the“Principal Distributor”). The Principal Distributor has entered into sub-distribution agreements with the followingaffiliated entities (each an “Affiliated Sub-Distributor”, collectively the “Affiliated Sub-Distributors”) pursuant to whicheach Affiliated Sub-Distributor has been appointed as a non-exclusive sub-distributor in respect of the promotion,marketing and sale of shares of one or more of the Sub-Funds:
• Wells Fargo Funds Distributor, LLC ,• Wells Fargo Advisors, LLC ,• Wells Fargo Securities, LLC,• Wells Fargo Securities Asia Limited, and• Wells Fargo Securities International Limited.
Each of the Affiliated Sub-Distributors is an affiliate of the Principal Distributor and may receive compensation from thePrincipal Distributor for the services they provide, if any, in connection with the promotion, marketing and sale of shares.The fees of the Affiliated Sub-Distributors are borne by the Principal Distributor.
The Directors who are also officers and/or directors of the Investment Manager and/or its affiliates do not receiveseparate remuneration from the Issuer. Richard Goddard, Jurgen Meisch and Yves Wagner, who are Directors with noaffiliation with the Investment Manager and/or its affiliates, each receive remuneration at a flat rate with no variableelement. The aggregate Directors’ remuneration relating to the Issuer amounted to EUR 145,477 for the year ended31 March 2017.
No transactions of the Fund were effected through a broker who is an affiliate of the Fund, the Management Company/Principal Distributor, the Investment Adviser, the Sub-Advisers or the Directors of the Fund. All transactions withconnected persons were entered into in the ordinary course of business and under normal commercial terms.
4. DEPOSITARY AND ADMINISTRATION FEES
Brown Brothers Harriman (Luxembourg) S.C.A. has been appointed as the depositary and administrator for the Fund. Thedepositary fee is calculated based on an agreed upon schedule. Under the depositary agreement, Brown BrothersHarriman (Luxembourg) S.C.A. receives annual safekeeping and servicing fees with rates varying according to the countryof investment. Under the administrative agreement, Brown Brothers Harriman (Luxembourg) S.C.A. receives a fee for itsservices according to an agreed upon schedule and is reimbursed for out-of-pocket expenses. The depositary andadministration fees are accrued on each valuation day based on the previous day’s NAV and are paid at the end of eachmonth.
5. REGISTRAR, TRANSFER AGENT AND PAYING AGENT FEES
Brown Brothers Harriman (Luxembourg) S.C.A. also serves as the registrar, transfer agent and paying agent of the Fund.The registrar fees are payable monthly in arrears and are in accordance with relevant agreements.
China Equity Fund, Emerging Markets Equity Income Fund, Global Focused Equity Fund, Global Opportunity Bond Fund, U.S. Dollar Short-Term Money Market
Fund, U.S. Select Equity Fund, U.S. Short-Term High Yield Bond Fund, U.S. Small Cap Value Fund and USD Investment Grade Credit Fund have not been
authorised by the Hong Kong Securities and Futures Commission and are not available for investment by Hong Kong retail investors.

76 Wells Fargo (Lux) Worldwide Fund Notes to financial statements (continued)
6. WAIVED FEES AND REIMBURSED EXPENSES
The waived fees and/or reimbursed expenses represent amounts exceeding the total expense ratio caps of each Sub-Fund during the financial period. These amounts are reimbursed by the Investment Adviser to each relevant Sub-Fundwhen the actual total expense ratio of each class exceeds the following rates:
Class A Class I Class X Class Z Service Class
China Equity Fund 1.80% 1.15% N/A 1.15% N/A
Emerging Markets Equity Fund 2.20% 1.45% N/A N/A N/A
Emerging Markets Equity Income Fund 2.15% 1.40% N/A 1.40% N/A
Global Equity Fund 1.90% 1.15% N/A 1.15% N/A
Global Focused Equity Fund 1.95% 1.20% N/A 1.20% N/A
Global Opportunity Bond Fund 1.20% 0.70% N/A 0.70% N/A
U.S. All Cap Growth Fund 1.90% 1.10% N/A 1.10% N/A
U.S. Dollar Short-Term Money Market Fund 1.20% 0.20% N/A N/A 0.45%
U.S. High Yield Bond Fund 1.75% 0.95% N/A 0.95% N/A
U.S. Large Cap Growth Fund 1.80% 1.00% N/A 1.05% N/A
U.S. Premier Growth Fund (until 6 January 2017) 1.80% 1.00% N/A 1.05% N/A
U.S. Select Equity Fund 2.20% 1.40% 1.15% N/A N/A
U.S. Short-Term High Yield Bond Fund 1.60% 0.80% N/A N/A N/A
U.S. Small Cap Value Fund 2.00% 1.20% N/A 1.20% N/A
USD Investment Grade Credit Fund 0.95% 0.45% N/A N/A N/A
7. DERIVATIVE TRANSACTIONS
During the year ended 31 March 2017, the Sub-Funds entered into forward foreign currency contracts. As at31 March 2017, the Sub-Funds had forward foreign currency contracts outstanding as follows:
Contract type Purpose CounterpartyMaturity
dateContracts
to receive/deliverIn exchange
for USDUSD value at
31/3/2017
USD value ofunrealised
appreciation/(depreciation)
Global Focused Equity Fund
Buy Economic hedging Brown Brothers Harriman 5/4/2017 782,000 EUR 844,489 834,274 (10,215)
Sell Economic hedging Brown Brothers Harriman 5/4/2017 (401,000) GBP 492,817 502,424 (9,607)
Economic hedging Brown Brothers Harriman 5/4/2017 (2,346,700) EUR 2,448,805 2,503,566 (54,761)
Economic hedging Brown Brothers Harriman 22/6/2017 (230,000) GBP 285,034 288,729 (3,695)
Global Opportunity Bond Fund
Buy Economic hedging State Street Bank 17/4/2017 2,200,000 SGD 1,572,197 1,572,886 689
Economic hedging State Street Bank 9/5/2017 10,415,000 MYR 2,346,942 2,350,219 3,277
Economic hedging State Street Bank 15/5/2017 1,280,000,000 KRW 1,140,617 1,145,187 4,570
Economic hedging State Street Bank 22/5/2017 2,315,000 HUF 8,082 8,016 (66)
Currency hedging Brown Brothers Harriman 27/4/2017 67,725 NOK 8,005 7,889 (116)
Currency hedging Brown Brothers Harriman 27/4/2017 13,168,308 GBP 16,615,032 16,507,473 (107,559)
Currency hedging Brown Brothers Harriman 27/4/2017 32,106,301 EUR 35,040,779 34,286,904 (753,875)
Sell Economic hedging State Street Bank 17/4/2017 (2,200,000) SGD 1,546,410 1,572,886 (26,476)
Economic hedging State Street Bank 9/5/2017 (10,415,000) MYR 2,338,978 2,350,220 (11,242)
Economic hedging State Street Bank 11/5/2017 (55,500,000) THB 1,582,414 1,614,606 (32,192)
Economic hedging State Street Bank 15/5/2017 (1,280,000,000) KRW 1,117,123 1,145,186 (28,063)
Economic hedging State Street Bank 16/5/2017 (3,100,000) RON 731,650 726,922 4,728
Economic hedging State Street Bank 22/5/2017 (9,325,000) PLN 2,296,176 2,350,270 (54,094)
Economic hedging State Street Bank 22/5/2017 (220,000,000) HUF 760,446 761,740 (1,294)
Economic hedging State Street Bank 2/6/2017 (2,550,000) BRL 801,534 803,270 (1,736)
China Equity Fund, Emerging Markets Equity Income Fund, Global Focused Equity Fund, Global Opportunity Bond Fund, U.S. Dollar Short-Term Money Market
Fund, U.S. Select Equity Fund, U.S. Short-Term High Yield Bond Fund, U.S. Small Cap Value Fund and USD Investment Grade Credit Fund have not been
authorised by the Hong Kong Securities and Futures Commission and are not available for investment by Hong Kong retail investors.

Notes to financial statements (continued) Wells Fargo (Lux) Worldwide Fund 77
Contract type Purpose CounterpartyMaturity
dateContracts
to receive/deliverIn exchange
for USDUSD value at
31/3/2017
USD value ofunrealised
appreciation/(depreciation)
Global Opportunity Bond Fund (continued)
Sell Economic hedging State Street Bank 6/6/2017 (8,400,000) ZAR 632,383 619,141 13,242
Economic hedging State Street Bank 13/6/2017 (3,200,000) GBP 3,897,206 4,016,084 (118,878)
Economic hedging State Street Bank 13/6/2017 (18,150,000) DKK 2,590,230 2,612,128 (21,898)
Economic hedging State Street Bank 14/6/2017 (4,550,000) NZD 3,140,419 3,183,590 (43,171)
Economic hedging State Street Bank 16/6/2017 (100,000) EUR 108,451 107,056 1,395
Economic hedging State Street Bank 16/6/2017 (1,800,000) EUR 1,923,534 1,927,013 (3,479)
Economic hedging State Street Bank 20/6/2017 (10,450,000) AUD 8,021,650 7,972,340 49,310
U.S. All Cap Growth Fund
Buy Currency hedging Brown Brothers Harriman 27/4/2017 9,717 CHF 9,915 9,714 (201)
U.S. High Yield Bond Fund
Buy Currency hedging Brown Brothers Harriman 27/4/2017 1,563,428 EUR 1,705,991 1,669,613 (36,378)
U.S. Select Equity Fund
Buy Currency hedging Brown Brothers Harriman 27/4/2017 9,060 EUR 9,888 9,675 (213)
Currency hedging Brown Brothers Harriman 27/4/2017 61,502 EUR 67,122 65,679 (1,443)
U.S. Short-Term High Yield Bond Fund
Buy Currency hedging Brown Brothers Harriman 27/4/2017 8,040 EUR 8,775 8,587 (188)
Currency hedging Brown Brothers Harriman 27/4/2017 17,067,878 GBP 21,534,720 21,395,880 (138,840)
Currency hedging Brown Brothers Harriman 27/4/2017 17,385,113 EUR 18,954,870 18,565,859 (389,011)
U.S. Small Cap Value Fund
Buy Currency hedging Brown Brothers Harriman 27/4/2017 18,436 GBP 23,256 23,110 (146)
Currency hedging Brown Brothers Harriman 27/4/2017 21,911 EUR 23,907 23,399 (508)
USD Investment Grade Credit Fund
Buy Currency hedging Brown Brothers Harriman 27/4/2017 49,014,879 EUR 53,493,946 52,343,881 (1,150,065)
8. TAX STATUS
The Fund is not liable for any Luxembourg tax on income, profits or gains, but it is liable in Luxembourg for an annualsubscription tax (“taxe d’abonnement”).
U.S. Dollar Short-Term Money Market Fund is liable in Luxembourg for a taxe d’abonnement at a rate of 0.01% per annumof its net assets, provided, however, that it is exempt from a taxe d’abonnement with respect to each class which isrestricted to institutional investors to the extent its weighted residual portfolio maturity does not exceed 90 days and ithas obtained the highest possible rating from a recognised credit rating agency.
The other Sub-Funds are liable in Luxembourg for a taxe d’abonnement at a rate of (i) 0.05% per annum of the net assetsof each class which is available to all investors and (ii) 0.01% per annum of the net assets of each class which is restrictedto institutional investors.
Each Sub-Fund is liable for value added taxes applicable to certain services, which are applied and incorporated in thefees incurred by each Sub-Fund.
No stamp duty or other tax is payable in Luxembourg on the issue or redemption of shares.
No Luxembourg tax is payable on the realised capital gains or unrealised capital appreciation of the assets of the Fund.
Dividends and interest received by the Fund on its investments are in many cases subject to irrecoverable withholdingtaxes at their source.
9. DISTRIBUTION POLICY
Under normal circumstances, the Board of Directors does not intend to declare and make distributions with respect to the netinvestment income and realised capital gains, if any, attributable to the Accumulation Classes, which are represented with thesuffix “acc.”. Accordingly, the net investment income of the Accumulation Classes will neither be declared nor distributed.However, the NAV per share of these Accumulation Classes will reflect any net investment income or capital gains.
China Equity Fund, Emerging Markets Equity Income Fund, Global Focused Equity Fund, Global Opportunity Bond Fund, U.S. Dollar Short-Term Money Market
Fund, U.S. Select Equity Fund, U.S. Short-Term High Yield Bond Fund, U.S. Small Cap Value Fund and USD Investment Grade Credit Fund have not been
authorised by the Hong Kong Securities and Futures Commission and are not available for investment by Hong Kong retail investors.
78 Wells Fargo (Lux) Worldwide Fund Notes to financial statements (continued)
Under normal circumstances, the Board of Directors intends to make distributions at least annually as at the end of thefinancial year, or at other time(s) to be determined by the Board of Directors, with respect to the net income, if any,attributable to certain Distribution Classes and with respect to gross income, if any, attributable to certain otherDistribution Classes. Distribution Classes that distribute net income will be represented with the suffix “distr.” in the classname and Distribution Classes that distribute gross income will be represented with the suffix “gross distr.” in the classname. A Sub-Fund will re-invest all distributions in additional shares of the same class of shares of the Sub-Fund givingrise to the distribution, and not distribute cash to shareholders in connection with any distributions, unless otherwiseexpressly requested by the relevant shareholder. The frequency of distributions for each Sub-Fund is available underwellsfargoworldwidefund.com.
Shareholders should note that Distribution Classes distributing gross income may result in the shareholder receiving ahigher dividend than they would have otherwise received and therefore may be subject to a higher income tax liability asa result. Shareholders should seek their own professional tax advice in this regard.
Also, with respect to such gross income Distribution Classes, since fees and expenses are applied to capital rather than toincome, the potential for future appreciation of NAV of such shares may be eroded, and, under normal circumstances, theNAV of a gross income Distribution Class will typically be smaller than the NAV of a net income Distribution Class. Asmaller NAV can result in performance variance when comparing gross income versus net income Distribution Classes.
The Board of Directors may amend this policy at any time upon notice without prior shareholder approval.
No distribution may be made which would result in the net assets of the Fund falling below the minimum provided for byLuxembourg law.
Dividends not claimed within five years from their payment date will lapse and revert to the relevant Sub-Fund.
10. SOFT COMMISSION ARRANGEMENTS
Each Sub-Adviser may, in circumstances in which two or more broker-dealers are in a position to offer comparable resultsfor a portfolio transaction, give preference to a broker-dealer that has provided statistical or other research services to theSub-Adviser. In selecting a broker-dealer under these circumstances, each Sub-Adviser will consider, in addition to thefactors listed above, the quality of the research provided by the broker-dealer. Each Sub-Adviser may cause a Sub-Fund topay higher commissions than those obtainable from other broker-dealers in exchange for such research services. Theresearch services generally include: (1) furnishing advice as to the value of securities, the advisability of investing in,purchasing, or selling securities, and the advisability of securities or purchasers or sellers of securities; (2) furnishinganalyses and reports concerning issuers, industries, securities, economic factors and trends, portfolio strategy, and theperformance of accounts; and (3) effecting securities transactions and performing functions incidental thereto. Byallocating transactions in this manner, each Sub-Adviser is able to supplement its research and analysis with the viewsand information of securities firms. Information so received will be in addition to, and not in lieu of, the services requiredto be performed by the Sub-Adviser under the sub-advisory contracts, and the expenses of each Sub-Adviser will notnecessarily be reduced as a result of the receipt of this supplemental research information.
Furthermore, research services furnished by broker-dealers through which each Sub-Adviser places securitiestransactions for a Sub-Fund may be used by the Sub-Adviser in servicing its other accounts, and although not all of theseservices may be used by the Sub-Adviser in connection with advising the Sub-Fund, they will always be in the interest ofthe Sub-Fund.
All Sub-Funds except Global Opportunity Bond Fund, U.S. Dollar Short-Term Money Market Fund, U.S. High Yield BondFund, U.S. Short-Term High Yield Bond Fund and USD Investment Grade Credit Fund participated in soft commissionarrangements.
11. TRANSACTION COSTS
Each Sub-Fund’s transaction costs incurred during the year ended 31 March 2017 relate to the purchase or sale oftransferable securities, derivatives or other eligible assets. Transaction costs include commission costs, settlement fees andbroker fees. Any depositary transaction costs of each Sub-Fund are included on the Statement of operations and changes innet assets under “Depositary and administration fees”. Not all transaction costs are separately identifiable. For fixed incomeinvestments, forward currency contracts and other derivative contracts, transaction costs are included in the purchase andsales price of the investment. These transactions costs are captured within the performance of each Sub-Fund.
China Equity Fund, Emerging Markets Equity Income Fund, Global Focused Equity Fund, Global Opportunity Bond Fund, U.S. Dollar Short-Term Money Market
Fund, U.S. Select Equity Fund, U.S. Short-Term High Yield Bond Fund, U.S. Small Cap Value Fund and USD Investment Grade Credit Fund have not been
authorised by the Hong Kong Securities and Futures Commission and are not available for investment by Hong Kong retail investors.

Notes to financial statements (continued) Wells Fargo (Lux) Worldwide Fund 79
The transaction costs incurred for the year ended 31 March 2017 are as follows:
USD
China Equity Fund 84,430
Emerging Markets Equity Fund 144,074
Emerging Markets Equity Income Fund 921,539
Global Equity Fund 80,840
Global Focused Equity Fund 20,314
Global Opportunity Bond Fund 0
U.S. All Cap Growth Fund 455,944
U.S. Dollar Short-Term Money Market Fund 0
U.S. High Yield Bond Fund 0
U.S. Large Cap Growth Fund 72,811
U.S. Premier Growth Fund (until 6 January 2017) 20,130
U.S. Select Equity Fund 282,579
U.S. Short-Term High Yield Bond Fund 0
U.S. Small Cap Value Fund 16,779
USD Investment Grade Credit Fund 0
12. SWING PRICING
If on any valuation day the aggregate transactions in shares of a Sub-Fund result in a net increase or decrease in netassets which exceeds a certain percentage of total net assets, as established by the Board of Directors, the NAV of therelevant Sub-Fund will be adjusted by an amount not exceeding 1.50% of that NAV, which reflects the estimated dealingcosts that may be incurred by the Sub-Fund and the estimated bid/offer spread of the assets in which the Sub-Fundinvests. The adjustment will be an addition when the net movement results in a net increase in total net assets of the Sub-Fund and a deduction when it results in a net decrease. Where a Sub-Fund invests substantially in government bonds ormoney market securities, the Board of Directors may decide that it is not appropriate to make such an adjustment.
As at 31 March 2017, the NAV of each share class of each Sub-Fund was not subject to any swing pricing adjustment.
13. GOVERNANCE STATEMENT
The Board of Directors adheres to the Association of the Luxembourg Fund Industry (“ALFI”) Code of Conduct forLuxembourg investment funds. The code of conduct sets a framework of high-level principles and best practicerecommendations for the governance of Luxembourg investment funds.
14. SUB-FUND MERGER
Effective at the close of business on 6 January 2017, U.S. Premier Growth Fund merged into U.S. All Cap Growth Fund.Class A, Class I and Class Z shareholders of U.S. Premier Growth Fund received the corresponding class of shares in U.S. AllCap Growth Fund. For one share held in the Sub-Fund, U.S. Premier Growth Fund, shareholders received the followingcorresponding shares of the Sub-Fund, U.S. All Cap Growth Fund:
Exchange ratios
Class A USD 0.73068067
Class I USD 0.70612340
Class I GBP 0.44222996
Class Z USD 0.73079411
Class Z GBP 0.45484579
As a result of the merger, U.S. Premier Growth Fund ceased to exist and its shareholders became shareholders of U.S. AllCap Growth Fund.
China Equity Fund, Emerging Markets Equity Income Fund, Global Focused Equity Fund, Global Opportunity Bond Fund, U.S. Dollar Short-Term Money Market
Fund, U.S. Select Equity Fund, U.S. Short-Term High Yield Bond Fund, U.S. Small Cap Value Fund and USD Investment Grade Credit Fund have not been
authorised by the Hong Kong Securities and Futures Commission and are not available for investment by Hong Kong retail investors.
80 Wells Fargo (Lux) Worldwide Fund Notes to financial statements (continued)
15. SUBSEQUENT EVENTS
On 19 April 2017, Global Opportunity Bond Fund re-opened Class A (EUR) Shares-acc. (hedged).
On 26 April 2017, U.S. Small Cap Value Fund launched Class I (GBP) Shares-acc.
The Fund launched the following Sub-Funds:
Launch date
EUR Investment Grade Credit Fund 19 June 2017
Global Low Volatility Equity Fund 19 June 2017
There were no other significant events occurring after the date of the Statement of Assets and Liabilities which wouldrequire revision of the figures or disclosure in the financial statements.
China Equity Fund, Emerging Markets Equity Income Fund, Global Focused Equity Fund, Global Opportunity Bond Fund, U.S. Dollar Short-Term Money Market
Fund, U.S. Select Equity Fund, U.S. Short-Term High Yield Bond Fund, U.S. Small Cap Value Fund and USD Investment Grade Credit Fund have not been
authorised by the Hong Kong Securities and Futures Commission and are not available for investment by Hong Kong retail investors.
Directors, Administration and Management Wells Fargo (Lux) Worldwide Fund 81
Registered Office80, route d’EschL-1470 LuxembourgGrand Duchy of Luxembourg
Board of DirectorsKarla M. Rabusch (until 16 March 2017)President,Wells Fargo Funds Management, LLC
Michael HoganSenior Vice President,Head of International Strategy and BusinessDevelopmentWells Fargo Funds Management, LLC
Jürgen MeischAchalm Capital GmbH
Yves WagnerThe Directors’ Office S.A.
Richard GoddardThe Directors’ Office S.A.
Management CompanyWells Fargo Asset Management Luxembourg S.A.19, rue de BitbourgL-1273 LuxembourgGrand Duchy of Luxembourg
Investment AdviserWells Fargo Funds Management, LLC525 Market StreetSan Francisco, CA 94105United States of America
Sub-AdvisersFirst International Advisors, LLCOne Plantation Place30 Fenchurch StreetLondon EC3M 3BDUnited Kingdom
Wells Capital Management Incorporated525 Market StreetSan Francisco, CA 94105United States of America
Wells Capital Management Singapore(a department of Wells Fargo Bank, N.A.)80 Raffles Place #26-20/21UOB Plaza TwoSingapore 048624
Principal DistributorWells Fargo Asset Management Luxembourg S.A.19, rue de BitbourgL-1273 LuxembourgGrand Duchy of Luxembourg
Legal AdvisersElvinger Hoss Prussen, Société anonyme2, Place Winston ChurchillL-1340 LuxembourgGrand Duchy of Luxembourg
Depositary Bank, Administrator, Domiciliary,Listing Agent, Paying Agent, Registrar and TransferAgentBrown Brothers Harriman (Luxembourg) S.C.A.80, route d’EschL-1470 LuxembourgGrand Duchy of Luxembourg
Auditors (Cabinet de révision agréé)KPMG Luxembourg, Société cooperative39, Avenue John F. KennedyL-1855 LuxembourgGrand Duchy of Luxembourg
Austrian Paying AgentUniCredit Bank Austria AGSchottengasse 6-81010 ViennaAustria
French Representative and Paying AgentCACEIS Bank France1-3 Place Valhubert75103 ParisFrance
German Paying and Information AgentMarcard, Stein & Co AGBallindamm 3620095 HamburgGermany
Hong Kong RepresentativeBrown Brothers Harriman (Hong Kong) Limited13/F Man Yee Building68 Des Voeux Road CentralHong Kong
Irish Facilities AgentSociété Générale, Dublin BranchIFSC House, 3rd FloorIFSCDublin 1Ireland
China Equity Fund, Emerging Markets Equity Income Fund, Global Focused Equity Fund, Global Opportunity Bond Fund, U.S. Dollar Short-Term Money Market
Fund, U.S. Select Equity Fund, U.S. Short-Term High Yield Bond Fund, U.S. Small Cap Value Fund and USD Investment Grade Credit Fund have not been
authorised by the Hong Kong Securities and Futures Commission and are not available for investment by Hong Kong retail investors.
82 Wells Fargo (Lux) Worldwide Fund Directors, Administration and Management (continued)
Italian Paying AgentSociété Générale Securities Services S.p.A.Via Benigno Crespi 19/A-MAC 220159 MilanItaly
Singapore RepresentativeRBC Investor Services Trust Singapore Limited77 Robinson Road#18-00 Robinson 77Singapore 068896Singapore
Spanish Representative AgentAllfunds Bank S.A.Estafeta, 6, La MoralejaComplejo Plaza de la Fuente Edificio 328109, AlcobendasMadridSpain
Swedish Paying AgentSkandinaviska Enskilda Banken ABSergels Torg H1, SE-106 40 StockholmSweden
Swiss Paying and Representative AgentBNP Paribas Securities Services, S.A.*Succursale de ZurichSelnaustrasse 168002 ZurichSwitzerland
UK RepresentativeWells Fargo Securities International LimitedOne Plantation Place30 Fenchurch StreetLondon EC3M 3BDUnited Kingdom
* BNP Paribas Securities Services, Paris, Succursale de Zurich, Selnaustrasse 16, 8002 Zurich has been authorised by the Swiss Financial MarketSupervisory Authority (FINMA) as Swiss Paying and Representative Agent of the Wells Fargo (Lux) Worldwide Fund. The Wells Fargo (Lux) WorldwideFund’s prospectus, key investor information documents, articles of incorporation, and annual and semi-annual reports, as well as the list ofsubscriptions and redemptions, are available at the office of the Swiss Paying and Representative Agent, free of charge.
China Equity Fund, Emerging Markets Equity Income Fund, Global Focused Equity Fund, Global Opportunity Bond Fund, U.S. Dollar Short-Term Money Market
Fund, U.S. Select Equity Fund, U.S. Short-Term High Yield Bond Fund, U.S. Small Cap Value Fund and USD Investment Grade Credit Fund have not been
authorised by the Hong Kong Securities and Futures Commission and are not available for investment by Hong Kong retail investors.
Report of the Revi seur d'Entreprises agree
To the Shareholders of Wells Fargo (Lux) Worldwide Fund 80, route d'Esch L-14 70 Luxembourg Grand Duchy of Luxembourg
Wells Fargo (Lux) Worldwide Fund 83
REPORT OF THE REVISEUR D'ENTREPRISES AGREE
We have audited the accompanying financial statements of Wells Fargo (Lux) Worldwide Fund (the "SICAV") and each of its sub-funds, which comprise the statement of assets and liabilities and the portfolio of investments as at 31 March 2017 and the statement of operations and changes in net assets for the year then ended, and a summary of significant accounting policies and other explanatory information.
Board of Directors of the SICAV responsibility for the financial statements
The Board of Directors of the SICAV is responsible for the preparation and fair presentation of these financial statements in accordance with Luxembourg legal and regulatory requirements relating to the preparation of the financial statements, and for such internal control as the Board of Directors of the SICAV determines is necessary to enable the preparation of financial statements that are free from material misstatement, whether due to fraud or error.
Responsibility of the Reviseur d'Entreprises agree
Our responsibility is to express an opinion on these financial statements based on our audit. We conducted our audit in accordance w ith International Standards on Auditing as adopted for Luxembourg by the Commission de Surveillance du Secteur Financier. Those standards require that we comply with ethical requirements and plan and perform the audit to obtain reasonable assurance about whether the financial statements are free from material misstatement.
An audit involves performing procedures to obtain audit evidence about the amounts and disclosures in the financial statements. The procedures selected depend on the judgement of the Reviseur d'Entreprises agree, including the assessment of the risks of material misstatement of the financial statements, whether due to fraud or error. In making those risk assessments, the Reviseur d'Entreprises agree considers internal control relevant to the enti ty's preparation and fair presentation of the financial statements in order to design audit procedures that are appropriate in the circumstances, but not for the purpose of expressing an opinion on the effectiveness of the enti ty's internal control.
An audit also includes evaluating the appropriateness of accounting policies used and the reasonableness of accounting estimates made by the Board of Directors of the SICAV, as well as evaluating the overall presentation of the financial statements.
We believe that the audit evidence we have obtained is sufficient and appropriate to provide a basis for our audit opinion.
Opinion
In our opinion, the financial statements give a true and fair view of the financial position of Wells Fargo (Lux) Worldwide Fund and each of its sub-funds as of 31 March 2017, and of the results of their operations and changes in their net assets for the year then ended in accordance with Luxembourg legal and regulatory requirements relating to the preparation of the financial statements.

84 Wells Fargo (Lux) Worldwide Fund Report of the Reviseur d'Entrepri ses agree (continued)
Other information
The Board of directors of the SICAV is responsible for the other information. The other information comprises the information included in the annual report but does not include the financial statements and our report of Reviseur d 'Entreprises agree thereon.
Our opinion on the financial statements does not cover the other information and we do not express any form of assurance conclusion thereon.
In connection with our audit of the financial statements, our responsibil ity is to read the other information and, in doing so, consider whether the other information is materially inconsistent with the financial statements or our knowledge obtained in the audit or otherwise appears to be materially misstated. If, based on the work we have performed, we conclude that there is a material misstatement of this other information, we are required to report this fact. We have nothing to report in this regard
Luxembourg, 28 June 2017 KPMG Luxembourg, Societe cooperative Cabinet de revision agree 39, AvenueJohnF.Kennedy L-1855 Luxembourg Grand Duchy of Luxembourg
L. Aktan
General Information Wells Fargo (Lux) Worldwide Fund 85
Current Prospectus
The Fund’s most recent prospectus and KIIDs may be obtained upon request and free of charge from the InvestmentAdviser, the Administrator and registered office of the Fund or under www.wellsfargoworldwidefund.com.
Publication of Prices and Notices to Shareholders
Notice of general meetings and notices to shareholders are given in accordance with Luxembourg law and regulations.The issue and redemption prices are available from the registered office on each dealing day.
Purchases and Sales
A detailed list of investments purchased and sold for each Sub-Fund during the financial year is available upon request,free of charge, from the registered office of the Fund.*
Reports and Articles of Incorporation of the Fund
Copies of the articles of incorporation of the Fund, this audited annual report and the latest unaudited semi-annualreport may also be obtained free of charge from the registered office of the Fund.
Remuneration
The Management Company, Wells Fargo Asset Management Luxembourg S.A. (“WFAML”), has implemented aremuneration policy in line with current laws and regulations on UCITS funds. The remuneration policy, which has beenapproved by WFAML’s Board of Directors, includes measures to avoid conflicts of interest and seeks to promote soundand effective risk management. The Fund’s prospectus contains a detailed description of the remuneration policy.
As at the end of the Fund’s financial year on 31 March 2017, the aggregate amount of remuneration broken down bycategory of employees or other staff members, following the UCITSV Directive effective date of 18 March 2016, is notavailable for a full performance year and therefore is not included in the annual report.
* A detailed list of investments purchased and sold for each Sub-Fund registered in Germany during the financial period is also available on request, free of charge,at the offices of the German Paying and Information Agent, Marcard, Stein & Co AG, Ballindamm 36, 30095 Hamburg.
China Equity Fund, Emerging Markets Equity Income Fund, Global Focused Equity Fund, Global Opportunity Bond Fund, U.S. Dollar Short-Term Money Market
Fund, U.S. Select Equity Fund, U.S. Short-Term High Yield Bond Fund, U.S. Small Cap Value Fund and USD Investment Grade Credit Fund have not been
authorised by the Hong Kong Securities and Futures Commission and are not available for investment by Hong Kong retail investors.

86 Wells Fargo (Lux) Worldwide Fund Appendix I
Total Expense Ratios (unaudited)
Total Expense Ratio (TER) is calculated as the total of all expenses (excluding bank interest), divided by the average net assets ofthe Sub-Fund, expressed as a percentage. The ratios are annualised and in the process of the average net assets calculation,week-ends are included. The TER excludes the transaction costs disclosed in Note 11 in the Notes to the Financial Statements.
For the year ended 31 March 2017, the TERs are as follows:
China Equity Fund
Gross TER Waiver Net TER*Capped
Expense Ratio
Class A (SEK) Shares-acc. 2.36% (0.25)% 2.11% 1.80%
Class A (USD) Shares-acc. 2.36% (0.24)% 2.12% 1.80%
Class I (EUR) Shares-acc. 1.60% (0.21)% 1.39% 1.15%
Class I (GBP) Shares-acc. 1.60% (0.21)% 1.39% 1.15%
Class I (USD) Shares-acc. 1.60% (0.22)% 1.38% 1.15%
Class Z (GBP) Shares-acc. 1.65% (0.22)% 1.43% 1.15%
* Due to a prospectus change introducing lower caps on expenses in December 2016, current Net TER may exceed Capped Expense Ratio presented.
Emerging Markets Equity Fund
Gross TER Waiver Net TERCapped
Expense Ratio
Class A (GBP) Shares-acc. 2.08% 0.00% 2.08% 2.20%
Class A (USD) Shares-acc. 2.08% 0.00% 2.08% 2.20%
Class I (AUD) Shares-distr. 1.31% 0.00% 1.31% 1.45%
Class I (EUR) Shares-acc. 1.29% 0.00% 1.29% 1.45%
Class I (GBP) Shares-acc. 1.29% 0.00% 1.29% 1.45%
Class I (USD) Shares-acc. 1.29% 0.00% 1.29% 1.45%
Emerging Markets Equity Income Fund
Gross TER Waiver Net TERCapped
Expense Ratio
Class A (USD) Shares-acc. 2.11% 0.00% 2.11% 2.15%
Class A (USD) Shares-gross distr. 2.15% 0.00% 2.15% 2.15%
Class I (AUD) Shares-distr. 1.31% 0.00% 1.31% 1.40%
Class I (EUR) Shares-acc. 1.30% 0.00% 1.30% 1.40%
Class I (GBP) Shares-gross distr. 1.28% 0.00% 1.28% 1.40%
Class I (USD) Shares-acc. 1.32% 0.00% 1.32% 1.40%
Class I (USD) Shares-gross distr. 1.28% 0.00% 1.28% 1.40%
Class Z (GBP) Shares-acc. 1.33% 0.00% 1.33% 1.40%
Global Equity Fund
Gross TER Waiver Net TERCapped
Expense Ratio
Class A (USD) Shares-acc. 1.89% 0.00% 1.89% 1.90%
Class I (USD) Shares-acc. 1.09% 0.00% 1.09% 1.15%
Class I (USD) Shares-gross distr. 1.06% 0.00% 1.06% 1.15%
Class Z (GBP) Shares-acc. 1.13% 0.00% 1.13% 1.15%
Class Z (USD) Shares-acc. 1.11% 0.00% 1.11% 1.15%
China Equity Fund, Emerging Markets Equity Income Fund, Global Focused Equity Fund, Global Opportunity Bond Fund, U.S. Dollar Short-Term Money Market
Fund, U.S. Select Equity Fund, U.S. Short-Term High Yield Bond Fund, U.S. Small Cap Value Fund and USD Investment Grade Credit Fund have not been
authorised by the Hong Kong Securities and Futures Commission and are not available for investment by Hong Kong retail investors.

Appendix I (continued) Wells Fargo (Lux) Worldwide Fund 87
Global Focused Equity Fund
Gross TER Waiver Net TERCapped
Expense Ratio
Class A (USD) Shares-acc.1 3.26% (1.31)% 1.95% 1.95%
Class I (EUR) Shares-acc.1 2.47% (1.27)% 1.20% 1.20%
Class I (GBP) Shares-acc.1 2.46% (1.26)% 1.20% 1.20%
Class I (USD) Shares-acc.1 2.47% (1.27)% 1.20% 1.20%
Class Z (GBP) Shares-acc.1 2.52% (1.32)% 1.20% 1.20%
1 Class commenced operations on 30 June 2016. Data for the TER calculation is and based on information for the period from 30 June 2016 to
31 March 2017 and annualised.
Global Opportunity Bond Fund
Gross TER Waiver Net TERCapped
Expense Ratio
Class A (USD) Shares-acc. 1.57% (0.37)% 1.20% 1.20%
Class I (EUR) Shares-acc. (hedged) 0.91% (0.21)% 0.70% 0.70%
Class I (GBP) Shares-acc. (hedged) 0.89% (0.19)% 0.70% 0.70%
Class I (NOK) Shares-acc. (hedged) 0.77% (0.07)% 0.70% 0.70%
Class I (USD) Shares-acc. 0.84% (0.14)% 0.70% 0.70%
Class Z (USD) Shares-acc. 0.90% (0.20)% 0.70% 0.70%
U.S. All Cap Growth Fund
Gross TER Waiver Net TERCapped
Expense Ratio
Class A (GBP) Shares-acc. 1.73% 0.00% 1.73% 1.90%
Class A (USD) Shares-acc. 1.73% 0.00% 1.73% 1.90%
Class I (CHF) Shares-acc. (hedged) 0.89% 0.00% 0.89% 1.10%
Class I (EUR) Shares-acc. 0.89% 0.00% 0.89% 1.10%
Class I (GBP) Shares-acc. 0.89% 0.00% 0.89% 1.10%
Class I (USD) Shares-acc. 0.90% 0.00% 0.90% 1.10%
Class Z (GBP) Shares-acc. 0.94% 0.00% 0.94% 1.10%
Class Z (GBP) Shares-distr. 0.94% 0.00% 0.94% 1.10%
Class Z (USD) Shares-acc. 0.94% 0.00% 0.94% 1.10%
Class Z (USD) Shares-distr. 0.93% 0.00% 0.93% 1.10%
U.S. Dollar Short-Term Money Market Fund
Gross TER Waiver Net TERCapped
Expense Ratio
Class A (USD) Shares-distr. 1.30% (0.65)% 0.65% 1.20%
Class I (USD) Shares-distr. 0.30% (0.10)% 0.20% 0.20%
Service Class (USD) Shares-distr. 0.55% (0.10)% 0.45% 0.45%
China Equity Fund, Emerging Markets Equity Income Fund, Global Focused Equity Fund, Global Opportunity Bond Fund, U.S. Dollar Short-Term Money Market
Fund, U.S. Select Equity Fund, U.S. Short-Term High Yield Bond Fund, U.S. Small Cap Value Fund and USD Investment Grade Credit Fund have not been
authorised by the Hong Kong Securities and Futures Commission and are not available for investment by Hong Kong retail investors.
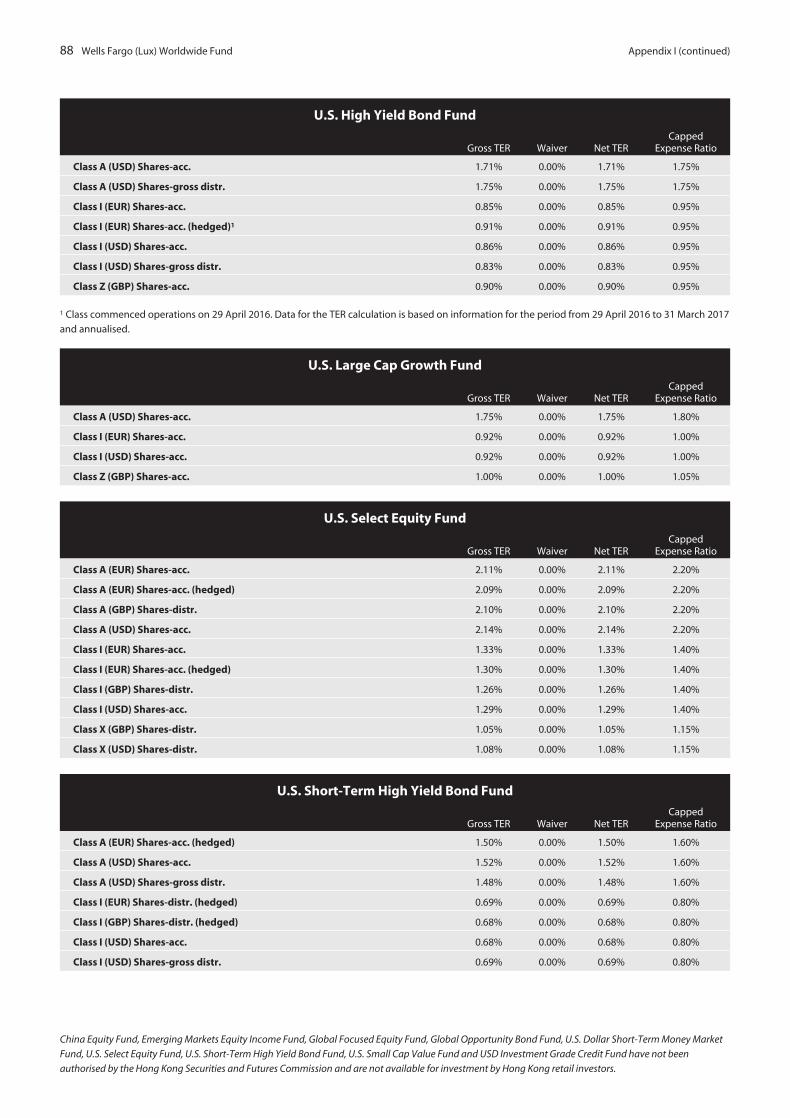
88 Wells Fargo (Lux) Worldwide Fund Appendix I (continued)
U.S. High Yield Bond Fund
Gross TER Waiver Net TERCapped
Expense Ratio
Class A (USD) Shares-acc. 1.71% 0.00% 1.71% 1.75%
Class A (USD) Shares-gross distr. 1.75% 0.00% 1.75% 1.75%
Class I (EUR) Shares-acc. 0.85% 0.00% 0.85% 0.95%
Class I (EUR) Shares-acc. (hedged)1 0.91% 0.00% 0.91% 0.95%
Class I (USD) Shares-acc. 0.86% 0.00% 0.86% 0.95%
Class I (USD) Shares-gross distr. 0.83% 0.00% 0.83% 0.95%
Class Z (GBP) Shares-acc. 0.90% 0.00% 0.90% 0.95%
1 Class commenced operations on 29 April 2016. Data for the TER calculation is based on information for the period from 29 April 2016 to 31 March 2017
and annualised.
U.S. Large Cap Growth Fund
Gross TER Waiver Net TERCapped
Expense Ratio
Class A (USD) Shares-acc. 1.75% 0.00% 1.75% 1.80%
Class I (EUR) Shares-acc. 0.92% 0.00% 0.92% 1.00%
Class I (USD) Shares-acc. 0.92% 0.00% 0.92% 1.00%
Class Z (GBP) Shares-acc. 1.00% 0.00% 1.00% 1.05%
U.S. Select Equity Fund
Gross TER Waiver Net TERCapped
Expense Ratio
Class A (EUR) Shares-acc. 2.11% 0.00% 2.11% 2.20%
Class A (EUR) Shares-acc. (hedged) 2.09% 0.00% 2.09% 2.20%
Class A (GBP) Shares-distr. 2.10% 0.00% 2.10% 2.20%
Class A (USD) Shares-acc. 2.14% 0.00% 2.14% 2.20%
Class I (EUR) Shares-acc. 1.33% 0.00% 1.33% 1.40%
Class I (EUR) Shares-acc. (hedged) 1.30% 0.00% 1.30% 1.40%
Class I (GBP) Shares-distr. 1.26% 0.00% 1.26% 1.40%
Class I (USD) Shares-acc. 1.29% 0.00% 1.29% 1.40%
Class X (GBP) Shares-distr. 1.05% 0.00% 1.05% 1.15%
Class X (USD) Shares-distr. 1.08% 0.00% 1.08% 1.15%
U.S. Short-Term High Yield Bond Fund
Gross TER Waiver Net TERCapped
Expense Ratio
Class A (EUR) Shares-acc. (hedged) 1.50% 0.00% 1.50% 1.60%
Class A (USD) Shares-acc. 1.52% 0.00% 1.52% 1.60%
Class A (USD) Shares-gross distr. 1.48% 0.00% 1.48% 1.60%
Class I (EUR) Shares-distr. (hedged) 0.69% 0.00% 0.69% 0.80%
Class I (GBP) Shares-distr. (hedged) 0.68% 0.00% 0.68% 0.80%
Class I (USD) Shares-acc. 0.68% 0.00% 0.68% 0.80%
Class I (USD) Shares-gross distr. 0.69% 0.00% 0.69% 0.80%
China Equity Fund, Emerging Markets Equity Income Fund, Global Focused Equity Fund, Global Opportunity Bond Fund, U.S. Dollar Short-Term Money Market
Fund, U.S. Select Equity Fund, U.S. Short-Term High Yield Bond Fund, U.S. Small Cap Value Fund and USD Investment Grade Credit Fund have not been
authorised by the Hong Kong Securities and Futures Commission and are not available for investment by Hong Kong retail investors.
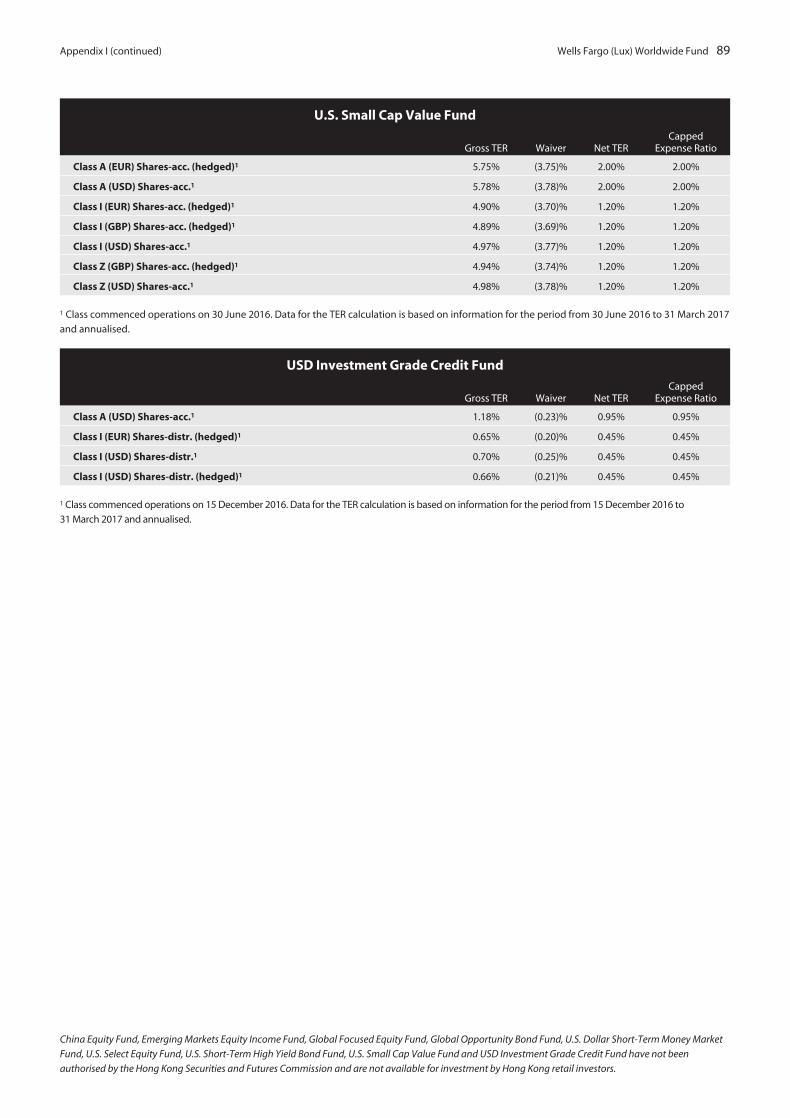
Appendix I (continued) Wells Fargo (Lux) Worldwide Fund 89
U.S. Small Cap Value Fund
Gross TER Waiver Net TERCapped
Expense Ratio
Class A (EUR) Shares-acc. (hedged)1 5.75% (3.75)% 2.00% 2.00%
Class A (USD) Shares-acc.1 5.78% (3.78)% 2.00% 2.00%
Class I (EUR) Shares-acc. (hedged)1 4.90% (3.70)% 1.20% 1.20%
Class I (GBP) Shares-acc. (hedged)1 4.89% (3.69)% 1.20% 1.20%
Class I (USD) Shares-acc.1 4.97% (3.77)% 1.20% 1.20%
Class Z (GBP) Shares-acc. (hedged)1 4.94% (3.74)% 1.20% 1.20%
Class Z (USD) Shares-acc.1 4.98% (3.78)% 1.20% 1.20%
1 Class commenced operations on 30 June 2016. Data for the TER calculation is based on information for the period from 30 June 2016 to 31 March 2017
and annualised.
USD Investment Grade Credit Fund
Gross TER Waiver Net TERCapped
Expense Ratio
Class A (USD) Shares-acc.1 1.18% (0.23)% 0.95% 0.95%
Class I (EUR) Shares-distr. (hedged)1 0.65% (0.20)% 0.45% 0.45%
Class I (USD) Shares-distr.1 0.70% (0.25)% 0.45% 0.45%
Class I (USD) Shares-distr. (hedged)1 0.66% (0.21)% 0.45% 0.45%
1 Class commenced operations on 15 December 2016. Data for the TER calculation is based on information for the period from 15 December 2016 to
31 March 2017 and annualised.
China Equity Fund, Emerging Markets Equity Income Fund, Global Focused Equity Fund, Global Opportunity Bond Fund, U.S. Dollar Short-Term Money Market
Fund, U.S. Select Equity Fund, U.S. Short-Term High Yield Bond Fund, U.S. Small Cap Value Fund and USD Investment Grade Credit Fund have not been
authorised by the Hong Kong Securities and Futures Commission and are not available for investment by Hong Kong retail investors.
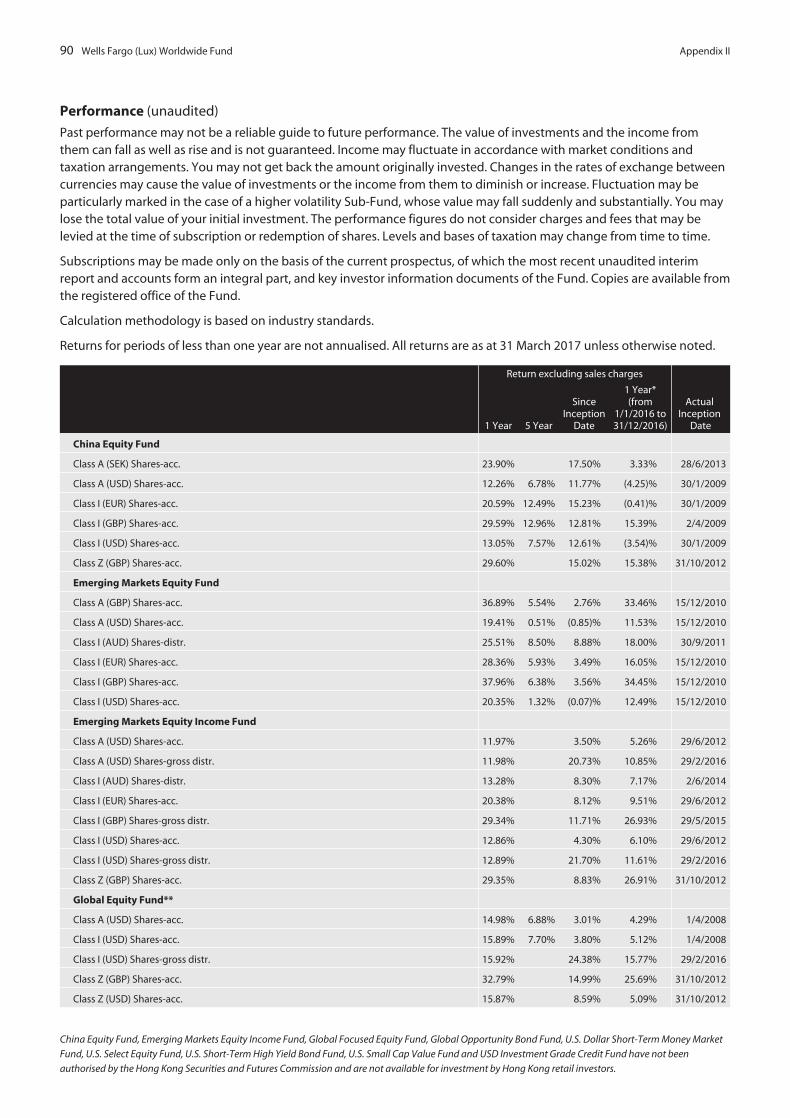
90 Wells Fargo (Lux) Worldwide Fund Appendix II
Performance (unaudited)
Past performance may not be a reliable guide to future performance. The value of investments and the income fromthem can fall as well as rise and is not guaranteed. Income may fluctuate in accordance with market conditions andtaxation arrangements. You may not get back the amount originally invested. Changes in the rates of exchange betweencurrencies may cause the value of investments or the income from them to diminish or increase. Fluctuation may beparticularly marked in the case of a higher volatility Sub-Fund, whose value may fall suddenly and substantially. You maylose the total value of your initial investment. The performance figures do not consider charges and fees that may belevied at the time of subscription or redemption of shares. Levels and bases of taxation may change from time to time.
Subscriptions may be made only on the basis of the current prospectus, of which the most recent unaudited interimreport and accounts form an integral part, and key investor information documents of the Fund. Copies are available fromthe registered office of the Fund.
Calculation methodology is based on industry standards.
Returns for periods of less than one year are not annualised. All returns are as at 31 March 2017 unless otherwise noted.
Return excluding sales charges
ActualInception
Date1 Year 5 Year
SinceInception
Date
1 Year*(from
1/1/2016 to31/12/2016)
China Equity Fund
Class A (SEK) Shares-acc. 23.90% 17.50% 3.33% 28/6/2013
Class A (USD) Shares-acc. 12.26% 6.78% 11.77% (4.25)% 30/1/2009
Class I (EUR) Shares-acc. 20.59% 12.49% 15.23% (0.41)% 30/1/2009
Class I (GBP) Shares-acc. 29.59% 12.96% 12.81% 15.39% 2/4/2009
Class I (USD) Shares-acc. 13.05% 7.57% 12.61% (3.54)% 30/1/2009
Class Z (GBP) Shares-acc. 29.60% 15.02% 15.38% 31/10/2012
Emerging Markets Equity Fund
Class A (GBP) Shares-acc. 36.89% 5.54% 2.76% 33.46% 15/12/2010
Class A (USD) Shares-acc. 19.41% 0.51% (0.85)% 11.53% 15/12/2010
Class I (AUD) Shares-distr. 25.51% 8.50% 8.88% 18.00% 30/9/2011
Class I (EUR) Shares-acc. 28.36% 5.93% 3.49% 16.05% 15/12/2010
Class I (GBP) Shares-acc. 37.96% 6.38% 3.56% 34.45% 15/12/2010
Class I (USD) Shares-acc. 20.35% 1.32% (0.07)% 12.49% 15/12/2010
Emerging Markets Equity Income Fund
Class A (USD) Shares-acc. 11.97% 3.50% 5.26% 29/6/2012
Class A (USD) Shares-gross distr. 11.98% 20.73% 10.85% 29/2/2016
Class I (AUD) Shares-distr. 13.28% 8.30% 7.17% 2/6/2014
Class I (EUR) Shares-acc. 20.38% 8.12% 9.51% 29/6/2012
Class I (GBP) Shares-gross distr. 29.34% 11.71% 26.93% 29/5/2015
Class I (USD) Shares-acc. 12.86% 4.30% 6.10% 29/6/2012
Class I (USD) Shares-gross distr. 12.89% 21.70% 11.61% 29/2/2016
Class Z (GBP) Shares-acc. 29.35% 8.83% 26.91% 31/10/2012
Global Equity Fund**
Class A (USD) Shares-acc. 14.98% 6.88% 3.01% 4.29% 1/4/2008
Class I (USD) Shares-acc. 15.89% 7.70% 3.80% 5.12% 1/4/2008
Class I (USD) Shares-gross distr. 15.92% 24.38% 15.77% 29/2/2016
Class Z (GBP) Shares-acc. 32.79% 14.99% 25.69% 31/10/2012
Class Z (USD) Shares-acc. 15.87% 8.59% 5.09% 31/10/2012
China Equity Fund, Emerging Markets Equity Income Fund, Global Focused Equity Fund, Global Opportunity Bond Fund, U.S. Dollar Short-Term Money Market
Fund, U.S. Select Equity Fund, U.S. Short-Term High Yield Bond Fund, U.S. Small Cap Value Fund and USD Investment Grade Credit Fund have not been
authorised by the Hong Kong Securities and Futures Commission and are not available for investment by Hong Kong retail investors.
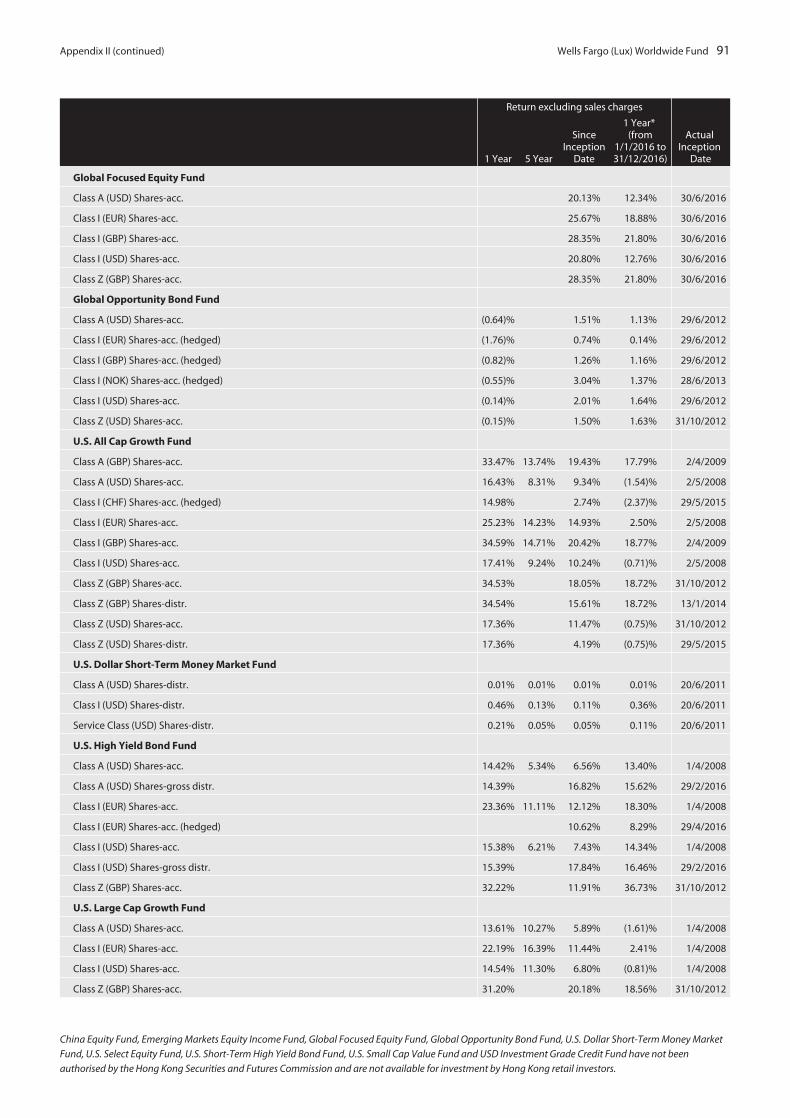
Appendix II (continued) Wells Fargo (Lux) Worldwide Fund 91
Return excluding sales charges
ActualInception
Date1 Year 5 Year
SinceInception
Date
1 Year*(from
1/1/2016 to31/12/2016)
Global Focused Equity Fund
Class A (USD) Shares-acc. 20.13% 12.34% 30/6/2016
Class I (EUR) Shares-acc. 25.67% 18.88% 30/6/2016
Class I (GBP) Shares-acc. 28.35% 21.80% 30/6/2016
Class I (USD) Shares-acc. 20.80% 12.76% 30/6/2016
Class Z (GBP) Shares-acc. 28.35% 21.80% 30/6/2016
Global Opportunity Bond Fund
Class A (USD) Shares-acc. (0.64)% 1.51% 1.13% 29/6/2012
Class I (EUR) Shares-acc. (hedged) (1.76)% 0.74% 0.14% 29/6/2012
Class I (GBP) Shares-acc. (hedged) (0.82)% 1.26% 1.16% 29/6/2012
Class I (NOK) Shares-acc. (hedged) (0.55)% 3.04% 1.37% 28/6/2013
Class I (USD) Shares-acc. (0.14)% 2.01% 1.64% 29/6/2012
Class Z (USD) Shares-acc. (0.15)% 1.50% 1.63% 31/10/2012
U.S. All Cap Growth Fund
Class A (GBP) Shares-acc. 33.47% 13.74% 19.43% 17.79% 2/4/2009
Class A (USD) Shares-acc. 16.43% 8.31% 9.34% (1.54)% 2/5/2008
Class I (CHF) Shares-acc. (hedged) 14.98% 2.74% (2.37)% 29/5/2015
Class I (EUR) Shares-acc. 25.23% 14.23% 14.93% 2.50% 2/5/2008
Class I (GBP) Shares-acc. 34.59% 14.71% 20.42% 18.77% 2/4/2009
Class I (USD) Shares-acc. 17.41% 9.24% 10.24% (0.71)% 2/5/2008
Class Z (GBP) Shares-acc. 34.53% 18.05% 18.72% 31/10/2012
Class Z (GBP) Shares-distr. 34.54% 15.61% 18.72% 13/1/2014
Class Z (USD) Shares-acc. 17.36% 11.47% (0.75)% 31/10/2012
Class Z (USD) Shares-distr. 17.36% 4.19% (0.75)% 29/5/2015
U.S. Dollar Short-Term Money Market Fund
Class A (USD) Shares-distr. 0.01% 0.01% 0.01% 0.01% 20/6/2011
Class I (USD) Shares-distr. 0.46% 0.13% 0.11% 0.36% 20/6/2011
Service Class (USD) Shares-distr. 0.21% 0.05% 0.05% 0.11% 20/6/2011
U.S. High Yield Bond Fund
Class A (USD) Shares-acc. 14.42% 5.34% 6.56% 13.40% 1/4/2008
Class A (USD) Shares-gross distr. 14.39% 16.82% 15.62% 29/2/2016
Class I (EUR) Shares-acc. 23.36% 11.11% 12.12% 18.30% 1/4/2008
Class I (EUR) Shares-acc. (hedged) 10.62% 8.29% 29/4/2016
Class I (USD) Shares-acc. 15.38% 6.21% 7.43% 14.34% 1/4/2008
Class I (USD) Shares-gross distr. 15.39% 17.84% 16.46% 29/2/2016
Class Z (GBP) Shares-acc. 32.22% 11.91% 36.73% 31/10/2012
U.S. Large Cap Growth Fund
Class A (USD) Shares-acc. 13.61% 10.27% 5.89% (1.61)% 1/4/2008
Class I (EUR) Shares-acc. 22.19% 16.39% 11.44% 2.41% 1/4/2008
Class I (USD) Shares-acc. 14.54% 11.30% 6.80% (0.81)% 1/4/2008
Class Z (GBP) Shares-acc. 31.20% 20.18% 18.56% 31/10/2012
China Equity Fund, Emerging Markets Equity Income Fund, Global Focused Equity Fund, Global Opportunity Bond Fund, U.S. Dollar Short-Term Money Market
Fund, U.S. Select Equity Fund, U.S. Short-Term High Yield Bond Fund, U.S. Small Cap Value Fund and USD Investment Grade Credit Fund have not been
authorised by the Hong Kong Securities and Futures Commission and are not available for investment by Hong Kong retail investors.

92 Wells Fargo (Lux) Worldwide Fund Appendix II (continued)
Return excluding sales charges
ActualInception
Date1 Year 5 Year
SinceInception
Date
1 Year*(from
1/1/2016 to31/12/2016)
U.S. Select Equity Fund
Class A (EUR) Shares-acc. 19.51% 5.74% 20.79% 30/1/2015
Class A (EUR) Shares-acc. (hedged) 10.40% 2.13% 15.52% 30/1/2015
Class A (GBP) Shares-distr. 28.43% 12.11% 39.94% 30/1/2015
Class A (USD) Shares-acc. 12.01% 2.96% 16.95% 30/1/2015
Class I (EUR) Shares-acc. 20.62% 6.65% 21.79% 30/1/2015
Class I (EUR) Shares-acc. (hedged) 11.20% 2.88% 16.43% 30/1/2015
Class I (GBP) Shares-distr. 29.51% 13.02% 41.12% 30/1/2015
Class I (USD) Shares-acc. 12.96% 3.81% 17.97% 30/1/2015
Class X (GBP) Shares-distr. 29.80% 13.41% 41.44% 30/1/2015
Class X (USD) Shares-distr. 13.19% 4.16% 18.23% 30/1/2015
U.S. Short-Term High Yield Bond Fund
Class A (EUR) Shares-acc. (hedged) 1.00% 1.30% 1.79% 28/6/2013
Class A (USD) Shares-acc. 2.61% 1.97% 3.20% 29/6/2012
Class A (USD) Shares-gross distr. 2.64% 3.18% 3.03% 29/2/2016
Class I (EUR) Shares-distr. (hedged) 1.86% 2.03% 2.68% 31/7/2013
Class I (GBP) Shares-distr. (hedged) 2.74% 2.47% 3.54% 31/7/2013
Class I (USD) Shares-acc. 3.47% 2.81% 4.08% 29/6/2012
Class I (USD) Shares-gross distr. 3.48% 4.03% 3.73% 29/2/2016
U.S. Small Cap Value Fund
Class A (EUR) Shares-acc. (hedged) 22.97% 25.44% 30/6/2016
Class A (USD) Shares-acc. 24.26% 26.27% 30/6/2016
Class I (EUR) Shares-acc. (hedged) 23.70% 25.93% 30/6/2016
Class I (GBP) Shares-acc. (hedged) 24.13% 26.28% 30/6/2016
Class I (USD) Shares-acc. 25.01% 26.77% 30/6/2016
Class Z (GBP) Shares-acc. (hedged) 24.13% 26.28% 30/6/2016
Class Z (USD) Shares-acc. 25.01% 26.77% 30/6/2016
USD Investment Grade Credit Fund
Class A (USD) Shares-acc. 2.42% 0.92% 15/12/2016
Class I (USD) Shares-acc. 2.57% 0.94% 15/12/2016
Class I (USD) Shares- distr. 2.56% 0.94% 15/12/2016
Class I (EUR) Shares-distr. (hedged) 1.98% 0.82% 15/12/2016
* If a class is less than 1 year old as of December 31, 2016, then inception date through 31 December, 2016 return is shown.
** Global Equity Fund was renamed and repositioned on 17 May 2010. Performance figures, excluding sales charges, include the performance of the
Sub-Fund prior to its repositioning. The performance of each share class prior to and after the repositioning is as follows:
Return excluding sales charges
Inception through16/5/2010
17/5/2010 through31/3/2017
Class A (USD) Shares-acc. . . . . . . . . . . . . . . . . . . . . . (12.75)% 8.48%
Class I (USD) Shares-acc. . . . . . . . . . . . . . . . . . . . . . . (12.09)% 9.31%
China Equity Fund, Emerging Markets Equity Income Fund, Global Focused Equity Fund, Global Opportunity Bond Fund, U.S. Dollar Short-Term Money Market
Fund, U.S. Select Equity Fund, U.S. Short-Term High Yield Bond Fund, U.S. Small Cap Value Fund and USD Investment Grade Credit Fund have not been
authorised by the Hong Kong Securities and Futures Commission and are not available for investment by Hong Kong retail investors.

Appendix II (continued) Wells Fargo (Lux) Worldwide Fund 93
U.S. Dollar Short-Term Money Market Fund (unaudited)
(As at 31 March 2017)Class A (USD)Shares-distr.
Class I (USD)Shares-distr.
Service Class (USD)Shares-distr.
7-day current yield1 0.01% 0.84% 0.59%
7-day compound yield 0.01% 0.84% 0.59%
30-day simple yield 0.01% 0.77% 0.52%
30-day compound yield 0.01% 0.77% 0.52%
1 Without waived fees and/or reimbursed expenses, the Sub-Fund’s 7-day current yield would have been (0.26)%, 0.74% and 0.49% for Class A (USD)
Shares-distr., Class I (USD) Shares-distr. and Service Class (USD) Shares-distr., respectively.
China Equity Fund, Emerging Markets Equity Income Fund, Global Focused Equity Fund, Global Opportunity Bond Fund, U.S. Dollar Short-Term Money Market
Fund, U.S. Select Equity Fund, U.S. Short-Term High Yield Bond Fund, U.S. Small Cap Value Fund and USD Investment Grade Credit Fund have not been
authorised by the Hong Kong Securities and Futures Commission and are not available for investment by Hong Kong retail investors.
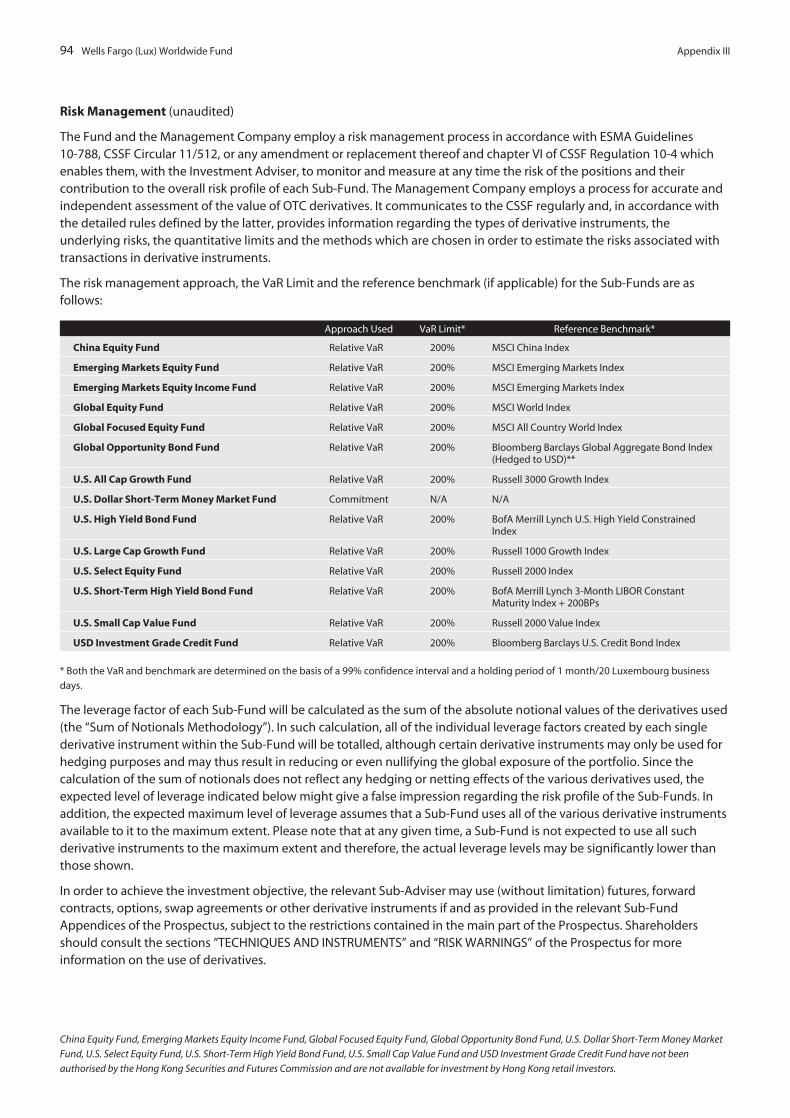
94 Wells Fargo (Lux) Worldwide Fund Appendix III
Risk Management (unaudited)
The Fund and the Management Company employ a risk management process in accordance with ESMA Guidelines10-788, CSSF Circular 11/512, or any amendment or replacement thereof and chapter VI of CSSF Regulation 10-4 whichenables them, with the Investment Adviser, to monitor and measure at any time the risk of the positions and theircontribution to the overall risk profile of each Sub-Fund. The Management Company employs a process for accurate andindependent assessment of the value of OTC derivatives. It communicates to the CSSF regularly and, in accordance withthe detailed rules defined by the latter, provides information regarding the types of derivative instruments, theunderlying risks, the quantitative limits and the methods which are chosen in order to estimate the risks associated withtransactions in derivative instruments.
The risk management approach, the VaR Limit and the reference benchmark (if applicable) for the Sub-Funds are asfollows:
Approach Used VaR Limit* Reference Benchmark*
China Equity Fund Relative VaR 200% MSCI China Index
Emerging Markets Equity Fund Relative VaR 200% MSCI Emerging Markets Index
Emerging Markets Equity Income Fund Relative VaR 200% MSCI Emerging Markets Index
Global Equity Fund Relative VaR 200% MSCI World Index
Global Focused Equity Fund Relative VaR 200% MSCI All Country World Index
Global Opportunity Bond Fund Relative VaR 200% Bloomberg Barclays Global Aggregate Bond Index(Hedged to USD)**
U.S. All Cap Growth Fund Relative VaR 200% Russell 3000 Growth Index
U.S. Dollar Short-Term Money Market Fund Commitment N/A N/A
U.S. High Yield Bond Fund Relative VaR 200% BofA Merrill Lynch U.S. High Yield ConstrainedIndex
U.S. Large Cap Growth Fund Relative VaR 200% Russell 1000 Growth Index
U.S. Select Equity Fund Relative VaR 200% Russell 2000 Index
U.S. Short-Term High Yield Bond Fund Relative VaR 200% BofA Merrill Lynch 3-Month LIBOR ConstantMaturity Index + 200BPs
U.S. Small Cap Value Fund Relative VaR 200% Russell 2000 Value Index
USD Investment Grade Credit Fund Relative VaR 200% Bloomberg Barclays U.S. Credit Bond Index
* Both the VaR and benchmark are determined on the basis of a 99% confidence interval and a holding period of 1 month/20 Luxembourg business
days.
The leverage factor of each Sub-Fund will be calculated as the sum of the absolute notional values of the derivatives used(the “Sum of Notionals Methodology”). In such calculation, all of the individual leverage factors created by each singlederivative instrument within the Sub-Fund will be totalled, although certain derivative instruments may only be used forhedging purposes and may thus result in reducing or even nullifying the global exposure of the portfolio. Since thecalculation of the sum of notionals does not reflect any hedging or netting effects of the various derivatives used, theexpected level of leverage indicated below might give a false impression regarding the risk profile of the Sub-Funds. Inaddition, the expected maximum level of leverage assumes that a Sub-Fund uses all of the various derivative instrumentsavailable to it to the maximum extent. Please note that at any given time, a Sub-Fund is not expected to use all suchderivative instruments to the maximum extent and therefore, the actual leverage levels may be significantly lower thanthose shown.
In order to achieve the investment objective, the relevant Sub-Adviser may use (without limitation) futures, forwardcontracts, options, swap agreements or other derivative instruments if and as provided in the relevant Sub-FundAppendices of the Prospectus, subject to the restrictions contained in the main part of the Prospectus. Shareholdersshould consult the sections “TECHNIQUES AND INSTRUMENTS” and “RISK WARNINGS” of the Prospectus for moreinformation on the use of derivatives.
China Equity Fund, Emerging Markets Equity Income Fund, Global Focused Equity Fund, Global Opportunity Bond Fund, U.S. Dollar Short-Term Money Market
Fund, U.S. Select Equity Fund, U.S. Short-Term High Yield Bond Fund, U.S. Small Cap Value Fund and USD Investment Grade Credit Fund have not been
authorised by the Hong Kong Securities and Futures Commission and are not available for investment by Hong Kong retail investors.

Appendix III (continued) Wells Fargo (Lux) Worldwide Fund 95
Expected Level of Leverage(Notional Method)
China Equity Fund 100%
Emerging Markets Equity Fund 100%
Emerging Markets Equity Income Fund 100%
Global Equity Fund 100%
Global Focused Equity Fund 100%
Global Opportunity Bond Fund 400%
U.S. All Cap Growth Fund 100%
U.S. Dollar Short-Term Money Market Fund 100%
U.S. High Yield Bond Fund 100%
U.S. Large Cap Growth Fund 100%
U.S. Select Equity Fund 100%
U.S. Short-Term High Yield Bond Fund 100%
U.S. Small Cap Value Fund 100%
USD Investment Grade Credit Fund 100%
Upon request of an investor, the Management Company will provide supplementary information relating to thequantitative limits and qualitative criteria that apply in the risk management of each Sub-Fund, to the methods chosen tothis end and to the recent evolution of the risks and yields of the main categories of instruments.
The VaR utilisation information for the applicable Sub-Funds is as follows:
LowestUtilisation
HighestUtilisation
AverageUtilisation
China Equity Fund 94.74% 106.00% 99.73%
Emerging Markets Equity Fund 86.49% 102.48% 93.34%
Emerging Markets Equity Income Fund 82.27% 101.41% 93.35%
Global Equity Fund 92.80% 112.15% 104.36%
Global Focused Equity Fund 26.09%* 117.48% 99.88%
Global Opportunity Bond Fund 46.99% 103.96% 87.08%
U.S. All Cap Growth Fund 106.23% 126.27% 114.38%
U.S. Dollar Short-Term Money Market Fund N/A N/A N/A
U.S. High Yield Bond Fund 82.06% 118.34% 97.33%
U.S. Large Cap Growth Fund 92.11% 115.78% 100.21%
U.S. Select Equity Fund 85.24% 112.24% 99.18%
U.S. Short-Term High Yield Bond Fund 48.61% 77.74% 62.48%
U.S. Small Cap Value Fund 86.40% 96.85% 91.92%
USD Investment Grade Credit Fund 96.10% 108.49% 102.53%
* The lowest utilisation value is due to the built up phase of the portfolio right after launch date.
The VaR utilisation information for the applicable Sub-Funds is as follows:
Systems: FactSetVaR Method: Monte CarloConfidence Level: 99%Holding Period: 20 daysDecay Factor for exponential smoothing of the historical market data: N/APeriod Covered: up to 570 days lookback
China Equity Fund, Emerging Markets Equity Income Fund, Global Focused Equity Fund, Global Opportunity Bond Fund, U.S. Dollar Short-Term Money Market
Fund, U.S. Select Equity Fund, U.S. Short-Term High Yield Bond Fund, U.S. Small Cap Value Fund and USD Investment Grade Credit Fund have not been
authorised by the Hong Kong Securities and Futures Commission and are not available for investment by Hong Kong retail investors.

96 Wells Fargo (Lux) Worldwide Fund Appendix IV
Securities Financing Transactions (unaudited)
Regulation (EU) 2015/2365 of the European Parliament and the Council of 25 November 2015 on transparency ofsecurities financing transactions and of reuse (“SFTR”) introduces reporting requirements for securities financingtransactions (“SFTs”), total return swaps and any financial instruments received as collateral and that is intended to bereused.
SFTs as defined as per Article 3(11) of the SFTR include:
• repurchase/reverse repurchase agreements• securities or commodities lending and securities or commodities borrowing• buy-sell back transactions or sell-buy back transactions, and• margin lending transactions
As at 31 March 2017, U.S. Dollar Short-Term Money Market Fund held reverse repurchase agreements which are underthe scope of the SFTR.
Global dataThe amount of assets across all SFTs as at 31 March 2017 is as follows:
Description Market Value USD % of Net Assets
Reverse repurchase agreements 125,000,000 11.18
Concentration dataThe issuers for collateral securities received across reverse repurchase agreements as at 31 March 2017 are as follows:
Collateral issuer Amount of collateral USD
United States Government 127,500,094
The counterparties across all reverse repurchase agreements as at 31 March 2017 are as follows:
Counterparty of reverse repurchase agreements Market value USD
Bank of Nova Scotia 91,800,060
Merrill Lynch, Pierce, Fenner & Smith Incorporated 35,700,034
Safekeeping of collateral receivedAll collateral received is held by the depositary which is Brown Brothers Harriman (Luxembourg) S.C.A. As at 31 March2017 collateral received is as follow:
Depositary Amount of collateral USD
Brown Brothers Harriman (Luxembourg) S.C.A.
Security collateral 127,500,094
Data on reuse of collateralThere were no collateral securities and cash collateral reused during the year ended 31 March 2017.
ReturnsReturns of reverse repurchase agreement for the year ended 31 March 2017 are as follows:
Returns Amount USD % of overall returns
Reverse repurchase agreements
To Fund 294,492 100.00
China Equity Fund, Emerging Markets Equity Income Fund, Global Focused Equity Fund, Global Opportunity Bond Fund, U.S. Dollar Short-Term Money Market
Fund, U.S. Select Equity Fund, U.S. Short-Term High Yield Bond Fund, U.S. Small Cap Value Fund and USD Investment Grade Credit Fund have not been
authorised by the Hong Kong Securities and Futures Commission and are not available for investment by Hong Kong retail investors.

Appendix IV (continued) Wells Fargo (Lux) Worldwide Fund 97
Aggregate transaction dataThe aggregate transaction data for collateral positions received across all reverse repurchase agreements as at 31 March2017 is as follows:
CounterpartyType of
collateralAmount of
Collateral USDQuality ofcollateral
Maturity ofcollateral
Country ofcounterparty
Settlementand clearing
Reverse repurchase agreements
Bank of Nova Scotia United StatesTreasury Note 35,709,176 Aaa Above one year United States Triparty
Bank of Nova Scotia United StatesTreasury Note 56,090,884 Aaa Above one year United States Triparty
Merrill Lynch, Pierce, Fenner& Smith Incorporated
United StatesTreasury Bond 35,700,034 Aaa Above one year United States Triparty
The maturity of all reverse repurchase agreements as at 31 March 2017 are as follows:
Market Value USD
Maturity of reverse repurchase agreements:
One day to one week 125,000,000
China Equity Fund, Emerging Markets Equity Income Fund, Global Focused Equity Fund, Global Opportunity Bond Fund, U.S. Dollar Short-Term Money Market
Fund, U.S. Select Equity Fund, U.S. Short-Term High Yield Bond Fund, U.S. Small Cap Value Fund and USD Investment Grade Credit Fund have not been
authorised by the Hong Kong Securities and Futures Commission and are not available for investment by Hong Kong retail investors.

More information about the Wells Fargo (Lux)
Worldwide Fund is available free upon request
at its registered office.