wells fargo short-term municipal bond fund...semi-annual report december 31, 2019 wells fargo...
TRANSCRIPT

Semi-Annual Report December 31, 2019
Wells Fargo Short-Term Municipal Bond Fund
Beginning on January 1, 2021, as permitted by new regulations adopted by the Securities and Exchange Commission, paper copies of the Wells Fargo Funds’ annual and semiannual shareholder reports issued after this date will no longer be sent by mail, unless you specifically request paper copies of the reports. Instead, the reports will be made available on the Funds’ website, and you will be notified by mail each time a report is posted and provided with a website address to access the report.
If you already elected to receive shareholder reports electronically, you will not be affected by this change and you need not take any action. You may elect to receive shareholder reports and other communications from the Fund electronically at any time by contacting your financial intermediary (such as a broker-dealer or bank) or, if you are a direct investor, by calling 1-800-222-8222 or by enrolling at wellsfargo.com/advantagedelivery.
You may elect to receive all future reports in paper free of charge. If you invest through a financial intermediary, you can contact your financial intermediary to request that you continue to receive paper copies of your shareholder reports; if you invest directly with the Fund, you can call 1-800-222-8222. Your election to receive reports in paper will apply to all Wells Fargo Funds held in your account with your financial intermediary or, if you are a direct investor, to all Wells Fargo Funds that you hold.


Contents Letter to shareholders . . . . . . . . . . . . . . . . . . . . . . . . . . . . . . . . . . . . . . . . . . . . . . .
. . . . . . . . . . . . . . . . . . . . . . . . . . . . . . . . . . . . . . . . . . . . . .
. . . . . . . . . . . . . . . . . . . . . . . . . . . . . . . . . . . . . . . . . . . . . . . . . . . . . .
. . . . . . . . . . . . . . . . . . . . . . . . . . . . . . . . . . . . . . . . . . . . .
. . . . . . . . . . . . . . . . . . . . . . . . . . . . . . . . . . . . .
. . . . . . . . . . . . . . . . . . . . . . . . . . . . . . . . . . . . . . . . . . . . .
. . . . . . . . . . . . . . . . . . . . . . . . . . . . . . . . . . .
. . . . . . . . . . . . . . . . . . . . . . . . . . . . . . . . . . . . . . . . . . . . . . . . . .
. . . . . . . . . . . . . . . . . . . . . . . . . . . . . . . . . . . . . . . .
. . . . . . . . . . . . . . . . . . . . . . . . . . . . . . . . . . . . . . . . . . . . . . . . . . .
. . . . . . . . . . . . . . . . . . . . . . . . . . . . . . . . . . . . . . . . . . . . . . . . . . . . . . . . . . .
2
Performance highlights 4
Fund expenses 6
Portfolio of investments 7
Financial statements
Statement of assets and liabilities 36
Statement of operations 37
Statement of changes in net assets 38
Financial highlights 39
Notes to financial statements 44
Other information 49
Appendix 53
Reduce clutter. Save trees. Sign up for
electronic delivery
of prospectuses
and shareholder
reports at
wellsfargo.com/ advantagedelivery
The views expressed and any forward-looking statements are as of December 31, 2019, unless otherwise noted, and are those of the Fund managers and/or Wells Fargo Asset Management. Discussions of individual securities, or the markets generally, or any Wells Fargo Fund are not intended as individual recommendations. Future events or results may vary significantly from those expressed in any forward-looking statements. The views expressed are subject to change at any time in response to changing circumstances in the market. Wells Fargo Asset Management and the Fund disclaim any obligation to publicly update or revise any views expressed or forward-looking statements.
INVESTMENT PRODUCTS: NOT FDIC INSURED ▪ NO BANK GUARANTEE ▪ MAY LOSE VALUE
Wells Fargo Short-Term Municipal Bond Fund | 1

Letter to shareholders (unaudited)
Andrew Owen President Wells Fargo Funds
“After periods of
volatility, investors
regrouped midway
through the year,
sentiment turned
positive, and U.S. equity
markets advanced
in July.”
Dear Shareholder: We are pleased to offer you this semi-annual report for the Wells Fargo Short-Term Municipal Bond Fund for the six-month period that ended December 31, 2019. Despite periods of market volatility, the year was strongly positive for financial markets as supportive central banks more than offset concerns over slowing global economic growth and international trade tensions.
Overall, both fixed-income and equity investors enjoyed healthy returns. For the period, U.S. stocks, based on the S&P 500 Index,1 gained 10.92% and international stocks, as measured by the MSCI ACWI ex USA Index (Net),2 returned 6.96%. The MSCI EM Index (Net)3 gained 7.09%. For bond investors, the Bloomberg Barclays U.S. Aggregate Bond Index4 added 2.45%, the Bloomberg Barclays Global Aggregate ex-USD Index5 returned 0.09%, the Bloomberg Barclays Municipal Bond Index6 gained 2.32%, and the ICE BofA U.S. High Yield Index7 added 3.86%.
Sentiment turned positive, driven by central bank support. After periods of volatility, investors regrouped midway through the year, sentiment turned positive, and U.S. equity markets advanced in July. The gains, primarily driven by geopolitical and monetary policy events, pushed equity markets to new highs. European Central Bank President Mario Draghi indicated the bank was ready to cut rates or buy more assets to prop up inflation if needed. President Trump backed off of tariff threats against Mexico and China. The U.S. Federal Reserve (Fed) implemented a 0.25% federal funds rate cut in July.
Throughout the summer, U.S.-China trade tensions simmered. Major U.S. stock market indices closed July with the worst weekly results of the year. Bond prices gained as Treasury yields fell to multiyear lows, and the yield curve inverted at multiple points along the 30-year arc.
Evidence of a continued global economic slowdown mounted, and central banks in China, New Zealand, and Thailand cut interest rates. Industrial and manufacturing data declined in China, Canada, Japan, and Germany. Adding to global uncertainty, Italy’s prime minister resigned, many feared a crackdown in Hong Kong as protestors sustained their calls for reform, and Boris Johnson planned to suspend Parliament as Brexit’s deadline neared.
In the U.S., the Fed cut interest rates a second time in September. U.S. manufacturing data disappointed investors. The U.S. Congress announced it would pursue an impeachment investigation of President Trump. Meanwhile, the Brexit impasse showed no signs of resolution. Officials in China warned of the negative economic impact of tariffs and trade restrictions. Although the S&P 500 Index finished the third quarter with the best year-to-date returns in more than 20 years, concerns about future returns remained.
1 The S&P 500 Index consists of 500 stocks chosen for market size, liquidity, and industry group representation. It is a market-value-weighted index with each stock’s weight in the index proportionate to its market value. You cannot invest directly in an index.
2 The Morgan Stanley Capital International (MSCI) All Country World Index (ACWI) ex USA Index (Net) is a free-float-adjusted marketcapitalization-weighted index that is designed to measure the equity market performance of developed markets, excluding the United States. Source: MSCI. MSCI makes no express or implied warranties or representations and shall have no liability whatsoever with respect to any MSCI data contained herein. The MSCI data may not be further redistributed or used as a basis for other indices or any securities or financial products. This report is not approved, reviewed, or produced by MSCI. You cannot invest directly in an index.
3 The MSCI Emerging Markets (EM) Index (Net) is a free-float-adjusted market-capitalization-weighted index that is designed to measure equity market performance of emerging markets. You cannot invest directly in an index.
4 The Bloomberg Barclays U.S. Aggregate Bond Index is a broad-based benchmark that measures the investment-grade, U.S. dollar-denominated, fixed-rate taxable bond market, including Treasuries, government-related and corporate securities, mortgage-backed securities (agency fixed-rate and hybrid adjustable-rate mortgage pass-throughs), asset-backed securities, and commercial mortgage-backed securities. You cannot invest directly in an index.
5 The Bloomberg Barclays Global Aggregate ex-USD Index is an unmanaged index that provides a broad-based measure of the global investment-grade fixed-income markets excluding the U.S. dollar-denominated debt market. You cannot invest directly in an index.
6 The Bloomberg Barclays Municipal Bond Index is an unmanaged index composed of long-term tax-exempt bonds with a minimum credit rating of Baa. You cannot invest directly in an index.
7 The ICE BofA U.S. High Yield Index is a market-capitalization-weighted index of domestic and Yankee high-yield bonds. The index tracks the performance of high-yield securities traded in the U.S. bond market. You cannot invest directly in an index. Copyright 2020. ICE Data Indices, LLC. All rights reserved.
2 | Wells Fargo Short-Term Municipal Bond Fund
Letter to shareholders (unaudited)
The fourth quarter started on a strong note, with a relaxing of U.S.-China trade tensions in October along with renewed optimism for a U.K. Brexit deal and positive macroeconomic data. The initial estimate of U.S. third-quarter gross domestic product growth was a 1.9% annualized rate, while the U.S. unemployment rate fell to a 50-year low of 3.5% in September. However, despite resilience among U.S. consumers, business confidence declined while manufacturing activity contracted. Concerned with a potential economic slowdown, the Fed lowered interest rates another quarter point in late October, its third rate cut in four months. This helped push the S&P 500 Index to a new all-time high, while emerging market equities rallied and global bonds declined overall, reflecting a broad pickup in risk appetite.
Equity markets continued to rally in November despite ongoing geopolitical risks. Hopes for a U.S.-China trade deal buoyed investor confidence. U.S. business sentiment improved slightly, and manufacturing and services activity picked up. Throughout the month, central bank actions were on hold. With that positive backdrop, developed market equities outpaced those in emerging markets, and U.S. stocks outperformed non-U.S. stocks overall. While consumer confidence and purchasing manager activity rose in the eurozone, China reported weakening manufacturing and consumer data. Bond yields rose marginally, leading to slightly negative returns for global government and investment-grade corporate bonds.
Financial markets ended the year on a strong note, with the U.S. and China reaching a Phase One trade deal, with some details to be worked out. That, along with the landslide election win by the pro-Brexit U.K. Conservative Party and ongoing central bank support, gave investors a greater sense of certainty. U.S. economic indicators were broadly positive, with the exception of manufacturing activity and business confidence. Consumer confidence was resilient, fed by a robust labor market, tame inflation, and lower interest rates, which boosted housing affordability and homebuyer activity. The impeachment of U.S. President Donald Trump, while historically noteworthy, had little impact on markets. Meanwhile, slowing Chinese economic activity, due in part to the trade war, led to further government stimulus at year-end through lower reserve ratios, allowing banks to lend more money.
“Financial markets ended
the year on a strong note,
with the U.S. and China
reaching a Phase One
trade deal”
Don’t let short-term uncertainty derail long-term investment goals. Periods of investment uncertainty can present challenges, but experience has taught us that maintaining long-term investment goals can be an effective way to plan for the future. To help you create a sound strategy based on your personal goals and risk tolerance, Wells Fargo Funds offers more than 100 mutual funds spanning a wide range of asset classes and investment styles. Although diversification cannot guarantee an investment profit or prevent losses, we believe it can be an effective way to manage investment risk and potentially smooth out overall portfolio performance. We encourage investors to know their investments and to understand that appropriate levels of risk-taking may unlock opportunities.
For further
information about
your Fund, contact
your investment
professional, visit our
website at wfam.com,
or call us directly at
1-800-222-8222.
Thank you for choosing to invest with Wells Fargo Funds. We appreciate your confidence in us and remain committed to helping you meet your financial needs.
Sincerely,
Andrew Owen President Wells Fargo Funds
Wells Fargo Short-Term Municipal Bond Fund | 3
Performance highlights (unaudited)
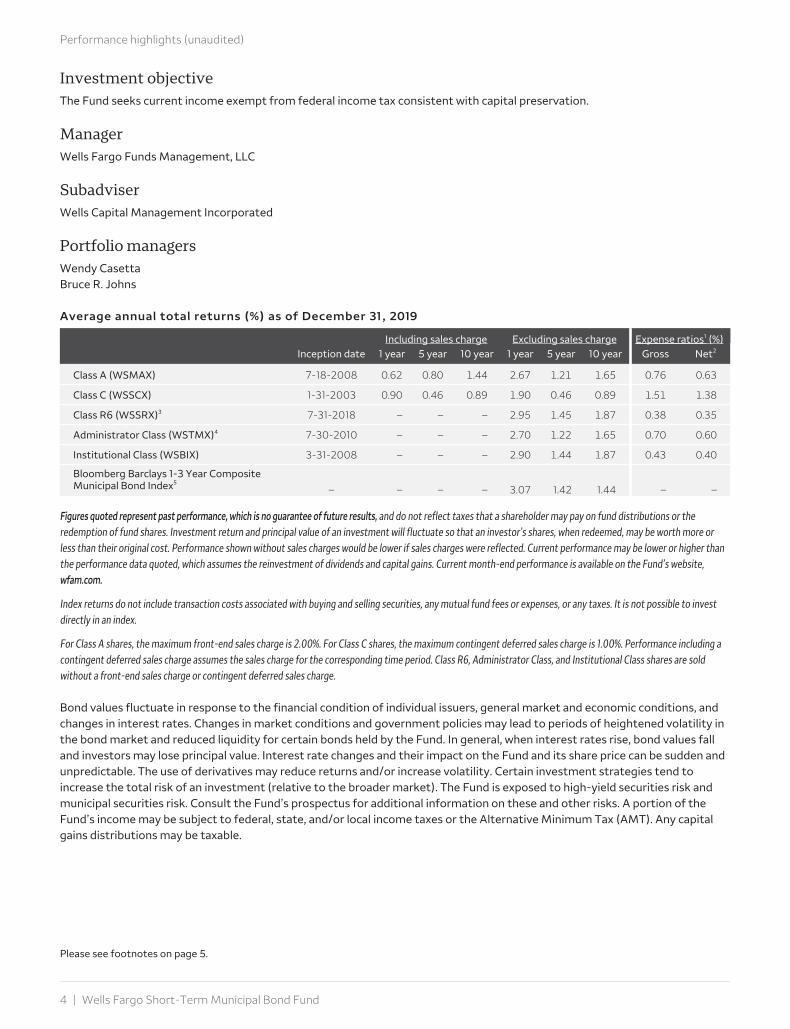
Investment objective The Fund seeks current income exempt from federal income tax consistent with capital preservation.
Manager Wells Fargo Funds Management, LLC
Subadviser Wells Capital Management Incorporated
Portfolio managers Wendy Casetta Bruce R. Johns
Average annual total returns (%) as of December 31 , 2019
Inception date Including sales charge
1 year 5 year 10 year Excluding sales charge
1 year 5 year 10 year Expense ratios1 (%)
Gross Net2
Class A (WSMAX) 7-18-2008 0.62 0.80 1.44 2.67 1.21 1.65 0.76 0.63
Class C (WSSCX) 1-31-2003 0.90 0.46 0.89 1.90 0.46 0.89 1.51 1.38
Class R6 (WSSRX)3 7-31-2018 – – – 2.95 1.45 1.87 0.38 0.35
Administrator Class (WSTMX)4 7-30-2010 – – – 2.70 1.22 1.65 0.70 0.60
Institutional Class (WSBIX) 3-31-2008 – – – 2.90 1.44 1.87 0.43 0.40
Bloomberg Barclays 1-3 Year Composite Municipal Bond Index5 – – – – 3.07 1.42 1.44 – –
Figures quoted represent past performance, which is no guarantee of future results, and do not reflect taxes that a shareholder may pay on fund distributions or the redemption of fund shares. Investment return and principal value of an investment will fluctuate so that an investor’s shares, when redeemed, may be worth more or less than their original cost. Performance shown without sales charges would be lower if sales charges were reflected. Current performance may be lower or higher than the performance data quoted, which assumes the reinvestment of dividends and capital gains. Current month-end performance is available on the Fund’s website, wfam.com.
Index returns do not include transaction costs associated with buying and selling securities, any mutual fund fees or expenses, or any taxes. It is not possible to invest directly in an index.
For Class A shares, the maximum front-end sales charge is 2.00%. For Class C shares, the maximum contingent deferred sales charge is 1.00%. Performance including a contingent deferred sales charge assumes the sales charge for the corresponding time period. Class R6, Administrator Class, and Institutional Class shares are sold without a front-end sales charge or contingent deferred sales charge.
Bond values fluctuate in response to the financial condition of individual issuers, general market and economic conditions, and changes in interest rates. Changes in market conditions and government policies may lead to periods of heightened volatility in the bond market and reduced liquidity for certain bonds held by the Fund. In general, when interest rates rise, bond values fall and investors may lose principal value. Interest rate changes and their impact on the Fund and its share price can be sudden and unpredictable. The use of derivatives may reduce returns and/or increase volatility. Certain investment strategies tend to increase the total risk of an investment (relative to the broader market). The Fund is exposed to high-yield securities risk and municipal securities risk. Consult the Fund’s prospectus for additional information on these and other risks. A portion of the Fund’s income may be subject to federal, state, and/or local income taxes or the Alternative Minimum Tax (AMT). Any capital gains distributions may be taxable.
Please see footnotes on page 5.
4 | Wells Fargo Short-Term Municipal Bond Fund

Performance highlights (unaudited)
Effective maturity distribution as of December 31, 20196
5+ years (4%)
3–5 years (21%)
0–1 year (37%)
1–3 year(s) (38%)
Credit quality as of December 31, 20197
Not Rated (5%) SP-2/MIG 2 (2%) BB/Ba (1%) AAA/Aaa (12%)
BBB/Baa (16%)
A-1/P-1/ MIG 1 (6%)
AA/Aa (33%)
A/A (25%)
1 Reflects the expense ratios as stated in the most recent prospectuses. The expense ratios shown are subject to change and may differ from the annualized expense ratios shown in the financial highlights of this report.
2 The manager has contractually committed through October 31, 2020, to waive fees and/or reimburse expenses to the extent necessary to cap total annual fund operating expenses after fee waivers at 0.63% for Class A, 1.38% for Class C, 0.35% for Class R6, 0.60% for Administrator Class, and 0.40% for Institutional Class. Brokerage commissions, stamp duty fees, interest, taxes, acquired fund fees and expenses (if any), and extraordinary expenses are excluded from the expense cap. Prior to or after the commitment expiration date, the cap may be increased or the commitment to maintain the cap may be terminated only with the approval of the Board of Trustees. Without this cap, the Fund’s returns would have been lower. The expense ratio paid by an investor is the net expense ratio (the total annual fund operating expenses after fee waivers) as stated in the prospectuses.
3 Historical performance shown for Class R6 shares prior to their inception reflects the performance of the Institutional Class shares, and includes the higher expenses applicable to Institutional Class shares. If these expenses had not been included, returns for Class R6 shares would be higher.
4 Historical performance shown for Administrator Class shares prior to their inception reflects the performance of Institutional Class shares, adjusted to reflect the higher expenses applicable to Administrator Class shares.
5 The Bloomberg Barclays 1-3 Year Composite Municipal Bond Index is a blended index weighted 50% in the Bloomberg Barclays 1-Year Municipal Bond Index and 50% in the Bloomberg Barclays 3-Year Municipal Bond Index. You cannot invest directly in an index.
6 Amounts are calculated based on the total long-term investments of the Fund. These amounts are subject to change and may have changed since the date specified.
7 The credit quality distribution of portfolio holdings reflected in the chart is based on ratings from Standard & Poor’s, Moody’s Investors Service, and/ or Fitch Ratings Ltd. Credit quality ratings apply to the underlying holdings of the Fund and not to the Fund itself. The percentages of the Fund’s portfolio with the ratings depicted in the chart are calculated based on the total market value of fixed income securities held by the Fund. If a security was rated by all three rating agencies, the middle rating was utilized. If rated by two of three rating agencies, the lower rating was utilized, and if rated by one of the rating agencies, that rating was utilized. Standard & Poor’s rates the creditworthiness of bonds, ranging from AAA (highest) to D (lowest). Ratings from A to CCC may be modified by the addition of a plus (+) or minus (-) sign to show relative standing within the rating categories. Standard & Poor’s rates the creditworthiness of short-term notes from SP-1 (highest) to SP-3 (lowest). Moody’s rates the creditworthiness of bonds, ranging from Aaa (highest) to C (lowest). Ratings Aa to B may be modified by the addition of a number 1 (highest) to 3 (lowest) to show relative standing within the ratings categories. Moody’s rates the creditworthiness of short-term U.S. tax-exempt municipal securities from MIG 1/VMIG 1 (highest) to SG (lowest). Fitch rates the creditworthiness of bonds, ranging from AAA (highest) to D (lowest). Credit quality distribution is subject to change and may have changed since the date specified.
Wells Fargo Short-Term Municipal Bond Fund | 5

Fund expenses (unaudited)
As a shareholder of the Fund, you incur two types of costs: (1) transaction costs, including sales charges (loads) on purchase payments and contingent deferred sales charges (if any) on redemptions and (2) ongoing costs, including management fees, distribution (12b-1) and/or shareholder servicing fees, and other Fund expenses. This example is intended to help you understand your ongoing costs (in dollars) of investing in the Fund and to compare these costs with the ongoing costs of investing in other mutual funds.
The example is based on an investment of $1,000 invested at the beginning of the six-month period and held for the entire period from July 1, 2019 to December 31, 2019.
Actual expenses The “Actual” line of the table below provides information about actual account values and actual expenses. You may use the information in this line, together with the amount you invested, to estimate the expenses that you paid over the period. Simply divide your account value by $1,000 (for example, an $8,600 account value divided by $1,000 = 8.6), then multiply the result by the number in the “Actual” line under the heading entitled “Expenses paid during period” for your applicable class of shares to estimate the expenses you paid on your account during this period.
Hypothetical example for comparison purposes The “Hypothetical” line of the table below provides information about hypothetical account values and hypothetical expenses based on the Fund’s actual expense ratio and an assumed rate of return of 5% per year before expenses, which is not the Fund’s actual return. The hypothetical account values and expenses may not be used to estimate the actual ending account balance or expenses you paid for the period. You may use this information to compare the ongoing costs of investing in the Fund and other funds. To do so, compare this 5% hypothetical example with the 5% hypothetical examples that appear in the shareholder reports of the other funds.
Please note that the expenses shown in the table are meant to highlight your ongoing costs only and do not reflect any transactional costs, such as sales charges (loads) and contingent deferred sales charges. Therefore, the “Hypothetical” line of the table is useful in comparing ongoing costs only and will not help you determine the relative total costs of owning different funds. In addition, if these transactional costs were included, your costs would have been higher.
Beginning account value
7-1-2019
Ending account value
12-31-2019
Expenses paid during the period¹
Annualized net expense ratio
Class A Actual $1,000.00 $1,008.83 $3.18 0.63% Hypothetical (5% return before expenses) $1,000.00 $1,021.97 $3.20 0.63%
Class C Actual $1,000.00 $1,005.03 $6.96 1.38% Hypothetical (5% return before expenses) $1,000.00 $1,018.20 $7.00 1.38%
Class R6 Actual $1,000.00 $1,010.25 $1.77 0.35% Hypothetical (5% return before expenses) $1,000.00 $1,023.38 $1.78 0.35%
Administrator Class Actual $1,000.00 $1,008.98 $3.03 0.60% Hypothetical (5% return before expenses) $1,000.00 $1,022.12 $3.05 0.60%
Institutional Class Actual $1,000.00 $1,009.99 $2.02 0.40% Hypothetical (5% return before expenses) $1,000.00 $1,023.13 $2.03 0.40%
1 Expenses paid is equal to the annualized net expense ratio of each class multiplied by the average account value over the period, multiplied by the number of days in the most recent fiscal half-year divided by the number of days in the fiscal year (to reflect the one-half-year period).
6 | Wells Fargo Short-Term Municipal Bond Fund

Portfolio of investments—December 31, 2019 (unaudited)
Interest rate
Maturity date Principal Value
Municipal Obligations: 98.75%
Alabama: 0.60%
Tax Revenue: 0.01% Board of Education of Shelby County AL Public School Series 2016 ## 4.00% 2-1-2020 $ 410,000 $ 410,918
Utilities Revenue: 0.59% Alabama Black Belt Energy Gas District Series A 4.00 12-1-2048 8,000,000 8,638,480 Alabama Black Belt Energy Gas District Series A 4.00 6-1-2024 3,640,000 4,017,177
Alabama Black Belt Energy Gas District Series A (Royal Bank of Canada LIQ) 4.00 8-1-2047 3,880,000 4,114,934 Chatom AL Industrial Development Board Alabama Electric Series A
(National Rural Utilities Cooperative Finance Corporation SPA) øø 1.40 8-1-2037 5,000,000 5,000,400
21,770,991
22,181,909
Alaska: 0.84%
Health Revenue: 0.73% Alaska IDA Loan Anticipation YKHC Project 3.50 12-1-2020 22,300,000 22,326,760 Alaska Industrial Development and Export Authority Tanana Chiefs
Conference Project 5.00 10-1-2023 600,000 674,016 Alaska Industrial Development and Export Authority Tanana Chiefs
Conference Project 5.00 10-1-2024 750,000 863,153 Alaska Industrial Development and Export Authority Tanana Chiefs
Conference Project 5.00 10-1-2025 1,310,000 1,537,875 Alaska Industrial Development and Export Authority Tanana Chiefs
Conference Project 5.00 10-1-2026 1,385,000 1,651,086
27,052,890
Utilities Revenue: 0.04% Alaska IDA Snettisham Hydroelectric Project 5.00 1-1-2021 1,400,000 1,437,646
Water & Sewer Revenue: 0.07% North Slope Borough Service Area Water & Wastewater Facilities 5.25 6-30-2034 2,445,000 2,584,878
31,075,414
Arizona: 2.48%
Education Revenue: 0.09% Cochise County AZ Community College District of Cochise County Series
2016A (BAM Insured) 5.00 7-1-2020 405,000 412,545 Cochise County AZ Community College District of Cochise County Series
2016A (BAM Insured) 5.00 7-1-2021 425,000 448,783 PIMA County AZ IDA Education Facility Odyssey Preparatory Academy
Goodyear Project 7.00 6-1-2034 312,000 336,807 PIMA County AZ IDA Education Facility Odyssey Preparatory Academy
Goodyear Project 7.13 6-1-2049 1,950,000 2,108,457
3,306,592
Health Revenue: 0.66% Maricopa County AZ IDA Series 2019C (SIFMA Municipal Swap +0.57%) ± 2.18 1-1-2035 4,865,000 4,874,973
Maricopa County AZ IDA Series 2019C (SIFMA Municipal Swap +0.80%) ± 2.41 9-1-2048 9,000,000 9,027,090 Scottsdale AZ IDA Healthcare Series F (AGM Insured) (m) 1.69 9-1-2045 4,500,000 4,500,000 Tempe AZ IDA Mirabella Arizona State University Project Series B1 144A 4.00 10-1-2023 6,000,000 6,047,580
24,449,643
The accompanying notes are an integral part of these financial statements.
Wells Fargo Short-Term Municipal Bond Fund | 7

Interest rate
Maturity date Principal Value
Industrial Development Revenue: 1.14% Chandler AZ IDA Intel Corporation Project 2.70% 12-1-2037 $ 175,000 $ 181,988 Chandler AZ IDA Intel Corporation Project 2.40 12-1-2035 32,885,000 34,040,908 Coconino County AZ Pollution Control Corporation Series A 1.80 9-1-2032 7,975,000 7,983,135
42,206,031
Miscellaneous Revenue: 0.26% Arizona Board of Regents Certificate of Participation Series A 5.00 6-1-2021 3,000,000 3,161,610 Navajo Nation AZ Refunding Bond Series A 144A ## 2.90 12-1-2020 3,025,000 3,047,234 Navajo Nation AZ Tribal Utility Authority (Municipal Government Guaranty
Insured) 4.00 1-1-2021 3,210,000 3,214,398
9,423,242
Utilities Revenue: 0.33% Maricopa County AZ PCR Public Service Company of New Mexico Palo Verde
Project Series B 5.20 6-1-2043 2,500,000 2,536,900 Maricopa County AZ PCR Series A 2.40 6-1-2043 9,800,000 9,832,732
12,369,632
91,755,140
Arkansas: 0.27%
Housing Revenue: 0.27% Arkansas Development Finance Authority MFHR Maple Place Apartments
(HUD Insured) 1.53 10-1-2023 5,000,000 5,004,200 Arkansas Development Finance Authority MFHR Texarkana Rental
Assistance Demonstration Convertible Bond Series A 2.10 6-1-2022 5,100,000 5,139,066
10,143,266
California: 4.56%
GO Revenue: 1.26% California Refunding Bond Series A (SIFMA Municipal Swap +0.25%) ± 1.86 5-1-2033 26,000,000 26,006,500
California Series B (SIFMA Municipal Swap +0.38%) ± 1.99 12-1-2027 20,000,000 20,051,800 San Ysidro CA School District (AGM Insured) ¤ 0.00 8-1-2047 3,610,000 504,353
46,562,653
Health Revenue: 0.78% California HFFA Providence St. Joseph Series B1 1.25 10-1-2036 5,785,000 5,791,364
California Statewide CDA Health Facilities Catholic Series E (AGM Insured) (m) 1.70 7-1-2040 21,550,000 21,550,000
Palomar CA Pomerado Health Care District Certificate of Participation Series C (AGM Insured) (m) 2.32 11-1-2036 1,100,000 1,100,000
Washington Township CA Health Care District Series B ## 5.00 7-1-2020 600,000 611,208
29,052,572
Industrial Development Revenue: 0.09% California PCFA AMT Calplant I Project 144A 7.00 7-1-2022 3,505,000 3,518,074
Miscellaneous Revenue: 0.73% California Infrastructure & Economic Development Bank The J. Paul Getty
Trust Series A-1 (1 Month LIBOR +0.33%) ± 1.53 10-1-2047 19,000,000 19,024,130 California Infrastructure & Economic Development Bank The J. Paul Getty
Trust Series B-2 (1 Month LIBOR +0.20%) ± 1.40 10-1-2047 8,000,000 7,999,360
27,023,490
Portfolio of investments—December 31, 2019 (unaudited)
The accompanying notes are an integral part of these financial statements.
8 | Wells Fargo Short-Term Municipal Bond Fund

Interest
rate Maturity
date Principal Value
Tax Revenue: 0.04% Commerce CA RDA CAB Project #1 ¤ 0.00% 8-1-2021 $ 1,440,000 $ 1,360,886
Transportation Revenue: 0.70% Bay Area Toll Authority San Francisco Bay Area Series C-1 (SIFMA Municipal
Swap +0.90%) ± 2.51 4-1-2045 25,500,000 25,930,950
Water & Sewer Revenue: 0.96% California Department of Water Resources Central Valley Project Series AT
(SIFMA Municipal Swap +0.37%) ± 1.98 12-1-2035 35,500,000 35,603,660
169,052,285
Colorado: 1.80%
Education Revenue: 0.42% Colorado University Enterprise and Refunding Bond Series C 2.00 6-1-2054 15,000,000 15,401,550
GO Revenue: 0.30% Dawson Ridge CO Metropolitan District # 1 ¤ 0.00 10-1-2022 8,445,000 8,145,540
Grand River CO Hospital District (AGM Insured) 5.00 12-1-2022 1,450,000 1,604,005 Grand River CO Hospital District (AGM Insured) 5.00 12-1-2024 1,140,000 1,329,867
11,079,412
Health Revenue: 1.04% Colorado HCFR Catholic Health Initiatives Series C2
(1 Month LIBOR +1.25%) ± 2.41 10-1-2039 8,730,000 8,751,389Colorado HCFR Catholic Health Initiatives Series C4
(1 Month LIBOR +1.25%) ± 2.41 10-1-2039 3,495,000 3,503,563 Colorado Health Facilities Authority Improvement Christian Living 4.00 1-1-2025 325,000 352,047
University of Colorado Hospital Authority Series 2017C-1 5.00 11-15-2038 24,630,000 26,142,775
38,749,774
Miscellaneous Revenue: 0.04% Colorado Bridge Enterprise Central 70 Project 4.00 12-31-2023 1,285,000 1,396,615
66,627,351
Connecticut: 1.86%
Education Revenue: 0.73% Connecticut HEFAR University of Hartford Series N 5.00 7-1-2024 120,000 137,728Connecticut HEFAR University of Hartford Series N 5.00 7-1-2025 140,000 164,268Connecticut HEFAR Yale University Issue Series A 2.05 7-1-2035 25,000,000 25,346,750Connecticut Higher Education Supplemental Loan Authority Refunding
Bond Chelsea Loan Program Series A 3.60 11-15-2023 1,265,000 1,349,363
26,998,109
GO Revenue: 0.36% Connecticut Refunding Bond Series B 4.00 5-15-2021 11,190,000 11,619,584 New Haven CT Series A 5.25 8-1-2021 1,830,000 1,933,633
13,553,217
Health Revenue: 0.27% Connecticut HEFAR Hartford Healthcare Series G (1 Month LIBOR
+0.95%) ± 2.11 7-1-2049 10,000,000 10,005,200
Portfolio of investments—December 31, 2019 (unaudited)
The accompanying notes are an integral part of these financial statements.
Wells Fargo Short-Term Municipal Bond Fund | 9

Interest
rate Maturity
date Principal Value
Housing Revenue: 0.27% Meriden CT Multifamily Housing Yale Acres Project 1.73% 8-1-2022 $10,000,000 $ 10,058,800
Miscellaneous Revenue: 0.23% Connecticut Series A (SIFMA Municipal Swap +0.65%) ± 2.26 3-1-2020 8,385,000 8,390,702
69,006,028
District of Columbia: 0.60%
Airport Revenue: 0.10% Metropolitan Washington DC Airport Authority Series A 5.00 10-1-2024 3,450,000 3,794,793
Housing Revenue: 0.33% District of Columbia HFA Multifamily Housing Strand Residences Project 1.45 2-1-2039 2,500,000 2,504,300District of Columbia HFA Multifamily Housing Liberty Place Apartments
Project 2.13 6-1-2021 9,800,000 9,867,130
12,371,430
Water & Sewer Revenue: 0.17% District of Columbia Water and Sewer Authority Public Utility Subordinated
Lien Series C 1.75 10-1-2054 6,000,000 6,111,720
22,277,943
Florida: 2.53%
Airport Revenue: 0.06% Broward County FL Airport System Series C 5.00 10-1-2022 2,000,000 2,196,460
Education Revenue: 0.28% Florida Gulf Coast University Financing Corporation Housing Project
Series A ## 5.00 8-1-2020 2,055,000 2,099,080Florida Higher Educational Facilities Financing Authority Educational
Facilities Institute Technology 5.00 10-1-2025 500,000 581,340Florida Higher Educational Facilities Financing Authority Educational
Facilities Institute Technology 5.00 10-1-2026 750,000 883,193University of North Florida Financing Corporation Capital Housing Project
(AGM Insured) 5.00 11-1-2020 3,125,000 3,215,625University of North Florida Financing Corporation Capital Housing Project
(AGM Insured) 5.00 11-1-2021 3,440,000 3,660,057
10,439,295
Health Revenue: 0.47% North Broward FL Hospital District Series B 5.00 1-1-2022 1,255,000 1,335,835 North Broward FL Hospital District Series B 5.00 1-1-2023 1,700,000 1,860,412 North Broward FL Hospital District Series B 5.00 1-1-2024 2,000,000 2,243,180 Palm Beach County FL HCFR ACTS Retirement Life Communities
Series 2016 5.00 11-15-2021 3,515,000 3,740,452 Tampa FL BayCare Health System Prefunded Bond 5.00 11-15-2023 4,140,000 4,198,540 Tampa FL BayCare Health System Unrefunded Bond 5.00 11-15-2023 3,940,000 3,995,278
17,373,697
Housing Revenue: 0.33% Florida Housing Finance Corporation Logan Heights Apartments Series F 1.90 2-1-2020 5,555,000 5,557,444 Miami-Dade County FL Housing Finance Authority Multifamily Housing
Liberty Square Phase Two Project 1.42 11-1-2040 6,500,000 6,508,645
12,066,089
Portfolio of investments—December 31, 2019 (unaudited)
The accompanying notes are an integral part of these financial statements.
10 | Wells Fargo Short-Term Municipal Bond Fund

Interest rate
Maturity date Principal Value
Miscellaneous Revenue: 0.45% Manatee County FL School Board Certificate of Participation Series A ## 5.00% 7-1-2020 $ 1,225,000 $ 1,246,291Miami-Dade County FL School Board Certificate of Participation Series A 5.00 5-1-2031 10,000,000 11,489,300St. Johns County FL School Board Refunding Bond Certificate of
Participation 5.00 7-1-2020 2,010,000 2,048,451St. Johns County FL School Board Refunding Bond Certificate of
Participation 5.00 7-1-2021 1,670,000 1,766,025
16,550,067
Resource Recovery Revenue: 0.05% Lee County FL Solid Waste System Refunding Bond 5.00 10-1-2023 1,750,000 1,953,700
Tax Revenue: 0.40% Department of Environmental Protection Florida Forever Series A 5.00 7-1-2023 7,720,000 8,454,481Leon County FL School District 4.00 9-1-2026 6,000,000 6,563,700
15,018,181
Transportation Revenue: 0.44% Florida Development Finance Corporation Surface Series T 1.90 1-1-2049 14,400,000 14,415,696Florida Mid-Bay Bridge Authority Series C 5.00 10-1-2020 785,000 805,065Osceola County FL Improvement Osceola Parkway Series %% 5.00 10-1-2024 300,000 346,587Osceola County FL Improvement Osceola Parkway Series %% 5.00 10-1-2026 735,000 884,102
16,451,450
Utilities Revenue: 0.05% JEA Bulk Power Supply System Scherer 4 Project Series A 3.00 10-1-2022 1,800,000 1,801,908
93,850,847
Georgia: 6.03%
Health Revenue: 1.16% Gainesville & Hall Counties GA Hospital Authority Health System Project
Series B (SIFMA Municipal Swap +0.95%) ± 2.56 8-15-2035 23,000,000 23,011,730Gainesville GA Hospital Authority Series C ø 1.77 2-15-2047 20,000,000 20,000,000
43,011,730
Housing Revenue: 1.00% Atlanta GA Urban Residential Finance Authority MFHR City Lights II Family
Apartments Project 1.45 12-1-2020 11,500,000 11,500,115Cobb County GA Housing Authority MFHR White Circle Phase 2 Project 1.65 12-1-2022 6,000,000 6,015,780Macon-Bibb County GA Housing Authority Hallmark Portfolio 2.04 4-1-2021 15,000,000 15,023,400Northwest GA Housing Authority MFHR Park Homes Apartments Project
(FHA Insured) 1.54 8-1-2022 4,500,000 4,505,490
37,044,785
Industrial Development Revenue: 0.59% Monroe County GA PCR Georgia Power Company Plant Scherer Project 2.35 10-1-2048 16,360,000 16,519,674Savannah GA EDA PCR International Paper Company Project Series B 1.90 8-1-2024 4,250,000 4,260,413Savannah GA EDA Recovery Zone Facility International 2.00 11-1-2033 1,000,000 1,008,760
21,788,847
Portfolio of investments—December 31, 2019 (unaudited)
The accompanying notes are an integral part of these financial statements.
Wells Fargo Short-Term Municipal Bond Fund | 11

Interest
rate Maturity
date Principal Value
Utilities Revenue: 3.28% Bartow County GA Development Authority Georgia Power Company Bowen
Project 2.05% 9-1-2029 $ 4,100,000 $ 4,131,447
Burke County GA Development Authority Georgia Power Company Plant Vogtle Project 1.55 12-1-2049 4,000,000 3,989,560
Burke County GA Development Authority Oglethorpe Power Corporation Vogtle Project Series A 2.40 1-1-2040 15,995,000 16,028,909
Burke County GA Development Authority Oglethorpe Power Corporation Vogtle Project Series F 3.00 11-1-2045 22,050,000 22,642,263
Floyd County GA PCR Georgia Power Company Plant Hammond Project 2.35 7-1-2022 11,250,000 11,345,063Georgia Municipal Electric Authority Plant Vogtle Units 3&4 Project M 5.00 1-1-2025 200,000 232,264Georgia Municipal Electric Authority Plant Vogtle Units 3&4 Project M 5.00 1-1-2026 300,000 355,002Georgia Municipal Electric Authority Plant Vogtle Units 3&4 Project P 5.00 1-1-2023 250,000 274,743Georgia Municipal Electric Authority Plant Vogtle Units 3&4 Project P 5.00 1-1-2024 400,000 451,104Georgia Municipal Electric Authority Plant Vogtle Units 3&4 Project P 5.00 1-1-2025 1,000,000 1,155,080Main Street Natural Gas Incorporated Georgia Gas Project Series B 5.00 3-15-2021 2,800,000 2,916,032Main Street Natural Gas Incorporated Georgia Gas Project Series C 4.00 8-1-2048 6,120,000 6,671,718Main Street Natural Gas Incorporated Georgia Gas Project Series C 4.00 3-1-2050 18,000,000 20,369,520Main Street Natural Gas Incorporated Georgia Gas Project Series E
(SIFMA Municipal Swap +0.57%) (Royal Bank of Canada LIQ) ± 2.18 8-1-2048 20,000,000 20,000,000Monroe County GA Development Authority PCR Oglethorpe Power
Corporation Scherer Project Series A 2.40 1-1-2039 11,245,000 11,268,839
121,831,544
223,676,906
Hawaii: 0.53%
GO Revenue: 0.34% Honolulu HI Rail Transit Project Series H (SIFMA Municipal Swap +0.32%) ± 1.93 9-1-2027 7,600,000 7,600,456 Honolulu HI Rail Transit Project Series H (SIFMA Municipal Swap +0.32%) ± 1.93 9-1-2028 5,000,000 5,000,300
12,600,756
Housing Revenue: 0.19% Hawaii Housing Finance & Development Corporation Multifamily Housing
Hale Kewalo Apartments Series A (GNMA Insured) 1.90 1-1-2021 7,160,000 7,162,649
19,763,405
Illinois: 9.42%
Airport Revenue: 0.98% Chicago IL Midway Airport Refunding Bond Second Lien Series A 5.00 1-1-2022 6,100,000 6,530,416Chicago IL Midway Airport Refunding Bond Second Lien Series A 5.00 1-1-2025 5,000,000 5,678,200
Chicago IL O’Hare International Airport Customer Facility Series 2013 5.00 1-1-2020 890,000 890,000Chicago IL O’Hare International Airport Refunding Bond General Senior Lien
Series B 5.00 1-1-2023 5,000,000 5,353,650Chicago IL O’Hare International Airport Refunding Bond General Senior Lien
Series B 5.00 1-1-2024 1,550,000 1,659,322Chicago IL O’Hare International Airport Refunding Bond Passenger Facility 5.00 1-1-2023 13,720,000 14,690,416Chicago IL O’Hare International Airport Refunding Bond Passenger Facility 5.00 1-1-2024 1,335,000 1,520,538
36,322,542
Education Revenue: 0.07% Illinois State University Auxiliary Facilities System 4.00 4-1-2020 1,480,000 1,480,089
Illinois State University Auxiliary Facilities System Series A (AGM Insured) 5.00 4-1-2025 700,000 804,454Illinois State University Auxiliary Facilities System Series B (AGM Insured) 5.00 4-1-2024 415,000 466,207
2,750,750
Portfolio of investments—December 31, 2019 (unaudited)
The accompanying notes are an integral part of these financial statements.
12 | Wells Fargo Short-Term Municipal Bond Fund

Portfolio of investments—December 31, 2019 (unaudited)
Interest rate
Maturity date Principal Value
GO Revenue: 2.24% Chicago IL Board of Education Refunding Bond Series A (AGM Insured) 5.00% 12-1-2022 $ 500,000 $ 542,330 Chicago IL Board of Education Refunding Bond Series A (AGM Insured) 5.00 12-1-2023 2,000,000
2,223,240 Chicago IL Emergency Telephone System Refunding Bond (National
Insured) 5.25 1-1-2020 3,765,000 3,765,000 Chicago IL Park District Harbor Facility Series C 5.00 1-1-2022 3,155,000 3,255,140 Chicago IL Park District Refunding Bond Series D 5.00 1-1-2020 1,290,000 1,290,000 Chicago IL Park District Refunding Bond Series D 5.00 1-1-2021 1,000,000 1,033,020 Chicago IL Park District Series A 4.50 1-1-2023 250,000 253,210 Chicago IL Refunding Bond Series B (Ambac Insured) 5.13 1-1-2022 1,595,000 1,645,976 Chicago IL Series C 5.00 1-1-2021 3,000,000 3,112,350 Chicago IL Series C 5.00 1-1-2022 15,845,000 16,690,965 Chicago IL Series C 5.00 1-1-2023 4,750,000 5,107,248 Cook County IL Refunding Bond Series 2016 A 5.00 11-15-2020 5,430,000 5,593,497 Illinois 4.00 2-1-2020 1,750,000 1,753,308 Illinois 5.00 2-1-2020 2,520,000 2,526,703 Illinois 5.00 11-1-2021 5,000,000 5,278,850 Illinois 5.00 4-1-2022 3,000,000 3,198,420 Illinois Refunding Bond 5.00 1-1-2020 13,515,000 13,515,000 Kane County IL School District Series B 2.00 2-1-2021 880,000 886,477 Kane, McHenry, Cook & Dekalb Counties IL Community Unit School District
#300 4.25 1-1-2023 1,000,000 1,025,220 Kendall Kane, & Will Counties IL Refunding Bond Series B 5.00 10-1-2022 1,400,000 1,526,028 Kendall Kane, & Will Counties IL Refunding Bond Series B 5.00 10-1-2023 560,000 626,696 Kendall, Kane, & Will Counties IL Community Unit School District #308 CAB
(AGM Insured) ¤ 0.00 2-1-2020 1,000,000 998,850 McHenry & Kane Counties IL Community Consolidated School District #158
CAB (National Insured) ¤ 0.00 1-1-2021 1,130,000 1,115,095 Waukegan IL Series B (AGM Insured) 4.00 12-30-2023 500,000 546,030 Whiteside & Lee Counties IL Community Unit School District Series A
(BAM Insured) 4.00 12-1-2024 1,490,000 1,643,247 Will County IL Community High School District #161 4.00 1-1-2024 2,000,000 2,176,140 Will County IL Community High School District #210 5.00 1-1-2021 1,165,000 1,167,400 Winnebago Boone County IL Community College District Rock Valley
College Series A (AGM Insured) 5.00 1-1-2022 500,000 533,530
83,028,970
Health Revenue: 1.75% Illinois Finance Authority Ascension Health Alliance Senior Credit Group
Series E-2 1.75 11-15-2042 2,000,000 2,011,300 Illinois Finance Authority Friendship Village of Schaumburg 4.00 2-15-2020 1,230,000 1,229,754 Illinois Finance Authority OSF Healthcare System Prerefunded Bond
Series A 6.00 5-15-2039 14,630,000 14,886,903 Illinois Finance Authority Swedish Covenant Hospital Series A 6.00 8-15-2038 3,460,000 3,479,514 Illinois Finance Authority The Admiral at the Lake Project Series A 7.75 5-15-2030 2,015,000 2,063,239 Illinois Finance Authority The Admiral at the Lake Project Series A 8.00 5-15-2040 20,755,000 21,268,479 Illinois Finance Authority The Admiral at the Lake Project Series A 8.00 5-15-2046 17,295,000 17,722,878 Southwestern IL Development Authority Health Facility Memorial Group
Incorporated 6.38 11-1-2023 1,950,000 2,170,799
64,832,866
Housing Revenue: 0.67% Chicago IL Multifamily Housing Mark Twain Apartments Project 2.20 6-1-2021 17,000,000 17,049,130 Illinois Housing Development Authority (SIFMA Municipal Swap +1.00%)
(FNMA LOC, FNMA LIQ) ± 2.61 5-15-2050 7,500,000 7,549,350 Illinois Housing Development Authority (GNMA Insured) 5.00 8-1-2028 185,000 187,956
24,786,436
The accompanying notes are an integral part of these financial statements.
Wells Fargo Short-Term Municipal Bond Fund | 13

Interest
rate Maturity
date Principal Value
Miscellaneous Revenue: 0.98% Chicago IL Board of Education Lease Certificates Refunding Bond Series A
(National Insured) 6.00% 1-1-2020 $ 3,260,000 $ 3,260,000 Chicago IL Board of Education Refunding Bond Series B 5.00 12-1-2024 2,270,000 2,531,322 Chicago IL Board of Education Refunding Bond Series B 5.00 12-1-2025 2,460,000 2,786,909
Illinois Refunding Bond (BAM Insured) 5.00 8-1-2020 9,175,000 9,365,932
Illinois Refunding Bond 5.00 2-1-2022 4,375,000 4,643,363 Illinois Refunding Bond 5.00 2-1-2023 6,040,000 6,547,239
Illinois Refunding Bond Series 2012 (AGM Insured) 5.00 8-1-2020 5,000,000 5,104,050 Illinois Series 2014 5.00 5-1-2021 2,000,000 2,083,820
36,322,635
Tax Revenue: 2.36% Build Illinois Bond Junior Obligation Series C 5.00 6-15-2022 2,810,000 2,997,568
Chicago IL Motor Fuel Tax Refunding Bond Series 2013 5.00 1-1-2020 1,120,000 1,120,000 Chicago IL Motor Fuel Tax Refunding Bond Series 2013 5.00 1-1-2021 380,000 389,093 Chicago IL Motor Fuel Tax Refunding Bond Series 2013 5.00 1-1-2022 955,000 997,412
Chicago IL Transit Authority Sales Tax Receipts 5.25 12-1-2024 6,705,000 7,180,519 Hillside IL Refunding Bond Series 2018 5.00 1-1-2024 1,215,000 1,257,574
Huntley IL Special Service Area No 6 Special Tax Refunding Bond (BAM Insured) 2.20 3-1-2024 1,865,000 1,889,525
Illinois Refunding Bond 5.00 1-1-2021 1,760,000 1,817,200Illinois Regional Transportation Authority Refunding Bond (AGM Insured) 5.75 6-1-2021 3,000,000 3,189,090Illinois Sales Tax Revenue Junior Obligation Series A 5.00 6-15-2023 5,825,000 6,361,483Illinois Sales Tax Revenue Refunding Bond Series C 4.00 6-15-2023 3,315,000 3,510,784
Illinois Series 2013 5.00 6-15-2024 485,000 527,030Illinois Series A 4.00 1-1-2020 12,265,000 12,265,000Illinois Series A 4.00 1-1-2021 2,715,000 2,776,576Metropolitan Pier & Exposition Authority McCormick Place Project Callable
Bond Series B 5.00 12-15-2022 1,260,000 1,260,806Metropolitan Pier & Exposition Authority McCormick Place Project
Non-Callable Bond Series B 5.00 12-15-2022 7,000,000 7,543,900Metropolitan Pier & Exposition Authority McCormick Place Project Series A
(National Insured) ¤ 0.00 12-15-2021 920,000 889,750Metropolitan Pier & Exposition Authority McCormick Place Project Series B 5.00 12-15-2020 1,845,000 1,898,616Regional Transportation Authority Illinois Series B-RMKT 1 1.45 6-1-2025 18,015,000 18,015,000Sales Tax Securitization Corporation Series A 5.00 1-1-2024 10,200,000 11,404,314
87,291,240
Tobacco Revenue: 0.35% Illinois Railsplitter Tobacco Settlement Authority 5.00 6-1-2022 12,000,000 13,020,000
Water & Sewer Revenue: 0.02% Chicago IL Second Lien 5.00 11-1-2020 740,000 761,090
349,116,529
Indiana: 1.27%
GO Revenue: 0.05% Hammond IN Local Public Improvement Advance Program Series A %% 2.38 12-31-2020 2,000,000 2,008,340
Health Revenue: 0.88% Indiana Finance Authority Health System Franciscan Alliance Incorporated
Series B 5.00 11-1-2022 1,000,000 1,103,800Indiana Finance Authority Health System Franciscan Alliance Incorporated
Series B 5.00 11-1-2023 1,270,000 1,445,146
Portfolio of investments—December 31, 2019 (unaudited)
The accompanying notes are an integral part of these financial statements.
14 | Wells Fargo Short-Term Municipal Bond Fund

Interest
rate Maturity
date Principal Value
(continued) Health RevenueIndiana Finance Authority Health System Franciscan Alliance Incorporated
Series B 5.00% 11-1-2024 $ 3,000,000 $ 3,511,590 Indiana Finance Authority Health System Franciscan Alliance Incorporated
Series C 5.00 11-1-2021 1,000,000 1,067,730 Indiana Finance Authority Health System Franciscan Alliance Incorporated
Series C 5.00 11-1-2023 800,000 910,328 Indiana Finance Authority Health System Franciscan Alliance Incorporated
Series C 5.00 11-1-2024 1,000,000 1,170,530 Indiana Finance Authority Parkview Health Series A 5.00 5-1-2021 1,020,000 1,071,031 Indiana Finance Authority Parkview Health Series A 5.00 5-1-2023 1,010,000 1,133,028 Indiana Finance Authority Refunding Bond University Health Obligated
Group Series B 1.65 12-1-2042 5,000,000 5,031,200 Indiana Finance Authority Senior Living Series A 5.00 11-15-2022 500,000 541,550
Indiana Finance Authority Senior Living Series A 5.00 11-15-2023 500,000 554,625 Indiana HEFA Series 2006B 1.75 11-15-2031 11,915,000 12,015,920
Indiana HFFA Ascension Health Subordinate Bond Credit Group Series 2015 A4 1.50 10-1-2027 1,825,000 1,826,643
Indiana HFFA Ascension Health Subordinate Bond Credit Group Series A8 1.25 11-1-2027 1,155,000 1,155,104
32,538,225
Housing Revenue: 0.10% Indianapolis IN MFHR Bethel Townhomes Project Series A 2.30 3-1-2021 3,795,000 3,800,351
Miscellaneous Revenue: 0.06% Indiana Bond Bank Special Program Series A 5.25 10-15-2021 2,000,000 2,132,500
Utilities Revenue: 0.18% Warrick County IN Environment Import Vectra Energy Delivery of Indiana
Incorporated 2.38 9-1-2055 6,550,000 6,558,646
47,038,062
Iowa: 0.27%
Education Revenue: 0.07% Iowa Student Loan Liquidity Corporation AMT Senior Series B 5.00 12-1-2022 500,000 549,935 Iowa Student Loan Liquidity Corporation AMT Senior Series B 5.00 12-1-2023 700,000 791,658 Iowa Student Loan Liquidity Corporation AMT Senior Series B 5.00 12-1-2024 1,000,000 1,159,340
2,500,933
Housing Revenue: 0.20% Iowa Finance Authority SFMR Series D (1 Month LIBOR +0.35%)
(GNMA/FNMA/FHLMC Insured) ± 1.61 7-1-2048 7,500,000 7,508,325
10,009,258
Kansas: 0.25%
Health Revenue: 0.06% Wichita KS Health Care Facilities Presbyterian Manors Incorporate 4.00 5-15-2024 1,015,000 1,067,699 Wichita KS Health Care Facilities Presbyterian Manors Incorporate 5.00 5-15-2025 1,055,000 1,168,761
2,236,460
Housing Revenue: 0.14% Kansas Development Finance Authority MFHR Woodland Village
Apartments Project Series J 1.68 7-1-2022 5,000,000 5,014,650
Portfolio of investments—December 31, 2019 (unaudited)
The accompanying notes are an integral part of these financial statements.
Wells Fargo Short-Term Municipal Bond Fund | 15

Interest
rate Maturity
date Principal Value
Utilities Revenue: 0.05% Burlington KS Environmental Impact Series B ø 1.75% 9-1-2035 $ 2,000,000 $ 2,000,000
9,251,110
Kentucky: 2.92%
Health Revenue: 0.24% Louisville & Jefferson Counties KY Catholic Health Initiatives Series A 5.00 12-1-2021 8,210,000 8,781,416
Housing Revenue: 0.69% Kentucky Housing Corporation Beecher Phase I Project 2.00 3-1-2022 5,500,000 5,549,335 Kentucky Housing Corporation Jefferson Green Apartments Project 2.20 9-1-2022 20,000,000 20,174,200
25,723,535
Miscellaneous Revenue: 0.06%
Hopkins County KY Public Properties Corporation Judicial Center Project 3.63 6-1-2025 1,000,000 1,009,410Pendleton County KY School District Finance Corporation 2.00 2-1-2021 1,200,000 1,208,184
2,217,594
Utilities Revenue: 1.93% Kentucky Public Energy Authority Gas Supply Series A-1 4.00 12-1-2049 15,490,000 17,169,271Kentucky Public Energy Authority Gas Supply Series B 4.00 1-1-2049 24,085,000 26,595,620Kentucky Public Energy Authority Gas Supply Series C 4.00 12-1-2049 20,000,000 22,150,000Louisville & Jefferson Counties KY Metro Government PCR Series B 2.55 11-1-2027 5,500,000 5,585,415
71,500,306
108,222,851
Louisiana: 0.65%
Housing Revenue: 0.08% Louisiana Housing Corporation Pine Trace Homes Project 2.40 5-1-2021 3,000,000 3,010,320
Industrial Development Revenue: 0.39% St John Baptist Parish Louisiana Marathon Oil Corporation Project 2.10 6-1-2037 14,320,000 14,456,756
Tax Revenue: 0.07% Louisiana Local Government Environmental Facilities & CDA Series 2015
(Build America Mutual Assurance Company Insured) 5.00 12-1-2020 1,135,000 1,173,738 Louisiana Regional Transit Authority CAB (National Insured) ¤ 0.00 12-1-2021 1,615,000 1,522,493
2,696,231
Utilities Revenue: 0.11% Lafayette LA Refunding Bond 5.00 11-1-2023 3,680,000 4,070,669
24,233,976
Maine: 0.01%
Education Revenue: 0.01% Maine Finance Authority Supplemental Education Loan Program Class A
Series A-1 (AGM Insured) 5.00 12-1-2025 425,000 499,146
Maryland: 2.56%
GO Revenue: 0.70% Maryland State & Local Facilities Loan of 2015 Series A 5.00 3-1-2024 23,060,000 25,876,779
Portfolio of investments—December 31, 2019 (unaudited)
The accompanying notes are an integral part of these financial statements.
16 | Wells Fargo Short-Term Municipal Bond Fund

Interest
rate Maturity
date Principal Value
Health Revenue: 0.03% Rockville MD Mayor and Council Economic Development Ingleside King Farm
Project Series A-1 5.00% 11-1-2020 $ 850,000 $ 872,160
Housing Revenue: 1.27% Maryland CDA Department of Housing & Community Multifamily
Development Huntington Apartments Series C 144A 2.34 4-1-2021 7,500,000 7,540,275 Maryland CDA Department of Housing & Community Multifamily
Development Lakeview Victoria Park Series H 3.00 11-1-2020 9,000,000 9,075,600Maryland CDA Department of Housing & Community Multifamily
Development Orchard Mews 2.06 9-1-2021 5,500,000 5,518,645
Maryland CDA Department of Housing & Community Multifamily Development Orchard Park Series F 2.52 8-1-2020 15,000,000 15,047,850
Maryland CDA Department of Housing & Community Multifamily Development Zions Towers Series A (FHA Insured) 2.44 3-1-2020 10,000,000 10,008,100
47,190,470
Miscellaneous Revenue: 0.20% Maryland CDA Department of Housing & Community Multifamily
Development Park Square Homes Series E 2.53 8-1-2020 7,500,000 7,524,375
Utilities Revenue: 0.36% Maryland Economic Development Corporation PCR Potomac Electric Power
Company Project 1.70 9-1-2022 13,250,000 13,373,623
94,837,407
Massachusetts: 3.17%
Education Revenue: 0.26% Massachusetts Educational Financing Authority AMT Issue J 5.00 7-1-2021 1,280,000 1,348,288Massachusetts Educational Financing Authority AMT Issue K Series A 5.00 7-1-2022 1,000,000 1,085,850Massachusetts Educational Financing Authority Series A 5.00 1-1-2020 3,000,000 3,000,000Massachusetts Educational Financing Authority Series A 5.00 1-1-2022 4,115,000 4,402,680
9,836,818
Health Revenue: 0.44% Massachusetts Development Finance Agency Partners Healthcare System
Series S-3 (SIFMA Municipal Swap +0.50%) ± 2.11 7-1-2038 5,000,000 5,008,600Massachusetts Development Finance Agency Partners Healthcare System
Series S-5 (SIFMA Municipal Swap +0.42%) ± 2.03 7-1-2044 11,230,000 11,234,043
16,242,643
Housing Revenue: 1.10% Massachusetts HFA Construction Loan Notes Series A 1.85 6-1-2020 1,650,000 1,650,479Massachusetts HFA Construction Loan Notes Series B 2.05 12-1-2021 24,630,000 24,637,635Massachusetts HFA Multifamily Conduit Van Brodie Mill Series A (TD Bank
NA LOC) 2.00 7-1-2020 7,000,000 7,005,320 Massachusetts HFA Single Family Series 200 (1 Month LIBOR +0.38%) ± 1.58 12-1-2048 7,500,000 7,508,100
40,801,534
Miscellaneous Revenue: 1.02% Massachusetts Consolidated Loan Series D 1.05 8-1-2043 12,860,000 12,849,841
Massachusetts Consolidated Loan Subordinate Bond Series D-2 1.70 8-1-2043 24,550,000 24,859,576
37,709,417
Portfolio of investments—December 31, 2019 (unaudited)
The accompanying notes are an integral part of these financial statements.
Wells Fargo Short-Term Municipal Bond Fund | 17

Interest
rate Maturity
date Principal Value
Transportation Revenue: 0.35% Massachusetts Department of Transportation Refunding Bond 5.00% 1-1-2039 $ 11,685,000
$ 12,971,986
117,562,398
Michigan: 1.99%
Education Revenue: 0.03% Western Michigan University Refunding Bond 5.00 11-15-2020 1,000,000 1,033,090
GO Revenue: 0.49% Allendale MI Public School District Series A (Qualified School Board Loan
Fund Insured) 3.00 11-1-2021 895,000 923,040Caledonia MI Community Schools (Qualified School Board Loan Fund
Insured) 5.00 5-1-2020 500,000 506,355Caledonia MI Community Schools (Qualified School Board Loan Fund
Insured) 5.00 5-1-2021 1,140,000 1,198,425 Detroit MI Series 2018 5.00 4-1-2021 620,000 639,623
Flushing MI Community School District (Qualified School Board Loan Fund Insured) 4.00 5-1-2021 1,135,000 1,177,029
Gibraltar MI School District (Qualified School Board Loan Fund Insured) 5.00 5-1-2020 1,100,000 1,114,047 Gibraltar MI School District (Qualified School Board Loan Fund Insured) 5.00 5-1-2021 1,185,000 1,246,051
Grand Ledge MI Public School District (Qualified School Board Loan Fund Insured) 5.00 5-1-2020 2,680,000 2,713,339
Haslett MI Public Schools (Qualified School Board Loan Fund Insured) 4.00 5-1-2020 370,000 373,337 Haslett MI Public Schools (Qualified School Board Loan Fund Insured) 5.00 5-1-2021 500,000 524,740
Lake Orion MI Community School District 2015 Refunding Bond (Qualified School Board Loan Fund Insured) 5.00 5-1-2020 1,550,000 1,569,282
Lake Orion MI Community School District 2016 Refunding Bond (Qualified School Board Loan Fund Insured) 5.00 5-1-2020 1,390,000 1,407,292
Lake Orion MI Community School District 2016 Refunding Bond (Qualified School Board Loan Fund Insured) 5.00 5-1-2021 1,385,000 1,454,472
South Lyon MI Community School District 4.00 5-1-2020 1,425,000 1,438,324 Southgate MI Community School District (BAM Insured) 5.00 5-1-2020 500,000 506,385
Warren Woods MI Public Schools (Qualified School Board Loan Fund Insured) 5.00 5-1-2020 1,445,000 1,462,976
18,254,717
Health Revenue: 0.37% Michigan Finance Authority Bronson Healthcare Group Series B & C 3.75 11-15-2049 7,600,000 8,502,272Michigan Finance Authority Crittenden Hospital Medical Center Series A 4.13 6-1-2032 4,290,000 4,592,617Michigan Strategic Limited Obligation Refunding Bond Holland Home
Project 4.00 11-15-2024 580,000 622,346
13,717,235
Housing Revenue: 0.26% Michigan Housing Development Authority MFHR Bond Renaissance Estates
of Ecorse Phase II Project 1.45 11-1-2020 9,800,000 9,801,470
Industrial Development Revenue: 0.53% Michigan Strategic Limited Obligation Consumers Energy Company Project 1.80 10-1-2049 19,500,000 19,589,310
Miscellaneous Revenue: 0.07% Michigan Finance Authority Local Government Loan Program Series 2014H-1 5.00 10-1-2022 1,075,000 1,142,564
Michigan Finance Authority Senior Lien Distributable State Aid Charter County of Wayne Criminal Justice Center Project 5.00 11-1-2022 1,150,000 1,271,406
2,413,970
Portfolio of investments—December 31, 2019 (unaudited)
The accompanying notes are an integral part of these financial statements.
18 | Wells Fargo Short-Term Municipal Bond Fund

Interest rate
Maturity date Principal Value
Water & Sewer Revenue: 0.24% Michigan Finance Authority Refunding Bond Local Government Loan
Program Detroit Water & Sewer Series D-6 (National Insured) 5.00% 7-1-2020 $ 1,800,000 $ 1,833,174 Michigan Finance Authority Refunding Bond Second Lien Detroit Water &
Sewer Series C-7 (National Insured) 5.00 7-1-2020 3,835,000 3,905,679 Michigan Finance Authority Refunding Bond Second Lien Detroit Water &
Sewer Series C-7 (National Insured) 5.00 7-1-2021 3,095,000 3,262,997
9,001,850
73,811,642
Minnesota: 0.77%
GO Revenue: 0.05% Hastings MN Independent School District #200 Series A (South Dakota
Credit Program Insured) ¤ 0.00 2-1-2023 815,000 781,846 Hastings MN Independent School District #200 Series A (South Dakota
Credit Program Insured) ¤ 0.00 2-1-2024 1,015,000 955,704
1,737,550
Housing Revenue: 0.70% Brooklyn Center MN Multifamily Housing Development Sonder House
Apartments Project 1.35 1-1-2037 2,355,000 2,354,529 Dakota County MN Community Development Agency Senior Multifamily
Housing West St. Paul Apartments Project Series A 2.25 1-1-2022 6,285,000 6,311,774 Dakota County MN Community Development Agency Senior Multifamily
Housing West St. Paul Apartments Project Series B 3.80 7-1-2022 6,325,000 6,348,719 Minnesota HFA Series D (SIFMA Municipal Swap +0.43%) (GNMA/FNMA/
FHLMC Insured) ± 2.04 1-1-2045 11,000,000 11,006,820
26,021,842
Miscellaneous Revenue: 0.02% Duluth MN Independent School District Certificates of Participation Series B
(South Dakota Credit Program Insured) 5.00 2-1-2024 425,000 483,773 Duluth MN Independent School District Certificates of Participation Series B
(South Dakota Credit Program Insured) 5.00 2-1-2025 375,000 438,154
2
921,927
8,681,319
Mississippi: 0.19%
Utilities Revenue: 0.19% Mississippi Business Finance Corporation Mississippi Power Company Project
Series 2010 2.75 12-1-2040 6,750,000 6,835,050
Missouri: 1.06%
GO Revenue: 0.18% Kansas City MO Series A 5.00 2-1-2020 1,495,000 1,499,530 St. Louis MO Special Administrative Board The Transitional School Direct
Deposit Program 4.00 4-1-2022 5,030,000 5,346,488
6,846,018
Health Revenue: 0.14% Kirkwood MO IDA Retirement Community Series A 8.25 5-15-2045 3,000,000 3,076,950 Missouri HEFA Health Care Series B 4.50 6-1-2025 1,000,000 1,013,810 Missouri HEFA Health Care Series B 5.00 6-1-2021 1,000,000 1,015,860
5,106,620
Portfolio of investments—December 31, 2019 (unaudited)
The accompanying notes are an integral part of these financial statements.
Wells Fargo Short-Term Municipal Bond Fund | 19

Interest rate
Maturity date Principal Value
Industrial Development Revenue: 0.65% Missouri Environmental Improvement and Energy Resources Authority
Kansas City Power And Light Company Project 2.75% 5-1-2038 $23,400,000 $ 23,921,118
Tax Revenue: 0.09% Arnold MO Real Property Arnold Triangle Redevelopment Project Series A 3.75 5-1-2023 1,380,000 1,405,489 Bi State Development Agency Missouri Illinois Metropolitan District
Refunding Bond St Clair County Metrolink Project (AGM Insured) 5.25 7-1-2020 2,000,000 2,039,720
3,445,209
39,318,965
Nebraska: 0.16%
Housing Revenue: 0.13% Douglas Country NE Housing Authority Sorensen Senior Residences Project
Series A 2.05 3-1-2020 5,000,000 5,000,350
Utilities Revenue: 0.03% Nebraska Public Power Generation Agency Whelan Energy Center Unit 2
Series A 5.00 1-1-2020 1,000,000 1,000,000
6,000,350
Nevada: 0.25%
Airport Revenue: 0.03% Clark County NV Airport Jet Aviation Fuel Tax Series A 5.00 7-1-2020 1,000,000 1,018,780
GO Revenue: 0.13% Clark County NV School District Series C 5.00 6-15-2022 2,000,000 2,177,260 Clark County NV School District Series D 5.00 6-15-2021 2,395,000 2,526,845
4,704,105
Industrial Development Revenue: 0.02% Clark County NV PCR 1.88 6-1-2031 880,000 880,370
Utilities Revenue: 0.07% Washoe County NV Sierra Pacific Power Series B 3.00 3-1-2036 560,000 581,414 Washoe County NV Water Facility Refunding Bond Series F 2.05 3-1-2036 2,000,000 2,019,560
2,600,974
9,204,229
New Hampshire: 0.07%
Housing Revenue: 0.07% New Hampshire HFA MFHR Series 1 (FHA Insured) 1.75 1-1-2020 2,455,000 2,455,000
New Jersey: 6.89%
Airport Revenue: 0.20% New Jersey EDA Refunding Bond Port Newark Container Terminal LLC
Project 5.00 10-1-2021 1,500,000 1,584,915 New Jersey EDA Refunding Bond Port Newark Container Terminal LLC
Project 5.00 10-1-2022 1,755,000 1,909,528 New Jersey EDA Refunding Bond Port Newark Container Terminal LLC
Project 5.00 10-1-2023 1,500,000 1,676,910 New Jersey EDA Refunding Bond Port Newark Container Terminal LLC
Project 5.00 10-1-2024 2,000,000 2,288,960
7,460,313
Portfolio of investments—December 31, 2019 (unaudited)
The accompanying notes are an integral part of these financial statements.
20 | Wells Fargo Short-Term Municipal Bond Fund

Interest rate
Maturity date Principal Value
Education Revenue: 0.30% New Jersey EDA Student Loan Series 1 5.50% 12-1-2021 $ 1,000,000 $ 1,077,200
New Jersey Higher Education Assistance Authority Series A1 5.00 12-1-2020 9,775,000 10,097,771
11,174,971
GO Revenue: 0.17% Andover NJ Regional School District Refunding School Bond Series 2014
(BAM Insured) 3.00 2-15-2020 515,000 516,112 New Jersey TTFA Transit System Series A 5.75 6-15-2020 2,275,000 2,319,317 Trenton City NJ Refunding Bond 4.00 7-15-2020 1,685,000 1,701,429
Trenton City NJ Refunding Bond (BAM Insured) 5.00 12-1-2020 1,675,000 1,730,459
6,267,317
Housing Revenue: 2.37% New Jersey Housing & Mortgage Finance Agency Multifamily Series A 2.00 11-1-2021 325,000 328,439 New Jersey Housing & Mortgage Finance Agency Multifamily Series B 1.65 5-1-2020 4,605,000 4,610,664 New Jersey Housing & Mortgage Finance Agency Multifamily Series B 2.00 5-1-2021 14,335,000 14,455,127 New Jersey Housing & Mortgage Finance Agency Multifamily Series C 2.41 10-1-2021 27,500,000 27,710,650New Jersey Housing & Mortgage Finance Agency Single Family Housing
Series B 2.60 10-1-2021 5,805,000 5,882,207 New Jersey Housing & Mortgage Finance Agency Single Family Housing
Series B 2.70 4-1-2022 5,925,000 6,036,212 New Jersey Housing & Mortgage Finance Agency Single Family Housing
Series B 2.80 10-1-2022 5,530,000 5,662,112 New Jersey Housing & Mortgage Finance Agency Single Family Housing
Series B 2.90 4-1-2023 6,100,000 6,287,331 New Jersey Housing & Mortgage Finance Agency Single Family Housing
Series B 2.95 10-1-2023 5,710,000 5,918,758 New Jersey Housing & Mortgage Finance Agency Single Family Housing
Series B 3.10 4-1-2024 2,700,000 2,820,717 New Jersey Housing & Mortgage Finance Agency Single Family Housing
Series B 3.25 4-1-2025 3,070,000 3,239,863 New Jersey Housing & Mortgage Finance Agency Villa Victoria Apartments
Project Series F 2.43 11-1-2021 5,000,000 5,039,700
87,991,780
Miscellaneous Revenue: 1.97% New Jersey EDA School Facilities Construction Bond Series DDD 5.00 6-15-2023 3,000,000 3,338,400 New Jersey EDA School Facilities Construction Bond Series DDD 5.00 6-15-2024 2,605,000 2,963,422 New Jersey EDA School Facilities Construction Bond Series K (National
Insured) 5.25 12-15-2021 1,040,000 1,116,960 New Jersey EDA School Facilities Construction Bond Series NN 5.00 3-1-2022 405,000 434,917 New Jersey EDA School Facilities Construction Refunding Bond Series NN 5.00 3-1-2021 1,410,000 1,473,253 New Jersey EDA School Facilities Construction Refunding Bond Series NN 5.00 3-1-2021 3,610,000 3,759,526 New Jersey EDA Series BBB 5.00 6-15-2022 6,000,000 6,501,480 New Jersey EDA Series BBB 5.00 6-15-2023 4,000,000 4,451,200 New Jersey EDA Series XX 5.00 6-15-2022 7,500,000 8,126,850 New Jersey EDA Transportation Project New Jersey Transit Corporation
Project Series B 5.00 11-1-2021 2,490,000 2,651,626 New Jersey EDA Transportation Project New Jersey Transit Corporation
Project Series B 5.00 11-1-2022 26,000,000 28,500,940 New Jersey School Facilities Construction Prerefunded Bond Series EE 5.00 9-1-2020 1,650,000 1,691,366 New Jersey TTFA Series A 5.00 6-15-2020 1,000,000 1,016,130 Newark NJ Housing Authority Newark Redevelopment Project Refunding
Bond (National Insured) 5.25 1-1-2020 2,170,000 2,170,000 Newark NJ Housing Authority Newark Redevelopment Project Refunding
Bond (National Insured) 5.25 1-1-2021 4,570,000 4,745,945
72,942,015
Portfolio of investments—December 31, 2019 (unaudited)
The accompanying notes are an integral part of these financial statements.
Wells Fargo Short-Term Municipal Bond Fund | 21

Interest rate
Maturity date Principal Value
Tax Revenue: 0.02% New Jersey EDA School Facilities Construction Unrefunded Bond Series EE 5.00% 9-1-2020 $ 610,000 $ 624,433
Transportation Revenue: 1.86% New Jersey TTFA Series A 5.25 12-15-2020 33,465,000 34,679,780
New Jersey TTFA Series A1 5.00 6-15-2020 7,000,000 7,114,800 New Jersey TTFA Series A1 5.00 6-15-2021 5,000,000 5,262,600
New Jersey Turnpike Authority Series C-6 (1 Month LIBOR +0.75%) ± 1.95 1-1-2030 21,820,000 22,014,853
69,072,033
255,532,862
New Mexico: 0.30%
Health Revenue: 0.02% Santa Fe NM Retirement Facility El Castillo Retirement 2.25 5-15-2024 600,000 600,540
Utilities Revenue: 0.28% Farmington NM PCR Southern California Edison Company Four Corners
Project Series 2011 1.88 4-1-2029 5,500,000 5,502,530 Farmington NM PCR Southern California Edison Company Four Corners
Project Series A 1.88 4-1-2029 4,950,000 4,952,277
10,454,807
11,055,347
New York: 6.47%
GO Revenue: 0.72% Nassau County NY Series A 5.00 1-1-2020 4,000,000 4,000,000 New York NY Series J Subordinate Bond Series J3 (AGM Insured) (m) 1.65 6-1-2036 19,425,000 19,425,000 Oyster Bay NY Public Improvement 4.00 2-15-2020 1,000,000 1,002,900 Rockland County NY Public Improvement Series C (AGM Insured) 3.00 5-1-2020 1,390,000 1,398,646
Rockland County NY Refunding Bond (BAM Insured) 3.00 2-15-2020 630,000 631,392
26,457,938
Health Revenue: 0.28% New York Dormitory Authority Non State Supported Debt Northwell Health 5.00 5-1-2048 4,000,000 4,517,160 New York NY Health & Hospital Corporation Health System Series A 5.50 2-15-2020 5,755,000 5,774,797
10,291,957
Housing Revenue: 0.74% New York NY Housing Development Corporation Multifamily Housing AMT
Sustainable Neighborhood 1.75 11-1-2023 400,000 401,400 New York NY Housing Development Corporation Multifamily Housing AMT
Sustainable Neighborhood 1.80 5-1-2024 400,000 401,528 New York NY Housing Development Corporation Multifamily Housing AMT
Sustainable Neighborhood 1.85 11-1-2024 400,000 401,656 New York NY Housing Development Corporation Multifamily Housing AMT
Sustainable Neighborhood 1.90 5-1-2025 515,000 516,715 New York NY Housing Development Corporation Multifamily Housing AMT
Sustainable Neighborhood 1.95 11-1-2025 520,000 521,321 New York NY Housing Development Corporation Multifamily Housing AMT
Sustainable Neighborhood 2.00 5-1-2026 535,000 535,728 New York NY Housing Development Corporation Sustainable Neighborhood
Bond Series I2B 2.00 5-1-2021 12,000,000 12,003,240 New York HFA Affordable Housing Series L (GNMA/FNMA/FHLMC Insured) 1.65 5-1-2021 6,400,000 6,431,808
Portfolio of investments—December 31, 2019 (unaudited)
The accompanying notes are an integral part of these financial statements.
22 | Wells Fargo Short-Term Municipal Bond Fund

Interest rate
Maturity date Principal Value
) Housing Revenue (continued New York HFA Affordable Housing Series M-1 (GNMA/FNMA/FHLMC
Insured) 1.80% 5-1-2020 $ 1,200,000 $ 1,202,100 New York HFA Affordable Housing Series M-1 (GNMA/FNMA/FHLMC
Insured) 2.00 5-1-2021 5,000,000 5,038,600
27,454,096
Industrial Development Revenue: 0.92% New York Transportation Development Corporation Special Facilities
Revenue Delta Airlines Incorporated LaGuardia Airport Terminals C&D Redevelopment 5.00 1-1-2024 30,130,000 33,967,056
Miscellaneous Revenue: 0.08% Suffolk County NY Judicial Facilities Agency Leases H. Lee Dennison Building 5.00 11-1-2020 2,915,000 3,000,759
Tax Revenue: 0.55% New York Metropolitan Transportation Authority Subordinate Bond Series
A2A (SIFMA Municipal Swap +0.45%) ± 2.06 11-1-2026 6,065,000 6,067,305 New York NY Transitional Finance Authority Subordinate Bond Series 1-B
(SIFMA Municipal Swap +0.80%) ± 2.41 11-1-2022 14,225,000 14,269,098
20,336,403
Transportation Revenue: 2.63% New York Metropolitan Transportation Authority Subordinate Bond
Series A2 (SIFMA Municipal Swap +0.58%) ± 2.19 11-15-2039 2,000,000 2,000,200 New York Metropolitan Transportation Authority Subordinate Bond
Series C2 4.00 11-15-2033 8,530,000 8,666,139 New York Metropolitan Transportation Authority Subordinate Bond
Series D-2A-1 (1 Month LIBOR +0.57%) (AGM Insured) ± 1.75 11-1-2032 7,500,000 7,504,875 New York Metropolitan Transportation Authority Subordinate Bond
Series D-2A-2 (1 Month LIBOR +0.68%) (AGM Insured) ± 1.86 11-1-2032 20,000,000 20,057,600 New York Metropolitan Transportation Authority Subordinate Bond
Series D-2B (1 Month LIBOR +0.30%) (AGM Insured) ± 1.48 11-1-2032 6,000,000 5,989,080 New York Metropolitan Transportation Authority Subordinate Bond
Series D1 5.00 9-1-2022 20,000,000 21,873,000 New York Metropolitan Transportation Authority Subordinate Bond
Series D2 (SIFMA Municipal Swap +0.45%) ± 2.06 11-15-2044 22,545,000 22,524,710 Niagara Falls NY Board Community Toll (National Insured) 6.25 10-1-2020 8,685,000 9,010,861
97,626,465
Utilities Revenue: 0.16% Long Island NY Power Authority Electric System General Series B 1.65 9-1-2049 6,000,000 6,049,800
Water & Sewer Revenue: 0.39% New York NY Municipal Water Finance Series B1-A (Sumitomo Mitsui
Banking SPA) ø 1.58 6-15-2024 14,500,000 14,500,000
239,684,474
North Carolina: 0.23%
Health Revenue: 0.20% Charlotte Mecklenburg NC Hospital Authority Atrium Health Series B 5.00 1-15-2048 7,000,000 7,545,090
Industrial Development Revenue: 0.03% Columbus County NC Industrial Facilities and Pollution Control Financing
Authority Environmental Improvement Revenue Refunding Bond International Paper Company Project Series A
2.00
11-1-2033 1,000,000
1,008,760
8,553,850
Portfolio of Investments—December 31, 2019 (unaudited)
The accompanying notes are an integral part of these financial statements.
Wells Fargo Short-Term Municipal Bond Fund | 23

Interest rate
Maturity date Principal Value
Ohio: 2.61%
GO Revenue: 0.01% Springfield OH Refunding Bond (AGC Insured) 4.00% 12-1-2020 $ 225,000 $ 225,439
Health Revenue: 0.02% Lake County OH Lake Hospital System Incorporated 5.00 8-15-2020 905,000 924,584
Housing Revenue: 1.47% Cuyahoga OH Metropolitan Housing Authority Headquarters Project 1.75 3-1-2020 5,445,000 5,447,178
Lucas OH Metropolitan Housing Authority Certificate of Participation 2.25 11-1-2020 270,000 271,123 Lucas Plaza OH Housing Development Corporation Refunding Bond (FHA
Insured) ¤ 0.00 6-1-2024 15,800,000 14,766,206 Ohio HFA Cambridge Village Apartments Project (HUD Insured) 2.40 4-1-2021 3,200,000 3,207,872 Ohio HFA Multifamily Sem Manor Project 1.40 9-1-2020 6,000,000 6,000,180 Ohio HFA Multifamily Southwick Place Townhomes Project 1.55 3-1-2022 4,975,000 4,978,383 Ohio HFA Multifamily Wesley Tower Apartments Project 1.40 6-1-2022 10,500,000 10,498,425 Trumbull Metropolitan Housing Authority Multifamily Housing Apartments
Project Series A 1.70 6-1-2022 9,250,000 9,285,890
54,455,257
Industrial Development Revenue: 0.10% Ohio Air Quality Development Authority Ohio Valley Electric Corporation
Series A 2.88 2-1-2026 3,750,000 3,805,613
Miscellaneous Revenue: 0.07% Ohio Portsmouth Bypass Project 5.00 12-31-2020 1,320,000 1,363,441 Ohio Portsmouth Bypass Project 5.00 12-31-2021 1,205,000 1,281,433
2,644,874
Resource Recovery Revenue: 0.33% Ohio Air Quality Development Authority Refunding Bond American Electric
Power Company Project 1.90 5-1-2026 12,000,000 12,055,920
Utilities Revenue: 0.61% American Municipal Power Ohio Incorporated Refunding Bond 2.30 2-15-2038 8,750,000 8,880,813
Lancaster OH Port Authority Gas Supply 5.00 8-1-2049 12,000,000 13,892,280
22,773,093
96,884,780
Oklahoma: 1.00%
Airport Revenue: 0.07% Tulsa OK Airports Improvement Trust Series 2013A (BAM Insured) 5.00 6-1-2020 695,000 705,091 Tulsa OK Airports Improvement Trust Series 2015A (BAM Insured) 5.00 6-1-2020 1,710,000 1,734,829
2,439,920
Education Revenue: 0.01% Oklahoma Development Finance Authority Refunding Bond Oklahoma City
University Project 4.00 8-1-2022 535,000 564,350
GO Revenue: 0.40% Oklahoma County OK Independent School District #52 Series A 2.50 1-1-2021 3,535,000 3,581,697 Oklahoma County OK Independent School District #52 Series A 3.00 1-1-2022 3,535,000 3,662,861 Oklahoma County OK Independent School District #52 Series A 3.00 1-1-2023 3,135,000 3,305,074 Oklahoma County OK Independent School District #52 Series A 3.50 1-1-2020 2,840,000 2,840,000 Woodward County OK Independent School District #1 Board of Education 2.30 6-1-2020 1,435,000 1,439,319
14,828,951
Portfolio of investments—December 31, 2019 (unaudited)
The accompanying notes are an integral part of these financial statements.
24 | Wells Fargo Short-Term Municipal Bond Fund

Interest rate
Maturity date Principal Value
Health Revenue: 0.05% Oklahoma Development Finance Authority Oklahoma University Medicine
Project Series B 5.00% 8-15-2022 $ 500,000 $ 541,220 Oklahoma Development Finance Authority Oklahoma University Medicine
Project Series B 5.00 8-15-2023 500,000 556,160 Oklahoma Development Finance Authority Oklahoma University Medicine
Project Series B 5.00 8-15-2024 600,000 684,540
1,781,920
Miscellaneous Revenue: 0.46% Blaine County OK Educational Facilities Authority Watonga Public Schools
Project 5.00 12-1-2020 750,000 773,933 Blaine County OK Educational Facilities Authority Watonga Public Schools
Project 5.00 12-1-2021 945,000 1,011,519 Creek County OK Educational Facilities Authority Sapulpa Public School
Project 5.00 9-1-2020 2,550,000 2,613,393 Grady County OK School Finance Authority Tuttle Public School Project 5.00 9-1-2021 1,065,000 1,131,168 Kay County OK Public Buildings Authority 2.25 4-1-2024 720,000 717,797 Kay County OK Public Buildings Authority 2.25 4-1-2025 735,000 731,060 Kay County OK Public Buildings Authority 2.38 4-1-2026 750,000 747,998 Ottawa County OK Educational Facilities Authority Educational Facilities
Lease Miami Public Schools Project 5.00 9-1-2023 830,000 930,563 Ottawa County OK Educational Facilities Authority Educational Facilities
Lease Miami Public Schools Project 5.00 9-1-2024 1,080,000 1,241,341 Ottawa County OK Educational Facilities Authority Educational Facilities
Lease Miami Public Schools Project 5.00 9-1-2025 930,000 1,092,006 Tulsa County OK Industrial Authority Educational Broken Arrow Public
Schools Project 5.00 9-1-2025 2,500,000 2,827,675 Wagoner County OK School Development Authority Wagoner Public Schools
Project 4.00 9-1-2025 1,255,000 1,409,880 Weatherford OK Industrial Trust Educational Facilities Lease Weatherford
Public Schools Project 5.00 3-1-2027 1,475,000 1,784,721
17,013,054
Tax Revenue: 0.01% Cleveland County OK Justice Authority Detention Facility Project 4.00 3-1-2020 500,000 501,050
37,129,245
Other: 0.67%
Miscellaneous Revenue: 0.67% FHLMC Multiclass Mortgage Certificate of Participation Series M012
Class A1A øø 1.60 8-15-2051 3,575,268 3,604,442 FHLMC Multiclass Mortgage Certificate of Participation Series M012
Class A1B1 øø 2.25 8-15-2051 16,535,614 16,833,090 Public Housing Capital Fund Trust I (HUD Insured) 144A 4.50 7-1-2022 3,692,210 3,732,012 Public Housing Capital Fund Trust II (HUD Insured) 144A 4.50 7-1-2022 575,829 584,340
24,753,884
Pennsylvania: 6.39%
Education Revenue: 0.79% Lehigh County PA General Purpose Authority (SIFMA Municipal Swap
+0.58%) ± 2.19 11-1-2037 11,025,000 11,023,457 Philadelphia PA IDA Thomas Jefferson University Series B ø 1.78 9-1-2050 18,210,000 18,210,000
29,233,457
Portfolio of investments—December 31, 2019 (unaudited)
The accompanying notes are an integral part of these financial statements.
Wells Fargo Short-Term Municipal Bond Fund | 25

Interest rate
Maturity date Principal Value
GO Revenue: 1.51% Butler PA Area School District (AGM Insured) 5.00% 10-1-2023 $ 1,280,000 $ 1,446,374 Butler PA Area School District (AGM Insured) 5.00 10-1-2024 2,965,000 3,444,678 Butler PA Area School District (AGM Insured) 5.00 10-1-2025 4,695,000 5,587,942
Coatesville PA Area School District (AGM Insured) 5.00 8-1-2023 1,000,000 1,117,460 Lackawanna County PA Riverside School District Project (BAM Insured) 4.00 10-15-2020 1,455,000 1,482,281
Manheim Township PA School District Series A (1 Month LIBOR +0.47%) ± 1.63 5-1-2025 3,760,000 3,769,588 Penn Hills PA School District (BAM Insured) 5.00 11-15-2020 825,000 851,499 Penn Hills PA School District (BAM Insured) 5.00 11-15-2021 1,275,000 1,359,992 Philadelphia PA School District Refunding Bond %% 5.00 9-1-2023 4,500,000 4,994,460 Philadelphia PA School District Series A 5.00 9-1-2022 1,000,000 1,096,130 Philadelphia PA School District Series A 5.00 9-1-2024 800,000 923,016 Philadelphia PA School District Series C 5.00 9-1-2020 1,125,000 1,152,821 Philadelphia PA School District Series D 5.00 9-1-2020 1,500,000 1,537,095 Philadelphia PA School District Series D 5.00 9-1-2021 1,750,000 1,856,330 Philadelphia PA School District Series E (State Aid Withholding Insured) 5.00 9-1-2020 2,225,000 2,280,024 Philadelphia PA School District Series E 5.25 9-1-2023 7,000,000 7,186,970 Philadelphia PA School District Series F 5.00 9-1-2020 2,750,000 2,818,008 Philadelphia PA School District Series F 5.00 9-1-2021 3,580,000 3,797,521 Scranton PA 144A 5.00 9-1-2020 2,205,000 2,246,851 Scranton PA School District Series A 5.00 6-1-2021 680,000 711,246 Scranton PA School District Series A 5.00 6-1-2022 730,000 783,224 Scranton PA School District Series A 5.00 6-1-2023 835,000 924,370 Scranton PA School District Series B 5.00 6-1-2021 580,000 606,651 Scranton PA School District Series B (National Insured) 5.00 6-1-2022 870,000 937,703 Scranton PA School District Series B (National Insured) 5.00 6-1-2023 615,000 680,823 Scranton PA School District Series C 5.00 6-1-2020 585,000 592,886 Scranton PA School District Series C 5.00 6-1-2021 590,000 617,111 Warwick PA School District 4.00 2-15-2020 1,000,000 1,003,350
55,806,404
Health Revenue: 0.92% Allegheny County PA Hospital Development Authority University of
Pittsburgh Medical Center Series A-1 (3 Month LIBOR +0.72%) ± 2.00 2-1-2021 1,345,000 1,348,201 Berks County PA IDA Health System Tower Health Project 5.00 11-1-2023 1,000,000 1,123,550 Berks County PA IDA Health System Tower Health Project 5.00 11-1-2024 1,000,000 1,152,310 Franklin County PA IDA Menno-Haven Incorporated Project 5.00 12-1-2021 230,000 240,486 Lancaster County PA Hospital Authority Healthcare Facilities Moravian
Manors Incorporated Project 2.88 12-15-2023 1,200,000 1,200,240 Montgomery County PA Higher Education & Health Authority
Series 2018D ø 1.78 9-1-2050 10,000,000 10,000,000 Montgomery County PA Higher Education & Health Authority Thomas
Jefferson University Series A 5.00 9-1-2023 1,050,000 1,188,033 Montgomery County PA Higher Education & Health Authority Thomas
Jefferson University Series C (SIFMA Municipal Swap +0.72%) ± 2.33 9-1-2051 10,000,000 10,000,000 Montgomery County PA IDA Albert Einstein Healthcare Network Issue
Series A 5.00 1-15-2020 1,315,000 1,316,460 Philadelphia PA Hospitals & HEFAR Temple University Health System 5.00 7-1-2021 1,250,000 1,307,950 Philadelphia PA Hospitals & HEFAR Temple University Health System 5.00 7-1-2022 2,000,000 2,150,780 Quakertown PA Health Facilities Authority Series A 3.13 7-1-2021 3,250,000 3,247,888
34,275,898
Housing Revenue: 1.10% Pennsylvania HFA Single Family Series 125A 2.38 10-1-2025 18,205,000 18,543,249 Pennsylvania HFA Single Family Series 128A 4.75 4-1-2033 8,175,000 8,984,080
Portfolio of investments—December 31, 2019 (unaudited)
The accompanying notes are an integral part of these financial statements.
26 | Wells Fargo Short-Term Municipal Bond Fund

Interest rate
Maturity date Principal Value
(continued) Housing Revenue Pennsylvania HFA Special Limited Obligation Multifamily Housing Norris
Homes Phase V 1.40% 1-1-2043 $10,000,000 $ 9,996,600 Pittsburgh PA Urban RDA Crawford Square Apartments Project 2.25 12-1-2020 3,300,000 3,301,320
40,825,249
Industrial Development Revenue: 0.64% Lehigh County PA IDA Electric Utilities Corporation Series B 1.80 2-15-2027 2,500,000 2,527,425 Montgomery County PA IDA Exelon Generation Company LLC 2.50 10-1-2030 15,795,000 15,839,384 Montgomery County PA IDA Peco Energy Company Project Series A 2.60 3-1-2034 2,125,000 2,143,806 Pennsylvania EDFA Bridges Finco LP 5.00 12-31-2020 2,020,000 2,084,640 Pennsylvania EDFA Bridges Finco LP 5.00 12-31-2021 1,095,000 1,162,452
23,757,707
Miscellaneous Revenue: 0.35% Bethlehem PA Area School District Authority Bethlehem Area School
District Refunding Bond Project (1 Month LIBOR +0.49%) ± 1.74 1-1-2030 4,970,000 4,976,014 Delaware County PA Authority Neumann University 4.00 10-1-2021 1,365,000 1,407,438 Philadelphia PA Public School Building Authority Harrisburg School District
Project Series A (AGM Insured)
5.00 12-1-2023 2,505,000 2,842,198 Philadelphia PA RDA Transformation Initiative Series B 5.00 4-15-2020 1,870,000 1,888,064 Scranton PA RDA Series A (Municipal Government Guaranty Insured) 5.00 11-15-2021 1,765,000 1,822,698
12,936,412
Resource Recovery Revenue: 0.25% Pennsylvania EDFA Solid Waste Disposal Series A 1.70 8-1-2037 9,420,000 9,431,963
Transportation Revenue: 0.42% Lancaster PA Parking Authority Series A (BAM Insured) 4.00 9-1-2025 530,000 596,626 Lancaster PA Parking Authority Series A (BAM Insured) 4.00 9-1-2026 545,000 621,398
Pennsylvania Turnpike Commission Series B (SIFMA Municipal Swap +0.70%) ± 2.31 12-1-2023 2,880,000 2,899,094
Pennsylvania Turnpike Commission Series B (SIFMA Municipal Swap +1.27%) ± 2.88 12-1-2020 11,300,000 11,351,980
15,469,098
Water & Sewer Revenue: 0.41% Pittsburgh PA Water & Sewer Authority Series C (1 Month LIBOR +0.64%)
(AGM Insured) ± 1.89 9-1-2040 15,000,000 15,004,650
236,740,838
Rhode Island: 0.36%
Education Revenue: 0.03% Rhode Island Student Loan Authority AMT Series A 5.00 12-1-2023 1,175,000 1,324,084
Health Revenue: 0.09% Rhode Island Health & Educational Building Corporation Tockwotton Home
Series 2011 8.38 1-1-2046 3,000,000 3,212,460
Miscellaneous Revenue: 0.24% Rhode Island & Providence Plantations Consolidated Capital Development
Series A
5.00
8-1-2023 8,045,000
8,833,330
13,369,874
Portfolio of investments—December 31, 2019 (unaudited)
The accompanying notes are an integral part of these financial statements.
Wells Fargo Short-Term Municipal Bond Fund | 27

Interest rate
Maturity date Principal Value
South Carolina: 0.47%
Health Revenue: 0.19% South Carolina Jobs EDA Prisma Health Obligated Group Series C ø 1.77% 5-1-2048 $ 7,000,000 $ 7,000,000
Miscellaneous Revenue: 0.13% South Carolina Transportation Infrastructure Bank Refunding Bond Series B
(1 Month LIBOR +0.45%) ± 1.60 10-1-2031 4,955,000 4,960,351
Utilities Revenue: 0.15% Piedmont SC Municipal Power Agency (National Insured) 5.38 1-1-2025 4,760,000 5,605,233
17,565,584
Tennessee: 1.81%
Health Revenue: 0.08% Greeneville TN Health and Educational Ballad Health Series A 5.00 7-1-2023 1,600,000 1,784,992 Knox County TN Health Educational and University Health System
Incorporate 5.00 4-1-2024 1,000,000 1,126,870
2,911,862
Housing Revenue: 0.18% Kingsport TN Housing & RDA Collateralized Multifamily Housing Series B 2.22 1-1-2022 6,700,000 6,771,958
Utilities Revenue: 1.55% Tennessee Energy Acquisition Corporation Gas Project 4.00 11-1-2049 7,500,000 8,336,400 Tennessee Energy Acquisition Corporation Series A 4.00 5-1-2048 45,840,000 49,066,678
57,403,078
67,086,898
Texas: 13.55%
Airport Revenue: 0.40% Dallas-Fort Worth TX International Airport Series B 5.00 11-1-2023 500,000 551,610
El Paso TX Airport Series 2018 5.00 8-15-2025 3,110,000 3,659,133 Houston TX Airport System Refunding Bond Subordinate Bond Lien Series A 5.00 7-1-2024 3,620,000 3,937,293 Houston TX Airport System Refunding Bond Subordinated Lien Series B 5.00 7-1-2027 6,090,000 6,645,713
14,793,749
Education Revenue: 0.53% Clifton TX Higher Education Finance Corporation Education International
Leadership Series D 5.00 8-15-2021 665,000 693,103 Clifton TX Higher Education Finance Corporation Education International
Leadership Series D 5.00 8-15-2022 1,000,000 1,065,800 Clifton TX Higher Education Finance Corporation Education International
Leadership Series D 5.00 8-15-2023 1,510,000 1,641,914 Clifton TX Higher Education Finance Corporation Education International
Leadership Series D 5.00 8-15-2024 3,125,000 3,457,813 North Texas Higher Education Authority Incorporated Student Loan Series 2
Class A (3 Month LIBOR +1.00%) ± 3.10 4-1-2037 4,205,000 4,225,184 Texas A&M University System Permanent University Series A 5.00 7-1-2021 4,870,000 5,152,265 University of Texas Financing System Refunding Bond Series C 5.00 8-15-2022 3,000,000 3,303,240
19,539,319
GO Revenue: 7.50% Cypress-Fairbanks TX Independent School District Series A-1 2.13 2-15-2027 7,040,000 7,134,970
Cypress-Fairbanks TX Independent School District Series B-2 2.13 2-15-2040 17,000,000 17,229,330
Portfolio of investments—December 31, 2019 (unaudited)
The accompanying notes are an integral part of these financial statements.
28 | Wells Fargo Short-Term Municipal Bond Fund

Interest rate
Maturity date Principal Value
(continued) GO Revenue Dallas TX Unrefunded Balance Refunding Bond 5.00% 2-15-2021 $ 3,580,000 $ 3,732,866 Denton TX Independent School District School Building Series B 2.00 8-1-2044 4,070,000 4,177,204 Denton TX Independent School District Unlimited Tax School Building Bond
Series 2013 2.00 8-1-2043 4,000,000 4,016,040 Eanes TX Independent School District School Building Series B 1.75 8-1-2039 7,465,000 7,562,568 Fort Bend TX Independent School District Series C 1.35 8-1-2042 4,525,000 4,526,267 Fort Bend TX independent School District Series D 1.50 8-1-2042 10,530,000 10,561,064 Harris County TX Cypress-Fairbanks Independent High School Series B-1 2.13 2-15-2040 4,800,000 4,864,752 Hays TX Consolidated Independent School District Building Bond Series B 2.70 8-15-2042 7,370,000 7,628,392 Houston TX Independent School District 1.45 6-1-2029 8,385,000 8,390,115 Houston TX Independent School District Limited Tax Schoolhouse Series B 2.40 6-1-2036 5,000,000 5,078,050 Houston TX Public Improvement Series A 5.00 3-1-2020 4,000,000 4,024,960 Houston TX Public Improvement Series A 5.00 3-1-2021 4,000,000 4,179,440 Houston TX Public Improvement Series A 5.00 3-1-2022 5,000,000 5,416,200 Houston TX Public Improvement Series A 5.00 3-1-2023 3,500,000 3,915,170 Hurst Euless Bedford TX Independent School District Prerefunded Bond 5.00 8-15-2022 2,140,000 2,190,055
Hutto TX Independent School District Series 2015 3.00 2-1-2055 23,725,000 23,956,319 Lake Travis TX Independent School District Prefunded Bond Series B 2.63 2-15-2048 1,010,000 1,040,845 Lake Travis TX Independent School District Unrefunded Bond 2.63 2-15-2048 8,990,000 9,214,660 Leander TX Independent School District Refunding CAB ¤ 0.00 8-15-2023 1,065,000 1,014,817 Leander TX Independent School District Unrefunded Bond ¤ 0.00 8-15-2044 8,500,000 2,730,795 Mansfield TX Independent School District 2.50 8-1-2042 8,500,000 8,654,700 McAllen TX Independent School District Series A 5.00 2-15-2024 2,620,000 2,925,125
New Caney TX Independent School District Building Bond 3.00 2-15-2050 1,100,000 1,130,173 North East TX Independent School District 2.20 8-1-2049 4,800,000 4,966,704 North East TX Independent School District 2.38 8-1-2047 7,135,000 7,317,513
Northside TX Independent School District Building Bond Series 2018 2.75 8-1-2048 18,975,000 19,880,677 Northside TX Independent School District Building Project 1.75 6-1-2032 6,045,000 6,052,012 Northside TX Independent School District Building Project 2.00 6-1-2046 10,845,000 10,934,037 Nueces County TX Tax Notes 1.95 2-15-2026 6,500,000 6,500,585 Pflugerville TX Independent School District School Building Series A 2.25 8-15-2037 3,450,000 3,534,767 Texas Northside Independent School District 1.45 6-1-2047 4,000,000 4,001,760 Texas Tax Revenue Anticipation Notes 4.00 8-27-2020 27,750,000 28,268,093 Texas Transportation Commission Mobility Fund Series B (SIFMA Municipal
Swap +0.30%) ± 1.91 10-1-2041 24,500,000 24,502,205 Tomball TX Independent School District Series B2 2.13 2-15-2039 6,750,000 6,841,058
278,094,288
Health Revenue: 0.59% Harris County TX Cultural Education Facilities Finance Corporation Hospital
Memorial Hermann Health System (SIFMA Municipal Swap +0.57%) ± 2.18 12-1-2049 11,000,000 11,000,000 Harris County TX Cultural Education Facilities Finance Corporation Hospital
Memorial Hermann Health System 5.00 7-1-2049 7,000,000 8,151,710 Tarrant County TX ECFA Hendrick Medical Center Group 5.00 9-1-2020 920,000 942,871 Tarrant County TX ECFA Hendrick Medical Center Group 5.00 11-15-2020 1,045,000 1,061,365
Travis County TX Health Facilities Development Corporation Longhorn Village Project Series A 7.13 1-1-2046 845,000 894,694
22,050,640
Housing Revenue: 2.14% Alamito TX Public Facility Corporation Cramer Three Apartments Project 2.50 11-1-2021 20,000,000 20,250,800 Austin TX Affordable PFC Incorporated Multifamily Housing Bridge
Cameron Apartments 1.45 12-1-2021 25,000,000 25,001,000 Austin TX Affordable PFC Incorporated Multifamily Housing Bridge Granada
Apartments 1.46 6-1-2023 500,000 500,805
Portfolio of investments—December 31, 2019 (unaudited)
The accompanying notes are an integral part of these financial statements.
Wells Fargo Short-Term Municipal Bond Fund | 29

Interest
rate Maturity
date Principal Value
(continued) Housing Revenue Bexar County TX Housing Finance Corporation Medio Springs Apartments
Project 2.00% 11-1-2020 $26,500,000 $ 26,548,760 Dallas TX Housing Finance Corporation Multifamily Housing Estates At
Shiloh 1.51 7-1-2037 7,000,000 6,998,670
79,300,035
Miscellaneous Revenue: 0.08% Texas Subordinate Bond Series E2 2.25 8-1-2029 2,960,000 2,976,280
Resource Recovery Revenue: 0.30% Mission TX Economic Development Corporation Waste Management Project 2.50 8-1-2020 11,000,000 11,012,540
Transportation Revenue: 0.71% Central Texas Regional Mobility Authority Series B 5.00 1-1-2045 410,000 417,085
Central Texas Regional Mobility Authority Subordinate Bond 4.00 1-1-2022 6,000,000 6,224,460 North Texas Tollway Authority Series A 5.00 1-1-2020 1,050,000 1,050,000 North Texas Tollway Authority Series A 5.00 1-1-2021 1,860,000 1,930,420 North Texas Tollway Authority Special Projects System Series A 6.00 9-1-2041 3,500,000 3,777,830 North Texas Tollway Authority Special Projects System Series D 5.00 9-1-2028 4,335,000 4,608,755 North Texas Tollway Authority Special Projects System Series D 5.25 9-1-2025 3,840,000 4,098,240 North Texas Tollway Authority Special Projects System Series D 5.25 9-1-2026 3,980,000 4,247,655
26,354,445
Utilities Revenue: 0.78% San Antonio TX Electric & Gas Systems Junior Lien Refunding Bond 2.75 2-1-2048 6,000,000 6,245,640 San Antonio TX Junior Lien Series D 3.00 12-1-2045 12,325,000 12,519,735 Texas Municipal Gas Acquisition & Supply Corporation Series A (SIFMA
Municipal Swap +0.55%) ± 2.16 9-15-2027 10,345,000 10,230,791
28,996,166
Water & Sewer Revenue: 0.52% San Antonio TX Water System Junior Lien Series A 2.63 5-1-2049 12,250,000 12,889,695 San Antonio TX Water System Junior Lien Series B 2.00 5-1-2044 5,805,000 5,897,706 Walnut Creek TX Special Utility District (BAM Insured) 4.00 1-10-2020 500,000 500,275
19,287,676
502,405,138
Utah: 0.31%
Airport Revenue: 0.23% Salt Lake City UT International Airport Series A 5.00 7-1-2023 3,150,000 3,532,473 Salt Lake City UT International Airport Series A 5.00 7-1-2024 2,000,000 2,303,920 Salt Lake City UT International Airport Series A 5.00 7-1-2025 2,300,000 2,713,241
8,549,634
Housing Revenue: 0.08% Utah Housing Corporation Multifamily Lincoln Tower Apartments Project 1.54 8-1-2022 3,000,000 3,003,660
11,553,294
Virginia: 3.45%
Health Revenue: 0.04% Lexington VA IDA Residential Care Facility Kendal at Lexington Refunding
Bond 3.00 1-1-2020 450,000 450,000 Lexington VA IDA Residential Care Facility Kendal at Lexington Refunding
Bond 4.00 1-1-2021 440,000 448,272
Portfolio of investments—December 31, 2019 (unaudited)
The accompanying notes are an integral part of these financial statements.
30 | Wells Fargo Short-Term Municipal Bond Fund

Interest rate
Maturity date Principal Value
(continued) Health Revenue Lexington VA IDA Residential Care Facility Kendal at Lexington Refunding
Bond 4.00% 1-1-2022 $ 525,000 $ 542,924
1,441,196
Housing Revenue: 0.78% Fairfax County VA Redevelopment & Housing Authority Parkwood Project 2.21 2-1-2021 15,000,000 15,076,500 Spotsylvania County VA Economic Development Authority Palmers Creek
Apartments Project (FHA/GNMA Insured) 1.45 8-1-2022 13,700,000 13,713,426
8,789,926 2
Industrial Development Revenue: 0.09% Peninsula VA Ports Authority Coal Terminal Refunding Bond Dominion
Terminal Associates Project 1.70 10-1-2033 3,300,000 3,296,106
Miscellaneous Revenue: 0.56% Franklin County VA IDA Public Facility Lease BAN 3.00 10-15-2023 3,000,000 3,037,830 Westmoreland County VA IDA Lease BAN High School Project 2.00 6-1-2022 17,510,000 17,743,233
20,781,063
Tax Revenue: 0.08% Greater Richmond VA Convention Center Authority 5.00 6-15-2020 1,000,000 1,017,360
Marquis VA CDA CAB Series 2015 144A ¤ 0.00 9-1-2045 680,000 447,086 Marquis VA CDA CAB Series A 5.10 9-1-2036 2,169,000 1,391,565 Marquis VA CDA CAB Series C ¤ 0.00 9-1-2041 3,493,000 210,383
066,394 3,
Transportation Revenue: 0.46% Chesapeake VA Bay Bridge & Tunnel District First Tier Generation
Resolution 5.00 11-1-2023 13,750,000 15,585,625 Virginia Commonwealth Transportation Board Refunding Bond Series A 5.00 5-15-2023 1,500,000 1,692,690
17,278,315
Utilities Revenue: 1.44% Halifax County VA IDA 2.15 12-1-2041 44,450,000 44,694,475 York County VA EDA PCR Virginia Electric And Power Company Project
Series A 1.90 5-1-2033 8,500,000 8,609,395
53,303,870
127,956,870
Washington: 4.68%
Airport Revenue: 0.31% Metropolitan Washington Airports Authority Refunding Bond Series 2014A 3.00 10-1-2022 6,500,000 6,787,625
Port of Seattle WA Refunding Bond Series B 5.00 8-1-2023 4,155,000 4,539,919
11,327,544
Education Revenue: 0.59% University of Washington Series A 5.00 5-1-2048 20,500,000 21,876,370
GO Revenue: 0.22% Washington Refunding Bond %% 5.00 6-1-2025 1,000,000 1,137,250 Washington Refunding Bond %% 5.00 6-1-2026 1,570,000 1,824,356 Washington Series A 5.00 8-1-2022 4,800,000 5,276,832
8,238,438
Portfolio of investments—December 31, 2019 (unaudited)
The accompanying notes are an integral part of these financial statements.
Wells Fargo Short-Term Municipal Bond Fund | 31

Interest rate
Maturitydate
Principal Value
Health Revenue: 0.75% Washington HCFR Catholic Health Initiatives Series B (SIFMA Municipal Swap
+1.00%) ± 2.61% 1-1-2035 $ 8,650,000 $ 8,665,224 Washington Health Care Facilities Authority Catholic Health Initiatives
Series A 5.00 2-1-2023 1,025,000 1,066,574 Washington Health Care Facilities Authority Commonspirit Health Series B1 5.00 8-1-2049 2,500,000 2,834,550 Washington Health Care Facilities Authority Commonspirit Health Series B3 5.00 8-1-2049 4,000,000 4,719,360
Washington Health Care Facilities Authority Fred Hutchinson Cancer Research (1 Month LIBOR +1.10%) ± 2.30 1-1-2042 9,500,000 9,610,200
Washington Health Care Facilities Authority Series 2015 5.00 7-1-2020 850,000 863,668
27,759,576
Housing Revenue: 0.91% Snohomish County WA Housing Authority Carvel Apartments Project 5.00 4-1-2025 500,000 583,015 Snohomish County WA Housing Authority Carvel Apartments Project 5.00 4-1-2026 730,000 867,795 Washington Housing Finance Commission Multifamily Housing College Glen
Apartments Project Series A (FHA Insured) 1.55 7-1-2022 7,880,000 7,892,056 Washington Housing Finance Commission Multifamily Housing Sanford
Hildebrandt Towers Project 2.25 7-1-2021 17,025,000 17,155,582 Washington Housing Finance Commission Multifamily Housing Series A 1.80 7-1-2020 7,350,000 7,350,000
33,848,448
Tax Revenue: 0.47% Central Puget Sound WA Regional Transit Authority Sales Series S2B (SIFMA
Municipal Swap +0.45%) ± 2.06 11-1-2045 17,250,000 17,252,415
Utilities Revenue: 0.97% Seattle WA Municipal Light & Power Refunding Bond Series B-2 (SIFMA
Municipal Swap +0.29%) ± 1.90 5-1-2045 12,635,000 12,639,043 Seattle WA Municipal Light & Power Refunding Bond Series C-1 (SIFMA
Municipal Swap +0.49%) ± 2.10 11-1-2046 23,190,000 23,279,282
35,918,325
Water & Sewer Revenue: 0.46% King County WA Junior Lien Series 2011 2.45 1-1-2042 17,000,000 17,064,430
173,285,546
West Virginia: 0.23%
Utilities Revenue: 0.23% West Virginia EDA Solid Waste Disposal Facilities Wheeling Power Company
Mitchell Project Series A 3.00 6-1-2037 8,300,000 8,558,462
Wisconsin: 2.22%
Airport Revenue: 0.21% Wisconsin Airport Facilities PFA Senior Obligation Group Series B 5.00 7-1-2022 7,470,000 7,801,967
Education Revenue: 0.04% Wisconsin PFA Guilford College 5.00 1-1-2021 650,000 667,869 Wisconsin PFA Guilford College 5.00 1-1-2022 625,000 658,694
,326,563 1
Health Revenue: 0.71% Wisconsin HEFA Advocate Aurora Health Credit Group Series B-3 5.00 8-15-2054 2,000,000 2,287,660 Wisconsin HEFA Advocate Aurora Health Credit Group Series B-4 5.00 8-15-2054 1,200,000 1,405,104
The accompanying notes are an integral part of these financial statements.
Portfolio of investments—December 31, 2019 (unaudited)
32 | Wells Fargo Short-Term Municipal Bond Fund

Interest rate
Maturity date Principal Value
(continued) Health Revenue Wisconsin HEFA Advocate Aurora Health Credit Group Series C-4 (SIFMA
Municipal Swap +0.65%) ± 2.26% 8-15-2054 $ 4,200,000 $ 4,243,932 Wisconsin HEFA Ascension Health Alliance 5.00 11-15-2033 12,000,000 13,991,040 Wisconsin HEFA Beloit Health System Incorporated %% 5.00 7-1-2025 1,000,000 1,177,010 Wisconsin HEFA Beloit Health System Incorporated %% 5.00 7-1-2026 1,060,000 1,273,261 Wisconsin HEFA Benevolent Corporation Cedar Community 5.00 6-1-2020 880,000 889,636 Wisconsin HEFA St. Camillus Health System Incorporated 5.00 11-1-2024 155,000 168,758 Wisconsin HEFA St. Camillus Health System Incorporated 5.00 11-1-2025 245,000 269,772 Wisconsin HEFA St. Camillus Health System Incorporated 5.00 11-1-2026 355,000 394,590 Wisconsin HEFA Vernon Memorial Healthcare Incorporated 5.00 3-1-2020 375,000 376,155
76,918 26,4
Miscellaneous Revenue: 0.88% Waukesha County WI Anticipation Notes Series C 3.00 5-1-2022 3,035,000 3,039,553 Waukesha County WI Series B 3.00 5-1-2021 11,890,000 11,907,241
Wisconsin State Refunding Bond Series A 5.00 5-1-2022 8,040,000 8,764,082 Wisconsin State Refunding Bond Series A 5.00 5-1-2023 8,015,000 9,038,804
32,749,680
Resource Recovery Revenue: 0.38% Wisconsin PFA Series A-2 1.45 10-1-2025 14,000,000 13,999,860
82,354,988
Total Municipal Obligations (Cost $3,619,728,778) 3,660,959,720
Closed End Municipal Bond Fund Obligations: 0.21%
Massachusetts: 0.21% Nuveen Massachusetts AMT-Free Municipal Income Fund Variable Rate
Demand Preferred Shares 1.93% 144A 3,000,000 3,000,000Nuveen Massachusetts Dividend Advantage Municipal Income Fund Variable
Rate Demand Preferred Shares 1.93% 144A 5,000,000 5,000,000
Total Closed End Municipal Bond Fund Obligations (Cost $8,000,000) 8,000,000
Yield Shares
Short-Term Investments: 0.11%
Investment Companies: 0.11% Wells Fargo Municipal Cash Management Money Market Fund Institutional
Class (l)(u)## 1.45 4,002,911 4,004,512
Total Short-Term Investments (Cost $4,004,512) 4,004,512
Total investments in securities (Cost $3,631,733,290) 99.07% 3,672,964,232
Other assets and liabilities, net 0.93 34,370,643
Total net assets 100.00%
$3,707,334,875
Portfolio of investments—December 31, 2019 (unaudited)
The accompanying notes are an integral part of these financial statements.
Wells Fargo Short-Term Municipal Bond Fund | 33
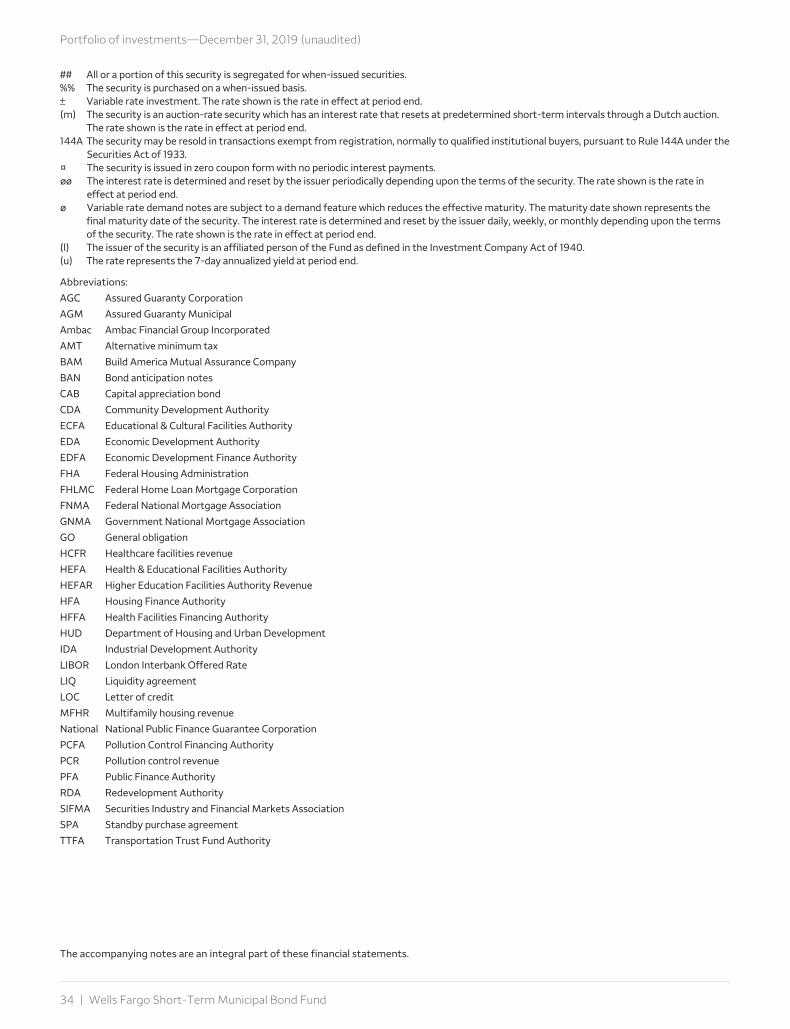
Portfolio of investments—December 31, 2019 (unaudited)
## All or a portion of this security is segregated for when-issued securities. %% The security is purchased on a when-issued basis. ± Variable rate investment. The rate shown is the rate in effect at period end. (m) The security is an auction-rate security which has an interest rate that resets at predetermined short-term intervals through a Dutch auction.
The rate shown is the rate in effect at period end. 144A The security may be resold in transactions exempt from registration, normally to qualified institutional buyers, pursuant to Rule 144A under the
Securities Act of 1933. ¤ The security is issued in zero coupon form with no periodic interest payments. øø The interest rate is determined and reset by the issuer periodically depending upon the terms of the security. The rate shown is the rate in
effect at period end. ø Variable rate demand notes are subject to a demand feature which reduces the effective maturity. The maturity date shown represents the
final maturity date of the security. The interest rate is determined and reset by the issuer daily, weekly, or monthly depending upon the terms of the security. The rate shown is the rate in effect at period end.
(l) The issuer of the security is an affiliated person of the Fund as defined in the Investment Company Act of 1940. (u) The rate represents the 7-day annualized yield at period end.
Abbreviations: AGC Assured Guaranty Corporation AGM Assured Guaranty Municipal Ambac Ambac Financial Group Incorporated AMT Alternative minimum tax BAM Build America Mutual Assurance Company BAN Bond anticipation notes CAB Capital appreciation bond CDA Community Development Authority ECFA Educational & Cultural Facilities Authority EDA Economic Development Authority EDFA Economic Development Finance Authority FHA Federal Housing Administration FHLMC Federal Home Loan Mortgage Corporation FNMA Federal National Mortgage Association GNMA Government National Mortgage Association GO General obligation HCFR Healthcare facilities revenue HEFA Health & Educational Facilities Authority HEFAR Higher Education Facilities Authority Revenue HFA Housing Finance Authority HFFA Health Facilities Financing Authority HUD Department of Housing and Urban Development IDA Industrial Development Authority LIBOR London Interbank Offered Rate LIQ Liquidity agreement LOC Letter of credit MFHR Multifamily housing revenue National National Public Finance Guarantee Corporation PCFA Pollution Control Financing Authority PCR Pollution control revenue PFA Public Finance Authority RDA Redevelopment Authority SIFMA Securities Industry and Financial Markets Association SPA Standby purchase agreement TTFA Transportation Trust Fund Authority
The accompanying notes are an integral part of these financial statements.
34 | Wells Fargo Short-Term Municipal Bond Fund
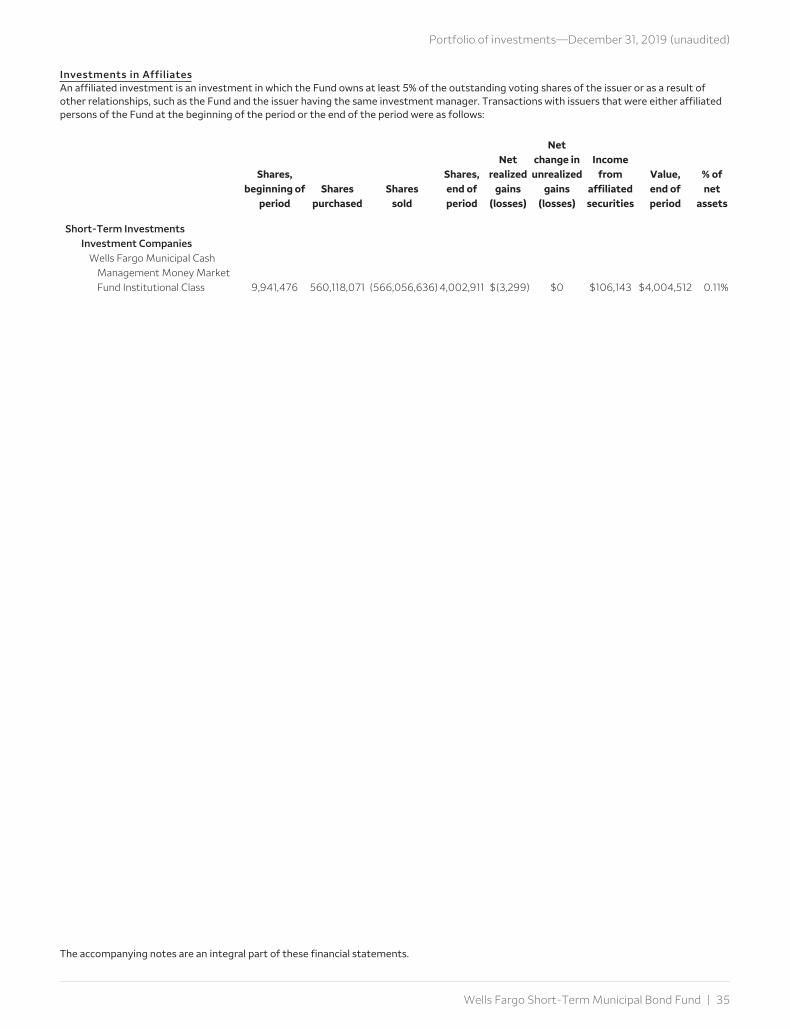
Portfolio of investments—December 31, 2019 (unaudited)
Investments in Affiliates An affiliated investment is an investment in which the Fund owns at least 5% of the outstanding voting shares of the issuer or as a result of other relationships, such as the Fund and the issuer having the same investment manager. Transactions with issuers that were either affiliated persons of the Fund at the beginning of the period or the end of the period were as follows:
Shares, beginning of
period Shares
purchased Shares
sold
Shares, end of period
Net realized
gains (losses)
Net change in
unrealized gains
(losses)
Income from
affiliated securities
Value, end of period
% of net
assets
Short-Term Investments Investment Companies
Wells Fargo Municipal Cash Management Money Market Fund Institutional Class 9,941,476 560,118,071 (566,056,636) 4,002,911 $(3,299) $0 $106,143 $4,004,512 0.11%
The accompanying notes are an integral part of these financial statements.
Wells Fargo Short-Term Municipal Bond Fund | 35

Statement of assets and liabilities—December 31, 2019 (unaudited)
Assets Investments in unaffiliated securities, at value (cost $3,627,728,778) . . . . . . . . . . . . . . . . . . . . . . . . . . . . . . . . . . . . . . . . . . . . . . . . . .
. . . . . . . . . . . . . . . . . . . . . . . . . . . . . . . . . . . . . . . . . . . . . . . . . . . . . . . . . . . . . . . . . . . . . . . . . . . . . . . . . . . . . . . . . . . . . . . . . . . . . . . . . . . . . . . . . . . . . . . . . . . . . . . . . . . . . . . . . . . . . . . . . . . . . . . . . . . . . . . . . . . . . .
. . . . . . . . . . . . . . . . . . . . . . . . . . . . . . . . . . . . . . . . . . . . . . . . . . . . . . . . . . . . . . . . . . . . . . . . . . . . . . . . . . . . . . . . . . . . . . . . . . . . . . . . . . . . . . . . . . . . . . . . . . . . . . . . . . . . . . . . . . . . . . . . . . . . . . . . . . . . . . . . . . . . . . . . .
. . . . . . . . . . . . . . . . . . . . . . . . . . . . . . . . . . . . . . . . . . . . . . . . . . . . . . . . . . . . . . . . . . . . . . . . . . . . . . . . . . . . . . . . . . . . .
. . . . . . . . . . . . . . . . . . . . . . . . . . . . . . . . . . . . . . . . . . . . . . . . . . . . . . . . . . . . . . . . . . . . . . . . . . . . . . . . . . . . . . . . . . . . . . . . . . . . . . . .
. . . . . . . . . . . . . . . . . . . . . . . . . . . . . . . . . . . . . . . . . . . . . . . . . . . . . . . . . . . . . . . . . . . . . . . . . . . . . . . . . . . . . . . . . . . . . . . . . . . . . . . . . . . . . . . . . . . . . . . . . . . . . . . . . . . . . . . . . . . . . . . . . . . . . . . . . . . . . . . . . . .
. . . . . . . . . . . . . . . . . . . . . . . . . . . . . . . . . . . . . . . . . . . . . . . . . . . . . . . . . . . . . . . . . . . . . . . . . . . . . . . . . . . . . . . . . . . . . . . . . . . . . . . . . . . . . . . . . . . . . . . . . . . . . . . . . . . . . . . . . . . . . . . . . . . . . . . . . . . . . . . . . . . . . . . . . . . . . . . . . . . . . . . . . . .
. . . . . . . . . . . . . . . . . . . . . . . . . . . . . . . . . . . . . . . . . . . . . . . . . . . . . . . . . . . . . . . . . . . . . . . . . . . . . . . . . . . . . . . . . . . . . . . . . . . . . . . . . . . . . . . . . . . . . . . . . . . . . . . . . . . . . . . . . . . . . . . . . . . . . . . . . . . . . . . . . . . . . . . . . . . . . . . . . . .
. . . . . . . . . . . . . . . . . . . . . . . . . . . . . . . . . . . . . . . . . . . . . . . . . . . . . . . . . . . . . . . . . . . . . . . . . . . . . . . . . . . . . . . . . . . . . . . . . . . . . . . . . . . . . . . . . . . . . . . . . . . . . . . . . . . . . . . . . . . . . . . . . . . . . . . . . . . . . . .
. . . . . . . . . . . . . . . . . . . . . . . . . . . . . . . . . . . . . . . . . . . . . . . . . . . . . . . . . . . . . . . . . . . . . . . . . . . . . . . . . . . . . . . . . . . . . . . . . . . . .
. . . . . . . . . . . . . . . . . . . . . . . . . . . . . . . . . . . . . . . . . . . . . . . . . . . . . . . . . . . . . . . . . . . . . . . . . . . . . . . . . . . . . . . . . . . . . . . . . . . .
. . . . . . . . . . . . . . . . . . . . . . . . . . . . . . . . . . . . . . . . . . . . . . . . . . . . . . . . . . . . . . . . . . . . . . . . . . . . . . . . . . . . . . . . . . . . . . . . . . . . . . . . . . . . . . . . . . . . . . . . . . . . . . . . . . . . . . . . . . . . . . . . . . . . . . . . . . . . . . . . . . . . . . . . . . . . . . . . . . . . . . . . . . . . . . . . .
. . . . . . . . . . . . . . . . . . . . . . . . . . . . . . . . . . . . . . . . . . . . . . . . . . . . . . . . . . . . . . . . . . . . . . . . . . . . . . . . . . . . . . . . . . . . . . . . . . . .
. . . . . . . . . . . . . . . . . . . . . . . . . . . . . . . . . . . . . . . . . . . . . . . . . . . . . . . . . . . . . . . . . . . . . . . . . . . . . . . . . . . . . . . . . . . . . . . . . . . . . . . . . . . . . . . . . . . . . . . . . . . . . . . . . . . . . . . . . . . . . . . . . . . . . . . . . . . . . . . . . . . . . . . . . . . . . . . . . . . . .
. . . . . . . . . . . . . . . . . . . . . . . . . . . . . . . . . . . . . . . . . . . . . . . . . . . . . . . . . . . . . . . . . . . . . . . . . . . . . . . . . . . . . . . . . . . . . . . . . . . . . . . . . . . . . . . . . . . . . . . . . . . . . . . . . . . . . . . . . . . . . . . . . . . . . . . . . . .
. . . . . . . . . . . . . . . . . . . . . . . . . . . . . . . . . . . . . . . . . . . . . . . . . . . . . . . . . . . . . . . . . . . . . . . . . . . . . . . . . . . . . . . . . . . . . . . . . . . . . . . . . . . . . . . . . . . . . . . . . . . . . . . . . . . . . . . . . . . . . . . . . . . . . . . . . . . . . . . . . . . . . . . . . . . . . . . . . . . . .
. . . . . . . . . . . . . . . . . . . . . . . . . . . . . . . . . . . . . . . . . . . . . . . . . . . . . . . . . . . . . . . . . . . . . . . . . . . . . . . . . . . . . . . . . . . . . . . . . . . . . . . . . . . . . . . . . . . . . . . . . . . . . . . . . . . . . . . . . . . . . . . . . . . . . . . . . . . . . . . . . . . . . . . . . . . . . . . .
. . . . . . . . . . . . . . . . . . . . . . . . . . . . . . . . . . . . . . . . . . . . . . . . . . . . . . . . . . . . . . . . . . . . . . . . . . . . . . . . . . . . . . . . . . . . . . . . . . . . . . . . . . . . . . . . . . . . . . . . . . . . . . . . . . . . . . . . . . . . . . . . . . . . . . . . . . . . . . . . . . . . . .
. . . . . . . . . . . . . . . . . . . . . . . . . . . . . . . . . . . . . . . . . . . . . . . . . . . . . . . . . . . . . . . . . . . . . . . . . . . . . . . . . . . . . . . . . . . . . . . . . . . . . . . . . . . . . . . . . . . . . . . . . . . . . . . . . . . . . . . . . . . . . . . . . . . . . . . . . . . . . . .
. . . . . . . . . . . . . . . . . . . . . . . . . . . . . . . . . . . . . . . . . . . . . . . . . . . . . . . . . . . . . . . . . . . . . . . . . . . . . . . . . . . . . . . . . . . . . . . . . . . . . . . . . . . . . . . . . . . . . . . . . . . . . . . . . . . . . . . . . . . . . . . . . . . . . . . . . . .
. . . . . . . . . . . . . . . . . . . . . . . . . . . . . . . . . . . . . . . . . . . . . . . . . . . . . . . . . . . . . . . . . . . . . . . . . . . . . . . . . . . . . . . . . . . . . . . . . . . . . . . . . . . . . . . . . . . . . . . . . . . . . . . . . . . . . . . . . . . . . . . . . . . .
$ 3,668,959,720 Investments in affiliated securities, at value (cost $4,004,512) 4,004,512 Cash 28,483,969 Receivable for investments sold 3,296,969 Receivable for Fund shares sold 15,816,038 Receivable for interest 27,532,442
Total assets 3,748,093,650
Liabilities Payable for investments purchased 18,050,986 Payable for Fund shares redeemed 19,596,613 Management fee payable 904,955 Dividends payable 1,019,908 Administration fees payable 295,118 Distribution fee payable 15,465 Trustees’ fees and expenses payable 4,157 Accrued expenses and other liabilities 871,573
Total liabilities 40,758,775
Total net assets $ 3,707,334,875
Net assets consist of Paid-in capital $ 3,711,299,925 Total distributable loss (3,965,050)
Total net assets $ 3,707,334,875
Computation of net asset value and offering price per share Net assets – Class A $ 886,565,301 Shares outstanding – Class A1 89,270,983 Net asset value per share – Class A $9.93 Maximum offering price per share – Class A2 $10.13 Net assets – Class C $ 23,505,454 Shares outstanding – Class C1 2,366,434 Net asset value per share – Class C $9.93 Net assets – Class R6 $ 664,860,252 Shares outstanding – Class R61 66,819,168 Net asset value per share – Class R6 $9.95 Net assets – Administrator Class $ 30,582,876 Shares outstanding – Administrator Class1 3,077,630 Net asset value per share – Administrator Class $9.94 Net assets – Institutional Class $ 2,101,820,992 Shares outstanding – Institutional Class1 211,257,905 Net asset value per share – Institutional Class $9.95
1 The Fund has an unlimited number of authorized shares. 2 Maximum offering price is computed as 100/98 of net asset value. On investments of $50,000 or more, the offering price is reduced.
The accompanying notes are an integral part of these financial statements.
36 | Wells Fargo Short-Term Municipal Bond Fund

Statement of operations—six months ended December 31, 2019 (unaudited)
Investment income Interest . . . . . . . . . . . . . . . . . . . . . . . . . . . . . . . . . . . . . . . . . . . . . . . . . . . . . . . . . . . . . . . . . . . . . . . . . . . . . . . . . . . . . . . . . . . . . . . . . . . . . . . . . . . . .
. . . . . . . . . . . . . . . . . . . . . . . . . . . . . . . . . . . . . . . . . . . . . . . . . . . . . . . . . . . . . . . . . . . . . . . . . . . . . . . . . . . . . . .
. . . . . . . . . . . . . . . . . . . . . . . . . . . . . . . . . . . . . . . . . . . . . . . . . . . . . . . . . . . . . . . . . . . . . . . . . . . . . . . . . . . . . . . . . . . . . .
. . . . . . . . . . . . . . . . . . . . . . . . . . . . . . . . . . . . . . . . . . . . . . . . . . . . . . . . . . . . . . . . . . . . . . . . . . . . . . . . . . . . . . . . . . . . . . . . . . . . .
. . . . . . . . . . . . . . . . . . . . . . . . . . . . . . . . . . . . . . . . . . . . . . . . . . . . . . . . . . . . . . . . . . . . . . . . . . . . . . . . . . . . . . . . . . . . . . . . . . . . . . . . . . . . .
. . . . . . . . . . . . . . . . . . . . . . . . . . . . . . . . . . . . . . . . . . . . . . . . . . . . . . . . . . . . . . . . . . . . . . . . . . . . . . . . . . . . . . . . . . . . . . . . . . . . . . . . . . . . . . . . . . . . . . . . . . . . . . . . . . . . . . . . . . . . . . . . . . . . . . . . . . . . . . . . . . . . . . . . . . . . . . . . . . . . . . . . . . . . . . . . . . . . . . . . . . . . . . . . . . . . . . . .
. . . . . . . . . . . . . . . . . . . . . . . . . . . . . . . . . . . . . . . . . . . . . . . . . . . . . . . . . . . . . . . . . . . . . . . . . . . . . . . . . . . . . . . . . . . . . . . . . . . . . . . . . . . . . . . . . . . . . . . . . . . . . . . . . . . . . . . . . . . . . . . . . . . . . . . . . . . . . . . . . . . . . . . . . . . . . . . . . . . . . . . . . . . . . . . . . . . .
. . . . . . . . . . . . . . . . . . . . . . . . . . . . . . . . . . . . . . . . . . . . . . . . . . . . . . . . . . . . . . . . . . . . . . . . . . . . . . . . . . . . . . . . . . . . . . . . . . . . . . . . . . . . .
. . . . . . . . . . . . . . . . . . . . . . . . . . . . . . . . . . . . . . . . . . . . . . . . . . . . . . . . . . . . . . . . . . . . . . . . . . . . . . . . . . . . . . . . . . . . . . . . . . . . . . . . . . . . . . . . . . . . . . . . . . . . . . . . . . . . . . . . . . . . . . . . . . . . . . . . . . . . . . . . . . . . . . . . . . . . . . . . . . . . . . . . . . . . . . . . . . . . . . . . . . . . . .
. . . . . . . . . . . . . . . . . . . . . . . . . . . . . . . . . . . . . . . . . . . . . . . . . . . . . . . . . . . . . . . . . . . . . . . . . . . . . . . . . . . . . . . . . . . . . . . . . . . . . . . . . . . . . . . . . . . . . . . . . . . . . . . . . . . . . . . . . . . . . . . . . . . . . . . . . . . . . . . . . . . . . . . . . . . . . . . . . . . . . . . . . . . . . . . . . . . . . . .
. . . . . . . . . . . . . . . . . . . . . . . . . . . . . . . . . . . . . . . . . . . . . . . . . . . . . . . . . . . . . . . . . . . . . . . . . . . . . . . . . . . . . . . . . . . . . . . . . . . . .
. . . . . . . . . . . . . . . . . . . . . . . . . . . . . . . . . . . . . . . . . . . . . . . . . . . . . . . . . . . . . . . . . . . . . . . . . . . . . . . . . . . . . . . . . . . . . . . . . . . . . . . . . . . . . . . . . . . . . . . . . . . . . . . . . . . . . . . . . . . . . . . . . . . . . . . . . . . . . . . . . . . . . . . . . . . . . . . . . . . . . . . . . . . . . . .
. . . . . . . . . . . . . . . . . . . . . . . . . . . . . . . . . . . . . . . . . . . . . . . . . . . . . . . . . . . . . . . . . . . . . . . . . . . . . . . . . . . . . . . . . . . . . . . . . . . . . . . . . . . . . . . . . . . . . . . . . . . . . . . . . . . . . . . . . . . . . . . . . . . . . . . . . . . . . . . . . . . . . . . . . . . . . . . . . . . . . . . . .
. . . . . . . . . . . . . . . . . . . . . . . . . . . . . . . . . . . . . . . . . . . . . . . . . . . . . . . . . . . . . . . . . . . . . . . . . . . . . . . . . . . . . . . . . . . . . . . . . . . . . . . .
. . . . . . . . . . . . . . . . . . . . . . . . . . . . . . . . . . . . . . . . . . . . . . . . . . . . . . . . . . . . . . . . . . . . . . . . . . . . . . . . . . . . . . . . . . . . . . . . . . . . . . . . . . . . . . . . . . . . . . . . . . . . . . . . . . . . . . . . . . . . . . . . . . . . . . . . . . . . . . . . . . . . . . . . . . . . . . . . . . . . . . . . . . . . . . . . . . . . . . . . . . . . . . . . . . . . . . . . . . . . . . . . . . . . . . . . . . . . . . . . . . . . . . . . . . . . . . . . . . . . . . . . . . . . . . . . . . . . . . . . . . . . . . . . . . . . . . . . . . . . . . . . . . . . . . . . . . . . . . . . . . .
. . . . . . . . . . . . . . . . . . . . . . . . . . . . . . . . . . . . . . . . . . . . . . . . . . . . . . . . . . . . . . . . . . . . . . . . . . . . . . . . . . . . . . . . . . . . . . . . .
. . . . . . . . . . . . . . . . . . . . . . . . . . . . . . . . . . . . . . . . . . . . . . . . . . . . . . . . . . . . . . . . . . . . . . . . . . . . . . . . . . . . . . . . . . . . . . . . . . . . . . . . .
. . . . . . . . . . . . . . . . . . . . . . . . . . . . . . . . . . . . . . . . . . . . . . . . . . . . . . . . . . . . . . . . . . . . . . . . . . . . . . . . . . . . . . . . . . . . . . . .
. . . . . . . . . . . . . . . . . . . . . . . . . . . . . . . . . . . . . . . . . . . . . . . . . . . . . . . . . . . . . . . . . . . . . . . . . . . . . . . . . . . . . . . . . . . . . . . . . . . . . . . . . . . . . . . . . . . . . . . . . . . . . . . . . . . . . . . . . . . . . . . . . . . . . . . . . . . . . . . . . . . . . . . . . . . . . . . . . . . . . . . . . . . . . . . . . . . .
. . . . . . . . . . . . . . . . . . . . . . . . . . . . . . . . . . . . . . . . . . . . . . . . . . . . . . . . . . . . . . . . . . . . . . . . . . . . . . . . . . . . . . . . . . . . . . . . . . . . . . . . . . . . . . . . . . . . . . . . . . . . . . . . . . . . . . . . . . . . . . . . . . . . . . . . . .
. . . . . . . . . . . . . . . . . . . . . . . . . . . . . . . . . . . . . . . . . . . . . . . . . . . . . . . . . . . . . . . .
. . . . . . . . . . . . . . . . . . . . . . . . . . . . . . . . . . . . . . . . . . . . . . . . . . . . . . . . . . . . . . . . . . . . .
$ 42,710,303 Income from affiliated securities 106,143
Total investment income 42,816,446
Expenses Management fee 6,468,234 Administration fees
Class A 757,516 Class C 22,752
Class R6 111,543 Administrator Class 16,478 Institutional Class 860,311
Shareholder servicing fees Class A 1,183,618 Class C 35,549 Administrator Class 41,196
Distribution fee Class C 106,579
Custody and accounting fees 74,353 Professional fees 25,826 Registration fees 105,757 Shareholder report expenses 19,510 Trustees’ fees and expenses 10,804 Other fees and expenses 25,711
Total expenses 9,865,737 Less: Fee waivers and/or expense reimbursements
Fund-level (609,252) Class A (358,018) Class C (10,614) Administrator Class (7,490)
Net expenses 8,880,363
Net investment income 33,936,083
Realized and unrealized gains (losses) on investments Net realized losses on
Unaffiliated securities (785,086) Affiliated securities (3,299)
Net realized losses on investments (788,385) Net change in unrealized gains (losses) on investments 5,217,850
Net realized and unrealized gains (losses) on investments 4,429,465
Net increase in net assets resulting from operations $38,365,548
The accompanying notes are an integral part of these financial statements.
Wells Fargo Short-Term Municipal Bond Fund | 37
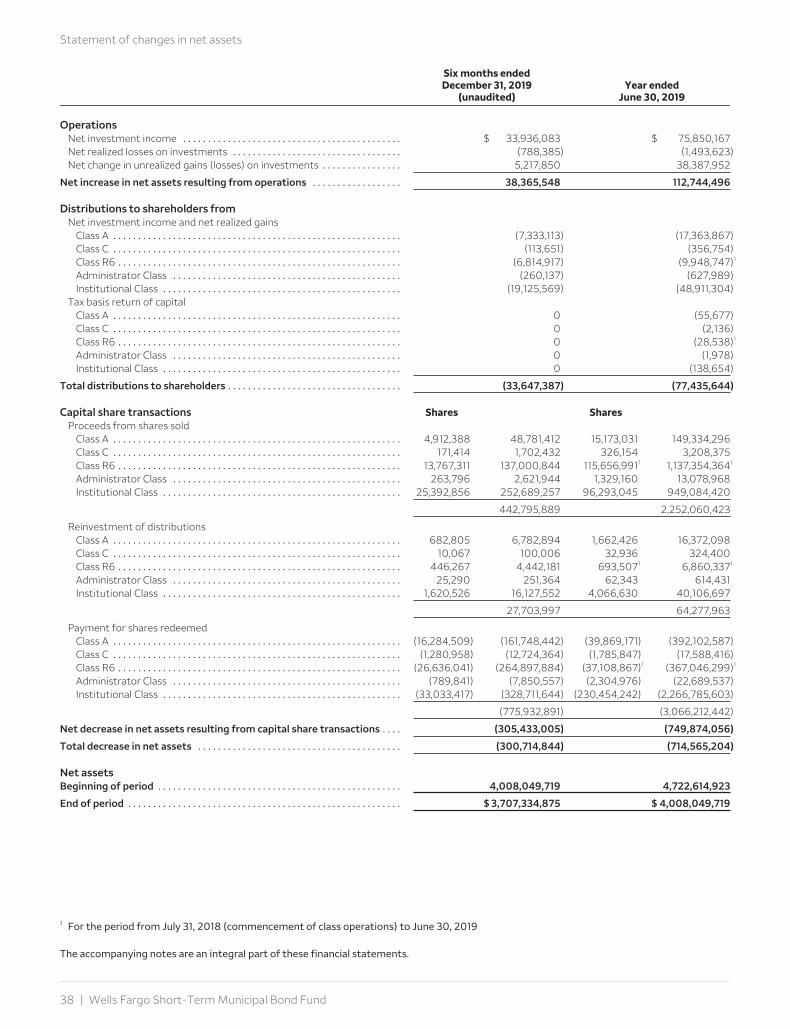
Statement of changes in net assets
Six months ended December 31, 2019
(unaudited) Year ended
June 30, 2019
Operations Net investment income . . . . . . . . . . . . . . . . . . . . . . . . . . . . . . . . . . . . . . . . . . . . $ 33,936,083 $ 75,850,167 Net realized losses on investments . . . . . . . . . . . . . . . . . . . . . . . . . . . . . . . . . .
. . . . . . . . . . . . . . . .
. . . . . . . . . . . . . . . . . .
. . . . . . . . . . . . . . . . . . . . . . . . . . . . . . . . . . . . . . . . . . . . . . . . . . . . . . . . . .
. . . . . . . . . . . . . . . . . . . . . . . . . . . . . . . . . . . . . . . . . . . . . . . . . . . . . . . . . .. . . . . . . . . . . . . . . . . . . . . . . . . . . . . . . . . . . . . . . . . . . . . . . . . . . . . . . . .
. . . . . . . . . . . . . . . . . . . . . . . . . . . . . . . . . . . . . . . . . . . . . .. . . . . . . . . . . . . . . . . . . . . . . . . . . . . . . . . . . . . . . . . . . . . . . .
. . . . . . . . . . . . . . . . . . . . . . . . . . . . . . . . . . .
(788,385) (1,493,623) Net change in unrealized gains (losses) on investments 5,217,850 38,387,952
Net increase in net assets resulting from operations 38,365,548 112,744,496
Distributions to shareholders from Net investment income and net realized gains
Class A (7,333,113) (17,363,867) Class C (113,651) (356,754) Class R6 (6,814,917) (9,948,747)1
Administrator Class (260,137) (627,989) Institutional Class (19,125,569) (48,911,304)
Tax basis return of capital Class A 0 (55,677) Class C 0 (2,136) Class R6 0 (28,538)1 Administrator Class 0 (1,978) Institutional Class 0 (138,654)
Total distributions to shareholders (33,647,387) (77,435,644)
Capital share transactions Shares Shares Proceeds from shares sold
Class A . . . . . . . . . . . . . . . . . . . . . . . . . . . . . . . . . . . . . . . . . . . . . . . . . . . . . . . . . . . . . . . . . . . . . . . . . . . . . . . . . . . . . . . . . . . . . . . . . . . . . . . . . . . . . . . . . . . .
. . . . . . . . . . . . . . . . . . . . . . . . . . . . . . . . . . . . . . . . . . . . . . . . . . . . . . . . . . . . . . . . . . . . . . . . . . . . . . . . . . . . . . . . . . . . . . . . . . . . . . .
. . . . . . . . . . . . . . . . . . . . . . . . . . . . . . . . . . . . . . . . . . . . . . . .
. . . . . . . . . . . . . . . . . . . . . . . . . . . . . . . . . . . . . . . . . . . . . . . . . . . . . . . . . .
. . . . . . . . . . . . . . . . . . . . . . . . . . . . . . . . . . . . . . . . . . . . . . . . . . . . . . . . . . . . . . . . . . . . . . . . . . . . . . . . . . . . . . . . . . . . . . . . . . . . . . . . . . . . . . . . . . .
. . . . . . . . . . . . . . . . . . . . . . . . . . . . . . . . . . . . . . . . . . . . . . . . . . . . . . . . . . . . . . . . . . . . . . . . . . . . . . . . . . . . . . . . . . . . . .
4,912,388 48,781,412 15,173,031 149,334,296 Class C 171,414 1,702,432 326,154 3,208,375 Class R6 13,767,311 137,000,844 115,656,9911 1,137,354,3641
Administrator Class 263,796 2,621,944 1,329,160 13,078,968 Institutional Class 25,392,856 252,689,257 96,293,045 949,084,420
442,795,889 2,252,060,423
Reinvestment of distributions Class A 682,805 6,782,894 1,662,426 16,372,098 Class C 10,067 100,006 32,936 324,400 Class R6 446,267 4,442,181 693,5071 6,860,3371
Administrator Class 25,290 251,364 62,343 614,431 Institutional Class 1,620,526 16,127,552 4,066,630 40,106,697
27,703,997 64,277,963
Payment for shares redeemed Class A (16,284,509) (161,748,442) (39,869,171) (392,102,587) Class C (1,280,958) (12,724,364) (1,785,847) (17,588,416) Class R6 (26,636,041) (264,897,884) (37,108,867)1 (367,046,299)1
Administrator Class (789,841) (7,850,557) (2,304,976) (22,689,537) Institutional Class (33,033,417) (328,711,644) (230,454,242) (2,266,785,603)
(775,932,891) (3,066,212,442)
Net decrease in net assets resulting from capital share transactions (305,433,005) (749,874,056)
Total decrease in net assets . . . . . . . . . . . . . . . . . . . . . . . . . . . . . . . . . . . . . . . . .
. . . .
. . . . . . . . . . . . . . . . . . . . . . . . . . . . . . . . . . . . . . . . . . . . . . . . .
. . . . . . . . . . . . . . . . . . . . . . . . . . . . . . . . . . . . . . . . . . . . . . . . . . . . . . .
(300,714,844) (714,565,204)
Net assets Beginning of period 4,008,049,719 4,722,614,923
End of period $ 3,707,334,875 $ 4,008,049,719
1 For the period from July 31, 2018 (commencement of class operations) to June 30, 2019
The accompanying notes are an integral part of these financial statements.
38 | Wells Fargo Short-Term Municipal Bond Fund

Financial highlights
(For a share outstanding throughout each period)
CLASS A
Six months ended December 31, 2019
(unaudited)
Year ended June 30
2019 2018 2017 2016 2015
Net asset value, beginning of period $9.92 $9.83 $9.85 $9.96 $9.93 $10.00
Net investment income 0.08 0.15 0.13 0.12 0.11 0.09 Net realized and unrealized gains (losses) on investments 0.01 0.10 (0.02) (0.11) 0.04 (0.06)
Total from investment operations 0.09 0.25 0.11 0.01 0.15 0.03
Distributions to shareholders from Net investment income (0.08) (0.16) (0.13) (0.12) (0.11) (0.09) Net realized gains 0.00 0.00 0.00 0.00 (0.01) (0.01) Tax basis return of capital 0.00 (0.00)1 0.00 0.00 (0.00) 0.00
Total distributions to shareholders (0.08) (0.16) (0.13) (0.12) (0.12) (0.10)
Net asset value, end of period $9.93 $9.92 $9.83 $9.85 $9.96 $9.93
Total return2 0.88% 2.57% 1.15% 0.14% 1.49% 0.27%
Ratios to average net assets (annualized) Gross expenses 0.75% 0.76% 0.77% 0.76% 0.75% 0.75% Net expenses 0.63% 0.63% 0.63% 0.63% 0.62% 0.60% Net investment income 1.56% 1.59% 1.34% 1.23% 1.11% 0.89%
Supplemental data Portfolio turnover rate 13% 33% 31% 23% 16% 24% Net assets, end of period (000s omitted) $886,565 $991,514 $1,209,079 $1,619,974 $3,362,147 $2,228,977
1 Amount is less than $0.005. 2 Total return calculations do not include any sales charges. Returns for periods of less than one year are not annualized.
The accompanying notes are an integral part of these financial statements.
Wells Fargo Short-Term Municipal Bond Fund | 39

Financial highlights
(For a share outstanding throughout each period)
CLASS C
Six months ended December 31, 2019
(unaudited)
Year ended June 30
2019 2018 2017 2016 2015
Net asset value, beginning of period $9.92 $9.83 $9.85 $9.96 $9.93 $10.00
Net investment income 0.04 0.08 0.06 0.05 0.04 0.01 Net realized and unrealized gains (losses) on investments 0.01 0.10 (0.02) (0.11) 0.04 (0.06)
Total from investment operations 0.05 0.18 0.04 (0.06) 0.08 (0.05)
Distributions to shareholders from Net investment income (0.04) (0.09) (0.06) (0.05) (0.04) (0.01) Net realized gains 0.00 0.00 0.00 0.00 (0.01) (0.01) Tax basis return of capital 0.00 (0.00)1 0.00 0.00 0.00 0.00
Total distributions to shareholders (0.04) (0.09) (0.06) (0.05) (0.05) (0.02)
Net asset value, end of period $9.93 $9.92 $9.83 $9.85 $9.96 $9.93
Total return2 0.50% 1.81% 0.40% (0.61)% 0.73% (0.48)%
Ratios to average net assets (annualized) Gross expenses 1.50% 1.51% 1.52% 1.51% 1.50% 1.50% Net expenses 1.38% 1.38% 1.38% 1.38% 1.37% 1.35% Net investment income 0.82% 0.84% 0.59% 0.49% 0.35% 0.14%
Supplemental data Portfolio turnover rate 13% 33% 31% 23% 16% 24% Net assets, end of period (000s omitted) $23,505 $34,381 $48,101 $62,796 $82,111 $103,146
1 Amount is less than $0.005. 2 Total return calculations do not include any sales charges. Returns for periods of less than one year are not annualized.
The accompanying notes are an integral part of these financial statements.
40 | Wells Fargo Short-Term Municipal Bond Fund
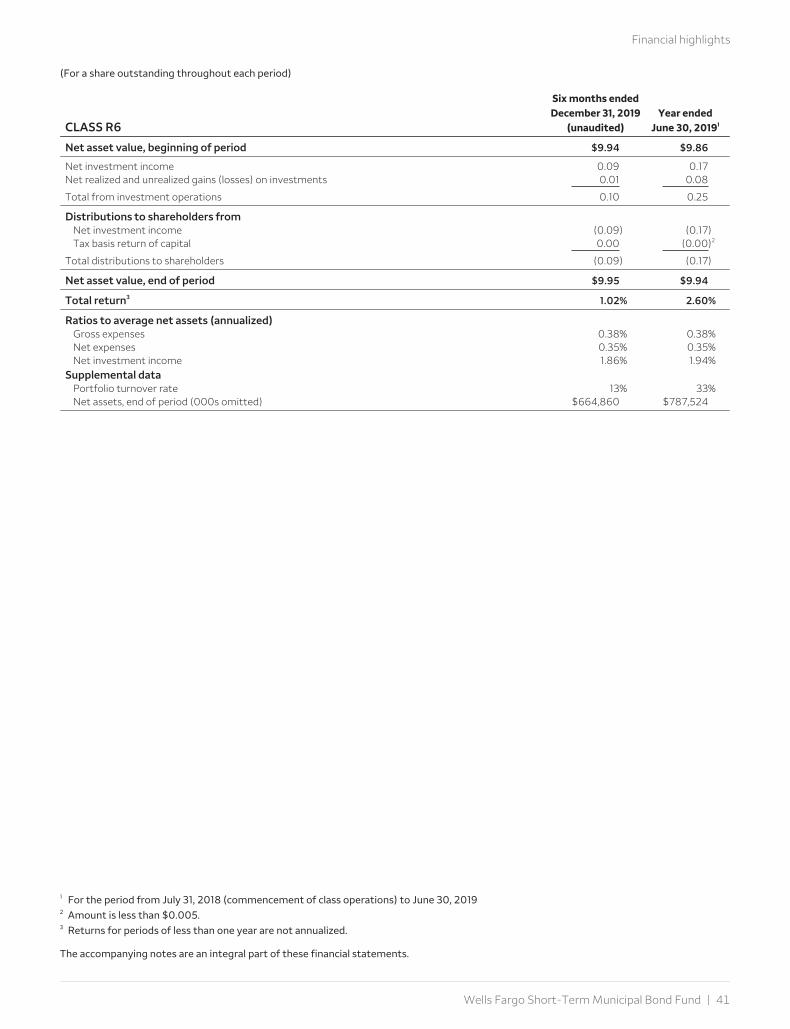
Financial highlights
(For a share outstanding throughout each period)
CLASS R6
Six months ended December 31, 2019
(unaudited) Year ended
June 30, 20191
Net asset value, beginning of period $9.94 $9.86
Net investment income 0.09 0.17 Net realized and unrealized gains (losses) on investments 0.01 0.08
Total from investment operations 0.10 0.25
Distributions to shareholders from Net investment income (0.09) (0.17)Tax basis return of capital 0.00
(0.00)2
Total distributions to shareholders (0.09) (0.17)
Net asset value, end of period $9.95 $9.94
Total return3 1.02% 2.60%
Ratios to average net assets (annualized) Gross expenses 0.38% 0.38%Net expenses 0.35% 0.35%Net investment income 1.86% 1.94%
Supplemental data Portfolio turnover rate 13% 33%Net assets, end of period (000s omitted) $664,860
$787,524
1 For the period from July 31, 2018 (commencement of class operations) to June 30, 2019 2 Amount is less than $0.005. 3 Returns for periods of less than one year are not annualized.
The accompanying notes are an integral part of these financial statements.
Wells Fargo Short-Term Municipal Bond Fund | 41

Financial highlights
(For a share outstanding throughout each period)
ADMINISTRATOR CLASS
Six months ended December 31, 2019
(unaudited)
Year ended June 30
2019 2018 2017 2016 2015
Net asset value, beginning of period $9.93 $9.84 $9.86 $9.97 $9.95 $10.03
Net investment income 0.08 0.16 0.14 0.13 0.111 0.09 Net realized and unrealized gains (losses) on investments 0.01 0.09 (0.02) (0.11) 0.03 (0.07)
Total from investment operations 0.09 0.25 0.12 0.02 0.14 0.02
Distributions to shareholders from Net investment income (0.08) (0.16) (0.14) (0.13) (0.11) (0.09) Net realized gains 0.00 0.00 0.00 0.00 (0.01) (0.01) Tax basis return of capital 0.00 (0.00)2 0.00 0.00 0.00 0.00
Total distributions to shareholders (0.08) (0.16) (0.14) (0.13) (0.12) (0.10)
Net asset value, end of period $9.94 $9.93 $9.84 $9.86 $9.97 $9.95
Total return 0.90% 2.60% 1.18% 0.17% 1.42% 0.17%
Ratios to average net assets (annualized) Gross expenses 0.69% 0.70% 0.71% 0.70% 0.66% 0.68% Net expenses 0.60% 0.60% 0.60% 0.60% 0.59% 0.60% Net investment income 1.60% 1.62% 1.36% 1.27% 1.08% 0.89%
Supplemental data Portfolio turnover rate 13% 33% 31% 23% 16% 24% Net assets, end of period (000s omitted) $30,583 $35,517 $44,186 $68,621 $95,121 $511,894
1 Calculated based upon average shares outstanding 2 Amount is less than $0.005. 3 Returns for periods of less than one year are not annualized.
The accompanying notes are an integral part of these financial statements.
42 | Wells Fargo Short-Term Municipal Bond Fund

Financial highlights
(For a share outstanding throughout each period)
INSTITUTIONAL CLASS
Six months ended December 31, 2019
(unaudited)
Year ended June 30
2019 2018 2017 2016 2015
Net asset value, beginning of period $9.94 $9.85 $9.87 $9.98 $9.95 $10.02
Net investment income 0.09 0.18 0.16 0.15 0.13 0.11 Net realized and unrealized gains (losses) on investments 0.01 0.09 (0.02) (0.11) 0.04 (0.06)
Total from investment operations 0.10 0.27 0.14 0.04 0.17 0.05
Distributions to shareholders from Net investment income (0.09) (0.18) (0.16) (0.15) (0.13) (0.11) Net realized gains 0.00 0.00 0.00 0.00 (0.01) (0.01) Tax basis return of capital 0.00 (0.00)1 0.00 0.00 0.00 0.00
Total distributions to shareholders (0.09) (0.18) (0.16) (0.15) (0.14) (0.12)
Net asset value, end of period $9.95 $9.94 $9.85 $9.87 $9.98 $9.95
Total return2 1.00% 2.81% 1.39% 0.37% 1.71% 0.47%
Ratios to average net assets (annualized) Gross expenses 0.42% 0.43% 0.44% 0.43% 0.42% 0.42% Net expenses 0.40% 0.40% 0.40% 0.40% 0.40% 0.40% Net investment income 1.79% 1.80% 1.58% 1.48% 1.33% 1.09%
Supplemental data Portfolio turnover rate 13% 33% 31% 23% 16% 24% Net assets, end of period (000s omitted) $2,101,821 $2,159,113 $3,421,249 $3,427,060 $2,261,092 $1,895,713
1 Amount is less than $0.005. 2 Returns for periods of less than one year are not annualized.
The accompanying notes are an integral part of these financial statements.
Wells Fargo Short-Term Municipal Bond Fund | 43
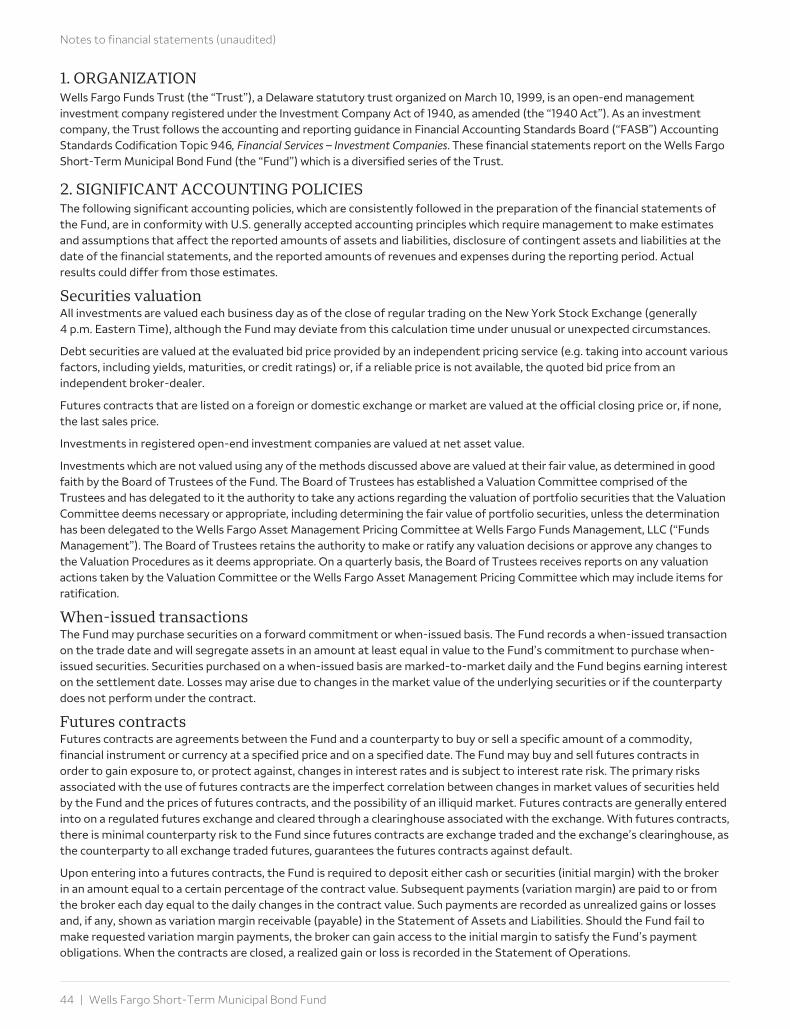
Notes to financial statements (unaudited)
1. ORGANIZATION Wells Fargo Funds Trust (the “Trust”), a Delaware statutory trust organized on March 10, 1999, is an open-end management investment company registered under the Investment Company Act of 1940, as amended (the “1940 Act”). As an investment company, the Trust follows the accounting and reporting guidance in Financial Accounting Standards Board (“FASB”) Accounting Standards Codification Topic 946, Financial Services – Investment Companies. These financial statements report on the Wells Fargo Short-Term Municipal Bond Fund (the “Fund”) which is a diversified series of the Trust.
2. SIGNIFICANT ACCOUNTING POLICIES The following significant accounting policies, which are consistently followed in the preparation of the financial statements of the Fund, are in conformity with U.S. generally accepted accounting principles which require management to make estimates and assumptions that affect the reported amounts of assets and liabilities, disclosure of contingent assets and liabilities at the date of the financial statements, and the reported amounts of revenues and expenses during the reporting period. Actual results could differ from those estimates.
Securities valuation All investments are valued each business day as of the close of regular trading on the New York Stock Exchange (generally 4 p.m. Eastern Time), although the Fund may deviate from this calculation time under unusual or unexpected circumstances.
Debt securities are valued at the evaluated bid price provided by an independent pricing service (e.g. taking into account various factors, including yields, maturities, or credit ratings) or, if a reliable price is not available, the quoted bid price from an independent broker-dealer.
Futures contracts that are listed on a foreign or domestic exchange or market are valued at the official closing price or, if none, the last sales price.
Investments in registered open-end investment companies are valued at net asset value.
Investments which are not valued using any of the methods discussed above are valued at their fair value, as determined in good faith by the Board of Trustees of the Fund. The Board of Trustees has established a Valuation Committee comprised of the Trustees and has delegated to it the authority to take any actions regarding the valuation of portfolio securities that the Valuation Committee deems necessary or appropriate, including determining the fair value of portfolio securities, unless the determination has been delegated to the Wells Fargo Asset Management Pricing Committee at Wells Fargo Funds Management, LLC (“Funds Management”). The Board of Trustees retains the authority to make or ratify any valuation decisions or approve any changes to the Valuation Procedures as it deems appropriate. On a quarterly basis, the Board of Trustees receives reports on any valuation actions taken by the Valuation Committee or the Wells Fargo Asset Management Pricing Committee which may include items for ratification.
When-issued transactions The Fund may purchase securities on a forward commitment or when-issued basis. The Fund records a when-issued transaction on the trade date and will segregate assets in an amount at least equal in value to the Fund’s commitment to purchase when-issued securities. Securities purchased on a when-issued basis are marked-to-market daily and the Fund begins earning interest on the settlement date. Losses may arise due to changes in the market value of the underlying securities or if the counterparty does not perform under the contract.
Futures contracts Futures contracts are agreements between the Fund and a counterparty to buy or sell a specific amount of a commodity, financial instrument or currency at a specified price and on a specified date. The Fund may buy and sell futures contracts in order to gain exposure to, or protect against, changes in interest rates and is subject to interest rate risk. The primary risks associated with the use of futures contracts are the imperfect correlation between changes in market values of securities held by the Fund and the prices of futures contracts, and the possibility of an illiquid market. Futures contracts are generally entered into on a regulated futures exchange and cleared through a clearinghouse associated with the exchange. With futures contracts, there is minimal counterparty risk to the Fund since futures contracts are exchange traded and the exchange’s clearinghouse, as the counterparty to all exchange traded futures, guarantees the futures contracts against default.
Upon entering into a futures contracts, the Fund is required to deposit either cash or securities (initial margin) with the broker in an amount equal to a certain percentage of the contract value. Subsequent payments (variation margin) are paid to or from the broker each day equal to the daily changes in the contract value. Such payments are recorded as unrealized gains or losses and, if any, shown as variation margin receivable (payable) in the Statement of Assets and Liabilities. Should the Fund fail to make requested variation margin payments, the broker can gain access to the initial margin to satisfy the Fund’s payment obligations. When the contracts are closed, a realized gain or loss is recorded in the Statement of Operations.
44 | Wells Fargo Short-Term Municipal Bond Fund

Notes to financial statements (unaudited)
Security transactions and income recognition Securities transactions are recorded on a trade date basis. Realized gains or losses are recorded on the basis of identified cost.
Interest income is accrued daily and bond discounts are accreted and premiums are amortized daily. To the extent debt obligations are placed on non-accrual status, any related interest income may be reduced by writing off interest receivables when the collection of all or a portion of interest has been determined to be doubtful based on consistently applied procedures and the fair value has decreased. If the issuer subsequently resumes interest payments or when the collectability of interest is reasonably assured, the debt obligation is removed from non-accrual status.
Distributions to shareholders Distributions to shareholders from net investment income are declared daily and paid monthly. Distributions from net realized gains, if any, are recorded on the ex-dividend date and paid at least annually. Such distributions are determined in accordance with income tax regulations and may differ from U.S. generally accepted accounting principles. Dividend sources are estimated at the time of declaration. The tax character of distributions is determined as of the Fund’s fiscal year end. Therefore, a portion of the Fund’s distributions made prior to the Fund’s fiscal year end may be categorized as a tax return of capital at year end.
Federal and other taxes The Fund intends to continue to qualify as a regulated investment company by distributing substantially all of its investment company taxable and tax-exempt income and any net realized capital gains (after reduction for capital loss carryforwards) sufficient to relieve it from all, or substantially all, federal income taxes. Accordingly, no provision for federal income taxes was required.
The Fund’s income and federal excise tax returns and all financial records supporting those returns for the prior three fiscal years are subject to examination by the federal and Delaware revenue authorities. Management has analyzed the Fund’s tax positions taken on federal, state, and foreign tax returns for all open tax years and does not believe that there are any uncertain tax positions that require recognition of a tax liability.
As of December 31, 2019, the aggregate cost of all investments for federal income tax purposes was $3,631,322,734 and the unrealized gains (losses) consisted of:
Gross unrealized gains $43,665,498
Gross unrealized losses (2,024,000)
Net unrealized gains $ 41,641,498
As of June 30, 2019, the Fund had capital loss carryforwards which consisted of $43,260,519 in short-term capital losses.
Class allocations The separate classes of shares offered by the Fund differ principally in applicable sales charges, distribution, shareholder servicing, and administration fees. Class specific expenses are charged directly to that share class. Investment income, common fund-level expenses, and realized and unrealized gains (losses) on investments are allocated daily to each class of shares based on the relative proportion of net assets of each class.
3. FAIR VALUATION MEASUREMENTS Fair value measurements of investments are determined within a framework that has established a fair value hierarchy based upon the various data inputs utilized in determining the value of the Fund’s investments. The three-level hierarchy gives the highest priority to unadjusted quoted prices in active markets for identical assets or liabilities (Level 1) and the lowest priority to unobservable inputs (Level 3). The Fund’s investments are classified within the fair value hierarchy based on the lowest level of input that is significant to the fair value measurement. The inputs are summarized into three broad levels as follows:
▪ Level 1 – quoted prices in active markets for identical securities
▪ Level 2 – other significant observable inputs (including quoted prices for similar securities, interest rates, prepayment speeds, credit risk, etc.)
▪ Level 3 – significant unobservable inputs (including the Fund’s own assumptions in determining the fair value of investments)
The inputs or methodologies used for valuing investments in securities are not necessarily an indication of the risk associated with investing in those securities.
Wells Fargo Short-Term Municipal Bond Fund | 45

The following is a summary of the inputs used in valuing the Fund’s assets and liabilities as of December 31, 2019:
Quoted prices (Level 1)
Other significant observable inputs
(Level 2)
Significant unobservable inputs
(Level 3) Total
Assets
Investments in:
Municipal obligations $ 0 $3,660,959,720 $0 $3,660,959,720
Closed end municipal bond fund obligations 0 8,000,000 0 8,000,000
Short-term investments
Investment companies 4,004,512 0 0 4,004,512
Total assets $4,004,512 $3,668,959,720 $0 $3,672,964,232
Notes to financial statements (unaudited)
Additional sector, industry or geographic detail is included in the Portfolio of Investments.
For the six months ended December 31, 2019, the Fund did not have any transfers into/out of Level 3.
4. TRANSACTIONS WITH AFFILIATES
Management fee Funds Management, an indirect wholly owned subsidiary of Wells Fargo & Company (“Wells Fargo”), is the manager of the Fund and provides advisory and fund-level administrative services under an investment management agreement. Under the investment management agreement, Funds Management is responsible for, among other services, implementing the investment objectives and strategies of the Fund, supervising the subadviser and providing fund-level administrative services in connection with the Fund’s operations. As compensation for its services under the investment management agreement, Funds Management is entitled to receive a management fee at the following annual rate based on the Fund’s average daily net assets:
Average daily net assets Management fee
First $1 billion 0.350%
Next $4 billion 0.325
Next $3 billion 0.290
Next $2 billion 0.265
Over $10 billion 0.255
For the six months ended December 31, 2019, the management fee was equivalent to an annual rate of 0.33% of the Fund’s average daily net assets.
Funds Management has retained the services of a subadviser to provide daily portfolio management to the Fund. The fee for subadvisory services is borne by Funds Management. Wells Capital Management Incorporated, an affiliate of Funds Management and an indirect wholly owned subsidiary of Wells Fargo, is the subadviser to the Fund and is entitled to receive a fee from Funds Management at an annual rate starting at 0.15% and declining to 0.05% as the average daily net assets of the Fund increase.
Administration fees Under a class-level administration agreement, Funds Management provides class-level administrative services to the Fund, which includes paying fees and expenses for services provided by the transfer agent, sub-transfer agents, omnibus account servicers and record-keepers. As compensation for its services under the class-level administration agreement, Funds Management receives an annual fee which is calculated based on the average daily net assets of each class as follows:
Class-level administration fee
Class A, Class C 0.16%
Class R6 0.03
Administrator Class 0.10
Institutional Class 0.08
46 | Wells Fargo Short-Term Municipal Bond Fund

Notes to financial statements (unaudited)
Waivers and/or expense reimbursements Funds Management has contractually waived and/or reimbursed management and administration fees to the extent necessary to maintain certain net operating expense ratios for the Fund. When each class of the Fund has exceeded its expense cap, Funds Management has waived fees and/or reimbursed expenses from fund-level expenses on a proportionate basis and then from class specific expenses. When only certain classes exceed their expense caps, waivers and/or reimbursements are applied against class specific expenses before fund-level expenses. Funds Management has committed through October 31, 2020 to waive fees and/or reimburse expenses to the extent necessary to cap the Fund’s expenses at 0.63% for Class A shares, 1.38% for Class C shares, 0.35% for Class R6 shares, 0.60% for Administrator Class shares, and 0.40% for Institutional Class shares. Prior to or after the commitment expiration date, the cap may be increased or the commitment to maintain the cap may be terminated only with the approval of the Board of Trustees.
Distribution fee The Trust has adopted a distribution plan for Class C shares of the Fund pursuant to Rule 12b-1 under the 1940 Act. A distribution fee is charged to Class C shares and paid to Wells Fargo Funds Distributor, LLC (“Funds Distributor”), the principal underwriter, at an annual rate of 0.75% of the average daily net assets of Class C shares.
In addition, Funds Distributor is entitled to receive the front-end sales charge from the purchase of Class A shares and a contingent deferred sales charge on the redemption of certain Class A shares. Funds Distributor is also entitled to receive the contingent deferred sales charges from redemptions of Class C shares. For the six months ended December 31, 2019, Funds Distributor received $655 from the sale of Class A shares. No contingent deferred sales charges were incurred by Class A and Class C shares for the six months ended December 31, 2019.
Shareholder servicing fees The Trust has entered into contracts with one or more shareholder servicing agents, whereby Class A, Class C, and Administrator Class of the Fund are charged a fee at an annual rate of 0.25% of the average daily net assets of each respective class. A portion of these total shareholder servicing fees were paid to affiliates of Wells Fargo.
Interfund transactions The Fund may purchase or sell portfolio investment securities to certain other Wells Fargo affiliates pursuant to Rule 17a-7 under the 1940 Act and under procedures adopted by the Board of Trustees. The procedures have been designed to ensure that these interfund transactions, which do not incur broker commissions, are effected at current market prices.
5. INVESTMENT PORTFOLIO TRANSACTIONS Purchases and sales of investments, excluding U.S. government obligations (if any) and short-term securities, for the six months ended December 31, 2019 were $651,205,005 and $479,505,754, respectively.
6. BANK BORROWINGS The Trust (excluding the money market funds), Wells Fargo Master Trust and Wells Fargo Variable Trust are parties to a $280,000,000 revolving credit agreement whereby the Fund is permitted to use bank borrowings for temporary or emergency purposes, such as to fund shareholder redemption requests. Interest under the credit agreement is charged to the Fund based on a borrowing rate equal to the higher of the Federal Funds rate in effect on that day plus 1.25% or the overnight LIBOR rate in effect on that day plus 1.25%. In addition, an annual commitment fee equal to 0.25% of the unused balance is allocated to each participating fund.
For the six months ended December 31, 2019, there were no borrowings by the Fund under the agreement.
7. INDEMNIFICATION Under the Trust’s organizational documents, the officers and Trustees have been granted certain indemnification rights against certain liabilities that may arise out of performance of their duties to the Trust. Additionally, in the normal course of business, the Trust may enter into contracts with service providers that contain a variety of indemnification clauses. The Trust’s maximum exposure under these arrangements is dependent on future claims that may be made against the Fund and, therefore, cannot be estimated.
8. NEW ACCOUNTING PRONOUNCEMENTS In August 2018, FASB issued Accounting Standards Update (“ASU”) No. 2018-13, Fair Value Measurement (Topic 820) Disclosure Framework—Changes to the Disclosure Requirements for Fair Value Measurement. ASU 2018-13 updates the disclosure requirements for fair value measurements by modifying or removing certain disclosures and adding certain new disclosures. The
Wells Fargo Short-Term Municipal Bond Fund | 47

Notes to financial statements (unaudited)
amendments are effective for fiscal years, and interim periods within those fiscal years, beginning after December 15, 2019. Early adoption is permitted. Management has adopted the removal and modification of disclosures early, as permitted, and will adopt the additional new disclosures at the effective date.
In March 2017, FASB issued ASU No. 2017-08, Premium Amortization on Purchased Callable Debt Securities. ASU 2017-08 shortens the amortization period for certain callable debt securities held at a premium and requires the premium to be amortized to the earliest call date. The amendments do not require an accounting change for securities held at a discount and discounts will continue to be accreted to the maturity date of the security. ASU 2017-08 is effective for fiscal years beginning after December 15, 2018 and for interim periods within those fiscal years. During the current reporting period, management of the Fund adopted the change in accounting policy which did not have a material impact to the Fund’s financial statements.
48 | Wells Fargo Short-Term Municipal Bond Fund

Other information (unaudited)
PROXY VOTING INFORMATION A description of the policies and procedures used to determine how to vote proxies relating to portfolio securities is available, upon request, by calling 1-800-222-8222, visiting our website at wfam.com, or visiting the SEC website at sec.gov. Information regarding how the proxies related to portfolio securities were voted during the most recent 12-month period ended June 30 is available on the website at wfam.com or by visiting the SEC website at sec.gov.
QUARTERLY PORTFOLIO HOLDINGS INFORMATION The Fund files its complete schedule of portfolio holdings with the SEC for the first and third quarters of each fiscal year as an exhibit to its reports on Form N-PORT. Shareholders may view the filed Form N-PORT by visiting the SEC website at sec.gov.
Wells Fargo Short-Term Municipal Bond Fund | 49

BOARD OF TRUSTEES AND OFFICERS Each of the Trustees and Officers1 listed in the table below acts in identical capacities for each fund in the Wells Fargo family of funds, which consists of 149 mutual funds comprising the Wells Fargo Funds Trust, Wells Fargo Variable Trust, Wells Fargo Master Trust and four closed-end funds (collectively the “Fund Complex”). This table should be read in conjunction with the Prospectus and the Statement of Additional Information2. The mailing address of each Trustee and Officer is 525 Market Street, 12th Floor, San Francisco, CA 94105. Each Trustee and Officer serves an indefinite term, however, each Trustee serves such term until reaching the mandatory retirement age established by the Trustees.
Independent Trustees
Name and year of birth
Position held and length of service* Principal occupations during past five years or longer
Current other public company or investment company directorships
William R. Ebsworth
(Born 1957)
Trustee,
since 2015
Retired. From 1984 to 2013, equities analyst, portfolio manager, research
director and chief investment officer at Fidelity Management and Research
Company in Boston, Tokyo, and Hong Kong, and retired in 2013 as Chief
Investment Officer of Fidelity Strategic Advisers, Inc. where he led a team of
investment professionals managing client assets. Prior thereto, Board member
of Hong Kong Securities Clearing Co., Hong Kong Options Clearing Corp., the
Thailand International Fund, Ltd., Fidelity Investments Life Insurance
Company, and Empire Fidelity Investments Life Insurance Company. Audit
Committee Chair and Investment Committee Chair of the Vincent Memorial
Hospital Endowment (non-profit organization). Mr. Ebsworth is a CFA®
charterholder.
N/A
Jane A. Freeman
(Born 1953)
Trustee,
since 2015;
Chair Liaison,
since 2018
Retired. From 2012 to 2014 and 1999 to 2008, Chief Financial Officer of
Scientific Learning Corporation. From 2008 to 2012, Ms. Freeman provided
consulting services related to strategic business projects. Prior to 1999,
Portfolio Manager at Rockefeller & Co. and Scudder, Stevens & Clark. Board
member of the Harding Loevner Funds from 1996 to 2014, serving as both
Lead Independent Director and chair of the Audit Committee. Board member
of the Russell Exchange Traded Funds Trust from 2011 to 2012 and the chair of
the Audit Committee. Ms. Freeman is a Board Member of The Ruth Bancroft
Garden (non-profit organization). She is also an inactive Chartered Financial
Analyst.
N/A
Isaiah Harris, Jr.
(Born 1952)
Trustee,
since 2009;
Audit Committee
Chairman,
since 2019
Retired. Chairman of the Board of CIGNA Corporation since 2009, and
Director since 2005. From 2003 to 2011, Director of Deluxe Corporation. Prior
thereto, President and CEO of BellSouth Advertising and Publishing Corp.
from 2005 to 2007, President and CEO of BellSouth Enterprises from
2004 to 2005 and President of BellSouth Consumer Services from 2000 to
2003. Emeritus member of the Iowa State University Foundation Board of
Governors. Emeritus Member of the Advisory Board of Iowa State University
School of Business. Advisory Board Member, Palm Harbor Academy (private
school). Advisory Board Member, Child Evangelism Fellowship (non-profit).
Mr. Harris is a certified public accountant (inactive status).
CIGNA Corporation
Judith M. Johnson
(Born 1949)
Trustee,
since 2008;
Audit Committee
Chairman, from
2009 to 2018
Retired. Prior thereto, Chief Executive Officer and Chief Investment Officer of
Minneapolis Employees Retirement Fund from 1996 to 2008. Ms. Johnson is
an attorney, certified public accountant and a certified managerial accountant.
N/A
Other information (unaudited)
50 | Wells Fargo Short-Term Municipal Bond Fund

Other information (unaudited)
Current other public company or investment company directorships
Name and year of birth
Position held and length of service* Principal occupations during past five years or longer
David F. Larcker
(Born 1950)
Trustee,
since 2009
James Irvin Miller Professor of Accounting at the Graduate School of Business,
Stanford University, Director of the Corporate Governance Research Initiative
and Senior Faculty of The Rock Center for Corporate Governance since 2006.
From 2005 to 2008, Professor of Accounting at the Graduate School of
Business, Stanford University. Prior thereto, Ernst & Young Professor of
Accounting at The Wharton School, University of Pennsylvania from
1985 to 2005.
N/A
Olivia S. Mitchell
(Born 1953)
Trustee,
since 2006;
Nominating and
Governance
Committee
Chair, since 2018
International Foundation of Employee Benefit Plans Professor, Wharton
School of the University of Pennsylvania since 1993. Director of Wharton’s
Pension Research Council and Boettner Center on Pensions & Retirement
Research, and Research Associate at the National Bureau of Economic
Research. Previously, Cornell University Professor from 1978 to 1993.
N/A
Timothy J. Penny
(Born 1951)
Trustee,
since 1996;
Chairman,
since 2018
President and Chief Executive Officer of Southern Minnesota Initiative
Foundation, a non-profit organization, since 2007. Member of the Board of
Trustees of NorthStar Education Finance, Inc., a non-profit organization,
since 2007.
N/A
James G. Polisson
(Born 1959)
Trustee,
since 2018
Retired. Chief Marketing Officer, Source (ETF) UK Services, Ltd, from
2015 to 2017. From 2012 to 2015, Principal of The Polisson Group, LLC, a
management consulting, corporate advisory and principal investing company.
Chief Executive Officer and Managing Director at Russell Investments, Global
Exchange Traded Funds from 2010 to 2012. Managing Director of Barclays
Global Investors from 1998 to 2010 and Global Chief Marketing Officer for
iShares and Barclays Global Investors from 2000 to 2010. Trustee of the San
Francisco Mechanics’ Institute, a non-profit organization, from 2013 to 2015.
Board member of the Russell Exchange Traded Fund Trust from 2011 to 2012.
Director of Barclays Global Investors Holdings Deutschland GmbH from
2006 to 2009. Mr. Polisson is an attorney and has a retired status with the
Massachusetts and District of Columbia Bar Associations.
N/A
Pamela Wheelock3
(Born 1959)
Trustee, since
January 2020;
previously Trustee
from
January 2018 to
July 2019
Board member of the Destination Medical Center Economic Development
Agency, Rochester, Minnesota since 2019. Acting Commissioner, Minnesota
Department of Human Services, July 2019 through September 2019. Human
Services Manager (part-time), Minnesota Department of Human Services,
October 2019 through December 2019. Chief Operating Officer, Twin Cities
Habitat for Humanity from 2017 to 2019. Vice President of University Services,
University of Minnesota from 2012 to 2016. Prior thereto, on the Board of
Directors, Governance Committee and Finance Committee for the Minnesota
Philanthropy Partners (Saint Paul Foundation) from 2012 to 2018, Interim Chief
Executive Officer of Blue Cross Blue Shield of Minnesota from 2011 to 2012,
Chairman of the Board from 2009 to 2012 and Board Director from 2003 to
2015. Vice President, Leadership and Community Engagement, Bush
Foundation, Saint Paul, Minnesota (a private foundation) from 2009 to 2011.
Executive Vice President and Chief Financial Officer, Minnesota Sports and
Entertainment from 2004 to 2009 and Senior Vice President from 2002 to
2004. Executive Vice President of the Minnesota Wild Foundation from 2004
to 2008. Commissioner of Finance, State of Minnesota, from 1999 to 2002.
Currently Board Chair of the Minnesota Wild Foundation since 2010.
N/A
* Length of service dates reflect the Trustee’s commencement of service with the Trust’s predecessor entities, where applicable.
Wells Fargo Short-Term Municipal Bond Fund | 51

Other information (unaudited)
Officers Name and year of birth
Position held and length of service Principal occupations during past five years or longer
Andrew Owen
(Born 1960)
President,
since 2017
Executive Vice President of Wells Fargo & Company and Head of Affiliated Managers, Wells Fargo
Asset Management, since 2014. In addition, Mr. Owen is currently President, Chief Executive Officer
and Director of Wells Fargo Funds Management, LLC since 2017. Prior thereto, Executive Vice
President responsible for marketing, investments and product development for Wells Fargo Funds
Management, LLC, from 2009 to 2014.
Nancy Wiser1
(Born 1967)
Treasurer,
since 2012
Executive Vice President of Wells Fargo Funds Management, LLC since 2011. Chief Operating
Officer and Chief Compliance Officer at LightBox Capital Management LLC, from 2008 to 2011.
Michelle Rhee4
(Born 1966)
Chief Legal
Officer,
since 2019
Secretary of Wells Fargo Funds Management, LLC, Chief Legal Counsel of Wells Fargo Asset
Management and Assistant General Counsel of Wells Fargo Bank, N.A. since 2018. Associate General
Counsel and Managing Director of Bank of America Corporation from 2004 to 2018.
Catherine Kennedy5
(Born 1969)
Secretary,
since 2019
Vice President of Wells Fargo Funds Management, LLC and Senior Counsel of the Wells Fargo Legal
Department since 2010. Vice President and Senior Counsel of Evergreen Investment Management
Company, LLC from 1998 to 2010.
Michael H. Whitaker
(Born 1967)
Chief Compliance
Officer,
since 2016
Chief Compliance Officer of Wells Fargo Asset Management since 2016. Senior Vice President and
Chief Compliance Officer for Fidelity Investments from 2007 to 2016.
David Berardi
(Born 1975)
Assistant
Treasurer,
since 2009
Vice President of Wells Fargo Funds Management, LLC since 2009. Vice President of Evergreen
Investment Management Company, LLC from 2008 to 2010. Manager of Fund Reporting and
Control for Evergreen Investment Management Company, LLC from 2004 to 2010 .
Jeremy DePalma1
(Born 1974)
Assistant
Treasurer,
since 2009
Senior Vice President of Wells Fargo Funds Management, LLC since 2009. Senior Vice President of
Evergreen Investment Management Company, LLC from 2008 to 2010 and head of the Fund
Reporting and Control Team within Fund Administration from 2005 to 2010.
1 Nancy Wiser acts as Treasurer of 64 funds in the Fund Complex. Jeremy DePalma acts as Treasurer of 85 funds and Assistant Treasurer of 64 funds in the Fund Complex.
2 The Statement of Additional Information includes additional information about the Trustees and is available, without charge, upon request, by calling 1-800-222-8222 or by visiting the website at wfam.com.
3 Pamela Wheelock was re-appointed to the Board effective January 1, 2020. 4 Michelle Rhee became Chief Legal Officer effective October 22, 2019. 5 Catherine Kennedy became Secretary effective October 22, 2019.
52 | Wells Fargo Short-Term Municipal Bond Fund

Appendix (unaudited)
Effective on or about May 1, 2020, if you purchase Fund shares through a Janney Montgomery Scott LLC (“Janney”) brokerage account, you will be eligible for the following load waivers (front-end sales charge waivers and contingent deferred sales charge (“CDSC”), or back-end sales charge, waivers) and discounts, which may differ from those disclosed elsewhere in the Fund’s Prospectus or SAI.
Front-end sales charge* waivers on Class A shares available at Janney
Shares purchased through reinvestment of capital gains distributions and dividend reinvestment when purchasing shares of the same fund
(but not any other fund within the fund family).
Shares purchased by employees and registered representatives of Janney or its affiliates and their family members as designated by Janney.
Shares purchased from the proceeds of redemptions within the same fund family, provided (1) the repurchase occurs within ninety (90) days
following the redemption, (2) the redemption and purchase occur in the same account, and (3) redeemed shares were subject to a front-end
or deferred sales load (i.e., right of reinstatement).
Employer-sponsored retirement plans (e.g., 401(k) plans, 457 plans, employer-sponsored 403(b) plans, profit sharing and money purchase
pension plans and defined benefit plans). For purposes of this provision, employer-sponsored retirement plans do not include SEP IRAs,
Simple IRAs, SAR-SEPs or Keogh plans.
Shares acquired through a right of reinstatement.
Class C shares that are no longer subject to a contingent deferred sales charge and are converted to Class A shares of the same fund
pursuant to Janney’s policies and procedures.
CDSC waivers on Class A and Class C shares available at Janney
Shares sold upon the death or disability of the shareholder.
Shares sold as part of a systematic withdrawal plan as described in the Fund’s Prospectus.
Shares purchased in connection with a return of excess contributions from an IRA account.
Shares sold as part of a required minimum distribution for IRA and retirement accounts if the redemption is taken in or after the year the
shareholder reaches qualified age based on applicable IRS regulations.
Shares sold to pay Janney fees but only if the transaction is initiated by Janney.
Shares acquired through a right of reinstatement.
Shares exchanged into the same share class of a different fund.
Front-end sales charge* discounts available at Janney; breakpoints, rights of accumulation and/or letters of intent
Breakpoints as described in the Fund’s Prospectus.
Rights of accumulation (“ROA”), which entitle shareholders to breakpoint discounts, will be automatically calculated based on the
aggregated holding of fund family assets held by accounts within the purchaser’s household at Janney. Eligible fund family assets not held at
Janney may be included in the ROA calculation only if the shareholder notifies his or her financial advisor about such assets.
Letters of intent which allow for breakpoint discounts based on anticipated purchases within a fund family, over a 13-month time period.
Eligible fund family assets not held at Janney Montgomery Scott may be included in the calculation of letters of intent only if the
shareholder notifies his or her financial advisor about such assets.
* Also referred to as an “initial sales charge.”
Wells Fargo Short-Term Municipal Bond Fund | 53

This page is intentionally left blank.

This page is intentionally left blank.

This page is intentionally left blank.


For more information More information about Wells Fargo Funds is available free upon request. To obtain literature, please write, visit the Fund’s website, or call:
Wells Fargo Funds P.O. Box 219967 Kansas City, MO 64121-9967
Website: wfam.com Individual investors: 1-800-222-8222 Retail investment professionals: 1-888-877-9275 Institutional investment professionals: 1-866-765-0778
Get this document online Sign up at wellsfargo.com/advantagedelivery
This report and the financial statements contained herein are submitted for the general information of the shareholders of the Fund. If this report is used for promotional purposes, distribution of the report must be accompanied or preceded by a current prospectus. Before investing, please consider the investment objectives, risks, charges, and expenses of the investment. For a current prospectus and, if available, a summary prospectus, containing this information, call 1-800-222-8222 or visit the Fund’s website at wfam.com. Read the prospectus carefully before you invest or send money.
Wells Fargo Asset Management (WFAM) is the trade name for certain investment advisory/management firms owned by Wells Fargo & Company. These firms include but are not limited to Wells Capital Management Incorporated and Wells Fargo Funds Management, LLC. Certain products managed by WFAM entities are distributed by Wells Fargo Funds Distributor, LLC (a broker-dealer and Member FINRA).
This material is for general informational and educational purposes only and is NOT intended to provide investment advice or a recommendation of any kind— including a recommendation for any specific investment, strategy, or plan.
INVESTMENT PRODUCTS: NOT FDIC INSURED ▪ NO BANK GUARANTEE ▪ MAY LOSE VALUE
© 2020 Wells Fargo & Company. All rights reserved. PAR-0120-02396 02-20
SA256/SAR256 12-19