wells fargo securities nick fanandakis industrial...
TRANSCRIPT

Wells Fargo Securities Industrial & Construction Conference May 8, 2014 New York
Nick Fanandakis Chief Financial Officer E. I. du Pont de Nemours & Company
2
Regulation G The attached charts include company information that does not conform to generally accepted accounting principles (GAAP). Management believes that an analysis of this data is meaningful to investors because it provides insight with respect to ongoing operating results of the company and allows investors to better evaluate the financial results of the company. These measures should not be viewed as an alternative to GAAP measures of performance. Furthermore, these measures may not be consistent with similar measures provided by other companies. This data should be read in conjunction with previously published company reports on Forms 10-K, 10-Q, and 8-K. These reports, along with reconciliations of non-GAAP measures to GAAP are available on the Investor Center of www.dupont.com under Key Financials & Filings in “Quarterly Supplemental Financial Data and Non-GAAP Reconciliations”. Reconciliations of non-GAAP measures to GAAP are also included with this presentation.
Forward Looking Statements During the course of this presentation we may make forward-looking statements or provide forward-looking information. All statements that address expectations or projections about the future are forward-looking statements. Some of these statements include words such as “plans,” “expects,” “will,” “anticipates,” “believes,” “intends,” and “estimates.” Although they reflect our current expectations, these statements are not guarantees of future performance, but involve a number of risks, uncertainties, and assumptions. Some of which include: fluctuations in energy and raw material prices; failure to develop and market new products and optimally manage product life cycles; global economic and capital markets conditions; litigation and environmental matters; changes in laws and regulations or political conditions; business or supply disruptions; ability to protect and enforce the company’s intellectual property rights successful integration of acquired business and separation of underperforming or non-strategic assets; and successful completion of the proposed spinoff of the Performance Chemicals segment including ability to fully realize the expected benefits of the proposed spinoff. The company does not undertake to update any forward-looking statements as a result of future developments or new information.
Developing Markets Total developing markets is comprised of Developing Asia, Developing Europe, Middle East & Africa, and Latin America. A detailed list of all developing countries is available on the Earnings News Release link on the Investor Center website at www.dupont.com.
2

3
AGRICULTURE & NUTRITION
INDUSTRIAL BIOSCIENCES
ADVANCED MATERIALS
Three Strategic Priorities Drive The Value Of DuPont…
3
Extend leadership across high-value, science-driven segments of the Ag and Food value chain.
Develop world-leading industrial biotech capabilities to create new businesses.
Grow leading position in differentiated high-value materials.
Higher Growth, Higher Value Company Through Three World-Leading Positions

4
• Rigorous pipeline management
• Disciplined project execution
• Increasing return on R&D
• Driving penetration in fast-growing, developing markets
• Delivering ongoing productivity
• Optimizing resource allocation
• Returning cash to shareholders
…Together With Three Key Operational Priorities
INNOVATION GLOBAL REACH EXECUTION
5
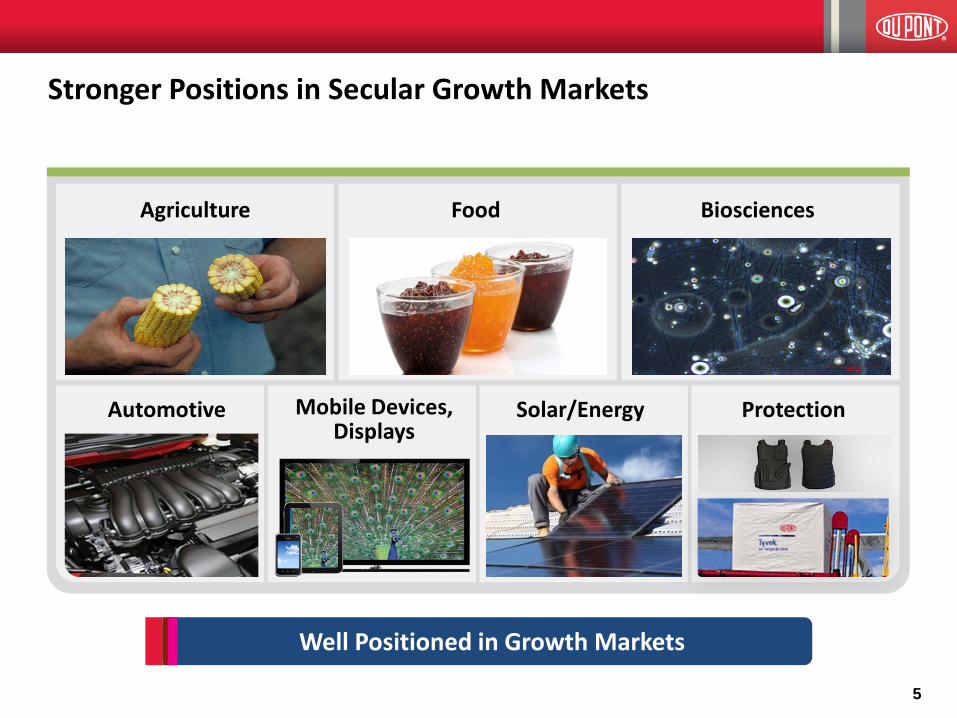
Stronger Positions in Secular Growth Markets
Agriculture Food Biosciences
Automotive Mobile Devices, Displays
Solar/Energy Protection
Well Positioned in Growth Markets

…COMPELLING MARKET INSIGHTS TO SOLVE WORLD SCALE CHALLENGES
WORLD CLASS INTEGRATED SCIENCE COUPLED WITH…
DuPont is Translating Leading Science Into Solutions for the World’s Great Challenges
Broadest, Deepest Science Capabilities of Any Enterprise 6
Materials Science
Chemistry
Biological Sciences
Engineering
Integration of emerging
biological sciences
FOOD
ENERGY
PROTECTION
Materials Science Chemistry Biological Sciences Engineering

7
Science is the Growth Engine for the Company
*2013 revenue from products introduced in the last four years
$ 5.8B* new product revenue
$ 0.4B* new product revenue
$ 3.9B* new product revenue
Agriculture & Nutrition Bio-based Industrials Advanced Materials
• Seeds • Traits • Crop Protection • Specialty Food Ingredients
• Enzymes • Biomaterials • Biofuels • Biochemicals
• Electronic Materials • Protective Materials • Alternative Energy • Advanced Polymers • Advanced Processes
Integrated Science is a Competitive Advantage

8
Portfolio Evolves for Higher Growth, Higher Value
2013
* Amounts represent segment sales, which include transfers. ** Separation of Performance Chemicals announced in 4Q 2013, anticipated completion mid-2015 *** Performance Coatings segment sold 1Q 2013
Segment Sales*
$29,337
2008
Segment Sales*
$20,304
Segment Sales* $10,396
Agriculture
Performance Coatings*** Electronics & Communications Industrial Biosciences
Performance Chemicals** Performance Materials Nutrition & Health
Safety & Protection
Segment Sales* $6,703

9
Dividends Will Continue To Be A Priority…
• Continuous dividend since 1904
• No reduction in dividend during recession or post Pharma license expiration
• Dividend growth restarted
• Dividend yield and payout ratio are above peers
Dividends per Share Stability and Growth Focus
Aim to Grow Future Dividends In Line With Earnings
$1.64 $1.64 $1.64
$1.70
$1.78
2009 2010 2011 2012 2013

10
$1B
$3B
$5B
$7B
$10B
$0B
$2B
$4B
$6B
$8B
$10B
$12B
2009 2010 2011 2012 2013
Cum
ulat
ive
Capi
tal R
etur
ned
To S
hare
hold
ers
($B)
Cumulative Dividends Cumulative Buybacks
…To Be Complemented With Share Buybacks
We Will Continue To Repurchase Shares With Excess Cash In Line With Our Balance Sheet Objectives And Strategic Opportunities
(1)
(1) Common dividends paid to shareholders
• Capital returned to shareholders has accelerated under current management’s tenure
• Two dividend increases
• $1B share repurchase with Performance Coatings proceeds
• Announced $5B share repurchase program, including $2B buyback in 2014
Comments Capital Returned To Shareholders
$2B

11
Two Strong Highly Competitive Companies with Separate and Distinct Value Creation Strategies
Performance Chemicals DuPont
Cash Generation Focus Process Technology Driven
• Leading Businesses • Customer Focused Application Development • Low Cost Production • Capital Productivity • Sustainable Operator • Regulatory Leadership and Advocacy
MISSION: Cash Generation Industry leadership and productivity
Growth Focus Science & Technology Driven
• Leading Technologies • Science Integration Across Businesses • Strong Applications Development • Targets Secular Driven Growth • Innovative Products; Robust Pipeline • Global Reach and Productivity
MISSION: Growth Differentiated and integrated science

12
$36.0B
DuPont
Two Companies with Strong Financial Profiles
* Segment Sales include transfers. Segment Operating Earnings is a non-GAAP measure. See appendix for reconciliation of non-GAAP measures to GAAP. Refer to the Company’s website for additional reconciliations of non-GAAP measures. ** CapEx includes purchases of property, plant and equipment and investment in affiliates.
Segment Sales*
2013 Sales
by Segment
DuPont Excluding Performance Chemicals
$29.3B
Performance
Chemicals
$5.9B Segment
Operating Earnings*
$4.9B $1.0B
$1.9B CapEx** $1.5B $0.4B
$2.2B R&D $2.1B $0.1B
$6.7B
DTT 45%
DC&F 55% Ag
32%
PChem 19%
E&C 7%
N&H 10%
IB 3%
Perf. Mat. 18%
S&P 11%
Ag 40%
E&C 9%
N&H 12%
IB 4%
Perf. Mat. 22%
S&P 13%

13
Sales CAGR 7% Operating EPS CAGR 12%
Operational Priorities Strategic Priorities
What You Can Expect
Extend Ag & Nutrition Leadership
Strengthen Advanced Materials
Build Bio-based Businesses
Innovation
Execution
Global Reach
Long Term Growth Targets

14
DuPont: Accelerating Achievement of Long Term Growth Targets
Segments
Long-Term Targets 2013
Margins* Sales CAGR Margins*
Agriculture 8-10% 22-24% 21%
Electronics & Communications 7-9% 16-18% 13%
Industrial Biosciences 7-9% 16-18% 14%
Nutrition & Health 7-9% 12-14% 9%
Performance Chemicals 3-5% 18-20% 15%
Performance Materials 3-5% 16-18% 20%
Safety & Protection 5-7% 21-23% 18%
* Excludes non-operating pension/OPEB costs and significant items. See appendix for reconciliations of non-GAAP measures to GAAP.
7% Sales CAGR & 12% Operating EPS CAGR

Segment Summaries

16
Agriculture Summary
Key Growth Drivers • Product and service innovation • Developing markets • Strategic investments • Margin expansion
$9.2 $10.4
$11.7
20% 21% 21%
2011 2012 2013
Sales and Margin Performance
Sales ($B)*Operating Margins (%)**
Long-Term Growth Targets: Sales 8-10% CAGR with 22-24% Margins
* Segment sales include transfers. ** Excludes non-operating pension/OPEB costs and significant items. See appendix for a reconciliation of non-GAAP measures.

17
Electronics & Communications Summary
Long-Term Growth Targets: Sales 7-9% CAGR with 16-18% Margins
Key Growth Drivers • Improving lifetime, efficiency
and cost of photovoltaic modules • Enabling higher performance and
versatility in smartphones and tablets • Commercializing OLED technology
for TVs
* Segment sales include transfers. ** Excludes non-operating pension/OPEB costs and significant items. See appendix for a reconciliation of non-GAAP measures.
$3.2
$2.7 $2.5
14% 10%
13%
2011 2012 2013
Sales and Margin Performance
Sales ($B)*Operating Margins (%)**

18
Industrial Biosciences Summary
Key Growth Drivers • Population and income growth
fueling core enzyme demand in emerging markets
• Increasing use of sustainable materials driving biobased solutions
• Global sustainability mandates and energy security driving biofuels demand
Long-Term Growth Targets: Sales 7-9% CAGR with 16-18% Margins
* Segment sales include transfers. ** Excludes non-operating pension/OPEB costs and significant items. See appendix for a reconciliation of non-GAAP measures.
$0.7
$1.2 $1.2
12% 14% 14%
2011 2012 2013
Sales and Margin Performance
Sales ($B)*Operating Margins (%)**

19
Nutrition & Health Summary
Key Growth Drivers • Underlying health, wellness and
food safety trends • Target developing markets • Investment in product and
application innovation • Drive margin expansion through
innovation, differential management and productivity
* Segment sales include transfers. ** Excludes non-operating pension/OPEB costs and significant items. See appendix for a reconciliation of non-GAAP measures.
Long-Term Growth Targets: Sales 7-9% CAGR with 12-14% Margins
$2.5
$3.4 $3.5
8% 9% 9%
2011 2012 2013
Sales and Margin Performance
Sales ($B)*Operating Margins (%)**

20
Performance Chemicals Summary
Long-Term Growth Targets: Sales 3-5% CAGR with 18-20% Margins
Key Growth Drivers • Continue Altamira expansion to
reduce our costs and meet market demand
• Drive commercialization for next generation refrigerants
• Deliver on industry leading productivity projects
* Segment sales include transfers. ** Excludes non-operating pension/OPEB costs and significant items. See appendix for a reconciliation of non-GAAP measures.
$7.8 $7.2
$6.7
27% 25%
15%
2011 2012 2013
Sales and Margin Performance
Sales ($B)*Operating Margins (%)**

21
Performance Materials Summary
Key Growth Drivers • Automotive light weighting,
increasing use of plastics • Increased penetration in Asia • Growth in renewable polymers
Long-Term Growth Targets: Sales 3-5% CAGR with 16-18% Margins
* Segment sales include transfers. ** Excludes non-operating pension/OPEB costs and significant items. See appendix for a reconciliation of non-GAAP measures.
$6.8 $6.4 $6.5
15% 19% 20%
2011 2012 2013
Sales and Margin Performance
Sales ($B)*Operating Margins (%)**

22
Safety & Protection Summary
Long-Term Growth Targets: Sales 5-7% CAGR with 21-23% Margins
Key Growth Drivers • Driving product innovation
and application development • Investing in downstream
marketing and brands • Reducing our cost structure
to gain profitable market share
* Segment sales include transfers. ** Excludes non-operating pension/OPEB costs and significant items. See appendix for a reconciliation of non-GAAP measures.
$3.9 $3.8 $3.9
17% 16% 18%
2011 2012 2013
Sales and Margin Performance
Sales ($B)*Operating Margins (%)**

Appendix 1: First Quarter 2014 Results

24
$ in millions, except EPS 1Q 2014 Financial Highlights*
* Amounts reflect continuing operations ** See appendix for reconciliations of Non-GAAP Measures
1Q14 vs. 1Q13 EPS Operating earnings** $1.58 1% GAAP earnings $1.54
Segment Operating Earnings** $2,248 (1%)
1Q14 vs. 1Q13
Consolidated Net Sales* $10,128 (3%)
Volume (1%)
Local Prices (1%)
Currency Impact (1%)

25
1Q 2014 Segment Operating Earnings* Variance
Key Takeaways
Agriculture lower due to year-on-year shifts in timing and planted area Performance Chemicals operating earnings decline due to lower price and weather Safety & Protection, Electronics & Communications, Nutrition & Health and
Industrial Biosciences delivered substantial operating earnings improvement Segment results include $43 ($0.04 per share) negative currency impact
* See appendix for details of significant items and reconciliation of Non-GAAP Measures
$2,276 Segment
Operating Earnings*
($74)
$37
$17 ($5)
($51) $26
$15 $7
$2,248 Segment
Operating Earnings*
1Q13 Ag Perf Chem S&P E&C N&H IB Perf Mtls Other 1Q14

26
Global Sales – Regional Highlights
1Q 2014 Sales YOY % CHG 1Q 2014 Sales by Region
U.S. & Canada 44%
Developing EMEA 10%
Developed EMEA 19%
Developing Asia 10%
Developed Asia 7%
Latin America 10%
Region %
Worldwide -3%
U.S. & Canada -8%
Developed EMEA +9%
Developed Asia -6%
Developing Markets -
Developing Asia +5%
Developing EMEA +8%
Latin America -10%

27
1Q 2014 Operating EPS* Variance
* See appendix for details of significant items and reconciliation of Non-GAAP Measures
Key Takeaways
Segment performance reflects operating earnings growth in most segments, offset by lower Agriculture and Performance Chemicals operating earnings
Exchange losses higher due primarily to currency devaluation in Argentina and the Ukraine more than offset by lower base tax rate
The base tax rate was 20.5%* compared to 23.4%* in the prior year; anticipate full year base tax rate of 22%*
Cost control and restructuring savings delivered lower corporate expenses
$1.56 Operating*
EPS
($0.02) $0.06
$0.01
($0.05)
$0.02
$1.58 Operating*
EPS
1Q 2013 Segmentresults
EGL Taxes Corporate &Interest Exp
Lowershares
1Q 2014

28
Other Financial Highlights
On track to complete Performance Chemicals separation about mid 2015
• Physical separation of manufacturing sites underway • New legal entity structures being created • Day One operating plans being finalized • Standalone financial statements being prepared • Target initial regulatory filings 4Q 2014
29
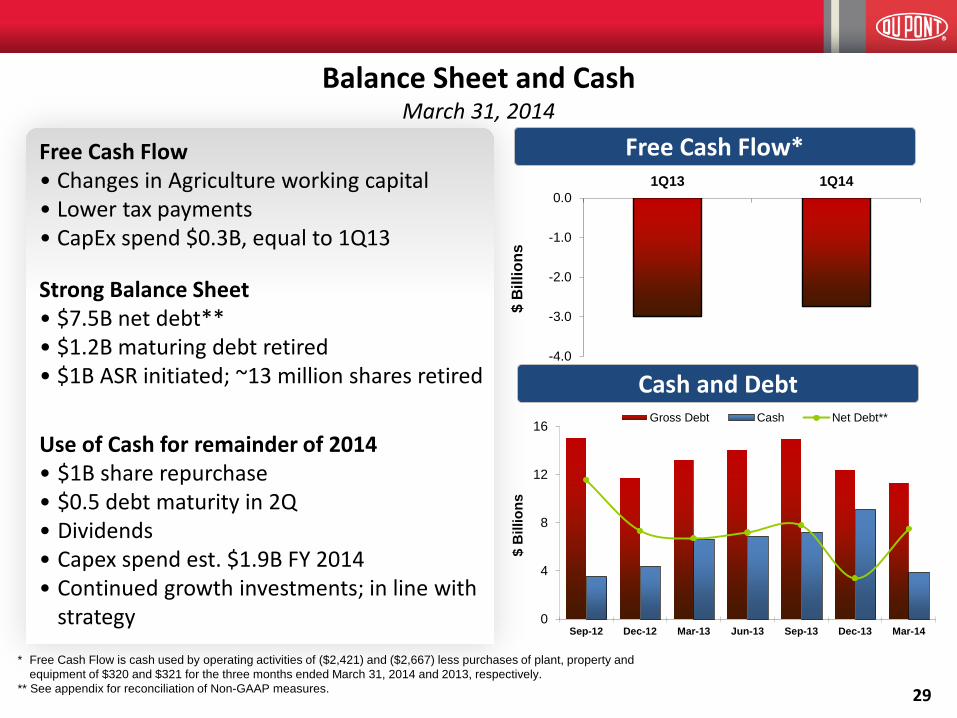
Balance Sheet and Cash March 31, 2014
Free Cash Flow • Changes in Agriculture working capital • Lower tax payments • CapEx spend $0.3B, equal to 1Q13
Strong Balance Sheet • $7.5B net debt** • $1.2B maturing debt retired • $1B ASR initiated; ~13 million shares retired
Use of Cash for remainder of 2014 • $1B share repurchase • $0.5 debt maturity in 2Q • Dividends • Capex spend est. $1.9B FY 2014 • Continued growth investments; in line with
strategy
* Free Cash Flow is cash used by operating activities of ($2,421) and ($2,667) less purchases of plant, property and equipment of $320 and $321 for the three months ended March 31, 2014 and 2013, respectively.
** See appendix for reconciliation of Non-GAAP measures.
Free Cash Flow*
-4.0
-3.0
-2.0
-1.0
0.01Q13 1Q14
$ B
illio
ns
0
4
8
12
16
Sep-12 Dec-12 Mar-13 Jun-13 Sep-13 Dec-13 Mar-14
$ B
illio
ns
Gross Debt Cash Net Debt**
Cash and Debt

Appendix 2: Supplemental Quarterly Information and Reconciliations of Non-GAAP Measures

31
E. I. DU PONT DE NEMOURS AND COMPANY AND CONSOLIDATED SUBSIDIARIES
SELECTED INCOME STATEMENT DATA
OPERATING EARNINGS (UNAUDITED)
(dollars in millions, except per share)
Year Year Year 1Q14 2013 4Q13 3Q13 2Q13 1Q13 2012 4Q12 3Q12 2Q12 1Q12 2011 4Q11 3Q11 2Q11 1Q11
Consolidated Net Sales 10,128 35,734 7,747 7,735 9,844 10,408 34,812 7,325 7,390 9,917 10,180 33,681 7,343 8,138 9,159 9,041
Segment Sales 10,209 36,046 7,814 7,813 9,925 10,494 35,194 7,397 7,480 10,022 10,295 34,087 7,444 8,236 9,263 9,144
Segment Operating Earnings (1) 2,248 5,925 939 853 1,857 2,276 6,251 616 921 2,241 2,473 6,292 820 1,215 2,074 2,183
Adjusted EBIT (Operating Earnings) (1) (2) 1,945 5,021 675 587 1,693 2,066 5,147 346 614 2,058 2,129 5,293 637 1,019 1,826 1,811
Adjusted EBITDA (Operating Earnings) (1) (2) 2,382 6,624 1,062 966 2,097 2,499 6,778 740 1,007 2,475 2,556 6,744 1,030 1,386 2,182 2,146
Operating Earnings Before Income Taxes (1) 1,848 4,587 567 482 1,582 1,956 4,708 230 501 1,950 2,027 4,886 524 914 1,724 1,724
Operating Earnings Per Share (1) (3) 1.58 3.88 0.59 0.45 1.28 1.56 3.77 0.20 0.43 1.50 1.64 4.02 0.37 0.72 1.39 1.53
(1) Operating earnings are defined as earnings from continuing operations (GAAP) excluding “significant items” and “non-operating pension and other post-employment benefit (OPEB) costs”. See reconciliation of Non-GAAP Measures on following pages of this appendix and additional details on the Company’s website.
(2) Adjusted EBIT from operating earnings is operating earnings (as defined above) before income taxes, net income attributable to noncontrolling interests and interest expense.
Adjusted EBITDA from operating earnings is adjusted EBIT from operating earnings before depreciation and amortization of intangible assets.
(3) Earnings per share for the year may not equal the sum of quarterly earnings per share due to changes in average share calculations.
Note: The data above provides a historical display of Selected Income Statement Data included in our Quarterly Earnings
Release financials. See Quarterly Earnings Release financials for full details, including details on "Significant Items".

32
E. I. DU PONT DE NEMOURS AND COMPANY AND CONSOLIDATED SUBSIDIARIES
SEGMENT SALES (UNAUDITED) (dollars in millions)
SEGMENT SALES Year Year Year 1Q14 2013 4Q13 3Q13 2Q13 1Q13 2012 4Q12 3Q12 2Q12 1Q12 2011 4Q11 3Q11 2Q11 1Q11
Agriculture 4,394 11,739 1,806 1,633 3,631 4,669 10,426 1,535 1,423 3,388 4,080 9,166 1,297 1,368 2,997 3,504
Electronics & Communications 580 2,549 642 638 653 616 2,701 622 607 795 677 3,173 630 841 891 811
Industrial Biosciences 301 1,224 326 305 304 289 1,180 300 292 300 288 705 289 293 123 -
Nutrition & Health 861 3,473 872 868 865 868 3,422 853 876 885 808 2,460 806 844 486 324
Performance Chemicals 1,532 6,703 1,616 1,720 1,782 1,585 7,188 1,588 1,732 1,968 1,900 7,794 1,860 2,142 1,995 1,797
Performance Materials 1,593 6,468 1,576 1,663 1,670 1,559 6,447 1,534 1,614 1,699 1,600 6,815 1,618 1,745 1,745 1,707
Safety & Protection 947 3,884 975 985 1,017 907 3,825 964 934 986 941 3,934 943 1,001 1,025 965
Other 1 6 1 1 3 1 5 1 2 1 1 40 1 2 1 36 Total Segment Sales 10,209 36,046 7,814 7,813 9,925 10,494 35,194 7,397 7,480 10,022 10,295 34,087 7,444 8,236 9,263 9,144
Elimination of Transfers (81) (312) (67) (78) (81) (86) (382) (72) (90) (105) (115) (406) (101) (98) (104) (103)
CONSOLIDATED NET SALES 10,128 35,734 7,747 7,735 9,844 10,408 34,812 7,325 7,390 9,917 10,180 33,681 7,343 8,138 9,159 9,041
Note: The data above provides a historical display of selected data included in our Quarterly Earnings Release financials.

33
E. I. DU PONT DE NEMOURS AND COMPANY AND CONSOLIDATED SUBSIDIARIES
INCOME FROM CONTINUING OPERATIONS (UNAUDITED) (dollars in millions)
SEGMENT PRETAX OPERATING INCOME (LOSS) Year Year Year 1Q14 2013 4Q13 3Q13 2Q13 1Q13 2012 4Q12 3Q12 2Q12 1Q12 2011 4Q11 3Q11 2Q11 1Q11
Agriculture 1,442 2,132 (108) (102) 861 1,481 1,669 (103) (198) 682 1,288 1,566 (222) (184) 843 1,129
Electronics & Communications 75 203 (38) 97 95 49 222 41 (99) 221 59 438 61 120 126 131
Industrial Biosciences 56 170 41 45 43 41 159 41 37 42 39 2 34 (26) (6) -
Nutrition & Health 93 305 87 81 61 76 270 22 64 105 79 76 54 (20) 14 28
Performance Chemicals 200 924 227 182 264 251 1,778 203 410 594 571 2,114 484 639 556 435
Performance Materials 299 1,281 279 374 336 292 1,121 270 230 344 277 1,079 221 263 285 310
Safety & Protection 175 694 213 171 172 138 562 130 92 181 159 661 131 162 184 184
Other (92) (340) (91) (107) (55) (87) (412) (80) (75) (208) (49) (55) (11) (32) 22 (34)
TOTAL SEGMENT PRETAX OPERATING INCOME 2,248 5,369 610 741 1,777 2,241 5,369 524 461 1,961 2,423 5,881 752 922 2,024 2,183
Net Exchange (Losses) Gains (96) (128) (73) (101) 35 11 (215) (54) (130) 50 (81) (146) (14) 6 3 (141)
Non-Operating Pension & OPEBs Costs (30) (539) (124) (142) (126) (147) (654) (147) (157) (174) (176) (540) (135) (135) (135) (135)
Corporate Expenses (217) (765) (183) (162) (206) (214) (948) (240) (233) (224) (251) (869) (166) (194) (291) (218)
Interest Expense (103) (448) (108) (108) (115) (117) (464) (117) (116) (117) (114) (447) (116) (116) (115) (100)
INCOME (LOSS) FROM CONTINUING OPERATIONS BEFORE INCOME TAXES 1,802 3,489 122 228 1,365 1,774 3,088 (34) (175) 1,496 1,801 3,879 321 483 1,486 1,589
(Provision For) Benefit From Income Taxes on Continuing Operations (357) (626) 61 35 (335) (387) (616) 38 135 (397) (392) (647) (15) (82) (326) (224)
INCOME (LOSS) FROM CONTINUING OPERATIONS
AFTER INCOME TAXES 1,445 2,863 183 263 1,030 1,387 2,472 4 (40) 1,099 1,409 3,232 306 401 1,160 1,365
Note: The data above provides a historical display of selected data included in our Quarterly Earnings Release financials.

34
E. I. DU PONT DE NEMOURS AND COMPANY AND CONSOLIDATED SUBSIDIARIES
OPERATING EARNINGS (UNAUDITED) (dollars in millions)
SEGMENT OPERATING EARNINGS Year Year Year 1Q14 2013 4Q13 3Q13 2Q13 1Q13 2012 4Q12 3Q12 2Q12 1Q12 2011 4Q11 3Q11 2Q11 1Q11
Agriculture 1,442 2,483 88 (62) 941 1,516 2,138 (77) (70) 947 1,338 1,791 (122) (59) 843 1,129
Electronics & Communications 75 334 93 97 95 49 259 43 58 99 59 438 61 120 126 131
Industrial Biosciences 56 169 40 45 43 41 162 41 40 42 39 81 35 35 11 -
Nutrition & Health 93 299 81 81 61 76 319 58 77 105 79 202 58 69 47 28
Performance Chemicals 200 998 229 254 264 251 1,814 236 413 594 571 2,114 484 639 556 435
Performance Materials 299 1,297 295 374 336 292 1,225 273 331 344 277 1,032 174 263 285 310
Safety & Protection 175 690 209 171 172 138 620 133 147 181 159 661 131 162 184 184
Other (92) (345) (96) (107) (55) (87) (286) (91) (75) (71) (49) (27) (1) (14) 22 (34)
TOTAL SEGMENT OPERATING EARNINGS 2,248 5,925 939 853 1,857 2,276 6,251 616 921 2,241 2,473 6,292 820 1,215 2,074 2,183
Corporate Expenses (201) (762) (191) (162) (195) (214) (864) (215) (174) (224) (251) (813) (166) (191) (238) (218)
Interest Expense (103) (448) (108) (108) (115) (117) (464) (117) (116) (117) (114) (447) (116) (116) (115) (100)
OPERATING EARNINGS BEFORE INCOME TAXES AND EXCHANGE GAINS (LOSSES) 1,944 4,715 640 583 1,547 1,945 4,923 284 631 1,900 2,108 5,032 538 908 1,721 1,865
Provision For Income Taxes on Operating Earnings, Excluding Taxes on Exchange Gains (Losses) (398) (983) (43) (111) (373) (456) (1,190) (61) (164) (460) (505) (1,137) (155) (177) (401) (404)
Net After-tax Exhange (Losses) Gains (68) (86) (39) (43) 19 (23) (142) (29) (59) (10) (44) (65) (34) (36) 11 (6)
Less: Net Income Attr. to Noncontrolling Interests 6 14 - 3 4 7 25 1 3 9 12 40 3 11 13 13
OPERATING EARNINGS 1,472 3,632 558 426 1,189 1,459 3,566 193 405 1,421 1,547 3,790 346 684 1,318 1,442
Net Income Attributable to Noncontrolling Interests 6 14 - 3 4 7 25 1 3 9 12 40 3 11 13 13
Non-Operating Pension & OPEB Costs - After-tax (21) (360) (81) (95) (85) (99) (439) (99) (106) (116) (118) (361) (90) (91) (90) (90)
Significant Items - After-tax (12) (423) (294) (71) (78) 20 (680) (91) (342) (215) (32) (237) 47 (203) (81) -
INCOME (LOSS) FROM CONTINUING OPERATIONS
AFTER INCOME TAXES 1,445 2,863 183 263 1,030 1,387 2,472 4 (40) 1,099 1,409 3,232 306 401 1,160 1,365
Note: The data above provides a historical display of selected data included in our Quarterly Earnings Release financials.

35
E. I. DU PONT DE NEMOURS AND COMPANY AND CONSOLIDATED SUBSIDIARIES
SIGNIFICANT ITEMS BY SEGMENT - PRETAX OPERATING INCOME (UNAUDITED)
(dollars in millions)
SEGMENT PRETAX IMPACT OF Year Year Year
SIGNIFICANT ITEMS 1Q14 2013 4Q13 3Q13 2Q13 1Q13 2012 4Q12 3Q12 2Q12 1Q12 2011 4Q11 3Q11 2Q11 1Q11
Agriculture - (351) (196) (40) (80) (35) (469) (26) (128) (265) (50) (225) (100) (125) - -
Electronics & Communications - (131) (131) - - - (37) (2) (157) 122 - - - - - -
Industrial Biosciences - 1 1 - - - (3) - (3) - - (79) (1) (61) (17) -
Nutrition & Health - 6 6 - - - (49) (36) (13) - - (126) (4) (89) (33) -
Performance Chemicals - (74) (2) (72) - - (36) (33) (3) - - - - - - -
Performance Materials - (16) (16) - - - (104) (3) (101) - - 47 47 - - -
Safety & Protection - 4 4 - - - (58) (3) (55) - - - - - - -
Other - 5 5 - - - (126) 11 - (137) - (28) (10) (18) - -
TOTAL SIGNIFICANT ITEMS
BY SEGMENT - PRETAX - (556) (329) (112) (80) (35) (882) (92) (460) (280) (50) (411) (68) (293) (50) -
Note: The data above provides a historical display of significant items included in our Quarterly Earnings Release financials.

36
E. I. DU PONT DE NEMOURS AND COMPANY AND CONSOLIDATED SUBSIDIARIES
RECONCILIATION OF NON-GAAP MEASURES (UNAUDITED) (dollars in millions, except per share)
Year Year Year 1Q14 2013 4Q13 3Q13 2Q13 1Q13 2012 4Q12 3Q12 2Q12 1Q12 2011 4Q11 3Q11 2Q11 1Q11
RECONCILIATION OF DILUTED EPS (1)
Operating EPS 1.58 3.88 0.59 0.45 1.28 1.56 3.77 0.20 0.43 1.50 1.64 4.02 0.37 0.72 1.39 1.53
Non-Operating Pension & OPEB Costs (0.03) (0.39) (0.09) (0.09) (0.10) (0.11) (0.46) (0.11) (0.11) (0.12) (0.12) (0.39) (0.10) (0.10) (0.10) (0.10)
Significant Items (0.01) (0.45) (0.31) (0.08) (0.08) 0.02 (0.72) (0.09) (0.37) (0.23) (0.04) (0.25) 0.05 (0.21) (0.08) -
GAAP EPS from continuing operations 1.54 3.04 0.19 0.28 1.10 1.47 2.59 - (0.05) 1.15 1.48 3.38 0.32 0.41 1.21 1.43
RECONCILIATION OF SEGMENT PTOI
Segment Operating Earnings 2,248 5,925 939 853 1,857 2,276 6,251 616 921 2,241 2,473 6,292 820 1,215 2,074 2,183
Significant Items included in Segment PTOI - (556) (329) (112) (80) (35) (882) (92) (460) (280) (50) (411) (68) (293) (50) -
Segment PTOI 2,248 5,369 610 741 1,777 2,241 5,369 524 461 1,961 2,423 5,881 752 922 2,024 2,183
RECONCILIATION OF ADJUSTED EBIT / ADJUSTED EBITDA TO CONSOLIDATED INCOME STATEMENTS
Income (Loss) From Continuing Operations Before Income Taxes 1,802 3,489 122 228 1,365 1,774 3,088 (34) (175) 1,496 1,801 3,879 321 483 1,486 1,589
Add: Significant Items - Pretax - (Benefit) / Charge 16 559 321 112 91 35 966 117 519 280 50 467 68 296 103 -
Add: Non-Operating Pension & OPEB Costs - Pretax 30 539 124 142 126 147 654 147 157 174 176 540 135 135 135 135
Operating Earnings Before Income Taxes 1,848 4,587 567 482 1,582 1,956 4,708 230 501 1,950 2,027 4,886 524 914 1,724 1,724
Less: Net Income Attributable to Noncontrolling Interests 6 14 - 3 4 7 25 1 3 9 12 40 3 11 13 13
Add: Interest Expense 103 448 108 108 115 117 464 117 116 117 114 447 116 116 115 100
Adjusted EBIT (Operating Earnings) 1,945 5,021 675 587 1,693 2,066 5,147 346 614 2,058 2,129 5,293 637 1,019 1,826 1,811
Add: Depreciation and Amortization 437 1,603 387 379 404 433 1,631 394 393 417 427 1,451 393 367 356 335
Adjusted EBITDA (Operating Earnings) 2,382 6,624 1,062 966 2,097 2,499 6,778 740 1,007 2,475 2,556 6,744 1,030 1,386 2,182 2,146
(1) Earnings per share for the year may not equal the sum of quarterly earnings per share due to changes in average share calculations.

37
E. I. DU PONT DE NEMOURS AND COMPANY AND CONSOLIDATED SUBSIDIARIES
RECONCILIATION OF NON-GAAP MEASURES (UNAUDITED)
(dollars in millions)
Mar-14 Dec-13 Sep-13 Jun-13 Mar-13 Dec-12 Sep-12 Jun-12 Mar-12 Dec-11 Sep-11 Jun-11 Mar-11
CALCULATION OF NET DEBT
Cash and Cash Equivalents 3,782 8,941 7,005 6,685 6,555 4,284 3,418 3,506 3,410 3,586 2,750 2,268 3,796
Marketable Securities 67 145 184 211 26 123 105 50 191 433 229 214 1,026
Total Cash 3,849 9,086 7,189 6,896 6,581 4,407 3,523 3,556 3,601 4,019 2,979 2,482 4,822
Short-Term Borrowings and Capital Lease Obligations 2,019 1,721 4,204 3,315 2,006 1,275 4,564 3,696 3,593 817 3,301 2,336 2,137
Long-Term Borrowings and Capital Lease Obligations 9,298 10,741 10,755 10,765 11,279 10,465 10,502 11,254 11,232 11,736 12,200 12,460 10,114
Total Debt 11,317 12,462 14,959 14,080 13,285 11,740 15,066 14,950 14,825 12,553 15,501 14,796 12,251
Debt (Net of all Cash) 7,468 3,376 7,770 7,184 6,704 7,333 11,543 11,394 11,224 8,534 12,522 12,314 7,429
Year Year Year
1Q14 2013 4Q13 3Q13 2Q13 1Q13 2012 4Q12 3Q12 2Q12 1Q12 2011 4Q11 3Q11 2Q11 1Q11
CALCULATION OF FREE CASH FLOW
Cash (Used for) Provided by Operating Activities (2,421) 3,179 5,512 298 36 (2,667) 4,849 5,275 691 760 (1,877) 5,152 4,721 1,075 840 (1,484)
Less: Purchases of Property, Plant and Equipment 320 1,882 659 466 436 321 1,793 654 443 395 301 1,843 632 470 418 323
Free Cash Flow (2,741) 1,297 4,853 (168) (400) (2,988) 3,056 4,621 248 365 (2,178) 3,309 4,089 605 422 (1,807)

38

39
E. I. DUPONT DE NEMOURS AND COMPANY AND CONSOLIDATED SUBSIDIARIES
RECONCILIATION OF BASE INCOME TAX RATE TO EFFECTIVE INCOME TAX RATE (UNAUDITED)
Base income tax rate is defined as the effective income tax rate less the effect of exchange gains (losses), significant items and non-operating pension/OPEB costs.
Three months ended March 31, Year ended December 31,
2014 2013 2014
Outlook(1) 2013 Actual
Effective income tax rate 19.8% 21.8% 21.4% 17.9%
Significant items effect and non-operating pension/OPEB costs effect 0.2% 3.3% 0.5% 2.6%
Tax rate, from continuing operations, before significant items and non-operating pension/OPEB costs
20.0% 25.1% 21.9% 20.5%
Exchange gains (losses) effect (2) 0.5% (1.7%) 0.1% 0.3%
Base income tax rate from continuing operations 20.5% 23.4% 22.00% 20.8%
(1) Represents the company's anticipated full year tax rates. (2) For the 2014 outlook, the effect of exchange gains (losses) on the company’s full year effective income tax rate reflects actual exchange gains (losses) from the first quarter 2014 only.

40
Copyright © 2014 DuPont. All rights reserved. The DuPont Oval Logo, DuPontTM, The miracles of scienceTM, and all products denoted with ® or M are trademarks or registered trademarks of E. I. du Pont de Nemours and Company.