wells fargo private bank provides financial services and products through wells fargo bank, n.a. and...
TRANSCRIPT

Wells Fargo Private Bank provides financial services and products through Wells Fargo Bank, N.A. and its various affiliates and subsidiaries. Wells Fargo & Company and its affiliates do not provide legal advice. Please consult your legal advisors to determine how this information may apply to your own situation. Whether any planned tax result is realized by you depends on the specific facts of your situation at the time your tax preparer submits your return.
1 200907125 TPB-IM21019 (08/09)
Wells Fargo Wealth Management2010 Utah Economic Summit for Nonprofits
Economic and Market Strategy Update | April 2010
Rees L. Petersen, CFA, CIMCVice President, Regional Investment Manager
Please be sure to read the important disclosures at the end of this presentation
A Note about Disclosures

2
Investment strategies to consider for your organization.
Where are we in this market cycle?
Today’s Agenda
Where are we in this economic cycle?
3
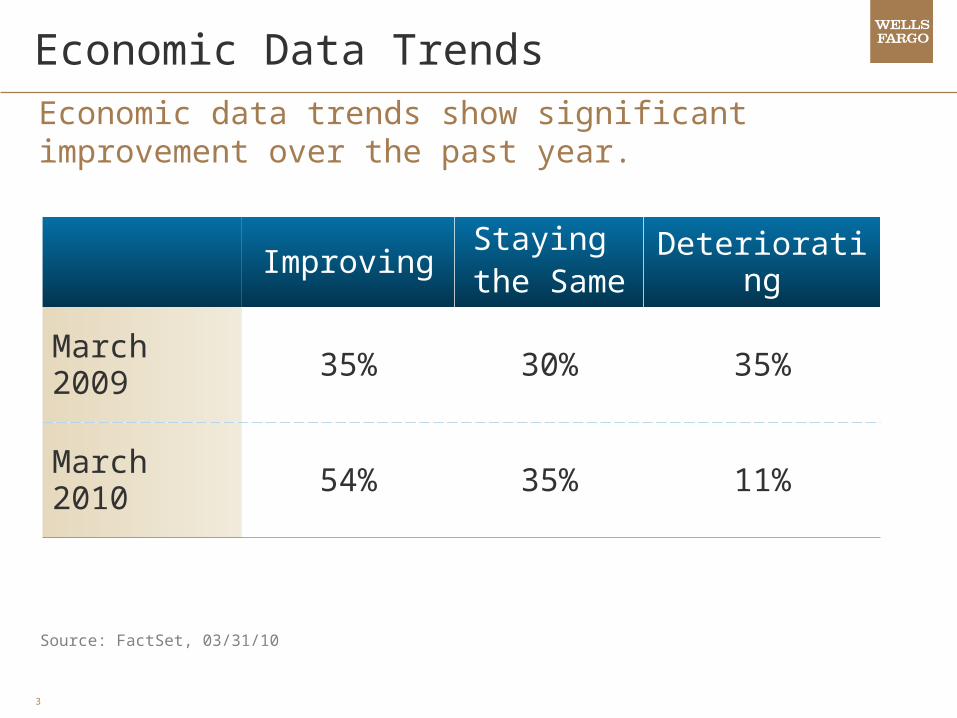
Economic Data Trends
ImprovingStaying
the SameDeteriorating
March 2009 35% 30% 35%
March 2010 54% 35% 11%
Economic data trends show significant improvement over the past year.
Source: FactSet, 03/31/10
4
-8
-6
-4
-2
0
2
4
6
8
3/30/2007 3/1/2008 3/1/2009 3/10/2010-1.5
-1
-0.5
0
0.5
1
1.5
GDP
LEI (Adv 6 mos)
Annualiz
ed Q
uart
erl
y C
hange (
%)
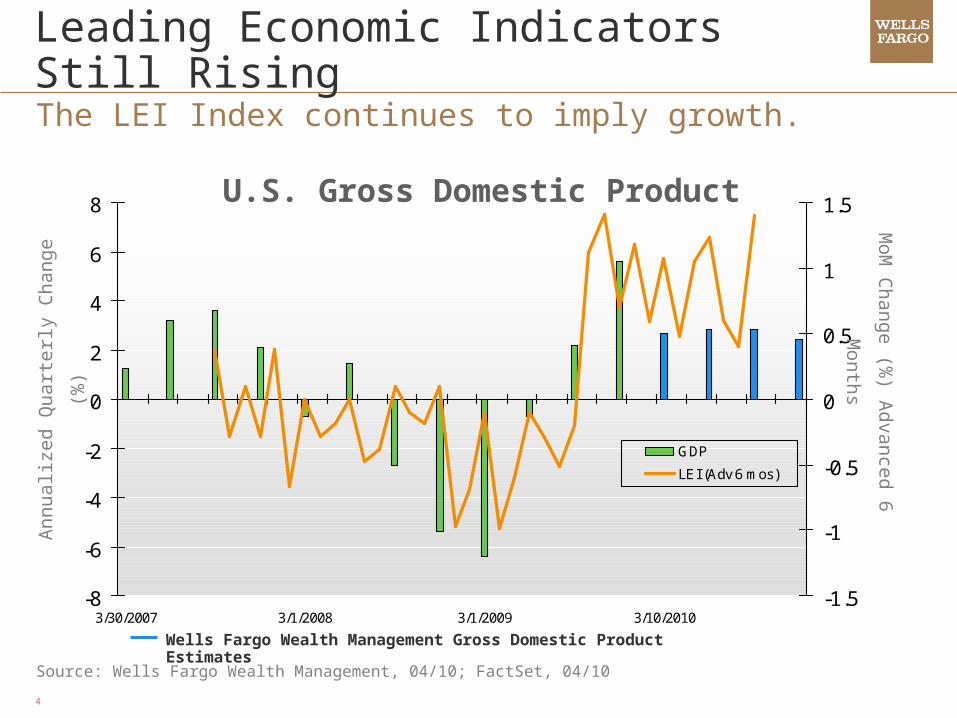
Source: Wells Fargo Wealth Management, 04/10; FactSet, 04/10
U.S. Gross Domestic Product
Wells Fargo Wealth Management Gross Domestic Product Estimates
MoM
Change (%
) Ad
vance
d 6
Month
s
Leading Economic Indicators Still RisingThe LEI Index continues to imply growth.
5
300
600
900
1200
1500
Feb-00 Feb-01 Feb-02 Feb-03 Feb-04 Feb-05 Feb-06 Feb-07 Feb-08 Feb-09 Feb-10
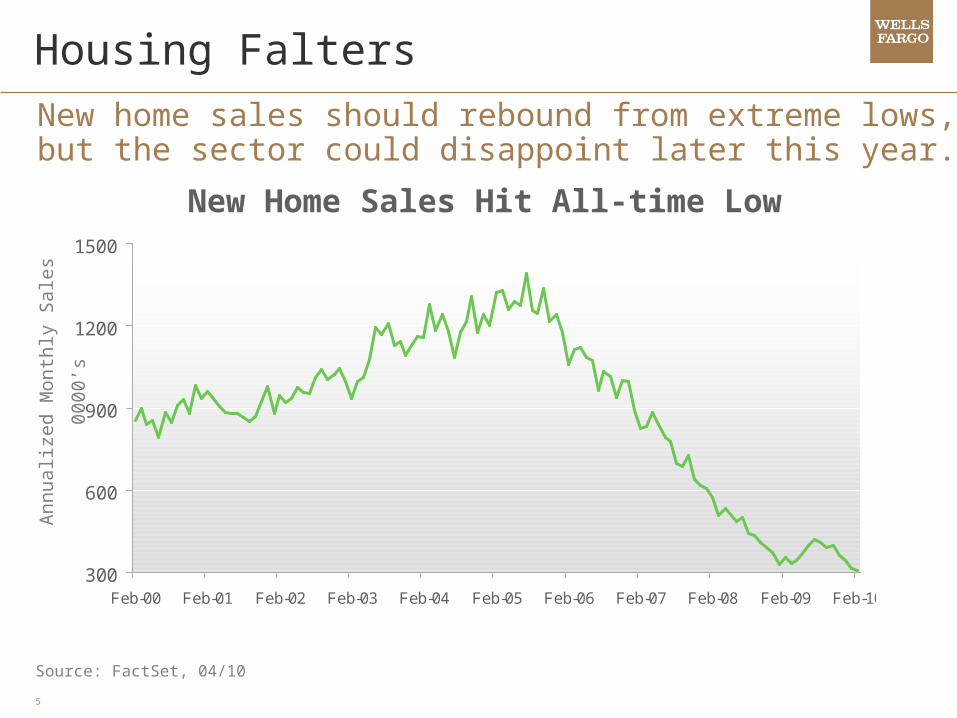
Housing Falters
Source: FactSet, 04/10
Annualiz
ed M
onth
ly S
ale
s 00
00’s
New home sales should rebound from extreme lows, but the sector could disappoint later this year.
New Home Sales Hit All-time Low

6
Unemployment claims are dropping more rapidly than they did in the prior two recessions.
350
380
410
440
470
500
530
560
590
620
650
Nov-08 Feb-09 May-09 Aug-09 Nov-09 Feb-10 May-10
U.S. Initial Unemployment Claims*
Source: ISI, 04/10; FactSet, 4/10
Init
ial C
laim
s (0
00),
4 W
k. A
ve.
Employment Situation Improving
1991 & 2002 Avg
*Prior cyclical peaks are indexed to the 643 peak of the current cycle.
Apr. 2, 2010
1983
7
-4
-3
-2
-1
0
1
2
3
4
Jun-07 Jun-08 Jun-09-4
-3
-2
-1
0
1
2
3
4
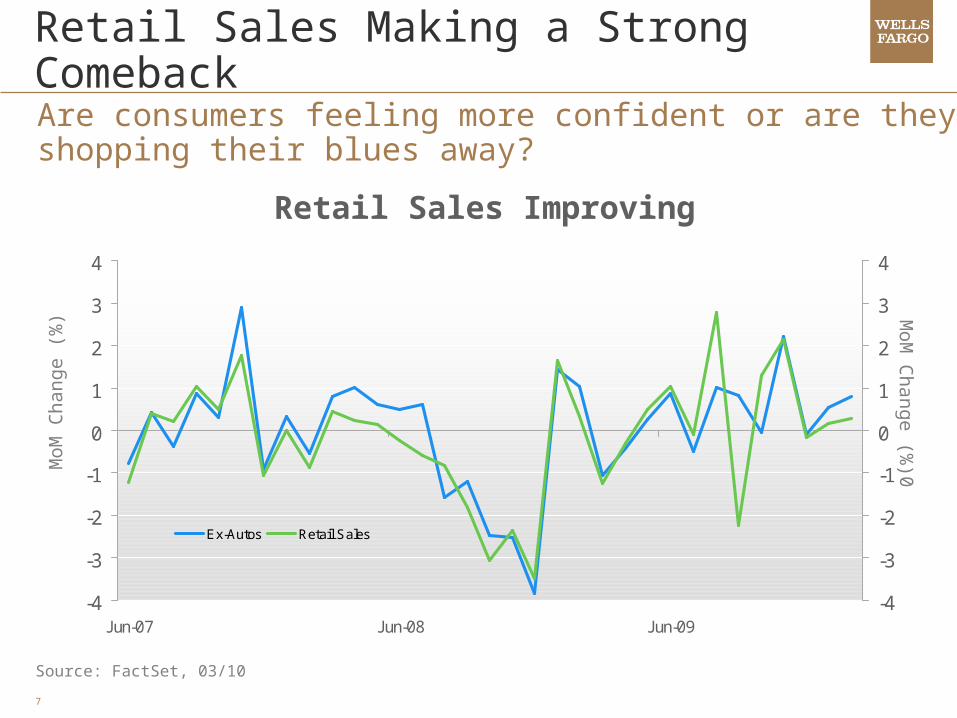
Ex-Autos Retail Sales
Retail Sales Making a Strong Comeback
Source: FactSet, 03/10
MoM
Change (
%)
Are consumers feeling more confident or are they shopping their blues away?
Retail Sales Improving
MoM
Change (%
)0

8
0
25000
50000
75000
Dec-99 Dec-01 Dec-03 Dec-05 Dec-07 Dec-09
$ B
illio
ns
Asset Prices are RisingImproving capital markets and stabilizing house prices are helping consumers’ net worth recover.
Household Net Worth is Rebounding
Source: Wells Fargo Wealth Management, Federal Reserve Board, 04/10
9
10.0
11.0
12.0
13.0
14.0
Dec-99 Dec-01 Dec-03 Dec-05 Dec-07 Dec-09
In P
erc
en
t (%
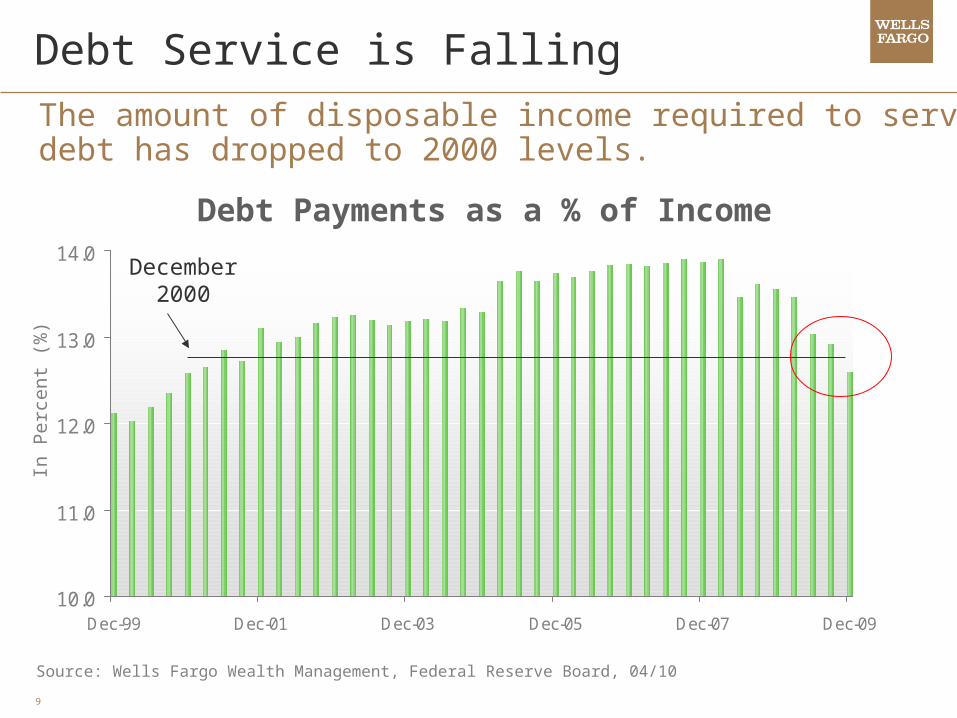
)Debt Service is Falling
Source: Wells Fargo Wealth Management, Federal Reserve Board, 04/10
Debt Payments as a % of Income
December 2000
The amount of disposable income required to servicedebt has dropped to 2000 levels.
10
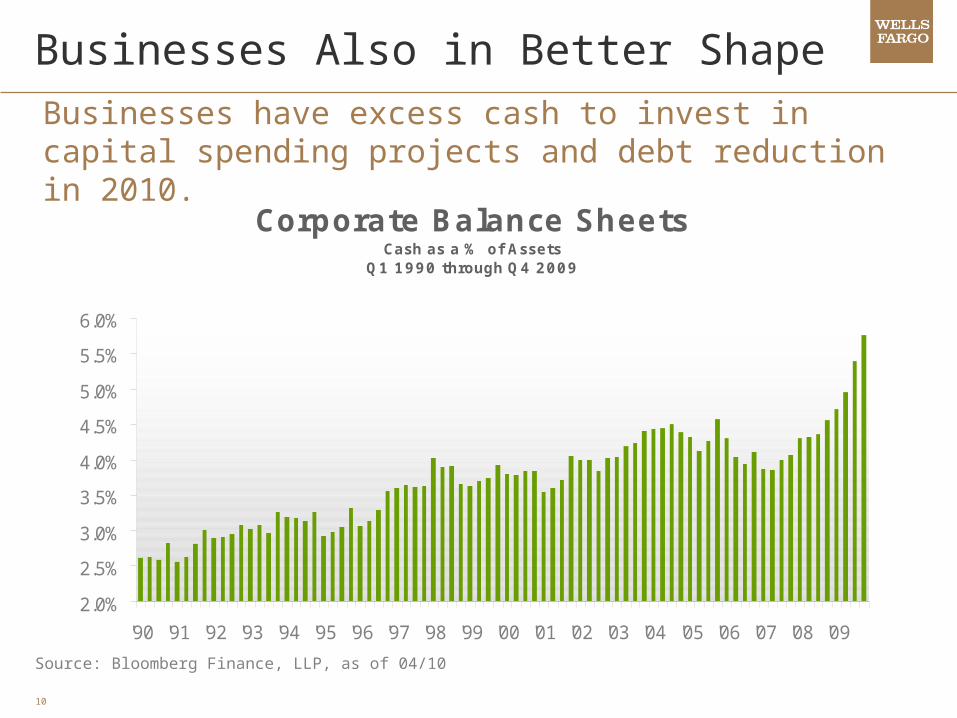
Corporate Balance Sheets Cash as a % of Assets
Q1 1990 through Q4 2009
2.0%
2.5%
3.0%
3.5%
4.0%
4.5%
5.0%
5.5%
6.0%
'90 '91 '92 '93 '94 '95 '96 '97 '98 '99 '00 '01 '02 '03 '04 '05 '06 '07 '08 '09
Businesses Also in Better ShapeBusinesses have excess cash to invest in capital spending projects and debt reduction in 2010.
Source: Bloomberg Finance, LLP, as of 04/10

11
Source: FactSet, 04/10
As business activity picks up, profits and new hires are increasing.
Business Surveys Show Expansion
30
35
40
45
50
55
60
65
Mar-00 Mar-01 Mar-02 Mar-03 Mar-04 Mar-05 Mar-06 Mar-07 Mar-08 Mar-09 Mar-10
30
35
40
45
50
55
60
65
Manufacturing Service
ISM
Manu
fact
uri
ng Ind
ex IS
M N
on-Manufacturing Index
Manufacturing and Services Expanding

12
$288B$275B
$224B
$99.1B$88.6B
$120.2B
0
50
100
150
200
250
300
350
Tax Benefits Contracts, Grants, Loans Entitlements
Funded Paid OutSource: www.recovery.gov, 02/10
U.S. Stimulus Funding
Lots of Stimulus Still in the PipelineMore than one half of the U.S. stimulus has yet to bedistributed.
$ b
illio
ns
13
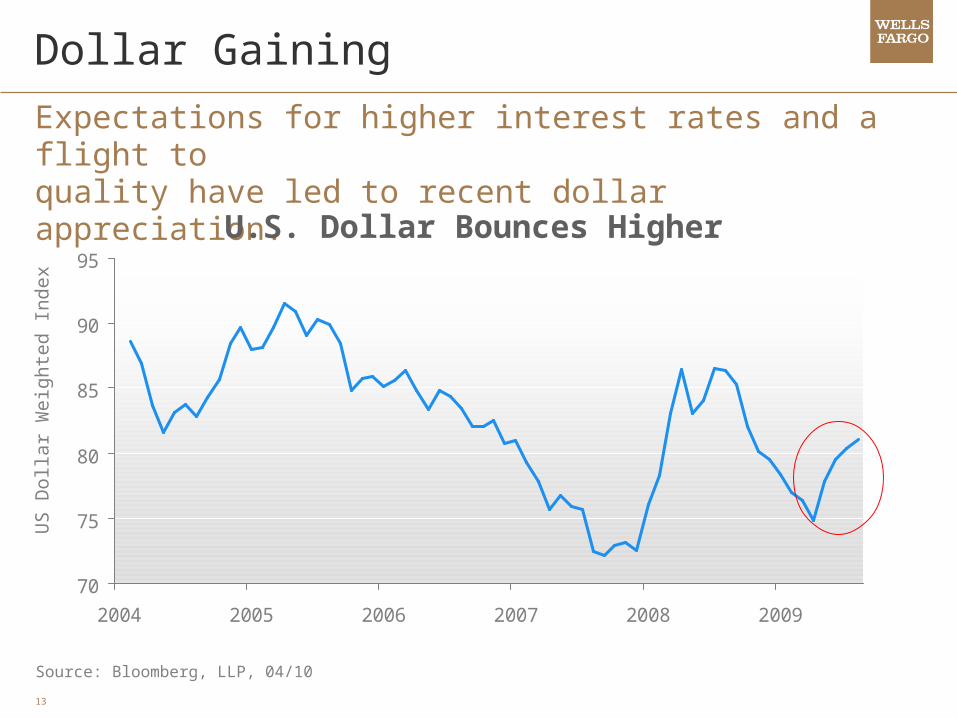
Expectations for higher interest rates and a flight to quality have led to recent dollar appreciation.
70
75
80
85
90
95
2004 2005 2006 2007 2008 2009
U.S. Dollar Bounces Higher
Source: Bloomberg, LLP, 04/10
US D
olla
r W
eig
hte
d Index
Dollar Gaining
14
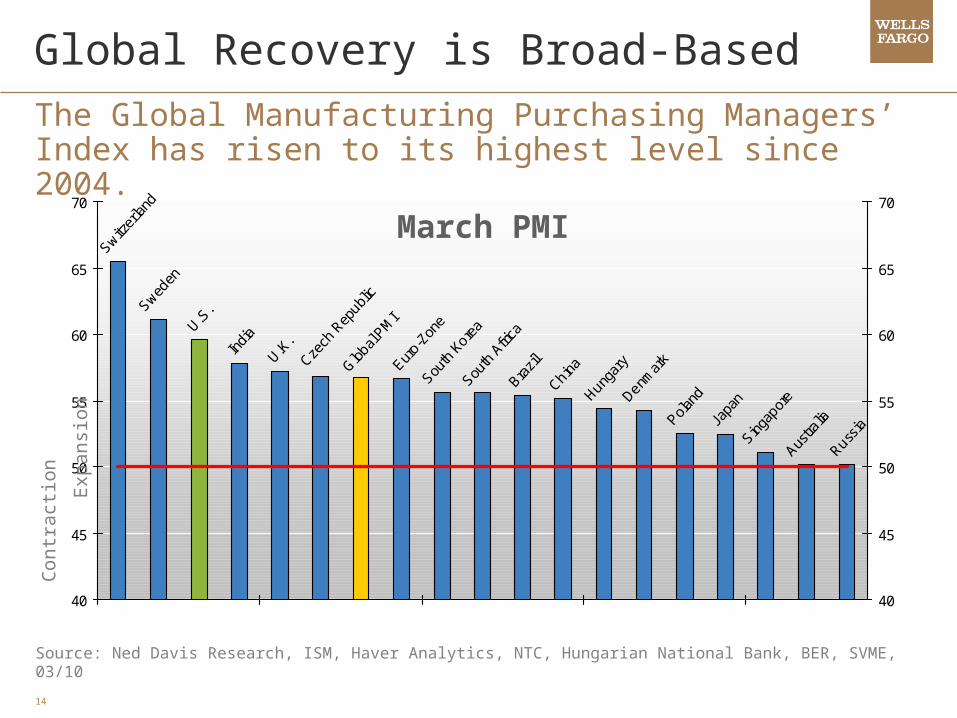
Global Recovery is Broad-Based The Global Manufacturing Purchasing Managers’ Index has risen to its highest level since 2004.
Sweden
U.S.
Indi
a
U.K.
Brazi
lChin
aHung
ary
Denmar
kPol
and
Japa
nSin
gapor
eAus
tralia
Russia
Glo
bal P
MI
Euro-Z
one
South
Kore
aSou
th A
frica
Switzer
land
Czech
Rep
ublic
40
45
50
55
60
65
70
40
45
50
55
60
65
70
Contr
act
ion
E
xpansi
on
March PMI
Source: Ned Davis Research, ISM, Haver Analytics, NTC, Hungarian National Bank, BER, SVME, 03/10

15
GDP Growth Rates
Source: IMF, World Economic Outlook, 10/09
Perc
en
t of
Tota
l G
lobal G
DP
Emerging Economies are Growing FastEmerging economies fared better during the crisis than developed economies and are recovering more quickly.
-9
-6
-3
0
3
6
9
12
2006 2007 2008 2009 2010 2011 2012
Advanced economies Emerging economies

16
Relative Contributions Changing The relative share of global output from emerging economies has gained over the past decade.
Contribution to Global Output1
Perc
en
t of
Tota
l G
lobal G
DP
49%54%
63%
51%46%
37%
0%
10%
20%
30%
40%
50%
60%
70%
2000 2009(e) 2014(e)Developed Emerging Economies
1 PPP Gross domestic product based on purchasing-power-parity (PPP) share of world total, 2009 IMF estimates
Source: IMF, World Economic Outlook, 10/09

17
Investment strategies to consider for your organization.
Where are we in this market cycle?
Today’s Agenda
Where are we in this economic cycle?

18
2010 Forecasts We see equity market gains in 2010, supported by a solid rebound in earnings growth.
Equity Market Forecasts
2008(a) 2009(a) 2010(e)
S&P 500 903 1115 1275
Russell 2000 499 625 700
MSCI EAFE 1237 1581 1770
MSCI EM 567 989 1140
Volatility (VIX Index) 40 22 23
Index price at December 31Note: An index is not managed and unavailable for direct investment.a: actual; e: estimate
Source: Bloomberg Finance, LLP, as of 01/10

19
'87-'00
'47-'57
'62-'66
'70-'73
'82-'87
'02-'07Current
'57-'61
'66-'68'74-'80
Average
0%
100%
200%
300%
400%
500%
600%
700%
0 20 40 60 80 100 120 140 160Bull Market Length (Months)
Bu
ll M
ark
et
Retu
rn
A larger circle represents a longer bull market
Average Bull Market: 68 Months, 178%
Current Bull Market: 13 Months, 73%
Bull Markets Historical PerspectiveThe latest bull market is off to a good start. History shows we may only be in the early stages.
Source: Bloomberg Finance LLP, as of 02/10
Past Performance is no guarantee of future results.

20
Equities vs. Fed Tightening Contrary to popular belief, Fed rate hikes do not always lead to poor equity market performance.
S&P 500 Returns after Initial Fed Rate HikesData from 1928-2009
4.8
8.610
7
1213
9
12
76
1.60.6
0.0
2.0
4.0
6.0
8.0
10.0
12.0
14.0
3 Months 6 Months 9 Months 12 MonthsAverage % Return Positive Return Periods Negative Return Periods
Source: Ned Davis Research, as of 03/10
% C
hange /
# D
ays
Past Performance is no guarantee of future results.
21
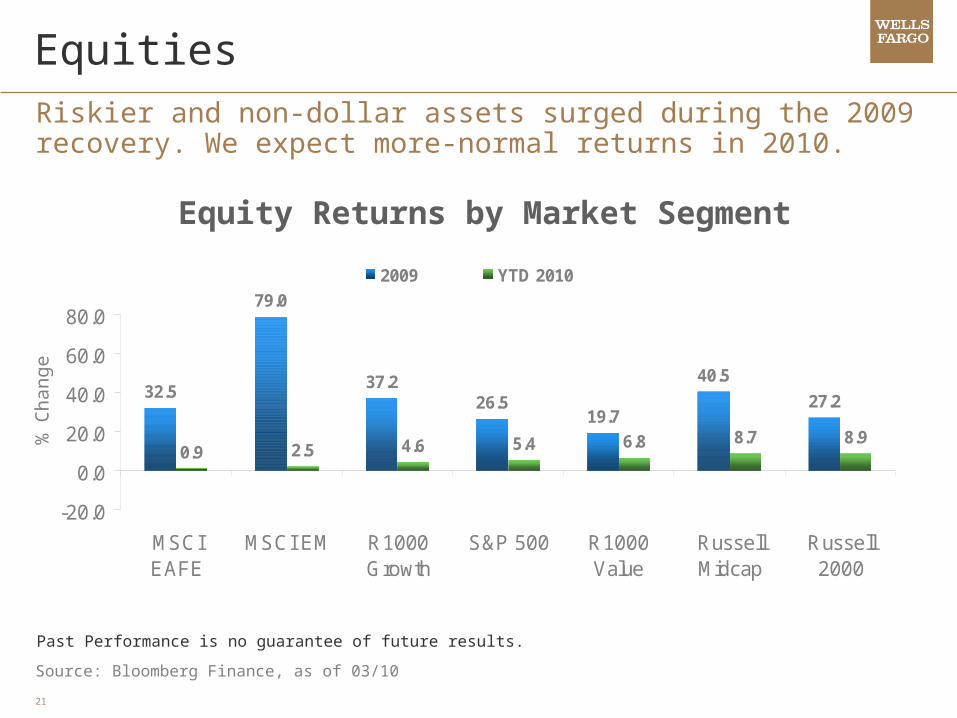
Equities Riskier and non-dollar assets surged during the 2009 recovery. We expect more-normal returns in 2010.
Equity Returns by Market Segment
37.226.5
19.7
40.5
27.2
79.0
32.5
8.98.76.85.44.62.50.9
-20.0
0.0
20.0
40.0
60.0
80.0
MSCIEAFE
MSCI EM R1000Growth
S&P 500 R1000Value
RussellMidcap
Russell2000
2009 YTD 2010
Source: Bloomberg Finance, as of 03/10
% C
hange
Past Performance is no guarantee of future results.
22
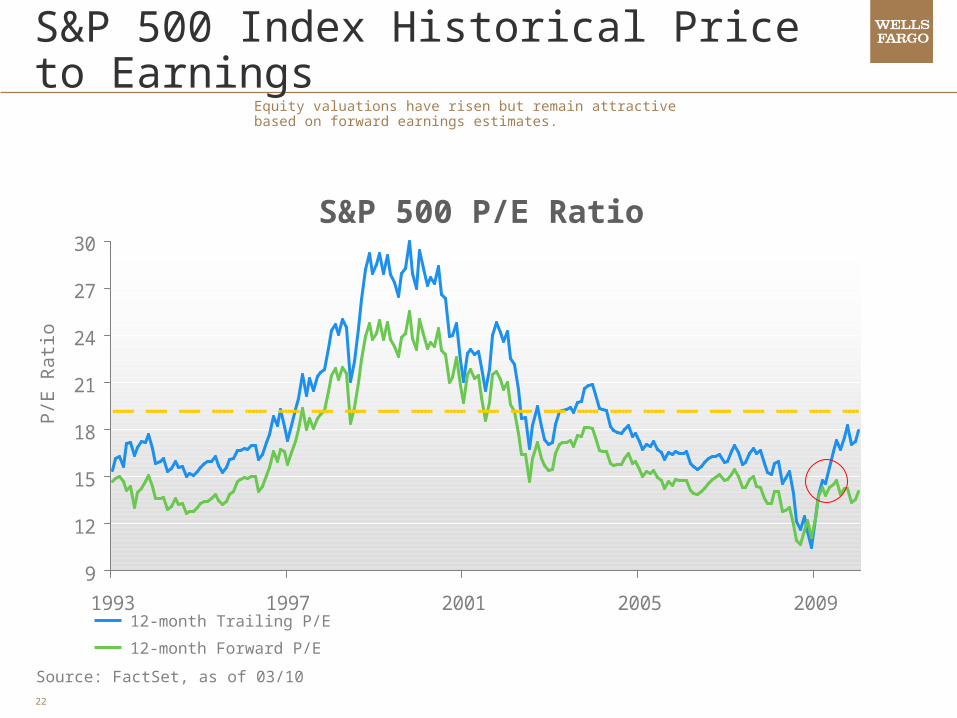
S&P 500 Index Historical Price to EarningsEquity valuations have risen but remain attractive based on forward earnings estimates.
Source: FactSet, as of 03/10
P/E
Rati
o
9
12
15
18
21
24
27
30
1993 1997 2001 2005 2009
S&P 500 P/E Ratio
12-month Trailing P/E
12-month Forward P/E
23
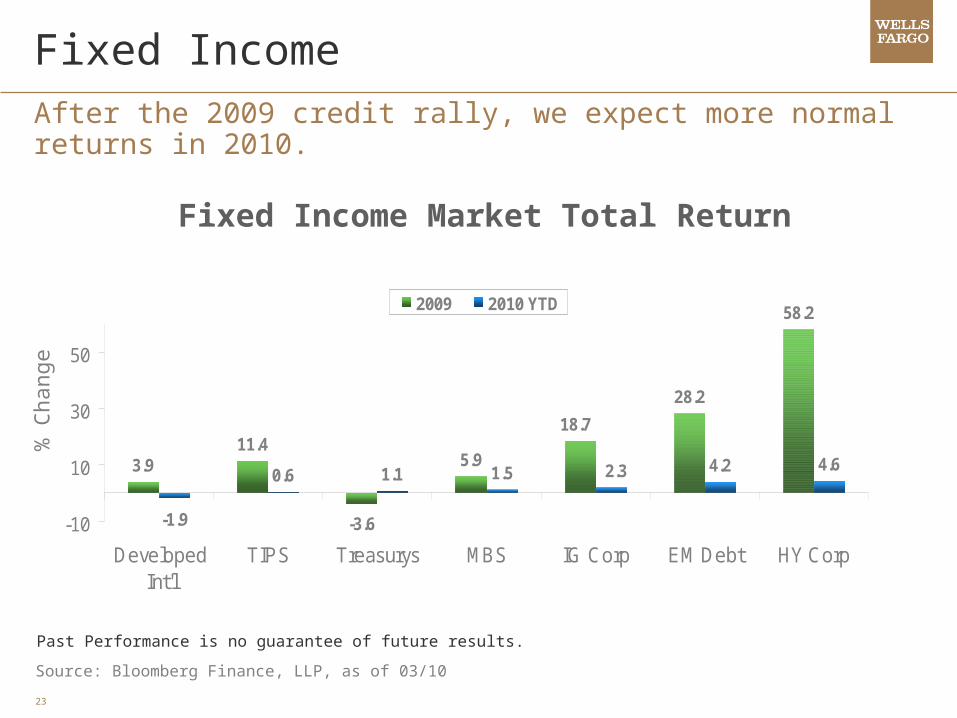
Fixed Income After the 2009 credit rally, we expect more normalreturns in 2010.
Fixed Income Market Total Return
3.911.4
-3.6
5.9
28.2
58.2
1.1 1.5 4.2 4.6
18.7
2.3
-1.9
0.6
-10
10
30
50
DevelopedInt'l
TIPS Treasurys MBS IG Corp EM Debt HY Corp
2009 2010 YTD
Source: Bloomberg Finance, LLP, as of 03/10
% C
hange
Past Performance is no guarantee of future results.
24
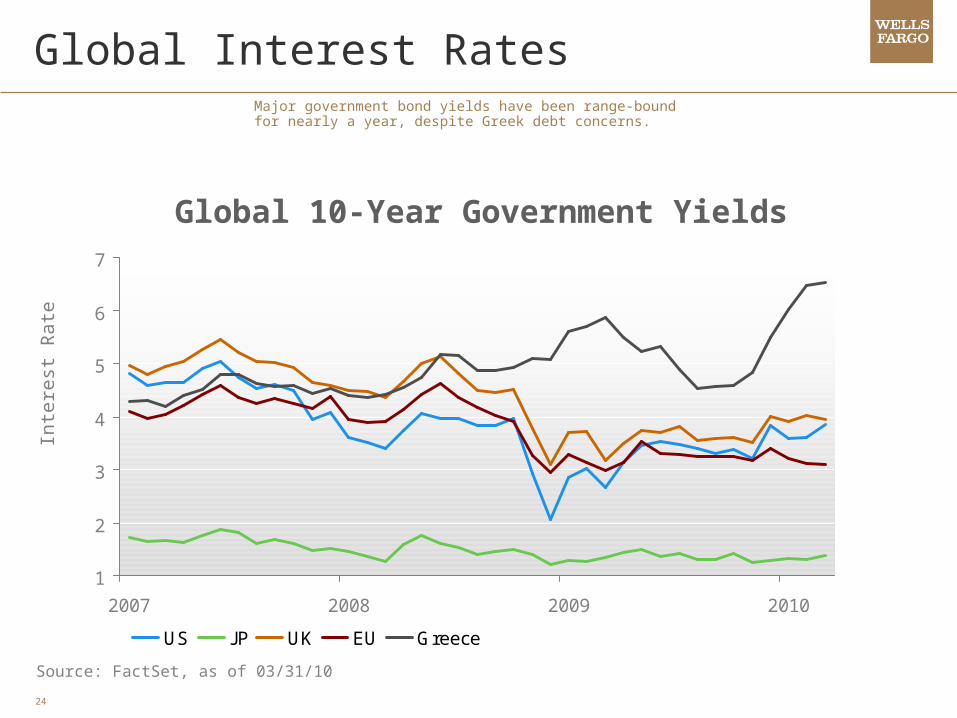
Global Interest RatesMajor government bond yields have been range-bound for nearly a year, despite Greek debt concerns.
Source: FactSet, as of 03/31/10
Inte
rest
Rate
1
2
3
4
5
6
7
2007 2008 2009 2010
US J P UK EU Greece
Global 10-Year Government Yields

25
600
800
1000
1200
1400
1600
2006 2007 2008 2009
0
100
200
300
400
500
600
700
Source: Bloomberg Finance, LLP, Barclays Capital, as of 03/31/10
Relationship Between Equity and Credit Credit markets have returned to pre-crisis levels.We expect equity markets to follow.
S&
P 5
00
In
dex
S&P 500 and Investment Grade Corporate Bond Spreads (Inverted)
Investment Grade Corporate Bond Spreads
S&P 500 Index
Investm
ent G
rade C
orp
ora
te
Bon
d S
pre
ads (In
verte
d)
Pre-crisis levels

26
Volatility Volatility has fallen below long-term average levels; however, it could pick up again as stimulus fades.
Source: Bloomberg Finance, LLP, 04/10
CBOE Volatility Index (VIX)
The VIX Index reached an all-time closing high in October 2008
10
20
30
40
50
60
70
1997 1998 1999 2000 2001 2002 2003 2004 2005 2006 2007 2008 2009 2010
Ind
ex

27
Lots of “Dry Powder” on the SidelinesAmple cash remains available to support financial market growth as risk appetites improve.
Source: ICI, 04/10Cash represented by money market mutual fund assets.
0
500
1000
1500
2000
2500
3000
3500
4000
4500
1996 1998 2000 2002 2004 2006 2008 2010
0
500
1000
1500
2000
2500
3000
3500
4000
4500
Cash on the Sidelines
$ B
illio
ns

28
-9.1%
432.4%403.7%
76.7%112.1%
-0.5%
140.5%
486.5%
-100%
0%
100%
200%
300%
400%
500%
600%
30's 40's 50's 60's 70's 80's 90's 00's
Decades of Returns The last decade was not kind to investors concentratedin domestic equities.
Source: Morningstar, as of 01/10
S&P 500 Cumulative Returns by Decade
% C
hange

29
$0.40
$0.60
$0.80
$1.00
$1.20
$1.40
$1.60
$1.80
$2.00
1999 2000 2001 2002 2003 2004 2005 2006 2007 2008 2009
$0.40
$0.60
$0.80
$1.00
$1.20
$1.40
$1.60
$1.80
$2.00
Balanced PortfolioS&P 500
The Power of Diversification The “lost decade” for stocks was not “lost” for well-diversified investors.
Growth of a Dollar over the Last Decade
Source: Wells Fargo Wealth Management, 02/10, Markov Processes International, LLC, 02/10
Total diversified portfolio consists of the following: 4.0% Short Bonds (Barclays Capital Aggregate 1-3 Total Return Index); 23.0% U.S. Taxable Bonds (Barclays Capital Aggregate Bond Total Return Index); 5.0%High Yield Bonds (Merrill Lynch High Yield Master II Index ); 8.0% Developed International Bonds (Citigroup World Government USD Total Return Index); 18.0% Large Cap Stocks (S&P 500 Total Return Index); 4.0% Mid Cap Stocks (S&P 400 Total Return Index); 4.0% Small Cap Stocks (S&P 600 Total Return Index); 11% International Developed Equity (Morgan Stanley Capital International Europe, Australia, Far East & Canada gross return Index in U.S. dollars); 3.0% Emerging Markets Equity (Morgan Stanley Capital International Emerging Markets gross return Index in U.S. dollars), 8.0% Real Estate Investment Trusts (FTSE NAREIT Equity REIT Total Return Index); 4.0% Commodities (Dow Jones UBS Commodity Total Return Index in U.S. Dollars), 4.0% Conservative Hedge (HFRX Equity Hedge Index), 4.0% Conservative Hedge (HFRX Relative Value Arbitrage Index).

30
Key Points – Economy and Markets
The economy is recovering.
Recent company earnings have exceeded expectations.
Employment conditions seem to be stabilizing, but high unemployment may limit economic growth.
Government policy responses have aided the recovery and there is more to come in 2010.
Moderate inflation is potentially on the horizon.
The markets are functioning much better, although some consolidation is likely.
Stock valuations are attractive by historical standards.
Cash on the sidelines may fuel further asset price increases.
Improving asset values and reduced fear may result in growth in donations to nonprofits over the next year.

31
Investment strategies to consider for your organization.
Where are we in this market cycle?
Today’s Agenda
Where are we in this economic cycle?
32
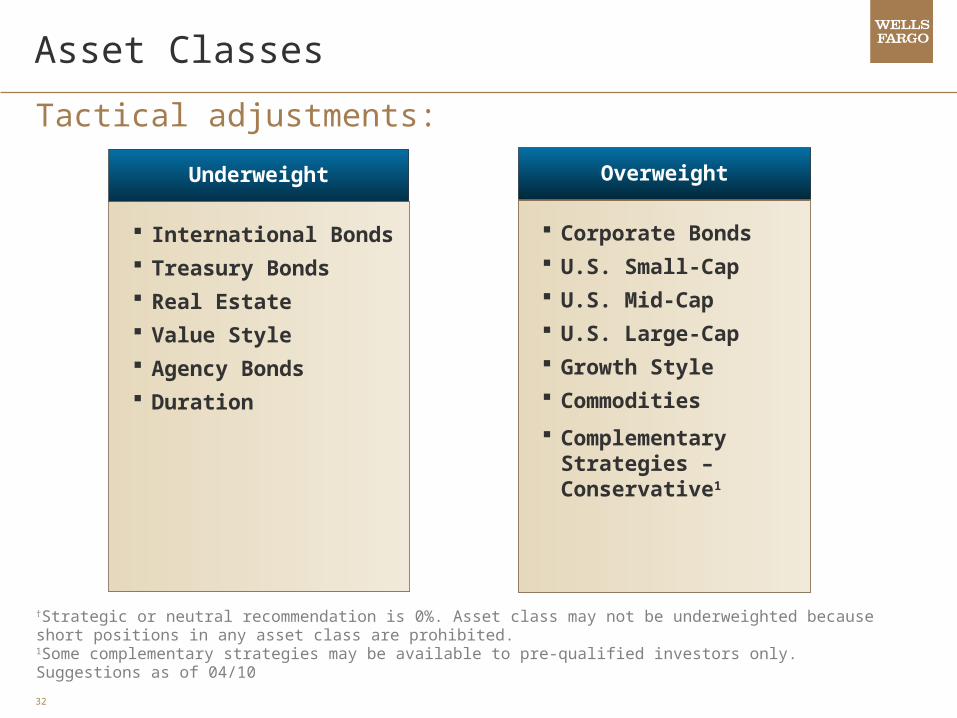
†Strategic or neutral recommendation is 0%. Asset class may not be underweighted because short positions in any asset class are prohibited. 1Some complementary strategies may be available to pre-qualified investors only. Suggestions as of 04/10
Asset Classes
Tactical adjustments:
Underweight
International Bonds Treasury Bonds Real Estate Value Style Agency Bonds Duration
Overweight
Corporate Bonds U.S. Small-Cap U.S. Mid-Cap U.S. Large-Cap Growth Style Commodities
Complementary Strategies – Conservative1

33
Suggestions as of 04/01/10
U.S. Equity Sectors
Tactical adjustments:
Underweight
Consumer StaplesTelecommunicationsUtilities Consumer Discretionary
Neutral
Information Technology
Health Care
Overweight
Financials Industrials Materials Energy Information
Technology

34
StrategiesTrends
Fully invest in all four asset groups– International Dev & EM Bonds– International Dev & EM Equity– Commodities & Global Real Estate– Hedge Funds with Global Exposure
Interdependent global economies
Correlated global markets
Synchronized global stimulus supporting worldwide recovery
Rise of the global consumer – China, India, Brazil,
Russia, Korea and frontier markets becoming consumer driven markets
– Global imbalances correcting
Tactical
Theme – Global Recovery
Diversify currency exposure through public and private investments
Overweight commodities
Broaden emerging markets exposure beyond BRIC countries
– Opportunities in SE Asia, Europe & SA
35
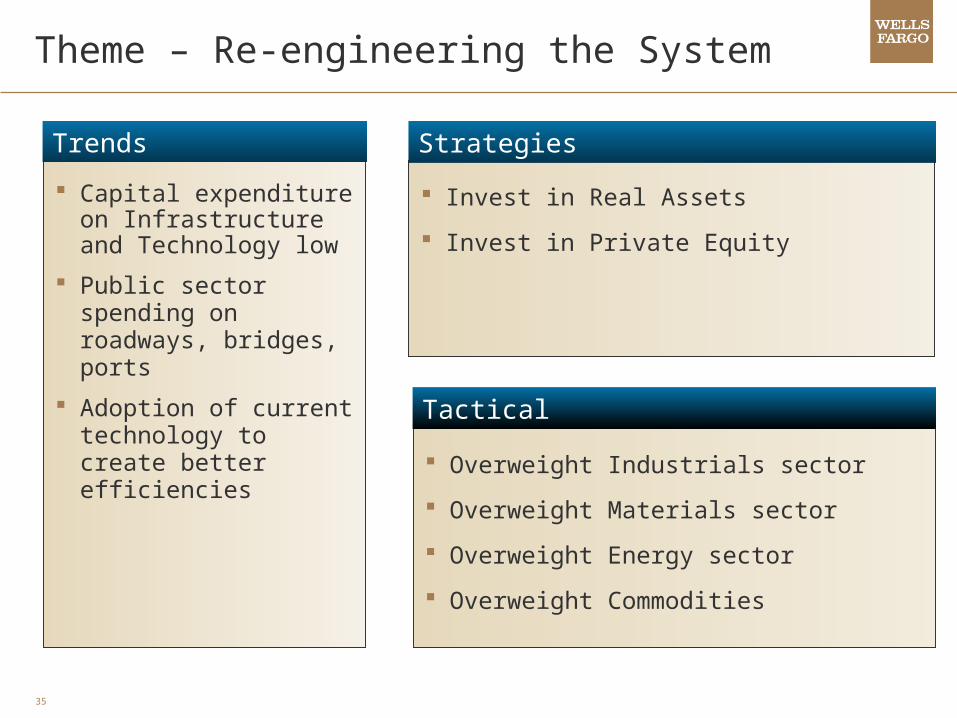
Theme – Re-engineering the System
Capital expenditure on Infrastructure and Technology low
Public sector spending on roadways, bridges, ports
Adoption of current technology to create better efficiencies
Invest in Real Assets
Invest in Private Equity
Overweight Industrials sector
Overweight Materials sector
Overweight Energy sector
Overweight Commodities
StrategiesTrends
Tactical

36
Theme – Risk Control
Long-term:
Removal of stimulus
Higher tax rates
Higher interest rates
Higher inflation
Strategic Asset Allocation fully diversified to meet risk/return targets
Invest in Complementary Strategies to change risk profile
Incorporate risk budgeting
Rebalance High Yield
Rebalance Small Cap
Overweight Conservative Hedge Funds
StrategiesTrends
Tactical

37
Theme – Higher Interest Rates
Potential for higher interest rates due to:
– Recovery
– High Federal deficit
Inflationary pressures from easy monetary policies
Potential “asset bubbles”
Diversify Fixed Income Assets
Diversify Income Sources
Equity, Commodities help hedge inflation
Active Yield Curve/Duration Mgmt
Underweight Duration
Overweight Domestic Equity
Underweight Treasurys
Underweight Foreign Sovereign Debt
Overweight Corporate Bonds
StrategiesTrends
Tactical

38
Underweight International Developed Bonds
Underweight International REITs
Theme – U.S. Dollar Diversification
Cyclical Trends:
Higher interest rates in U.S. may help dollar in 2010
Dollar may be oversold in the short-term
Secular Trends:
Longer-term dollar pressured by high debt, relatively weaker economy and persistent trade imbalances
Diversify currency exposure through public and private overseas investments
Certain Hedge Funds may benefit from currency fluctuations
StrategiesTrends
Tactical

39
Key Points – 2010 Strategy Highlights
Maintain globally diversified portfolios.
Focus on high quality, dividend-paying, cash-rich companies.
Broaden emerging-markets exposure beyond BRIC countries.
Diversify currency exposure.
Prepare for the triple threat of higher inflation, higher interest rates, and higher taxes.
Overweight commodities – not just gold.
Rebalance high-yield back to target.
Seek opportunities in hedge funds and private equity.

40
Questions?
200701178 TPB-PB21055 (03/08)
41
Disclosures Wells Fargo Private Bank provides products and services through Wells Fargo Bank, N.A. and its various affiliates and
subsidiaries. The information and opinions in this report were prepared by the investment management division within Wells Fargo Private
Bank. Information and opinions have been obtained or derived from sources we consider reliable, but we cannot guarantee their accuracy or completeness. Opinions represent Wells Fargo Private Bank’s opinion as of the date of this report and are for general information purposes only. Wells Fargo Private Bank does not undertake to advise you of any change in its opinions or the information contained in this report. Wells Fargo & Company affiliates may issue reports or have opinions that are inconsistent with, and reach different conclusions from, this report.
This material is for general information only, is not suitable for all investors and is not soliciting any action from any particular investor. Information and opinions presented have been obtained or derived from sources we believe reliable, but we cannot guarantee their accuracy or completeness. Opinions represent WFB’s judgment as of the date of the report and are subject to change without notice. WFC affiliates may issue reports or have opinions, which are inconsistent with, and reach different conclusions from, this report.
This report is not an offer to buy or sell or a solicitation of an offer to buy or sell any securities mentioned. Wells Fargo & Company and/or its affiliates may trade for their own accounts, be on the opposite side of customer orders, or have a long or short position in the securities mentioned herein.
The investments discussed or recommended in this report are not insured by the Federal Deposit Insurance Corporation (FDIC) and may be unsuitable for some investors depending on their specific investment objectives and financial position.
Past performance is not a guide to future performance. Income from investments may fluctuate. The price or value of the investments also may fluctuate.
Asset allocation and diversification do not assure or guarantee better performance and cannot eliminate the risk of investment losses.
Investing in foreign securities presents certain risks that may not be present in domestic securities and may not be suitable for all investors.
Real estate investment carries a certain degree of risk and may not be suitable for all investors.

42
Disclosures Some complementary strategies and real assets may be available to pre-qualified investors only.
Hedge strategies and private investments may be speculative and involve a high degree of risk. Hedge strategies and private investment performance can be volatile. An investor could lose all or a substantial amount of his or her investment. There is no secondary market for the investor’s interest in a hedge fund or private equity investment and none is expected to develop. There may be restrictions on transferring interests in a hedge fund or private equity investment.
Fixed income securities are subject to availability and market fluctuation. These securities may be worth less than the original cost upon redemption. Certain high-yield/high-risk bonds carry particular market risks and may experience greater volatility in market value than investment grade corporate bonds. Government bonds and Treasury bills are guaranteed by the U.S. government and, if held to maturity, offer a fixed rate of return and fixed principal value. Interest from certain municipal bonds may be subject to state and/or local taxes and in some instances, the alternative minimum tax.
Yields are subject to change with economic conditions. Yield is only one factor that should be considered when making an investment decision.
Wells Fargo & Company and its affiliates do not provide legal advice. Please consult your legal advisors to determine how this information may apply to your own situation. Whether any planned tax result is realized by you depends on the specific facts of your situation at the time your tax preparer submits your return .
You cannot invest directly in an index.
The S&P/Case-Shiller® U.S. National Home Price Index is a broad, market value-weighted composite of single-family home price indices for the nine U.S. Census divisions and is calculated quarterly.
S&P 500 Index is a capitalization-weighted index calculated on a total-return basis with dividends reinvested. The index includes 500 widely held U.S. market industrial, utility, transportation and financial companies.
S&P 400 Index is an unmanaged capitalization-weighted index of common stocks representing all major industries in the mid-range of the U.S. stock market.
S&P 600 Index is an unmanaged capitalization-weighted index of common stocks representing all major industries in the small-cap (between $300mn and $2 billion) are of the market.
The Market Volatility Index (VIX) is an index designed to track market volatility as an independent entity. The index calculated based on option activity and is used as an indicator of investor sentiment, with high values implying pessimism and low values implying optimism.
Wilshire 5000® Equity Index is an unmanaged index made up of all U.S. stocks regularly traded on the three major U.S. exchanges, including the New York Stock Exchange, American Stock Exchange, and Nasdaq.
43
Disclosures Russell 1000® Growth Index measures the performance of those Russell 1000 companies with higher price-to-book ratios
and higher forecasted growth values. Russell 1000® Value Index measures the performance of those Russell 1000 companies with lower price-to-book ratios and
lower forecasted growth values. Russell 2000® Index measures the performance of the 2,000 smallest companies in the Russell 3000® Index, which
represents approximately 8% of the total market capitalization of the Russell 3000®.
Russell Midcap Index measures the performance of the 800 smallest companies in the Russell 1000 Index, which represent approximately 25% of the total market capitalization of the Russell 1000 Index.
MSCI EAFE Index (Europe, Australasia, Far East) is a free float-adjusted market capitalization index that is designed to measure the equity market performance of developed markets, excluding the U.S. and Canada. As of June 2007 the MSCI EAFE Index consisted of 21 developed-market country indices.
MSCI Europe, Australasia, Far East & Canada Gross Return Index is a free float-adjusted market capitalization index that is designed to measure the equity market performance of developed markets, excluding the U.S.
Morgan Stanley Capital International (MSCI) Emerging Markets Global Index is a market capitalization-weighted benchmark index made up of equities from 29 developing countries.
JP Morgan Global Ex United States Index is a total return, market capitalization weighted index, rebalanced monthly consisting of the following countries: Australia, Germany, Spain, Belgium, Italy, Sweden, Canada, Japan, United Kingdom, Denmark, Netherlands, and France.
Barclays Capital U.S. Aggregate Bond Index (formerly known as Lehman Brothers U.S. Aggregate Bond Index) represents U.S. domestic, taxable and dollar-denominated securities. The index covers the U.S. investment grade fixed rate bond market, including government and corporate securities, mortgage pass-through securities and asset-backed securities between one and ten years.
Barclays Capital Aggregate 1-3 Total Return Index includes aged U.S. Treasury bills, notes and bonds with a remaining maturity from 1 up to (but not including) 12 months. It excludes zero coupon strips.
Barclays Capital U.S. Corporate Bond Index (from Lehman Brothers U.S. Corporate Bond Index) includes publicly issued U.S. corporate and Yankee debentures and secured notes that meet specified maturity, liquidity, and quality requirements.
Barclays Capital U.S. Treasury Index (formerly known as Lehman Brothers U.S. Treasury Index) includes public obligations of the U.S. Treasury with a remaining maturity of one year or more.
44
Disclosures Barclays Capital Municipal Bond Index (from Lehman Brothers Municipal Bond Index) represents municipal bonds with a
minimum credit rating of at least Baa, an outstanding par value of at least $3 million, and a remaining maturity of at least one year. The Index excludes taxable municipal bonds, bonds with floating rates, derivatives, and certificates of participation.
Barclays Capital U.S. TIPS Index consists of Inflation-Protection securities issued by the U.S. Treasury.
Barclays Capital High Yield Bond Index is an unmanaged index that tracks the performance of below investment grade U.S. dollar-denominated corporate bonds publicly issued in the U.S. domestic market.
Merrill Lynch High-Yield Bond Master II Index is an unmanaged index that tracks the performance of below-investment grade U.S. dollar-denominated corporate bonds publicly issued in the U.S. domestic market. This index does not reflect fees and expenses.
JP Morgan Emerging Markets Bond Index Global (EMBI Global) currently covers 27 emerging market countries. Included in the EMBI Global are U.S.-dollar-denominated Brady bonds, Eurobonds, traded loans, and local market debt instruments issued by sovereign and quasi-sovereign entities.
Citigroup World Government USD Total Return Index is a dollar denominated, market-weighted bond index consisting of government bond markets of developed countries.
FTSE NAREIT Equity REIT Total Return Index is an unmanaged index reflecting performance of the U.S. real estate investment trust market.
The HFRX indices currently consist of eight single strategy indices, an asset-weighted Global Hedge Fund Index and HFRX Equal Weighted Strategies Index, each calculated pursuant to an index methodology. Most HFRX Indices are priced daily. All HFRX Indices are re-balanced quarterly.
Equity Hedge: Equity Hedge strategies maintain positions both long and short in primarily equity and equity derivative securities. A wide variety of investment processes can be employed to arrive at an investment decision, including both quantitative and fundamental techniques.
Relative Value Arbitrage: Investment Managers who maintain positions in which the investment thesis is predicated on realization of a valuation discrepancy in the relationship between multiple securities.
Dow Jones - UBS Commodity Index is designed to be a highly liquid and diversified benchmark for commodities as an asset class. The index is composed of futures contracts on 19 physical commodities. No related group of commodities (e.g., energy, precious metals, livestock and grains) may constitute more than 33% of the index as of the annual re-weightings of the components. No single commodity may constitute less than 2% of the index.
Additional information is available upon request.
© 2010 Wells Fargo Bank, N.A., All rights reserved.