wells fargo 4q17 quarterly supplement...℠ feature:waives overdraft and non-sufficient funds (nsf)...
TRANSCRIPT

4Q17 Quarterly Supplement
January 12, 2018
© 2018 Wells Fargo & Company. All rights reserved.

5
10
15
20
25
30
Table of contents
4Q17 Results Continued focus on our stakeholders in 2017 Page 2-3 4Q17 Highlights 4
Noteworthy items in 4Q17
Tax Cuts & Jobs Act (Tax Act) 4Q17 impact and 2018 expectations 6
Commercial loan trends
Summary
Balance Sheet and credit overview (linked quarter) 7
Income Statement overview (linked quarter) 8
Loans 9
Consumer loan trends 11
Deposits 12
Net interest income 13
Noninterest income 14
Trading-related net interest income & noninterest income
Noninterest expense and efficiency ratio 16
Noninterest expense – linked quarter 17
Noninterest expense – year over year 18
Efficiency improvement program highlights in 2017 19
Targeting a total of $4 billion in expense reductions
2018 Expense expectations 21
Income statement impact from business divestitures 22
Community Banking 23
Community Banking metrics 24
Wholesale Banking 26
Wealth and Investment Management 27
Credit quality 28
Capital 29
Wells Fargo 4Q17 Supplement
Appendix Innovating for our customers 32
Adoption of hedge accounting update ASU 2017-12 33
Noninterest expense analysis (reference for slides 17-18) 34
Real estate 1-4 family mortgage portfolio 35
Consumer credit card portfolio 36
Auto portfolios 37
Student lending portfolio 38
Common Equity Tier 1 (Fully Phased-In) 39
Return on average tangible common equity (ROTCE) 40
Forward-looking statements and additional information 41
Final financial results and other disclosures will be reported in our Annual Report on Form 10-K for the year ended December 31, 2017, and may differ materially from the results and disclosures in this document due to, among other things, the completion of final review procedures, the occurrence of subsequent events, or the discovery of additional information.
Financial information for prior quarters in 2017 has been revised to reflect the impact of the adoption of Accounting Standards Update (ASU) 2017-12 – Derivatives and Hedging (Topic 815): Targeted Improvements to Accounting for Hedging Activities in fourth quarter 2017. The retrospective application of the changes to certain hedging strategies resulted in a cumulative effect adjustment to opening retained earnings effective January 1, 2017. The adjustment reduced retained earnings by $381 million and increased other comprehensive income by $168 million. The effect of adoption on previously reported September 30, 2017, year-to-date net income resulted in an increase of $169 million ($242 million pre-tax) and a decrease in other comprehensive income of $163 million. Other affected financial information, including financial ratios, has been revised to reflect this adoption.
1

Continued focus on our stakeholders in 2017 (page 1 of 2)
Customers: Team Members:
Customer-friendly changes to deposit accounts included:
- Overdraft Rewind℠ feature: Waives overdraft and non-sufficient funds (NSF) fees if a covering direct deposit is received by 9am the day after the account is overdrawn
- Automatic zero-balance alerts sent during the day allow customers time to make a covering deposit or transfer
- Eliminated overdraft and NSF fees on small-dollar transactions of $5 or less
- Reduced the maximum number of overdraft and NSF fees that can be assessed from 4 to 3 per day
New technology to enhance customer experience (see page 32):
- Card-free ATM access via one-time password to Wells Fargo’s 13,000 ATMs and NFC access to over 5,000 ATMs
- Debit card On/Off capability - Zelle® P2P payments experience - Intuitive Investor digital brokerage advisory mobile
offering - Personalized insights and advice with predictive
banking technology - Daily Change: Interactive mobile app encouraging
customers to save - Make an Appointment API to schedule
appointments with Wells Fargo (WF) on non-WF websites
- Increased digital acquisition functionality for deposits, mortgage and credit card
In 1Q17, we increased the base minimum hourly pay rate for U.S.-based team members by 12% to $13.50 benefiting ~31,000 team members
Announced an increase in the base minimum hourly pay rate for U.S.-based team members to $15.00, an 11% increase from the low end of prior minimum hourly rate and more than double the national minimum wage (Effective March 2018)
In addition to 401(k) employer matching contributions (6%), U.S.-based team members received a profit sharing contribution of 1% of certified compensation in 2Q17
Added 4 additional paid holidays per year
Announced plans to grant restricted stock awards to ~250,000 team members
- Awards to be granted in 1Q18, two-year vesting period
- 50 shares of Wells Fargo common stock for eligible full-time team members, with vested value based on future share price (e.g. vested value of $3,000 at $60/share), and 30 shares for eligible part-time team members (e.g. vested value of $1,800 at $60/share)
The Wells Fargo Foundation donated $6.5 million to the WE Care Fund
- Provides grants to our team members in need with expenses related to disaster situations and other financial hardships
Wells Fargo 4Q17 Supplement 2

Continued focus on our stakeholders in 2017 (page 2 of 2)
Shareholders, Board and governance: Communities:
Shareholders:
- Returned $14.5 billion to shareholders through common stock dividends and net share repurchases, up 16% from 2016
Board and governance changes included:
- Elected Elizabeth A. (“Betsy”) Duke, a former member of the Federal Reserve Board of Governors, as independent Chair, effective 1/1/18
- Named 6 new independent directors in 2017 (a total of 8 new independent directors have been elected since 2015); 5 directors retired from the Board in 2017
• Board enhanced overall capabilities and experience, including in financial services, risk management, technology, consumer, human capital management, finance, and ESG areas
- Refreshed the composition and leadership of various Board committees, including new chairs of the Risk Committee and Governance and Nominating Committee
Launched Stakeholder Advisory Council
- Seven members, all external, represent groups focused on consumer rights, fair lending, the environment, human rights, civil rights, and governance
$286 million in 2017 charitable contributions
- In addition to our ongoing regular commitments to communities, contributions included $4.1 million for disaster relief efforts to aid victims of hurricanes, wildfires, earthquakes and floods, as well as other local disasters
Announced $50 million, five year commitment to American Indian/Alaska Native communities
More than $100 million has been donated since 2012 to support military service members, veterans and their families
NeighborhoodLIFT® expanded to 56th program
- Since 2012, LIFT programs have helped create nearly 15,400 homeowners in 55 communities
2018 Targets include:
- $400 million in donations to community and nonprofit organizations
• $75 million to NeighborhoodLIFT® program
• $100 million in capital and other resources over the next three years to support the growth of diverse small businesses
Wells Fargo 4Q17 Supplement 3

4Q17 Highlights
Financial information for prior quarters in 2017 has been revised to reflect the impact of the adoption in fourth quarter 2017 of Accounting Standards Update (ASU) 2017-12 – Derivatives and Hedging (Topic 815): Targeted Improvements to Accounting for Hedging Activities. See page 1 for more information. (1) 4Q17 capital ratio is a preliminary estimate. Fully phased-in capital ratios are calculated assuming the full phase-in of the Basel III capital rules. See page 39 for additional information regarding the Common Equity Tier 1 capital ratio.
Earnings of $6.2 billion included:
Tax Cuts & Jobs Act impact:
- $3.35 billion after-tax benefit from the impact of the Tax Cuts & Jobs Act (Tax Act)
Other items:
- $848 million pre-tax gain from the 11/30/17 sale of Wells Fargo Insurance Services USA
- $3.25 billion of pre-tax litigation accruals for a variety of matters, including mortgage-related regulatory investigations, sales practices, and other consumer-related matters
Diluted earnings per common share of $1.16
Revenue up 2% year-over-year (YoY) and 1% linked quarter (LQ)
Average loans down 1% YoY and stable LQ, and average deposits up 2% YoY and stable LQ
Solid credit quality
- Net charge-offs of 31 bps of average loans (annualized), down 6 bps YoY and up 1 bp LQ
- Nonperforming assets down 24% YoY and 7% LQ
Strong capital position
- Common Equity Tier 1 ratio (fully phased-in) of 11.9% at 12/31/17 (1)
- Returned $4.0 billion to shareholders through common stock dividends and net share repurchases in 4Q17
Wells Fargo 4Q17 Supplement 4
5,274 5,634
5,856
4,542
6,151
4Q16 1Q17 2Q17 3Q17 4Q17Diluted earnings per common share
$0.96 $1.03
$1.08
$0.83
$1.16
Wells Fargo Net Income ($ in millions, except EPS)

Noteworthy items in 4Q17
Wells Fargo 4Q17 Supplement 5
($ in millions) Line Affected Revenue Expense Income Tax Adjustments
Net Income
Diluted EPS
Income StatementTax Act impacts $ $ 0.67
See page 6 for additional information
Sale of Wells Fargo Insurance Services USA (WFIS)
$ 0.11
Sold on 11/30/17
Litigation accruals 3,251 (2,909) $ (0.59)
For a variety of matters, including mortgage-related regulatory investigations, sales practices, and other consumer-related matters
Majority of litigation accruals were not tax deductible
848 526
4Q17 Impact
3,346 Various (597) 3,716
Operating losses
All other noninterest income

Tax Cuts & Jobs Act (Tax Act) 4Q17 impact and 2018 expectations
$3.35 billion net income benefit, or $0.67 per share, in 4Q17 primarily due to:
- $3.89 billion estimated tax benefit from the reduction to net deferred income taxes
• Provisional result from re-measurement of net deferred income tax liability due to reduction in the U.S. corporate income tax rate
o Primary drivers of net deferred tax liability (DTL) include mortgage servicing rights, leasing and mark to market accounting on certain asset categories
- $370 million after-tax loss from adjustments related to leveraged leases, low income housing investments, and tax-advantaged renewable energy investments
• $597 million decline in revenue reflected:
o $183 million loss due to a one-time adjustment related to leveraged leases (in net interest income)
o $284 million impairment on low income housing investments (in all other noninterest income)
o $130 million impairment on tax-advantaged renewable energy investments (in all other noninterest income)
• $227 million tax effect of the above items
- $173 million tax expense from the estimated deemed repatriation of undistributed foreign earnings
We currently expect our full year 2018 effective income tax rate to be ~19%
To further support economic growth and invest in our communities, we announced the following initial actions in response to the Tax Act:
- Increased the minimum hourly pay rate for all U.S.-based team members to $15.00, which is an 11% increase from the previous minimum hourly rate and more than double the national minimum wage of $7.25 an hour (Effective March 2018)
- Targeting $400 million in donations to community and nonprofit organizations in 2018, and beginning in 2019, we are targeting 2% of after-tax profits for corporate philanthropy
Wells Fargo 4Q17 Supplement 6

Balance Sheet and credit overview (linked quarter)
Loans
Cash and short-term investments
Trading assets
Up $4.9 billion driven by higher commercial and consumer loans - Commercial loans up $3.2 billion on growth in commercial & industrial loans - Consumer loans up $1.7 billion on growth in real estate 1-4 family first mortgage
loans and consumer credit card
Up $3.7 billion as growth in deposits was partially offset by declines in longterm debt
Up $3.9 billion on increased inventory
Up $1.8 billion as ~$20.9 billion of gross purchases, mostly agency mortgage-backed securities (MBS) in the available for sale portfolio, were largely offset by run-off and sales
Investment securities
Up $29.3 billion on an increase in commercial, and consumer and small business banking deposits (1)
Deposits
Long-term debt Down $14.2 billion, driven by $10.0 billion in net Federal Home Loan Bank (FHLB) reductions and $4.5 billion in other maturities
Up $9.4 billion, reflecting funding associated with trading Short-term borrowings
Up $1.2 billion to $206.9 billion in 4Q17 Total stockholder’s equity Common shares outstanding down 36.3 million on net share repurchases of
$2.1 billion
Net charge-offs of $751 million, up $34 million to 31 bps of average loans (annualized)
Credit
Nonperforming assets of $8.7 billion, down $647 million and included a $467 million reduction in oil and gas nonaccruals
$100 million reserve release (2) in the quarter reflected continued strong credit performance
Period-end balances. All comparisons are 4Q17 compared with 3Q17. (1) Total deposits excluding mortgage escrow and wholesale deposits. (2) Reserve build represents the amount by which the provision for credit losses exceeds net charge-offs, while reserve release represents
the amount by which net charge-offs exceed the provision for credit losses.
Wells Fargo 4Q17 Supplement 7

Income Statement overview (linked quarter)
Total revenue
Net interest income
Noninterest income
Noncontrolling interest (reduces net income)
Noninterest expense
Revenue of $22.1 billion, up $201 million
NII down $136 million driven primarily by a $183 million loss due to a one-time adjustment related to leveraged leases resulting from the Tax Act, partially offset by a modest net benefit from all other growth, repricing and variable items; NIM down 2 bps to 2.84%
Noninterest income up $337 million
- Deposit service charges down $30 million driven by customer-friendly changes including the November launch of Overdraft Rewind℠
- Trust and investment fees up $78 million on higher asset-based fees and retail brokerage transaction activity
- Mortgage banking down $118 million on $71 million lower gains on mortgage origination activity primarily reflecting seasonality, as well as $47 million lower mortgage servicing results
- Market sensitive revenue (1) up $79 million driven by higher gains on equity investments
- Other income up $358 million; included an $848 million gain on the sale of Wells Fargo Insurance Services USA, and $414 million of impairments on low income housing and renewable energy investments resulting from the Tax Act
Minority interest up $32 million reflecting higher equity gains from venture capital businesses
Noninterest expense up $2.4 billion
- Operating losses up $2.2 billion and included $3.3 billion of litigation accruals for a variety of matters, including mortgage-related regulatory investigations, sales practices, and other consumer-related matters (a majority of the litigation accruals were not tax deductible)
All comparisons are 4Q17 compared with 3Q17. (1) Consists of net gains from trading activities, debt securities and equity investments.
Wells Fargo 4Q17 Supplement 8

Loans
Average
Wells Fargo 4Q17 Supplement
Total average loans of $951.8 billion, down $12.3 billion, or 1%, YoY and down $521 million LQ
- Commercial loans down $692 million LQ as growth in commercial & industrial loans was more than offset by lower commercial real estate loans
- Consumer loans up $171 million LQ as growth in real estate 1-4 family first mortgage and credit card was partially offset by expected declines in auto and junior lien mortgage, and lower other revolving credit and installment loans
Total average loan yield of 4.35%, down 6 bps LQ driven by the net interest income adjustment related to leveraged leases resulting from the Tax Act
Period end
Total period-end loans decreased $10.8 billion YoY driven by expected declines in auto and junior lien mortgage loans, as well as lower commercial real estate loans
Total period-end loans up $4.9 billion LQ
- Please see pages 10 and 11 for additional information
9
964.1 963.6 956.9 952.3 951.8
4Q16 1Q17 2Q17 3Q17 4Q17
967.6 958.4 957.4 951.9 956.8
4Q16 1Q17 2Q17 3Q17 4Q17
Total average loan yield
Period-end Loans Outstanding ($ in billions)
Average Loans Outstanding ($ in billions)
4.20% 4.26%4.36% 4.41% 4.35%
Commercial loan trends
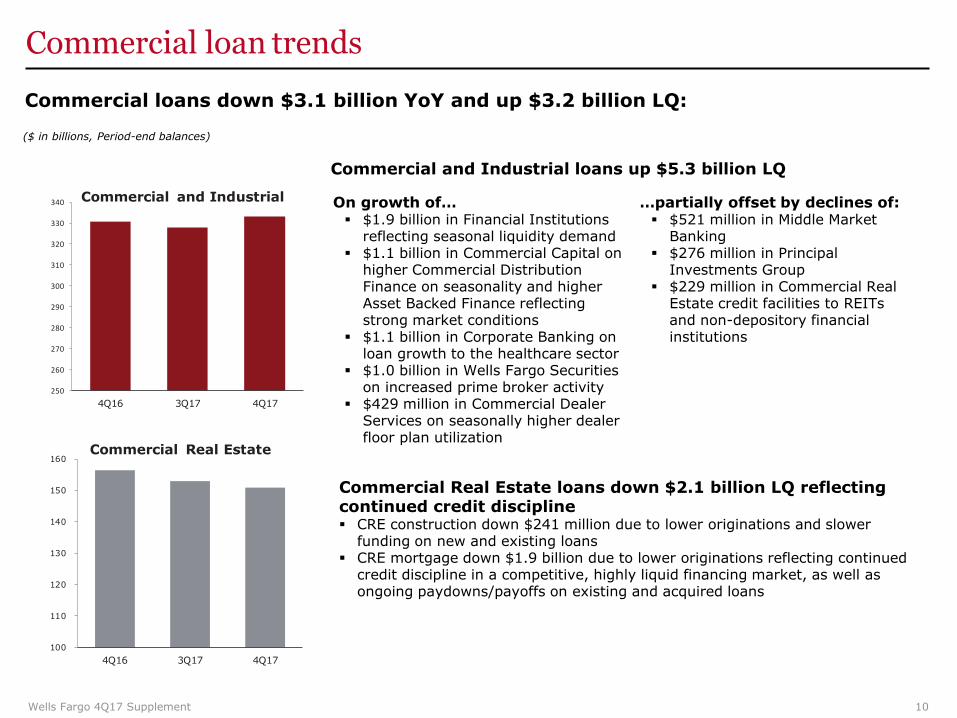
Commercial loans down $3.1 billion YoY and up $3.2 billion LQ:
($ in billions, Period-end balances)
Commercial and Industrial loans up $5.3 billion LQ
250
260
270
280
290
300
310
320
330
340
4Q16 3Q17 4Q17
Commercial and Industrial
100
110
120
130
140
150
160
4Q16 3Q17 4Q17
Commercial Real Estate
On growth of… $1.9 billion in Financial Institutions
reflecting seasonal liquidity demand $1.1 billion in Commercial Capital on
higher Commercial Distribution Finance on seasonality and higher Asset Backed Finance reflecting strong market conditions
$1.1 billion in Corporate Banking on loan growth to the healthcare sector
$1.0 billion in Wells Fargo Securities on increased prime broker activity
$429 million in Commercial Dealer Services on seasonally higher dealer floor plan utilization
Commercial Real Estate loans down $2.1 billion LQ reflecting continued credit discipline CRE construction down $241 million due to lower originations and slower
funding on new and existing loans CRE mortgage down $1.9 billion due to lower originations reflecting continued
credit discipline in a competitive, highly liquid financing market, as well as ongoing paydowns/payoffs on existing and acquired loans
…partially offset by declines of: $521 million in Middle Market
Banking $276 million in Principal
Investments Group $229 million in Commercial Real
Estate credit facilities to REITs and non-depository financial institutions
Wells Fargo 4Q17 Supplement 10

Consumer loan trends
Consumer loans down $7.7 billion YoY and up $1.7 billion LQ
($ in billions, Period-end balances)
Consumer Real Estate 1-4 Family First &
Junior Lien Mortgage 300
250
200
150
100
50
0
4Q16 3Q17 4Q17
1-4 Family First Junior Lien
Automobile
65
60
55
50
45
40
35
30
4Q16 3Q17 4Q17
Wells Fargo 4Q17 Supplement
� First mortgage loans up $3.9 billion LQ: 40
- Nonconforming loan growth of $5.9 billion 36
- Growth partially offset by continued run-off of 32
higher-yielding legacy portfolios 28
� Junior lien mortgage loans down $1.4 billion LQ and 24
down $6.5 billion YoY as continued paydowns more 20
than offset new originations
� Auto down $2.1 billion LQ and down $8.9 billion 44
YoY as tighter credit underwriting standards 40
slowed originations 36
� Continued decline in outstanding loans 32
expected through late 28
2018 24
20
Credit Card
4Q16 3Q17 4Q17
Other Revolving Credit and Installment
4Q16 3Q17 4Q17
� Credit card up $1.7 billion LQ on seasonality and up $1.3 billion YoY reflecting purchase growth
� Student loans down $229 million LQ and $453 million YoY
� Personal loans and lines down $194 million LQ
- Continued decline in outstanding loans expected due to lower branch referrals over the past year
11

Deposits
Average
907.3 942.1 944.1
376.9 364.3 367.5
1,284.2 1,306.4 1,311.6
4Q16 3Q17 4Q17
Interest-bearing deposits Noninterest-bearing deposits
1,306.1 1,306.7 1,336.0
4Q16 3Q17 4Q17
Average deposit cost
Average Deposits and Rates ($ in billions)
Period-end Deposits($ in billions)
0.12%
0.26% 0.28%
� Average deposits up $27.4 billion, or 2%, YoY and up $5.2 billion LQ
- Noninterest-bearing deposits down $9.4 billion YoY and up $3.2 billion LQ
- Interest-bearing deposits up $36.8 billion, or 4%, YoY and up $2.0 billion LQ
� Average deposit cost of 28 bps, up 2 bps LQ and 16 bps YoY, driven by increases in commercial and Wealth and Investment Management deposit rates
� Consumer and small business banking deposits (1)
of $757.5 billion, up 1% YoY and up modestly LQ
Period end � Period-end deposits up $29.9 billion, or 2%, YoY
on an increase in commercial, and consumer and small business banking deposits (1)
� Period-end deposits up $29.3 billion LQ on an increase in commercial, and consumer and small business banking deposits (1)
� Primary consumer checking customers (2) in November up 0.2% YoY
(1) Total deposits excluding mortgage escrow and wholesale deposits. (2) Customers who actively use their checking account with transactions such as debit card purchases, online bill payments, and direct deposits. Wells Fargo 4Q17 Supplement 12

Net interest income
12,402 12,324 12,471 12,449 12,313
4Q16 1Q17 2Q17 3Q17 4Q17 Net Interest Margin (NIM)
Net Interest Income ($ in millions)
2.87% 2.87% 2.90% 2.86% 2.84%
� Net interest income decreased $89 million, or 1%, YoY and $136 million LQ; 4Q17 results included:
- $183 million loss due to a one-time adjustment related to leveraged leases resulting from the Tax Act, partially offset by a modest net benefit from all other growth, repricing and variable items
� NIM of 2.84%, down 2 bps LQ as the negative adjustment related to leveraged leases, and growth in average deposits, were partially offset by lower average long-term debt and a modest net benefit from all other growth, repricing and variable items
� Loan swap position summary: - In 4Q17 we unwound $30.2 billion of our receive
fixed loan swap position, and $50.6 billion remained outstanding as of 12/31/17
o We unwound more of our position in early 2018
- Unwinding swaps does not result in immediate recognition of gains/losses; impact is recognized over the remaining life of the original derivative
- Partial unwind moves our net asset sensitivity toward the mid-point of our previously provided guidance of 5-15 bps for a 100 bps parallel shift in the yield curve
Financial information for prior quarters in 2017 has been revised to reflect the impact of the adoption in fourth quarter 2017 of Accounting Standards Update (ASU) 2017-12 – Derivatives and Hedging (Topic 815): Targeted Improvements to Accounting for Hedging Activities. See page 1 for more information.
Wells Fargo 4Q17 Supplement 13

Noninterest income
($ in millions) 4Q17 vs
3Q17 vs
4Q16
Noninterest income Service charges on deposit accounts $ 1,246 (2) % (8) Trust and investment fees:
Brokerage advisory, commissions and other fees 2,401 4 3
Trust and investment management 866 3 3 Investment banking 420 (10) (19)
Card fees 996 - -Other fees 913 4 (5) Mortgage banking 928 (11) (35) Insurance 223 (17) (15) Net gains from trading activities 132 (46) n.m. Net gains on debt securities 157 (5) 8 Net gains from equity investments 439 84 43 Lease income 458 (4) (12) Other 558 n.m. n.m. Total noninterest income $ 9,737 4 % 6
9,931 9,764 9,737 9,180 9,400
4Q16 1Q17 2Q17 3Q17 4Q17
� Deposit service charges down $30 million LQ driven by customer-friendly changes including the November launch of Overdraft Rewind℠
� Trust and investment fees up $78 million on higher asset-based fees and retail brokerage transaction activity
� Other fees up $36 million on higher commercial real estate brokerage commissions
� Mortgage banking down $118 million - Servicing income down $47 million primarily due
to a lower MSR servicing hedge gain due to the impact of changes in MSR valuation assumptions reflecting increased pricing competition in the industry, and increased customer payment deferrals in areas impacted by recent hurricanes
- Residential mortgage origination revenue down $71 million largely driven by a 10% reduction in origination volumes largely on seasonality
� Insurance down $46 million due to the sale of Wells Fargo Insurance Services (WFIS) in November
� Trading gains down $113 million - Please see page 15 for additional information
� Gains from equity investments up $201 million on higher venture capital results
� Other income up $359 million and included an $848 million gain on the sale of WFIS, and $414 million of impairments on low income housing and renewable energy investments resulting from the Tax Act
Financial information for prior quarters in 2017 has been revised to reflect the impact of the adoption in fourth quarter 2017 of Accounting Standards Update (ASU) 2017-12 – Derivatives and Hedging (Topic 815): Targeted Improvements to Accounting for Hedging Activities. See page 1 for more information. Wells Fargo 4Q17 Supplement 14

-
Trading-related net interest income and noninterest income
($ in millions) 4Q17 3Q17 4Q16
Trading-related revenue
Linked Quarter Change Year-over year Change
Net interest income $ 710 646 651 $ 64 10 % $ 59 9 % Net gains/(losses) on trading activities 132 245 (109) (113) (46) 241 n.m.
Trading-related revenue $ 842 891 542 $ (49) (5) % $ 300 55 %
� Trading-related revenue of $842 million was down $49 million, or 5%, from 3Q17: - Net interest income increased $64 million on higher trading assets
• Average trading asset balances up 7% on higher inventories in corporate securities and RMBS
- Net gains/(losses) on trading activities decreased $113 million on lower customer trading activity reflecting lower volatility and compressed spreads, and was partially offset by a modest increase in deferred compensation plan investment results • $8 million higher deferred compensation plan investment results (largely offset in employee benefits
expense) ($134 million gain in 4Q17 vs. $126 million gain in 3Q17)
� Trading-related revenue was up $300 million, or 55%, YoY primarily driven by net interest income on increased balances, increased customer trading activity in spread and equities products, and improving credit spreads, as well as $110 million of higher deferred compensation plan investment results (largely offset in employee benefits expense)
Wells Fargo 4Q17 Supplement 15

Noninterest expense and efficiency ratio (1)
� Noninterest expense up $2.4 billion LQ ($ in millions) 4Q17
vs 3Q17
vs 4Q16
Noninterest expense Salaries $
Commission and incentive compensation Employee benefits Equipment Net occupancy Core deposit and other intangibles FDIC and other deposit assessments Outside professional services (2)
Operating losses (2)
Other (2)
4,403 2,665 1,293
608 715 288 312
1,025 3,531 1,960
1 % 5 4 8 1 17
16 (5) - 1 - (4)
(1) (12) 7 4
n.m. n.m. (4) (11)
Total noninterest expense $ 16,800 17 % 27
16,800
Included a 14.74% impact from the $3.3 billion litigation accrual
Efficiency Ratio
13,215 13,792 13,541 14,351
4Q16 1Q17 2Q17 3Q17 4Q17
61.2% 62.0% 60.9%
65.7%
76.2%
- Personnel expense up $173 million • Salaries up $47 million reflecting an accrual for
additional team member holidays, as well as higher severance expense
• Commission and incentive compensation up $112 million on increased stock award expense due to higher stock price and performance on prior-period awards, as well as higher revenue-based incentive compensation in retail brokerage
• Employee benefits expense up $14 million and included $27 million higher deferred compensation expense (P&L neutral)
- Equipment expense up $85 million on typically higher year-end software expense
- Outside professional services (2) up $70 million reflecting higher project spend and legal expense
- Operating losses (2) of $3.5 billion, up $2.2 billion and included $3.3 billion of litigation accruals for a variety of matters, including mortgage-related regulatory investigations, sales practices, and other consumer-related matters
- Other expense (2) down $78 million and included: • Typically higher 4Q advertising and promotion
expense, up $63 million • $103 million increase in charitable donations • $221 million decline in All Other, which included a
$117 million gain on the sale of a corporate property
� 4Q17 efficiency ratio of 76.2% Financial information for prior quarters in 2017 has been revised to reflect the impact of the adoption in fourth quarter 2017 of Accounting Standards Update (ASU) 2017-12 – Derivatives and Hedging (Topic 815): Targeted Improvements to Accounting for Hedging Activities. See page 1 for more information. (1) Efficiency ratio defined as noninterest expense divided by total revenue (net interest income plus noninterest income). Noninterest expense and our efficiency
ratio may be affected by a variety of factors, including business and economic cyclicality, seasonality, changes in our business composition and operating environment, growth in our business and/or acquisitions, and unexpected expenses relating to, among other things, litigation and regulatory matters.
(2) The sum of Outside professional services expense, operating losses and Other expense equals Other noninterest expense in the Consolidated Statement of Income, pages 18 and 19 of the press release.
Wells Fargo 4Q17 Supplement 16

Noninterest expense – linked quarter
($ in millions)
$18,000
$16,000
$14,000
$12,000
$10,000
$8,000
$85 $16,800$101$2,068
“Running the Infrastructure Business” – Typically higher
Discretionary: 4Q equipment Typically higher expense 4Q advertising
$43 and promotion $10$14,351 $142 expense and Revenue- Third Party “Running the Compensation higher travel related: Services: Business” – & Benefits: and Higher Higher Non Higher stock entertainment commissions project Discretionary: award expense expense and incentive spending, Includes $2.2 on higher stock compensation and legal billion of higher price and in retail expense operating losses performance on brokerage on higher prior-period largely offset litigationawards; and by lower accruals salaries operating expense lease expense
3Q17 4Q17
For analytical purposes, we have grouped our noninterest expense into these six categories. Please see page 34 for additional information. Wells Fargo 4Q17 Supplement 17

Noninterest expense – year over year
$18,000
$17,000
$16,000
$15,000
$14,000
$13,000
$12,000
$11,000
$10,000
$9,000
$8,000
$13,215
$16,800
$475 $64 $46
$3,041 ($8) ($33)
Third Party Services:
Higher project spending and
contract services
Infrastructure: Lower equipment
expense
“Running the Business” –
Discretionary: Lower postage, stationery and
supplies expense, and
travel and entertainment
expense, partially offset
by higher advertising and
promotion expense
Compensation & Benefits:
Higher salaries from annual
increases and
“Running the Business” –
Non Discretionary: Includes $3.3
billion of higher
Revenue-related: Higher
commissions
higher deferred compensation
on higher
and benefits expense,
partially offset by a 2% decline
in FTEs
accruals
operating losses
litigation
and incentive compensation
driven by Wealth &
Investment Management
and Wells Fargo
Securities
4Q16 4Q17
($ in millions)
For analytical purposes, we have grouped our noninterest expense into these six categories. Please see page 34 for additional information. Wells Fargo 4Q17 Supplement 18

Efficiency improvement program highlights in 2017
Initiatives 2017 Accomplishments included:
Centralization & Optimization
� Ongoing centralization and standardization in enterprise functions - Eliminating redundancies and lower value work, leveraging best
practices, consolidating and streamlining processes, automating process at scale, rationalizing tools, optimizing workforce location
� Realigned businesses to leverage capabilities and more efficiently serve our customers (e.g. International group realignment)
- Eliminating redundancies, leveraging customer synergies
� Ongoing transformational changes to operating models including contact centers, technology and operations
- Streamlining processes, leveraging digital automation, using new capabilities to improve customer experience, optimizing workforce location
Professional Services & � Continued negotiation to improve contract rates with third-party Third Party Expenses suppliers and ‘demand’ based savings
� Enhanced governance around engagement of professional services firms
Corporate Properties � 214 branch consolidations exceeding our target of 200 (Facilities and Branch � Reduced the number of stand-alone mortgage banking locations by Optimization) over 10%
Travel � Significantly enhanced travel policy standards and enforcement
Wells Fargo 4Q17 Supplement 19
Targeting a total of $4 billion in expense reductions
� We expect efficiency initiatives will reduce expenses by $2 billion annually by year-end 2018 and that those savings support our investment in the business
� We expect an additional $2 billion in annual expense reductions by the end of 2019; these savings are projected to go to the “bottom line” and be fully recognized in 2020
� Expected target savings do not include: - Run-off of core deposit intangible amortization expense (2018 expense of $769 million,
$0 million in 2019)
- Expected completion of FDIC special assessment by year end 2018
- Expense saves due to business divestitures
Wells Fargo 4Q17 Supplement 20

2018 Expense expectations
2018 Efficiency expectations
� We currently expect full year 2018 total expenses to be in the range of $53.5 - $54.5 billion - Includes ~$0.6 billion of typical operating losses, and excludes litigation and remediation accruals and
penalties � 2018 revenue, which will influence the efficiency ratio, will be driven by a number of factors
including: absolute level of interest rates, shape of yield curve, loan growth, deposit betas, credit spreads, cash/fed funds redeployment, and absolute level of the equity markets
2018 expected savings initiatives include: � Ongoing centralization and optimization
� Professional services and third party expense savings through contract rate negotiation, governance guidelines and expanded oversight
� Implementation of span of control expectations
� Investment optimization through central management
� Continued facilities and branch optimization - Expect to close 250+ branches in 2018
- Total branch network expected to decline to ~5,000 by year-end 2020
� Rationalizing call center and operational capacity
� Ongoing technology application rationalization
2018 expected investment initiatives include: � Investing in a number of key areas to enhance
our compliance and risk management capabilities, build a better bank, and strengthen our core infrastructure
� Investment program spend is focused on the following key areas:
- Bank secrecy act / Anti-money laundering (BSA/AML)
- Cyber - Data modernization - Innovation - Regulatory compliance and remediation - Sales practices - Technology transformation - Resolution and recovery planning
Wells Fargo 4Q17 Supplement 21

Income Statement impact from business divestitures
� Divestitures have been focused on businesses that no longer meet our return requirements, and/or future investment spending requirements to maintain market positioning, and product capabilities exceeded our desired investment spend
� Revenues generated and direct expenses incurred by these businesses included: ($ in millions)
2016 Direct 2017 Direct Timing of Sale Business Sold 2016 Revenue Expense 2017 Revenue Expense
1Q16 Crop Insurance $ 150 (127) 2Q16 Health Benefit Services 21 (15) 4Q16 Global Fund Services 41 (42)
Other divestitures in 2016 43 (35) 4Q17 Wells Fargo Insurance Services USA 656 (598) 578 (573)
Total $ 911 (817) 578 (573)
� Sale of Shareowner Services expected to close in 1Q18
Wells Fargo 4Q17 Supplement 22

Community Banking
($ in millions) 4Q17 vs
3Q17 vs
4Q16
Net interest income Noninterest income Provision for credit losses Noninterest expense Income tax benefit Segment net income ($ in billions) Avg loans, net Avg deposits
($ in billions) 4Q17 3Q17 4Q16 Key Metrics: Total Retail Banking branches Credit card penetration (1)(2)
($ in billions) 4Q17 3Q17 4Q16 vs vs
Auto Originations Home Lending Applications Application pipeline Originations Residential HFS production margin (3)
.
$ 7,537 (1) % 4,491 3 9
636 (2) 1 10,200 30 46 (2,560) n.m. n.m.
$ 3,673 69 % 34
$ 473.5 - (3) 738.1 - 4
5,861 5,927 6,065 45.3 % 45.4 45.5
$ 4.3 - % (33)
$ 63 (14) % (16) 23 (21) (23) 53 (10) (26)
1.25 % 1 bps (43)
� Net income of $3.7 billion, up 34% YoY and 69% LQ. 4Q17 included the income tax benefit of the Tax Act to the Company, which was partially offset by $3.3 billion of pre-tax litigation accruals
Key metrics � See pages 24 and 25 for additional information � 5,861 retail bank branches reflect 69 branch
consolidations in 4Q17 and 214 in 2017 � Credit card penetration (1)(2) of 45.3% � Consumer auto originations of $4.3 billion, stable
LQ and down 33% YoY reflecting our tighter underwriting standards
� Mortgage originations of $53 billion, down 10% LQ on seasonality and down 26% YoY
- 64% of originations were for purchases, compared with 72% in 3Q17 and 50% in 4Q16
- Correspondent channel was 57% of total originations vs. 54% in 3Q17 and 50% in 4Q16
- 1.25% residential held for sale production margin (3) up 1 bp LQ as modestly higher retail and correspondent margins were largely offset by held for sale funding mix shift
Financial information for prior quarters in 2017 has been revised to reflect the impact of the adoption in fourth quarter 2017 of Accounting Standards Update (ASU) 2017-12 – Derivatives and Hedging (Topic 815): Targeted Improvements to Accounting for Hedging Activities. See page 1 for more information. (1) Metrics reported on a one-month lag from reported quarter-end; for example 4Q17 data as of November 2017 compared with November 2016. (2) Penetration defined as the percentage of Retail Banking households that have a credit card with Wells Fargo. Retail Banking households reflect only those households that maintain a retail checking account, which we believe provides the foundation for long-term retail banking relationships. Credit card household penetration rates have not been adjusted to reflect the impact of the potentially unauthorized accounts (determined principally based on whether the account was activated by the customer) identified by a third party consulting firm in August 2017 because the maximum impact in any one quarter was not greater than 127 bps. (3) Production margin represents net gains on residential mortgage loan origination/sales activities divided by total residential held-for-sale mortgage originations. Wells Fargo 4Q17 Supplement 23

Community Banking metrics
In 4Q17 customers continued to actively use their accounts
Branch and Digital Activity (in millions, unless otherwise noted) 4Q17 3Q17 2Q17 1Q17 4Q16
vs. 3Q17
vs. 4Q16
Branch and ATM Interactions (1) 364.3 374.2 379.9 367.4 382.7 -3% -5% Digital (Online and Mobile) Secure Sessions (2) 1,547.3 1,514.5 1,436.2 1,401.2 1,427.0 2% 8%
� Branch and ATM interactions (1) of 364.3 million in 4Q17 down 3% LQ and 5% YoY, reflecting continued customer migration to virtual channels, lower customer growth, and LQ seasonality impacts
� Total digital secure sessions (2) of 1,547.3 million, up 2% LQ and 8% YoY reflecting continued increases in digital adoption
Customers and Active Accounts (in millions, unless otherwise noted) 4Q17 3Q17 2Q17 1Q17 4Q16
vs. 3Q17
vs. 4Q16
Digital (Online and Mobile) Active Customers(2) 28.1 27.8 27.9 27.9 27.4 1% 3% Primary Consumer Checking Customers (2) (3) 23.6 23.6 23.6 23.5 23.6 0.1% 0.2% Consumer General Purpose Credit Card Active Accounts (4)(5) 7.9 7.8 7.7 7.6 7.9 1% 0%
� Digital (online and mobile) active customers (2) of 28.1 million, up modestly LQ and up 3% YoY - 21.2 million mobile active customers, up 1% LQ
• Mobile active customers continued to exceed desktop active customers � Primary consumer checking customers (2) (3) of 23.6 million, up modestly on both a LQ and YoY basis � Consumer general purpose credit card active accounts (4) (5) of 7.9 million, up modestly LQ and stable YoY
(1) A customer communication or transaction qualifies as a customer traffic interaction, which is consistent with the definition used by management for each customer channel presented. Preparation of customer traffic interaction metrics requires the application of interpretive judgement for each communication or transaction. Management uses these metrics to monitor customer traffic trends within the Company’s Retail Banking business.
(2) Metrics reported on a one-month lag from reported quarter-end; for example, 4Q17 data as of November 2017 compared with November 2016. (3) Customers who actively use their checking account with transactions such as debit card purchases, online bill payments, and direct deposit. (4) Accounts having at least one POS transaction, including POS reversal, during the period. (5) Credit card metrics shown in the table are for general purpose cards only.
Wells Fargo 4Q17 Supplement 24

-
Community Banking metrics
Balances and Activity (in millions, unless otherwise noted) 4Q17 3Q17 2Q17 1Q17 4Q16
vs. 3Q17
vs. 4Q16
Deposits ($ in billions)
$Consumer and Small Business Banking Deposits (Average) Debit Cards (1)
POS Transactions 2,120 2,093 2,101 1,964 2,040 1% 4% POS Purchase Volume (billions) $ 83.1 80.0 80.6 75.7 78.4 4% 6%
Consumer General Purpose Credit Cards (2) ($ in billions) POS Purchase Volume $ 19.1 18.2 17.9 16.2 18.0 5% 6% Outstandings (Average) 28.6 27.8 27.1 27.3 27.1 3% 5%
� Average consumer and small business banking deposit balances stable LQ and up 1% YoY � Debit cards (1) and consumer general purpose credit cards (2):
- Point-of-sale (POS) debit card transactions up 1% LQ on seasonality and up 4% YoY on stronger usage per account
- POS debit card purchase volume up 4% LQ due to holiday spending and up 6% YoY on an increase in transaction volume and a higher average transaction amount
- POS consumer general purpose credit card purchase volume up 5% LQ driven by holiday spending and up 6% YoY on active account growth and increased spend per account
- Consumer general purpose credit card average balances of $28.6 billion, up 3% LQ and up 5% YoY on higher spend per active account and transaction volume
757.5 755.1 760.1 758.8 749.9 0% 1%
Customer Experience Survey Scores with Branch (period end) 4Q17 3Q17 2Q17 1Q17 4Q16
vs. 3Q17
vs. 4Q16
Customer Loyalty 58.2% 57.2% 58.8% 57.9% 55.5% 101 bps 277 Overall Satisfaction with Most Recent Visit 78.0% 77.5% 77.8% 77.6% 76.4% 52 161
� With nearly 400,000 branch customer experience surveys completed during the fourth quarter and 1.6 million surveys completed in 2017, ‘Loyalty’ score improved LQ and ‘Overall Satisfaction with Most Recent Visit’ score was back to pre-sales practice settlement level
(1) Combined consumer and business debit card activity. (2) Credit card metrics shown in the table are for general purpose cards only. Wells Fargo 4Q17 Supplement 25

Wholesale Banking
($ in millions) 4Q17 vs
3Q17 vs
4Q16
Net interest income $ 4,211 (3) % (3)
Noninterest income 2,883 5 2
Provision for credit losses 20 (71) (88)
Noninterest expense 4,204 (1) 5
Income tax expense 716 (2) (10)
Segment net income $ 2,148 5 % (2)
($ in billions) Avg loans, net $ 463.5 - Avg deposits 465.7 - 1
Key Metrics: Commercial card spend volume (1) $ 7.8 3 % 13 U.S. investment banking market share (2) 3.6
($ in billions) 4Q17 vs
3Q17 vs
4Q16
Financial information for prior quarters in 2017 has been revised to reflect the impact of the adoption in fourth quarter 2017 of Accounting Standards Update (ASU) 2017-12 – Derivatives and Hedging (Topic 815): Targeted Improvements to Accounting for Hedging Activities. See page 1 for more information. (1) Includes commercial card volume for the entire company. (2) Full year 2017. Source: Dealogic U.S. investment banking fee market share. Wells Fargo 4Q17 Supplement
� Net income of $2.1 billion, down 2% YoY and up 5% LQ
� Net interest income down 3% LQ reflecting a $183 million reduction related to leveraged leases as a result of the Tax Act
� Noninterest income up 5% LQ reflecting the $848 million gain on the sale of WFIS and higher CRE brokerage, partially offset by $414 million in investment impairments resulting from the Tax Act, as well as lower trading, investment banking and insurance income
� Provision for credit losses decreased $49 million LQ on continued improvement in credit performance
� Noninterest expense down 1% LQ
Treasury Management � Treasury management revenue up 1% LQ and
2% YoY reflecting new product sales � Commercial card spend volume (1) of $7.8 billion,
up 13% YoY on customer growth and an increase in transaction volumes, and up 3% LQ
Investment Banking � 2017 U.S. investment banking market share of
3.6% (2) vs. 2016 (2) of 4.4% reflected market growth in areas where Wells Fargo Securities has a narrower scope
26
Wealth and Investment Management
($ in millions) 4Q17 vs
3Q17 vs
4Q16
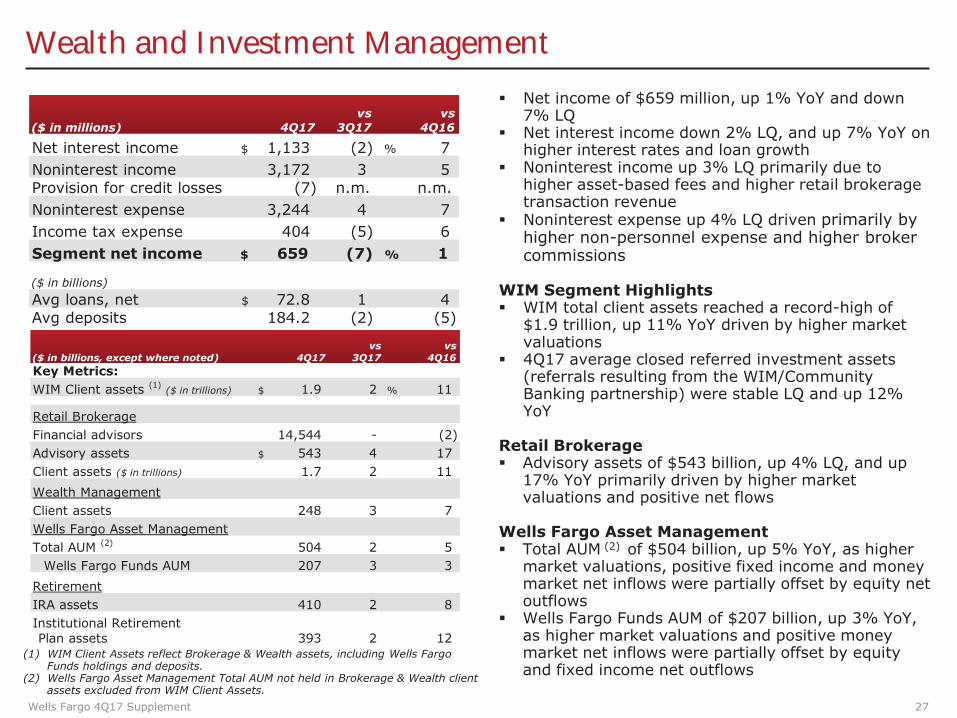
Net interest income $ 1,133 (2) % 7 Noninterest income 3,172 3 5 Provision for credit losses (7) n.m. n.m. Noninterest expense 3,244 4 7 Income tax expense 404 (5) 6 Segment net income $ 659 (7) % 1
($ in billions) Avg loans, net $ 72.8 1 4 Avg deposits 184.2 (2) (5)
($ in billions, except where noted) 4Q17 vs
3Q17 vs
4Q16 Key Metrics: WIM Client assets (1) ($ in trillions) $ 1.9 2 % 11
Retail Brokerage Financial advisors 14,544 - (2) Advisory assets $ 543 4 17 Client assets ($ in trillions) 1.7 2 11 Wealth Management Client assets 248 3 7 Wells Fargo Asset Management Total AUM (2) 504 2 5
Wells Fargo Funds AUM 207 3 3 Retirement IRA assets 410 2 8 Institutional Retirement Plan assets 393 2 12
(1) WIM Client Assets reflect Brokerage & Wealth assets, including Wells Fargo Funds holdings and deposits.
(2) Wells Fargo Asset Management Total AUM not held in Brokerage & Wealth client assets excluded from WIM Client Assets.
� Net income of $659 million, up 1% YoY and down 7% LQ
� Net interest income down 2% LQ, and up 7% YoY on higher interest rates and loan growth
� Noninterest income up 3% LQ primarily due to higher asset-based fees and higher retail brokerage transaction revenue
� Noninterest expense up 4% LQ driven primarily by higher non-personnel expense and higher broker commissions
WIM Segment Highlights � WIM total client assets reached a record-high of
$1.9 trillion, up 11% YoY driven by higher market valuations
� 4Q17 average closed referred investment assets (referrals resulting from the WIM/Community Banking partnership) were stable LQ and up 12% YoY
Retail Brokerage � Advisory assets of $543 billion, up 4% LQ, and up
17% YoY primarily driven by higher market valuations and positive net flows
Wells Fargo Asset Management � Total AUM (2) of $504 billion, up 5% YoY, as higher
market valuations, positive fixed income and money market net inflows were partially offset by equity net outflows
� Wells Fargo Funds AUM of $207 billion, up 3% YoY, as higher market valuations and positive money market net inflows were partially offset by equity and fixed income net outflows
Wells Fargo 4Q17 Supplement 27

Credit quality
Provision Expense and Net Charge-offs ($ in millions)
905 805
605 555
717 651
805
655 717 751
0.37% 0.34% 0.27% 0.30% 0.31%
4Q16 1Q17 2Q17 3Q17 4Q17 Provision Expense Net Charge-offs Net Charge-off Rate
Nonperforming Assets ($ in billions)
11.4 10.7
10.4
1.0
9.8
0.9 9.8 9.3
8.7 0.8
9.0
0.7
8.6
0.7
8.0
4Q16 1Q17 2Q17 3Q17 4Q17 Nonaccrual loans Foreclosed assets
Wells Fargo 4Q17 Supplement
� Net charge-offs of $751 million, up $34 million, or 5%, LQ
� $100 million reserve release reflected continued strong credit performance
� 0.31% net charge-off rate - Commercial losses of 9 bps, stable LQ - Consumer losses of 56 bps, up 3 bps LQ on
higher losses in credit card, partially offset by higher consumer real estate recoveries, and lower auto losses
� NPAs decreased $647 million LQ - Nonaccrual loans decreased $583 million on a
$469 million decline in commercial nonaccruals and a $114 million decline in consumer nonaccruals
- Foreclosed assets declined $64 million � Allowance for credit losses = $12.0 billion
- Allowance covered 4.0x annualized 4Q17 net charge-offs
� Oil and gas loan portfolio of $12.5 billion, down $342 million, or 3%, LQ and 16% YoY
- $20 million of net charge-offs in 4Q17, down $15 million LQ
- Nonaccrual loans of $1.1 billion, down $467 million, or 30%, LQ
- Criticized loans of $3.1 billion, down $1.0 billion, or 24%, LQ
- Allowance for credit losses allocated for the oil and gas portfolio = 5.6% of total oil and gas loans outstanding
28

Capital
Capital Position
10.8% 11.2%
11.6% 11.8% 11.9%
4Q16 1Q17 2Q17 3Q17 4Q17 Estimated
Common Equity Tier 1 Ratio (Fully Phased-In) (1)
(1) 4Q17 capital ratio is a preliminary estimate. Fully phased-in capital ratios are calculated assuming the full phase-in of the Basel III capital rules. See page 39 for additional information regarding capital ratios.
(2) Net payout ratio means the ratio of (i) common stock dividends and share repurchases less issuances and stock compensation-related items, divided by (ii) net income applicable to common stock.
� Common Equity Tier 1 ratio well above the regulatory minimum and our internal target of 10%
- Common Equity Tier 1 ratio (fully phased-in) of 11.9% at 12/31/17 (1)
Capital Return � Period-end common shares outstanding down
36.3 million LQ - Settled 51.4 million common share repurchases - Issued 15.1 million common shares
� Continued strong capital return to shareholders - Net payout ratio (2) of 69.7% in 4Q17 - Returned $4.0 billion to shareholders
in 4Q17, up 1% LQ and 34% YoY - Net share repurchases up 3% LQ and 91% YoY
Total Loss Absorbing Capacity (TLAC) Update � As of 12/31/2017, we estimate that our eligible
external TLAC as a percentage of total risk-weighted assets was 23.9% compared with an expected 1/1/2019 required minimum of 22.0%
Wells Fargo 4Q17 Supplement 29

Summary
2017 � Net income of $22.2 billion; diluted EPS of $4.10
� Revenue of $88.4 billion, up modestly from 2016
� ROA = 1.15%; ROE = 11.35%; ROTCE (1) = 13.55%
� Returned $14.5 billion to shareholders through common stock dividends and net share repurchases, up 16% from $12.5 billion in 2016
4Q17 � Net income of $6.2 billion; diluted EPS of $1.16, including the following noteworthy items:
- $3.35 billion after-tax benefit, or $0.67 per share, from the Tax Cuts & Jobs Act (Tax Act)
- $848 million pre-tax gain, or $0.11 per share, on sale of Wells Fargo Insurance Services USA
- $3.25 billion pre-tax expense, or $(0.59) per share, from litigation accruals
� ROA = 1.26%; ROE = 12.47%; ROTCE (1) = 14.85%
� Strong balance sheet with high levels of capital and liquidity - Period-end loans decreased $10.8 billion, or 1%, YoY
- Period-end deposits up $29.9 billion, or 2%, YoY
� Diversified and high quality loan portfolio - Strong credit quality with net charge-offs of 0.31% of average loans (annualized)
� Returned $4.0 billion to shareholders through common stock dividends and net share repurchases, up 34% YoY
- Net share repurchases of $2.1 billion, up 91% YoY
(1) Tangible common equity is a non-GAAP financial measure and represents total equity less preferred equity, noncontrolling interests, and goodwill and certain identifiable intangible assets (including goodwill and intangible assets associated with certain of our nonmarketable equity investments but excluding mortgage servicing rights), net of applicable deferred taxes. The methodology of determining tangible common equity may differ among companies. Management believes that return on average tangible common equity, which utilizes tangible common equity, is a useful financial measure because it enables investors and others to assess the Company's use of equity. See page 40 for additional information.
Wells Fargo 4Q17 Supplement 30

Appendix

Innovating for our customers
4Q16 4Q17
Digital 5-min New customer Digital mortgage mobile borrowing Digital credit card account application experience, with acquisition (launch open for Acquisition multi-product model expected deposits offers (in pilot)1Q18)
Control Tower Zelle® P2P Debit cardInstant B2C Phase 1: Customer payments on-off payment control over WF experience in capability indisbursements Payments accounts and WF mobile WF mobilevia Push-to recurring payments app appCard API (in pilot)
Intuitive Greenhouse: aDaily Change: Personalized Investor digital digital banking Interactive
insights and advice brokerage advisory experience with Personalized mobile app with predictive account for the cash management encouraging Advice banking next generation of tools (2018 customers to
technology investors expected save (launched 11/17)
Expanded and
Integrated Distribution
Card-free ATM access (via onetime password) to Wells Fargo’s
13,000 ATMs
Secure access to WF services via chatbot on FB
messenger (in pilot)
Make an Appointment
API to schedule appointments
with WF on non-WF websites
Over 5,000 WF ATMs enabled
with NFC technology for “tap and pay”
banking
Created Artificial Announced 4 new Phase 1 of Enterprise Intelligence (AI) participants in WFDigital Identity Service,COE to develop a Platform for Startupleveraging thousands of data common platform Accelerator; 17Innovation sources to improve real-time and identify use account open experience participants currently cases for AI across in programthe enterprise
Wells Fargo 4Q17 Supplement 32

-
Adoption of hedge accounting update ASU 2017-12
� Final standard issued in late August with an effective date of 1Q19
� Elected to early adopt in 4Q17 retroactive to January 1, 2017, and our financial statements for 2017 include a cumulative effect adjustment to opening retained earnings as well as adjustments to our previously reported 2017 earnings
($ in millions) Line Affected
(pre tax) Revenue
Other Comprehensive
Income Retained Earnings
Net Income
Diluted EPS
January 1- September 30, 2017 Impact
Net interest income, $(15)MM; $ 242 5 (212) 169 $ 0.03 Impacts from early adoption of new hedge Other income, $257MM accounting standard (ASU 2017-12)
Impacts related to our interest rate and foreign currency long-term debt hedges
- 2017 quarterly diluted earnings per share (EPS) impacts: • 1Q17 up $0.03 to $1.03 EPS • 2Q17 up $0.01 to $1.08 EPS • 3Q17 down $0.01 to $0.83 EPS
� As a result of the adoption, our interest rate and foreign currency hedge accounting ineffectiveness related to our long-term debt hedges has been significantly reduced
� Going forward:
- Remaining ineffectiveness related to fair value hedges of interest rate risk will be recognized in net interest income
- Remaining ineffectiveness volatility related to foreign currency hedges will continue to be recognized in noninterest income
Wells Fargo 4Q17 Supplement 33

Noninterest expense analysis (reference for slides 17-18)
For analytical purposes, we have grouped our noninterest expense into six categories:
Compensation & Benefits: Salaries, benefits and non-revenue-related incentive compensation
Revenue-related: Incentive compensation directly tied to generating revenue; businesses with expenses directly tied to revenue (operating leases, insurance)
Third Party Services: Expenses related to the use of outside parties, such as legal and consultant costs
“Running the Business” – Non Discretionary: Expenses that are costs of doing business, including foreclosed asset expense and FDIC assessments
“Running the Business” – Discretionary: Travel, advertising, postage, etc.
Infrastructure: Equipment, occupancy, etc.
Wells Fargo 4Q17 Supplement 34

($ in millions) 4Q17 3Q17
Net charge-offs $ (23) (16) as % of average loans (0.03) % (0.02)
Real estate 1-4 family mortgage portfolio
Real estate 1-4 family first mortgage loans: $ 284,054 280,173 Nonaccrual loans 4,122 4,213 as % of loans 1.45 % 1.50
Real estate 1-4 family junior $lien mortgage loans: 39,713 41,152 Nonaccrual loans 1,086 1,101 as % of loans 2.73 % 2.68 Net charge-offs $ (7) 1 as % of average loans (0.06) %
� Pick-a-Pay PCI portfolio - Remaining nonaccretable difference of $292 million - Accretable yield balance of $8.7 billion, down $315
million LQ as accretion was partially offset by a $2 million reclass from nonaccretable difference in 4Q17 • Weighted average life of 6.8 years, stable LQ • 4Q17 accretable yield percentage of 9.83%
expected to increase to ~9.85% in 1Q18 reflecting improved cash flow timing
� First lien mortgage loans up $3.9 billion LQ as nonconforming mortgage growth was partially offset by a decline in Pick-a-Pay loan balances
- Nonconforming mortgage loans increased $5.9 billion to $190.5 billion (1)
- First lien home equity lines of $13.5 billion, down $327 million
� First lien credit performance - Nonaccrual loans down $91 million, or
5 bps, LQ - Net recovery of $23 million, up $7 million LQ
� Pick-a-Pay non-PCI portfolio - Loans of $13.4 billion, down 5% LQ primarily
reflecting loans paid-in-full - Nonaccrual loans decreased $57 million,
or 5%, LQ - Net recovery of $12 million, down $1
million LQ
- Current average LTV of 48% (2)
� Junior lien mortgage loans down $1.4 billion, or 3%, LQ as paydowns more than offset new originations
- Junior lien nonaccrual loans down $15 million, or 1%, LQ
- Junior lien net charge-offs down $8 million LQ to a net recovery of $7 million
(1) Nonconforming mortgages originated post February 2009. (2) The current loan-to-value (LTV) ratio is calculated as the net carrying value divided by the collateral value. Wells Fargo 4Q17 Supplement 35
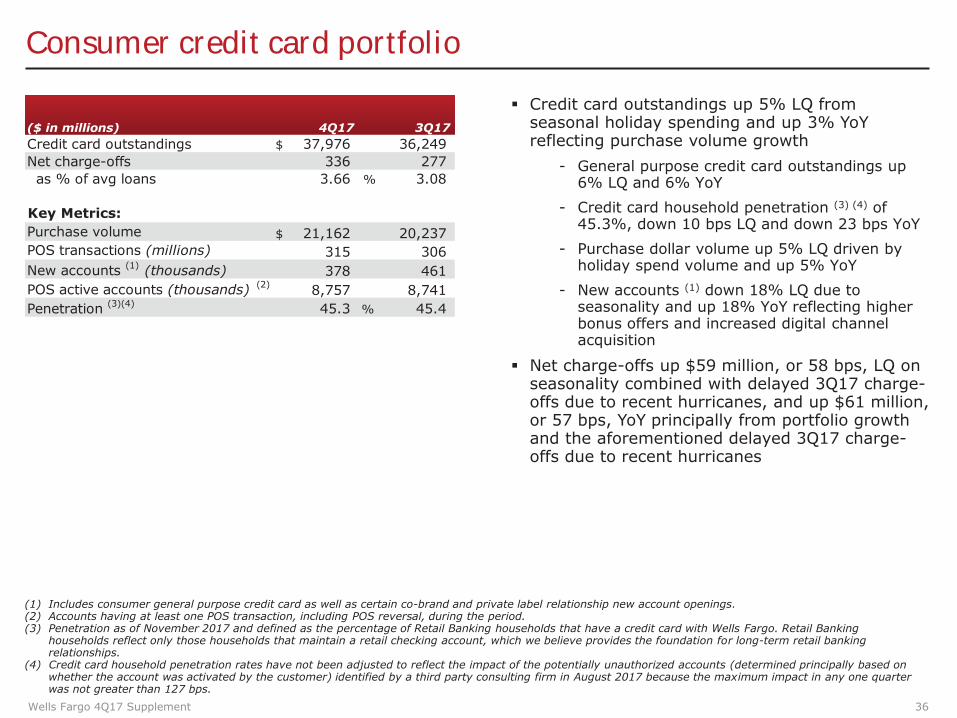
Consumer credit card portfolio
($ in millions) 4Q17 3Q17 Credit card outstandings $ 37,976 36,249 Net charge-offs 336 277 as % of avg loans 3.66 % 3.08
Key Metrics: Purchase volume $ 21,162 20,237 POS transactions (millions) 315 306 New accounts (1) (thousands) 378 461 POS active accounts (thousands) (2) 8,757 8,741 Penetration (3)(4) 45.3 % 45.4
� Credit card outstandings up 5% LQ from seasonal holiday spending and up 3% YoY reflecting purchase volume growth
- General purpose credit card outstandings up 6% LQ and 6% YoY
- Credit card household penetration (3) (4) of 45.3%, down 10 bps LQ and down 23 bps YoY
- Purchase dollar volume up 5% LQ driven by holiday spend volume and up 5% YoY
- New accounts (1) down 18% LQ due to seasonality and up 18% YoY reflecting higher bonus offers and increased digital channel acquisition
� Net charge-offs up $59 million, or 58 bps, LQ on seasonality combined with delayed 3Q17 charge-offs due to recent hurricanes, and up $61 million, or 57 bps, YoY principally from portfolio growth and the aforementioned delayed 3Q17 charge-offs due to recent hurricanes
(1) Includes consumer general purpose credit card as well as certain co-brand and private label relationship new account openings. (2) Accounts having at least one POS transaction, including POS reversal, during the period. (3) Penetration as of November 2017 and defined as the percentage of Retail Banking households that have a credit card with Wells Fargo. Retail Banking
households reflect only those households that maintain a retail checking account, which we believe provides the foundation for long-term retail banking relationships.
(4) Credit card household penetration rates have not been adjusted to reflect the impact of the potentially unauthorized accounts (determined principally based on whether the account was activated by the customer) identified by a third party consulting firm in August 2017 because the maximum impact in any one quarter was not greater than 127 bps.
Wells Fargo 4Q17 Supplement 36

Auto portfolios
($ in millions) 4Q17 3Q17
Auto outstandings $ 51,831 53,723 Nonaccrual loans 127 135 as % of loans 0.25 % 0.25 Net charge-offs $ 184 198 as % of avg loans 1.39 % 1.43 30+ days past due $ 1,859 1,557 as % of loans 3.59 % 2.90
Auto outstandings $ 1,540 1,732 Nonaccrual loans 3 2 as % of loans 0.19 % 0.12 Net charge-offs $ 4 4 as % of avg loans 0.94 % 0.85 30+ days past due $ 17 14 as % of loans 1.10 % 0.81
Commercial: Auto outstandings $ 11,367 10,986 Nonaccrual loans 3 3 as % of loans 0.03 % 0.03 Net charge-offs $ - (1) as % of avg loans - % (0.02)
Indirect Consumer:
Direct Consumer:
Wells Fargo 4Q17 Supplement
Consumer Portfolio � Auto outstandings of $53.4 billion, down 4% LQ
and 14% YoY - $1.9 billion of outstandings in Puerto Rico
(Reliable Financial) - Customer payment moratorium provided
the option to defer payments up to 90 days beginning in September 2017
- 4Q17 originations of $4.3 billion, stable LQ, and down 33% YoY reflecting our tighter underwriting standards
� Nonaccrual loans decreased $7 million LQ and were up $24 million YoY
� Net charge-offs down $14 million LQ, and up $22 million YoY predominantly driven by higher severity resulting from a temporary moratorium on certain repossessions for customers who have had collateral protection insurance (CPI) policies purchased on their behalf while we remediate the previously disclosed CPI issues, as well as the seasoning of 2016 originated loans
� 30+ days past due increased $305 million LQ largely driven by seasonality and the end of hurricane-related customer payment moratoriums, and increased $200 million YoY on higher frequency of default from vintage maturation
Commercial Portfolio � Loans of $11.4 billion up 3% LQ and 1% YoY on
higher dealer floor plan utilization - $340 million of outstandings in Puerto Rico
(Reliable Financial) 37

Student lending portfolio
($ in millions) 4Q17 3Q17 Private outstandings $ 11,945 12,174 Net charge-offs 35 29 as % of avg loans 1.14 % 0.94 30+ days past due $ 193 194 as % of loans 1.61 % 1.59
� $11.9 billion private loan outstandings down 2% LQ and 4% YoY on higher paydowns/payoffs
- Average FICO of 761 and 83% of the total outstandings have been co-signed
- Originations down 17% YoY reflecting lower customer sentiment
� Net charge-offs increased $6 million LQ due to seasonality of repayments and decreased $10 million YoY
� 30+ days past due decreased $1 million LQ and $36 million YoY
� Part of the YoY trends in net charge-offs and 30+ days past due reflected the 90 day suspension of collection activities in hurricane-impacted areas
Wells Fargo 4Q17 Supplement 38

Common Equity Tier 1 (Fully Phased-In)
Wells Fargo & Company and Subsidiaries COMMON EQUITY TIER 1 UNDER BASEL III (FULLY PHASED-IN) (1)
Estimated Dec 31, Sep 30, Jun 30, Mar 31, Dec 31,
(in billions, except ratio) 2017 2017 2017 2017 2016 Total equity (2) $ 208.1 206.6 205.9 202.3 200.5
Adjustments: Preferred stock (25.4) (25.6) (25.8) (25.5) (24.6) Additional paid-in capital on ESOP
preferred stock (0.1) (0.1) (0.1) (0.2) (0.1)
Unearned ESOP shares 1.7 1.9 2.1 2.5 1.6 Noncontrolling interests (1.1) (0.9) (0.9) (1.0) (0.9)
Total common stockholders' equity (2) 183.2 181.9 181.2 178.1 176.5
Adjustments: Goodwill (26.6) (26.6) (26.6) (26.7) (26.7) Certain identifiable intangible assets (other than
(1.6) (1.9) (2.1) (2.4) (2.7)MSRs) Other assets (3) (2.2) (2.3) (2.2) (2.1) (2.1) Applicable deferred taxes (4) 1.0 1.6 1.6 1.7 1.8 Investment in certain subsidiaries and other 0.2 (0.1) (0.2) (0.1) (0.4)
Common Equity Tier 1 (Fully Phased-In) under Basel III (A) 154.0 152.6 151.7 148.5 146.4
Total risk-weighted assets (RWAs) anticipated under Basel III (5)(6) (B) $ 1,292.3 1,292.8 1,310.5 1,324.5 1,358.9
Common Equity Tier 1 to total RWAs anticipated under Basel III (Fully Phased-In) (6) (A)/(B) 11.9% 11.8 11.6 11.2 10.8
(1) Basel III capital rules, adopted by the Federal Reserve Board on July 2, 2013, revised the definition of capital, increased minimum capital ratios, and introduced a minimum Common Equity Tier 1 (CET1) ratio. These rules established a new comprehensive capital framework for U.S. banking organizations that implements the Basel III capital framework and certain provisions of the Dodd-Frank Act. The rules are being phased in through the end of 2021. Fully phased-in capital amounts, ratios and RWAs are calculated assuming the full phase-in of the Basel III capital rules. Fully phased-in regulatory capital amounts, ratios and RWAs are considered non-GAAP financial measures that are used by management, bank regulatory agencies, investors and analysts to assess and monitor the Company’s capital position.
(2) Financial information for prior quarters in 2017 has been revised to reflect the impact of the adoption in fourth quarter 2017 of Accounting Standards Update (ASU) 201712 – Derivatives and Hedging (Topic 815): Targeted Improvements to Accounting for Hedging Activities. See page 1 for more information.
(3) Represents goodwill and other intangibles on nonmarketable equity investments, which are included in other assets. (4) Applicable deferred taxes relate to goodwill and other intangible assets. They were determined by applying the combined federal statutory rate and composite state income
tax rates to the difference between book and tax basis of the respective goodwill and intangible assets at period end. (5) The final Basel III capital rules provide for two capital frameworks: the Standardized Approach, which replaced Basel I, and the Advanced Approach applicable to certain
institutions. Under the final rules, we are subject to the lower of our CET1 ratio calculated under the Standardized Approach and under the Advanced Approach in the assessment of our capital adequacy. Because the final determination of our CET1 ratio and which approach will produce the lower CET1 ratio as of December 31, 2017, is subject to detailed analysis of considerable data, our CET1 ratio at that date has been estimated using the Basel III definition of capital under the Basel III Standardized Approach RWAs. The capital ratio for September 30, June 30 and March 31, 2017, and December 31, 2016, was calculated under the Basel III Standardized Approach RWAs.
(6) The Company’s December 31, 2017, RWAs and capital ratio are preliminary estimates.
Wells Fargo 4Q17 Supplement 39

Return on average tangible common equity (ROTCE)
Wells Fargo & Company and Subsidiaries TANGIBLE COMMON EQUITY (1)
Quarter ended Year ended (in millions, except ratios) Dec 31, 2017 Dec 31, 2017
Return on average tangible common equity (1):
Net income applicable to common stock (A) $ 5,740 20,554
Average total equity 207,413 205,654
Adjustments:
Preferred stock (25,569) (25,592)
Additional paid-in capital on ESOP preferred stock (129) (139)
Unearned ESOP shares 1,896 2,143
Noncontrolling interests (998) (948)
Average common stockholders’ equity (B) 182,613 181,118
Adjustments:
Goodwill (26,579) (26,629)
Certain identifiable intangible assets (other than MSRs) (1,767) (2,176)
Other assets (2) (2,245) (2,184)
Applicable deferred taxes (3) 1,332 1,570
Average tangible common equity (C) $ 153,354 151,699
Return on average common stockholders' equity (ROE) (annualized) (A)/(B) 12.47% 11.35
Return on average tangible common equity (ROTCE) (annualized) (A)/(C) 14.85 13.55
(1) Tangible common equity is a non-GAAP financial measure and represents total equity less preferred equity, noncontrolling interests, and goodwill and certain identifiable intangible assets (including goodwill and intangible assets associated with certain of our nonmarketable equity investments but excluding mortgage servicing rights), net of applicable deferred taxes. The methodology of determining tangible common equity may differ among companies. Management believes that return on average tangible common equity, which utilizes tangible common equity, is a useful financial measure because it enables investors and others to assess the Company's use of equity.
(2) Represents goodwill and other intangibles on nonmarketable equity investments, which are included in other assets.
(3) Applicable deferred taxes relate to goodwill and other intangible assets. They were determined by applying the combined federal statutory rate and composite state income tax rates to the difference between book and tax basis of the respective goodwill and intangible assets at period end.
Wells Fargo 4Q17 Supplement 40

Forward-looking statements and additional information
Forward-looking statements: This document contains “forward-looking statements” within the meaning of the Private Securities Litigation Reform Act of 1995. In addition, we may make forward-looking statements in our other documents filed or furnished with the SEC, and our management may make forward-looking statements orally to analysts, investors, representatives of the media and others. Forward-looking statements can be identified by words such as “anticipates,” “intends,” “plans,” “seeks,” “believes,” “estimates,” “expects,” “target,” “projects,” “outlook,” “forecast,” “will,” “may,” “could,” “should,” “can” and similar references to future periods. In particular, forward-looking statements include, but are not limited to, statements we make about: (i) the future operating or financial performance of the Company, including our outlook for future growth; (ii) our noninterest expense and efficiency ratio; (iii) future credit quality and performance, including our expectations regarding future loan losses and allowance levels; (iv) the appropriateness of the allowance for credit losses; (v) our expectations regarding net interest income and net interest margin; (vi) loan growth or the reduction or mitigation of risk in our loan portfolios; (vii) future capital or liquidity levels or targets and our estimated Common Equity Tier 1 ratio under Basel III capital standards; (viii) the performance of our mortgage business and any related exposures; (ix) the expected outcome and impact of legal, regulatory and legislative developments, as well as our expectations regarding compliance therewith; (x) future common stock dividends, common share repurchases and other uses of capital; (xi) our targeted range for return on assets and return on equity; (xii) the outcome of contingencies, such as legal proceedings; and (xiii) the Company’s plans, objectives and strategies. Forward-looking statements are not based on historical facts but instead represent our current expectations and assumptions regarding our business, the economy and other future conditions. Investors are urged to not unduly rely on forward-looking statements as actual results could differ materially from expectations. Forward-looking statements speak only as of the date made, and we do not undertake to update them to reflect changes or events that occur after that date. For more information about factors that could cause actual results to differ materially from expectations, refer to the “Forward-Looking Statements” discussion in Wells Fargo’s press release announcing our fourth quarter 2017 results and in our most recent Quarterly Report on Form 10-Q, as well as to Wells Fargo’s other reports filed with the Securities and Exchange Commission, including the discussion under “Risk Factors” in our Annual Report on Form 10-K for the year ended December 31, 2016.
Purchased credit-impaired loan portfolios: Loans acquired that were considered credit impaired at acquisition were written down at that date in purchase accounting to an amount estimated to be collectible and the related allowance for loan losses was not carried over to Wells Fargo’s allowance. In addition, such purchased credit-impaired loans are not classified as nonaccrual or nonperforming, and are not included in loans that were contractually 90+ days past due and still accruing. Any losses on such loans are charged against the nonaccretable difference established in purchase accounting and are not reported as charge-offs (until such difference is fully utilized). As a result of accounting for purchased loans with evidence of credit deterioration, certain ratios of Wells Fargo are not comparable to a portfolio that does not include purchased credit-impaired loans. In certain cases, the purchased credit-impaired loans may affect portfolio credit ratios and trends. Management believes that the presentation of information adjusted to exclude the purchased credit-impaired loans provides useful disclosure regarding the credit quality of the non-impaired loan portfolio. Accordingly, certain of the loan balances and credit ratios in this document have been adjusted to exclude the purchased credit-impaired loans. References in this document to impaired loans mean the purchased credit-impaired loans. Please see page 31 of the press release announcing our 4Q17 results for additional information regarding the purchased credit-impaired loans.
Wells Fargo 4Q17 Supplement 41