wellington regional freight background report - gw · 5.1.1 strategic rail network ......
TRANSCRIPT

Wellington Regional Freight Background Report
March 2011


WGN_DOCS-#902458-V1 i
Table of contents
TABLE OF CONTENTS................................................................................................................................................... I
1. GOAL ........................................................................................................................................................................1
2. OBJECTIVES...........................................................................................................................................................1
3. METHODOLOGY ...................................................................................................................................................1
4. BACKGROUND.......................................................................................................................................................2
4.1 STUDIES.............................................................................................................................................................4 4.1.1 National Freight Demands Study (September 2008)....................................................................................4 4.1.2 Freight Analysis for the Wellington, Nelson, Marlborough and Tasman regions (June 2009)....................5 4.1.3 High Productivity Motor-Vehicle route studies (On-going).........................................................................5 4.1.4 Freight futures – long term sea freight scenarios (September 2010) ...........................................................6 4.1.5 The Question of Bigger Ships (August 2010) ...............................................................................................7
4.2 NATIONAL LEGISLATION , STRATEGIES AND PLANS.............................................................................................7 4.2.1 Land Transport Management Act 2003........................................................................................................7 4.2.2 Road User Charges ......................................................................................................................................8 4.2.3 National Infrastructure Plan ........................................................................................................................9 4.2.4 New Zealand Transport Strategy 2008.........................................................................................................9 4.2.5 Government Policy Statement on land transport funding 2009 ...................................................................9 4.2.6 KiwiRail Turnaround Plan.........................................................................................................................10
4.3 REGIONAL STRATEGIES AND PLANS.................................................................................................................11 4.3.1 Regional Land Transport Strategy 2010 – 2040 ........................................................................................11 4.3.2 Wellington Regional Strategy.....................................................................................................................14 4.3.3 Wellington Regional Rail Plan...................................................................................................................15
4.4 PERFORMANCE OF CURRENT REGIONAL FREIGHT PLAN 2007..........................................................................16 4.4.1 Facilitate rail based transfer of logs to CentrePort ...................................................................................16 4.4.2 Protect short haul rail freight.....................................................................................................................16 4.4.3 Improve long haul rail freight efficiency....................................................................................................16
5. INFRASTRUCTURE AND LAND USE ..............................................................................................................16
5.1 STRATEGIC TRANSPORT NETWORK...................................................................................................................16 5.1.1 Strategic rail network.................................................................................................................................17 5.1.2 Strategic road network ...............................................................................................................................17
5.2 REGIONAL CENTRES AND IMPORTANT DESTINATIONS......................................................................................17 5.2.1 Key regional centres...................................................................................................................................17 5.2.2 CentrePort..................................................................................................................................................18 5.2.3 Ferry Terminal ...........................................................................................................................................19 5.2.4 Wellington International Airport................................................................................................................19
5.3 LAND USES.......................................................................................................................................................19 5.3.1 Industrial land............................................................................................................................................19 5.3.2 Integration of land use and transport planning..........................................................................................21

WGN_DOCS-#902458-V1 ii
6. CURRENT FREIGHT MOVEMENTS................................................................................................................23
6.1 OVERALL FREIGHT MOVEMENTS......................................................................................................................23 6.2 MODAL BREAKDOWN.......................................................................................................................................24
6.2.1 Road ...........................................................................................................................................................26 6.2.2 Rail .............................................................................................................................................................29 6.2.3 Sea freight ..................................................................................................................................................29 6.2.4 Summary.....................................................................................................................................................31
6.3 COMMODITIES..................................................................................................................................................32 6.3.1 Projected growth ........................................................................................................................................34
7. ISSUES AND LIMITATIONS ..............................................................................................................................34
7.1 CONGESTION....................................................................................................................................................34 7.2 ROAD FREIGHT TRAVEL TIME BETWEEN KEY DESTINATIONS............................................................................36 7.3 TRAVEL TIME VARIABILITY BY ROAD ...............................................................................................................39 7.4 EMPTY RUNNING..............................................................................................................................................41 7.5 RAIL CONSTRAINTS..........................................................................................................................................41 7.6 NETWORK RELIABILITY ...................................................................................................................................42 7.7 FERRY CAPACITY.............................................................................................................................................43 7.8 ACCESS TO CENTREPORT.................................................................................................................................44 7.9 PORT CAPACITY...............................................................................................................................................45 7.10 AIRPORT CAPACITY..........................................................................................................................................46 7.11 SAFETY AND PERSONAL SECURITY...................................................................................................................46 7.12 ENVIRONMENT.................................................................................................................................................47 7.13 AFFORDABILITY ...............................................................................................................................................48 7.14 PEAK OIL ..........................................................................................................................................................48 7.15 INFORMATION GAPS.........................................................................................................................................49
8. POTENTIAL CHANGES IN FREIGHT MOVEMENTS..................................................................................49
8.1 THE CONTEXT – ECONOMIC AND POPULATION GROWTH...................................................................................50 8.2 CENTRALISED DISTRIBUTION CENTRES............................................................................................................50 8.3 BIGGER SHIPS...................................................................................................................................................51 8.4 CHANGES TO PORT OPERATIONS......................................................................................................................52 8.5 OVER-WEIGHT AND OVER-DIMENSION VEHICLES.............................................................................................52 8.6 EMISSIONS TRADING SCHEME..........................................................................................................................53 8.7 OTHER TOOLS INCLUDING ROAD PRICING.........................................................................................................53
9. OPPORTUNITIES FOR IMPROVING FREIGHT EFFICIENCIES ..............................................................53
9.1 OPPORTUNITIES FOR ROAD...............................................................................................................................53 9.2 OPPORTUNITIES FOR RAIL................................................................................................................................54 9.3 OPPORTUNITIES FOR THE PORT.........................................................................................................................54 9.4 OPPORTUNITIES FOR THE AIRPORT...................................................................................................................55
10. CONCLUSION ..................................................................................................................................................56
BIBLIOGRAPHY ............................................................................................................................................................57

WGN_DOCS-#902458-V1 1
1. Goal
To develop a robust and comprehensive Regional Freight Plan for the Wellington region in line with the Wellington Regional Land Transport Strategy (RLTS) 2010 – 2040 and with the support of all stakeholders involved.
The Regional Freight Plan will identify issues and opportunities for freight movement in, out and through the Wellington region as well as prioritise a series of projects and activities for inclusion in future Regional Land Transport Programmes.
2. Objectives
The purpose of this background report is to collate the latest available information in order to provide an evidence-based platform to create the next Regional Freight Plan. To do this the Wellington Regional Freight Background Report has the following objectives:
1. Describe the infrastructure and land uses that enable and generate freight within the region
2. Describe current freight movements in, out and through the region as accurately as possible
3. Identify the issues and limitations of freight movement in, out and through the region
4. Assess how freight movements may change for the region over the next 5 to 10 years
5. Identify opportunities for improving freight efficiencies in, out and through the Wellington region – focusing on transport infrastructure.
3. Methodology
This background report combines the latest quantitative data available with the qualitative information on issues, changes and opportunities.
This background report combines information from three principle sources:
1. National Freight Demands Study 2008 2. Hyder Wellington Freight Analysis 2009 3. 2009/10 Annual Monitoring Report on the Wellington RLTS
These and other sources of information are summarised in section 4.1.
A questionnaire was sent out to transport network providers (New Zealand Transport Agency, KiwiRail, CentrePort, Wellington International Airport, local councils) freight user groups and advocacy associations, and other interested parties (such as the Wellington and Wairarapa chambers of commerce, Automobile Association, etc.). The questionnaire was also sent out to members of the Chartered Institute of Logistics and Transport to diversify the input into this report.
The questionnaire asked for responses concerning issues facing the freight sector, opportunities to improve the efficiency of freight movements, awareness of information gaps and what they believed would be the most significant changes in how freight moves in, out and through the Wellington region over the next 5 to 10 years.
WGN_DOCS-#902458-V1 2
4. Background
The region’s freight network consists of road, rail and sea freight. Air freight plays a fairly minor role at this time, but may increase due to planned investment by Wellington International Airport. The two primary freight modes in the Wellington region are road and rail.
Road freight is most appropriate for the movement of goods between many origins and many destinations. Rail freight is most appropriate for the movement of high volumes of massed or bulk goods over longer distances and between key production and distribution nodes (over relatively short distances). Domestic freight movement by coastal shipping (which doesn’t include the inter-island ferry services) is relatively minor compared to the other routes and is most suitable to the movement of bulk goods.
Freight includes anything transported as part of a commercial arrangement – from a small couriered document carried by cycle messenger to the movement of logs, containers and heavy machinery. As such, freight movement and economic well-being are interrelated.
Road freight takes up the vast majority of freight movements. Road freight accounts for 70% of freight tonne kilometres, nationally, while coastal shipping and rail made up 15% each.1 Regionally, road freight accounts for 91% of outbound inter-regional freight movements and 74% of inbound movements (see Figure 7). The region’s key road freight destinations are Seaview/Gracefield, Petone, Porirua/Tawa and CentrePort.
State Highway 58 provides an east-west connection for some freight movements between State Highway 1 (SH 1) and State Highway 2 (SH 2). However, SH 58 is not a reliable east-west route for large trucks as the curve radii are too tight. Large trucks use the SH 1 and SH 2 intersection at Ngauranga for east-west travel. This can lead to large additional distances travelled for freight and increase congestion on SH 1 and 2.
Work to increase capacity on SH 1 as part of the Levin to Wellington Airport Road of National Significance is expected to increase reliability and improve travel times. The NZ Transport Agency’s High Productivity Motor Vehicle permitting process is aimed at increasing the efficiency of road freight by allowing heavier truck loads to use designated roads.
Rail connections to CentrePort and the inter-island ferries mean the region’s rail network is of national importance. However, inter-regional rail freight movements have declined by 7% since 2003.2 Most freight journeys within the Wellington region tend to be relatively short (about 40 km) and therefore not easily transferred to rail (Hyder, 2009).
KiwiRail’s Turnaround Plan has a strong focus on improving the North Island Main Trunk rail line (NIMT) backbone in order to improve rail’s competitiveness for inter-regional freight movements between Auckland, Wellington and Christchurch. Wellington’s topography does provide opportunities for shorter than average rail freight movement. For instance, the rail tunnel through the Rimutakas may increase rail’s competitiveness with road freight that has to travel over the hill.
1 Source: Ministry of Transport, Transport Monitoring Indicator Framework, FT008. 2 GWRC, 2009/2010, Annual Monitoring Report on the Regional Land Transport Strategy.

WGN_DOCS-#902458-V1 3
Port traffic at Wellington’s CentrePort is expected to increase in line with economic growth trends, with most freight arriving at or departing the port by road. CentrePort has seen increasing freight volumes each year since 1997 (WRS, 2005). Logs and containers are core components of the port’s freight traffic. CentrePort, along with KiwiRail’s Interislander ferry service, are key links for both road and rail freight between the North and South Islands. Access to CentrePort for both road and rail freight from the north is important for CentrePort’s role as a key transport hub for the lower North Island.
Freight movement via the airport is a relatively minor component of the region’s freight traffic, largely due to the restriction in aircraft size that can be accommodated by Wellington airport. The airport’s 2030 Master Plan outlines and investment plan to attract larger aircraft capable of carrying containerised freight. A future increase in freight movement from 5,000 tonnes to 28,000 tonnes by 2030, mainly from increases in international freight, is predicted in the Master Plan as a result. The importance of access to and from Wellington airport will increase with any future increase in air freight volumes.
Work done for the New Zealand Transport Strategy 2008 by the Ministry of Transport estimated the amount of freight in New Zealand would double by 20403 depending on GDP growth and the distribution of that GDP generation. This expected growth in freight volumes, together with timing needs associated with freight delivery will mean an increasing contribution of road freight to peak period congestion based on current practice.
Currently, there are significant heavy vehicle flows along SH 1 as well as SH 2 (which links manufacturing centres in Upper and Lower Hutt, as well as Seaview with the population base and port facilities in Wellington City). Likewise, the effects of congestion on freight movement have been signalled as a problem which is likely to increase with any freight volume growth and potential industrial re-development – particularly in Hutt Valley.
Investment on the State Highway network,4 local roads and public transport improvements along key routes should improve the efficiency and timely movement of freight within the region. A focus on future road freight efficiencies such as more advanced technology, heavier average loads, increasing truck sizes and driver training can also have substantial benefits. However, heavier loadings and increased truck sizes are also likely to have associated costs in terms of required road maintenance and increased damage from collisions when they occur.
Increasing rail and coastal shipping freight mode share can mitigate some of these costs, as well as others (i.e. congestion and greenhouse gas emissions). For example, there is a significant volume of log freight by road from Wairarapa to CentrePort. Anticipated increases in log production and delays from road congestion mean a return to rail freight is being pursued through the Wairarapa Corridor Plan 2010. The KiwiRail Turnaround Plan goes further by setting out a major revitalisation of domestic rail freight. The ‘Sea change’ strategy for increased coastal shipping, released in May 2008 by the Ministry of Transport, is no longer considered operable by the Ministry.
3 Ministry of Transport, New Zealand Transport Strategy 2008, page 7. 4 Work on State Highway 1 has been given high priority by government as the Wellington Road of National Significance.

WGN_DOCS-#902458-V1 4
The Wellington region is a net importer of freight. The lack of outbound inter-regional freight implies certain inherent inefficiencies in the movement of freight – ie. containers leaving the region empty. One of the aims of the Wellington Regional Strategy is to increase the region’s exports and if successful could improve the inbound/outbound balance.
Due to the region’s geographical position at the lower end of the North Island there is also a significant proportion of freight moving through the region from one of the main islands to the other. A key example of this is rail freight moving between Auckland and Christchurch – which is expected to significantly grow in volume and value over the next 10 years and beyond.
Ultimately, operational decisions in the freight sector will be made by private actors in the market. However, adequate transport planning and investment is necessary to ensure that there is healthy competition between different transport modes for the movement of freight. That way freight will move in, out and through the Wellington region as efficiently as possible. This will help maximise the economic return to the Wellington region, but it is also important to understand how freight movements affect the communities of the region and mitigate any negative effects of freight traffic that wouldn’t otherwise be factored into economic decisions.
4.1 Studies
A number of studies concerning the freight sector in New Zealand have recently been completed. The most relevant of these to this Regional Freight Background Report are summarised below.
4.1.1 National Freight Demands Study (September 2008)
The National Freight Demand Study (NFDS) was commissioned in early 2008 by the Ministry of Transport, the Ministry of Economic Development and the NZ Transport Agency to look at the current (financial year 2006-07) operations of the freight sector and its future development. The study was undertaken to overcome the limited amount of data on the sector and provide a sound basis for future policies.
The NFDS analysed the freight sector by identified key commodities, by mode of transport and inter-regional movement patterns (regions analysed don’t necessarily follow the local government regional political boundaries). Forecasts of future freight volumes in 2031 were also conducted.
The main conclusions from these forecasts are a 70-75% growth in the freight tonnes, with rail and coastal shipping generally maintaining their current share of freight movement. Auckland, Waikato and Canterbury are forecast to see the most growth of freight entering and leaving those regions.
The NFDS is one of the key documents informing this Wellington Regional Freight Background Report because it provides a large amount of information on how freight moves throughout New Zealand. Although the NFDS focuses on freight at a national level, many Wellington regional statistics appear throughout. With the majority of Wellington freight moving across regional boundaries, a national level perspective is important to keep in mind.

WGN_DOCS-#902458-V1 5
The recommendation from the NFDS was for government to regularly collect data on the three main modes of freight movement. This will allow the government to properly identify emerging trends and enhance the value of data already collected, improve the data’s usefulness to those who operate within the freight sector, and for the government to achieve its sustainability goals and proved the infrastructure and related services necessary to support an efficient freight industry.
4.1.2 Freight Analysis for the Wellington, Nelson, Marlborough and Tasman regions (June 2009)
Hyder Consulting was commissioned by NZ Transport Agency to analyse freight movements and the associated issues and opportunities for each NZ Transport Agency region. The most relevant Hyder study is the one for the Wellington, Nelson, Marlborough and Tasman regions. The Hyder study is based on NFDS and provides a regional level focus to the data presented in the NFDS. It therefore is a good foundation for the analysis conducted in this background report.
The main conclusions for the Wellington region from the Hyder study are:
• The Wellington region is a net importer of freight • The average trip distances for inter-regional freight into and out of the region imply a large
degree of empty running • Freight coming into the Wellington region has a relatively high portion of rail and maritime
transport in comparison with the rest of New Zealand • A high proportion of the region’s heavy vehicle traffic consists of relatively short trips on
state highways between North of the Terrace Tunnel, South of Tawa and South of Upper Hutt.
Opportunities identified by the Hyder study are:
• The level of empty running may offer opportunities to improve the productivity of the transport sector (although it is noted that the Wellington region has few export industries)
• The high proportion of freight movement on selected routes encourages innovation in the planning and management of roads in the region,
• Heavy movement of selected commodities encourages industry-focused solutions for better management of logistics
• ‘High Performance Hubs’ that combine road and rail freight transport should be investigated. (opportunities for this exist at Seaview, Petone and Porirua)
4.1.3 High Productivity Motor-Vehicle route studies (On-going)
These studies are a key element to the implementation process of the Vehicle Dimensions and Mass Amendment 2010 Rule. This amended Land Transport Rule allows longer heavy vehicles in some instances and creates a new permit category for high performance motor vehicles (HPMVs) at increased weights.
WGN_DOCS-#902458-V1 6
The HPMV permitting category allows divisible loads (for example, a truck with two trailers) to go over the current weight limit of 44 tonnes and to have longer than current ‘as-of-right’ lengths (20 metres). However, a permit is required for these allowances as well as for the roads approved as suitable for the over-weight, over-length trucks.
The purpose of the route studies is to identify potential HPMV routes from the origin of the heavy truck trip to its final destination to streamline the permitting process. These approved routes will cover the State Highway network and all the necessary local roads in consultation with industry and the local Territorial Authorities – who are the road controlling authorities for the local road network.
This review of the Regional Freight Plan will include a ‘regional freight network map’ of approved HPMV routes within the Wellington region. The State Highway network in the Wellington region has been cleared for use by HPMVs. Local roads on routes that are not permitted may become the focus of improvement and maintenance work to upgrade them for the use of HPMVs.
The NZ Transport Agency is the lead agency for this activity.
4.1.4 Freight futures – long term sea freight scenarios (September 2010)
There is considerable debate within the maritime transport sector about its future. NZIER was commissioned by the Ministry of Transport (MoT) to look at some of the main ideas being debated, and to do a high-level assessment on the potential impact on the economy. MoT did this study to inform its own thinking on the issues, and to contribute to the debate.
To undertake this study, four scenarios were created and modelled out 20 years. These are:
• Status quo – where past political and economic influences are continued • Hubbing New Zealand export and import containers through Australian ports • A “two-port” strategy, one port each on the North and South Island, to cater for very large
container ships • A reduction in shipping operators calling at New Zealand ports.
The main conclusions are that the alternative policy options are unlikely to improve efficiency relative to the status quo scenario. There is a need for the sea freight sector to think long-term rather than short-term, and about the overall impact on the economy rather than just the impact on the sector. Also, both supply and demand side factors need to be considered by policy makers when thinking about policy interventions.
Consideration of demand side factors – such as exports growth, stage of shipping cycle, competitiveness of ship operators – may be more important than supply side factors (e.g. port size) when considering appropriate interventions.
This report does not focus on Wellington’s CentrePort. It focuses instead on four main groups in New Zealand’s maritime transport sector – ports, international shipping, domestic shipping and shippers (cargo interests). The Minister of Transport has announced that the NZIER report supports the Government’s view that market-led developments by shippers and ports is the best approach for determining the future of the ports sector, rather than interventions to bring about other scenarios.

WGN_DOCS-#902458-V1 7
Given this, it seems unlikely that central government would be looking to make direct structural changes to the ports sector in which CentrePort operates.
4.1.5 The Question of Bigger Ships (August 2010)
This report sets out the industry perspective of the cargo owners (exporters and importers) on whether New Zealand ports should invest to facilitate bigger ships – of around 5000 to 7000 twenty-foot equivalent units (TEU)5 – calling at New Zealand. The report focuses on bigger ship services between New Zealand and South East Asia as a case study.
The report sets out the benefits and costs of bigger ships, as well as determines that New Zealand does have sufficient cargo volumes to warrant infrastructure improvements to cater for larger ships. Five scenarios, including a status quo scenario, were modelled to determine the various costs and benefits of different shipping schedules with ships of varying sizes.
Its main recommendations are that two ports, one in the North and one on the South Island, should invest to become capable of handling 7000 TEU ships within the next 5 years and for MoT to close the information gap on container carrying capacity between operators and ports with a robust and consistently applied data collection regime.
While this report does not focus on Wellington’s CentrePort, it does set out scenarios within which CentrePort may be operating in the future from the perspective of the port’s customers (importers and exporters). Recommendations in this report for investment, particularly on the rail network, do have implications for rail access to CentrePort. The scenarios tested in this study are similar to the ones in MoT’s ‘Freight futures’ study. The recommendations in this study conflict with the MoT study, so it is unknown how influential this ‘bigger ships’ study will be.
4.2 National legislation, strategies and plans
The following are the legislation and national-level strategies and plans that the Regional Freight Plan should be consistent with.
4.2.1 Land Transport Management Act 2003
The purpose of the LTMA 2003 is to contribute to the aim of achieving an integrated, safe, responsive and sustainable land transport system. Greater Wellington has significant transport planning obligations under the LTMA.
The LTMA 2003 requires regional land transport strategies to contribute to assisting economic development (section 75(a)(ii)(A)). The Regional Freight Plan, which sits underneath the RLTS, is an important component of regional planning in accordance with this part of the LTMA.
5 The standard measure of shipping container volume.
WGN_DOCS-#902458-V1 8
4.2.2 Road User Charges
While road user charges (RUC) have no direct bearing on this freight report, it is important to understand the costs levied on road transport operators for the maintenance of the road network and how those costs are allocated.
The Road User Charges Act 1977 sets out who is required to pay RUC, what the charges are, the basis for charging (ie actual weight carried on road and distance), licence requirements, vehicle requirements (eg vehicles must have a distance recorder) and administrative details, such as who may issue licences and refunds for off road use.
Key drivers for the introduction of the RUC system were:
• To establish more economic price relativities between road and rail transport • More accurate roading costs to provide an economic incentive to all road operators to
economise on the use of roads • The ability to adjust revenue from road taxation to match roading expenditure attributable to
heavy vehicles • Ensuring that each type of vehicle is taxed according to the costs it imposes on the roading
system, thus making the user-pays principle more evident in the financing of road construction and road maintenance.
Two groups of vehicles pay RUC – all diesel and other vehicles powered by a fuel not taxed at source6 regardless of weight. All vehicles that travel on road must also pay an annual license fee which is separate from the RUC distance licences.
In any given year, the RUC are calculated by MoT’s cost allocation model (CAM) which is set up to share the costs incurred between vehicles of different types according to the differences in the costs they generate for the road network. The CAM is currently under review, so the distribution of costs between different classes of vehicles may change in the future.
Statutory responsibility for the application of the RUC system rests with the Chief Executive of the MoT. The Chief Executive has delegated responsibility for administration of the system to the NZ Transport Agency. This includes collection of fees, recovery of unpaid RUC and management of refunds. Enforcement of the offences regime relating to RUC is carried out by the New Zealand Police while the MoT administers RUC policy and has overall revenue management responsibility.
On 1 October 2010 road user charges were increased along with the first of two scheduled fuel excise duty increases. These increases roughly coincided with a change in legislation regarding RUC. The average RUC increase is 7% across the affected vehicle fleet.
RUC represents about 10% of the total costs for road transport operators. The RUC increases will add about 5 to 6 percent to the RUC payable for combination vehicles running at maximum weights (this represents an increase of 0.5 to 0.6 percent to total operating costs).
6 Fuels taxed at the source are petrol, compressed natural gas (CNG) and liquefied petroleum gas (LPG).
WGN_DOCS-#902458-V1 9
For some operators RUC will be a higher proportion of costs, or their vehicle fleet will have higher average increases in rates. For them the increase will have a slightly larger impact, but this is still unlikely to be much more than 1% of total operating costs.
4.2.3 National Infrastructure Plan
The Plan outlines the Government’s infrastructure priorities, describes the planned investment and provides a snapshot of public and private infrastructure. It will give infrastructure providers greater certainty about the Government’s plans and allow planners and stakeholders to have a clear sense of what is happening across a range of sectors.
It confirms that there are bottlenecks in roading and electricity, which are being addressed by the Government's ‘step-up’ in investment. Otherwise it finds that New Zealand's infrastructure is generally sound and that there are no obvious looming crises in the near term (five years). Planning across sectors is variable, however, and identifying New Zealand's needs 10-20 years ahead will be a major focus of the next plan.
The Government’s response to the roading bottlenecks in the Wellington region is with the Wellington Road of National Significance project which follows State Highway 1 from Levin south to Wellington Airport.
4.2.4 New Zealand Transport Strategy 2008
The New Zealand Transport Strategy (NZTS) provides direction for all parts of the transport sector. As well as setting out its intentions for transport, the NZTS provides a framework for the activities of transport-related Crown entities and guidance for local authorities. It sets the strategic context for the development of Government Policy Statements – which will establish central government’s funding policy and priorities for land transport development on a three-yearly cycle.
The NZTS vision is to ensure that ‘people and freight in New Zealand have access to an affordable, integrated, safe, responsive and sustainable transport system.’ The five objectives of the NZTS have been built into the LTMA 2003 and flow into the objectives of the Wellington RLTS.
4.2.5 Government Policy Statement on land transport funding 2009
The LTMA 2003 requires the Minister of Transport to issue a Government Policy Statement on land transport funding (GPS) every three years. A GPS will include the Government’s overall short to medium-term impacts that the Crown wants to achieve, funding targets for the first 3 years, funding ranges for the next six years, and funding range forecasts for the following four years (for a total of 10 years). It will also indicate any necessary changes to the fuel excise duty, road user charges, and motor vehicle registration fees to fund the proposed activities.

WGN_DOCS-#902458-V1 10
The LTMA describes how the GPS relates to certain land transport planning and funding processes. The government’s main priority with the 2009 GPS is to support national economic growth and productivity. It will do this by ensuring that national land transport funding is invested into infrastructure projects and transport services. Particularly by:
• investing in the State Highway network to move freight and people more efficiently • generating better value for money from investment across all land transport activities • enhancing the economic efficiency of individual projects.
The 2009 GPS places priority on investment impacts that contribute to economic growth and productivity, which are:
• improvements in the provision of infrastructure and services that enhance transport efficiency and lower the cost of transportation through: - improvements in journey time reliability - easing of severe congestion - more efficient freight supply chains - better use of existing transport capacity
• better access to markets, employment and areas that contribute to economic growth • a secure and resilient transport network.
Other impacts included in the 2009 GPS are:
• reductions in deaths and serious injuries as a result of road crashes • more transport choices, particularly for those with limited access to a car, where appropriate • reduction in adverse environmental effects from land transport • contributions to positive health outcomes.
The 2009 GPS also identified seven roads of national significance throughout New Zealand that will be the focus for investment in order to achieve economic growth and productivity over the next 10 years. One of these is the Wellington Road of National Significance from Levin south to the Wellington International Airport, which follows State Highway 1 through region’s Western and Ngauranga to Wellington Airport Corridors.
This freight report is a means to determine how ‘more efficient freight supply chains’ can be achieved in the Wellington region.
4.2.6 KiwiRail Turnaround Plan
On 18 May 2010 the Minister of Transport announced the KiwiRail Turnaround Plan. It aims to ensure KiwiRail becomes a business capable of standing on its own feet financially. Implementing the plan involves five key areas of investment and work to increase rail traffic volumes and revenue, increased productivity, modernise assets and separate out the commercial elements of the business from the non-commercial.
A main initiative in the Plan is to grow domestic rail freight through infrastructure improvement and also by linking freight hubs via rail. Another is to clarify and assign accountability for costs associated with operating the Wellington metro network service.

WGN_DOCS-#902458-V1 11
The Auckland – Christchurch route is the most important route to the rail business. Upgrading this route to improve travel times and be more competitive with road freight is the central focus of the Turnaround Plan. Increasing domestic containerised freight on this route is critical for the sustainability of the rail freight business.
This route moves through Wellington and across the Cook Strait via the Interislander ferries. Improvement work on the Wellington region’s rail network is therefore of national importance.
Part of the Turnaround Plan is to review several ‘minor’ railway lines in consultation with communities, customers and staff. It is possible that these lines will be closed or mothballed unless key ‘anchor customers’ can be identified by 2012. The North Wairarapa Line between Masterton and Woodville is one of these minor lines up for review.
4.3 Regional strategies and plans
Several regional strategies and plans are relevant to this background report.
4.3.1 Regional Land Transport Strategy 2010 – 2040
The Wellington Regional Land Transport Strategy 2010 – 2040 (RLTS) defines the appropriate role for land transport freight traffic as the safe and efficient movement of goods within, to, from and through the region.
The vision of the RLTS is “to deliver an integrated land transport network that supports the region’s people and prosperity in a way that is economically, environmentally and socially sustainable”. In order to achieve that vision, the RLTS has six objectives. These objectives reflect the provisions set out in the LTMA 2003.
The RLTS objectives of ‘assisting economic and regional development’ and ‘improve access, mobility and reliability’ have become more prominent as a response to Government’s focus on economic growth in the GPS 2009. The Regional Freight Plan is an important step in implementing those RLTS objectives.
However, freight does not solely impact on those two objectives alone. For a transport network to run efficiently and effectively a multitude of factors need to be addressed. This requires a balanced approach where compromises have to be made to satisfactorily meet multiple demands on the transport network. Freight is no exception.
The RLTS objectives and how freight contributes to each of them is highlighted below.

WGN_DOCS-#902458-V1 12
Assist economic and regional development
The movement of freight both contributes to, and is determined by, economic growth as well as a changing economy.
The efficient and timely movement of freight contributes to economic and regional development by moving goods and providing services to the people living and businesses operating within the region. Improvements in efficient and timely freight movements will benefit the region by reducing the costs of doing business and contributing to a more business-friendly regional environment which can be a strong attraction to new businesses. These new businesses can also change the amount and nature of the freight task in the region.
These economic benefits also enable rejuvenation of existing commercial areas and the development of new commercial properties. The future location of:
• raw materials extraction, • manufacturing and processing, • distribution, • wholesale and retail activities, • residential properties
and the amount of freight moving between them will affect both the scale of the freight task and the impacts on the wider region. The relationships between these different areas will help determine how freight moves, modal choice and the routes used by freight vehicles.
While economic and regional development policies are significant to the freight industry, operating practices by freight carriers are ultimately decided by a range of factors including the economic environment and costs of doing business.
Assist safety and personal security
The movement of freight can often be associated with large and intrusive vehicles competing with general traffic – creating potential conflicts with other road users. This is especially important at parts of the road network where lane widths are narrow and turning radii are tight (for example, Rimutaka Hill Road), causing large trucks to intrude on other lanes or even cross the centre line.
These issues are likely to get more pronounced with NZ Transport Agency’s work with permitting overweight and over-dimension vehicles. Ensuring the safe use of state highways and local roads by these vehicles is a key factor in determining whether a permit will be issued.
Rail freight also has similar issues of potential conflict at level crossings and with passenger rail services – especially during peak travel times.
The promotion of improved vehicle safety standards and operating conditions as well as educational programmes can contribute to assisting safety and personal security by encouraging the use of improved safety technology in freight vehicles and ensuring drivers are experienced with the particular rig configuration they are driving.

WGN_DOCS-#902458-V1 13
Improve access, mobility and reliability
The transport network exists so that people can get around easily, safely and reliably to carry out daily activities, contribute to the economy and participate in society. Freight activities generally occur on the same network, interacting and competing with travel for other purposes for road space and rail tracks.
Policies that improve the movement of freight to maximise efficiency, safety and reliability (ie. priority measures, identification of freight corridors, reducing congestion) will ultimately lead to improved access and mobility to other users of the network.
Protect and promote public health
Air emissions, noise and vibration are associated with freight vehicles. This can impact strongly on the health of individuals and communities. These issues and the effects of freight related accidents are generally perceived more negatively by the community than those caused by other road users. Furthermore, stress on freight operators resulting from congestion and longer working hours have a negative effect on public health.
Ensure environmental sustainability
During construction and operation, the transport network can have adverse environmental effects. Freight vehicles and trains are often perceived as the major causes of impacts because they are more visible. Planning around freight movements and infrastructure improvements should endeavour to mitigate or minimise such effects. Tools for this include improved vehicle standards, cleaner fuels and improved efficiencies that reduce freight movements, or encouraging shifts to more sustainable modes of transport (rail and coastal shipping) when those options are economically viable.
Support for business locations that require fewer or shorter freight trips while recognising location-based constraints facing freight generating activities needs to be considered in this regard. Constructive solutions are required that seek to reconcile economic, social and environmental needs and issues affecting the movement of freight in the region.
Ensure that the Regional land Transport Programme is affordable for the regional community
Freight transport needs to be effective and reliable to meet customer demands, and should make the best use of limited resources available, including transport infrastructure and non-renewable resources. Freight transport needs to be cost efficient in terms of public funds required to build infrastructure, as well as in terms of the cost to the freight industry in supplying services in compliance with regulatory requirements.
Costs need to be affordable, acceptable and take into account the financial resources available. In that regard costs need to achieve ‘value for money’ over the lifecycle of the infrastructure involved.
RLTS outcomes and policies
Following on from these objectives, there are a number of RLTS outcomes and targets of particular relevance to the Freight Plan, including:

WGN_DOCS-#902458-V1 14
RLTS outcomes 2020 RLTS targets
7.1 Improved regional freight efficiency Improved road journey times for freight traffic between key destinations
7.2 Improved inter-regional freight efficiency Infrastructure constraints to rail freight movements are removed
8.1 Improved safety, efficiency and reliability of road, public transport and freight links to the north of the region
Progress measured using information collected for congestion (4.1), reliability (4.3), safety (5.1) and inter-regional freight (7.2)
4.1 Reduced severe road congestion Average congestion on selected roads will remain below year 2003 levels despite traffic growth (20 seconds delay/km in 2003; 23.4 seconds delay/km in 2010)
4.2 Maintained vehicle travel times between communities and regional destinations
Average vehicle journey ‘speeds’ shown in travel time surveys for selected key routes will remain at or above year 2003 levels (55 km/h in 2003; 52 km/h in 2010)
4.3 Improved reliability of the strategic roading network
Continual reduction in total incident hours
6.3 Sustainable economic development supported
Continued reduction in vehicle kilometres travelled per GDP
A number of RLTS policies also refer directly to the freight network. These are:
8.1.v Ensure the transport network provides for freight and commercial needs
8.1.w Ensure that key regional freight routes are developed in a way that facilitates efficient movement of freight, including provision for over-dimension and over-weight vehicles, where appropriate
8.2.k Support beneficial rail freight initiatives where net benefits exceed those of road freight
8.5.h Ensure major recreational, tourist and freight traffic flows are taken into account during planning processes
8.7.b To prepare and review implementation plans for pedestrians, cycling, road safety, travel demand management, and freight, in accordance with the regional framework provided by this Strategy, that identify the needs and proposed actions specific to each mode
4.3.2 Wellington Regional Strategy
The Wellington Regional Strategy (WRS) is a joint project involving Greater Wellington and the nine territorial authorities of the region working together to build an internationally competitive Wellington. It is primarily an economic growth strategy with an outlook to 2025.

WGN_DOCS-#902458-V1 15
The WRS contains a range of initiatives to realise the region’s economic potential. It aims to enhance our “regional form” by addressing such issues as transport, housing, urban design and open spaces, which are all the things that contribute to our quality of life.
The WRS aims will be pursued with a collaborative effort between the private sector, central and local government, as well as economic development organisations. It will be a rallying point for matters requiring a region-wide approach. There are currently 5 implementation workstreams:
• Regional Urban Design • Regional Open Spaces • Industrial Land • Rural Residential Development • Centres • Intensification.
Grow Wellington is an economic development agency charged with the task of implementing the economic initiatives of the strategy, particularly those relating to investing in growth of the regional economy through exports.
4.3.3 Wellington Regional Rail Plan
Greater Wellington’s Regional Rail Plan provides for the long term development of the region’s rail network. Its purpose it to maintain and grow rail’s position as the key transport mode for long to medium distance and high volume transport services over the next 25 years.
The rail plan’s vision is to – ‘deliver a modern, reliable and accessible rail system that competitively moves people and freight in an economic, environmental, integrated and socially sustainable way’
The plan recognises and encourages the increasing popularity of rail as a sustainable transport choice for passengers and freight, a trend that is evident across the globe. It also recognises that rail is an essential service underpinning the effective functioning and economic development of the Wellington region.
Rail freight benefits from implementing the Plan include:
• Capacity – maintained • Reliability – greater network and system reliability • Competitiveness – reduced journey times from infrastructure improvements
While plans are already under way for a number of improvements, such as the order for new rolling stock, the Regional Rail Plan provides an ‘implementation pathway’ for the longer term investment on the rail network once current developments are complete.
The Rail Plan is currently being reviewed.

WGN_DOCS-#902458-V1 16
4.4 Performance of current Regional Freight Plan 20 07
The Freight Plan 2007 contains three specific actions.
4.4.1 Facilitate rail based transfer of logs to CentrePort
This action is to advocate for the Wanganui/Manawatu (Horizons) RLTS to support the development of log transfer sites at Marton and Wanganui.
The Wairarapa Corridor Plan 2010 contains actions to “ensure provision in the Wairarapa Combined District Plan that facilitate the development of a log transfer and storage site at Waingawa are retained” and to “support commercial development of a log transfer and storage site at Waingawa”.
While the Waingawa site is not in Marton or Wanganui, it does offer to provide a similar function in accordance with this action. A small log transfer facility is currently available but has not been well-utilised due to a number of wider logistical issues.
4.4.2 Protect short haul rail freight
This action is to advocate to ONTRACK (now KiwiRail Network) and Hutt City Council for the protection of the Gracefield/Seaview rail corridor.
The designation for the Gracefield Branch Railway (NZR 2) remains in Hutt City’s District Plan.
This action is currently in progress.
4.4.3 Improve long haul rail freight efficiency
This action is to advocate to ONTRACK (KiwiRail) for removal of the Kai Iwi tunnel constraint (on the rail line between Marton and New Plymouth).
Recent improvements have allowed the transport of modern Hi-Cube containers, which are currently passing through the Gorge by rail.
This action has been completed.
5. Infrastructure and land use
Objective 1 of this report is to describe the infrastructure and land uses that enable and generate freight within the Wellington region.
5.1 Strategic transport network
The strategic transport network is made up of the region’s key railway lines, state highways and those major local roads serving an arterial purpose.

WGN_DOCS-#902458-V1 17
5.1.1 Strategic rail network
The strategic rail network in the Wellington region consists of the following:
• North Island Main Trunk Line • Wairarapa Line from Upper Hutt to Woodville • Melling Line • Johnsonville Line • Gracefield Branch Railway
5.1.2 Strategic road network
The strategic road network consists of the state highway network and any connecting roads that lead to the key centres and important destinations above. The state highway network in the Wellington region consists of the following:
• State Highway 1 • State Highway 2 • State Highway 58 • State Highway 53 • Transmission Gully7 (designated future route)
Other key local roads important to freight movements in the region are Hutt Road, Thorndon Quay, Aotea Quay and Waterloo Quay in Wellington City. In Lower Hutt City, The Esplanade is a key local road for freight.
5.2 Regional centres and important destinations
A key function of the strategic transport network is linking the region’s centres and important destinations with the rest of New Zealand.
These centres are important destinations for freight and include the Wellington CBD, other regional centres, CentrePort, Interislander Ferry Terminal and Wellington International Airport.
5.2.1 Key regional centres
The proposed Regional Policy Statement (RPS) defines ‘regionally significant centres’ as including the Wellington city CBD as well as sub-regional and suburban centres.
The centres listed in policy 29 were identified during the development of the WRS as centres of significance to the region’s form for economic development, transport movement, civic or community investment.
7 Part of the larger suite of projects that make up improvements on the Wellington Road of National Significance – signalled in the GPS 2009.

WGN_DOCS-#902458-V1 18
The Wellington CBD is the main regional central business district, with 73,000 people working there each day. It is important to maintain and enhance the viability and vibrancy of the Wellington CBD and the regionally significant sub-regional centres above as all these centres are important in encouraging investment.
This development supports an increased range and diversity of activities throughout the region. They are also important for their prosperity and resilience in the face of social and economic change.
Industrial areas located in each of the Territorial Authorities are the main generators of freight in the region. Other areas such as quarries and plantation forest lots are also important generators of freight. The region’s key road freight areas are Seaview/Gracefield, Petone, Porirua/Tawa, Rongatai, Kilbirnie, Wingate, Maidstone and CentrePort.
5.2.2 CentrePort
CentrePort is the region’s main port facility. CentrePort is located in the geographical centre of New Zealand, with a natural, sheltered deep-water harbour. CentrePort offers nationwide access, with direct connections to New Zealand’s major highway and main trunk railway. Key coastal shipping and inter-island ferry services are also located within the port precinct.
As a result, CentrePort is the only New Zealand port able to offer delivery anywhere in New Zealand within 24 hours. Imports and exports both primarily come from / go to Asia and Australia via a wide range of international shipping services with direct calls to CentrePort.
CentrePort has a diverse range of port and commercial related property. Its commercial property is primarily located within the Harbour Quays precinct and adjoins the Wellington CBD. In addition CentrePort has commercial and industrial property interests at Seaview and Miramar.
Cargoes currently handled at the port include logs, petroleum, chemicals, horticultural products, cement, new and used vehicles, new and scrap steel, and processed forestry products.
CentrePort’s 2010 Annual Report highlighted that the port handled:
• 98,783 TEU of container volumes on 215 container ships • 451,968 m3 of logs • 14,665 imported vehicles • Average 400 truck and rail movements through the port per day • 46 cruise vessel visits in 2009/10.
The 2010 annual report also outlined strong growth over the 2009 year in key commodity areas, such as:
• 4% increase in container volumes • 58% increase in log volume • 32% increase in vehicle imports

WGN_DOCS-#902458-V1 19
5.2.3 Ferry Terminal
The Interislander provides freight and passenger services across Cook Strait between Wellington and Picton. The ferries provide a vital link in the supply chain for both rail and road freight. Interislander services the majority of the inter-island ferry market into and out of Wellington – the other being Strait Shipping, which has its own terminal.
Interislander operates three ships – the Arahura (capacity 300 lane metres), Aratere (capacity 515 lane metres) and Kaitake – which has a freight capacity of 1780 lane metres. During 2011, work will be undertaken to extend the Aratere by 30 metres. The extension will enhance revenue opportunities in the short term and provide greater capacity for freight generated by the Turnaround Plan.
During 2009/10 Interislander serviced 845,411 passengers and 1,893,300 lane metres of freight (or approximately 3,264,221 tonnes) through its terminal. This equates to the three ferries totalling approximately 50 return sailings each week.
Strait Shipping has its own terminal at CentrePort. It operates 2 ships, the Santa Regina and Straitsman, under the Bluebridge passenger brand but also provides freight services. The Santa Regina has a freight capacity of 1300 lane metres and the Straitsman has a capacity of 1300 lane metres. Strait Shipping runs approximately 28 return sailing across the Cook Strait each week.
5.2.4 Wellington International Airport
The Wellington International Airport (WIAL) is the region’s main airport. It is a domestic hub with international connections to Australia and the Pacific Islands. Wellington airport currently handles less than 1% of total New Zealand import or export cargo (Hyder, 2009) at about 5,000 tonnes.8
Internationally, airports are used for the import and export of perishable and time sensitive goods. These goods include, in general, computers and other technology/appliances, spare parts, recorded media and fresh foods as well as live animals.
The WIAL 2030 Master Plan forecasts a growth in freight volumes to 28,000 tonnes by 2030 and provides an investment plan to be able to meet / generate that volume.
5.3 Land uses
Understanding land use patterns is important to understanding freight movements. This section aims to outline land use patterns which ultimately influence demand for freight activity.
5.3.1 Industrial land
In 2009 Boffa Miskell undertook a study for the councils in the region to address the following:
• How much land in the Wellington region is zoned for industrial use9 • How much land is currently being utilised as industrial land
8 Wellington International Airport, 2030 Master Plan, 2010, page 10. 9 This includes - where it is, quality, any restrictions on industrial use (ie light only), whether the land is zoned only for industrial use or could be utilised for other purposes (eg. commercial).

WGN_DOCS-#902458-V1 20
• The impacts of current District Plan rules for land that is/could be used as industrial activity • Work each council is doing that could impact current rules/allow changes.
Below is a table summarising the results from Boffa Miskell’s findings. All results are given in hectares. The report identifies transport corridors as the state highway network and rail lines.
Slope Coverage (ha) TA Area (ha)
> 15° < 15° Vacant < 25% 25-50% 50-75% > 75%
Area within 500m of transport corridors (ha)
WCC 220.30 66.74 153.56 28.79 115.92 49.16 35.15 11.12 166.59
HCC 551.25 106.71 444.54 0.15 281.39 136.43 81.61 43.37 539.70
PCC 183.76 9.05 174.72 56.57 81.15 29.89 20.17 1.91 183.76
UHCC 137.8 8.64 129.16 n/a n/a n/a n/a n/a 94.14
KCDC 124.66 1.67 122.99 36.71 33.34 23.40 12.23 1.81 78.37
Wairarapa (comb.)
404.35 0.41 403.94 n/a n/a n/a n/a n/a 404.35
Region (total)
1,622.13 633.02 887.17 n/a n/a n/a n/a n/a 1,466.91
Figure 1: Summary of Boffa Miskell industrial land study results. Source: WRS, GWRC
Findings from the study described below:
• Lower Hutt has the largest area of industrial land (zoned 550 ha) followed by the combined Wairarapa local authorities (404 ha).
• The other local authority areas - Wellington, Porirua, Upper Hutt and Kapiti – have in the order of the same proportion of industrial zoned land (ranging from 183 ha to 124 ha).
• The Hutt, Porirua and Wairarapa Councils’ land is well located relative to the primary transport network. In Porirua, all industrial land is within 500 metres of the state highway and/or rail
• Most of the Lower Hutt land is also relatively flat with only about 20% being over 15 degrees slope. Wellington has the greatest proportion of sloping industrial land greater than 15 degrees (over half). Kapiti has the greatest proportion of its industrial zoned land which is relatively flat.
• Generally there is a high proportion of utilized land as expressed by site coverage in Wellington and Lower Hutt. Porirua and Kapiti have a relatively larger number of vacant parcels. No coverage data was available for Upper Hutt or Wairarapa. However, both of these latter Councils have introduced relatively large new areas for industrial activities recently which will tend to suggest they too have larger proportions of vacant land.
The future development of new industrial areas and the potential re-development of currently vacant industrial land may significantly increase the freight task in the region. The impact of any potential freight movement increase is more likely to have a significant effect on the local road network. This is due to the corridor-constrained nature of the strategic transport network in the region – by and large freight moves south or north.
Local roads between industrial land and the state highway network also may need to be upgraded to comply with standards for over-weight or over-dimension vehicles.

WGN_DOCS-#902458-V1 21
5.3.2 Integration of land use and transport planning
The topography of the Wellington region has meant that development has occurred in a relatively compact form along the region’s strategic transport network. Land use has therefore been relatively well integrated with transport – depending on the level of connectivity between local networks and the state highway and rail routes.
This pattern of development is beneficial to freight movement in that, if designed correctly, it reduces the time and cost necessary for getting freight to the state highway and rail networks. This reduction also eases the conflict between freight and commuters on local roads – improving safety and reducing local road maintenance costs.
The WRS identifies the significance of integrated land use and transport planning for its benefits in economic and social participation. The Regional Policy Statement is one mechanism for integrating land use and transport planning by providing a policy framework guiding development.
The maps in Figures 2 and 3 show the density and location of new subdivisions, less than eight hectares in size, in the western and eastern (Wairarapa) parts of the region respectively, from 2001 to 2010. These subdivisions are not differentiated by type, and therefore may include new residential, commercial or other zone types.
Figure 2: Density of new subdivisions < 8 Ha in area, western Wellington region, 2001 to 2010. Source: GWRC
Figure 3: Density of new subdivisions < 8 Ha in area, eastern Wellington region (Wairarapa), 2001 to 2010. Source: GWRC

WGN_DOCS-#902458-V1 22
In the western part of the region, growth has occurred in all regional centres. A higher density of new subdivisions now exists, particularly in Paraparaumu, Raumati, Porirua East, North Wellington and Riverstone Terraces (in Upper Hutt). Growth in Wellington City has also been strong.
In the eastern (Wairarapa) part of the region, a higher density of new subdivisions exists to the east and south of Masterton. There has also been reasonable growth in Carterton and Martinborough townships.
Figure 4 shows the location and number of new lots created each year in the Wellington region between 2001 and 2010. Over the last year there were just under 2000 new lots created across the entire region. Whilst there has been a decline in the number of new lots created in each district over the last year, Wellington City and Wairarapa continue to experience the largest number of new lots.
0
500
1000
1500
2000
2500
2001 2002 2003 2004 2005 2006 2007 2008 2009 2010Year
Num
ber
of n
ew lo
ts <
8 H
a
Wellington City Hutt City Porirua
Upper Hutt Kapiti Wairarapa
Figure 4: New lots created < 8 Ha in area, by district. Source: GWRC
From 2001 to 2005, the number of new lots created in each district remained relatively constant. Then over the next two years there was a rapid increase in the number of new lots created. Wairarapa districts and Wellington City experienced the largest growth, with Kapiti and Hutt City experiencing strong growth over the same period. Growth in Porirua and Upper Hutt was much more modest.
Other than a spike in new lots in Upper Hutt in 2008, and Wellington City and Wairarapa in 2009, there has been a decline in the number of new lots created in each district since 2007. In 2010, there were 69% fewer new lots created across the region than in 2007. The decline over the last few years may be a result of a slowing economy.

WGN_DOCS-#902458-V1 23
6. Current freight movements
Objective 2 of this report is to describe current freight movements in, out and through the Wellington region.
The primary sources of information for this section are the National Freight Demands Study (NFDS) 2008, the Hyder Freight Study and the latest RLTS Annual Monitoring Report 2009/10.
The Wellington regional economy has grown 62% since 1990.10 There is a direct relationship between economic growth and freight growth, so economic growth experienced in the Wellington region is expected to result in increased freight volumes within the region and across its boundaries.
The numbers given in the NFDS and Hyder study all relate to financial year 2006/07. More up-to-date information is given when available – principally through the Wellington RLTS Annual Monitoring Report and other sources such as annual reports and NZ Transport Agency state highway traffic volume data.
Due to the effects of the recent global economic slowdown, as shown in Figure 8, it is reasonable to assume that the average total tonnage of freight movements in, out and through the Wellington region is approximately now as it was then. There are, of course, significant differences from 2006/07 which limit the extent of any reasonable comparison. However, as seen in the ‘total’ line in Figure 8, the overall multi-modal numbers are probably fairly consistent with 2009/10 freight movements. The multi-modal total tonnage in 2009/10 is 5% less than in 2006/07.
6.1 Overall freight movements
The Hyder Freight Study breaks down the intra-regional and inter-regional movement of freight for the Wellington region in 2006/07 as seen below:
Wellington New Zealand
Intra-regional freight
Intra-regional freight (million tonnes) 7.74 165.5
Intra-regional freight (thousand tonne-kilometres) 309,601 6,855,644
Inter-regional freight
Inter-regional freight destined for the region (million tonnes) 12.02 226.83
Inter-regional freight destined for the region (thousand tonne-kilometres) 2,167,988 26,720,000
Inter-regional freight originating in the region (million tonnes) 9.52 226.83
Inter-regional freight originating in the region (thousand tonne-kilometres) 706,339 26,720,000
Figure 5: Hyder calculation on the information in the National Freight Demands Study
10 National bank: http://www.nationalbank.co.nz/economics/regional/default.aspx.
WGN_DOCS-#902458-V1 24
The above table shows that the Wellington region has a relatively high level of inter-regional freight movement. This is based on the total inter-regional freight tonnes originating and destined for the region compared to intra-regional freight.
The other conclusion drawn from this Hyder analysis is that the Wellington region is a net importer of freight – with 2.5 million tonnes more freight entering the region than leaving.
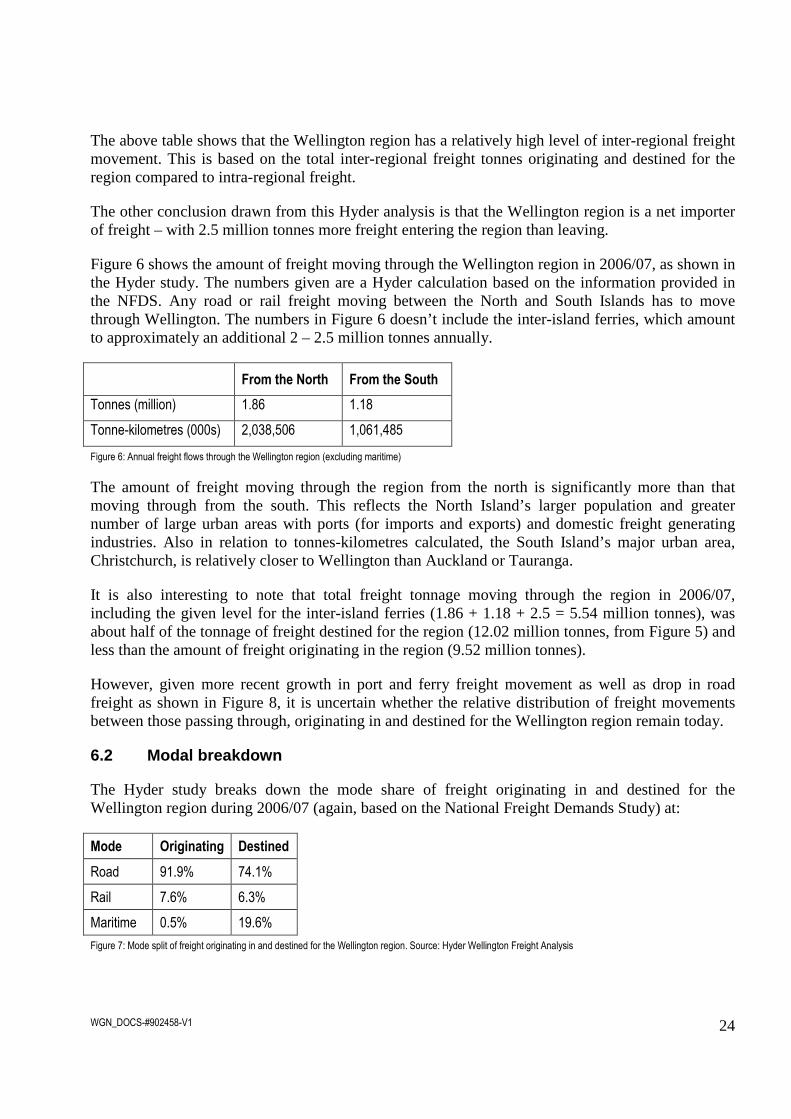
Figure 6 shows the amount of freight moving through the Wellington region in 2006/07, as shown in the Hyder study. The numbers given are a Hyder calculation based on the information provided in the NFDS. Any road or rail freight moving between the North and South Islands has to move through Wellington. The numbers in Figure 6 doesn’t include the inter-island ferries, which amount to approximately an additional 2 – 2.5 million tonnes annually.
From the North From the South
Tonnes (million) 1.86 1.18
Tonne-kilometres (000s) 2,038,506 1,061,485
Figure 6: Annual freight flows through the Wellington region (excluding maritime)
The amount of freight moving through the region from the north is significantly more than that moving through from the south. This reflects the North Island’s larger population and greater number of large urban areas with ports (for imports and exports) and domestic freight generating industries. Also in relation to tonnes-kilometres calculated, the South Island’s major urban area, Christchurch, is relatively closer to Wellington than Auckland or Tauranga.
It is also interesting to note that total freight tonnage moving through the region in 2006/07, including the given level for the inter-island ferries (1.86 + 1.18 + 2.5 = 5.54 million tonnes), was about half of the tonnage of freight destined for the region (12.02 million tonnes, from Figure 5) and less than the amount of freight originating in the region (9.52 million tonnes).
However, given more recent growth in port and ferry freight movement as well as drop in road freight as shown in Figure 8, it is uncertain whether the relative distribution of freight movements between those passing through, originating in and destined for the Wellington region remain today.
6.2 Modal breakdown
The Hyder study breaks down the mode share of freight originating in and destined for the Wellington region during 2006/07 (again, based on the National Freight Demands Study) at:
Mode Originating Destined
Road 91.9% 74.1%
Rail 7.6% 6.3%
Maritime 0.5% 19.6%
Figure 7: Mode split of freight originating in and destined for the Wellington region. Source: Hyder Wellington Freight Analysis

WGN_DOCS-#902458-V1 25
Freight is measured in a range of non-comparable units, and some data is commercially sensitive. This makes defining the transport mode share of freight movements difficult.
An index of freight movement has been created for the Wellington RLTS Annual Monitoring Report (Figure 8) and gives some more recent perspective on changes in inter-regional freight movement.
The total is an aggregate measure based on several assumptions and is only suitable as an index over time. It must be noted that much recorded freight does not have a regional origin or destination and is counted twice. For example, a container of logs may enter the region by road and leave by sea. Air freight figures are unavailable.
75
100
125
150
175
2003 2004 2005 2006 2007 2008 2009 2010Year
Fre
ight
mov
emen
t ind
ex
Port Ferry Road Rail Total
Figure 8: Inter-regional freight movements. 2003 = 100. Sources: CentrePort; Strait Shipping; New Zealand Transport Agency; KiwiRail
Note: Road freight refers to the previous calendar year.
An overall decline in inter-regional freight movement has occurred since 2008, after a steady increase in freight movement between 2003 and 2008. However, inter-regional freight movement in 2010 is 12% higher than that observed in 2003. There are also differences in freight movement by transport mode.
Inter-regional freight movement by ferry had the highest growth rate from 2003 to 2005, but since this time, ferry freight has declined overall. In 2010 ferry freight movement was 15% higher than that observed in 2003 after growing 8% over year 2009.

WGN_DOCS-#902458-V1 26
Rail freight movement has gradually declined since 2003, whereas freight movement through the port has gradually increased. Road freight movement also steadily increased from 2003 to 2005, and then experienced rapid growth up until 2008. In 2008, road freight movement was 49% higher than in 2003. However, since 2008 road freight movement has rapidly declined and in 2010 road freight was only 7% higher than in 2003.
Current data on the 2009/10 mode share of intra-regional freight movement is not available. However, given the relatively short distances involved (an average of 40 kilometres11) it is assumed that the vast majority of this freight is taken by road.
6.2.1 Road
The percentage of heavy vehicles on key routes is obtained from NZ Transport Agency’s permanent telemetry sites. These sites record the length of each vehicle, and anything more than 5.5 metres defined as ‘heavy’. The average percentage of heavy vehicles (during March and October) on selected key routes on weekdays is shown in Figure 9.
Nationally, NZ Transport Agency telemetry data indicates that in 2009, there has been a reduction of approximately 4% in heavy commercial vehicles (HCV) using the State Highway network, compared to 2008. The heavy vehicle growth index returned to similar levels as observed in 2006.
0
2
4
6
8
10
12
14
16
2001 2002 2003 2004 2005 2006 2007 2008 2009Year
Per
cent
age
of h
eavy
veh
icle
s (%
)
SH1&2 @ Ngauranga SH2 @ Rimutaka SH58 @ Pauatahanui
Figure 9: Heavy vehicles on major routes (%), weekdays. March and October. Sources: GWRC; New Zealand Transport Agency
11 Hyder, Wellington Freight Analysis, page 12.
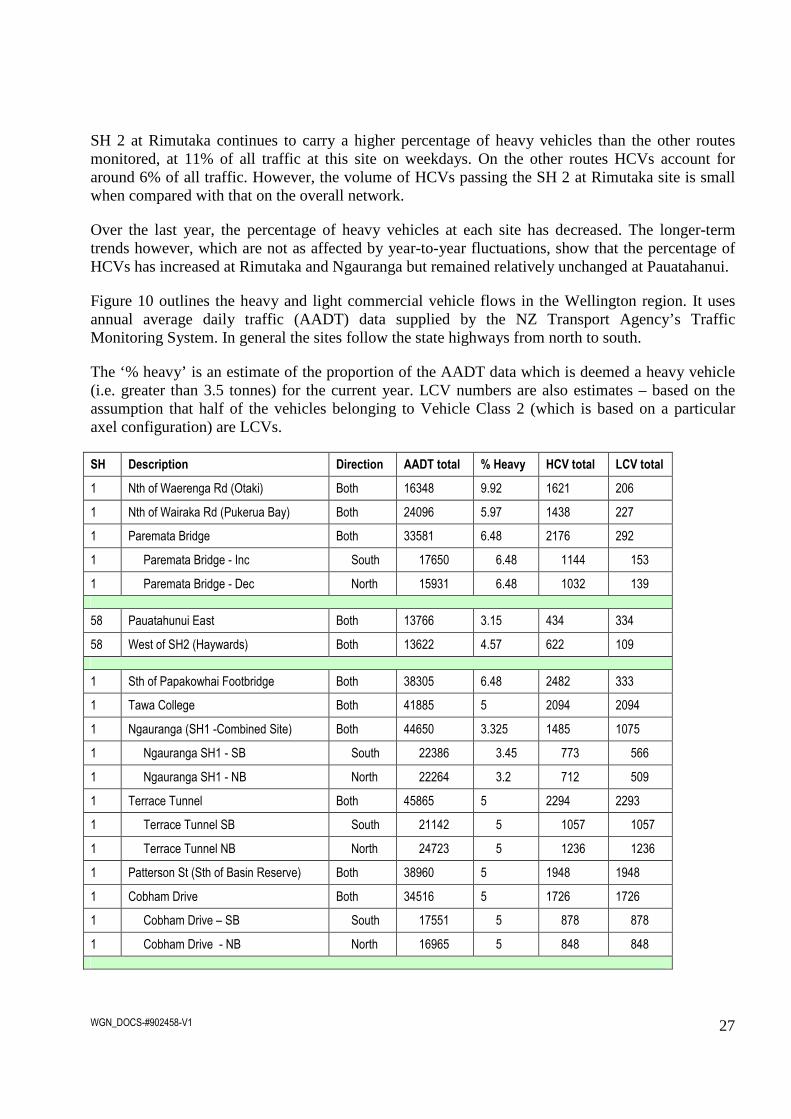
WGN_DOCS-#902458-V1 27
SH 2 at Rimutaka continues to carry a higher percentage of heavy vehicles than the other routes monitored, at 11% of all traffic at this site on weekdays. On the other routes HCVs account for around 6% of all traffic. However, the volume of HCVs passing the SH 2 at Rimutaka site is small when compared with that on the overall network.
Over the last year, the percentage of heavy vehicles at each site has decreased. The longer-term trends however, which are not as affected by year-to-year fluctuations, show that the percentage of HCVs has increased at Rimutaka and Ngauranga but remained relatively unchanged at Pauatahanui.
Figure 10 outlines the heavy and light commercial vehicle flows in the Wellington region. It uses annual average daily traffic (AADT) data supplied by the NZ Transport Agency’s Traffic Monitoring System. In general the sites follow the state highways from north to south.
The ‘% heavy’ is an estimate of the proportion of the AADT data which is deemed a heavy vehicle (i.e. greater than 3.5 tonnes) for the current year. LCV numbers are also estimates – based on the assumption that half of the vehicles belonging to Vehicle Class 2 (which is based on a particular axel configuration) are LCVs.
SH Description Direction AADT total % Heavy HCV total LCV total
1 Nth of Waerenga Rd (Otaki) Both 16348 9.92 1621 206
1 Nth of Wairaka Rd (Pukerua Bay) Both 24096 5.97 1438 227
1 Paremata Bridge Both 33581 6.48 2176 292
1 Paremata Bridge - Inc South 17650 6.48 1144 153
1 Paremata Bridge - Dec North 15931 6.48 1032 139
58 Pauatahunui East Both 13766 3.15 434 334
58 West of SH2 (Haywards) Both 13622 4.57 622 109
1 Sth of Papakowhai Footbridge Both 38305 6.48 2482 333
1 Tawa College Both 41885 5 2094 2094
1 Ngauranga (SH1 -Combined Site) Both 44650 3.325 1485 1075
1 Ngauranga SH1 - SB South 22386 3.45 773 566
1 Ngauranga SH1 - NB North 22264 3.2 712 509
1 Terrace Tunnel Both 45865 5 2294 2293
1 Terrace Tunnel SB South 21142 5 1057 1057
1 Terrace Tunnel NB North 24723 5 1236 1236
1 Patterson St (Sth of Basin Reserve) Both 38960 5 1948 1948
1 Cobham Drive Both 34516 5 1726 1726
1 Cobham Drive – SB South 17551 5 878 878
1 Cobham Drive - NB North 16965 5 848 848

WGN_DOCS-#902458-V1 28
2 Sth of Readers Cutting Both 2969 12.23 363 48
2 Sth of Intermediate St (Masterton) Both 14028 4.21 590 110
2 Nth of Victoria St (Carterton) Both 12233 4.76 582 126
2 Sth of Tauherenikau River Bridge Both 5651 5.93 335 63
2 Sth of Whakatiki St Both 25829 4.86 1256 207
2 Sth of SH 58 Both 34878 5.77 2011 1118
2 Nth of Block Rd Both 35858 5.76 2067 1149
2 Nth of Block Rd (SB) South 16533 5.76 953 530
2 Nth of Block Rd (NB) North 19325 5.76 1114 619
2 Nth of Ngauranga Interchange Both 67271 3.28 2204 1375
2 Nth of Ngauranga Interchange (SB) South 33100 3.35 1108 710
2 Nth of Ngauranga Interchange (NB) North 34171 3.21 1096 665
Figure 10: Annual Average Daily Traffic information. Source: NZ Transport Agency
Figure 10 indicates that about 1,600 heavy vehicles pass both ways across the regional boundary along SH 1 and about 360 enter and leave the region along SH 2 each weekday. It also shows that a high proportion of the Wellington region’s heavy vehicles travel relatively short trips on state highways between north of the Terrace Tunnel, south of Porirua, and south of Upper Hutt.
At the merge of SH 1 and SH 2 at Ngauranga, approximately 3,700 heavy vehicles travel south into Wellington City. This is the key segment of the state highway network for HCVs as it connects Wellington City with Lower Hutt, Upper Hutt, Seaview (where some CentrePort operations are carried out), Petone and the Wairarapa region.
The reduction of heavy vehicles by nearly 600 between the Tawa and Ngauranga sites along SH 1 suggest that these vehicles are either using Hutt Road to enter Wellington City, rather than SH 1 or are turning to travel north up SH 2 (the same suggestion can be made for heavy vehicles travelling south down SH 2 and turning north up SH 1 at Ngauranga). Data supplied by Wellington City shows Aotea Quay having more HCVs travelling on it than anywhere else in the region at approximately 5,000 a day.
Over 2,000 heavy vehicles pass (in both directions) through the Terrace Tunnel and just less than that travel further south of the Basin Reserve on a daily basis. Also, approximately 2,000 heavy vehicles a day pass through the SH 1 section near Tawa, and approximately 1,000 heavy vehicles pass through SH 2 north of Upper Hutt.
Therefore, it is likely that this high proportion of heavy vehicles are travelling between CentrePort (using Aotea Quay exit/entry on Hutt Road and SH 1) distribution centres or manufacturing locations in Lower Hutt, Upper Hutt, Ngauranga, Petone and Seaview using Hutt Road, SH 1 and 2.
There is little information publically available on the usage of local roads by heavy and light commercial vehicles. This is a considerable information gap considering local roads comprise the beginning and end phases of a road freight trip.

WGN_DOCS-#902458-V1 29
Local arterial roads carry considerable numbers of freight vehicles – The Esplanade in Lower Hutt City, for example, carries approximately 1,200 heavy vehicles on an average working week, or 5% of the total traffic. This is similar to the numbers carried by the SH 2 in Hutt Valley.
In terms of tonnage, from the NFDS, it is estimated that the Wellington region received about 11.2 million tonnes and sent 9.3 million tonnes by road in 2006/07. Most of this road freight movement is intra-regional with 7.7 million tonnes having both its origin and destination within the region. Wellington received 1.4 million tonnes of freight from Manawatu and 800,000 tonnes from Auckland by road. Wellington also exported 1.3 million tonnes to Manawatu by road and approximately 100,000 tonnes to Auckland, Waikato, Bay of Plenty and Hawke’s Bay.
6.2.2 Rail
Rail connections to CentrePort and the Cook Strait ferries means the region’s rail network is of national importance. Currently, over half a billion dollars is being invested in upgrading the region’s rail network and purchasing new passenger trains. Mainfreight and Peter Baker Transport are also building new rail-sided terminals near the Wellington Train Station. Mainfreight is also constructing terminals in Palmerston North.
The KiwiRail Turnaround Plan calls for investment on the North Island Main Trunk rail line that will reduce the travel time a train takes between Auckland and Wellington from the current 14 hours to 12 hours. The other main rail line in the region is the Wairarapa line which branches away from the NIMT line at Kaiwharawhara and runs north through Wairarapa to Woodville. The Wairarapa line was upgraded in 2010 in order to carry freight diverted from the NIMT.
This is a result of a ‘block the line’ on the NIMT required to undertake major works as part of the double tracking and electrification project to Waikanae on that line. This diversion highlights the importance of the Wairarapa line in the resilience of the North Island’s rail network by mitigating the effects of closures on the NIMT rail line.
The NFDS calculated total rail freight movements destined for Wellington at 442,000 tonnes in 2006/07. The total amount originating from Wellington during the same year was 181,000 tonnes. Most of the rail freight coming into Wellington originated in Manawatu (199,000 tonnes) and Auckland (94,000 tonnes).
Most of the freight that originated in Wellington was internal (58,000 tonnes) or travelled north to Manawatu (52,000 tonnes) or further up to Auckland (24,000 tonnes). Total rail freight from Wellington to the South Island is 19,000 tonnes - most of it (13,000 tonnes) going to Canterbury.
6.2.3 Sea freight
CentrePort’s infrastructure enables the movement of approximately 11 million tonnes per annum, including inter-island freight movements. This freight volume is significantly more that the majority of other New Zealand ports, with the exception of Ports of Auckland and Port Tauranga.12
12 As reported in the NZ Transport Agency State Highway Classification consultation draft 2011.

WGN_DOCS-#902458-V1 30
Domestic sea freight is broadly split into three different categories in New Zealand: ferry, coastal, and trans-shipments. Ferry services run back and forth repeatedly between two ports-of-call. Coastal shipping services carry domestic freight on routes between multiple ports. Trans-shipment is very similar to coastal shipping; however trans-shipments carry international-bound freight from a New Zealand port to an intermediate New Zealand port before being loaded onto an international container vessel.
KiwiRail Interislander is the main provider of ferry services into and out of the Wellington region. The other main ferry service provider is Strait Shipping. Interislander’s three ships make approximately 50 return sailings to Picton and back per week. In 2009/10 the Interislander ferries handled an overall total of 1,893,300 lane metres, or an estimated 3,264,221 tonnes, of freight. Half of the freight from commercial vehicles – not including rail – was classified as general (52%) and the other half is composed of refrigerated goods (22%), courier (10%), livestock (5%), furniture (3%), bulk goods (6%) and cars (1%).
Coastal shipping, on the other hand, refers to domestic cargos of both bulk products (such as cement and oil) and containerised products. The main coastal shipping operations in the Wellington region are:
• Strait Shipping and Interislander ferries between Wellington and Picton – both carry cargo of national importance.
• Strait Shipping’s service between Wellington and Nelson carries domestic cargo as well as international bound cargo being trans-shipped through CentrePort.
Pacifica Shipping operates container vessels which link the ports of Nelson, Taranaki and Wellington to the ports of Auckland, Christchurch and Tauranga. The main purpose of these services is to carry out the coastal feeder service for trans-shipping Asian imports to New Zealand and New Zealand exports to Asia through the larger ports. Over the 12 months to 31 January 2011, Pacifica Shipping handled 1,657 TEU containers through Wellington for approximately 18,558 tonnes of freight. Pacifica Shipping also handles a number of empty containers from CentrePort which it carries to other ports where exports exceed imports – namely Napier, Nelson and New Plymouth.
Coastal shipping operates with relatively longer transit times than an all-road mode. While it can offer relatively low costs, the goods still have to be transferred to and from road vehicles at each end, as is the case with the majority of through-rail movements except in cases where rail sidings in freight generating areas are available. It is therefore primarily a market for non-urgent cargoes.
The following table lists the 12 month rolling annual volume of the total throughput from CentrePort (as at 31 January 2011). It includes both coastal and trans-shipment volumes.
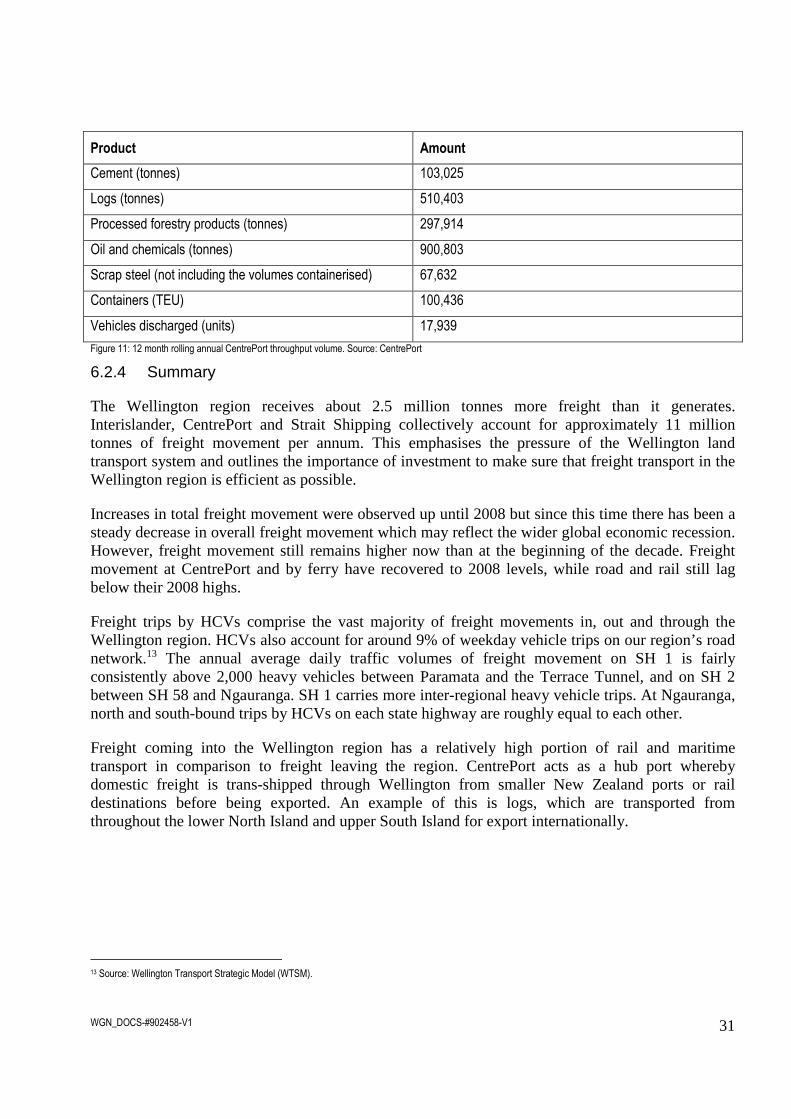
WGN_DOCS-#902458-V1 31
Product Amount
Cement (tonnes) 103,025
Logs (tonnes) 510,403
Processed forestry products (tonnes) 297,914
Oil and chemicals (tonnes) 900,803
Scrap steel (not including the volumes containerised) 67,632
Containers (TEU) 100,436
Vehicles discharged (units) 17,939
Figure 11: 12 month rolling annual CentrePort throughput volume. Source: CentrePort
6.2.4 Summary
The Wellington region receives about 2.5 million tonnes more freight than it generates. Interislander, CentrePort and Strait Shipping collectively account for approximately 11 million tonnes of freight movement per annum. This emphasises the pressure of the Wellington land transport system and outlines the importance of investment to make sure that freight transport in the Wellington region is efficient as possible.
Increases in total freight movement were observed up until 2008 but since this time there has been a steady decrease in overall freight movement which may reflect the wider global economic recession. However, freight movement still remains higher now than at the beginning of the decade. Freight movement at CentrePort and by ferry have recovered to 2008 levels, while road and rail still lag below their 2008 highs.
Freight trips by HCVs comprise the vast majority of freight movements in, out and through the Wellington region. HCVs also account for around 9% of weekday vehicle trips on our region’s road network.13 The annual average daily traffic volumes of freight movement on SH 1 is fairly consistently above 2,000 heavy vehicles between Paramata and the Terrace Tunnel, and on SH 2 between SH 58 and Ngauranga. SH 1 carries more inter-regional heavy vehicle trips. At Ngauranga, north and south-bound trips by HCVs on each state highway are roughly equal to each other.
Freight coming into the Wellington region has a relatively high portion of rail and maritime transport in comparison to freight leaving the region. CentrePort acts as a hub port whereby domestic freight is trans-shipped through Wellington from smaller New Zealand ports or rail destinations before being exported. An example of this is logs, which are transported from throughout the lower North Island and upper South Island for export internationally.
13 Source: Wellington Transport Strategic Model (WTSM).
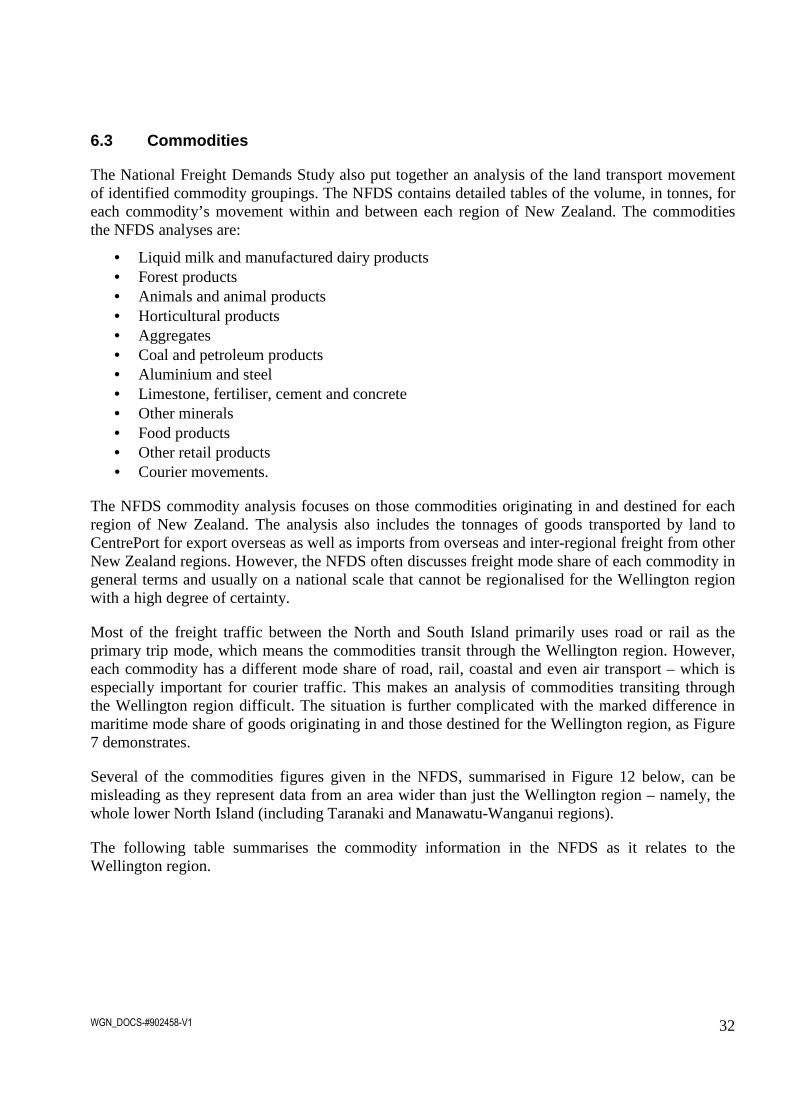
WGN_DOCS-#902458-V1 32
6.3 Commodities
The National Freight Demands Study also put together an analysis of the land transport movement of identified commodity groupings. The NFDS contains detailed tables of the volume, in tonnes, for each commodity’s movement within and between each region of New Zealand. The commodities the NFDS analyses are:
• Liquid milk and manufactured dairy products • Forest products • Animals and animal products • Horticultural products • Aggregates • Coal and petroleum products • Aluminium and steel • Limestone, fertiliser, cement and concrete • Other minerals • Food products • Other retail products • Courier movements.
The NFDS commodity analysis focuses on those commodities originating in and destined for each region of New Zealand. The analysis also includes the tonnages of goods transported by land to CentrePort for export overseas as well as imports from overseas and inter-regional freight from other New Zealand regions. However, the NFDS often discusses freight mode share of each commodity in general terms and usually on a national scale that cannot be regionalised for the Wellington region with a high degree of certainty.
Most of the freight traffic between the North and South Island primarily uses road or rail as the primary trip mode, which means the commodities transit through the Wellington region. However, each commodity has a different mode share of road, rail, coastal and even air transport – which is especially important for courier traffic. This makes an analysis of commodities transiting through the Wellington region difficult. The situation is further complicated with the marked difference in maritime mode share of goods originating in and those destined for the Wellington region, as Figure 7 demonstrates.
Several of the commodities figures given in the NFDS, summarised in Figure 12 below, can be misleading as they represent data from an area wider than just the Wellington region – namely, the whole lower North Island (including Taranaki and Manawatu-Wanganui regions).
The following table summarises the commodity information in the NFDS as it relates to the Wellington region.

WGN_DOCS-#902458-V1 33
Commodity group Wellington destination (million tonnes)
Wellington origin (million tonnes)
Intra-regional movement (million tonnes)
Liquid milk14 4.1 3.96 3.92
Manufactured dairy products14 0.62 0.71 0.57
Forest products 1.36 0.73 0.45
Animals and animal products 0.15 0.15 0.12
Horticultural products 0.28 0.06 0.06
Aggregates15 2.40 2.40 2.16
Coal n/a n/a n/a
Petroleum products14 1.68 1.28 1.10
Aluminium and steel14 0.16 0.09 0.09
Limestone, fertiliser, cement
and concrete14
2.42 1.95 1.74
Other minerals14 0.05 0.01 0.01
Food products 0.76 0.29 0.18
Other retail products 0.72 0.43 0.38
Courier movements 0.051 0.052 0.002
Figure 12: Commodity movements relevant to Wellington region and percentage growth to 2031.
In general, looking at the tonnage of goods with only the Wellington region as their destination shows that aggregates has the most tonnage, followed by forest products, then food and other retail products, horticultural products and finally animals and animal products.
The tonnage of goods originating in the Wellington region is mostly taken up by aggregates again, followed by forest products, other retail, food products, animals and animal products, and horticultural products.
Total retail goods originating in the Wellington region amount to 720,000 tonnes, while all retail goods destined for Wellington is 1.48 million tonnes. 570,000 tonnes of retail goods are locally sourced, with 460,000 tonnes arriving from Auckland and 380,000 tonnes coming from Manawatu-Wanganui. Wellington sends retail goods principally to Manawatu-Wanganui (120,000 tonnes).
Figure 12 provides further evidence that Wellington is a net importer of freight as most commodities have more tonnages destined for the Wellington region (and the wider lower North Island) than originating in the region.
The majority of most commodity movements are intra-regional – with an origin and destination within the Wellington region. The sole exception of this trend is for courier movements.
14 These figures correspond to a wider area than the Wellington region and include Taranaki and Manawatu-Wanganui regions. 15 Excluding pipelines

WGN_DOCS-#902458-V1 34
In most other cases, the volume of intra-regional movements (that stay within the region) is very similar to the volume of goods originating in the region. The commodity tables in the NFDS show that the vast majority of goods produced in the Wellington region are sold within the region or exported overseas through CentrePort – and therefore not destined for other New Zealand regions.
The single biggest commodity CentrePort handles is oil and petroleum products – which it takes in at Seaview. Logs and other forestry products are the single biggest export from CentrePort with 539,000 tonnes exported in 2006/07.
6.3.1 Projected growth
The study also projected growth for each commodity to 2031.
The movement of goods originating in the region are forecast in the NFDS to grow from 6.78 million tonnes in 2006/07 to 12.83 million tonnes in 2031. For the movement of goods destined to the Wellington region the forecast growth is from 8.09 million tonnes to 15.89 million tonnes. That is a forecast doubling in tonnes lifted for both goods originating in and destined for the Wellington region. For similar reasons given above, it is difficult to estimate a projected volume of freight through traffic for 2031.
While these projections are not broken down into individual commodities in the National Freight Demands Study, it does forecast a 270% increase in total log production in the Wellington region. The Study also predicts that CentrePort will import more food products for supermarkets and other food retailers.
For the movement of other commodities, Wellington is likely to change in proportion to relative economic and population growth compared with other New Zealand regions.
7. Issues and limitations
Objective 3 of this background report is to identify the issues and limitations of freight movement in, out and through the Wellington region.
As stated above, the NFDS predicts that freight movements for the Wellington region will double by 2031. Most of the data provided below is excerpted from the 2009/10 Wellington RLTS Annual Monitoring Report.
7.1 Congestion
Congestion has an economic cost in terms of wasted time and lost productivity caused by delays, as well as increased fuel use and the consequent increased vehicle emissions. Traffic congestion also often influences trip timing by spreading demand, affects mode choice and eventually influences land use decisions.
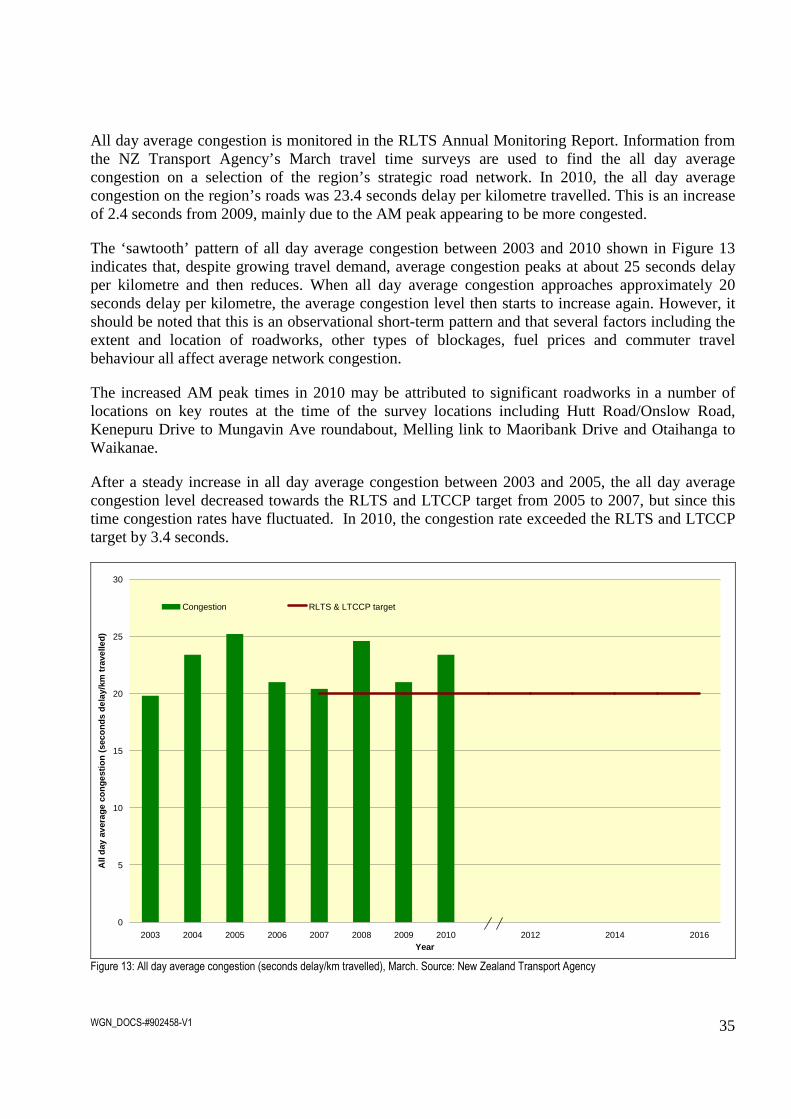
WGN_DOCS-#902458-V1 35
All day average congestion is monitored in the RLTS Annual Monitoring Report. Information from the NZ Transport Agency’s March travel time surveys are used to find the all day average congestion on a selection of the region’s strategic road network. In 2010, the all day average congestion on the region’s roads was 23.4 seconds delay per kilometre travelled. This is an increase of 2.4 seconds from 2009, mainly due to the AM peak appearing to be more congested.
The ‘sawtooth’ pattern of all day average congestion between 2003 and 2010 shown in Figure 13 indicates that, despite growing travel demand, average congestion peaks at about 25 seconds delay per kilometre and then reduces. When all day average congestion approaches approximately 20 seconds delay per kilometre, the average congestion level then starts to increase again. However, it should be noted that this is an observational short-term pattern and that several factors including the extent and location of roadworks, other types of blockages, fuel prices and commuter travel behaviour all affect average network congestion.
The increased AM peak times in 2010 may be attributed to significant roadworks in a number of locations on key routes at the time of the survey locations including Hutt Road/Onslow Road, Kenepuru Drive to Mungavin Ave roundabout, Melling link to Maoribank Drive and Otaihanga to Waikanae.
After a steady increase in all day average congestion between 2003 and 2005, the all day average congestion level decreased towards the RLTS and LTCCP target from 2005 to 2007, but since this time congestion rates have fluctuated. In 2010, the congestion rate exceeded the RLTS and LTCCP target by 3.4 seconds.
0
5
10
15
20
25
30
2003 2004 2005 2006 2007 2008 2009 2010 2012 2014 2016Year
All
day
aver
age
cong
estio
n (s
econ
ds d
elay
/km
trav
elle
d)
Congestion RLTS & LTCCP target
Figure 13: All day average congestion (seconds delay/km travelled), March. Source: New Zealand Transport Agency

WGN_DOCS-#902458-V1 36
Severe congestion occurs particularly at peak times on the main routes in and out of Wellington City CBD – usually in urban areas. ‘Bottlenecks’ on the strategic network include Mana Esplanade, Paekakariki, Pukerua Bay, SH 1 Ngauranga interchange, SH 2 Dowse to Ngauranga and around the Terrace and Mt Victoria Tunnels.
Severe congestion, which is particularly relevant to freight movements, includes the SH 1 Aotea on-ramp and the SH 2 Ngauranga on- and off-ramp in the evening peak. Other important freight congestion sites are SH 2 Petone on-ramp during the morning peak and Petone Esplanade during the evening peak.
The expected growth in road freight volumes, together with timing needs associated with freight delivery will mean an increasing contribution of road freight to peak period congestion. Currently, there are significant heavy vehicle flows along SH 1 as well as SH 2 (which links manufacturing centres in Upper and Lower Hutt, as well as Seaview with the population base and port facilities in Wellington City).
Rail movements that occur across Waterloo Quay during the commuter peak periods contribute to substantial traffic congestion along the waterfront route and queuing back onto the Wellington Urban Motorway at Aotea Quay.
Modelling of the network suggests that peak period congestion can be maintained at current levels, despite population and economic growth with corresponding increases in travel demand, with appropriate investment in the network across all modes.
Demand measures around freight operations such as avoiding travel during peak periods, separating freight and commuter traffic as well as trends in freight consolidation in multi-modal hubs as in Palmerston North can also contribute to meeting RLTS congestion targets. However, avoiding travel during peak periods can lead to increased labour costs and working un-social hours for freight transport companies and receiving businesses.
7.2 Road freight travel time between key destinatio ns
Representative routes for typical road freight movements across the region are shown below:
• Route 1: Seaview – Porirua via SH58 • Route 2: Seaview – Porirua via SH1 and SH2 • Route 3: Seaview – CentrePort
Figures 14 to 16 show the all day average travel time in minutes for routes 1 to 3 respectively.

WGN_DOCS-#902458-V1 37
0
10
20
30
40
50
Eastbound Westbound
Route 1: Seaview and Porirua via SH58
All
day
aver
age
trav
el ti
me
(min
s)
2003 2004 2005 2006 2007 2008 2009 2010
Figure 14: All day average travel time (mins) on road freight route 1, March. Sources: New Zealand Transport Agency; GWRC
Since measurements began, the all day average time taken to travel between Porirua and Seaview (eastbound) via State Highway 58 has decreased, even though a slight increase was observed over the last year. Last year, travel times increased during all three periods of the day (AM peak, interpeak and PM peak) but the increase in the AM peak of around 14 minutes accounts for the majority of the increase in all day travel time observed last year.
Since measurements began, the travel time on the westbound route has gradually increased. Travel time was also found to increase in this direction during the AM peak, but only by around 4 minutes since 2009 – a considerably smaller increase than that observed in the eastbound direction. A slight increase in travel time also occurred during the inter-peak but there was nearly a 4 minute decrease during the PM peak.
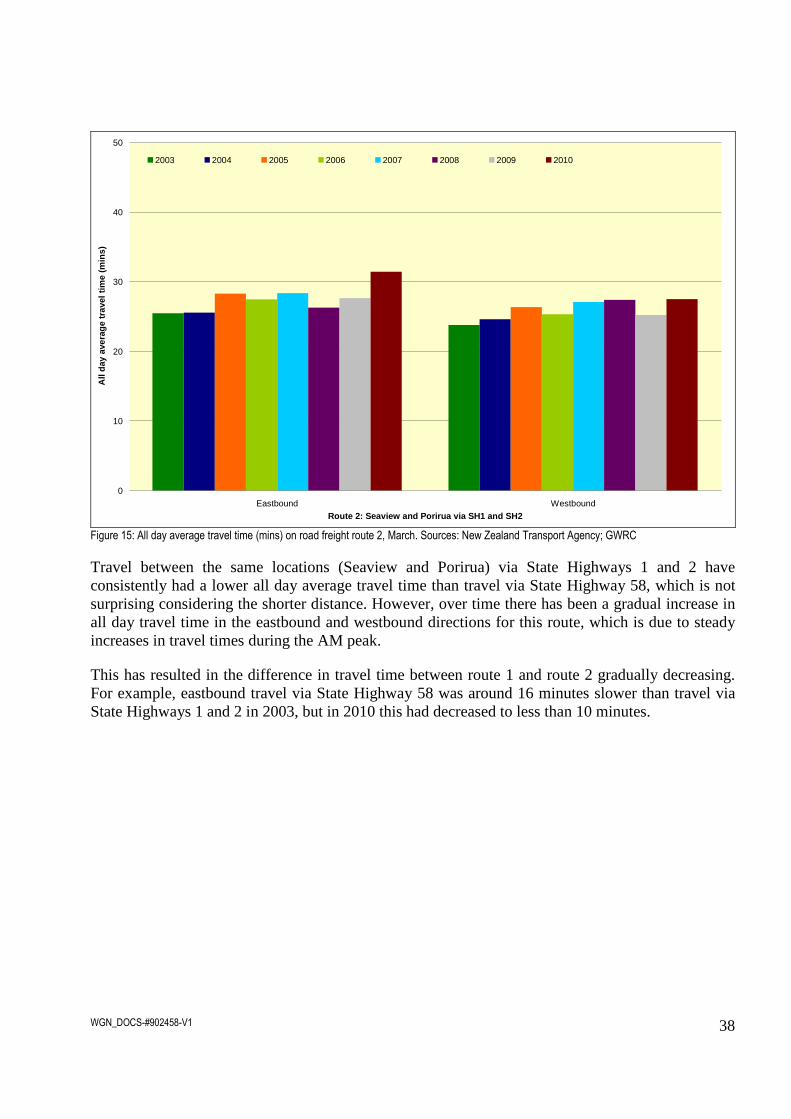
WGN_DOCS-#902458-V1 38
0
10
20
30
40
50
Eastbound WestboundRoute 2: Seaview and Porirua via SH1 and SH2
All
day
aver
age
trav
el ti
me
(min
s)
2003 2004 2005 2006 2007 2008 2009 2010
Figure 15: All day average travel time (mins) on road freight route 2, March. Sources: New Zealand Transport Agency; GWRC
Travel between the same locations (Seaview and Porirua) via State Highways 1 and 2 have consistently had a lower all day average travel time than travel via State Highway 58, which is not surprising considering the shorter distance. However, over time there has been a gradual increase in all day travel time in the eastbound and westbound directions for this route, which is due to steady increases in travel times during the AM peak.
This has resulted in the difference in travel time between route 1 and route 2 gradually decreasing. For example, eastbound travel via State Highway 58 was around 16 minutes slower than travel via State Highways 1 and 2 in 2003, but in 2010 this had decreased to less than 10 minutes.

WGN_DOCS-#902458-V1 39
0
10
20
30
40
50
Eastbound WestboundRoute 3: Seaview and CentrePort
All
day
aver
age
trav
el ti
me
(min
s)
2003 2004 2005 2006 2007 2008 2009 2010
Figure 16: All day average travel time (mins) on road freight route 3, March. Sources: New Zealand Transport Agency; GWRC
The all day average travel time between Seaview and CentrePort was 24 minutes (eastbound) and 26 minutes (westbound) in 2010. There has been a gradual increase in all day travel time both eastbound and westbound since the surveys began in 2003. Since this time, there has been little change in the travel time during the inter-peak and PM peak, but the AM peak has increased by over 10 minutes in both directions.
As HCV traffic is closely related to economic activity, it is important that freight can be efficiently moved between key destinations in the region. The all day average travel times between three key freight locations in the region have generally increased but this tends to be due to large increases in travel times during the AM peak. The PM peak and inter-peak travel times have either decreased or remained relatively unchanged.
The overall increases in travel times, suggest that the all day average efficiency of freight movement across the region has decreased over time. However, the current performance indicators do not show what time of day freight traffic tends to move around the region. Therefore, it is uncertain if the changes in travel times from year to year are significant for the freight sector.
7.3 Travel time variability by road
The percentage variability in travel time across three periods of the day, from the NZTA’s travel time surveys, is shown in Figure 17. This is a measure of the reliability of travel times by road.
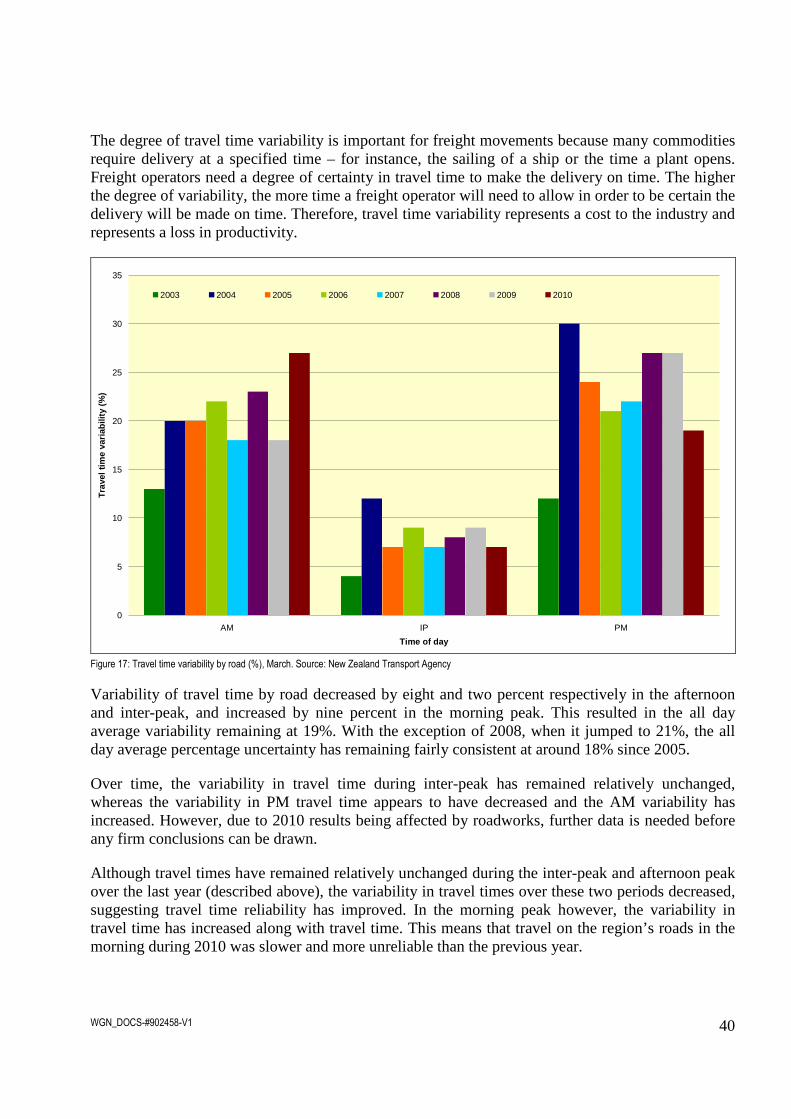
WGN_DOCS-#902458-V1 40
The degree of travel time variability is important for freight movements because many commodities require delivery at a specified time – for instance, the sailing of a ship or the time a plant opens. Freight operators need a degree of certainty in travel time to make the delivery on time. The higher the degree of variability, the more time a freight operator will need to allow in order to be certain the delivery will be made on time. Therefore, travel time variability represents a cost to the industry and represents a loss in productivity.
0
5
10
15
20
25
30
35
AM IP PM
Time of day
Tra
vel t
ime
varia
bilit
y (%
)
2003 2004 2005 2006 2007 2008 2009 2010
Figure 17: Travel time variability by road (%), March. Source: New Zealand Transport Agency
Variability of travel time by road decreased by eight and two percent respectively in the afternoon and inter-peak, and increased by nine percent in the morning peak. This resulted in the all day average variability remaining at 19%. With the exception of 2008, when it jumped to 21%, the all day average percentage uncertainty has remaining fairly consistent at around 18% since 2005.
Over time, the variability in travel time during inter-peak has remained relatively unchanged, whereas the variability in PM travel time appears to have decreased and the AM variability has increased. However, due to 2010 results being affected by roadworks, further data is needed before any firm conclusions can be drawn.
Although travel times have remained relatively unchanged during the inter-peak and afternoon peak over the last year (described above), the variability in travel times over these two periods decreased, suggesting travel time reliability has improved. In the morning peak however, the variability in travel time has increased along with travel time. This means that travel on the region’s roads in the morning during 2010 was slower and more unreliable than the previous year.

WGN_DOCS-#902458-V1 41
However, the roadworks at key locations along the routes will have contributed to longer travel times and less reliability. Results during the inter-peak and afternoon peak are much more encouraging and show decent progress towards maintaining vehicle travel times between communities and regional destinations.
7.4 Empty running
Hyder’s analysis of average trip lengths for inter-regional freight destined for and originating in the Wellington region indicated that imports have a longer average journey than exports (Figure 5). This shows that a significant level of inter-regional freight trips in the region are empty trips.
Empty running refers to a truck or train that is not carrying freight (for example, a truck delivering goods to a port and returning to a warehouse without a load from the port). Empty running represents inefficiency in the logistics chain – because it increases the net costs of moving freight as there is no financial benefit from the return journey. Empty running is problematic for wider users of the roads as it contributes to congestion for other users and damage to the road surface.
Clearly, the value of the laden trip means it still remains profitable for the freight operator to make the empty trip, but empty running does present concerns for the transport network. It is also a sub-optimal from an efficiency perspective relative to a trip where freight is being carried.
Empty running cannot be eliminated in the region so long as Wellington remains primarily a destination point for consumer freight, without the manufacturing base to offset the inward movement goods. The short-term opportunities to reduce empty running exist in the possibility of better managing inter-island freight movements. In the long-term, a growth in export generating industries in the Wellington region will be required to reduce empty running.
7.5 Rail constraints
The rail network is particularly important for long distance and high volume freight connections. Rail connections to CentrePort and the Cook Strait ferries mean the region’s rail network is of national importance. The rail tunnel through the Rimutakas and connecting lines between CentrePort and Seaview mean that there are also opportunities for increasing short-haul rail freight volumes in the Wellington region.
Work has also been done on the North Wairarapa Line to upgrade several bridges and other parts of the line in order to carry the freight volumes during major works on the North Island Main Trunk line over the Christmas/New Year period of 2010/11.
The KiwiRail Turnaround Plan identifies the North Island Main Trunk rail line as a priority for track upgrades and improvements to reduce the travel time of freight trains between Auckland and Wellington. The Wellington Regional Rail Plan sets out a programme to 2035 to address infrastructure and rolling stock issues in conjunction with KiwiRail and local authorities.
The key constraint on the current rail network is the single-tracked section of railway line between Pukerua Bay and Paekakariki is known as North-South junction.

WGN_DOCS-#902458-V1 42
Freight trains experience much difficulty restarting if they are forced to stop on uphill sections of the track to wait for other trains to pass. This often occurs during the peak commuter periods due to conflict between commuter and freight services. Commuter trains are also often held up by freight trains in this area.
To address this issue KiwiRail lowered the track in the tunnels in North-South Junction. This work has enabled freight trains to traverse the section at higher speed. KiwiRail is also eased one curve to enable further increase in speed. This will reduce the amount of time any train spends in the single track section – which reduces delay. However, significant improvements to travel times in this area will require double-tracking the North-South Junction.
7.6 Network reliability
Reliability is a significant issue for the region. Journey time reliability is especially important for time sensitive activities to occur, such as flights and other inter-modal connections, opening hours and appointments. The development of more sophisticated supply chains and the reduction of inventories in retail stores are also placing an increasing premium on delivery within constrained time windows.
Day-to-day reliability of services
The key routes into Wellington’s CBD by road are subject to relatively high variability in ‘expected’ travel times. This is primarily due to congestion, but even a reasonably minor event can cause significant delays due to a lack of alternative routes to avoid the trouble spot (BERL, 2004). In March 2010, AM peak travel times on the strategic road network varied by 27% with PM peak variability at 19%.
The highway can be prone to closure following traffic accidents, provides limited access for emergency vehicles and is vulnerable to natural hazards such as landslips and flooding. There are limited alternative routes along this corridor. Improvements to State Highway 1 signalled for the next 10 years as part of the Wellington RoNS are expected to improve network reliability and reduce congestion in the long term after the route becomes operational.
Rail network service monitoring shows that EMU (electric multiple unit) services run to within five minutes of the timetable about 90% of the time. Wairarapa services run to within five minutes of the timetable about 80% of the time. A major contributor to poor service reliability is the ageing rail infrastructure and rolling stock which leaves the network vulnerable to faults and breakdowns. There are no figures available on freight train reliability, although anecdotal evidence suggests freight trains experience similar delays.
Like the highway, the rail corridor is also vulnerable to slips. The single track sections of the NIMT railway line north of Pukerua Bay is a significant weak point on the existing rail corridor as it delays trip times by not allowing north and southbound trains to pass each other. The double tracking project out to Waikanae by KiwiRail as part of the Regional Rail Plan has addressed a significant section of this weak point. However, more work through the North-South Junction and between Otaki and Palmerston North is needed.

WGN_DOCS-#902458-V1 43
Natural hazards and climate change
The extent of any disruption to the region’s transport network during a hazard event differs, depending on the event’s location and nature. Potential hazard events include flooding, landslides, earthquakes and tsunamis.
A major seismic event is likely to significantly impact the strategic transport links to Wellington, Hutt Valley and Porirua.16 This would affect access for emergency vehicles in the short term and general access over the medium to long term. Disruption caused by a major hazard event would have a significant social and economic impact on the region.
The potential impact of natural hazards and climate change on network reliability is not currently well documented. The resilience of the region’s transport network in response to such events and its ability to resume service as quickly as possible will be important in minimising their impact.
7.7 Ferry capacity
Rail carries 18% of domestic traffic between Auckland and Christchurch – in 1995 it carried approximately 60%.17 KiwiRail intends to focus on removing Auckland and Wellington Metro bottlenecks and making the North Island Main Trunk more robust. While other rail routes are busy and important, the Auckland-Christchurch route is the primary route for domestic rail-based containerised freight.
Assuming that all rail-based freight movements originating in the North Island that are destined for the South Island, and vice versa, transited through Wellington at the Interislander terminal – 646,000 tonnes flowed from the North Island to the South Island and 547,000 tonnes from the South Island to the North Island in 2006/07 according to the NFDS. The vast majority of this rail freight movement was between Auckland and Christchurch – with 368,000 tonnes moving by rail from Auckland to Christchurch and 173,000 tonnes going north. Interislander reports that they are at near their current maximum capacity to handle freight movements.
The NFDS predicts that rail freight to grow 70% in 20 years if rail maintains its current freight market share. KiwiRail has identified that greater rail capacity will be needed for Interislander to support freight business growth. Total freight volumes moving through the Interislander ferry terminal are expected to grow 36% over the next 10 years and 77% in 20 years.18
Nationally, rail is expected to expand to handle 40% of freight movements. Mainfreight is moving their Seaview based business to a new building near the Stadium by the rail shunt lines. Other Freight forwarders have signalled their intentions to increase their use of rail and have are planning on building rail sided warehouses in key locations, eg Palmerston North, Wellington, Christchurch etc to make full use of rail’s capability and to reduce their own asset base, particularly where they only have one way loads. This has the potential to greatly contribute to the tonnage carried on the Auckland – Christchurch rail route in line with these growth figures.
16 Wellington Lifelines Group. Nov 2005. Submission to proposed Western Corridor Plan. 17 KiwiRail, The Backbone of integrated transport networks. 18 KiwiRail, The Backbone of integrated transport networks.

WGN_DOCS-#902458-V1 44
For road freight capacity at the ferry terminal, currently there are 23 slots for trucks to park at the terminal. However, 80 truck exchanges occur with each ferry voyage. There are also safety issues here with freight trucks competing with passenger vehicles for limited space. In total, approximately 1.1 million tonnes of road freight moved from the North Island to the South Island, and 1.2 million tonnes travelled the other way in 2006/07. Most likely, this amount of road freight, on top of the inter-island rail movements, transits through Wellington either at the Interislander terminal, CentrePort, or via Strait Shipping.
Figure 18 below shows the growth in Interislander ferry traffic as well as estimates of other coastal shipping operators since 1983; and includes projections of current trends from 2010 to 2030. These projections are based on the NFDS assumption that freight mode shares for rail and coastal shipping remain the same. The abbreviations in the chart are as follows:
• Rail – KiwiRail Freight traffic • IIL CV – road freight traffic carried by the Interislander ferries • SSL – estimates of Straight Shipping Limited traffic • Pac – estimates of Pacifica Shipping traffic • Int’l – estimates of total international trans-shipments (combined Interislander, SSL and Pac)
Inter Island Freight Volumes (LM)
0
500,000
1,000,000
1,500,000
2,000,000
2,500,000
3,000,000
3,500,000
4,000,000
4,500,000
5,000,000
5,500,000
19
83
19
85
19
87
19
89
19
91
19
93
19
95
19
97
19
99
20
01
20
03
20
05
20
07
20
09
20
11
20
13
20
15
20
17
20
19
20
21
20
23
20
25
20
27
20
29
Rail IIL CV SSL Pac Int'l Figure 18: Ferry and coastal shipping traffic (combination of real and estimates) since 1983 to 2010 with future projections to 2030. Source: Interislander.
Expanding Interislander’s capacity to handle freight is critical if the KiwiRail Turnaround Plan is to be successful and for rail to reliably compete with road-based freight. It can be anticipated that KiwiRail will factor into its future ferry replacement strategy the potential future demand – with a decision on the Arahura replacement due later this decade.
7.8 Access to CentrePort
Access to CentrePort’s container terminal, cruise terminal, main log yards and vehicle holding point is off Aotea Quay, which is a main arterial off SH 1. At peak times, the heavy commuter demand causes congestion and delays for freight entering and exiting the port by road transport.

WGN_DOCS-#902458-V1 45
The Hyder Wellington freight analysis states that approximately 70% of commuters into Wellington City travel from the Hutt Valley. Also, traffic count data provided by Wellington City indicates that an average of 30,000 vehicles use Aotea Quay during any given weekday. About 5,000 are heavy vehicles (22% to the total) and 400 are light commercial vehicles.
Rail access to CentrePort is via a direct connection from the Wellington Yard to the North Island Main Trunk line – New Zealand’s busiest rail line. Rail access to the port currently crosses Waterloo Quay just south of the Wellington Regional Stadium. Shunting of freight between the rail and port container yards, across Waterloo Quay, can cause long queues of vehicles during peak commuter times. Delays and unreliability of rail transport into the region via both the North Island Main Trunk line and the Wairarapa line means that freight exporters are evaluating whether other regions can provide better supply chain solutions.
Inefficient land transport caused by conflicts between commuter and freight transport results in delays and unreliability in transport times, requires higher inventory carrying costs and adds unnecessary costs into the Wellington supply chain. These costs are most likely to ultimately be passed onto the final consumers of the goods transported.
NZ Transport Agency, as part of the Wellington Roads of National Significance (RoNS) programme, is currently investigating new 4-lane roading infrastructure options for improving state highway traffic flows between the Ngauranga interchange and Aotea Quay off ramp. This project is expected to provide for improved traffic flows during peak traffic demand periods. It is important that any road or rail access at the SH 1 / Aotea Quay intersection does not reduce access between CentrePort’s land assets.
Conflict for road space can also be managed by improving rail access between Seaview and CentrePort so that freight transport has a choice of modes or, as envisaged under the RoNS programme, city arterial traffic movements are directed away from Waterloo/Aotea Quays through improvements to SH 1 with dual tunnels at the Terrace and Mt Victoria and associated roading infrastructure development. This will release the pressure on Aotea / Waterloo Quays so that they can better serve the port and rail infrastructure.
Greater Wellington has commissioned a Wellington Port Access Concept Plan to study future access to and from CentrePort and the Interislander ferry terminal by road and rail. It is expected that the conclusions from this concept plan will be taken into account by the NZ Transport Agency during its investigation phase for the Ngauranga to Aotea Oway project.
7.9 Port capacity
Lack of space for storage at CentrePort and elevated land values may lead freight transporters, transport companies and container terminal operators to operate offsite freight storage points or inland hubs. This will result in the requirement for time sensitive short haul journeys between these hubs and CentrePort.
This is a central issue for freight in general. As land prices elevate, distribution operations are relocated. These commercial decisions have significant impact on optimisation activities (which usually have a longer time horizon).

WGN_DOCS-#902458-V1 46
ERMA has also reviewed the use of methyl bromide as the primary fumigant treatment of logs and the new standards require larger buffers associated with the fumigation of logs. This will limit CentrePort’s ability to fumigate stored logs at the present sites near the Wellington Regional Stadium and at Seaview. Current practice at CentrePort is to fumigate logs within a ship’s hold whenever possible.
7.10 Airport capacity
Currently, the Wellington International Airport (WIAL) handles very little freight. Research commissioned by the airport and WIAL’s 2030 Master Plan for the airport identifies a potential rapid increase in air freight. WIAL currently lacks the capacity to cater for this growth. However, the Master Plan identifies a series of infrastructure improvements at the airport which can increase WIAL’s capacity to handle freight and can also help facilitate this potential air freight growth.
The introduction of aircraft capable of transporting containerised freight (Airbus A320, for example) on trunk domestic and short-haul international destinations will improve WIAL’s capacity to carry freight. Larger, wide-body aircraft (such as the Boeing 787 and Airbus A350) may also carry larger volumes of freight if they are able to be used within the Airport confines.
While the Master Plan predicts an increase to 28,000 tonnes of air freight, research suggests there is potential for 45,000 tonnes annually. Depending on the types of aircraft calling at Wellington International Airport there is an estimated total market for 60,000 tonnes of airfreight – calculated as a proportion of total New Zealand airfreight equivalent to WIAL catchment’s share of Gross Domestic Product.
7.11 Safety and personal security
The movement of freight can often be associated by the general public with large and intrusive vehicles competing with general traffic – creating potential conflicts with other road users. These perception issues are likely to get more pronounced with NZ Transport Agency’s work with permitting overweight and over-dimension vehicles. Ensuring the safe use of state highways and local roads by these vehicles is a key factor in determining whether a permit will be issued.
The full economic costs of a truck crash can be considerable when taking account of damaged goods, damaged rig and the amount of time that truck is off the road for repairs. That said, trucks are involved in a relatively minor number of crashes. Figure 19 shows that in 2009 there were 9 minor, 2 serious and no fatal crashes involving trucks in the Wellington region. Total crash numbers for the region in 2009 involved 17 fatal, 149 serious and 849 minor crashes.

WGN_DOCS-#902458-V1 47
0
2
4
6
8
10
12
14
16
18
20
1988 1989 1990 1991 1992 1993 1994 1995 1996 1997 1998 1999 2000 2001 2002 2003 2004 2005 2006 2007 2008 2009
No.
of c
rash
es
Fatal Serious Minor
Figure 19: Number of fatal, serious and minor injury crashes involving trucks. Source: Crash Analysis System
While actual crash figures are relatively low, anecdotal evidence suggests the perception of trucks as dangerous vehicles persists. The promotion of improved vehicle safety standards and driver operating conditions as well as educational programmes can contribute to keeping crash incidents involving trucks low throughout the region.
Rail freight also has similar issues of potential conflict at level crossings and with passenger rail services – especially during peak travel times.
7.12 Environment
Air emissions, noise and vibration are also associated with freight vehicles. These impacts can reduce the health of individuals and communities as well as amenity values. Planning around freight movements and infrastructure improvements should endeavour to mitigate or minimise such effects.
Support for business locations that require fewer or shorter freight trips while recognising location-based constraints facing freight generating activities needs to be considered with regard to the effects air emissions, noise and vibrations have on individuals and communities when making land use decisions. Constructive solutions are required that seek to reconcile economic, social and environmental needs and issues affecting the movement of freight in the region.
Tools for this include improved vehicle standards, cleaner fuels and improved efficiencies that reduce freight movements. Reducing idling from road congestion and making shifts to other modes of transport when economically viable are also effective means to reduce environmental effects.

WGN_DOCS-#902458-V1 48
Modelling work undertaken for the Wellington RLTS 2010-40 also highlighted an information gap for engine efficiency improvements in HCVs over the previous decades. There are also no available projections on how the average engine efficiencies of New Zealand’s HCV fleet will improve over the coming decades.
7.13 Affordability
Freight transport needs to be effective and reliable to meet customer demands, and should make the best use of limited resources available, including transport infrastructure and non-renewable resources. Freight transport needs to be cost efficient in terms of public funds required to build infrastructure, as well as in terms of the cost to the freight industry in supplying services in compliance with regulatory requirements.
Costs need to be affordable, acceptable and take into account the financial resources available. With the implementation of the Vehicle Dimensions and Mass Amendment 2010 Rule more over-weight and over-dimension vehicles will be using roads in the Wellington region. This will likely increase the cost efficiency of the road freight sector, but will also have cost implications for the Road Controlling Authorities as maintenance costs on both the state highways and local road networks increase.
The KiwiRail Turnaround Plan identified the North Wairarapa rail line as a potential candidate for being closed or mothballed unless an anchor customer can be found. Currently, maintenance costs on that rail line are approximately $2 million, but with no regular services, it doesn’t generate any income for KiwiRail.
KiwiRail is currently involved in a process to engage with local communities on potential opportunities for the North Wairarapa rail line. One of the main opportunities that have been identified is the expected increase in log harvesting in the area. If a proportion of the logs are transferred to rail, it could make up the maintenance costs of the North Wairarapa rail line and save costs in congestion and road maintenance along SH 2 and SH 50 north to Napier, as well as avoid potential conflicts with commuters, cyclists and pedestrians in communities along SH 2.
7.14 Peak oil
The report prepared by the New Zealand Parliamentary Library entitled ‘The Next Oil Shock?’ concluded that, while oil reserves will not run out for decades, oil production cannot indefinitely continue at an increasing rate from the remaining reserves. Forecasts indicate that world oil production capacity will not grow or fall in the next five years while demand will continue to rise.
There is a risk that the world economy may be at the start of a cycle of supply crunches leading to price spikes and recessions, followed by recoveries leading to further supply crunches. New Zealand is heavily dependent on oil imports and will remain so for the foreseeable future. While there is potential to substantially increase domestic production, domestic oil production cannot insulate New Zealand from global oil price shocks because New Zealand pays the world price for goods like oil.

WGN_DOCS-#902458-V1 49
Key export-generating industries in the New Zealand economy including tourism and timber, dairy, and meat exports are very vulnerable to oil shocks because of their reliance on affordable international transport.
This will put pressure on freight transport operators to achieve greater efficiency either through investment in more modern equipment, increased use of HPMVs for just-in-time deliveries or changes in the organisation of supply chains (ie. increased hubbing at centralised distribution centres).
Higher prices for fuel may also drive the smaller operators out the market, leaving more local freight to be carried by several large operators and reducing competition.
7.15 Information gaps
During the course of developing this background report, several gaps in readily available information presented themselves. The questionnaire also requested feedback on any information gaps.
The most significant information gaps identified are:
• Limited data available on coastal shipping movements • Limited data on the origin and destination of imports and exports • Limited analysis available of HCV and LCV usage of the local road network • Limited information available on road pavement and structure (ie. bridges) carrying capacities • Lack of information available to local councils on freight supply chains • Out of date origin-destination matrix for freight in the Wellington region • Limited information on how fuel efficiencies for HCV vehicles will change in the future • Limited information available on the movement of hazardous substances in the region.
A lot of these information gaps stem from the need to maintain commercial sensitivity and competitive advantage within the freight sector. An updated freight origin-destination matrix should also be able to distinguish between the movements of different commodities.
More information on the transport of hazardous substances through the Wellington region is expected to become available through the implementation of MoT’s ‘Freight Information Gathering System’ which can track these goods.
8. Potential changes in freight movements
Objective 4 is to assess how freight movements may change for the Wellington region over the next 5 to 10 years.

WGN_DOCS-#902458-V1 50
8.1 The context – economic and population growth
In 2009 the Wellington region contributed around 13% of all the goods and services produced in New Zealand (GDP or Gross Domestic Product). In the same year our regional GDP per capita was $52,780 rising by 1% over 2008 while the national average declined 1.1%. Job numbers in the region also grew, and at a faster rate than the national average.19
The region’s economy is expected to continue to grow at a modest rate, driving an increasing demand for travel and freight movement. The efficient movement of people, goods and services along key regional transport corridors and local roads is crucial to ensure continued economic growth and prosperity nationally, regionally and locally.
Work done for the Wellington RLTS 2010-40 shows a medium forecast of a further 87% economic growth between 2006 and 2041.
Between 1996 and 2006 the region as a whole experienced population growth of 9.3%. The region is forecast to experience moderate population growth, with an extra 42,000 people expected to live here by 2026, a 9% increase from 2009.20 Farther into the future, the more uncertain population projections become.
Under the medium growth scenario used in the RLTS 2010-40 the regional population growth rate is projected to slow after 2026. Regional planning should allow for over half a million inhabitants by 2026.
The rate of growth varies widely between districts within the region. Projections developed by Statistics NZ suggest that Wellington City and Kapiti Coast are likely to experience the most population growth, while other areas will remain stable or decline.
Population and economic growth, increasing car ownership and freight movements are key contributors to the regional demand for travel. Over the past 20 years, the number of trips on New Zealand’s state highways has grown 66% while heavy vehicle growth has more than doubled.21
Freight volumes are forecast to grow by 75% to 2031, with rail freight expected to grow by 70% nationwide (NFDS, 2008). Current national policy settings (NZTS) have a target rate of rail carrying 25% (12 billion net tonne kms) by 2040.
8.2 Centralised distribution centres
As port and rail container terminals increase throughput, space is becoming more constrained and freight transporters, transport companies and container terminal operators are starting to operate offsite freight storage points or inland hubs. This will result in the requirement for time sensitive short haul journeys to be completed within shorter time frames. However, distribution centres may reduce the distances required for just-in-time freight journeys.
19 GWRC, Wellington Regional Genuine Progress Index, unpublished. 20 GWRC. 2009/2010 Annual Monitoring Report on the Regional Land Transport Strategy. 21 New Zealand Transport Agency. Traffic Volumes Monthly Report (September 2010).

WGN_DOCS-#902458-V1 51
Palmerston North has emerged as a potential freight hub for the lower North Island, which could impact on freight movements to/from Wellington.22 This would mean increased time dependent heavy vehicle traffic travelling south down State Highway 1 or more freight train trips between Palmerston North and the Wellington rail yard. This has potential to increase conflicts with commuter traffic unless movements are timed to avoid commuter peak times.
Another potential hub is at Seaview to serve the warehousing needs of expected industry growth in the Hutt Valley and the surrounding Seaview/Gracefield area.23 This industrial re-development and potential hubbing options would increase the volume of goods making the short haul from Seaview to CentrePort. The consolidation of goods at the potential Seaview hub and industrial re-development may make rail transport for these goods more economic and opening up the possibility of rehabilitating the Seaview rail spur.
The Grenada to Gracefield link (incorporating the envisaged Grenada to Petone highway link and the Cross Valley link) is seen as a key roading infrastructure initiative to facilitate efficient freight movement. This link will provide a more direct route between SH 1 and SH 2, freeing up movement between the key logistic operations at Gracefield. It will also divert traffic off SH 2 providing for increased capacity for port freight traffic.
The growth in log harvesting in Wairarapa and the potential increase of the wood processing industry in the area could provide the basis of an inland port for CentrePort in Wairarapa (potentially at Waingawa – as per the action plan in the 2007 Wellington Regional Freight Plan and 2010 Wairarapa Corridor Plan). Land pressures at CentrePort in Wellington City and Lower Hutt could also mean that log assembly (and potentially fumigation) could also be moved to this Wairarapa inland port. Such a hub for logs could increase the tonnage of logs travelling to CentrePort for export by rail or north to Napier port.
8.3 Bigger ships
Multiple views exist amongst industry stakeholders regarding the future of New Zealand’s container ports and the shipping services operated by international lines. It is foreseeable that there could be progression towards larger container vessels calling at New Zealand ports over the next 5 to 10 years, as shipping lines look to match capacity with demand, and take advantage of the economies of scale that exist with operating larger vessels.
Despite the potential introduction of larger vessels, it is likely that most New Zealand’s ports, including CentrePort, will continue to be served by a mixture of both international and feeder vessels.
22 Horizons Regional Council, Horizons Regional Land Transport Strategy 2010-40. 23 As per the Vision Seaview Gracefield 2030 ( Hutt City Council, 2010) document created as part of the Wellington Regional Strategy.

WGN_DOCS-#902458-V1 52
This view is supported by the following:
• There has been no indication from shipping lines that they intend to radically change the way they operate in New Zealand.
• To date there has been no publicly available analysis that comprehensively demonstrates rail and coastal shipping’s capability and cost effectiveness in aggregating all containerised cargoes through hub ports.
• The recently published Shippers Council “Big Ship” Report called for ports and rail to invest significantly in infrastructure and equipment to enable options for shippers. It also assumes that any benefits gained by the shipping companies will be passed through to the shippers. The passing on of these gains seems unlikely given the substandard returns the major lines currently generate, and the likely costs incurred by ports and rail in providing the infrastructure necessary to accommodate vessels of this size.
• The Government has indicated that it does not see the need for intervention in the port sector.
At this stage CentrePort continues to operate the container terminal to handle international and feeder vessels. In the longer term, upgrading infrastructure assets to handle large vessels calling Wellington will be carried out if there is the commercial demand in place to provide for a suitable business case for investment.
Various freight research papers have detailed the large growth in freight transport demand expected to occur over the next 20 years. Irrespective of whether this freight is handled by coastal feeder vessels, international direct vessels or interisland ferry, it is likely that a large portion of these goods will be handled by CentrePort. Therefore, it is imperative that the land transport infrastructure and supply chain is set up to handle this increase in freight demand around the port and central rail container terminal.
8.4 Changes to port operations
The major changes in the cargo operations segment will be an intensification of activity on the current land to handle the forecast growth of freight in New Zealand, as outlined in the National Freight Demand Study.
KiwiRail Interislander and Strait Shipping operations currently utilise CentrePort infrastructure and land assets. Long term options are currently being explored between CentrePort and the ferry operators to make sure that suitable infrastructure is provided for efficient inter-island connections that can handle the forecast growth in freight demand over the next 20 years.
8.5 Over-weight and over-dimension vehicles
The routes that over-weight and over-dimension vehicles will be permitted to use can clarify the movements and intensity freight flows on local roads. While not necessarily changing the origin and destination of freight movements with regard to the Wellington region, these vehicles may reduce the number of freight trucks using the road network and making more efficient use of road space.
It is currently uncertain what the changes to the RUC will have on the adoption of over-weight and over-dimension vehicles by freight operators.

WGN_DOCS-#902458-V1 53
8.6 Emissions trading scheme
Implementation of the Emissions Trading Scheme will increase the costs of diesel for road freight transport as well as diesel powered trains and shipping vessels. However, the ETS is likely to affect the road freight sector to a greater degree – as the rail freight and coastal shipping sectors are more fuel efficient. As diesel prices increase due to the ETS, the cost savings in reduced fuel use from HPMV vehicles are likely to be less.
The ETS is likely to increase the use of rail and coastal shipping transport for bulk goods of low value per weight products as road transport for these goods becomes less economic. These goods include forestry products, aggregates, liquid milk, livestock, concrete and limestone.24
8.7 Other tools including road pricing
Travel demand management tools such as ultra-fast broadband, working from home, staggered opening hours at businesses, or a road pricing scheme targeting commuter vehicles entering the Wellington CBD have the potential to reduce congestion that currently delays freight vehicles. Reducing the number of vehicles using the road network optimises the capacity of the network and makes freight travel times more reliable.
The provision of a high quality, reliable public transport network is an essential part of the overall transport network. Public transport has its own investment costs and will compete for limited space in transport corridors with private vehicle commuters and freight vehicles as well.
9. Opportunities for improving freight efficiencies
Objective 5 is to identify opportunities for improving freight efficiencies in, out and through the Wellington region – focusing on transport infrastructure.
9.1 Opportunities for road
Implementation of the Levin to Wellington Airport Road of National Significance is expected to improve road safety and the efficiency of freight flows between Wellington and the rest of the North Island. This will create opportunities for improving economic growth by expanding the capacity of most of State Highway 1 through the Wellington region.
However, full implementation of the Wellington RoNS (as currently envisioned) will still leave the Ngauranga merge as a major pinch point of the state highway network in the region. Opportunities to be identified in the Hutt Corridor Plan for the creation of a new east/west link between Petone and Grenada may provide the best opportunity to reduce existing severe congestion at the Ngauranga merge and provide more direct routes for freight travelling to/from the Hutt Valley.
24 Derived from the National Freight Demands Study.

WGN_DOCS-#902458-V1 54
In addition, SH 2 also carries significant freight flows. The Hutt Corridor Plan will include a range of improvements to this corridor to improve journey times, principally through the grade separation of intersections. Improvements to the road network between the Seaview / Gracefield area and SH 2 will play an important role in facilitating efficient freight travel to and from this industrial area.
A study focused on the origin and destination of HCV and LCV trips on the local road network can provide valuable information to local councils when considering improvements to the road network and for urban planning processes.
There may also be a need for investment to strengthen roads and structures to allow for new loading and vehicle standards. It is essential that local road controlling authorities understand the carrying capacity of existing pavements and structures. This will require detailed technical assessments. NZ Transport Agency’s studies on route carrying capacity as part of their permitting process for high productivity motor vehicles will provide a good basis for wider pavement and structure assessments.
The Ministry of Transport is also putting together a ‘Freight Information Gathering System’ based on data available at New Zealand’s ports. This could potentially produce useful information concerning the demand for land transport freight movements as well.
9.2 Opportunities for rail
The North Island Main Trunk Line between Auckland and Christchurch has been identified as the major area of improvement on the rail network. By removing known bottlenecks and single track sections, it will greatly improve the efficiency and travel time reliability for rail freight.
Keeping the North Wairarapa Rail line open also provides critical route security opportunities in case of blockages on the NIMT line caused either by accidents, natural hazards or other climate change-related effects.
The coming increases in log harvesting in Wairarapa also provides a significant opportunity for the rail network to carry more of this relatively low value bulk good for export to CentrePort, in the first instance, or to the Port of Napier.
Proposed newer, larger ferries capable of carrying containerised freight will also allow KiwiRail Interislander to keep up with predicted rail freight increases. However, land use and goods marshalling space constraints remain at the ferry terminal. One possible means of increasing Interislander’s capacity is to relocate the terminal to another location.
9.3 Opportunities for the port
Improved road and rail links to CentrePort will be critical for the port to successfully handle the predicted increase in freight demand. This is especially important for transport connections between CentrePort and industrial land in the Hutt Valley, Seaview and Wairarapa.

WGN_DOCS-#902458-V1 55
Re-instating the rail line through the Seaview / Gracefield industrial area can improve access to rail sidings for goods produced in that area and allow for more short-haul rail freight movements to CentrePort. The NZ Transport Agency’s Ngauranga to Aotea project, the Grenada to Petone link (with the inclusion of a cross valley connection to Gracefield) and the Wellington RoNS will play a part in improving road links.
However, these projects must be staged correctly to make sure that the intra regional traffic flow through Wellington does not put further pressure on Aotea Quay, which would result in further cost and time delays on Wellington freight.
Increasing inter-regional freight should also be aligned with the duplication of the Terrace and Mt. Victoria tunnels so that the importance of the waterfront as an arterial route through the Wellington CBD is reduced.
The potential for increased rail freight movements across Waterloo Quay and its impact on road traffic movements will need to be considered with a likely need to provide for a grade separated over-bridge solution. Another option is to connect and utilise the alternative the rail line at Burma Road, on the south/east side of Aotea Quay. This project could avoid the need to shunt trains across Waterloo Quay – which causes congestion for commuters and freight vehicles using that road. Greater Wellington has commissioned the Wellington Port Access Concept Plan to identify a long-term solution for road and rail access to and from CentrePort and the ferry terminals.
Further investigations of options for inland port facilities could ease storage pressures on existing CentrePort facilities. Other means to facilitate greater intensification of activity on current port-owned land in Wellington City or at Seaview can also increase CentrePort’s ability to handle growing freight demand.
9.4 Opportunities for the airport
Airports, internationally, are well positioned to carry time-sensitive freight to supply a service-based, just-in-time economy like that of the Wellington region. This is especially true if the freight is sourced internationally.
Higher freight volumes entering the region via the airport can reduce pressures at the main bottlenecks of the road and rail transport system. Wellington International Airport’s (WIAL) 2030 Master Plan provides an investment programme to facilitate this potential freight growth. However, success of the Master Plan will depend on decisions made by airlines to call at WIAL and which aircraft are used to service Wellington-bound routes.
The transport network between WIAL and the Wellington CBD will have to be upgraded to handle the increased freight and commuter traffic if projected freight volume increases materialise.

WGN_DOCS-#902458-V1 56
10. Conclusion
The vision of the Wellington RLTS 2010-40 is for an ‘an integrated land transport network that supports the region’s people and prosperity in a way that is economically, environmentally and socially sustainable.’ The RLTS defines the appropriate role of freight as the safe and efficient movement of goods within, to, from and through the region.
Road, rail, coastal shipping, port traffic and air freight all have a part in achieving the RLTS vision by the safe and efficient movement of freight. The amount of freight moved by each mode will be largely determined by the relative economic attractiveness and the level of access to each mode.
Road-based freight will continue to dominate the freight sector. Investment in the Wellington RoNS, the introduction of more over-weight and over-dimension vehicles, fuel efficiency improvements and driver training and improved working conditions are all opportunities for increasing the efficiency of road freight in the Wellington region.
Rail can also play a major role in Wellington freight movements. Investment on the North Island Main Trunk line, maintenance of the North Wairarapa line, improved access to CentrePort and the Interislander Ferry Terminal and re-instating the rail spur line through Gracefield are all opportunities for improved rail freight efficiency. The increase in forestry harvesting and processing in Wairarapa also provides a major opportunity for more freight to be carried by rail in the future. However, capacity restraints at the Interislander Ferry Terminal will have to be resolved in cooperation with CentrePort for the success of the KiwiRail Turnaround Plan.
Coastal shipping is a relatively minor freight mode for Wellington. While being the most fuel efficient freight mode, it is also the slowest which limits coastal shipping’s mode share to less urgent, long-distance deliveries of bulk goods. Therefore, coastal shipping predominantly competes with the rail network for freight. A lack of data on coastal shipping movements partially inhibits investment and the relatively slow travel speeds inhibit the growth of this mode for freight.
Access to port land is a critical issue for meeting the economic impacts outlined in the Government Policy Statement and for the success of the KiwiRail Turnaround Plan. Improving road and rail access to CentrePort and the Interislander Ferry Terminal is one key opportunity for improving freight supply chains in the Wellington region.
Airfreight carries a very minor proportion of freight movements in Wellington and New Zealand. However, airports are well situated to deliver time-sensitive goods that supply a service-based economy. Investment in Wellington International Airport and the introduction of wider body aircraft capable of taking containerised freight can dramatically increase airfreight’s market share. If this were to occur, improved connections between the airport and the Wellington CBD will become more important.

WGN_DOCS-#902458-V1 57
Bibliography
Boffa Miskell Ltd (2009) Wellington Region Industrial Land Supply Study. Wellington.
Business & Economic Research Limited (BERL) (2004) Wellington Transport Package: Social & Economic Impacts. Wellington Transport Project Group. November 2004. Wellington.
Business & Economic Research Limited (BERL) (2010) The Economic Impact of CentrePort. Wellington.
CentrePort Limited (2010) Annual Report 2010. Wellington.
Greater Wellington Regional Council (GWRC) (2007) Regional Freight Plan 2007. Wellington.
Greater Wellington Regional Council (GWRC) (2009) Proposed Regional Policy Statement. Wellington.
Greater Wellington Regional Council (GWRC) (2009) Wellington Regional Rail Plan. Wellington.
Greater Wellington Regional Council (GWRC) (2010) 2009/10 Annual Report on the Regional Land Transport Strategy, October 2010. Wellington.
Greater Wellington Regional Council (GWRC) (2010) Wellington Regional Land Transport Strategy 2010-40. Wellington.
Hutt City Council (2010) Vision Seaview Gracefield 2030 – Transforming the future. Wellington.
Hyder Consulting (NZ) Ltd (2009) New Zealand Transport Agency Freight Analysis – Wellington, Nelson, Marlborough and Tasman regions, June 2009. Wellington.
KiwiRail (2010) The Backbone of integrated transport networks. Wellington.
KiwiRail (2010) The KiwiRail Turnaround Plan. Wellington.
Ministry of Transport (2008) New Zealand Transport Strategy (NZTS). Wellington.
Ministry of Transport (2009) Government Policy Statement on land transport funding 2009/10 – 2018/19. Wellington.
Ministry of Transport, New Zealand Transport Agency and Ministry of Economic Development (2008) National Freight Demands Study. Wellington.
Ministry of Transport website (2010). Road User Charges legislation changes questions and answers. http://www.transport.govt.nz/ourwork/Land/Pages/RoadUserChargeslegislationchangesQandAs.aspx. Accessed on 1 November 2010.
New Zealand Government (2010). National Infrastructure Plan. Wellington.
WGN_DOCS-#902458-V1 58
New Zealand Shippers’ Council (2010) The Question of Bigger Ships? Securing New Zealand’s international supply chain. Wellington.
New Zealand Transport Agency website (2010) High Quality Motor Vehicle Permits – Questions and Answers. http://www.nzta.govt.nz/vehicle/your/hpmv-qa.html. Accessed on 1 November 2010.
New Zealand Transport Agency (2010) State Highway Traffic Data Booklet 2005 – 2009. Wellington.
New Zealand Transport Agency (2011) State highway classification – Consultation draft. Wellington.
NZIER (2010) Freight Futures – Long term sea freight scenarios. Wellington.
Road User Charges Review Group (2009) An independent review of the New Zealand Road User Charging System. Wellington.
Wellington International Airport (2010) 2030 The Master Plan. Wellington.
Wellington Regional Strategy (WRS) (2006) Wellington Regional Strategy – Internationally Competitive Wellington. September 2006. Wellington.