wellington lifelines group restoration times november 2012 · wellington lifelines group...
TRANSCRIPT

Wellington Lifelines Group ‘Restoration Times’ report – November 2012
1
Lifeline Utilities Restoration Times for Metropolitan
Wellington Following a Wellington Fault Earthquake
Report to the Wellington CDEM Group Joint Committee
from the Wellington Lifelines Group
November 2012

Wellington Lifelines Group ‘Restoration Times’ report – November 2012
2
Author: Richard Mowll, Project Manager, Wellington Lifelines Group, with the input of the various
Wellington Lifelines Group organisations.

Wellington Lifelines Group ‘Restoration Times’ report – November 2012
3
Contents Foreword by Fran Wilde, Chair of the Wellington Lifelines Group .......................................................... 5
Executive summary ................................................................................................................................. 7
1. Introduction ...................................................................................................................................... 9
2. Context – the earthquake scenario ............................................................................................... 11
3. Summary of likely restoration times .............................................................................................. 15
3.1. The context of estimating restoration times in the Wellington region ................................... 15
3.2. Restoration assumptions ....................................................................................................... 15
3.3. Restoration levels of service ................................................................................................. 15
3.4. Descriptions of restoration times for each type of utility ....................................................... 16
3.4.1. Land access .................................................................................................................. 16
3.4.2. Plans for restoring land access ..................................................................................... 18
3.4.3. Water and wastewater .................................................................................................. 19
3.4.4. Power ............................................................................................................................ 20
3.4.5. Telecommunications ..................................................................................................... 22
3.4.6. Gas ................................................................................................................................ 23
3.4.7. Fuels .............................................................................................................................. 23
3.5. Summarised restoration times for gas, power and water ..................................................... 23
4. Comparing the Wellington and Christchurch metropolitan areas ................................................. 25
4.1. Topography ........................................................................................................................... 25
4.2. Transport Access .................................................................................................................. 25
4.3. Christchurch case studies ..................................................................................................... 25
4.3.1. Christchurch’s power ..................................................................................................... 25
4.3.2. Christchurch’s telecommunications............................................................................... 26
4.3.3. Christchurch’s water supply .......................................................................................... 27
4.3.4. Christchurch’s gas ......................................................................................................... 27
5. What the individual lifeline utilities and WeLG are doing for mitigation and preparation .............. 29
5.1. Providing more resilient infrastructure .................................................................................. 29
5.2. Projects providing greater resilience ..................................................................................... 29
5.2.1. Power ............................................................................................................................ 29
5.2.2. Telecommunications ..................................................................................................... 31
5.2.3. Water ............................................................................................................................. 31
5.2.4. Transport / access ......................................................................................................... 34
5.3. Planning transport access responses to a major event ........................................................ 36
5.4. Limits to infrastructure resilience........................................................................................... 38
5.5. Planning for an emergency event ......................................................................................... 39
5.6. Future WeLG co-ordination work on improving resilience .................................................... 39

Wellington Lifelines Group ‘Restoration Times’ report – November 2012
4
5.7. Personal resilience preparedness ......................................................................................... 40
6. Resilience investment ................................................................................................................... 43
6.1. General resilience investment issues ................................................................................... 43
6.2. Regulatory investment issues ............................................................................................... 43
7. Conclusions and Recommendations ............................................................................................ 45
7.1. Conclusions ........................................................................................................................... 45
7.2. Recommendations ................................................................................................................ 45
Appendix 1 – Water restoration times mappings .............................................................................. 49
Appendix 2 – Road seismic vulnerability mappings .......................................................................... 57

Wellington Lifelines Group ‘Restoration Times’ report – November 2012
5
Foreword by Fran Wilde, Chair of the Wellington Lifelines Group
Charles Darwin once said it was not the strongest nor the most intelligent species that survived when
threatened, but the most adaptable – and that holds true for our communities too.
We live in a region facing a serious and well-documented earthquake risk. Experience has shown it
doesn't take a catastrophe to interrupt our enjoyment of life; a simple traffic accident has at times
brought Wellington to gridlock.
Various disasters around the country in recent years have had a profound impact on individual
communities, and many of us naturally have asked ourselves: how well would we have coped in the
same situation?
To answer such a question, we need a good understanding of the state of our region’s infrastructure.
The layout of that infrastructure has been strongly influenced by the region’s topography. We have, for
example, well-defined road and rail corridors vital to the flow of commerce and social interaction. Other
infrastructure essential to our day-to-day lives and continuing prosperity includes telecommunications,
water, wastewater and energy equipment, as well as the port and airport. There has been
considerable investment over the years – and there continues to be investment – in strengthening this
infrastructure against the day when a powerful quake hits the region. Great effort has also gone into
providing an effective civil defence response system. The safety and wellbeing of our families,
neighbourhoods, businesses and communities will largely depend on the resilience of those
infrastructure networks and the companies managing them.
The contents of this report make sober reading. The complexities of restoring essential services after a
severe earthquake are considerable and the job will not be achieved quickly. The bottlenecks created
by the region’s topography do not help matters. It’s important to note, however, that the restoration
times quoted in this report represent a worse-case scenario (7.5 on the Richter scale) that would
feature multiple failures of infrastructure.
I note that, although not addressed in substance in this report, there is also a role here for every
individual, family and neighbourhood in the region. It is critical each one of us takes personal
responsibility for being prepared in the event of a big shake. The findings should make all of us stop
and reassess our personal preparedness. Over-reaction will not be helpful, because preparedness is a
long-term, continuous process literally incorporating new ways of doing things into our every day life.
In the meantime, good progress is being made with earthquake-strengthening vital
infrastructure. Many infrastructure companies are already well down this path. The region’s councils
are also heavily engaged in upgrading their networks to provide greater certainty of service following a
major event. The work being done on all these fronts is outlined in the report.
There is much at stake. Not only does the region comprise 11 per cent of the country's population, but
it also generates 15 per cent of its GDP. Wellington is the seat of government and the transport hub
between North and South islands. Many organisations have their national headquarters in the capital’s
CBD so that a severe earthquake would affect operations far beyond the city.
Under the umbrella of the Wellington Lifelines Group, the region’s infrastructure providers are working
to ensure they can quickly recover from a serious earthquake. We have all learned much from the
tragedies of Christchurch and those lessons are now being applied in a practical way here. Together
we need to continue to work in our homes, businesses and communities to build a more resilient
region.
Fran Wilde, Chair

Wellington Lifelines Group ‘Restoration Times’ report – November 2012
6

Wellington Lifelines Group ‘Restoration Times’ report – November 2012
7
Executive summary
This report follows a preliminary report to the Wellington CDEM Joint Committee presented on 29
June 2012. It provides a summary of likely restoration times for key lifeline utility services,
following a major earthquake involving a rupture of the Wellington Fault. The report focuses on
the Wellington metropolitan area – Upper and Lower Hutt, Wellington and Porirua. However,
because important transport routes servicing this area run through Kapiti and the Rimutaka
range, these areas are referenced in some of the discussion.
A rupture of the Wellington Fault is considered to represent a worst-case, but realistic, scenario
for planning purposes. It is acknowledged that it is but one earthquake scenario, with at least four
other active faults and the subduction interface beneath Wellington affecting the Wellington
region. It is acknowledged that there are higher-likelihood but less damaging earthquake
scenarios affecting the region. In understanding, and planning for, the larger events, the region
will be better prepared for all, no matter what scale.
Different utility assets behave in varying ways in an earthquake – an overhead electrical cable
will be affected quite differently from a buried water main. Describing the effects of an earthquake
in any part of the Wellington region, with its specific topography and utility networks, is not a
simple task. While such a description could become overly simplistic, it is useful to consider the
overall effects, such as the indicative restoration times and dynamics of this type of event. The
restoration of road access into the Wellington metropolitan area is a key issue. With the current
state highway network configuration, land access could potentially be cut off for up to 120 days
(New Zealand Transport Agency estimate). This would be reduced to 40 days if the Transmission
Gully Motorway were constructed, A detailed report by the Wellington Lifelines Group on
transport restoration times is being undertaken but was not available at the time of writing this
report. Water restoration time frames are generally shorter close to the water sources and
increase with distance. Power restoration times are different for each part of the Wellington
metropolitan area, but it is reasonable to expect restoration within 20 to 95 days. Restoration
times should be read in conjunction with the level of service descriptions in the report and the
restoration assumptions in Section 3.2, which contains a summary of restoration times.
In reflecting on the lifeline utility response to the September 2010 and February 2011 Canterbury
earthquakes, it should be recognised that the Wellington region is very different to the flatter
topography around Christchurch. Additionally, the two cities’ utility assets of the two cities are
quite different. The differences indicate that lifeline restoration times will be considerably longer
in Wellington.
There are many activities progressing across all utility sectors to mitigate against specific seismic
vulnerabilities in the Wellington metropolitan area. Some activities provide quick improvements.
However, most will progress over many years or take many years to investigate, consult on,
agree on funding sources, design and construct. This report presents a snapshot of the current
state of resilience and work planned for the future. Continued work on improving the seismic
performance of assets does provide greater resilience. An overview of the various activities and
projects under way is presented in Section 5.
It should be noted that, no matter what seismic upgrades are made to the Wellington lifeline
utilities, the earthquake risk cannot be eliminated. The topography, which determines the layout
of the utilities, and the seismicity of the region, mean that while resilience can be increased,
vulnerabilities will remain even once infrastructure is seismically upgraded. Work on emergency
planning, both by the lifeline utilities themselves and by the Wellington Region Emergency
Management Office, will continue to address this gap in future years.

Wellington Lifelines Group ‘Restoration Times’ report – November 2012
8
An earlier report by BERL took interdependency principles into account when assessing the
economic impact of restoration times. However, a further detailed interdependency modelling
exercise has not been carried out because of the complexity that such an exercise would entail.
This highlights the fact that the nature of the restoration times presented in this report is
indicative only.
There are seismic vulnerabilities in Wellington’s infrastructure. This report sets a point of
reference – a starting point. It is the intention of the various lifeline utilities involved to improve
upon the status quo and the later sections of this report will provide an outline of those plans. With
the continued efforts of the lifeline utilities and continuing facilitation by the Wellington Lifelines
Group, it is expected that the vulnerabilities will be progressively worked upon to create a more
resilient infrastructure base. An understanding of vulnerabilities is therefore essential to create a
more robust base on which to build forward work programmes.

Wellington Lifelines Group ‘Restoration Times’ report – November 2012
9
1. Introduction
This report follows a preliminary report to the Wellington CDEM Joint Committee presented on 29
June 2012. It provides a summary of likely restoration times for key lifeline utility services,
following a major earthquake involving a rupture of the Wellington Fault. The work draws from a
range of reports that have been completed over the years. Recent work - particularly in the
transport, water and power supply sectors - has, however, strongly influenced the updated
restoration times. The report also summarises the work proposed by the lifeline utilities and
WeLG to address the issues that have arisen and ties in closely with the It’s Our Fault project led
by GNS Science.
The physical vulnerability of Wellington’s roading and utility networks to earthquake, in
conjunction with the strong ground shaking and permanent ground deformation associated with a
major fault rupture, results in substantial estimated times to restore lifeline utility services to the
community. The implications of these timeframes for the community and local and central
government are significant. Risk reduction and readiness initiatives to address the community
impacts require careful planning and prioritisation. It should also be noted that the 2010 and 2011
Canterbury earthquakes, although occurring in a quite different context to that of Wellington,
have led to a new appreciation of the impacts that a major earthquake would have in this region.
A rupture of the Wellington Fault is considered to represent a worst-case, but realistic, scenario
for planning purposes. It is acknowledged that it is but one earthquake scenario, with at least four
other active shallow faults, and the subduction interface about 25km beneath Wellington,
affecting the Wellington region. The hazard context is discussed in Section 2.
Section 3 presents the restoration assumptions, and details on how the different infrastructure
types will be restored, as well as giving a summary of restoration times.
Section 4 outlines the differences between the Wellington and Christchurch contexts, explaining
how the sets of infrastructure are different and why restoration times in Wellington will be
different.
Section 5 outlines what Wellington Lifelines Group members are doing to mitigate against the
risks. The work being carried out includes upgrading the physical resilience of infrastructure and
emergency planning for an earthquake.
Sections 6 and 7 present conclusions and recommendations from this report.
The report sets a point of reference, a starting point. Lifelines utilities all recognise that there is
more work to be done in creating a resilient region and overcoming the seismic vulnerabilities in
Wellington’s infrastructure. There are now a number of major work streams in place and the
facilitation provided by WeLG in providing coordination will continue. It is expected that this work
will progressively create a more resilient infrastructure base. A key part of this is a clear
understanding of vulnerabilities and, in this respect, the work that has been undertaken so far
has created a robust base on which to build forward work programmes.
This report covers the Wellington metropolitan area, includes the Porirua, Upper Hutt, Hutt and
Wellington cities. As a Wellington Lifelines Group document, it does not cover the Wairarapa, as
this area is covered by the Wairarapa Engineering Lifelines Association. However, the report
does reference transport routes in an out of the metropolitan area through Kapiti and across the
Rimutaka Hill.


Wellington Lifelines Group ‘Restoration Times’ report – November 2012
11
2. Context – the earthquake scenario
Due to its topography, Wellington is particularly susceptible to a major local earthquake. Although
such events are rare, a ‘direct hit’ from a large event would have serious consequences for the
region. The recent earthquakes in the Canterbury region have demonstrated the vulnerability of
infrastructure to such events. Wellington’s hilly terrain and relatively restricted corridors mean
that its infrastructure is more vulnerable.
There are two measurement scales regarding earthquakes – the Richter magnitude scale and
the Modified Mercalli (MM) intensity scale. The Richter magnitude outlines the amount of energy
released in a seismic event. The larger the number, the more energy released. Each earthquake
has just one Richter magnitude. The Modified Mercalli intensity measures the strength of shaking
the event creates. The higher the number, the higher the shaking intensity, as detailed in Table
1. Intensity varies from place to place, and decreases as you move away from the epicentre.
Hence some seemingly smaller Richter events can cause more damage at the surface if the
event is shallow or nearby. For example, the magnitude 6.2 Christchurch February 2011
earthquake caused more city centre damage than the previous magnitude 7.1 Darfield
September 2010 earthquake because it was closer to Christchurch’s city centre and was a
shallow event.
The research project It’s Our Fault, led by GNS Science, identifies that there is a 10% probability
of a major rupture of the Wellington Fault within the next 100 years. Such an event would be of a
magnitude of about Richter 7.5. The Wellington Fault ruptures on average every 840 years, with
the last major rupture around 300 years ago. In terms of actual shaking effect, the majority of
Wellington’s infrastructure lies within a zone that would be subjected to shaking intensity of MM9
or MM10. At the fault line itself, it is anticipated that a Wellington Fault rupture would produce a
maximum of 4m to 5m in horizontal movement and up to 1m in vertical movement. The
Wellington Fault is, however, just one fault that may produce earthquakes affecting the region.
For the purposes of this report, we have assumed the worst case scenario of a ‘direct hit’ Richter
magnitude 7.5 rupture on the Wellington fault, with the epicentre located in the Wellington
Harbour area. The level of shaking from a quake of this magnitude located close to Ngauranga is
likely to be strong over a relatively wide area, as shown in Figure 1.
Figure 1 - Isoseismal map for a magnitude 7.5 earthquake on the Wellington Fault, with the
epicentre near the centre of the fault which is a worst-case location (GNS Science, 2012).

Wellington Lifelines Group ‘Restoration Times’ report – November 2012
12
While the above represents a worst-case scenario, Table 1 shows the expected return periods of
various scales of earthquakes and their effects. The scenario of a Richter 7.5 Wellington Fault
rupture, with an 840 year return period can be expected to give shaking in the MM9 to MM10
plus range. While the scenario taken in this report is considered a very damaging scenario, it
should be noted that many other scenarios exist, which include at least moderate shaking.
Table 1 - Modified Mercalli events in the Wellington Region and their effects (GNS
Science, 2012)
Shaking
intensity
Average
Return
period
Last event People Structures Environment
MM6 8 years 1/11/1968 Felt by all. Damage to a few
weak domestic
chimneys, some of
which may fall.
Loose material may
be dislodged from
sloping ground, e.g.
existing slides.
MM7 30 years 24/6/1942 Difficulty
experienced
in standing.
Unreinforced stone
and brick walls
cracked.
Small slides such as
falls of sand and
gravel banks, and
small rock-falls from
steep slopes and
cuttings.
MM8 120 years 22/11/1848 Steering of
motorcars
greatly
affected.
Weak masonry
buildings heavily
damaged, some
collapse.
Cracks appear on
steep slopes and in
wet ground. Small to
moderate slides in
roadside cuttings.
MM9 400 years 23/1/1855 Many weak masonry
buildings destroyed.
Landsliding general
on steep slopes.
MM10 1,500
years in
Ngauranga
Gorge
location
No known Reinforced masonry
buildings heavily
damaged, and some
collapse.
Landsliding very
widespread in
susceptible terrain.
This shaking and fault rupture would have considerable effects on the Wellington lifeline utilities,
and this is broadly summarised in Table 2.

Wellington Lifelines Group ‘Restoration Times’ report – November 2012
13
Table 2 - Overview of key lifeline vulnerabilities in relation to the Wellington Fault
Hazard/ Threat Example Locations Lifeline utility affected
Fault Rupture
From Karori through to Kaitoke
Bulk water network (five locations)
State Highways and local roads
Bulk gas
33KV fluid and gas-filled buried power
cables and substations
Silverstream crossing Bulk water and wastewater pipelines
Landslide
The four land entry-points to Wellington
(SH1 Paekakariki to Pukerua Bay, the
Paekakariki Hill Road, the Akatarawa
Road and SH2 Rimutaka Hill Road)
Roads and local power infrastructure
SH58 Haywards and SH2 Horokiwi State Highways and rail (Horokiwi only)
All areas, but particularly in hill-side
locations
Roads and rail lines and local power
infrastructure
Shaking Some Wellington Electricity substation
buildings.
Liquefaction
Petone/Seaview Access to the fuel terminals at Seaview,
roads, 33KV fluid-filled buried power
cables, and buried water and wastewater
pipes
Porirua CBD Water, wastewater, roads, gas and power
Cobham Drive and Moa Point, near
airport, Wellington
Roads and power infrastructure
Aotea Quay Container terminal


Wellington Lifelines Group ‘Restoration Times’ report – November 2012
15
3. Summary of likely restoration times
3.1. The context of estimating restoration times in the Wellington region
The complexity of describing the restoration of single lifeline utilities, quite apart from combining
across a number of different types of utilities, means that summarising overall effects from a
single earthquake becomes relatively simplistic. The earthquake scenario of a Richter 7.5 event
and its effects are also hard to accurately predict. This is why the restoration times and their
assumed interdependencies can be indicative only. The effects of one earthquake may also be
magnified or diminished simply through the availability of one section of road, or one part of a
water network. So, while all of the lifeline utilities have participated in producing the ‘restoration
times’ summary, the times given must be taken to be indicative and not definitive.
3.2. Restoration assumptions
In order to have a common basis across lifeline utilities, a number of assumptions have been
made to establish a common understanding of restoration times. Without these base
assumptions the analysis of the restoration times would have become overly complicated, to the
point where realistic assessment would become impossible. Although highly simplified, the
assumptions take into account likely scenarios regarding damage incurred in such an
earthquake, and the likely assistance from outside the Wellington region. The common
assumptions are as follows:
Road access, for response and recovery of the water and gas networks, has been assumed
to be that shown on the road vulnerability mapping, as included in appendix 2. It is
nevertheless accepted that road access in some locations may be very restricted at the time
that access is required for inspection and repairs. Due the complexities of analysis, road
access for power (electricity) and telecommunications has been assumed to be ‘single lane
with speed restrictions, priority usage’ in all locations.
The majority of the expected damage will be caused by the initial fault rupture and
earthquake. Significant aftershocks would potentially cause further damage and therefore
potentially lengthen restoration times.
Sufficient standby generators are locally available for key infrastructure facilities and can be
provided within 5-10 days.
Diesel for standby generators and utility vehicles/machinery is locally available and
transportable.
The majority of necessary materials for asset damage repair are either locally available or can
be externally provided within 10-20 days.
The majority of necessary skilled resource and associated equipment is locally available or
can be provided within 5-10 days.
Civil machinery is locally available for asset repairs.
3.3. Restoration levels of service
In order to explain restoration times, the levels of service to which lifeline utilities will be
progressively restored need to be characterised. For the purposes of this study, the definitions
shown in Table 2 have been used:
Wellington Lifelines Group ‘Restoration Times’ report – November 2012
16
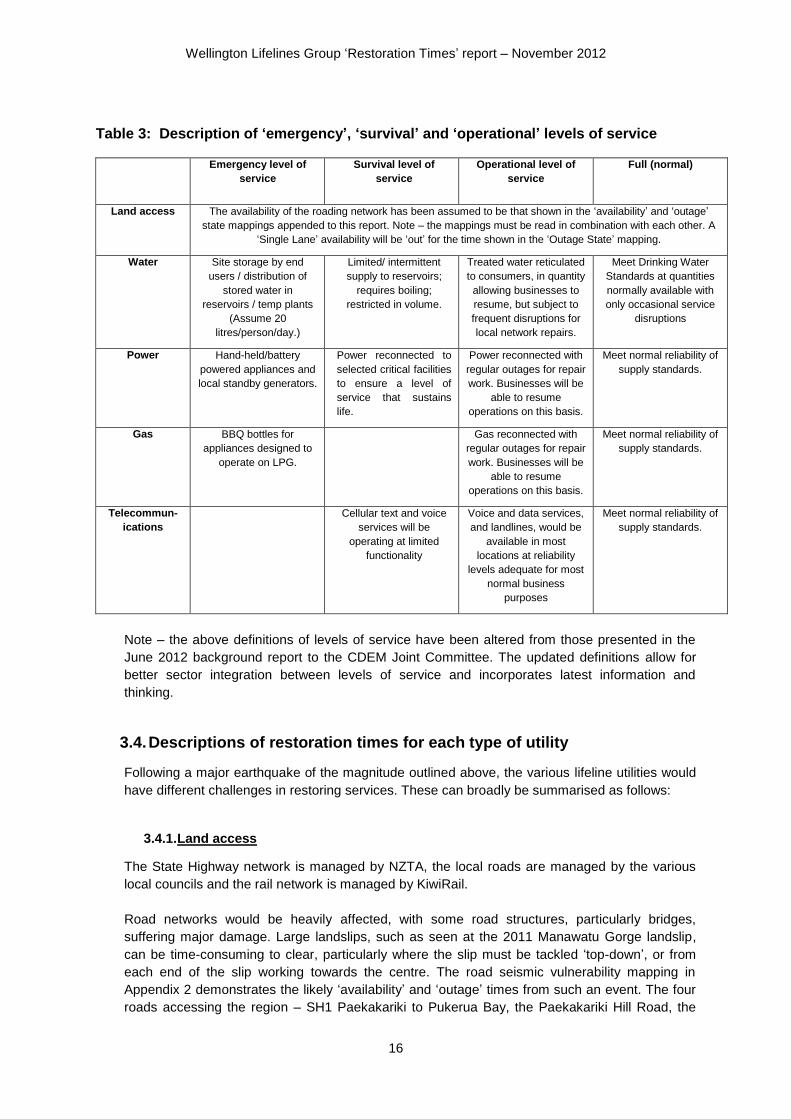
Table 3: Description of ‘emergency’, ‘survival’ and ‘operational’ levels of service
Emergency level of
service
Survival level of
service
Operational level of
service
Full (normal)
Land access The availability of the roading network has been assumed to be that shown in the ‘availability’ and ‘outage’
state mappings appended to this report. Note – the mappings must be read in combination with each other. A
‘Single Lane’ availability will be ‘out’ for the time shown in the ‘Outage State’ mapping.
Water Site storage by end
users / distribution of
stored water in
reservoirs / temp plants
(Assume 20
litres/person/day.)
Limited/ intermittent
supply to reservoirs;
requires boiling;
restricted in volume.
Treated water reticulated
to consumers, in quantity
allowing businesses to
resume, but subject to
frequent disruptions for
local network repairs.
Meet Drinking Water
Standards at quantities
normally available with
only occasional service
disruptions
Power Hand-held/battery
powered appliances and
local standby generators.
Power reconnected to
selected critical facilities
to ensure a level of
service that sustains
life.
Power reconnected with
regular outages for repair
work. Businesses will be
able to resume
operations on this basis.
Meet normal reliability of
supply standards.
Gas BBQ bottles for
appliances designed to
operate on LPG.
Gas reconnected with
regular outages for repair
work. Businesses will be
able to resume
operations on this basis.
Meet normal reliability of
supply standards.
Telecommun-
ications
Cellular text and voice
services will be
operating at limited
functionality
Voice and data services,
and landlines, would be
available in most
locations at reliability
levels adequate for most
normal business
purposes
Meet normal reliability of
supply standards.
Note – the above definitions of levels of service have been altered from those presented in the
June 2012 background report to the CDEM Joint Committee. The updated definitions allow for
better sector integration between levels of service and incorporates latest information and
thinking.
3.4. Descriptions of restoration times for each type of utility
Following a major earthquake of the magnitude outlined above, the various lifeline utilities would
have different challenges in restoring services. These can broadly be summarised as follows:
3.4.1. Land access
The State Highway network is managed by NZTA, the local roads are managed by the various
local councils and the rail network is managed by KiwiRail.
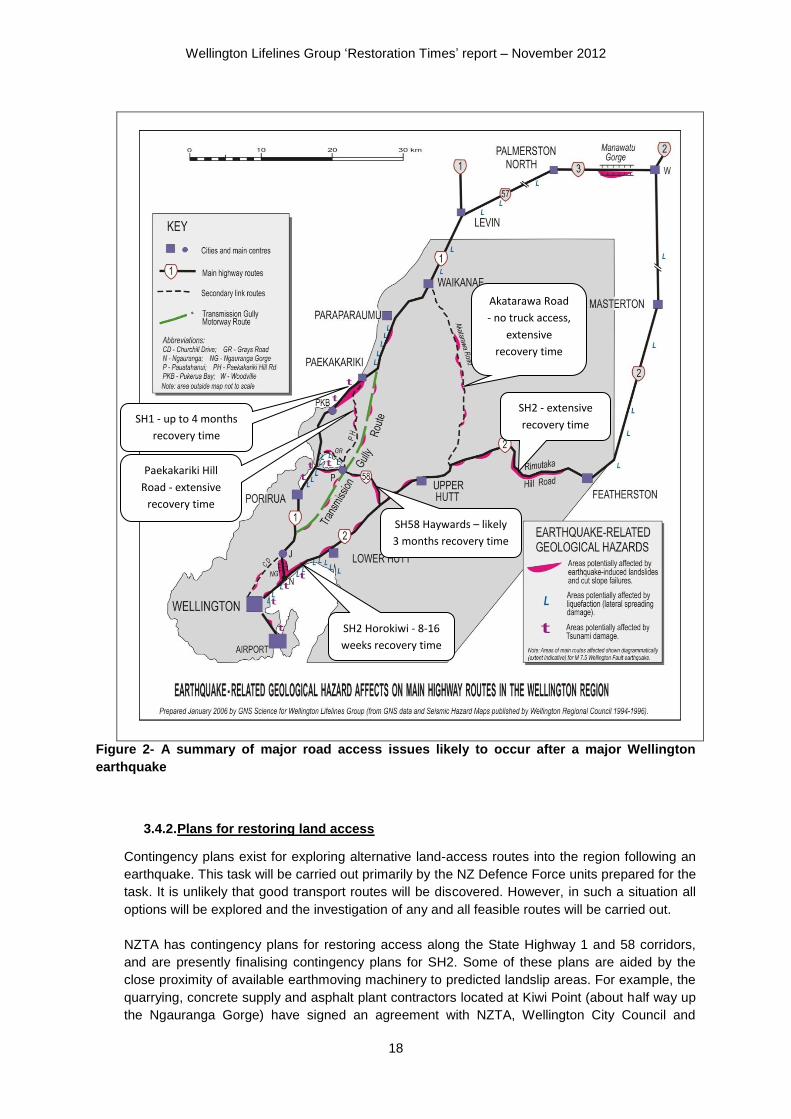
Road networks would be heavily affected, with some road structures, particularly bridges,
suffering major damage. Large landslips, such as seen at the 2011 Manawatu Gorge landslip,
can be time-consuming to clear, particularly where the slip must be tackled ‘top-down’, or from
each end of the slip working towards the centre. The road seismic vulnerability mapping in
Appendix 2 demonstrates the likely ‘availability’ and ‘outage’ times from such an event. The four
roads accessing the region – SH1 Paekakariki to Pukerua Bay, the Paekakariki Hill Road, the

Wellington Lifelines Group ‘Restoration Times’ report – November 2012
17
Akatarawa Road and the SH2 Rimutaka Hill Road would all be out of use for ‘at least three
months’. It is anticipated that SH1 Paekakariki to Pukerua Bay would be reopened first, at up to
120 days restoration time for truck access. If the Transmission Gully route were to be developed,
it is estimated it would cut restoration time down to 40 days. Anticipated slips at SH58 Haywards
and SH2 Horokiwi would fragment the region for at least 55 days. Figure 2 depicts the key road
access issues following a major Wellington earthquake.
Regarding food supply into the region, under normal circumstances the two major supermarket
chains, Progressive and Foodstuffs, truck provisions to the Wellington Metropolitan area from
major logistical hubs located in Palmerston North. Due to the nature of the sector, most
provisions are transported and stored on a just-in-time basis. This means that while supermarket
shelves are normally well stocked, if the transport routes are disrupted for lengthy periods, there
are no large back-up stores of provisions within the region to maintain supply to the
supermarkets. Provisions would therefore have to be transported to supermarkets via alternative
routes. Routes and arrangements for such alternative routes are outlined in Section 5.3.
Rail access will be affected similarly to the road network. The rail network follows a similar route
to SH1 between Paekakariki and Pukerua Bay. Although the Rimutaka Rail Tunnel itself may be
relatively unaffected, access to the portals of the tunnel is likely to be heavily affected.
Wellington Lifelines Group ‘Restoration Times’ report – November 2012
18
Figure 2- A summary of major road access issues likely to occur after a major Wellington
earthquake
3.4.2. Plans for restoring land access
Contingency plans exist for exploring alternative land-access routes into the region following an
earthquake. This task will be carried out primarily by the NZ Defence Force units prepared for the
task. It is unlikely that good transport routes will be discovered. However, in such a situation all
options will be explored and the investigation of any and all feasible routes will be carried out.
NZTA has contingency plans for restoring access along the State Highway 1 and 58 corridors,
and are presently finalising contingency plans for SH2. Some of these plans are aided by the
close proximity of available earthmoving machinery to predicted landslip areas. For example, the
quarrying, concrete supply and asphalt plant contractors located at Kiwi Point (about half way up
the Ngauranga Gorge) have signed an agreement with NZTA, Wellington City Council and
SH1 - up to 4 months
recovery time
Paekakariki Hill
Road - extensive
recovery time
Akatarawa Road
- no truck access,
extensive
recovery time
SH2 - extensive
recovery time
SH58 Haywards – likely
3 months recovery time
SH2 Horokiwi - 8-16
weeks recovery time

Wellington Lifelines Group ‘Restoration Times’ report – November 2012
19
KiwiRail on restoring access in the Johnsonville to Thorndon corridor following an event. Similar
agreements are planned at other key locations around the Wellington region.
In addition to the above, the WeLG and WREMO have collaborated with the various transport
asset owners to establish feasible means of transporting freight around the region following a
major earthquake. This work is expected to be complete in early 2013. The initial piece of work
may be used by the other lifeline organisations and other sectors for planning purposes. Follow-
on work is outlined in Section 5.3.
3.4.3. Water and wastewater
Potable water
The bulk water supply and distribution is managed by the Wellington Regional Council, the local
reticulation is managed by Capacity (for Upper Hutt City Council, Hutt City Council and
Wellington City Council) and by Porirua City Council.
Three operational water treatment plants provide bulk water to the primary reservoirs of the
region’s four cities. Except for river and stream crossings, the pipelines are underground. The
supply pipeline from the Te Marua treatment plant to Porirua and Wellington crosses the
Wellington Fault at Te Marua, Silverstream and Karori. Supply pipelines from the Waterloo and
Wainuiomata treatment plants cross liquefaction-prone areas in Petone, and the Wellington Fault
at Korokoro and Thorndon. At each fault crossing the pipe will be fractured and displaced and the
area may be eroded by escaping water. In addition, multiple breaks are expected along the
length of each pipeline from ground acceleration and movement, yet the likely location of
damage is difficult to predict.
Repair of the bulk water pipeline is a linear process from the point of supply, involving testing,
repair and retesting. A reduced level of bulk water will be restored earlier to reservoirs closest to
the source of supply (such as in Upper Hutt and Lower Hutt). Thus restoring any supply to
Wellington City and system-remote reservoirs such as Pukerua Bay is expected to take many
weeks.
Although obvious breaks in city reticulation systems could be repaired soon after the event, the
reticulation system will be progressively repaired from reservoir to consumers once a source of
water is available to fill and pressurise the pipes to identify leaks. The planned approach is to test
and repair a section of the reticulation main and then test and repair each branch fed from it, until
all lateral connections to consumers supplied from that section have been repaired. After a
section of the main pipe and all its connections have been repaired, the process is repeated with
the next section. In this systematic way, areas of the region will be progressively reconnected to
the water supply. Separate teams working on different mains or branches and at multiple
locations will speed up the time needed for repair.
Without an alternative source of water to use for supply or repair, a decision will need to be made
on whether to use some of the stored water in reservoirs for testing and repair before the bulk
supply is at least partially restored.
Metropolitan Wellington’s average residential consumption varies by city and was between 200
and 225 litres per person per day over the 12 months to June 2012. In a major emergency, the
plan is for a restricted volume of water (20 litres per person per day) to be available from stored
water held in city reservoirs. This is only 10% of normal consumption and around the minimum
recommended by aid agencies.
Wellington Lifelines Group ‘Restoration Times’ report – November 2012
20
The water will need to be collected by individuals in containers from distribution points
(emergency level of service). When the bulk supply is first restored to the reservoirs it will be in
reduced quantity and possibly untreated or partially treated, but a boil water notice may be
necessary (survival level of service). At this stage the volume of water should be sufficient for the
20 litres per person per day to continue and testing/repair of the reticulation system to proceed.
It is intended that an increased supply of treated bulk water would be restored to the reservoirs
by the time the pipework to consumers is repaired to a functioning level (operational level). The
quantity available at this stage may be less than normal but more than adequate for commercial
activities to continue. Network repairs and improvements will continue for months before normal
supply is restored to consumers.
Some communities will experience a greater water shortage than others. Upper Hutt and Hutt
City have access to aquifers that will provide a faster solution to restoring water supply. Porirua
and Wellington cities, however, have few options for an alternative emergency water supply,
although these alternative options are being investigated. As a result, planning for the
reinstatement of bulk water places an emphasis on restoring at least a partial supply of bulk
water to Porirua and Wellington central, western and the northern suburbs. This will allow repair
of the reticulation to eastern and southern suburbs of Wellington City to proceed sooner.
For restoration times of the water network, see the timeframes given in Table 4 and Table 5 in
Section 3.5. Additionally, for more detail, see Appendix 1 for ‘contour mappings’ of water network
recovery times. Note in Appendix 1 that the time taken to restore water supply to the relevant
reservoirs is the ‘survival’ restoration time given in Table 4. The time to restore water to
reservoirs plus the time to restore the reticulation is the ‘operational’ restoration time given in
Table 5.
Wastewater system / Sewage disposal
The wastewater infrastructure in Wellington urban areas is expected to be severely damaged in a
significant earthquake event. The recent Christchurch earthquakes have demonstrated the
serious effects of liquefaction and ground shaking on wastewater pipes, especially old ones, and
the extended duration of repair and recovery of the gravity networks to basic operational level
due to land deformation (months).
Some damage is expected to the wastewater treatment plants and pumping stations. However,
the major damage anticipated to the wastewater pipelines and combined with the lack of normal
water supply would severely reduce the immediate volume of sewage requiring pumping or
treatment.
The hilly terrain of the Wellington region makes the provision of emergency sewage disposal
particularly challenging and the community may be expected to be self-sufficient for a longer
period than that experienced by Christchurch residents following the Christchurch earthquakes.
3.4.4. Power
The Transpower transmission network (national grid) supplying the Wellington metropolitan area
has a degree of redundancy and, being a predominately overhead network, is expected to
perform well in an earthquake. Additionally, Transpower’s substations and equipment are
designed and constructed to a high level of seismic performance, as work on this issue has been
going on for a number of years. Note, in Section 4.3, the performance of the transmission system

Wellington Lifelines Group ‘Restoration Times’ report – November 2012
21
in the Christchurch February 2011 earthquake. The supplies for the Wellington metropolitan area
come from two major nodes (Haywards and Bunnythorpe) in the lower North Island. Bunnythorpe
is near Palmerston North.
Wellington Electricity Lines Ltd’s (WELL) power distribution network is recognised as a reliable
network. With 60% of the assets located underground, it provides a reliable supply system which
is largely unaffected by the high winds synonymous with the Wellington region. However, the
benefit of buried cables in high-wind conditions could become a vulnerability during an
earthquake because the ground movement may cause multiple cable failures, both at cable joints
and at equipment terminations.
The majority of WELL’s 33kV sub-transmission cables, which form the backbone of the
distribution network, are relatively mature and have been constructed as pressurised fluid-filled
cables. The network has the majority of these cables installed under busy roads, along clear
areas like river banks or through structures such as bridges, some of which cross fault lines.
These cables will be very vulnerable to failure from ground deformation caused by an
earthquake. Repair to an extensively damaged cable would take many weeks due to the
specialised materials and skilled resource required to carry out the repair.
WELL owns 489 substation buildings, with approximately 300 built before 1976. The buildings
contain the higher-cost equipment (transformers and high-voltage switchboards), which has long
lead times to manufacture and deliver. The pre-1976 buildings, although compliant with the
relevant building code when constructed, now require a further structural assessment to confirm
that their seismic performance would meet a fitness standard within the current Building Act. It is
important that the electrical assets remain available for service following a significant seismic
event, so WELL must ensure that the building does not collapse and damage equipment, or
endanger the public and surrounding buildings. This may require a reinforcement programme of
selected buildings, which WELL is currently assessing.
The projected peak load in the Wellington Metropolitan area for 2012 is 550 to 570 MW. West
Wind Generation (the wind turbines at Makara) may contribute a maximum of 143 MW
(depending on wind speed), and is connected between Wilton and Central Park on the
Transpower 110kV system. Unfortunately, the wind turbines require the grid to be energised to
be able generate power, so cannot run independently.
The greatest vulnerabilities to the Wellington region that would impact power restoration
timeframes are the region’s topography, both from the perspective of the steep hilly terrain and
the limited number of narrow road and transportation access corridors. Each access corridor is
susceptible to subsidence and landslides in areas. Key network vulnerabilities include the scores
of 33kV fluid-filled sub-transmission cables, which would readily fail if subjected to ground
deformation and would require lengthy repair times.
WELL utilises telecommunication services from a number of different telecommunication utilities
such as leased fibre cable, wireless and cellular radio services. These services are used
extensively in the operational control of the power distribution network for the remote control and
monitoring of distributed assets (SCADA system) and for operational communications to co-
ordinate field activity. The ability for these telecommunications services to remain functional
following an earthquake will be vital in WELL’s response to power restoration.
Asset assessment and repair for the power distribution network are also a linear process,
working from the higher supply voltages at the 33,000V sub-transmission level and then down
through the 11,000 V distribution feeders and 400V segments of the network. Supply to the
distribution line network cannot occur until the network connections are established, with
successive repair and livening work through the voltage hierarchy of 33kV, 11kV and finally 400V

Wellington Lifelines Group ‘Restoration Times’ report – November 2012
22
networks. This would progressively restore power to required areas, with critical loads such as
hospitals and water pumping stations being given a high priority for restoration. Some individual
homes and dwellings, depending on the damage incurred, may first need to be cleared for
electrical safety by an electrical verification inspection which WELL would need to arrange and
coordinate through independent electrical inspectors. This recognises that dwellings and
business premises may be damaged to an extent that they would be unable to be safely
connected to a restored street supply.
It is important to note that there are key regional and power network differences between
Christchurch and Wellington, which will be reflected in the considerably longer restoration times
required for Wellington. The restoration timeframes for the Wellington zones shown in Table 4
and Table 5 incorporate the Wellington regional and WELL network vulnerabilities, the event
scenario and the restoration assumptions. The differences between the Christchurch and
Wellington networks are reflected in Section 4.3.1.
3.4.5. Telecommunications
Telecommunications is a relatively complex sector compared to other infrastructure sectors. Nine
Telecommunications Service Providers (TSPs) are active in Wellington, each delivering different
services (e.g. voice, data/internet, SMS in access and back-haul networks) using different asset
types (in roof-tops, on surface and underground). Usability depends not just on TSP performance
but also on users’ devices beyond TSP’s immediate control (e.g. accessing telecommunications
via cordless phone needs power, cell phones also need re-charging etc.).
These matters complicate the TSP restoration story, making simple / single restoration times
difficult to derive and support. The following provisional estimates are to be read against these
caveats.
The provisional estimates below distinguish survival from operational levels of performance.
Illustratively, survival can be taken to mean that cellular text and voice services (but perhaps not
data) will be operating at limited functionality, i.e. at performance levels noticeably lower than
normal (e.g. with reduced coverage and building penetration and often with extensive redialling).
Performance may be more favourable in these first days in areas where mains power is
available, but can be expected to deteriorate following aftershocks due to congestion.
Resumption of landline services is not included in this survival performance level. Operational
performance means voice and data services, and landlines, would be available in most locations
at reliability levels adequate for most normal business purposes.
Assuming shaking comparable with Christchurch, and assuming favourable post-earthquake
conditions, restoration of cellular services at most locations, to survival level, might be expected
quite quickly – e.g. within three days (provisional estimate), albeit with congestion following
aftershocks. It should also be noted that battery reserve on cell sites is likely to enable survival
level cell phone service for a period of hours in the immediate aftermath, with expected high
levels of network congestion. Note that, in the absence of mains power, this estimate assumes
continuing local road access and availability of petroleum for generators and vehicles. It also
assumes ready access into Wellington and availability of water.
Restoration of services to operational level might take 10 days (provisional estimate). The
assumptions in the preceding paragraph also apply here. The pace of repairs to underground
cables is also likely to impact on the rate of restoration to operational service levels. Resumption
of landlines may well take longer than cellular and landline customers with cordless phones will
need to await restoration of mains power supply before their phones can be used.
Wellington Lifelines Group ‘Restoration Times’ report – November 2012
23
These provisional estimates will need to be extended if power, access to and within Wellington,
petroleum and/or water supplies are unreliable. The estimates would need to be extended if
numerous repairs to underground cables are required.
There is a clear need for the TSPs and emergency management planners, possibly with the input
from the fuel supply companies, to better understand how the emergency distribution of fuel to
critical cell sites would be undertaken in the days and weeks following a major earthquake.
3.4.6. Gas
The bulk gas supply network is managed by Vector, with the local supply network managed by
Nova Energy and Powerco.
As a predominantly buried pipe network, the gas network is affected by the same hazards in an
earthquake as the water network and buried electrical cables. Similarly, the restoration of the gas
network is carried out first from the bulk mains, with repair works progressing towards the
consumer. The restoration of the gas network is different from other utilities, however, because
repaired lines must be formally certified before being used. Unlike water, it is therefore not
possible to fill the pipework with a limited supply. Rather, once recovered, the gas network would
run at normal levels. Restoration of the gas network is strongly influenced by the reopening of the
road network, as the gas main network is largely in the road corridor. Restoring the gas network
will take longer if water seeps into the gas pipework system.
A further complication with breaks to gas networks is the danger posed by leaks. For this, the
energy sector, in association with WeLG, has created a protocol for reconnections of their
respective networks in order to ensure that faulty gas mains and electric cables in combination
do not cause additional hazards. Despite this, if the gas network does leak, this may cause
general delay and recovery co-ordination issues in the vicinity of the leak.
3.4.7. Fuels
Fuel supply has not been addressed as part of this report. A draft regional fuel emergency
response plan is not yet finalised, commenting at this stage on fuel supply restoration times
would not be of value. Discussions are continuing between WeLG, WREMO and the fuel
companies on this issue, and it is recommended these be progressed. Assumptions made
regarding land access could, however, be taken into account regarding fuel supply.
3.5. Summarised restoration times for gas, power and water
The following are summarised restoration times, to the levels of service outlined in Table 3. Note
that restoration times are the grid/bulk supply times combined with local distribution (for gas,
combined Vector, Powerco and Nova Energy, for power combined transmission [Transpower] and
distribution [Wellington Electricity], for water, bulk supply [Wellington Regional Council], and local
reticulation [Capacity and Porirua City Council]).
Due to the complexity of the telecommunications sector restoration times (see section 3.4), the
telecommunications restoration times are not included in tables 3 and 4.

Wellington Lifelines Group ‘Restoration Times’ report – November 2012
24
The estimated restoration times have been summarised for whole suburbs or areas. It should be
noted that some pockets of earlier recovery may be possible depending on a range of factors
such as proximity to key distribution nodes of networks.
Table 4: Summarised survival restoration times
Gas restoration
time (days)
Power
restoration
time (days)
Water
restoration
time (days)
Upper Hutt and Stokes Valley 80 20 20
Hutt Western Hills 80 30 30
Hutt Central 80 30 20
Wainuiomata 80 20 20
Hutt City Harbourside 80 30 25
Mana, Plimmerton and Pukerua Bay 60 20 50
Porirua Central 60 20 35
Pauatahanui – Haywards 60 20 25
Northern Wellington suburbs 60 30 30
Western Wellington suburbs 60 30 40
Wellington CBD 80 50 50
Central Wellington suburbs 80 30 50
Roseneath, airport and Southern Bays 80 30 65
Eastern Wellington suburbs 80 30 65
Table 5: Summarised operational restoration times
Gas restoration
time (days)
Power
restoration
time (days)
Water
restoration
time (days)
Upper Hutt and Stokes Valley 80 50 30
Hutt Western Hills 80 60 40
Hutt Central 80 60 25
Wainuiomata 80 50 35
Hutt City Harbourside 80 70 40
Mana, Plimmerton and Pukerua Bay 60 40 75
Porirua Central 60 40 75
Pauatahanui – Haywards 60 40 35
Northern Wellington suburbs 60 60 45
Western Wellington suburbs 60 60 55
Wellington CBD 80 95 55
Central Wellington suburbs 80 60 55
Roseneath, airport and Southern Bays 80 60 70
Eastern Wellington suburbs 80 60 70
While the above restoration times take into account interdependency principles, a detailed
interdependency modelling exercise has not been carried out. This is largely due to the
complexity that such an exercise would entail. This again highlights the indicative (rather than
definitive) nature of the restoration times presented in this report.

Wellington Lifelines Group ‘Restoration Times’ report – November 2012
25
4. Comparing the Wellington and Christchurch metropolitan areas
4.1. Topography
In reflecting on the lifeline utility response to the September 2010 and February 2011 Canterbury
earthquakes, it should be recognised that the Wellington region is very different from the flatter
topography around Christchurch. Christchurch is situated between the Canterbury plains and
Banks Peninsula. The majority of the city, apart from residences around the Port Hills, is situated
on flat terrain with a grid road layout. In contrast, Wellington city (with half the region’s population
and a large proportion of its daytime workers) is built around a harbour with the majority of
residences located in hill and valley suburbs, and the CBD built on a narrow flat area between a
fault line and reclaimed harbour frontage. The various utilities that supply Wellington are
constructed around and over hills and slopes. Additionally, the wider Wellington region is
constructed along corridors – the Hutt Valley and Tawa being examples. Some of the corridors
are narrow and take a wide range of utilities, such as through the Thorndon Quay area, which
contains key roads, water mains, gas mains, electricity and telecommunications cables and gas
mains, all located within the road corridor. Such a concentration of utilities in a confined area
creates a greater combined risk in the event of a natural hazard event. It should be noted that the
Wellington fault crosses this key area. Wellington City Council and WeLG are working together to
mitigate some of the risk in this key area. The greater repair and reconstruction challenges in
Wellington are reflected in the longer recovery times that would be required following a ‘direct hit’
earthquake in the Wellington region.
The February 2011 earthquake significantly affected the Port Hills in Christchurch, with their
topography broadly similar to that in Wellington. In Christchurch, the local CDEM restricted utility
access due to landslips, falling rocks and general ground instability. This issue will present an
ongoing safety hazard during response and repair in Wellington.
4.2. Transport Access
The grid layout of Christchurch’s road network is a key difference to that of Wellington. A grid
road network, as at Christchurch, provides a large diversity of routes should a road or bridge be
affected by earthquake. Due to its topography, Wellington’s road layout is less networked,
particularly for main routes – as demonstrated in the road seismic vulnerability mappings in
Appendix 2 and also as demonstrated in Figure 2. Because of this, in Wellington, if one road is
disrupted, there may be limited, or no, alternative routes. Other lifeline utilities face similar layout
issues, with few alternatives if one key corridor or part of a network is compromised.
4.3. Christchurch case studies
The following are case studies outlining restoration times from the different context of the recent
Christchurch earthquakes. These outline how and why restoration times in Wellington will be
different.
4.3.1. Christchurch’s power
During the February 2011 earthquake, Transpower’s equipment was returned to service within
four hours. Orion, the Christchurch electrical distribution business, was able to restore power to
Wellington Lifelines Group ‘Restoration Times’ report – November 2012
26
approximately 90% of customers within 10 days, excluding the CBD red-zoned area. Orion’s
electrical network is fundamentally different to the WELL power network. Over a period of 15
years prior to the September 2010 earthquake, Orion had invested approximately $6 million in
seismic strengthening programmes, such as reinforcing over 100 substation buildings and
supporting sub-transmission cables in vulnerable locations. This investment is estimated by
Orion to have saved them approximately $50 million in damaged assets and direct asset
replacement costs. Restoration times to both the September and February earthquakes would
have been significantly higher had the seismic strengthening works not been undertaken. Orion
also has a different network architecture from that of WELL, with more redundancy of supply in
its 11kV network, which allows for a higher level of interconnection of alternative supplies.
In addition to the Christchurch CBD, which contains 6,600 connections and was ring-fenced and
isolated as a “red zone”, only approximately 10% of Orion’s power network was actually affected
with large areas receiving little or no damage at all. The Wellington region would clearly be more
vulnerable to loss of power than Christchurch. (See Section 5.1 regarding upgrading the
resilience of Wellington region infrastructure.)
4.3.2. Christchurch’s telecommunications
Immediately after the Christchurch earthquakes, cellular performance suffered for some hours
due to extreme congestion (exacerbated as batteries ran down). In homes and workplaces,
cordless PSTN phones ceased to work where electricity failed.
Numerous faults occurred in the local access copper network and many PSTN copper and lead-
covered cables were damaged. On the other hand, roadside cabinets were generally
undamaged. Some microwave dishes were misaligned. Fibre and radio services held up well.
In the following hours and days, cellular performance temporarily declined as batteries at cell
sites depleted, then improved as generators and mobile sites were deployed (around 200 mobile
generators were used). Generator refuelling presented major logistical challenges due to road
conditions and traffic congestion. Vodafone for example reported that refuelling was a 24 hour
operation in the first three to four days, with eight people working in 12 hour shifts. Petroleum
was generally available for generators and vehicles.
Landline availability declined a little as cabinets batteries depleted. Performance then improved
progressively as generators were deployed, numerous telephone cable faults were repaired and
electricity was restored at customer premises.
Main nodes / exchanges (where back-up electricity supplies are available) and connections to
other parts of New Zealand held up well.
TSPs have improved emergency capability in the months since the main Christchurch
earthquakes, likely to favourably impact on service restoration. However, TSPs note that in
Wellington’s case:
Extensive shaking and slope failure could cause greater damage to sites (including
monopoles and towers) and cables than experienced in Christchurch.
Difficulties may arise in transporting needed equipment including generators to
Wellington. Difficulties may also arise in accessing main telecommunication nodes and
other sites - access is expected to be more challenging in Wellington given the topology
and the greater incidence of equipment on high-rise buildings.

Wellington Lifelines Group ‘Restoration Times’ report – November 2012
27
Availability of petroleum and ongoing road access for frequent refuelling may be more
problematic.
4.3.3. Christchurch’s water supply
Christchurch was able to reinstate a basic mains water supply to 50% of the city three days after
the February 2011 earthquake and to 89% of the city after two weeks. The water still needed to
be boiled and was intermittent due to ongoing repair of distribution pipes. This will not be the
case for a major earthquake in Wellington due to the fundamental differences in the water supply
network. Christchurch’s water is fully supplied from underground aquifers below the city. Water is
extracted from wells at over 50 locations around the city and pumped untreated into
interconnected distribution networks to consumers. Pressure in the network is maintained by the
pumps and assisted by a small number of reservoirs that also serve the hill suburbs.
In comparison, approximately 60% of metropolitan Wellington’s water supply relies on remote
‘run of river’ sources and the treated water being piped through long trunk mains - for example
the Te Marua to Wellington pipeline is 56km long. The remaining 40% is supplied by the
Waiwhetu aquifer in the Hutt Valley from eight wells in one area and piped to the Waterloo
treatment plant for treatment and supply. With only a few exceptions, the bulk water from all
sources is piped to reservoirs and distributed from the reservoirs to consumers. Emergency
cross-connections between the bulk water trunk mains and the city distribution network have
been pre-installed at strategic locations to bypass reservoirs. An emergency cross-connection
between the aquifer well outlet and the Hutt City distribution network is planned. These
connections are intended to speed up the reinstatement of water supply in specific areas but in
general still rely on the repair of the trunk main.
4.3.4. Christchurch’s gas
In Christchurch there is a shorter reticulated gas system (130km) none of which was in the CBD.
During the recent earthquakes, as the pipework was constructed of polyethylene, no breakages
occurred, except to around three overground meter sets. Wellington’s gas network is much larger
with relatively more natural hazard vulnerabilities to contend with, meaning that recovery times
are anticipated to be longer.

Wellington Lifelines Group ‘Restoration Times’ report – November 2012
29
5. What the individual lifeline utilities and WeLG are doing for
mitigation and preparation
Wellington lifeline utilities are working on two fronts to address the seismic vulnerabilities outlined
in this report. Firstly they are working on the long term task of reducing the existing infrastructure
vulnerabilities. Secondly, they are planning emergency responses.
5.1. Providing more resilient infrastructure
Lifeline utilities review the resilience of their assets against relevant seismic codes. Reducing
existing vulnerabilities to earthquakes is a task that can be approached in two ways. Firstly,
through the day-to-day maintenance and renewals work that is carried out by utilities. For
example, where old (and brittle) reticulation pipes require replacement for maintenance reasons,
they are often replaced with strong but flexible polyethylene pipe (both water and gas networks)
which performs much better under earthquake loading. Although this is a simple example, similar
changes are also being made through the day-to-day maintenance work of the other lifeline
utilities.
The second action to reduce infrastructure earthquake vulnerabilities is through one-off projects.
An example of such a project is the current seismic upgrade of the Te Marua reservoirs, which will
improve the earthquake resilience of the water supply to the Wellington metropolitan area.
There are many other examples of day-to-day maintenance/renewal upgrades that, over a period
of years, provide improved earthquake resilience. An excellent example of the benefits of
progressive infrastructure upgrades is the work that has been going on in Christchurch, as
outlined in a recent New Zealand Lifelines Committee report. Seismic retrofitting has been proved
to be relevant, worthwhile and economically justifiable.
5.2. Projects providing greater resilience
The following section outlines projects in, or affecting, the Wellington region that have already or
will at completion have a positive effect on the seismic resilience of the region.
5.2.1. Power
Power transmission
Transpower are taking the following actions which will improve power transmission resilience to
the Wellington region:
Recent work carried out
Kaiwharawhara – two new transformers installed with foundations to new seismic standards.
Haywards – HVDC Pole 3 project – extensive upgrading on site to new seismic standards
Planned work
Foundations of two replaced to new seismic standards at the Central Park substation
A rebuild of a 110kV structure at the Wilton substation to provide better diversity
Replacement of a Wilton outdoor 33kV structure with indoor 33kV switchgear to meet new
seismic standards
Wellington Lifelines Group ‘Restoration Times’ report – November 2012
30
An additional 220/110kV interconnector transformer for Wellington – location still to be
determined
Inter-phase spacers to be installed on the Takapu Road – Wilton 110kV circuits 1 and 2 to
improve the performance in snow storms (as an outcome of the 15-16 August 2011 snow
storm).
Deployment of nine hardwood poles into the Wellington region as a contingency if the roads
are blocked from the north. (Temporary towers are located in Palmerston North which can be
flown in by helicopter)
Studies
A ‘High Impact Low Probability’ (HILP) and diversity study is now under way for Central Park,
Wilton, Kaiwharawhara and associated transmission lines. This is due for completion in
February 2013.
Power distribution
From a power resilience perspective, WELL has adopted a substation building seismic policy.
This provides the methodology for the risk assessment of WELL’s substation buildings for
seismic strengthening and includes a priority ranking system. This policy is driving a 10 to 15-
year seismic assessment and strengthening programme of substation buildings.
As outlined in Section 3.4.4, buried 33kV fluid-filled sub-transmission cables can be vulnerable to
seismic events with repair to extensively damaged fluid-filled cables possibly taking a number of
months, depending on the extent of damage on each individual cable. WELL is engaging with
Wellington City Council to develop protocols regarding the emergency installation of overhead
33kV lines should sub-transmission cables become unavailable for an extended period following
a seismic event. The selection of the proposed overhead 33kV contingency routes will consider
all risks within their immediate vicinity such as earthquake-prone buildings, vegetation,
topography, ground conditions and ease of access for construction. Engagement with the
remaining Wellington-area councils will commence following completion of the Wellington CBD
study.
WELL is also working with Transpower to investigate further options to improve the transmission
supply security and diversity into the Wellington CBD. The increased security and diversity at
transmission level will assist in quicker response times for power restoration.
In addition to the initiatives above, the following projects and actions have been undertaken
which will improve power distribution resilience to the Wellington region:
Transpower’s Wilton Grid Exit Point to Moore St 33kV cable replacement – two fluid-filled
33kV buried sub-transmission circuits (5km in length) have been replaced with modern XLPE
cable at a cost of $9 million.
Adelaide Rd substation – the front façade has been seismically strengthened and the roof
replaced resulting in a high level of National Building Standard compliance and providing
seismic protection to the internal assets and public safety.
Restraining substation equipment – Major equipment within zone substations has been
seismically restrained and non-service spares removed to a central store.
Numerous seismic structural assessments have been completed and strengthening remedial
works will be programmed into future capital works programmes.

Wellington Lifelines Group ‘Restoration Times’ report – November 2012
31
5.2.2. Telecommunications
Telecommunications Service Providers (TSPs) with Wellington operations are taking many steps
to improve post-earthquake services. The scope covers both assets and organisational
response. Some examples include the following:
Stocks of generators have been reviewed with deployment at cell sites, cabinets etc
in mind. Steps are being taken to increase the number available and improve their
portability, connection characteristics and fuel capacity
Improvements are being made to air conditioning and switch-board / generators at
key Wellington exchanges (proposed changes to air conditioning will improve
resilience by reducing dependency on mains water supply)
Work is underway by at least one major TSP to check and enhance Wellington
earthquake relationships with suppliers, and to identify specific points where fibre
may be vulnerable to fault rupture – mitigation is planned to follow
Intra-TSP emergency response arrangements have been reviewed following
Christchurch experience and improvements are under way (development of “war
rooms” and mapping capability are examples)
The Telecommunications Emergency Forum has been expanded and now covers all
TSPs with operations in Wellington (the Forum facilitates inter-TSP communication
and co-operation in emergencies, and also enhances engagement with the CDEM
response)
These and other steps arise from specific internal reviews by TSPs of their Christchurch
experience, ongoing capital expenditure programmes and regular capability reviews.
5.2.3. Water
Bulk water supply
Wellington Regional Council has spent more than $20 million in the past 20 years earthquake-
strengthening its bulk water supply network. This investment has also boosted its ability to
restore services faster after a big earthquake.
The regional council regularly reviews the bulk water network to identify and prioritise areas of
potential vulnerability. This includes such things as supply intakes, treatment plants, pipelines,
pumping stations and reservoirs. There is $5.4 million allocated in the current budget for
earthquake-strengthening work.
The biggest and most expensive of these is the strengthening and expansion of two reservoirs at
Te Marua. Work on the first of the Stuart Macaskill Lakes has been completed; work on the
second will start this summer. The cost of strengthening the embankments is $10 million.
Another big project in the current year is replacement of the suction main to Point Howard
pumping station at a cost of $1 million. The existing pipeline passes through a liquefaction-prone
area of Seaview and is old and brittle. The replacement pipe will follow a more secure route and
be better able to supply the suburb of Eastbourne after an earthquake.
The regional council has a policy that, where cost-effective, critical water supply buildings should
be 100% of New Building Standard to ensure greater certainty of supply after a major
earthquake. All such buildings and structures have been prioritised for structural assessment
over the next three years. Strengthening of the Kaiwharawhara pumping station is currently in the
Wellington Lifelines Group ‘Restoration Times’ report – November 2012
32
design stage, while structural assessment of buildings at three water treatment plants has
recently been commissioned.
Local networks
Earthquake-strengthening the local networks that feed out from the bulk network to consumers is
equally important to the overall resilience of the region’s water supply. A considerable
programme of work is under way to replace critical pipelines with pipes made of materials more
able to withstand seismic shocks. To date, 35% of water mains in Wellington have now been
replaced with pipes constructed of more resilient materials. In Lower Hutt and Porirua, the figure
is 40%, and in Upper Hutt it is 60%. Porirua is also installing flexible seismic connections at
critical locations in its network.
In 2008, a group was set up to co-ordinate a regional approach to emergency water supply. The
Water Services Emergency Preparedness Group has representatives from Capacity, the
Wellington Regional Emergency Management Office, the regional council and local councils in
Wellington, Porirua, Lower Hutt and Upper Hutt. The group has developed a plan to tackle short
and medium-term challenges to supplying emergency water until normal operations resume.
The regional council, Capacity and the councils of Wellington, Lower Hutt, Upper Hutt and
Porirua have been working to install emergency cross-connections at key points between the
bulk water and local networks (city reticulation systems). Cross-connections have been installed
in each city. These cross-connections, activated after a big earthquake, will allow bulk water to
flow directly into city reticulation systems, rather than via reservoirs. The net result will be a faster
restoration of supplies to consumers.
This financial year a key cross-connection will be installed in Lower Hutt between the Waiwhetu
aquifer wellheads and the Lower Hutt reticulation system in Knights Road. This will allow aquifer
water to be piped directly into the Lower Hutt network within days of a big earthquake and also
allow tankers to be filled for emergency distribution.
Shut-off valves activated by seismic shocks prevent the loss of water held in reservoirs. They
also activate when they sense the excessive outflows caused by broken mains. All the main
reservoirs – accounting for 90% of the Wellington metropolitan area’s water storage capacity –
have now been fitted with automatic shut-off values, and work is turning to their installation at
smaller reservoirs in Wellington.
A feasibility study into a sea water desalination plant on Wellington’s south coast was recently
completed. A plant was found to be unsuitable for use solely in emergencies because it would be
slow and technically difficult to start up, and also uneconomic to operate on an occasional basis.
It would also be costly to build. However, small mobile plants remain an option under
consideration.
Emergency storage
The storage of emergency water supplies is one means of enabling services to resume more
quickly. This would be of most benefit to Porirua and Wellington, which are the greatest distance
from the region’s water sources and whose supplies would be the last to resume. Upper Hutt
and Lower Hutt both have access to water from aquifers.
The regional council has begun identifying sites to build covered emergency storage ponds close
to where they are most needed. These ponds could have capacities ranging up to 500 million

Wellington Lifelines Group ‘Restoration Times’ report – November 2012
33
litres. Eventually, such ponds have the potential to provide emergency water to both Porirua and
Wellington cities until bulk supplies restart.
A reservoir with a capacity of 35 million litres is currently being designed for daily use by
Wellington’s CBD and eastern and southern suburbs (including the regional hospital). In an
emergency, almost two-thirds of the reservoir’s capacity would be set aside solely for use by the
hospital.
Porirua is investigating the use of the old Kenepuru Dam as an emergency water supply.
The installation of emergency storage tanks at strategic places in local communities is another
means of dealing with disruptions until normal supplies resume. In Wellington, Porirua and Lower
Hutt, local councils have installed such tanks in schools and community centres. Porirua City
Council has installed 62 (with a combined capacity of 1.5 million litres); Hutt City Council has
installed 25, and Wellington City Council has installed nine (and plans to have 50 in place by
2015). Existing tanks have capacities ranging from 5,000 litres to 25,000 litres.
Domestic rainwater tanks are one more way of dealing with a disruption to service. Kapiti Coast
District Council requires all new homes to have a 10,000-litre rainwater tank, or a 4,000-litre tank
as well as a system to reuse grey water. Capacity and the regional council encourage, and
provide information on, installing rainwater tanks. The Wellington Regional Emergency
Management Office has advice on its website about how to capture rainwater in an emergency.
Planning for emergency water supply until normal operations are restored.
The following investigations and activities are under way:
Arranging to source mobile water tankers for local distribution. Water for these tankers
can be sourced from either the Hutt Valley artesian system or though navy based tankers
bringing water from other regions. This includes:
o Construction of mobile tanker filling facilities in Lower Hutt using the artesian well
collection pipeline
o Joint planning with the NZ Defence Force to ferry tankers into the region where
land transport access is compromised
Installation of a new bore in Lower Hutt and retrofitting of existing private bores in the Hutt
Valley for public supply.
Investigations are continuing into the availability of bore water in Wellington and Porirua
Identification of available surface water at several sites and collection at a higher level
than buildings to avoid contamination with sewage throughout the region, suitable for
recharging the networks to hasten repairs and for public use
Taking advantage of and treating existing ground water seepage. The Tawa NIMT rail
tunnel for example produces about a third of Wellington’s emergency water needs.
Exploring the possibility of installation of small scale desalination plants especially around
the eastern and southern suburbs of Wellington where normal water supply operations
will take longer to be restored.
The Water Services Emergency Preparedness Group (WSEPG) is working closely with
Wellington Lifelines Group and the Wellington Regional Emergence Management Office in the
delivery of projects to improve utility resilience.

Wellington Lifelines Group ‘Restoration Times’ report – November 2012
34
Wastewater system and sewage disposal
WSEPG has developed a regional plan that identifies potential options available for the disposal
of sewage following a major earthquake.
The options identified in the short term following an event will require residents to bury their
waste on site, where possible, or contain it for collection and disposal by the authorities. Other
options include:
The procurement/installation of long drops and composting toilets
The procurement and distribution of port-a-loos to hospitals, welfare centres and within
communities for public use
The procurement and distribution of chemical toilets to households.
A composting toilet system, which is currently under trial and, if successful, could assist in
the management of sewage in an emergency.
Investigations are continuing to identify the risk and options available within areas of each of the
respective cities in the region.
5.2.4. Transport / access
What is the transport sector doing for mitigation and preparation?
Wellington’s state highway and local road network currently has low to medium resilience
particularly due to the limited alternative routes in, out and around the city. However important
work has been completed over the last decade. The NZ Transport Agency along with Wellington
City Council, Hutt City Council, Upper Hutt City Council, Porirua City Council and Kapiti Coast
District Council has invested in preventative maintenance and seismic strengthening work to help
reduce critical vulnerabilities across the region’s transport networks.
What has been achieved to date?
Key work programmes completed have included:
Wellington City
- Strengthening of bridges on SH1 Shell Gully and the SH1 Thorndon Overbridge (Wellington
Urban Motorway)
- A $50 million upgrade of the Terrace Tunnel to improve the safety of this tunnel during an
emergency.
- Ngaio Gorge. A decade long programme of road risk mitigation works has been completed to
improve the seismic stability of this route which could be a critical corridor in an emergency.
- Churchill Drive. Road risk mitigation including road retaining wall improvements and
preventative maintenance has been conducted at Churchill Drive (Churton Park) which is also
a potential strategic recovery corridor.
Porirua City
- Preventative maintenance on the Paekakariki Hill Road to mitigate critical vulnerabilities along
the corridor
- Seismic strengthening of SH1 Pukerua Bay Rail Overbridge
Wellington Lifelines Group ‘Restoration Times’ report – November 2012
35
Hutt City
- Preventative maintenance at the Connolly Street Stopbank to realign road and raise the stop
bank to reduce the risk of flooding in low lying areas of Hutt Valley that may flood following
natural event.
Upper Hutt City
- Seismic strengthening SH2 Pakuratahi River Bridge
- Strengthening of the Silverstream Bridge.
Kapiti Coast
- Seismic strengthening SH1 Waikanae River Bridge and SH1 Otaki River Bridge
Work that is currently underway includes
- Work is about to begin on reinforcing the portals of the Mt Victoria Tunnel, strengthening of
the Karori Tunnel Portals and nearby banks is nearly complete.
- In the 2012-15 National Land Transport Programme funding has also been allocated to begin
construction on the MacKays to Peka Peka section of the Kapiti Expressway and to
investigate improved connections between Petone to Grenada and between SH2 and SH58,
with an aim of improving resilience and creating alternative routes.
What still needs to be done?
In the medium term (2015 and beyond) major investment is planned to construct Transmission
Gully and work on the other Wellington Northern Corridor Roads of National Significance (RoNS)
projects. The RoNS programme will strengthen the resilience of State Highway 1 out of
Wellington, and the connection between the inner city and the Wellington Regional Hospital in
Newtown. Investment is also planned for further work on connections between SH1/ SH2 and
SH58 to improve connectivity in and out of the Hutt Valley.
NZTA’s programme of future investment will be targeted to address the most significant regional
vulnerabilities where are the most substantial improvements to restoration times. The NZTA is
now beginning work with local authorities in the Wellington metropolitan region to develop a
substantial package of network resilience activities to mitigate risks identified in this report.
Port
CentrePort’s infrastructure used for the berthing of vessels and transfer of cargoes includes
wharves, seawalls, pavements and cargo handling equipment. The port’s facilities and
infrastructure are predominantly located on areas of reclaimed land.
CentrePort understands the importance of its infrastructure in facilitating recovery operations
following a significant natural disaster event and has as a key strategy the maintenance of a
Business Continuity Plan which is subject to regular update and review.
Post-disaster, based on the port’s Business Continuity Plan, assessments by CentrePort will be
able to identify wharves and pavements which are, or are likely to be, the most suitable for

Wellington Lifelines Group ‘Restoration Times’ report – November 2012
36
mooring ships and handling of emergency recovery cargo. This will have important implications
for the planning of the type and size of ship which can be berthed at Wellington after a major
earthquake
The Airport
An engineering study for Wellington Airport shows that some areas of the runway will incur
damage in a major earthquake. Following any seismic event above MM 4.1 on the airport’s
accelerometer, an infrastructure assessment will be undertaken. Subject to that assessment, the
runway is presently expected to be operational for helicopter and military aircraft within hours.
Airport engineers are now undertaking further assessment on what is likely to be required to
reinstate full operations after a major earthquake.
The rail network
KiwiRail is carrying out the following work regarding the improvement of seismic resilience in the
region:
Asset studies recently carried out on slope stability risk in the Wellington area have
resulted in a funding stream and work programme to lower these risks. Slope stability is
a key consideration in weather and seismic resilience. This work will be carried out over
multiple years.
Track and structure renewals, carried out in accordance with KiwiRail’s asset
management system, are to current design standards, taking earthquake and flood risk
into consideration.
Contingency planning for an emergency event is continually updated, company-wide. For
example, emergency bridging stock is available, and resources outside the region are in
place to aid recovery.
5.3. Planning transport access responses to a major event
Work carried out in during September and October 2012, facilitated by the Wellington Lifelines
Group and the Wellington Region Emergency Management Office with the respective transport
asset owners has highlighted the means by which food, fuel and freight would be transported into
and around the region following a major earthquake, and the principles of recovering transport
links. The Wellington region was considered in five “areas”, with key findings as follows: -
Wellington Port, CBD and the airport
This area is at the start of the food/materials delivery supply chain, assuming supply by sea into
Wellington Port, but the end of the lifeline chain for water and electricity supply. Water and power
availability will present additional challenges in this area for both community and lifelines
response and recovery. The following concepts have been developed for transport relating to this
area: -
As a first priority, create an access corridor along the route from the airport to Wellington
Hospital, and the port, and from there to the ‘Wellington West’ area.
The airport is central for rapid response, evacuation and urgent/high-priority supplies.

Wellington Lifelines Group ‘Restoration Times’ report – November 2012
37
Centreport have achieved an average of 25 to 30 containers handled an hour using existing
container cranes. If these cranes are unavailable (no power, jumped off rails, collapse or
equipment failure), it should be expected that containers are delivered by conventional ships with
onboard cranes that would be used for off-loading, at a rate of six to 10 containers each per hour.
Additional supplies could be delivered via ‘roll on roll off’ vessels such as quarter deck car
carriers.
‘Wellington West’
The ‘Wellington West’ area has been assumed to incorporate Johnsonville at its northernmost
extreme, the Ngauranga Gorge, and the Wellington City suburbs west of the Wellington fault line
(i.e. Crofton Downs, Khandallah, Karori). The fault line was chosen not just for the likelihood of its
rupture (which represents only one earthquake scenario for the region) but because adjacent to
the faultline is a steep hill (from Wadestown to Kelburn) which must be traversed to gain access
to the other side of the faultline. This presents a natural barrier for transport access in the region,
particularly following a major local earthquake, and is therefore a logical boundary for the eastern
side of the ‘Wellington West’ area.
The key actions following an earthquake will be to establish which are the most viable routes in
this corridor for restoring access from Wellington City through to Porirua and the Hutt Valley. This
will be achieved through early reconnaissance operations and through co-operation between
NZTA, WCC, KiwiRail and key contractors, as identified in the ‘Thorndon Critical Area plan for
road access Ngauranga to Thorndon (May 2012)’. A concentration of available resources will be
given to the best access route once this has been identified.
Restoring an access route between Johnsonville and the Karori tunnel area will be an early
requirement. For improved connectivity between CentrePort and other Wellington metropolitan
areas, the recovery of the Hutt Road between Ngauranga and Thorndon will be vital.
Access via the Crofton Downs-Wilton-Wadestown route is likely to be the route opened earliest
(even though with restricted capacity, being a narrow road). Access into Karori is likely to be
through the Crofton Downs-Wilton-Karori route.
Porirua and Tawa
Priorities for restoring transport access into and around the Porirua and Tawa areas will be, with
top priority first: -
Restore access, via Johnsonville, to the Wellington Harbour area (likely to take, in
total, around three weeks). Whilst this work progresses:
Restore access around the Porirua and Tawa areas.
Until access to Wellington Harbour is achieved, create a barging access into Titahi
Bay for supply of food and materials to the Porirua and Tawa area.
Start earthmoving operations to re-open State Highway 1, starting at Pukerua Bay
and working north towards Paekakariki.
Investigate the viability of using the Old Coach Road over the Belmont Hills towards
the Hutt Valley.

Wellington Lifelines Group ‘Restoration Times’ report – November 2012
38
The Hutt Valley
Food, fuel and materials will be transported into the Hutt Valley via the harbour foreshore, via
CentrePort or from a ship moored in the harbour off-loading direct to barges, supplemented by air
delivery and ‘four wheel drive transport.
The long-term priority will be on restoring access from Wellington via State Highway 2, Petone to
Ngauranga. NZTA’s SH2 contingency plan estimates it will take eight to 12 weeks to restore truck
access along this corridor. Restoring access over the SH2 Rimutaka Hill Road and through SH58
Haywards is anticipated to take ‘more than three months’. Therefore getting direct transport
access to the Hutt Valley without any use of State Highway 2 or State Highway 58 should be
developed for the short to medium term of the response and recovery.
Fuel deliveries through the Seaview area remain critical for the response and recovery activities
of the region, and access through this area requires particular attention. The Seaview Marina will
probably present the most viable location for loading/unloading barges and landing craft.
Within the Hutt Valley, effort would be concentrated on establishing a route from Seaview and
Petone to Te Marua. As SH2 is likely to be heavily affected in this area, the local road route would
provide the most feasible access option. The most likely difficulties in this corridor would be the
road structures across the Waiwhetu Stream in the Seaview area, the road at Taita Gorge and the
road at Brown Owl.
Kapiti Coast
Due to likely large landslips south of Paekakariki on State Highway 1, on the Paekakariki Hill
Road and the Akatarawa Road, transport access to the Wellington Metropolitan area will be cut
by land. Food, fuel and materials will be transported into the Kapiti Coast via State Highway 1 and
via the rail network from the north. Earthmoving operations are likely to be staged from the Kapiti
Coast area for restoring land access to the Wellington metropolitan area and a large logistical
operation will be based at Paraparaumu airport to manage helicopter access around the region.
Although time frames for restoring access from further north (the Manawatu area) can only be
broadly assumed as a matter of five to 20 days, this does not change the strategy of securing
access along the State Highway 1/rail network spine as the most convenient, and probably
highest-volume access route.
It is recommended that further planning be carried out by the other lifeline utilities and other
sectors on the basis of the findings of the above item of work.
5.4. Limits to infrastructure resilience
It should be noted that, no matter what seismic upgrades are made to Wellington lifeline utility
networks, the earthquake risk cannot be eliminated. The topography, which determines the
layout of the utilities, and the seismic nature of the region, mean that whilst resilience can be
increased, vulnerabilities will remain.
Wellington Lifelines Group ‘Restoration Times’ report – November 2012
39
5.5. Planning for an emergency event
Wellington lifeline utilities regularly review their business continuity and emergency response
plans. Such reviews are being updated in the context of learning from the recent Christchurch
earthquakes. Emergency response planning is being carried out by affected utilities for locations
identified as critical utility infrastructure areas. To date, reviews have been carried out on
Thorndon and the Petone-Seaview areas.
Overarching the above plans is the Ministry of Civil Defence and Emergency Management
“Wellington Earthquake National Initial Response Plan” which outlines actions in the first few
days of response after a major earthquake.
Of course earthquakes are not the only natural hazard facing the region, so plans are also in
place for other hazards such as tsunamis and floods.
5.6. Future WeLG co-ordination work on improving resilience
Regarding co-ordination of effort on understanding better restoration times, and on ensuring that
infrastructure resilience efforts are co-ordinated, the work undertaken by WeLG and the various
lifeline utilities to understand the vulnerabilities of the region’s own networks and assets has led
to the identification of the following current and future projects:
Transport access is a key issue that underpins the operations of many lifeline utilities.
WeLG is leading a new project to better understand the nature of land access
vulnerabilities, which will build on recent and continuing work being carried out by NZTA
and the various roading authorities in the region. Preliminary findings of this project have
been included in Section 5.3 of this report.
Further work on the Priority Sites for Utility Restoration project will lead to a greater
understanding of interdependencies of the various lifeline utilities, and provide a better
platform to plan for a range of hazard events.
Further work on the Critical Areas set of projects, including more work on the Thorndon
and Seaview ‘Critical areas’.
It is anticipated that WeLG will co-ordinate the following potential future projects/actions:
Create a better understanding of emergency regional fuel supply arrangements.
Create a better understanding of the emergency distribution of fuel supply to
telephone cell sites.
Undertake additional sector planning activities in regards to improving earthquake
response and recovery times, for example to ensure electricity lines-truck access to parts
of the Wellington metropolitan area following an earthquake.
All of the above work will be carried out in conjunction with the final phase of the It’s Our Fault
project led by GNS Science. This project will continue to actively engage with lifeline utility
providers, regarding the effects of a rupture of the Wellington fault.
WeLG is working with the Wellington Regional Emergency Management Office to co-ordinate the
above work with the organisations involved.

Wellington Lifelines Group ‘Restoration Times’ report – November 2012
40
5.7. Personal resilience preparedness
Although this report is about the resilience of our lifelines and infrastructure, it is important to note
that personal preparedness is critical as, in a major disaster, there will be significant gaps in the
performance of our infrastructure. However, the impact will be lessened considerably by people
and, by inference, their families and neighbourhoods, being prepared.
Preparing for a disaster is easy. The simple actions of having a conversation with everyone in
your household about how they will connect after an event, storing basic emergency items
around the house and knowing which neighbours can lend a hand or need a hand can prove
invaluable. Christchurch demonstrated both the power of communities looking after one another
and the importance of ensuring no one ‘falls through the gaps’. The Wellington Region
Emergency Management Office dedicates the majority of its efforts and resources to
helping people and communities take responsibility for their own their preparedness.
This is accomplished through proactive engagement with the public, private and health sectors,
NGOs, educational institutions and a wide array of community groups to develop appropriate
preparedness outcomes; this is Community-Driven Emergency Management (CDEM). Resilience
examples include building capacity across the 4Rs (Reduction, Readiness, Response and
Recovery) through training CDEM Volunteers, facilitating Community Response Plans and
Business Continuity Plans for Small and Medium Enterprises, ensuring agencies responsible for
vulnerable communities have strong links to their clients and many other activities that increase
connectedness of our people and foster co-operation.
To assist individuals, families and neighbourhoods, the Wellington Region Emergency
Management Office has produced a simple guide called It's Easy, Get Prepared for an
Emergency. This document forms the basis of engagement at this level and includes advice on:
Understanding risks and hazards in your community;
Family meeting places;
Arrangements for collecting children;
Knowing the location of utilities;
Determining evacuation routes;
Knowing where you can find information and advice in an emergency;
Knowing what warning systems mean;
Knowing where local Civil Defence Centres are;
Knowing your neighbours;
Having sufficient water for emergencies;
Having survival items (food, torch, radio, medications etc); and,
Having a readily accessible getaway kit (for home and work)
5.8. Response planning
In addition to the vital role of engagement to build resilience in our people, families,
neighbourhoods, businesses, and ultimately our communities, the Wellington Region Emergency
Management Office also has a key role in building capacity and systems to enable our
communities to respond effectively during a disaster.
Section 64 of the Civil Defence Emergency Management Act 2002 states that a local authority
must plan and provide for civil defence emergency management within its district; and must
Wellington Lifelines Group ‘Restoration Times’ report – November 2012
41
ensure that it is able to function to the fullest possible extent, even though this may be at a
reduced level, during and after an emergency. To facilitate this, the Wellington region has a
network of Emergency Operations Centres (EOCs) in Wellington, Hutt City, Porirua,
Paraparaumu, and Masterton as well as an Emergency Coordination Centre (EOC) in Wellington
City. These facilities are further supported by a network of Civil Defence Centres and Incident
Management Teams reaching even further into the community
This network acts as a central command and control facility responsible for directing and co-
ordinating the actions of council, emergency services and other groups conducting emergency
response operations in a disaster event. Its success is determined by its ability to understand and
influence the "big picture" and its main functions are to: gather and analyse data, make decisions
that protect life and property, mitigate the effects of the disaster, provide comfort, maintain
continuity, and facilitate the flow of information to and from all response agencies and individuals
concerned.
The Wellington region ECC/EOCs functions, according to Co-ordinated Incident Management
System (CIMS) principles, comprise the following teams: Planning/Intelligence, Operations,
Logistics, Welfare, Lifelines and Public Information Management (PIM).
In anticipation of emergency operations, the Wellington Region Emergency Management
Office places considerable emphasis on building strong relationships with key response partners,
particularly the Ministry of Civil Defence Emergency Management, the NZ Defence Force,
emergency services, government departments, NGOs, infrastructure companies and groups
capable of helping during an emergency. The Wellington Region Emergency Management Office
conducts regular response training and also produces and exercises various plans and
frameworks designed to promote speedy and effective response efforts.


Wellington Lifelines Group ‘Restoration Times’ report – November 2012
43
6. Resilience investment
6.1. General resilience investment issues
Lifeline utilities make decisions on future investments based on a number of issues, with trade-
offs made against a variety of competing investment factors. Investment trade-offs in their nature
are similar for the majority of the lifeline utilities. Utility resilience to hazards is only one part of
the equation of maintaining a utility, with other considerations such as day-to-day maintenance,
population size and location changes and usage patterns all having an effect on network
investment decisions. Resilience investment cannot be viewed in isolation, as the impacts of all
of the above issues will affect the way in which a utility invests in upgrades to its network. All
investments must be made with the impact on cost to the shareholders and consumer in mind.
6.2. Regulatory investment issues
Some of the Wellington Lifeline utilities are regulated monopolies. Wellington Electricity notes that
it is a regulated monopoly Lines Business and is subject to Price Quality regulation under Part 4
of the Commerce Act. Under the current Default Price-Quality path price (DPP) increases are
limited to the rate of inflation although Wellington Electricity is able to apply for a Customised
Price-Quality Path (CPP) if the DPP does not meet its individual circumstances. The regulatory
framework encourages WELL to consult with customers and carefully consider the price-quality
trade-off for what level of customer funded resilience investment is warranted to improve
resilience. A significant programme of work is still required to engage with the wider Wellington
community to discuss the value with the customers of paying for some smaller investments ahead
of an event for stronger infrastructure rather than face higher costs and longer delays post event
due to the weaker infrastructure remaining. It is important to strike the right balance that allows
affordability, quick economic recovery and return to community activity following a major event.


Wellington Lifelines Group ‘Restoration Times’ report – November 2012
45
7. Conclusions and Recommendations
7.1. Conclusions
Technical studies have been conducted by various Wellington lifelines organisations over recent
years. Viewed together, these studies clearly demonstrate the vulnerability of Wellington’s
infrastructure to a large Magnitude 7.5 earthquake.
Some examples of potential restoration times are provided in section 3. It should be noted,
however, that summarising restoration times involves a range of assumptions and uncertainties.
This means that figures should be regarded as being indicative only.
An earthquake involving rupture of the Wellington fault would be a worst-case event, with the
likelihood of occurrence being 10% within the next 100 years. Active planning for such an event
(or other earthquake events of lower magnitude but collectively a higher likelihood) is prudent,
and the Wellington lifelines utility organisations are continuing to work proactively on this issue.
Planning for such an event is a task for the Wellington Region Emergency Management Office
(WREMO), alongside the Wellington lifelines organisations that are responsible for the various
items of infrastructure. Specifically, work continues on better understanding these vulnerabilities,
and the potential consequences to the population. Also, discussions are underway regarding
logistical arrangements that may be put in place to get essential supplies to Wellington by means
other than road – by air and sea.
Investment decisions on making infrastructure more robust cannot be taken in isolation from
investment decisions on other aspects of utility upgrades. Infrastructure upgrades are ongoing,
both through business-as-usual maintenance and renewals programmes and through specific
seismic-upgrading projects.
7.2. Recommendations
The Wellington Lifelines Group:
1. Recommends that the CDEM Group Joint Committee
a. Notes the report;
b. Directs WREMO to incorporate the findings of the report into planning assumptions;
c. Recommends that local councils and their relevant lifelines infrastructure entities
incorporate the findings of the report into their infrastructure and civil defence
planning; and
d. Encourages other lifeline utilities to incorporate the findings of the report into their
infrastructure planning.
2. Tasks the Wellington Region Emergency Management Office to promote a high level of
preparedness in the community to bridge the gap between a disaster and the resulting
emergency management response.

Wellington Lifelines Group ‘Restoration Times’ report – November 2012
46

Wellington Lifelines Group ‘Restoration Times’ report – November 2012
47
Appendices
Appendix 1 – Water restoration times mappings
Appendix 2 – Road seismic vulnerability mappings

Wellington Lifelines Group ‘Restoration Times’ report – November 2012
49
Appendix 1 – Water restoration
times mappings

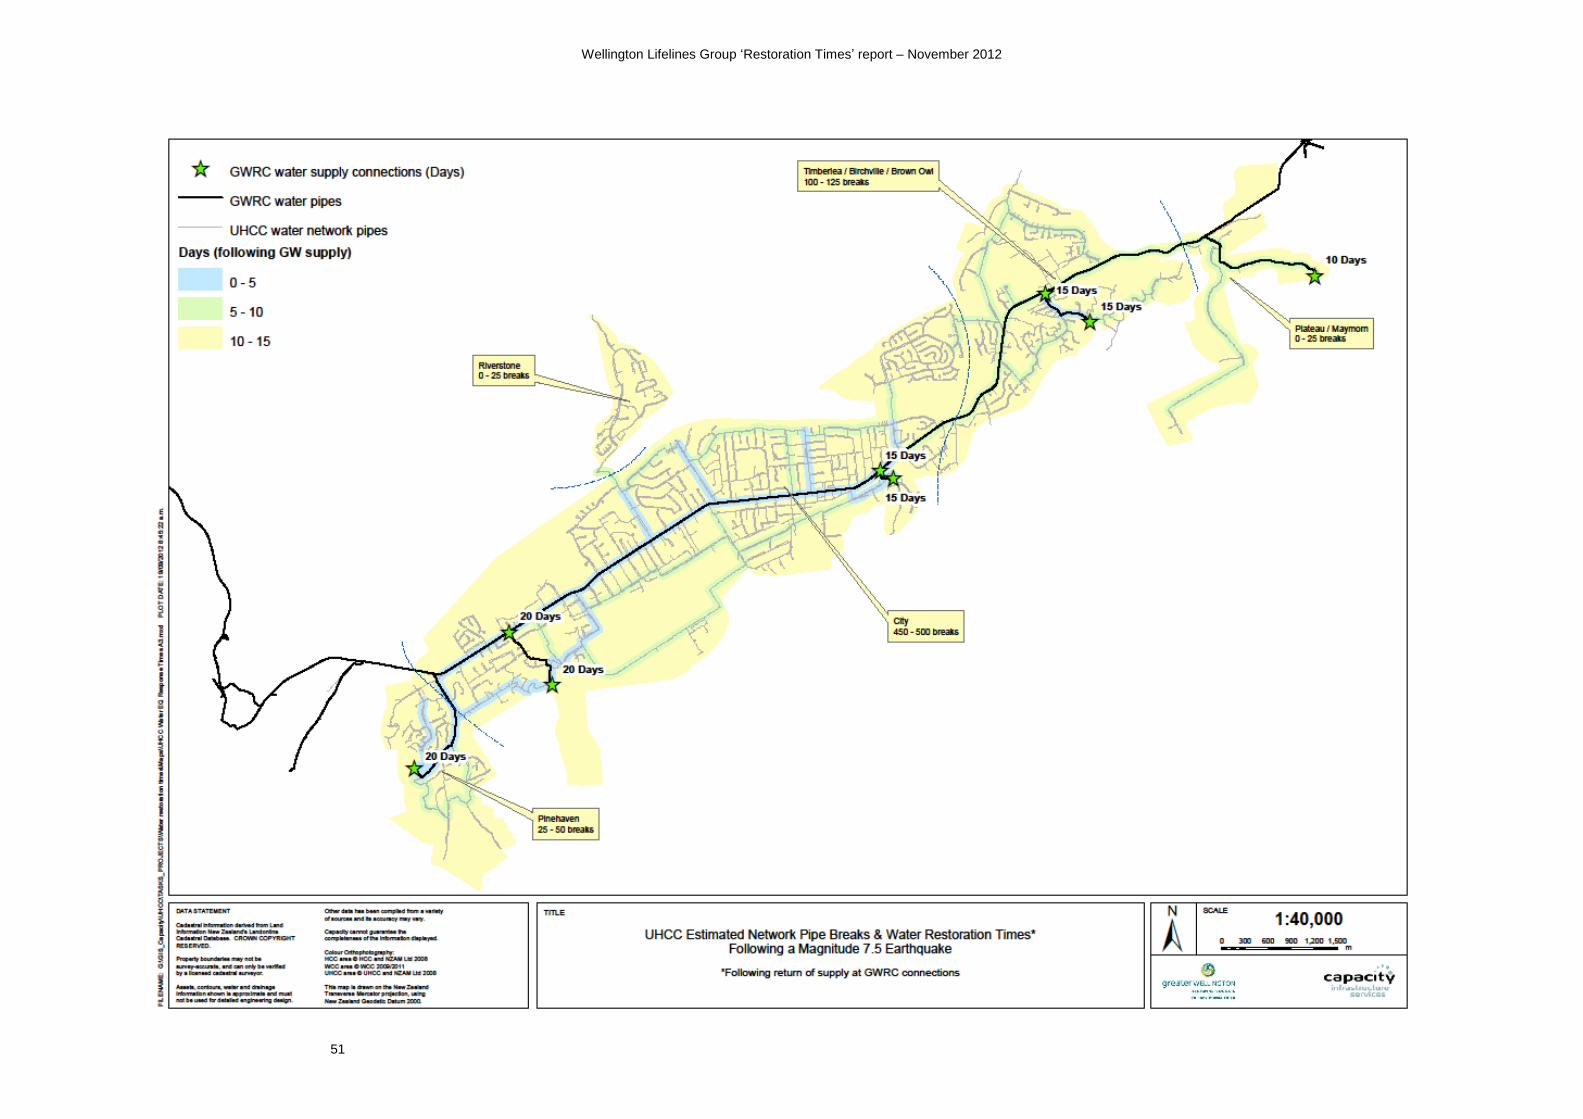
Wellington Lifelines Group ‘Restoration Times’ report – November 2012
51

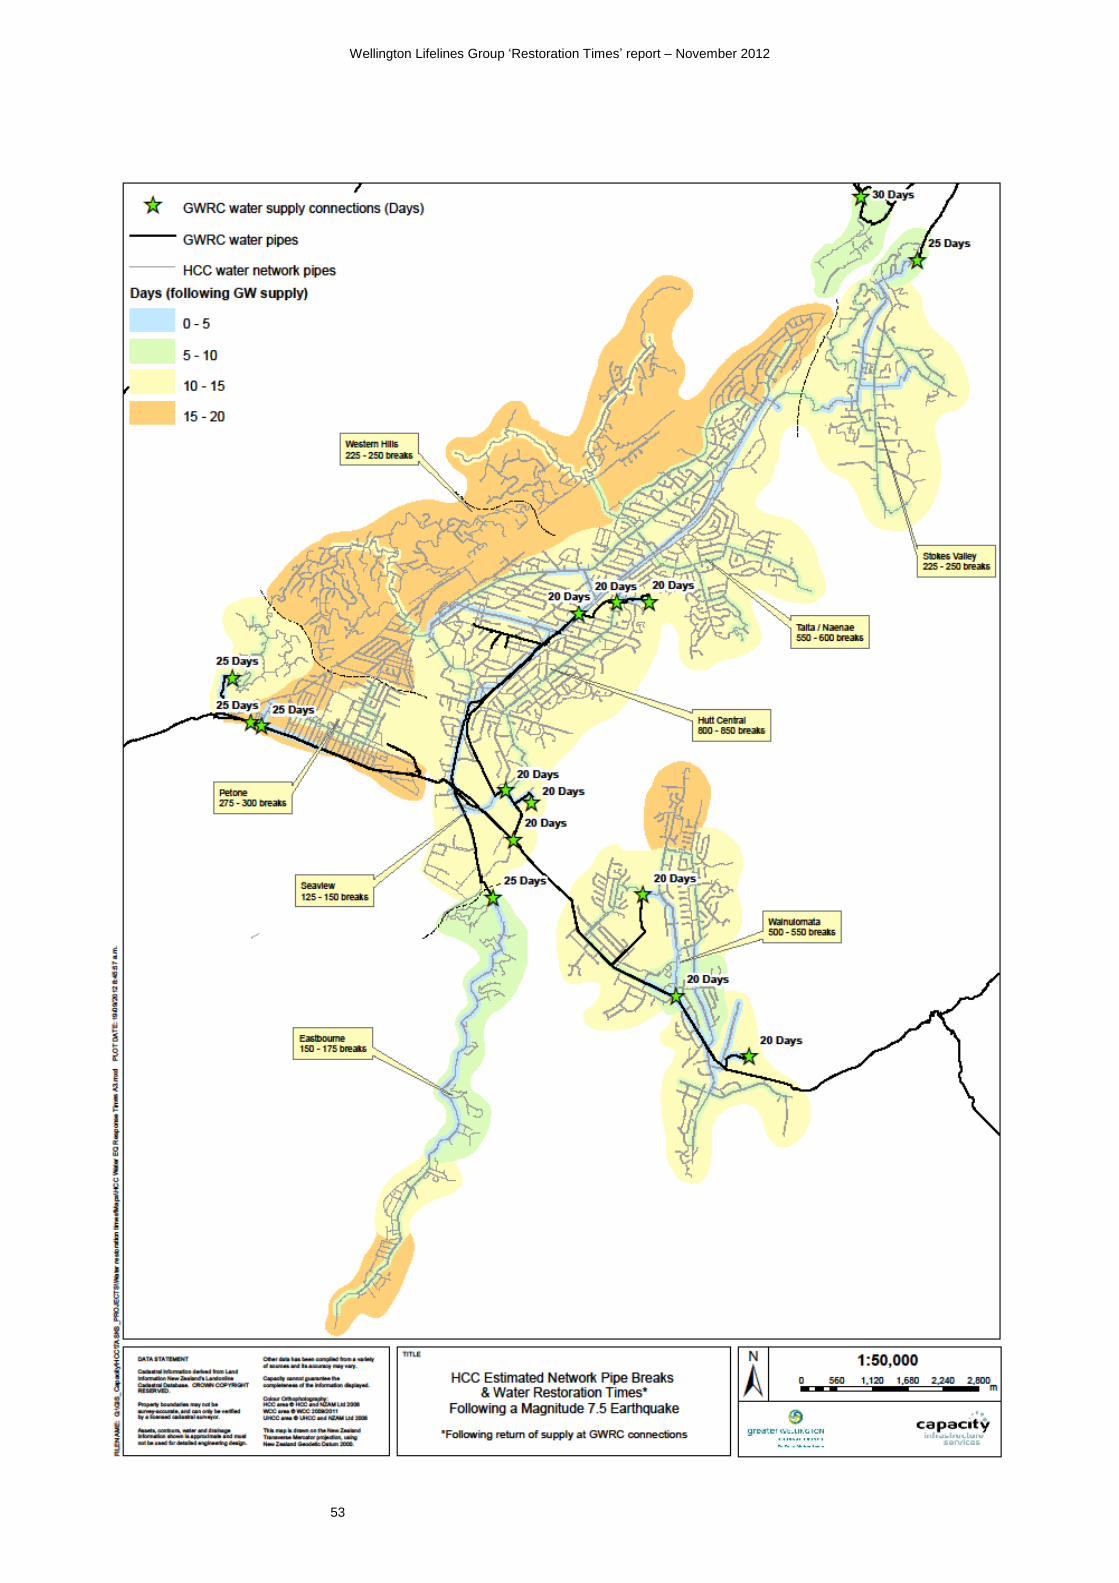
Wellington Lifelines Group ‘Restoration Times’ report – November 2012
53

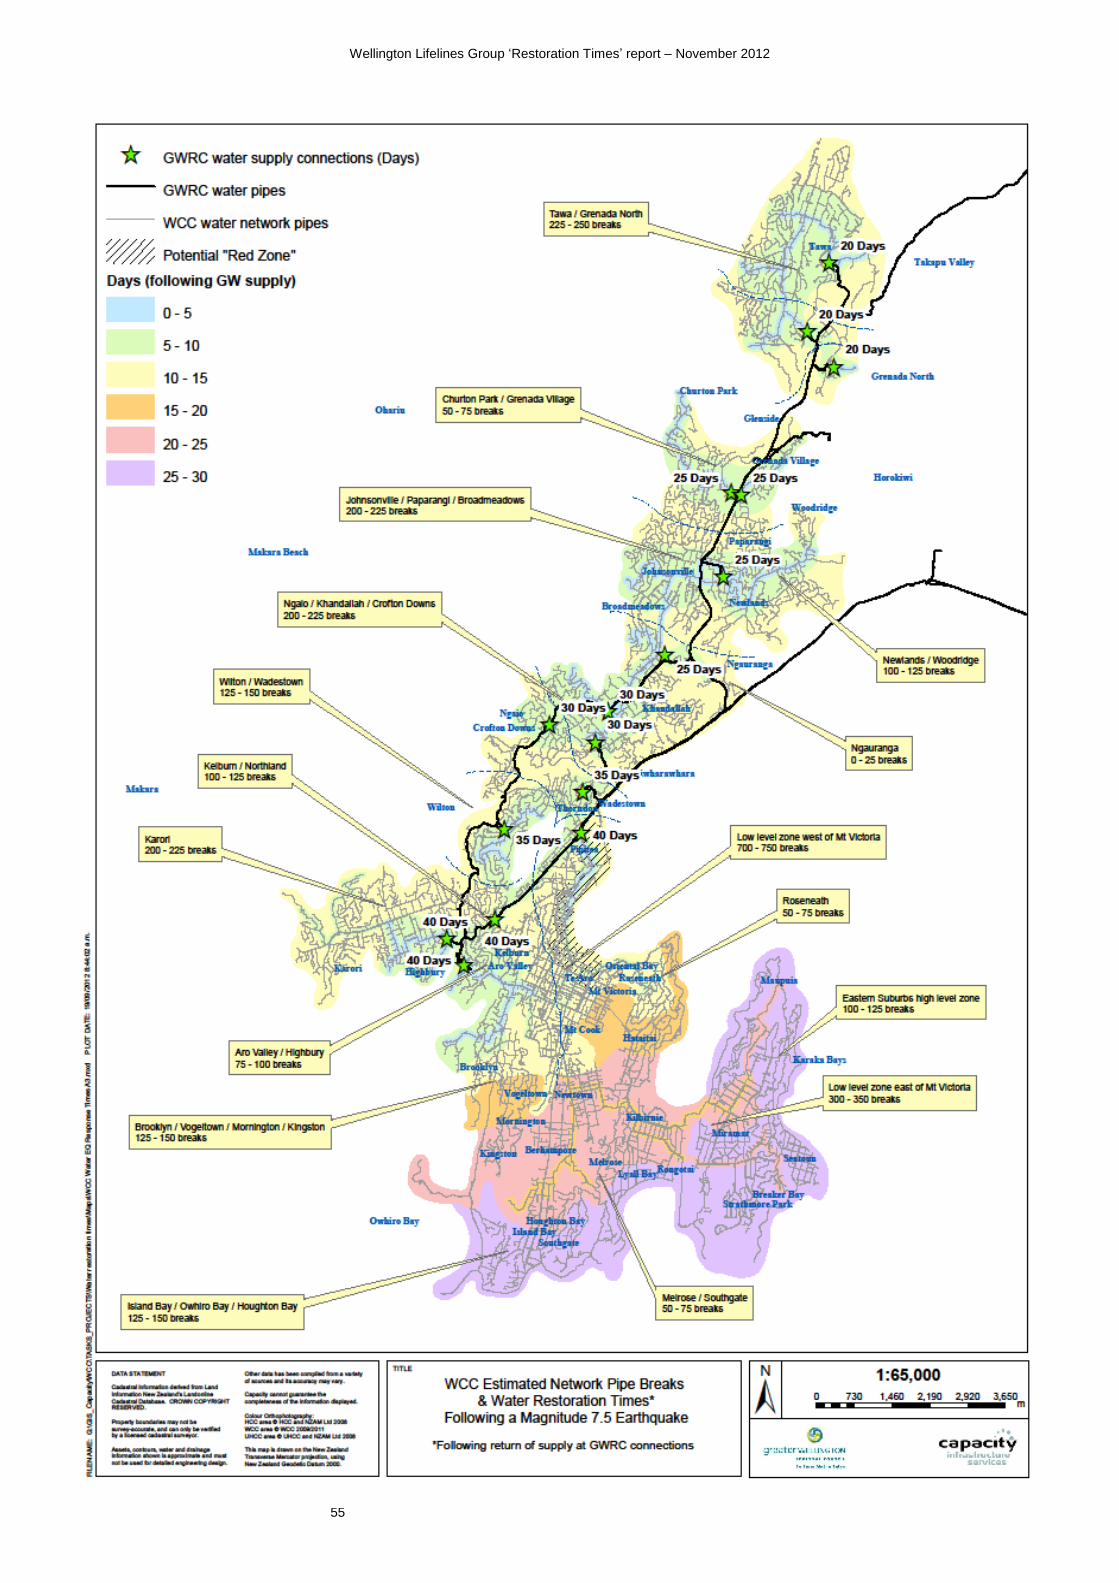
Wellington Lifelines Group ‘Restoration Times’ report – November 2012
55

Wellington Lifelines Group ‘Restoration Times’ report – November 2012
57
Appendix 2 – Road seismic
vulnerability mappings


Wellington Lifelines Group ‘Restoration Times’ report – November 2012
59


Wellington Lifelines Group ‘Restoration Times’ report – November 2012
61


Wellington Lifelines Group ‘Restoration Times’ report – November 2012
63