well test analysis in an egyptian naturally fractured oil reservoir · 2019-06-17 · petroleum...
TRANSCRIPT

Petroleum & Petrochemical Engineering Journal ISSN: 2578-4846
Well Test Analysis in an Egyptian Naturally Fractured Oil Reservoir Pet Petro Chem Eng J
Well Test Analysis in an Egyptian Naturally Fractured Oil
Reservoir
Bayoumi AW1, Gomaa S1,2* and Adel S1
1Al-Azhar University, Faculty of Engineering, Mining and Petroleum Engineering
Department, Cairo, Egypt
2The British University in Egypt, Faculty of Engineering, Department of Petroleum
Engineering and Gas Technology, El-Sherouk City, Cairo, Egypt
*Corresponding author: Sayed Gomaa, Al-Azhar University, Faculty of Engineering, Mining and Petroleum Engineering
Department, Cairo, Egypt, Tel: 002-01115003694; Email: [email protected]
Abstract
In this paper, well test data from three naturally fractured oil reservoirs were analyzed based on conventional semi–log
plots, type curve matching and Tiab’s direct synthesis techniques. A computer program using C# was developed based on
the direct synthesis method to be used in analyzing well test data in naturally fractured reservoirs. The developed
program gives accurate results compared with pan-system (one of the commercial softwares) which characterizes the
naturally fractured reservoir using conventional semi-log and type curve matching techniques. The developed program
characterizes the fractured reservoir in case of infinite reservoir without wellbore storage effect whether all flow regimes
are present, the early time infinite acting radial flow regime is absent, the late time infinite acting radial flow regime is
absent or both infinite acting radial flow periods cannot be observed.
Keywords: Oil; Gas; Reservoir; Fractures; Matrix; Porosity
Introduction
More than 50% of oil and gas reservoirs all over the world are naturally fractured [1]. Some naturally fractured reservoirs are called dual porosity reservoirs as they consist of two porous media of different characteristics; which are the matrix and the fractures. The matrix has high porosity and low permeability. However, the fractures medium has high permeability and low porosity. The flow in dual porosity system comes from the matrix towards the fractures, then from the fracture directly towards the wellbore. A number of authors have developed different models for interpreting
the pressure response in fractured reservoirs considering, among others, the characteristics of flow from matrix to fractures, fracture orientation, and block-size distribution. In general, pressure-transient tests in NFR show a behavior consistent with the Amanat U. Chaudhry model [2]. The characteristic behavior of pressure response can be described with two dimensionless parameters; namely storativity ratio (ω) and interporosity flow coefficient (λ). Several models were developed to describe the pressure behavior of wells in dual porosity reservoirs. These models assume that the flow from matrix to fractures is under transient or pseudosteady state flow conditions. The flow rate in pseudosteady state model is proportional to the pressure difference between the matrix and the
Research Article
Volume 3 Issue 2
Received Date: April 02, 2019
Published Date: May 17, 2019
DOI: 10.23880/ppej-16000188
Petroleum & Petrochemical Engineering Journal
Gomaa S, et al. Well Test Analysis in an Egyptian Naturally Fractured Oil Reservoir. Pet Petro Chem Eng J 2019, 3(2): 000188.
Copyright© Gomaa S, et al.
2
adjacent fracture. In addition, the pseudosteady state conditions are assumed at initial flow conditions. On the other side, the flow rate in case of transient matrix flow model is proportional to the pressure gradient as the pressure drawdown starts at the interface between the matrix and fracture, and then propagates into the matrix. Finally, pseudosteady state is achieved.
The presence of skin region of low permeability at the
interface between matrix and fracture causes the pressure behavior to be predicted by pseudosteady state matrix flow model, although the flow in matrix is under transient flow conditions. Therefore, most of the field cases follow the pseudosteady state flow model. Fractures have been defined in different terms depending on the specific purpose or context of the definition. From reservoir point of view, Nelson [3] has defined fracture as a naturally macroscopic planar discontinuity in rock due to deformation or physical digenesis. Fractures can be produced by brittle or ductile failure. The characteristic of fractures will also be different depending on generation process. Fractures can have positive or negative effect on fluid flow. NFR are those reservoirs where fractures have, or could have, any influence on reservoir performance. Nelson [3] has stressed the importance to collect information that allows identifying a reservoir as fractured in early stage of development.
Naturally Fractured Reservoir
Fracture Properties
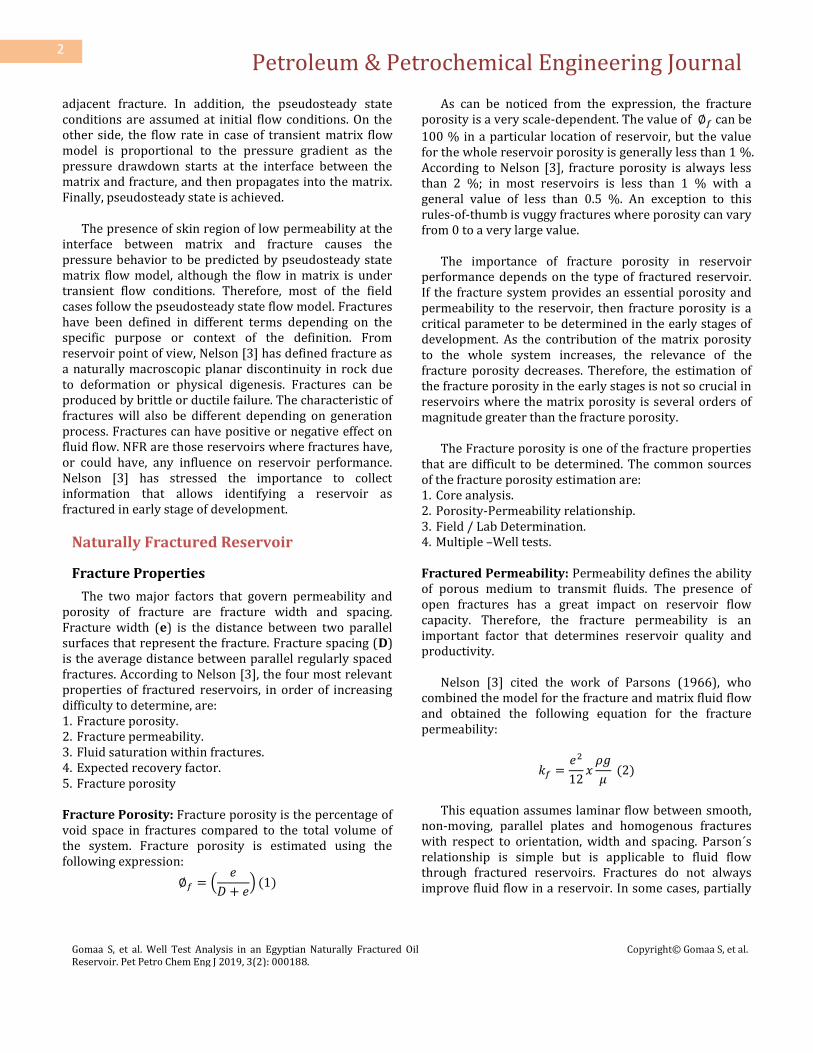
The two major factors that govern permeability and porosity of fracture are fracture width and spacing. Fracture width (e) is the distance between two parallel surfaces that represent the fracture. Fracture spacing (D) is the average distance between parallel regularly spaced fractures. According to Nelson [3], the four most relevant properties of fractured reservoirs, in order of increasing difficulty to determine, are: 1. Fracture porosity. 2. Fracture permeability. 3. Fluid saturation within fractures. 4. Expected recovery factor. 5. Fracture porosity Fracture Porosity: Fracture porosity is the percentage of void space in fractures compared to the total volume of the system. Fracture porosity is estimated using the following expression:
(
)
As can be noticed from the expression, the fracture porosity is a very scale-dependent. The value of can be
100 % in a particular location of reservoir, but the value for the whole reservoir porosity is generally less than 1 %. According to Nelson [3], fracture porosity is always less than 2 %; in most reservoirs is less than 1 % with a general value of less than 0.5 %. An exception to this rules-of-thumb is vuggy fractures where porosity can vary from 0 to a very large value.
The importance of fracture porosity in reservoir
performance depends on the type of fractured reservoir. If the fracture system provides an essential porosity and permeability to the reservoir, then fracture porosity is a critical parameter to be determined in the early stages of development. As the contribution of the matrix porosity to the whole system increases, the relevance of the fracture porosity decreases. Therefore, the estimation of the fracture porosity in the early stages is not so crucial in reservoirs where the matrix porosity is several orders of magnitude greater than the fracture porosity.
The Fracture porosity is one of the fracture properties
that are difficult to be determined. The common sources of the fracture porosity estimation are: 1. Core analysis. 2. Porosity-Permeability relationship. 3. Field / Lab Determination. 4. Multiple –Well tests. Fractured Permeability: Permeability defines the ability of porous medium to transmit fluids. The presence of open fractures has a great impact on reservoir flow capacity. Therefore, the fracture permeability is an important factor that determines reservoir quality and productivity.
Nelson [3] cited the work of Parsons (1966), who combined the model for the fracture and matrix fluid flow and obtained the following equation for the fracture permeability:
This equation assumes laminar flow between smooth,
non-moving, parallel plates and homogenous fractures with respect to orientation, width and spacing. Parson´s relationship is simple but is applicable to fluid flow through fractured reservoirs. Fractures do not always improve fluid flow in a reservoir. In some cases, partially

Petroleum & Petrochemical Engineering Journal
Gomaa S, et al. Well Test Analysis in an Egyptian Naturally Fractured Oil Reservoir. Pet Petro Chem Eng J 2019, 3(2): 000188.
Copyright© Gomaa S, et al.
3
or total filled fractures can act as flow barriers. The effect of the fractures on the permeability depends on several factors such as morphology, orientation, and others.
Fracture width and permeability are difficult to
determine from direct sources such as core data or laboratory test. Well test analysis is the most common source of the fracture permeability information.
Classification of Fractured Reservoirs
Fractured reservoirs can be classified into: - 1) Fractures provide the essential reservoir porosity and
permeability. 2) Fractures provide the essential reservoir permeability. 3) Fractures assist permeability in an already producible
reservoir. 4) Fractures provide no additional porosity or
permeability but create significant reservoir anisotropy, such as barriers to flow.
As shown in Figure 1, the effect of fractures is of paramount importance for type I reservoir, decreases for type II and so on. In the same way, the importance of the proper characterization of porosity and permeability changes with the reservoir type.
Figure 1: Schematic plot of fracture porosity and permeability percentage for four fractured reservoir types, (After Nelson [3]).
Models of Well Test Analysis in Naturally Fractured Reservoir
In naturally fractured reservoirs, several sophisticated models were developed to describe the pressure response in dual porosity system. This section reviews the analytical and numerical models concerning well test analysis in this type of reservoirs.
The discovery of the first fractured reservoir was in 1880, according to Hubbert and Willis [4]. At this time, the well test methods were not used yet, they were first applied to homogenous reservoirs in 1950. One of the most useful methods to analyze well test data is presented by Horner [5]. His method is based on plotting bottom hole shut-in pressure versus ( / on a semi-log plot. Where the flowing is time prior to
shut-in and is the shut-in period. The slope calculated from the semi-log plot can be used to calculate the permeability thickness product of the formation. Baker Model: Baker [6] used the limestone formation in the Middle East. He assumed that the reservoir consists of parallel plates where the fluid can flow through them. This assumption was based on the model given by lamb [7], Muskat [8], and Huitt [9]. The equation used was:
(3)
The equation is valid only for steady state flow. Warren and Root Model: Warren and Root Model [10] presented a modified model for naturally fractured reservoirs. They considered that the reservoir has both primary and secondary porosity. In addition, they defined the fissured reservoir by two new parameters: (1) the relative storativity , which is defined as the ratio of porosity-compressibility product of the fractures to the total system porosity-compressibility product, given as follows:
(4)
And (2) the Interporosity flow parameter, , is defined by the dimensionless matrix/fracture permeability ratio:
𝜆
(5)
Where the shape factor , depends on the type of geometry of the matrix block (horizontal slap, rectangular cylinders, or spherical matrix block).
In case of =1 and 𝜆= , Warren and Root model can represent homogenous reservoir which is considered as a limiting case in their model.

Petroleum & Petrochemical Engineering Journal
Gomaa S, et al. Well Test Analysis in an Egyptian Naturally Fractured Oil Reservoir. Pet Petro Chem Eng J 2019, 3(2): 000188.
Copyright© Gomaa S, et al.
4
Warren and Root [10] model is based on the following assumptions: 1. The rock matrix is homogeneous and isotropic, and is
contained within a systematic array of identical, rectangular parallelepipeds.
2. An orthogonal system of continuous, uniform fractures surrounding the matrix blocks contains the secondary porosity
3. Flow occurs between the matrix blocks (primary porosity) and the fractures (secondary porosity), then from the fracture network to the wellbore.
Sugar Cube Model: The Sugar Cube Model is based on the first two assumptions of Warren and Root model. This model considered the idealized representation of the fractured formation as shown in Figure 2.
Figure 2: Ideal model for a natural fractured reservoir (after Warren and Root [10] ).
The slightly compressible radial flow equation that
describes the flow in fractures can be expressed as:
(
)
(6)
The pseudosteady flow in matrix block can be written as:
( ) (7)
The porosity and permeability values are calculated
with respect to bulk properties. The reservoir is infinite acting and producing at a constant rate.
Equations (6) and (7) can be expressed in
dimensionless form as:
(
)
(8)
(1-
( ) (9)
The solution is obtained by transforming the governing equations to Laplace space and approximating the modified Bessel function:
( (
) (
))
(10) Warren and Root [10] Model found that buildup pressure response exhibits two semi log straight lines, Figure 3.
The first straight line corresponds to the transient flow in the fracture media, and the second to the transient flow in the total system. The slopes of those lines are related to the flow capacity of the formation. The vertical separation of the two lines is related to the relative storage capacity of the fracture. They also defined two parameters describing the pressure behavior in a fractured system. The first parameter is storativity ratio which is the ratio of fractured storage capacity to the total storage capacity of the system. The second parameter is interporosity flow coefficient which governs the flow form the matrix to the fracture and is related to the heterogeneity of the system.
Figure 4 shows the effect of different values of . As
decreases, the fracture depletes faster and that results in a shorter early straight line.
The effect of various values of 𝜆 is shown in Figure 5.
As 𝜆 decreases, the transfer of fluid from the matrix to the fracture becomes limited and consequently a delay in the pressure plateau.
Figure 3: Semi log plot for pressure response in NFR.

Petroleum & Petrochemical Engineering Journal
Gomaa S, et al. Well Test Analysis in an Egyptian Naturally Fractured Oil Reservoir. Pet Petro Chem Eng J 2019, 3(2): 000188.
Copyright© Gomaa S, et al.
5
Small 𝜆 values are resulted from: (1) a large contrast between fracture and matrix permeability’s with a constant (shape factor), or (2) increasing matrix block sizes with a constant permeability ratio.
During early times, the pressure response is
dominated totally by the fracture system behavior; Equation (10) is reduced to:
( (
)) (11)
When the reservoir behaves as homogeneous system Equation (11) can be approximated as:
(12)
Figure 4: Effect of storativity ratio on the pressure response with pseudosteady state Interporosity flow. λ= .
A plot of versus log of the flowing time can give the fracture permeability by calculating the slope of either
straight lines, m:
(13)
Skin can be calculated from the first time straight line by:
(
(
)
(
)) (14)
Or from the second straight line by removing log ⁄ term in Equation (14). In case of the two parallel straight lines are present, the relative storativity ratio can be calculated as follows:
(15) Where is the vertical displacement separating the two parallel lines and m is the slope of them.
Figure 5: Effect of Interporosity on the pressure response with pseudosteady state interporosity flow. ω = 0.01.
Odeh Model: Odeh [11] presented a model to analyze pressure transient tests in dual porosity reservoirs. By analyzing various pressure buildup and drawdown data, he concluded that there is no distinction between the behavior of fractured and homogeneous reservoir. Odeh [11] observed that no parallel straight lines ever appeared on the semi-log plot. This led him to conclude that there is no difference between the equations used to describe the fractured reservoir behavior and these used to describe the unsteady state behavior of homogeneous reservoir. Warren and Root [12] showed in a later publication that Odeh’s presentation is a special case in Warren and Root model. The pseudosteady state matrix flow by Warren and Root [12] has been used to analyze a large number of naturally fractured reservoirs. However, the duration of the transition period in some cases was longer and has less pressure drop. Therefore, transient matrix flow models were developed for this pressure behavior. Bourdet, et al. [13] developed a set of type curves that is used to analyze well test data from fractured reservoirs. Bourdet, et al. [14] developed another set of type curves that can be used in analyzing buildup and drawdown tests.

Petroleum & Petrochemical Engineering Journal
Gomaa S, et al. Well Test Analysis in an Egyptian Naturally Fractured Oil Reservoir. Pet Petro Chem Eng J 2019, 3(2): 000188.
Copyright© Gomaa S, et al.
6
Figure 6: Derivative type curve for double-porosity reservoir, pseudo-steady state flow.
Direct Synthesis Technique
Direct synthesis method uses a log-log plot of pressure and pressure derivative data versus time to calculate various reservoirs and well parameters. It uses the pressure derivative technique to identify reservoir heterogeneities. In this method, the values of intersection points, the slopes, and the beginning and ending times of various flow regimes from the log-log plot can be used in analytical equations to calculate the different parameters. High accuracy pressure gauges are needed to make this method reliable. Engler and Tiab [15] developed direct synthesis method to analyze pressure transient tests in dual porosity formation without using type curve matching. They used analytical and empirical correlations to calculate the naturally fractured reservoir parameters. Advantages of using the direct synthesis technique are: 1. Accurate results of reservoir and well parameters. 2. Independent verification is frequently possible from a
third unique point. 3. Very useful when not all flow regimes are observed.
The direct synthesis was applied to different models
such as; homogeneous reservoir with skin and wellbore storage [16] and to fractured reservoir in closed systems [17].
Field Description
This study is conducted on an X field which extends over 7500 acre. The reservoir is a naturally fractured reservoir (Carbonate rock) and is characterized by a heterogeneous distribution of porosity and permeability.
The reservoir has low porosity and low permeability matrix blocks surrounded by a tortuous, highly permeable fracture network. As a result, the overall fluid flow in the reservoir strongly depends on the flow properties of the fracture network.
The rservoir has variable thicknesses generally
between 60 to 250 ft and it consists of dolomite, and some silt. the reservoir boundary is a closed system, constant compressibility. This reservoir has a crude oil of API gravity and average GOR of 332 SCF/STB. The initial reservoir pressure was 4840 psi and the bubble point pressure is 1536.943 psi, The other reservoir and fluid properties are shown in Table 1. Table 1 presents the main reservoir characteristics.
Well Vertical well Wellbore radius, ft 0.35
Gauge depth,ft 11099 Net pay thickness, ft 60
Porosity, % 10 Water saturation, % 10.3
Compressibility, Formation temperature, 218
Reservoir pressure, psi 4840 API 34.8
Sp.gr 0.88
Table 1: Main reservoir characteristics. Pressure and temperature profiles and the rate schedule are shown in Figures 7 and 8.
Figure 7: Pressure and temperature profiles.

Petroleum & Petrochemical Engineering Journal
Gomaa S, et al. Well Test Analysis in an Egyptian Naturally Fractured Oil Reservoir. Pet Petro Chem Eng J 2019, 3(2): 000188.
Copyright© Gomaa S, et al.
7
Before the buildup test, the well is allowed to produce at a rate of 4052 BOPD for 11 hrs. After that, the well was shut in for a 24 hrs to allow the pressure to build-up.
Then the well was open to flow at a rate of 9010 BOPD
for 3 hrs. Then, the flow rate was reduced to 8333 BOPD for 3 hrs.
Then, the flow rate was reduced to 990 BOPD for 5.5
hrs, for PVT sampling. The second draw-down was at a rate of 3809 BOPD on a choke size 32/ for 19.5 hrs.
Figure 8: Rate schedule history used in test.
Results and Discussions
This section illustrates the results of applying the three techniques on different cases to analyze the naturally fractured reservoirs. First, the conventional semi-log analysis is applied, if it is possible. Then, the direct synthesis technique results are presented using the developed computer program. Finally, Type curve matching and automatic matching were used to analysis the performance of the subject reservoirs.
First Draw-Down Period
After running the software, the first step is to import data by entering the pressure data and rate schedule of the test to plot pressure and rate versus time as shown in Figure 9. The second step is the data preparation by entering the well, reservoir and fluid properties mentioned above.
Figure 9: The first draw-down period.
The third step is to analyze the data as shown in Figure 10. This figure shows the combined log-log plot of pressure difference and its derivative versus time for a dual – porosity system. The derivative plot shows a ''minimum'' or a ''dip'' on the pressure-derivative curve caused by the interporosity flow during the transition period. The ''minimum'' is between two horizontal lines; the first represents the radial flow Controlled by the fissures, and the second describes the combined behavior of the double porosity system.
Figure 10: log-log plot of pressure difference and its derivative versus time.
At early time, the typical behavior of wellbore storage effects with the deviation from the 45° straight line to a maximum depicts wellbore damage.

Petroleum & Petrochemical Engineering Journal
Gomaa S, et al. Well Test Analysis in an Egyptian Naturally Fractured Oil Reservoir. Pet Petro Chem Eng J 2019, 3(2): 000188.
Copyright© Gomaa S, et al.
8
Conventional Semi-Log Analysis
The semi log plot yields an S – shape curve with two parallel straight lines as shown in Figure 11. The two separate straight lines indicate that the double porosity nature of the reservoir.
Secondary porosity (fissures), having greater
transmissivity and being connected to the wellbore, respond first as described by the first semi log straight line which reflects the transient radial flow through the fractures, and thus its slope is used to determine the system permeability-thickness product.
However, because the fracture storage is small, the
fluid in the fracture is quickly depleted with a combined pressure decline in the fractures due to production. This pressure drop in the fracture allows more fluid to flow from the matrix into the fractures, which causes a slowdown in the pressure decline rate.
The matrix starts to discharge the fluid into the
fracture through the ''minimum'' or the transition zone, until the pressure is stabilized in the two systems and yield the second semilog straight line.
Figure 11: Conventional semi log plot.
As for the drawdown, wellbore storage effects may obscure the first semilog straight line.
If both semi log straight lines are developed, the permeability–thickness product and the other reservoir parameters can be determined.
Storativity ratio and interporosity flow coefficient are
estimated from the slope m of either straight line.
Table 2 represents the results obtained from the conventional semi-log analysis.
,md 272.078
0.07532 S -2.4496
Table 2: semi-log analysis results.
Direct Synthesis Technique
The pressure difference and its derivative curves are shown on Figure 12 with the characteristic point From the plot: 7.13 psi 0.13hrs. 0.051 hrs 0.97 0.037 hrs 1.3hrs. 160.2psi 17.97 psi Where and stand for the early (fracture) and late (total system) radial flow. is the end time of the early radial flow line, and is the beginning time of the late radial flow line. The log-log plot shows a unique behavior of a naturally fractured reservoir. Different reservoir parameters can be calculated by direct synthesis technique.
The fracture permeability can be calculated from the early and late radial flow lines:
Two methods were applied to calculate the storativity coefficient (ω): From minimum to radial pressure derivative ratio:
(
) (
)
(
) (
)
From minimum, early radial, or radial time ratio:
(
) (
)
(
) (
)

Petroleum & Petrochemical Engineering Journal
Gomaa S, et al. Well Test Analysis in an Egyptian Naturally Fractured Oil Reservoir. Pet Petro Chem Eng J 2019, 3(2): 000188.
Copyright© Gomaa S, et al.
9
Four methods were employed to determine the interporosity flow coefficient parameter (λ): From the characteristic times:
⁄
(
)
Figure 12: Pressure difference and its derivative plot. From the minimum coordinates:
(
)
(
)
The skin factor is calculated from a convenient point during early or late radial flow period: From the early time pressure and pressure derivative data:
[(
)
(
) ]
*
(
) +
= -3.21
From the late time pressure and pressure derivative data:
[(
)
(
) ]
*
(
) + -2.8
256.2
0.148 S -2.8
Table 3: presents the results of analyzing well test data from naturally fracture reservoir by the developed program based on direct synthesis technique.
Type Curve Matching Analysis
The third method used to analyze the naturally fractured reservoirs is the type curve matching as shown in Figure 13 which involves a log–log plot of the derivative of the pressure with respect to time versus elapsed time.
Table 4 presents the results which are obtained from
the type curve matching analysis.
279.90
0.001 S -2.665
Table 4: Type curve matching analysis result.
Figure 13: Type curve analysis.

Petroleum & Petrochemical Engineering Journal
Gomaa S, et al. Well Test Analysis in an Egyptian Naturally Fractured Oil Reservoir. Pet Petro Chem Eng J 2019, 3(2): 000188.
Copyright© Gomaa S, et al.
10
Commercial Software Matching
A commercial software (Pan-System) was used for analyzing well test data from naturally fractured reservoir. Figure 14 depicts that the response of pressure build-up and its derivative for the well is divided into six periods. Period (1): this is a unit-slope region which indicates the wellbore storage (WBS) impact. It should be noted that the WBS effect lasts for only 0.01 hour assuming negligible (or controlled) WBS period due to the low compressibility of the crude.
This should be confirmed and assured by utilizing down-hole shut-in tool (DHST) to mitigate the WBS impact. In this case, a slight change in the pressure derivative trend would be expected.
Figure 14: Typical pressure derivative and its periods. DHST is very important to avoid masking of later periods. Period (2): this is the skin hump period. It will be analyzed to estimate the skin factor (S) (which is related to damaged zone or stimulated zone). Period (3): this period refers to zero slope line which reflects the radial flow in the fracture. From this period, permeability and reservoir pressure can be estimate. Period (4): This period can be considered as an extension of IAFR period. The presence of the dual-porosity system ( ) can be detected from this period. This period may (or may not) exist based on the nature of rock petrography and pores-system of the formation.
This period is called the minimum and at which the
interflow occurs between the fracture and the matrix. From this period, the main important two factors which describe the fluid flow and behavior of dual porosity system can be estimated.
The first parameter is the storativity ratio ( ) which describes the fracture porosity as a percentage of the matrix porosity. The duration and depth of the depression are linked by the value of ω; a small value produces a long and therefore deep transition. The second parameter is the interporosity flow coefficient ( ) which describes the fluid transfer between the matrix and fractures, and defines the position of the time axis of the transition regime. Period (5): it represents the homogenous behavior of both media when recharge from the least permeable medium (matrix) is fully established and pressure is equalized. Period (6): it represents the effect of boundary condition which is a closed system (unit slope on the pressure derivative). From this period, the distance to boundary and drainage area can be calculated. Table 5 presents the model selected from the commercial software.
Model option Standard model Well Vertical
Flow regime PSS Reservoir dual porosity Boundary Closed system
Table 5: The model selected from the software. Table 6 presents the main model parameters.
0.018 2596.79
⁄ 322.813
263.869
15832.14 -2.5973
Table 6: Main model parameter (Case 1).
Table 7 presents the reservoir and boundary parameters.
,

Petroleum & Petrochemical Engineering Journal
Gomaa S, et al. Well Test Analysis in an Egyptian Naturally Fractured Oil Reservoir. Pet Petro Chem Eng J 2019, 3(2): 000188.
Copyright© Gomaa S, et al.
11
0.083
104.171
4821.56
-90.573 1715.814
1.4002 30.8815 1065.09
Table 7: Reservoir and boundary parameters.
The standard model is selected as a dual porosity pseudo steady state to the reservoir due to a transformation between the least permeable media (matrix) and the high permeable media (fissures), and it is mathematically equivalent to the pseudo steady-state solution, i.e., the Warren and Root model, and selected as closed system for the reservoir boundary.
After setting the model, the main model parameters
can be obtained. These are wellbore storage coefficient, skin factor, storativity ratio, interporosity flow coefficient and permeability thickness product. Wellbore Storage Coefficient ( ) which is very small value due to using down-hole shut-in tool ( ) which is necessary to mitigate wellbore storage ( ) effect and hence obtaining valuable pressure curve. Skin Factor has a value of -2.5973 which indicates that there is no damage around the wellbore (i.e., stimulation process is successful). Permeability-Thickness Product (kh) has a value of 15832.14 md.ft. This is very high value due to the higher permeability of the fracture.
One of the well test analysis results is the initial reservoir pressure ( ), which has a value of 4821 psi, is necessary for estimating the productivity index (P.I) and inflow performance relationship (IPR). Pressure drop due to Skin ( ), which equal to -90.573 psi, is a small value caused by lower value of skin effect (S). This means that there is no additional pressure drop due to damage of the formation around the wellbore which will give a higher production rate and higher productivity index.
Storativity Ratio (ω) is related to the fracture porosity. A typical range of ω is from 0.1 to 0.001. In this work the value of ω is 0.0832 which means that the value of ω in this reservoir is a small value as compared to the typical one, i.e., large and deep transition period. This is because the fracture porosity is low as compared to the matrix porosity which takes small time to deplete the fracture due to lower porosity.
The pressure drop in the fracture which permits the matrix to discharge flow in to the fracture and the pressure stabilization occurs slowly (the duration and depth of the depression are linked by the value of ω).
By assuming that the fracture compressibility is equal
to the matrix compressibility, the fracture porosity can easily be obtained from storativity ratio using the following equation:
(
)
(
)
So, the storativity ratio is very important in understanding the performance of the dual porosity system and in finding the fracture porosity. Interporosity Flow Coefficient (λ) is related to the fracture permeability. In this case the value of λ is . This means that higher value of interporosity flow coefficient moves the dipression to the left side of the plot. This is clearly shown in Figure 14.
This occurs because the lower the value of λ, the lower the value of matrix permeability as compared to the fracture permeability which leads to delay the minimum from disappears and moves to the right of the plot.
The Interporosity flow coefficient λ value defining the position of the time axis of the transition regime. As shown on Figure 14, the shape of the ''minimum'' takes a ''U – shape'' and this is due to a non-restricted interporosity flow coefficient (i.e., there is a low skin between the matrix face and the fracture). The fluid flows from the matrix system into the fractures under pseudo –steady-state conditions with the fracture acting like conduits to the wellbore (i.e., Warrenn and Root model). Distance to Boundary (L) which has a value of 1065.09 ft., effects on the pressure derivative curve. For the case under steady, the OOIP has a value of 3.684MMSTB, and
Petroleum & Petrochemical Engineering Journal
Gomaa S, et al. Well Test Analysis in an Egyptian Naturally Fractured Oil Reservoir. Pet Petro Chem Eng J 2019, 3(2): 000188.
Copyright© Gomaa S, et al.
12
the drainage area has a value of 104.171-acres. It should be noted that the test time should be long enough to reach the boundary of the reservoir.
Table 8 shows a comparison among the three techniques used in analyzing well test data in naturally fractured reservoirs.
The results show that, conventional semi-log
technique gives an accurate permeability only, and type curve matching gives inaccurate matching during the transition period and leads to erroneous values of . The direct synthesis gives accurate results of nearly all the reservoir parameters except permeability.
parameter Conventional semi-log Direct synthesis technique Type curve matching
272.078 256.2 279.9
0.075 0.148 0.001 -2.449 -2.8 -2.66
Table 8: Comparison of results.
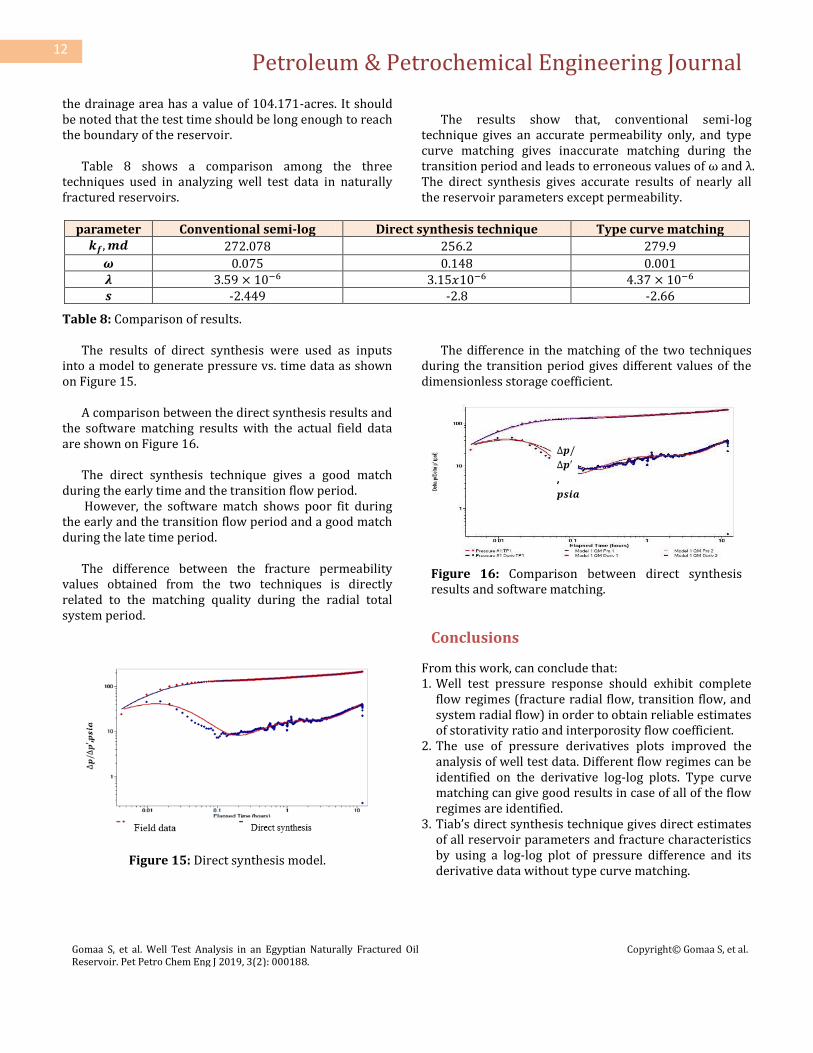
The results of direct synthesis were used as inputs into a model to generate pressure vs. time data as shown on Figure 15.
A comparison between the direct synthesis results and
the software matching results with the actual field data are shown on Figure 16.
The direct synthesis technique gives a good match
during the early time and the transition flow period. However, the software match shows poor fit during
the early and the transition flow period and a good match during the late time period.
The difference between the fracture permeability
values obtained from the two techniques is directly related to the matching quality during the radial total system period.
Figure 15: Direct synthesis model.
The difference in the matching of the two techniques during the transition period gives different values of the dimensionless storage coefficient.
Figure 16: Comparison between direct synthesis results and software matching.
Conclusions
From this work, can conclude that: 1. Well test pressure response should exhibit complete
flow regimes (fracture radial flow, transition flow, and system radial flow) in order to obtain reliable estimates of storativity ratio and interporosity flow coefficient.
2. The use of pressure derivatives plots improved the analysis of well test data. Different flow regimes can be identified on the derivative log-log plots. Type curve matching can give good results in case of all of the flow regimes are identified.
3. Tiab’s direct synthesis technique gives direct estimates of all reservoir parameters and fracture characteristics by using a log-log plot of pressure difference and its derivative data without type curve matching.
Software
matching
,

Petroleum & Petrochemical Engineering Journal
Gomaa S, et al. Well Test Analysis in an Egyptian Naturally Fractured Oil Reservoir. Pet Petro Chem Eng J 2019, 3(2): 000188.
Copyright© Gomaa S, et al.
13
4. In case of high wellbore storage, the conventional semi-log analysis gives inaccurate results and not all naturally fractured reservoir parameters can be estimated.
5. The developed computer program gives accurate results as compared to commercial software matching, conventional semi-log analysis, and the type curve matching.
6. Interporosity flow coefficient obtained from well test analysis can also be used to estimate the fracture permeability provided that the shape factor and the matrix permeability values are known.
7. When all flow regimes are not identified, type curve matching gives incorrect reservoir and fracture parameters. However, the direct synthesis technique gives an accurate result of the naturally fractured reservoir parameters and fracture properties.
Nomenclature
A Area, AOFP Absolute open flowing potential,
B Formation volume factor, res C Wellbore storage coefficient, Shape factor
Total compressibility, Dimensionless wellbore storage
DHST Down-Hole Shutting Tool
Pressure drop due to skin,
F.E Flow efficiency GOR Gas Oil Ratio,
h Total formation thickness, IPR Inflow performance relationship
Productivity index, Fracture permeability,
Permeability-thickness product, Matrix permeability,
L Distant to boundary, Fracture spacing,
NP Cumulative oil production, OOIP Original oil in place,
p Pressure, Dimensionless pressure Dimensionless bottom-hole pressure
Initial pressure, Bottom-hole flowing pressure,
Dimensionless pressure derivative
Dimensionless bottom-hole pressure derivative
Pressure difference, Pressure difference derivative, Total flow rate, Reservoir outer radius, Wellbore radius, S Skin factor T Test time, Dimensionless time
WOR Water oil ratio

Petroleum & Petrochemical Engineering Journal
Gomaa S, et al. Well Test Analysis in an Egyptian Naturally Fractured Oil Reservoir. Pet Petro Chem Eng J 2019, 3(2): 000188.
Copyright© Gomaa S, et al.
14
Fracture width,
ω Dimensionless storage coefficient λ Interporosity flow coefficient Natural fracture density,
µ Viscosity, Porosity
References
1. Ahmed T (2010) Reservoir Engineering Handbook. 4th(Edn.), Gulf Professional Publishing, Amsterdam, pp: 1472.
2. Chaudhry AU (2004) Oil Well Testing Handbook. Gulf Professional Publishing/Elsevier, Houston, Texas, pp: 525.
3. Nelson RA (2001) Geologic analysis of naturally fractured reservoir. 2nd(Edn.), Gulf professional Publishing, Woburn, MA, pp: 352.
4. Hubbert MK, Wills DG (1955) Important Fractured Reservoirs in the United States. 4th World Petroleum Congress, World Petroleum Congress, Italy, pp: 58-81.
5. Horner DR (1951) Pressure Build-up in Wells. 3rd World Petroleum Congress, World Petroleum Congress, Netherlands, pp: 19.
6. Baker WJ (1955) Flow in Fissured Formation. 4th World Petroleum Congress, World Petroleum Congress, Italy, pp: 379-393.
7. Lamb H (1932) Hydrodynamics. 6th(Edn.), Dover Publications, New York,.
8. Muskat M (1937) The Flow of Homogeneous Fluids through Porous Media. McGraw-Hill, New York, New York.
9. Huitt JL (1956) Fluid Flow in Simulated Fractures. Am Inst Chem Eng J 2(2): 259-264.
10. Warren JE, Root PJ (1963) The Behavior of Naturally Fractured Reservoirs. Soc Pet Eng J 3(3): 245-255.
11. Odeh AA (1965) Unsteady-state Behavior of Naturally Fracture Reservoirs. Soc Pet Eng J 5(1): 60-66.
12. Warren JE, Root PJ (1965) Discussion of Unsteady- state Behavior of Naturally Fractured Reservoirs. Soc Pet Eng J pp: 64.
13. Bourdet D, Ayoub JA, Pirard YM, Knlazeff V (1983) Interpreting Well Tests in Fractured Reservoirs World Oil 5(5): 77-87.
14. Bourdet D, Alagoa A, Ayoub JA, Pirard YM (1984) New Type Curves Aid Analysis of Fissured Zone Well Tests. World Oil, pp: 111-125.
15. Engler T, Tiab (1996) Analysis of Pressure and Pressure Derivative without type-curve matching, 5. Horizontal well tests in naturally fractured reservoirs. Journal of Petroleum Science and Engineering 15(2-4): 139-151.