well being, poverty, ethnicity.pdf
TRANSCRIPT

Subjective Well-Being, Poverty and Ethnicity in South Africa: Insights from an ExploratoryAnalysisAuthor(s): Daniel F. NeffSource: Social Indicators Research, Vol. 80, No. 2 (Jan., 2007), pp. 313-341Published by: SpringerStable URL: http://www.jstor.org/stable/27734538 .
Accessed: 23/03/2013 18:13
Your use of the JSTOR archive indicates your acceptance of the Terms & Conditions of Use, available at .http://www.jstor.org/page/info/about/policies/terms.jsp
.JSTOR is a not-for-profit service that helps scholars, researchers, and students discover, use, and build upon a wide range ofcontent in a trusted digital archive. We use information technology and tools to increase productivity and facilitate new formsof scholarship. For more information about JSTOR, please contact [email protected].
.
Springer is collaborating with JSTOR to digitize, preserve and extend access to Social Indicators Research.
http://www.jstor.org
This content downloaded from 129.128.216.34 on Sat, 23 Mar 2013 18:13:07 PMAll use subject to JSTOR Terms and Conditions
Social Indicators Research (2007) 80: 313-341 ? Springer 2006
DOI 10.1007/sll205-005-5920-x
DANIEL F. NEFF
SUBJECTIVE WELL-BEING, POVERTY AND ETHNICITY
IN SOUTH AFRICA: INSIGHTS FROM AN EXPLORATORY
ANALYSIS*
(Accepted 12 December 2005)
ABSTRACT. South Africa has one of the highest inequality levels in the world. In 1993, nearly half of the population were considered poor. These poverty and inequality levels were and still
are a legacy of South Africa's colonial and apartheid past. Since the end of apartheid, there has
been a strong governmental effort to combat poverty and in this light a 'social indicators
movement' has emerged. The aim of this article is to contribute to the South African social
indicators research in three ways: Firstly, this article introduces ethnicity as a unit of analysis in
the context of poverty and well-being. It is argued that racial categorisations are not justifiable and in the case of South Africa hide valuable insights. The results of an exploratory analysis
suggest that ethnicity allows a more insightful analysis of poverty and well-being than race.
Secondly, this article introduces a multiple correspondence analysis (MCA) in the context of
subjective well-being research. Many studies regarding subjective well-being in South Africa use
ordered probit regression models. It is argued here that these models are based on false
assumptions and that a MCA can be seen as a suitable alternative since it constitutes an
assumption free model. Lastly, the insights gained from the exploratory analysis are discussed.
The MCA seems to show that subjective well-being can be regarded as an outcome measure.
Furthermore, it is argued that there are cultural differences (between the ethnic groups)
regarding subjective well-being. It seems that the ethnic groups in South Africa have different
conceptions of well-being and that different factors influence their subjective well-being assessments.
KEY WORDS: multiple correspondence analysis, poverty, South Africa, subjective well-being
1. INTRODUCTION
In international comparisons South Africa is ranked by the World Bank as
an upper-middle-income country (World Bank, 2005)l. However it is esti
mated that South Africa has one of the highest inequality levels in the world.
This work is partly based on a Master thesis from 2004 at the Institute for Development
Policy and Management at the University of Manchester. I am grateful for the intellectual
guidance, the constant support and encouragement by Wendy Olsen and for the comments on
earlier drafts from Peter Edward, David A. Clark and two anonymous reviewers.
This content downloaded from 129.128.216.34 on Sat, 23 Mar 2013 18:13:07 PMAll use subject to JSTOR Terms and Conditions
314 DANIEL F. NEFF
Indications in 1993 were that approximately half of the population could be
considered poor, receiving together just 11 % of South Africa's total annual
income, whereas the richest 7% of the population received over 40% of the
country's income2 (May et al., 2000; SAHDR, 2003). Although during the
early 1990's apartheid was brought to an end, this high level of inequality is
still persistent and must be seen as a legacy of South Africa's colonial and
apartheid past (see Ross, 1999; Glaser, 2001; Aliber 2003)3. After the end of apartheid, the newly elected democratic South African
government planned to combat poverty. Therefore accurate information
about the extent and severity of poverty was needed. During apartheid rule
official statistics did not cover the whole of South Africa and did not pro duce representative household surveys, so no accurate picture of poverty existed until 1993/1994. For example, four of the poorest so-called 'home
lands' were excluded where approximately 20% of South Africa's popula tion and 30% of the poor live had been living (Klasen, 1997). This study is
based on the first nationally representative household income and living standards survey of South Africa (see Carter and May, 1999) which covered
all South African communities (PSLSD, 1994).4 Since the political change to democracy there has been an increase of
quantitative surveys, and a growing number of scholars are researching social indicators for South Africa in what M?ller (1997, p. 1) terms a 'social
indicators movement'. This paper tries to contribute to the social indicators
debate by firstly arguing that language might be an important basis for
understanding the diverse nature of South Africa's population. It is sug
gested that race, as a widely used unit of analysis in quantitative social
science, is imperfect and that ethnicity needs to be broken down further
before it can be useful. In this study it will be pointed out that combining
language with the existing racial categories can be a better basis for
understanding the diversity among the racial groups. This ethnic breakdown
helps to understand inter-ethnic differences in poverty or well-being. Fur
thermore, this study proposes an exploratory analysis technique for ordinal
data called multiple correspondence analysis which is seen as a useful
alternative to regression models. This technique allows one to explore the
inter-ethnic differences in poverty or well-being.
1.1. Aim of Research
The aim of this research is twofold. Firstly, looking at the case of South
Africa, this paper explores the extent to which an ethnic classification could
represent a better alternative unit of analysis than race, especially regarding
This content downloaded from 129.128.216.34 on Sat, 23 Mar 2013 18:13:07 PMAll use subject to JSTOR Terms and Conditions

SUBJECTIVE WELL-BEING, POVERTY AND ETHNICITY IN SOUTH AFRICA 315
poverty or inequality analysis. Research suggests (e.g. Stanfield, 1993) that
racial categorisations are not justifiable since racial groups do not form
homogeneous groups. Lester et al. (2000) argue that in South Africa (as well as in other countries), social and political power was used to artificially construct and reconstruct 'race'. They point to the example of the practice of
annual reclassifications during the apartheid period, where each year hun
dreds of individuals successfully applied to be reclassified to a different
distinct social (racial) group. Due to this constructed nature of race, eth
nicity will be used as a unit of analysis derived from the combination of race
and language which is regarded as a more valid categorisation. It will then
compare how these ethnic groupings perform with respect to poverty and
well-being (namely expenditure poverty, capability poverty and subjective
well-being) vis-?-vis the racial categorisation5. Are there differences in
poverty levels between the racial groups (inter-racial), or inside the racial
groups (intra-racial), and are they differentiated according to ethnicity? This
question will be explored with the use of simple mean scores of these three
poverty measures. Secondly, this paper introduces a multiple correspon dence analysis, arguing that it is a suitable alternative to common analysis
techniques (i.e. ordered probit regression) since it is not based on weak
model assumptions. With the help of this technique it will be argued that
apart from intra-racial differences, intra-ethnic differences also exist. Lastly, the findings of the exploratory analysis are discussed and the insights gained in respect to existing research are summarised.
2. POVERTY/WELL-BEING MEASURES
The measures selected for this study are two poverty measures (monetary
poverty and capability poverty) and one subjective well-being measure (life
satisfaction). Monetary well-being is based on the idea that someone has
command over adequate income to meet minimal consumption require ments for human welfare, whereas the capability approach views poverty as
a function of the lack of individual capabilities to achieve a basic level of human well-being (Wagle, 2002). Subjective well-being reflects the cognitive evaluation of one's life and is therefore to be regarded as the broadest
concept, since it is not restricted to just one dimension (income or expen diture - as in the monetary approach) or several dimensions (like health, education and income - as in the capability approach) but is open to all the
dimensions the individual is incorporating for its evaluation. The terms
This content downloaded from 129.128.216.34 on Sat, 23 Mar 2013 18:13:07 PMAll use subject to JSTOR Terms and Conditions

316 DANIEL F. NEFF
poverty and well-being are used interchangeably, in the sense that it is
assumed that the absence of poverty constitutes well-being.
2.1. Monetary Poverty
Monetary approaches represent the most widely used poverty measures and
have been pioneered by economists. In general, economists perceive poverty as a lack of resources relative to needs, whereby it is assumed that con
sumption or income are good proxies for needed consumables like food or
clothing. Economists value this approach because it is compatible with the
utility maximising behaviour assumption which represents the foundation of
microeconomics. It is widely assumed that the utility maximising behaviour
is reflected in expenditure which in turn reflects the marginal value or utility
people place on commodities (Ruggeri Laderchi et al., 2003). The basic
premise the monetary approach rests on is that uniform monetary metrics can take into account the relevant heterogeneity across individuals and their
situations. Therefore one single indicator like income or consumption is
believed to be sufficient to measure individual well-being. Poverty is there
fore identified as a shortfall of income or expenditure from some pre-defined
poverty line. These poverty lines are distinguished according to whether they are 'relative' or 'absolute'.
Relative deprivation has to be understood as the poverty of individuals
relative to others in the society in which they function. In other words, whether or not one is poor depends not only on individual (or household)
income/consumption, but also on the income/consumption of others in
society. Therefore a person is regarded as poor, for instance, if his or her
income or consumption level is below a particular fraction of the national
average. The basic concept that the relative approach is based on is that
societies and living standards are constantly changing and, therefore poverty lines also need to change accordingly (Wagle, 2002). Further it is assumed
that societies differ and therefore a single absolute poverty line cannot be
applied for all societies but has to be relative to the living standards of that
particular society. Nevertheless relative poverty approaches cannot avoid
defining a poverty line, which is expressed as a certain percentage of the
median or mean income or expenditure level of the social reference group.
Compared to the median, the mean is regarded as imperfect, because
changes of income of the richest persons affect the poverty line, whereas the
median stays unaffected. Although a consensus is lacking, relative poverty thresholds are usually set at either 40, 50, or 60% of mean or median income
(Jesuit and Smeeding, 2002). In general, relative poverty measures are
This content downloaded from 129.128.216.34 on Sat, 23 Mar 2013 18:13:07 PMAll use subject to JSTOR Terms and Conditions

SUBJECTIVE WELL-BEING, POVERTY AND ETHNICITY IN SOUTH AFRICA 317
criticised for not reflecting the well-being of those who are poor. It is argued that a person might be relatively poor but this is not necessarily mean that
he or she is absolutely poor. For example there might be an improvement in
relative poverty while absolute poverty is increasing or vice versa. Another
problem with the relative poverty concept is that it is not clear what an
improvement in relative poverty indicates (Blackwood and Lynch, 1993). Therefore the application of a relative poverty line in a time-series study
might be limited.
In contrast, absolute poverty has to be understood as the deprivation of
individuals relative to some predetermined poverty line which is for
example defined as a market-priced basket of goods and services com
prising the basic commodities essential to meet one's own or one's fam
ily's basic or minimum requirements which are proxied through income or
consumption. The inherent problem of defining basic means of survival is
that this always involves arbitrary standards due to the fact that the issue
of survival is immediately related to the quality of survival (Wagle, 2002). For example, basic means could be defined in a way that an individual is
able to survive in a medical sense, but that might imply that his quality of
life is severely restricted. Despite this problem, poverty has been defined
in terms of some survival criteria, expressed in a poverty line. This
poverty threshold implies that there is some form of difference between
the poor and the non-poor which can be represented through a poverty line.
Recent research in chronic poverty suggests that the poor are not a
homogenous group and therefore differentiate between 'always poor',
'usually poor', 'fluctuating poor', 'occasionally poor' and 'non-poor' (see Hulme et al., 2001; Hulme and Shepherd, 2003; CPRC, 2004). Although chronic poverty is normally measured using the income and time space, scholars acknowledge that poverty 'has breadth', i.e. that poverty is multi
dimensional (Clark and Hulme, 2005, p. 3). One such multidimensional -
but purely theoretical - approach is the so-called capability approach.
2.2. Capability Poverty
The capabilities approach was introduced in the late 1970s and advanced in a series of journal papers and books by Amartya Sen (1981, 1990, 1999) and constitutes a comprehensive framework for conceptualising human
well-being and development, which is rooted in a critique of the ethical
foundations of utilitarianism (Ruggeri Laderchi et al., 2003). Sen's critique addresses the basic assumptions of rational choice or utility theory that
This content downloaded from 129.128.216.34 on Sat, 23 Mar 2013 18:13:07 PMAll use subject to JSTOR Terms and Conditions

318 DANIEL F. NEFF
equates rational behaviour with self-interested utility maximisation. Based on this critique Sen developed a theoretical framework that is grounded in
the idea that market outcomes should be judged in terms of valuable human ends and that contrary to approaches that exclusively focus on income,
expenditure and utility, places emphasis on functionings, capabilities and
freedoms, and rights. Sen (1990) understands functionings to relate to the things a person values
doing or being. They are features of a person's state of existence ranging from relatively elementary states (e.g. being adequately nourished), to more
complex personal states and activities (e.g. participation and appearing without shame). In contrast, he understands capabilities to relate to the
ability of a person to achieve different combinations of valuable beings and
doings that are within a person's reach, reflecting the opportunity or free
dom to choose a life that a person values (see Clark, 2002). In his book
'Development as Freedom' (1999) Sen expands his capability framework
integrating freedom and rights.6 These freedoms not only encompass
political liberties, access to essential services and the reduction of depriva tions, but also participation in market exchanges. The basic principle behind the capability approach is not to equalize the income of people and to
reduce monetary inequality, but to equalize the capability each has to enjoy valuable activities and states of being. Therefore Sen advocates the pro motion and expansion of valuable capabilities and equality in the space of
basic capabilities, such as cross-national life expectancy, literacy and health care (Alkire, 2002).
Basically the first7 main operationalisation of Sen's capability approach was the Human Development Index (HDI) published in the Human
Development Report (HDR) in 1990. The report defines human develop ment as a process of enlarging people's choices, whereby the 'the most
critical ones are to lead a long and healthy life, to be educated and to enjoy a
decent standard of living. Additional choices include political freedom,
guaranteed human rights and self-respect' (UNDP, 1990, p. 10). Never
theless, the HDI has to be regarded as a pragmatic approach which avoids
measuring levels of achievements (or functionings) as a measure of well
being because of the difficulties of doing so8. Instead it measures capabilities that enable one to achieve a set of functioning needed to improve or sustain a higher level of well-being. Therefore the HDI measures capabilities in terms of life expectancy, educational attainment and income. Since its
introduction the HDI has been criticised9, and although it has been modified and improved since then, it is still considered as conceptually weak (Clark, 2002, ch. 1).
This content downloaded from 129.128.216.34 on Sat, 23 Mar 2013 18:13:07 PMAll use subject to JSTOR Terms and Conditions

SUBJECTIVE WELL-BEING, POVERTY AND ETHNICITY IN SOUTH AFRICA 319
2.3. Subjective Well-being
In the literature subjective well-being is a term used to encompass different
subjective concepts or measures of the well-being, satisfaction or happiness of
individuals. Diener et al. (2004) differentiate four concepts which in their view
together constitute subjective well-being. These are negative affect, positive affect, domain satisfaction and cognitive life-satisfaction. This study will focus on the latter - the cognitive life-satisfaction - and will refer to it as subjective
well-being for simplicity. Subjective well-being is defined as the subjective measurement of the overall satisfaction with life (see Camfield, 2003). In
general it is assumed that individual satisfaction with life is a multidimensional
concept. This multidimensional concept is believed to encompass not only material achievements but also other aspects of life, such as health, love,
employment, and having children. Subjective well-being - when it is measured
- refers to a person's declared well-being and is based on a person's answer to
either a single question or a group of questions about his/her well-being
(Rojas, 2003). Therefore subjective well-being can be regarded as an outcome measure by which to judge successful living (Diener and Suh, 2000).
Contrary to the monetary and capability approaches the subjective well
being concept makes it possible to avoid defining what welfare and well
being means. By using the answers to subjective questions, individuals define
their level of welfare and well-being themselves (Ferrer-I-Carbonell, 2002). This can be seen as an advantage not only because it avoids value judge ments about the constituent components of well-being (Kingdon and
Knight, forthcoming), but also because there is no agreement on the final
definition of the quality of life. Nevertheless it is still disputed whether a
subjective well-being (or quality-of-life) approach can eventually avoid to
define the essence of a good life (see for example Kajanoja, 2002; Michalos,
2003) and furthermore it is also disputed that there is something like an
overall quality of life (Veenhoven, 2000). However, if individuals define their level of welfare and well-being
themselves, there are two main assumptions needed for a meaningful
analysis of subjective questions. Firstly, that individuals are able to evaluate their own situation; and secondly, that responses among individuals can be
compared (Ferrer-I-Carbonell, 2002). Veenhoven (2000) takes the position that individuals are able to evaluate their own situation. He argues that humans feel good or bad about particular things, whereby the mood level
signals overall adaptation, which humans can reflect on. Furthermore he
states that humans have an idea of how we have felt over the past (i.e. the
last year). Critiques argue that subjective appraisals cannot be compared
This content downloaded from 129.128.216.34 on Sat, 23 Mar 2013 18:13:07 PMAll use subject to JSTOR Terms and Conditions
320 DANIEL F. NEFF
between persons since people 'have different scales in their mind'. It is
believed that someone who reports to be 'very satisfied' may in fact be as
happy as someone who reports to be 'satisfied' which is referred to in eco
nomics as the 'theorem of incomparable utilities' (Veenhoven, 2004, p. 20). This critique is generally answered with empirical findings. Diener and
Lucas (1999) find that comparability within a given language community is
given, and Ouweneel and Veenhoven (1991) review evidence from countries
in which more than one language are spoken, showing that the subjective
well-being scores across language groups are similar. Furthermore, Veenhoven (1991) finds - contrary to Easterlin - that life-satisfaction is not
relative. A more challenging criticism of subjective well-being results from
the so-called 'satisfaction paradox' (Zapf in Olson and Schober, 1993: 173). This satisfaction-paradox refers to the state of being satisfied despite
objectively unsatisfactory living conditions. Sen (1987, 1992, 1999) con
cludes that subjective well-being measures are unreliable (especially within
the group of the poor) since poor people might adjust to and be satisfied
with their living conditions, i.e. learn to be happy. Recent research, however,
suggest that poor people do report lower global life satisfaction, but nev
ertheless report positive levels of satisfaction with life domains, especially in
the area of social relationships (see Biwas-Diener and Diener, 2001). In recent research it has been argued that quantitative approaches have to
be complemented by a multidimensional view of poverty which is qualitative and includes the subjective assessment of poor people themselves (Hulme et al., 2001). Since the basic assumptions that individuals are able to eval
uate their own situation and that their responses can be compared seem to
be supported, subjective well-being measures are seen to have useful po tential in multidimensional poverty measurements (see for example the
conceptual framework of the Well-being in developing countries project set
out in McGregor, 2004). As mentioned above, not all researchers share this
view. In a recent working paper Clark and Qizilbash (2005) state that in
their surveyed communities between 73% and 82% of respondents claimed
to be either satisfied or very satisfied, despite large prevalent capability poverty. Therefore they doubt that 'data on satisfaction levels are, on their
own, an adequate basis for evaluation the quality of life' {ibid: p. 26).
3. THE CASE OF SOUTH AFRICA
Having identified the three well-being/poverty measures used in this study, it
is important to look more precisely at the South African circumstances to
identify a possible level of analysis.
This content downloaded from 129.128.216.34 on Sat, 23 Mar 2013 18:13:07 PMAll use subject to JSTOR Terms and Conditions

SUBJECTIVE WELL-BEING, POVERTY AND ETHNICITY IN SOUTH AFRICA 321
3.1. Poverty, Race and Ethnicity in South Africa
During apartheid South Africa was dominated by the descendants of the
white colonists whose material privilege was 'legitimated and consciously understood by them as an inevitable by-product of racial difference' (Lester et al., 2000, p. 3). Today South Africa's wealth and income is unevenly distributed among ethnic groups with Anglophone whites at the top fol
lowed by Afrikaners, Indians, Coloureds and Black Africans at the bottom.
Du Toit (1998) reports an average income for whites in 1995 of around
R103 per month compared to R71 for Indians, R32 for coloureds and R23
for Africans. Due to the apartheid system most of the poor people are to be
found among the black Africans. The Project for Statistics on Living Standards and Development (PSLSD, 1994) states that 64.9% of all African
people are poor (which are 94.7% of South Africa's population (RDP,
1995), whereas 32.6% of the coloureds (5% of the total population), 2.5%
of the Indians (0.1% of the total population) and just 0.5 of the whites are
poor (0.2% of the total population).
Although most of the poverty analyses regarding South Africa use race as
a level of analysis, it is important to distinguish race from ethnicity. 'Races' are thought of as social groups with distinct physical features, such as South
African whites, Africans, coloureds and Indians. In contrast, Zulus, Xhosas, Tswana and Afrikaners are considered ethnic groups because they have
distinct languages and histories. Nevertheless, groups like the Nama were
officially classified as Coloured but are a very distinct 'aboriginal' group. In
South Africa the racial categorisation was officially constructed under the
regime of apartheid. In the Population Registration Act (1950), the South
African population was classified according to racial population groups:
namely blacks, coloureds, Indians and whites, and within the racial groups
according to ethnic or tribal labels (Henrard, 2002). That these were con
structed and state imposed categories can be seen for example in the fact
that in 1986, 1624 South Africans applied to be reclassified of whom 1102 were successful (Lester et al. 2000; Mar?, 2001). On this foundation other
laws were based which created race segregation along racial and ethnic lines in regard to residential areas, schooling, public services, etc. During the 1950s and 1960s the apartheid regime assigned separate residential areas
called Bantustans and later 'homelands'. These were based on established
language areas.
In regard to survey analysis it is important to understand that there are
certain problems involved with the use of race as an analytical category. Stanfield (1993) describes these as the homogeneity and monolithic identity
This content downloaded from 129.128.216.34 on Sat, 23 Mar 2013 18:13:07 PMAll use subject to JSTOR Terms and Conditions

322 DANIEL F. NEFF
fallacies. The use of racial categorisations like blacks, coloureds, Indians
and whites connote internal sameness, i.e. homogeneity with each race, which may not exist in practice. There is to my knowledge little literature in
regard to macro studies of poverty (in the quantitative and especially eco
nomic tradition) in South Africa - except for the class analyses such as
Seekings (2003), which tries to avoid the homogeneity fallacy by differen
tiating between the poverty levels using class. Another fallacy is the so-called
monolithic identity problem. Some scholars ascribe certain characteristics to
people of coloured origin and as a result ignore the range of identities (and therefore humanity) present in these groups. Both fallacies are to a certain
extent overlapping since both races and individuals of these races are seen as
uniform, but the homogeneity fallacy has to be seen as a macro-level phe nomenon, whereas the monolithic identity fallacy is a micro-level phe nomenon.
This study tries to avoid these fallacies and argues that it is important in
the case of South Africa to identify distinct social groups on as detailed a
level as possible. Research in the UK for example suggests that the South
Asian minority population is not homogenous and therefore should be
differentiated across religious sub-groups (Brown, 2000). Regarding South
Africa it is suggested that the racial categorisation should be replaced by an
ethnic categorisation along language groupings. In this study this is done by
combining the variables race and language10. To a certain extent this sort of
categorisation encompasses regional groups since certain languages are
mainly spoken in certain areas11. Unfortunately information on religion and
other aspects of identity are not available in the dataset, so no further
breakdown is possible. Further classification could include gender, but this
is for the sake of simplicity avoided here. Nevertheless, the advantages of a
detailed differentiation of social groups emerge clearly using the present ethnic categorisation.
3.2. Review of Well-being Studies Conducted in South Africa
Researchers have generated a vast literature on well-being for South Africa
stemming from the 1993 SALDRU dataset (PSLSD, 1994) on which this
paper is based12. Klasen (1997) argues that poverty in South Africa has a
strong racial dimension as a direct result of apartheid policies, with poverty
being concentrated among the African population. In his study he con
structs a composite well-being index (using the SALDRU, 1993 data) of 12
indicators, including income, health, education, household wealth, access to
services, transport, and perceptions of quality of life and compares it to
This content downloaded from 129.128.216.34 on Sat, 23 Mar 2013 18:13:07 PMAll use subject to JSTOR Terms and Conditions

SUBJECTIVE WELL-BEING, POVERTY AND ETHNICITY IN SOUTH AFRICA 323
income and expenditure measures of poverty. He finds that the people who are defined poor by the constructed index only partly overlap with the
expenditure poor. According to the comparison, Klasen identifies a total of
3.7 million severely deprived people who are not captured by the income
poverty measure. Similar to the results published by the RDP (1995) his
results show that 64% of the African people are poor, compared to 33% of
coloured people, and 3% of Indian people. The poverty rate of white people is close to zero in 1993.
Bookwalter and Dalenberg (2004) present a model of subjective well
being which they base upon poverty (including expenditure and capabilities) and household characteristics (such as housing, sanitation and transporta
tion) partly adapted from Klasen (1997). They hypothesise that satisfaction
depends upon various characteristics of the household. To test their
hypothesis they construct an index13 with household factors which they then
converted into a satisfaction measure using ordered probit regression
techniques. The authors find that the ordered probit model correctly pre dicted 40.4% of the total observations, but varied significantly. It predicted best for the groups of satisfied (62%) and dissatisfied (53%), but predicted less well for the very dissatisfied (27%), the very satisfied (2%) and the
neither satisfied nor dissatisfied (0%). Further, Bookwalter and Dalenberg examined whether the results differ between rich and poor by computing an
ordered probit model using the expenditure quintiles and their constructed
index. They find that important differences exist among groups based upon
expenditures, whereby transport and basic housing play the most important role for the poor, while sanitation, water, energy, education and health are
relatively more important for the rich. The authors go on to conclude that
'self-reported subjective well-being is affected by a complex assortment of
influences, of which basic economic factors play a role' (ibid: p. 346) and
argue that their results have policy implications, since targets for policy are
identified which affect well-being.
Kingdon and Knight (forthcoming) compare subjective well-being poverty with income and capabilities poverty and find that subjective well-being is
related to both approaches. They conclude that income does not constitute an adequate measure of capability poverty, since they find variables (i.e. health, insecurity, mobility, etc.) which influence happiness, even after con
trolling for economic factors such as income and assets. Therefore they view
subjective well-being as an encompassing concept. In a complex analysis
using ordered probit models, they estimate several subjective well-being functions for South Africa and come up with a preferred equation which
contains variables corresponding to the income approach, the basic needs
This content downloaded from 129.128.216.34 on Sat, 23 Mar 2013 18:13:07 PMAll use subject to JSTOR Terms and Conditions
324 DANIEL F. NEFF
approach, the relative functioning approach, and the security approach .
Observing differences between the South African racial groups, they argue that race itself is not associated with subjective well-being, but that 'unob
served circumstances which matter to happiness differ across the races' (ibid: p. 16), i.e. community factors such as public services and amenities.
What all these three studies regarding poverty and subjective well-being have in common is that they use race as a unit of analysis. While race is an
imperfect unit of analysis, none of the studies discuss the problems of a
racial classification. They do not explore differences inside the racial groups.
Furthermore, the studies of Bookwalter and Dalenberg (2004) and Kingdon and Knight (forthcoming) identify causal relationships from their models, which their models cannot in fact prove. The first, for example, argues that
subjective well-being is affected by certain influences and concludes that
policies which target these influences could improve subjective well-being,
implying a causal relationship. Nevertheless, it can only be inferred, not
verified, that these influences have a causal effect on subjective well-being, since variables are simultaneously collected and it cannot even be shown
that the independent variable(s) precedes the dependent variable (Bryman, 2001, p. 75). Since the models of Bookwalter and Dalenberg and Kingdon and Knight cannot establish this causal link between subjective well-being and certain influences, the conclusion that a policy change would result in an
improvement of subjective well-being cannot hold up. It has not been shown
that a change of the influences really results in higher subjective well-being.
Although Kingdon and Knight state that they 'are unable convincingly to
test the direction of causality' (ibid: p. 15), they generate a subjective well
being function. As it will be argued in the following pages, the ordered
probit models are not suitable for the analysis of subjective well-being due to a number of questionable premises upon which this technique relies.
4. METHODOLOGY
4.1. Dataset
SALDRU collected information on 43,984 individuals in 8854 households, between September and December 1993, regarding education, health, fer
tility histories, consumption patterns, labour supply to the formal and
informal sectors, migration and remittances, sources of income, and the
perceived quality of life. The main purpose of the questionnaire was to focus
on poverty using a mainly monetary approach, but the survey also tried to
collect as much additional information as feasible. For this reason the main
This content downloaded from 129.128.216.34 on Sat, 23 Mar 2013 18:13:07 PMAll use subject to JSTOR Terms and Conditions

SUBJECTIVE WELL-BEING, POVERTY AND ETHNICITY IN SOUTH AFRICA 325
part of the survey is concentrated on household expenditure and income, while education, health, migration and perceived quality of life only play a
minor role. Any study which is not primarily concerned with income and
expenditure patterns has to deal with restricted available information (i.e.
variables). For this study, the data was cleaned so that only those persons above the age of 16 and who answered the subjective well-being question with a valid value were included. Some observations with missing values on
key variables were also removed. After the cleaning process, the survey
yielded data on 7568 households. The data was weighted using the provided enumeration weight (see SALDRU, 1997).
4.2. Creation of Categories
4.2.1. Household expenditure. Poverty levels are usually measured using household expenditure since this measure is assumed to be more reliably
reported and more stable than household income (Klasen, 1997). In the
literature several reasons can be found why the use of income is problematic
(e.g. Khandker, 2002, Coudouel et al., 2004). Firstly, people tend to forget what they may have earned over the asked period (week, month or year) or
remember things they have earned earlier or later. In the case of the SAL
DRU questionnaire an individual is asked about the household income, so
the possible errors are higher than if the individual had only been asked
about his or her individual income. Secondly, people tend not to disclose the
full extent of their income for several reasons. In the SALDRU-question naire it could especially be that the respondents do not know the exact
income of other household members since the household sizes varied largely with a mean household size of 2.5415. A few households have over 40
members. Thirdly, some sources of income are difficult to observe, such as
the extent to which the value of farm output is rising or falling over time.
For this study household expenditure is calculated as monthly per capita household expenditure by dividing the total household expenditure by the
number of the household members. This derived variable is then divided
into five categories: 0-100 Rand, 101-200 Rand, 201-300 Rand, 301-500
Rand, 501-1000 Rand, 1001-2000 Rand and 2001 Rand or higher16.
4.2.2. Capability indicators. There is an ongoing debate as to how to measure capabilities. In general variables regarding education, health and,
sometimes, income are used as proxies for capability poverty. The principal aim for example of the UNDP in creating the HDI, the Capability Poverty
Measure (CPM) or the Human Poverty Index (HPI) is that the goal of
This content downloaded from 129.128.216.34 on Sat, 23 Mar 2013 18:13:07 PMAll use subject to JSTOR Terms and Conditions
326 DANIEL F. NEFF
development should be to enable people to live long, well-informed and
comfortable lives (see UNDP, 1990, 1996, 1997). But since the HDI (as well as the CPM and the HPI) represent measures which are meant mainly for
cross-country comparison or the comparison of large homogeneous groups,
indicating the relative position of a country/group relative to other coun
tries/groups, they cannot be used to compare households (May et al., 2000) or individuals.
Since any construction of a capability index is not without problems, for
this study three proxy variables are identified which are oriented on the
UNDP's conceptual framework mentioned above. Health, the highest educational attainment, and income are used as indicators. Health is broken
down into three categories, being healthy, being temporarily ill and having
long-term illness. The highest educational attainment is grouped into five
categories: 'no education', 'until junior certificate', 'until senior certificate',
'higher education', and 'university degree'. Lastly, total monthly per capita income is used, which is computed as the total monthly household income
divided by the household size.
4.2.3. Subjective well-being. In the SALDRU questionnaire subjective
well-being is based on a question regarding the perceived quality of life:
'Taking everything into account, how satisfied is this household with the
way it lives these days'? The response options ranged from 'very satisfied' to
'very dissatisfied' (1-5). Since this question is addressing the household and
not the individual's satisfaction, the first major assumption one might make
is that this question is answered out of the individual's own personal sat
isfaction level and not that of the household as a whole. The question was
asked of only one individual in each household and the individual is
answering on behalf of the household. In this study it is assumed that the
individual cognitively evaluates his or her well-being as a member of a
certain household and therefore the answer to the satisfaction question can
be regarded as the individual's subjective well-being. This assumption to
regard it as personal subjective well-being might not be shared by quality-of life proponents who could argue that this item should be rather seen as a
domain satisfaction item.
4.2.4. Ethnicity. The variable which is referred to as 'ethnicity' in the
following was created by combining two variables in the data set, namely 'race' and 'first language'. Contrary to existing analysis which uses 'race' as
an independent variable, this study constructs a variable out of the four race
groups and nine of the languages reported to be spoken as a first language.
This content downloaded from 129.128.216.34 on Sat, 23 Mar 2013 18:13:07 PMAll use subject to JSTOR Terms and Conditions

SUBJECTIVE WELL-BEING, POVERTY AND ETHNICITY IN SOUTH AFRICA 327
Most South African white respondents claimed to speak either Afrikaans or English as their language spoken at home and nearly all South African Indians claimed to speak English. Those few whites and Indians who did not
speak either English or Afrikaans were classified as 'other languages' and due to their very small number they were excluded from the analysis. The
coloured people either claimed to speak Afrikaans or English. In contrast
the Africans claimed to speak English, Afrikaans, Zulu, Xhosa, Swazi, North Sotho, South Sotho, Tswana, Venda, Ndebele or Shangaan/Tsonga. Since there were only a small number of Blacks who principally speak English or Afrikaans, they were combined in one category. Therefore there are 15 ethnic categories in the newly created variable (see Table I for the ethnic breakdown of the sample).
4.3. Data analysis Technique
The responses to the subjective well-being question in the SALDRU ques tionnaire regarding household satisfaction belong to the class of qualitative or limited variables. Responses are discrete and ordered. In many studies
they are therefore analysed using econometric techniques such as ordered
probit or logit with individual effects (van Praag et al., 2003). The central idea is that 'underlying the ordered response is a latent, continuously distributed random variable' representing the propensity to be satisfied (see
TABLE I
Ethnic Groups in South Africa
Ethnicity % % (cum.)
Black Engl./Afrikaans 0.4 0.4 Xhosa 16.5 16.9 Zulu 17.5 34.3
Tswana 9.5 43.9 North Sotho 11.0 54.9 South Sotho 7.6 62.5
Venda 1.4 63.8
Shangaan/Tsonga 4.8 68.6 Swazi 2.8 71.4
Ndebele 1.1 72.5 Coloured Engl. 1.8 74.4 Coloured Afrikaans 6.1 80.4 Indian English 2.7 83.2
White English 6.7 89.8 White Afrikaans 10.2 100.0
This content downloaded from 129.128.216.34 on Sat, 23 Mar 2013 18:13:07 PMAll use subject to JSTOR Terms and Conditions
328 DANIEL F. NEFF
Daykin and Moffat, 2002, p. 158). The ordered probit regression models a
curvilinear relationship based on an inverse normal-distribution. It regresses a function of the probability that a case falls in a certain category of Y, on a
linear combination of X variables (K?hler and Kreuter, 2001). The coeffi
cient ? (Beta) is computed following the maximum-likelihood principle. With these pre-defined assumptions about the distribution, the ordered
probit model assumes the categories of the ordinal variable to fall in line,
whereby they are not treated as independent. However this contradicts the
nature of ordinal variables since ordinal variables can be rank ordered in
categories, but the distance between the categories cannot be specified (de
Yaus, 2002). Furthermore, the ordered probit model assumes causality can
be represented by treating one variable as dependent and others as inde
pendent. It therefore assumes that the dependent variable is influenced by certain independent variables. In the case of subjective well-being it is as
sumed that subjective well-being can be explained with certain variables
such as health, expenditure, etc., although it is impossible to establish
causality through quantitative analysis. In contrast, by firstly using
descriptive statistics and then using a multiple correspondence analysis
(MCA) technique called HOMALS (available in SPSS 12), the limitations of
the ordered probit model can be avoided.
HOMALS is mainly understood as an exploratory and descriptive tech
nique. It is a model-free method that has few restrictions and assumptions. For example it is not based on distributional assumptions as the classical
techniques are (i.e. regression or ordered probit). The only restriction is that
HOMALS does not allow variables with negative value. Basically, in doing a MCA one analyses the relations between the categories of discrete vari
ables in order to reveal the structure of a complex ordinal data matrix
without the loss of essential information (Clausen, 1998). It does not try to
confirm or reject hypotheses about underlying processes that generated the
data (Blasius, 2002). Furthermore it presents the results visually in the form
of graphical displays referred to as 'maps' which ease interpretation.
5. RESULTS
5.1. Ethnicity and Poverty/ Well-being
In the following, in order to compare race and ethnicity as units of analysis,
simple mean scores of per capita expenditure, per capita income and
subjective well-being are computed. It is expected that a more detailed
break-down of racial groups will reveal intra-racial differences in regard to
poverty and well-being. However this is an empirical question.
This content downloaded from 129.128.216.34 on Sat, 23 Mar 2013 18:13:07 PMAll use subject to JSTOR Terms and Conditions
SUBJECTIVE WELL-BEING, POVERTY AND ETHNICITY IN SOUTH AFRICA 329
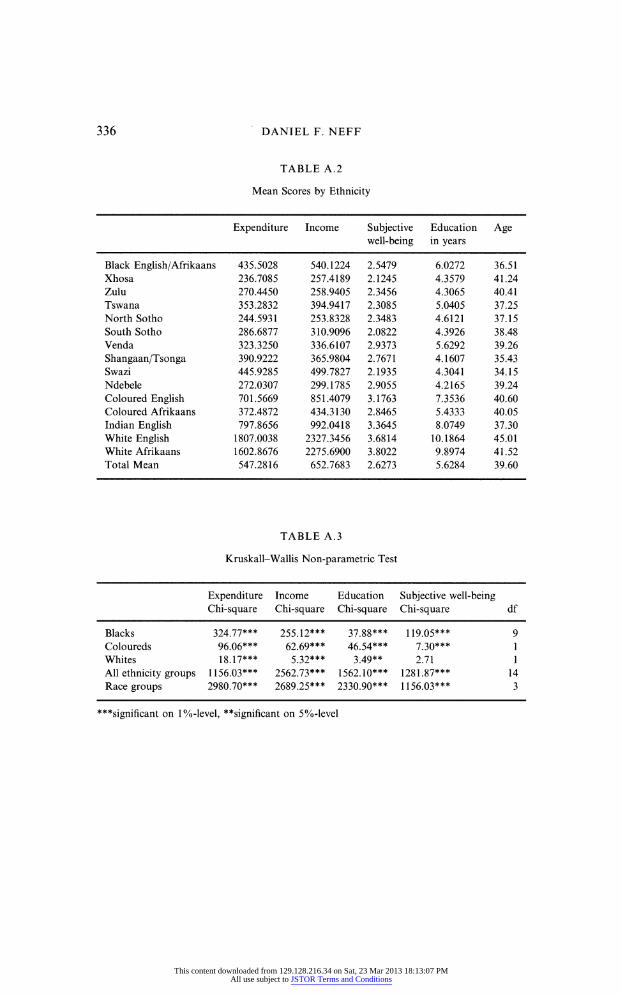
The mean scores of per capita income, expenditure and subjective well
being by race show the well-known racial differences in poverty or well
being. Whites have the highest average income and expenditure and report the highest average subjective well-being (see Table A.l). They are followed
by the Indians, coloured people and lastly by the African population. In
contrast, the mean scores of the ethnic groups show that apart from the
assumed racial hierarchy there are also intra-racial differences in poverty and well-being. The white English speaking group have a higher income and
expenditure than the White Afrikaans, the Coloured English speakers are
better of than their Afrikaans speaking counterparts, and the black ethnic
groups differ, too (see Table A.2). The black English/Afrikaans speakers have the highest mean income, the North Sotho speakers, the lowest. The
per capita expenditure is highest among the Swazi and lowest among the
Xhosa. Nevertheless, the mean subjective well-being is highest among the
Venda and Ndebele and lowest among the South Sotho and Xhosa groups.
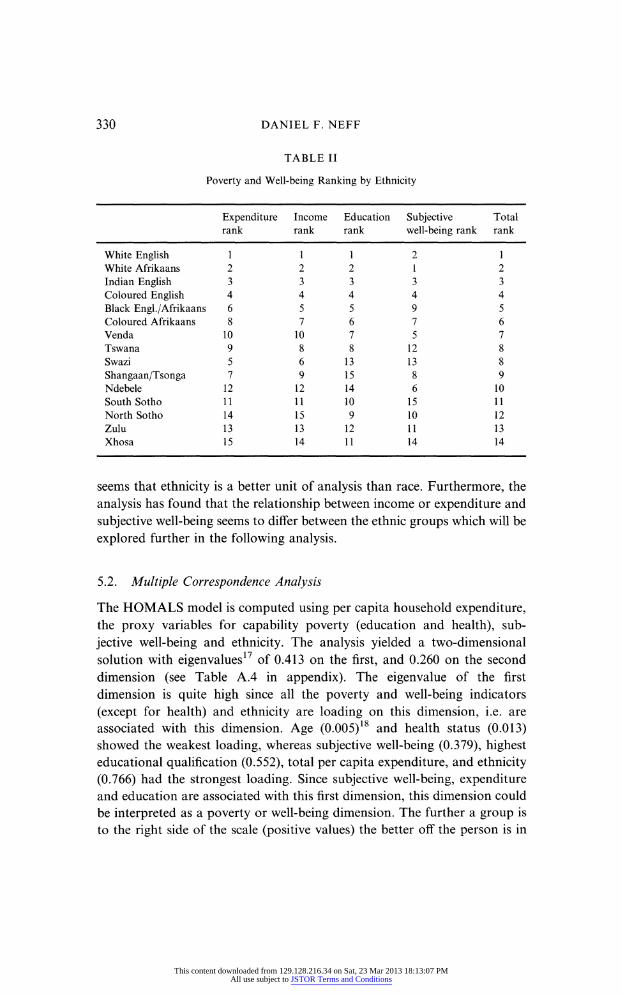
Converting the mean scores into rank scores gives the following total
poverty or well-being hierarchy (see Table II). The racial hierarchy is still
persistent, apart for one exception. Ranked by expenditure, income and
subjective well-being rankings, the black English/Afrikaans speaking group ranks higher than the coloured Afrikaans speaking group. What is inter
esting in this ranking is that expenditure and income rankings are mainly the
same, but the subjective well-being ranking is not. Although the white
English speakers earn and spend more than the white Afrikaans speaking group, they report a lower mean subjective well-being. In contrast, among the coloured group, the English speakers who have a higher income and
expenditure level claim to be more satisfied than the Afrikaans speakers.
Among the black groups, there is no clear association between the income
and expenditure and the subjective well-being rank.
The non-parametric Kruskal-Wallis Test shows that there are significant differences between the different racial and ethnic groups regarding their mean expenditure, income and subjective well-being level (see Table A.3 in
appendix). Furthermore, there are significant differences between the black
ethnic groups and between the coloured groups. The difference between the white ethnic groups is only significant for expenditure, income and education.
The comparison of poverty means has shown that there are racial dif
ferences but more importantly that there are significant intra-racial differ ences in expenditure, income, education and subjective well-being, which
supports the argument that the racial groups are not homogenous groups. The concept of ethnicity introduced here shows that there are differences
between the ethnic groups which are classified by race and language. It
This content downloaded from 129.128.216.34 on Sat, 23 Mar 2013 18:13:07 PMAll use subject to JSTOR Terms and Conditions
330 DANIEL F. NEFF
TABLE II
Poverty and Well-being Ranking by Ethnicity
Expenditure Income Education Subjective Total
rank rank rank well-being rank rank
White English 1112 1 White Afrikaans 2 2 2 1 2 Indian English 3 3 3 3 3 Coloured English 4 4 4 4 4
Black Engl./Afrikaans 6 5 5 9 5 Coloured Afrikaans 8 7 6 7 6 Venda 10 10 7 5 7 Tswana 9 8 8 12 8
Swazi 5 6 13 13 8 Shangaan/Tsonga 7 9 15 8 9 Ndebele 12 12 14 6 10 South Sotho 11 11 10 15 11 North Sotho 14 15 9 10 12
Zulu 13 13 12 11 13 Xhosa 15 14 11 14 14
seems that ethnicity is a better unit of analysis than race. Furthermore, the
analysis has found that the relationship between income or expenditure and
subjective well-being seems to differ between the ethnic groups which will be
explored further in the following analysis.
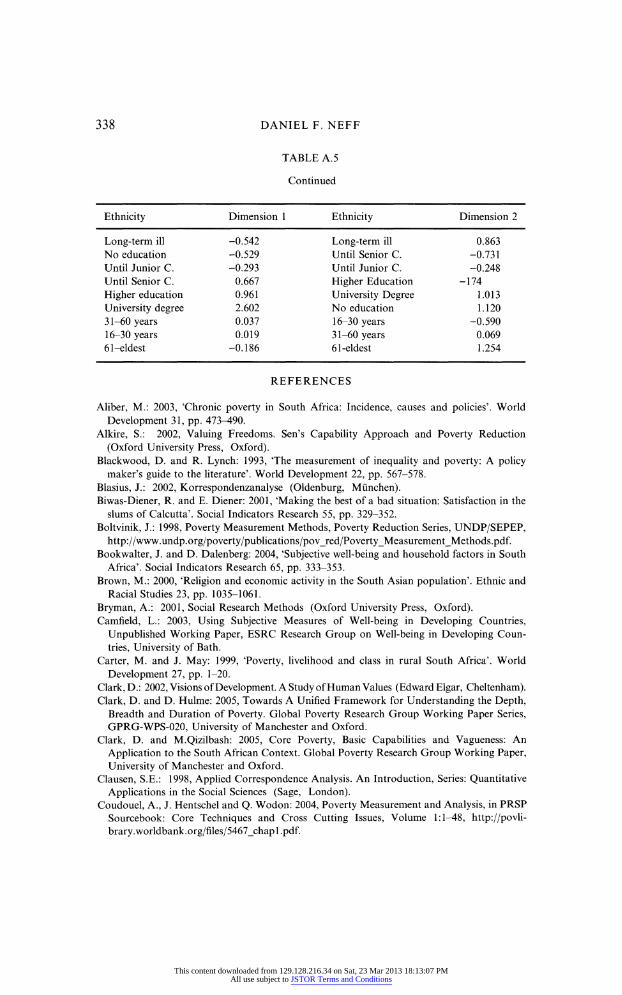
5.2. Multiple Correspondence Analysis
The HOMALS model is computed using per capita household expenditure, the proxy variables for capability poverty (education and health), sub
jective well-being and ethnicity. The analysis yielded a two-dimensional
solution with eigenvalues17 of 0.413 on the first, and 0.260 on the second
dimension (see Table A.4 in appendix). The eigenvalue of the first
dimension is quite high since all the poverty and well-being indicators
(except for health) and ethnicity are loading on this dimension, i.e. are
associated with this dimension. Age (0.005)18 and health status (0.013) showed the weakest loading, whereas subjective well-being (0.379), highest educational qualification (0.552), total per capita expenditure, and ethnicity
(0.766) had the strongest loading. Since subjective well-being, expenditure and education are associated with this first dimension, this dimension could
be interpreted as a poverty or well-being dimension. The further a group is
to the right side of the scale (positive values) the better off the person is in
This content downloaded from 129.128.216.34 on Sat, 23 Mar 2013 18:13:07 PMAll use subject to JSTOR Terms and Conditions

SUBJECTIVE WELL-BEING, POVERTY AND ETHNICITY IN SOUTH AFRICA 331
terms of poverty or well-being. Clearly, as a legacy of apartheid, the dif
ferent racial as well as ethnic groups differ on this dimension, i.e. in their
level of poverty or well-being. The findings of 5.1 are supported since the
hierarchy on this dimension is equal to the mean scores of the different
ethnic groups. The smaller eigenvalue of the second dimension is due to the fact that
although four variables (expenditure, education, ethnicity and age) are
associated with this dimension, all do not load very strongly. Interestingly age (0.005) was not associated with the poverty or well-being dimension
(dimension 1) but is now associated with the second dimension whereas
subjective well-being was associated with the first dimension but is not
associated with the second dimension (0.042). As with dimension one, health
again is not related (0.031) with the second dimension, whereas ethnicity
(0.322) and expenditure (0.431) are associated, although less strong as with
dimension 1 (Table A.4). The graphical mapping of the poverty measures and the ethnic groups
depict the findings. Dimension one is a poverty or well-being dimension19 and on this dimension, we can see that all black groups are situated on the
left spectrum which are close to low expenditure, high capability poverty (in
regard of ill-health and low education) and low subjective well-being, whereas both white groups are situated on the right end close to high expenditure, low capability poverty (good health and good education) and
high subjective well-being. Dimension two is equivalent to the individual variation inside the ethnic
groups and is much more difficult to interpret. The question is to how this
difference between the ethnic groups can be explained. By looking closely at the distribution of ethnic groups along the second dimension one
can see that age and education appear to be important factors apart from expenditure which are responsible for intra-ethnic variation. This
intra-ethnic variation must be further investigated to be sure about the
underlying structure. One possible interpretation of the importance of
expenditure, age and education is that in South African households are
often dependent on a single earner, i.e. someone who is in employment (see Seekings, 2003), and as Ferreira and Litchfield (in van der Berg, 2002) argue, the chances of having employment is higher, the higher the edu
cation is a person holds. Van der Berg (2002) argues not only education
but the quality of education (apart from location factors)20 is important. But naturally education is more important for the younger generation, therefore the age structure of the ethnic groups is important, too. The results of the HOMALS model point in the direction that for the younger
This content downloaded from 129.128.216.34 on Sat, 23 Mar 2013 18:13:07 PMAll use subject to JSTOR Terms and Conditions

332 DANIEL F. NEFF
Fig. L Multiple correspondence analysis (HOMALS).
generation education is important in order to enhance chances on the
labour market, but since the labour market prospects differ significantly between the nine provinces, location plays a big role. So educated indi
viduals of black ethnic groups close to the economic centres (Gauteng and
the Western Cape) have higher chances of upward mobility since there are
more jobs available. On the other hand, as van der Berg points out, the
quality of education varies significantly between and inside the provinces. As Moll (2000) states, South Africa has experienced a decrease in inter
racial earning inequality during the years 1980-1993 but an increase in
inequality within the race groups. He explains that the end of apartheid resulted in the removal of labour market discrimination which gave some
African the opportunity of upward mobility. Meanwhile, former privileged uneducated whites lost their apartheid protection. Education therefore
became the factor which determined who could benefit from the new
opportunities or who lost his job security.
6. DISCUSSION
This paper has introduced ethnicity as a concept of analysis. The descriptive
analysis has shown that race as a unit of analysis is hiding intra-racial
differences. By using ethnicity as a unit of analysis, constructed from a
This content downloaded from 129.128.216.34 on Sat, 23 Mar 2013 18:13:07 PMAll use subject to JSTOR Terms and Conditions
SUBJECTIVE WELL-BEING, POVERTY AND ETHNICITY IN SOUTH AFRICA 333
combination of established race classifications and the language spoken at
home, intra-racial differences in expenditure poverty, capability poverty and
subjective well-being are revealed. Ethnicity therefore seems to be a
worthwhile unit of analysis for future research regarding poverty and
inequality. Although ethnicity seems to be a better unit of analysis it is by no
means perfect. Further aspects like gender, location or age could be inte
grated, if the sample size is larger. Furthermore, this study has introduced an alternative multivariate tech
nique for the analysis of categorical data, which, as it is argued, is not
dependent on assumptions such as causality and therefore has an advantage over more widely used multivariate techniques such as ordered probit
regressions. The multi correspondence analysis - in this study HOMALS -
helped to identify underlying structures independent of causalities. A two
dimensional HOMALS model suggested that in the case of South Africa
there is a well-being hierarchy due to the apartheid past which is based on
race and ethnicity. More interestingly it has further uncovered a complex connection between education, age and location which is responsible for the
individual variation within the ethnic groups. Nevertheless, further research
is needed to uncover this complex structure.
Finally, in regard of subjective well-being it was found that there is no
clear association between income or expenditure and subjective well-being of the African ethnic groups. As reported earlier, the models of Bookwalter
and Dalenberg (2004) do not predict subjective well-being very well for the
very dissatisfied (23.3% of the sample) and the very satisfied (7.9% of the
sample). Interestingly, 89.4% of the very dissatisfied are from African ethnic
groups, whereas of the very satisfied, 41.2% are from African ethnic groups and 47.3% are from white ethnic groups. Regarding these facts and the mean rank scores for income, expenditure and subjective well-being it seems
that to a certain extent there are cultural differences between the ethnic
groups which are associated with the subjective well-being levels. The
question why the equation cannot explain the subjective well-being level of
the very dissatisfied Africans has two possible answers. It could be, firstly, that further proxy variables need to be integrate into their model to explain the difference between the dissatisfied and the very dissatisfied, or, secondly, that there are certain cultural differences between the races and ethnic
groups which are not considered. The question why the white English
speaking group does not have the highest mean subjective well-being level
could have two possible explanations. Firstly, clearly the white population has lost their state protection with the end of apartheid. Maybe the loss of
apartheid protection was perceived as more severe among the English
This content downloaded from 129.128.216.34 on Sat, 23 Mar 2013 18:13:07 PMAll use subject to JSTOR Terms and Conditions

334 DANIEL F. NEFF
speaking elites compared to the Afrikaans speaking population. The Afri
kaans speaking white population could have in general been less affected
due to laws like the sunset clause which granted civil servants their jobs after
the transition from apartheid to democracy. This could have resulted in
larger pessimism and lower perceived satisfaction among the group of the
English speaking whites and in comparison larger optimism among the
Afrikaans speaking whites. A second explanation might be that the returns
to a high income or expenditure in regard of subjective well-being are
diminishing after a certain level. What the HOMALS model further suggests is that subjective well-being indeed seems to be an outcome measure since it
is only associated with the first well-being dimension and does not have a
significant individual variation (i.e. was associated with dimension two). But to understand this outcome of subjective well-being more research is
needed into the complex structure in South Africa, partly uncovered in this
paper.
NOTES
1 South Africa is reported to have a mean life satisfaction of 6.73 (on a scale from 0-10) which
ranks it on place 25 out of 42 countries (Schyns, 2002). 2 Klasen (2002) states a Gini coefficient of 0.60 and argues that it is among the highest in the
world. 3 The South African Human Development Report suggests that inequality has persisted and
increased slightly since the end of apartheid. 4
Conducted by the Project for Statistics on Living Standards and Development (PSLSD) of
the Southern African Labour and Development Research Unit (SALDRU) at the University of
Cape Town. 5
In the following well-being and poverty are boldly used interchangeably, although the author
acknowledges the differences between poverty and well-being and is aware of the problems of
using poverty and well-being interchangeably. 6
In a recent paper Sen (2005) argues that although human capabilities and rights go well with
each other (i.e. that many human rights can be regarded as right so certain capabilities) the
capability framework does not encompass the human rights approach in the sense that human
rights cannot be 'adequately analysed within the capability framework' (ibid: p. 163). 7
Sen himself (for example in 1985) operationalised human capabilities in earlier works. 8 Although the income component of the HDI is often regarded as a proxy for functionings. 9 A first critique is that the HDI is applied to rank countries and therefore does not represent a
poverty definition or measurement in the strict sense (which would focus on individuals or
households) (see Boltvinik, 1998). Secondly, the process of aggregation is criticised, because
capabilities are regarded as incommensurable, and therefore should be presented separately for
each capability. In general aggregation is further criticised because it conceals information
(Ruggeri Laderchi et al., 2003). Thirdly, it is argued that the attached weights to the three
indicators are arbitrary, and that the explanatory power of the index is limited to how well a
certain country is doing in relation to other countries. Fourthly, it is criticised that since the
This content downloaded from 129.128.216.34 on Sat, 23 Mar 2013 18:13:07 PMAll use subject to JSTOR Terms and Conditions

SUBJECTIVE WELL-BEING, POVERTY AND ETHNICITY IN SOUTH AFRICA 335
HDI represents an average, it excludes information on inequality, gender or urban and rural
people (Clark, 2002, ch. 1). 10
There are 11 official languages in South Africa. 11
The Black English or Afrikaans speakers are to be found in all provinces (between 7 and
16.5%) except for Northern Transvaal and the North West Province but the majority are
situated in Western Cape (28.9%). The Xhosa speakers live mainly in the Eastern Cape, the
group of Zulus mainly in KwaZulu Natal, the Tswana in the North West, the South Sotho in
the Free State, the Venda, Swazi and Ndebelele in Mpumalanga, the North Sotho and the
Shangaan/Tsonga in Limpopo, the Coloured English and Coloured English in Western Cape, the Indian English in KwaZulu Natal, the White English in the Western Cape, Gauteng. and the
Eastern Cape, the White Afrikaans mainly in Gauteng and Western Cape. 12
There are now many relevant poverty and well/being datasets since the SALDRU survey,
e.g. the Census and October Household Surveys, the Labour Force Survey, etc. but the
SALDRU survey is still extensively used although it is increasingly dated. Nevertheless it still
represents the only living standards measurement study in South Africa. 13
The index is estimated as follows (ibid 2004, p. 339):// = M + 62EDUC/ + M EXPEND/ +
M DURABLES? + b5 ILLNESS Dummy* + Sj HOUSING Dummies/ + 0/WATER SOURCE Dummies/ + Xj SANITATION Dummied + nj COOKING ENERGY Dummies/ + otj TRANSPORTATION Dummies/ + ex. 14
The security approach refers to the physical and economical risks of households. Kingdon and Knight (forthcoming) identify exposure to crime, debt, the risk of unemployment and the
lack of assets. 15
and a standard deviation of 2.97. 16
In contrast to the procedure suggested by the World Bank this was not done with the help of an adult equivalent scale. 17
Eigenvalues are squared correlations 18
These factors are discrimination measures and vary from 0 to 1. 19
Dimension one is equivalent to the mean ranks of the ethnic groups regarding poverty and
well-being measures. 20
Indeed, in a separate HOMALS analysis, location was controlled for and the variable
province (the nine provinces) had the strongest factor loading on dimension two.
APPENDIX
TABLE A.l
Mean Scores by Race Groups
Expenditure Income Subjective
well-being
Education
in years Age
African
Coloured
Indian
White
Total Mean
287.9563
449.6201
797.8656
1683.6769
547.2816
300.9492
526.4558
992.0418
2294.9727
652.7683
2.3060
2.9226
3.3645
3.7543
2.6273
4.4923 5.8769
8.0749
10.0121
5.6284
38.86
40.18
37.30
42.90
39.60
Subjective well-being scale 1-5, 1 =very dissatisfied, 5 = very satisfied.
This content downloaded from 129.128.216.34 on Sat, 23 Mar 2013 18:13:07 PMAll use subject to JSTOR Terms and Conditions
DANIEL F. NEFF
TABLE A.2
Mean Scores by Ethnicity
Expenditure Income Subjective
well-being
Education
in years Age
Black English/Afrikaans 435.5028 540.1224 2.5479 6.0272 36.51
Xhosa 236.7085 257.4189 2.1245 4.3579 41.24
Zulu 270.4450 258.9405 2.3456 4.3065 40.41
Tswana 353.2832 394.9417 2.3085 5.0405 37.25
North Sotho 244.5931 253.8328 2.3483 4.6121 37.15
South Sotho 286.6877 310.9096 2.0822 4.3926 38.48
Venda 323.3250 336.6107 2.9373 5.6292 39.26
Shangaan/Tsonga 390.9222 365.9804 2.7671 4.1607 35.43
Swazi 445.9285 499.7827 2.1935 4.3041 34.15
Ndebele 272.0307 299.1785 2.9055 4.2165 39.24
Coloured English 701.5669 851.4079 3.1763 7.3536 40.60
Coloured Afrikaans 372.4872 434.3130 2.8465 5.4333 40.05
Indian English 797.8656 992.0418 3.3645 8.0749 37.30
White English 1807.0038 2327.3456 3.6814 10.1864 45.01
White Afrikaans 1602.8676 2275.6900 3.8022 9.8974 41.52
Total Mean 547.2816 652.7683 2.6273 5.6284 39.60
TABLE A.3
Kruskall-Wallis Non-parametric Test
Education Subjective well-being
Chi-square Chi-square
Expenditure Income
Chi-square Chi-square df
Blacks 324.77***
Coloureds 96.06***
Whites 18.17***
All ethnicity groups 1156.03***
Race groups 2980.70***
255.12***
62.69***
5.32***
2562.73***
2689.25***
37.88*** 119.05***
46 54*** 7 3Q***
3.49** 2.71
1562.10*** 1281.87***
2330.90*** 1156.03***
9
1
1
14
3
***significant on 1%-level, **significant on 5%-level
This content downloaded from 129.128.216.34 on Sat, 23 Mar 2013 18:13:07 PMAll use subject to JSTOR Terms and Conditions

SUBJECTIVE WELL-BEING, POVERTY AND ETHNICITY IN SOUTH AFRICA 337
TABLE A.4
Multiple Correspondence Analysis - HOMALS model summary
Dimension 1 Dimension 2
Eigenvalues
Subjective well-being
Expenditure
Ethnicity Education
Health
Age
0.413
0.379
0.762
0.766
0.552
0.013
0.005
0.260
0.042
0.431
0.322
0.412
0.031
0.319
TABLE A.5
Multiple Correspondence Analysis - HOMALS Model
Ethnicity Dimension 1 Ethnicity Dimension 2
Xhosa -0.597
North Sotho -0.412
South Sotho -0.470
Zulu -0.455
Ndebele -0.230
Tswana -0.283
Swazi -0.264
Shangaan/Tsonga -0.125
Venda -0.050
Coloured Afrikaans -0.38
Black Afrikaans/English 0.503
Coloured English 0.842
Indian English 0.819
White Afrikaans 1.967
White English 2.181
2001-highest 2.260
1001-2000 1.639
501-1000 0.676
301-500 0.003
201-300 -0.382
101-200 -0.611
0-100 -0.794
Very satisfied 1.375
Satisfied 0.656
Neither 0.030
Dissatisfied -0.459
Very dissatisfied -0.490
Healthy 0.032
Temporarily ill -0.106
Coloured English -1.454
Indian English -1.408
Coloured Afrikaans -0.823
Black Swazi -0.779
Black Tswana -0.550
Black Afrikaans/English -0.398
Black Shangaan -0.271
Black Ndebele -0.095
Black South 0.012
Black Zulu 0.034
Black Venda 0.122
Black North 0.183
White Afrikaans 0.236
Black Xhosa 0.630
White English 1.006
301-500 1.069
501-1000 0.978
201-300 0.445
101-200 -0.134
1001-2000 -0.545
0-100 -0.933
2001-highest -1.546
Very satisfied 0.305
Dissatisfied 0.211
Very dissatisfied -0.072
Neither -0.105
Satisfied -0.260
Healthy -0.045
Temporarily ill 0.117
This content downloaded from 129.128.216.34 on Sat, 23 Mar 2013 18:13:07 PMAll use subject to JSTOR Terms and Conditions
DANIEL F. NEFF
TABLE A.5
Continued
Ethnicity Dimension Ethnicity Dimension 2
Long-term ill
No education
Until Junior C.
Until Senior C.
Higher education
University degree 31-60 years 16-30 years 61-eldest
-0.542
-0.529
-0.293
0.667
0.961
2.602
0.037
0.019
-0.186
Long-term ill
Until Senior C.
Until Junior C.
Higher Education
University Degree No education
16-30 years 31-60 years 61-eldest
0.863
-0.731
-0.248
-174
1.013
1.120
-0.590
0.069
1.254
REFERENCES
Aliber, M.: 2003, 'Chronic poverty in South Africa: Incidence, causes and policies'. World
Development 31, pp. 473-490.
Alkire, S.: 2002, Valuing Freedoms. Sen's Capability Approach and Poverty Reduction
(Oxford University Press, Oxford).
Blackwood, D. and R. Lynch: 1993, The measurement of inequality and poverty: A policy maker's guide to the literature'. World Development 22, pp. 567-578.
Blasius, J.: 2002, Korrespondenzanalyse (Oldenburg, M?nchen).
Biwas-Diener, R. and E. Diener: 2001, 'Making the best of a bad situation: Satisfaction in the
slums of Calcutta'. Social Indicators Research 55, pp. 329-352.
Boltvinik, J.: 1998, Poverty Measurement Methods, Poverty Reduction Series, UNDP/SEPEP,
http://www.undp.org/poverty/publications/pov_red/Poverty_Measurement__Methods.pdf. Bookwalter, J. and D. Dalenberg: 2004, 'Subjective well-being and household factors in South
Africa'. Social Indicators Research 65, pp. 333-353.
Brown, M.: 2000, 'Religion and economic activity in the South Asian population'. Ethnic and
Racial Studies 23, pp. 1035-1061.
Bryman, A.: 2001, Social Research Methods (Oxford University Press, Oxford).
Camfield, L.: 2003, Using Subjective Measures of Well-being in Developing Countries,
Unpublished Working Paper, ESRC Research Group on Well-being in Developing Coun
tries, University of Bath.
Carter, M. and J. May: 1999, 'Poverty, livelihood and class in rural South Africa'. World
Development 27, pp. 1-20.
Clark, D.: 2002, Visions of Development. A Study of Human Values (Edward Elgar, Cheltenham).
Clark, D. and D. Hulme: 2005, Towards A Unified Framework for Understanding the Depth, Breadth and Duration of Poverty. Global Poverty Research Group Working Paper Series,
GPRG-WPS-020, University of Manchester and Oxford.
Clark, D. and M.Qizilbash: 2005, Core Poverty, Basic Capabilities and Vagueness: An
Application to the South African Context. Global Poverty Research Group Working Paper,
University of Manchester and Oxford.
Clausen, S.E.: 1998, Applied Correspondence Analysis. An Introduction, Series: Quantitative
Applications in the Social Sciences (Sage, London).
Coudouel, A., J. Hentschel and Q. Wodon: 2004, Poverty Measurement and Analysis, in PRSP
Sourcebook: Core Techniques and Cross Cutting Issues, Volume 1:1-48, http://povli
brary.worldbank.org/files/5467_chapl.pdf.
This content downloaded from 129.128.216.34 on Sat, 23 Mar 2013 18:13:07 PMAll use subject to JSTOR Terms and Conditions

SUBJECTIVE WELL-BEING, POVERTY AND ETHNICITY IN SOUTH AFRICA 339
CPRC: 2004, The Chronic Poverty Report 2004-05, Chronic Poverty Research Centre, Institute
for Development Policy and Management, University of Manchester.
Daykin, A. and P. Moffat: 2002, 'Analyzing ordered responses: A review of the ordered probit model'. Understanding Statistics 1, pp. 157-166.
de Vaus, D.: 2002, Surveys in Social Research 5th ed. (Routledge, London).
Diener, E. and R.E. Lucas: 1999, 'Personality, and subjective well-being', in D. Kahneman, E. Diener and N. Schwarz (eds.), Well-being: The foundations of hedonic psychology,
(R?ssel Sage Foundation, New York), pp. 213-229.
Diener, E. and E.M. Suh: 2000, 'Measuring subjective well-being to compare the quality of life', in E. Diner and E.M. Suh (eds.), Culture and Subjective Well-being, (MIT Press, Cambridge),
pp. 1-12.
Diener, E., C. Scollon and R. Lucas: 2004, 'The evolving concept of subjective well-being: The multifaceted nature of happiness'. Advances in Cell Aging and Gerontology 15, pp. 187-219.
Du Toit, J.: 1998, The Structure of the South African Economy, Southern Books 2 ed.
(Halfway House, Johannesburg).
Ferrer-I-Carbonell, A.: 2002, Subjective Questions to Measure Welfare and Well-being, Dis
cussion Paper (Tinbergen Institute, Amsterdam).
Glaser, D.: 2001, Politics and Society in South Africa: a critical introduction (Sage, London).
Henrard, K.: 2002, 'Post apartheid south africa's democratic transformation process: Redress
of the past, reconciliation and "unity in diversity'". The Global Review of Ethnopolitics 1,
pp. 18-38.
Hulme, D. and A. Shepherd: 2003, 'Conceptualizing chronic poverty'. World Development
31(3): pp. 403-423.
Hulme, D., K. Moore and A. Shepherd: 2001, Chronic poverty: Meanings and analytical frameworks, Chronic Poverty Research Centre, Working Paper 2, Institute for Development
Policy and Management, University of Manchester.
Jesuit, D. and T. Smeeding: 2002, Poverty Levels in the Developed World, Luxembourg Income Study Working Papers No. 321 (Syracuse University, New York).
Kajanoja, J.: 2002, 'Theoretical bases for the measurement of quality of life', in E. Gullone and
R. Cummins (eds.), The Universality of Subjective Well-being Indicators. A Multi-disci
plinary and Multi-national Perspective, Social Indicators Research Book Series, 16 (Kluwer Academic Publishers, Dordrecht), pp. 63-80.
Khandker, S.: 2002, Poverty manual (World Bank, Washington), http://web.worldbank.
org/WBSITE/EXTERNAL/WBI/WBIPROGRAMS/PGLP/0, contentMDK:20284296~me nuPK: 461269~pagePK:64156158-piPK:64152884~theSitePK:461246,00.html.
Kingdon, G. and J. Knight (2006), 'Well-being poverty versus income poverty and capabilities
poverty?' Journal of Development Studies, forthcoming.
Klasen, S.: 1997, 'Poverty, inequality and deprivation in South Africa: An analysis of the 1993
SALDRU survey'. Social Indicators Research 41, pp. 51-94.
Klasen, S.: 2002, 'Social economic, and environmental limits for the newly enfranchised in
South Africa?'. Economic Development and Cultural Change 50, pp. 607-42.
K?hler, U. and F. Kreuter: 2001, Datenanalyse mit Stata: allgemeine Konzepte der Daten
analyse und ihre praktische Anwendung (Wissenschaftsverlag, M?nchen). Lester, A., E. Nel and T. Binns: 2000, South Africa. Past Present and Future. Gold at the End
of the Rainbow? (Person Education Limited, London). Mare, G.: 2001, 'Race counts in contemporary South Africa: 'An illusion of ordinariness'.
Transformation 47, pp. 75-93.
May, J., I. Woolard and S. Klasen: 2000, 'The nature and measurement of poverty and
inequality', in J. May (ed.), Poverty and Inequality in South Africa: Meeting the Challenge,
(Zed Books, London), pp. 19-50.
This content downloaded from 129.128.216.34 on Sat, 23 Mar 2013 18:13:07 PMAll use subject to JSTOR Terms and Conditions

340 DANIEL F. NEFF
McGregor, JA.: 2004, Researching Well-being: Communicating between the Needs of Policy Makers and the Needs of People, Paper for the International Workshop on Researching
Well-being in Developing Countries, Hanse Institut for Advanced Studies, Bremen.
Michalos, A.: 2003, Observations on Key National Performance Indicators. Mimeographed
(University of Northern British Columbia, Prince George, Canada).
Moll, P.: 2000, 'Discrimination is declining in South Africa but inequality is not'. Journal of
Studies in Economics and Econometrics 24, pp. 91-108.
M?ller, V.: 1997, 'South Africa's emergent "social indicators movement'". Social Indicators
Research 41, pp. 1-14.
Olson, G. and B. Schober: 1993, The satisfied poor. Development of an intervention-oriented
theoretical framework to explain satisfaction with a life in poverty'. Social Indicators Re
search 28, pp. 173-193.
Ouweneel, P. and R. Veenhoven: 1991, 'Cross-national differences in happiness: Cultural bias or
societal quality?', in N. Bleichrodt and P. Drenth (eds.), Contemporary Issues in Cross
cultural Psychology (Swets and Zeitlinger, Amsterdam), pp. 168-184.
PSLSD (1994), South Africans Rich and Poor: Baseline Statistics Southern Africa Labour and
Development Research Unit, Cape Town.
RDP Office: 1995, Key Indicators of Poverty in South Africa (RDP Office, Pretoria).
Rojas, M.: 2003, The Multidimensionality of Poverty: A Subjective Weil-Being Approach
(WIDER Conference Paper, Helsinki).
Ross, R.: 1999, A Concise History of South Africa (Cambridge University Press, Cambridge).
Ruggeri Laderchi, C, R. Saith and F. Stewart: 2003, 'Does it matter that we do not agree on the
definition of poverty? A Comparison of Four Approaches'. Oxford Development Studies 31,
pp. 243-274.
SAHDR: 2003. South Africa Human Development Report 2003. The Challenge of Sustainable
Development: Unlocking People's Creativity, UNDP South Africa, Oxford University Press, New York.
SALDRU: 1997, Overview, http://www.worldbank.org/html/prdph/lsms/country/za94/docs/ za94ovr.txt.
Schyns, P.: 2002, 'Wealth of nations, individual income and life satisfaction in 42 countries: A
multilevel approach'. Social Indicators Research 60, pp. 5-40.
Seekings, J.: 2003, Social Stratification and Inequality in South Africa at the End of Apartheid,
Working Paper 31, Centre for Social Science Research, University of Cape Town.
Sen, A.: 1981, Poverty and Famines. An Essay on Entitlement and Deprivation (Clarendon
Press, Oxford). Sen, A.: 1985, Commodities and Capabilities (Oxford University Press, Oxford).
Sen, A.: 1987, On Ethics and Economics (Blackwell, Oxford).
Sen, A.: 1990, 'Development as capability expansion', in K. Griffin and J. Knight (eds.), Human
Development and the International Development Strategy for the 1990s (Macmillan,
London), pp. 41-58.
Sen, A.: 1992, Inequality Re-examined (Oxford University Press, Oxford).
Sen, A.: 1999, Development as Freedom (Oxford University Press, Oxford). Sen, A.: 2005, 'Human rights and capabilities'. Journal of Human Development 6, pp. 151-166.
Stanfield, J.H.: 1993, Race and Ethnicity in Research Methods (Sage, London). UNDP: 1990, Human Development Report 1990, Concept and Measurement of Human
Development (Oxford University Press, New York). UNDP: 1996, Human Development Report 1996, Economic Growth and Human Develop
ment (Oxford University Press, New York). UNDP: 1997, Human Development Report 1997, Human Development to Eradicate Poverty
(Oxford University Press, New York).
This content downloaded from 129.128.216.34 on Sat, 23 Mar 2013 18:13:07 PMAll use subject to JSTOR Terms and Conditions

SUBJECTIVE WELL-BEING, POVERTY AND ETHNICITY IN SOUTH AFRICA 341
van der Berg, S.: 2002, Education, Poverty and Inequality in South Africa, Paper to the
Conference of the Centre for the Study of African Economies Economic growth and poverty in Africa, Oxford, pp. 1-26.
van Praag, B., P. Frijters and A. Ferrer-I-Carbonell: 2003, 'The anatomy of subjective well
being'. Journal of Economic Behavior & Organization 51, pp. 29-49.
Veenhoven, R.: 1991, 'Is happiness relative?'. Social Indicators Research 24, pp. 1-34.
Veenhoven, R.: 2000, 'The four qualities of life: ordering concepts and measures of the good life'. Journal of Happiness Studies 1, pp. 1-39.
Veenhoven, R.: 2004, Subjective Measures of Well-being, Discussion Paper No. 2004/07 (World Institute for Development Economics Research, United Nations University, Helsinki).
Wagle, U.: 2002, 'Rethinking poverty: Definition and measurement'. International Social
Science Journal 54, pp. 155-165.
World Bank: 2005, South Africa Country Brief, http://web.worldbank.org/WBSITE/
EXTERNAL/COUNTRIES/AFRICAEXT/SOUTHAFRICAEXTN/0,menuPK:368086~ PagePK:141132~piPK:141107~theSitePK:368057,00.html.
Centre for Census and Survey Research and
Institute for Development Policy and Management
University of Manchester
2nd floor, Booth Street East, M13 9PL Manchester, UK
E-mail: [email protected]
This content downloaded from 129.128.216.34 on Sat, 23 Mar 2013 18:13:07 PMAll use subject to JSTOR Terms and Conditions