welfare impacts of rural electrification: evidence...
TRANSCRIPT

Welfare Impacts of Rural Electrification:
Evidence from Vietnam1 By
Shahidur R. Khandker Douglas F. Barnes
Hussain Samad Nguyen Huu Minh
World Bank September, 2008
Abstract
Access to electricity is key to any development initiative and there is a growing body of literature on the impact of rural electrification on development. However, most studies have so far relied on cross-sectional surveys comparing households with and without electricity, which have well known causal attribution problems. This paper is one of the first studies to examine the welfare impacts of households’ rural electrification based on panel surveys conducted in 2002 and 2005 for some 1,100 households in rural Vietnam,. The findings indicate that grid electrification has been both extensive (connecting all surveyed communes by 2005) and intensive (connecting almost 80 percent of the surveyed households by 2005). Vietnam is fairly unique in that once electricity is locally available, both rich and poor households are equally likely to get the connection. The econometric estimations suggest that grid electrification has significant positive impacts on households’ cash income, expenditure and educational outcomes. The benefits, however, reach a saturation point after prolonged exposure to electricity. Finally, this study recommends investigating long-term benefits of rural electrification – not just for households, but for rural economy as a whole.
1 This panel study of the impacts of rural electrification was conceived in about the year 2000 by Anil Malhotra, the task manager for the first Vietnam Rural Energy Project (RE), and more recently, it has been supported and administered by Van Hung Tien (World Bank Office, Hanoi) who is the task manager for second Vietnam Rural Energy (REII), and Ky Hong Tran (World Bank Office, Hanoi). The Swedish International Development Cooperation Agency (SIDA) funded all data collection and preparation, New Zealand’s International Aid & Development Agency (NZAid) provided technical assistance in the field, and the surveys were undertaken by the Vietnam Institute of Sociology. Nguyen Vinh, has been the primary person compiling data from 2002 and 2005 surveys. We thank Kevin Fitzgerald for valuable inputs on the survey instruments and data. We also acknowledge with thanks the support of the Development Infrastructure Monitoring and Evaluation (DIME). Finally, we would like to thank Ariel Fiszbein, Pedro Olinto, Niall Keleher and two anonymous reviewers for helpful comments and suggestions. Views expressed in this paper are entirely authors’ and do not reflect those of the World Bank or its affiliated organizations

1
Welfare Impacts of Rural Electrification:
Evidence from Vietnam
1. Introduction
It is universally accepted that electrification enhances quality of life at the household level and
stimulates economy at a broader level. The immediate benefit of electrification comes through
improved lighting, which promotes extended hours of study and reading and other household
chores, and in turn contributes to better educational achievements. Lighting can also benefit many
other household activities, such as sewing by women, social gatherings after dark, and many others.
Communication devices such as radios and television also improve the access to information by
rural households and can provide entertainment to family members. In addition, household’s
economic activities both from inside and outside home benefit tremendously from electricity. For
example, crop productivity can be increased by the application of electric irrigation pumps,
businesses can be operated longer hours in the evening, electric tools and machinery can impart
efficiency and production growth to industrial enterprises, and so on. The benefits of electricity have
been discussed in a large body of literature (Cabraal and Barnes 2006; Barnes, Peskin and Fitzgerald
2003; Kulkarni and Barnes 2004; Khandker 1996; Filmer and Pritchett 1998; Roddis 2000; World
Bank 2002; Agarwal 2005).
Given its substantial benefits, electrification (along with access to other sources of modern
energy) has been identified as essential for fulfilling the Millennium Development Goals (MDGs)
(UNDP 2005). The World Bank views electrification as an integral part of development and has
supported electrification projects in many developing countries. This study examines one such
electrification project called Rural Electrification I (REI) that was funded in 2000 in Vietnam. Most
of the electrification projects financed by the Bank in many developing countries often expand
coverage of grid electrification with specific objectives in mind, for example, improving welfare
(income, education, etc.), establishing institutional mechanisms for rural electrification, providing
inputs to power sector reform, formulating guidelines for tariffs, subsidies, and others. Among the

2
multiple objectives, making a positive impact on the livelihood of rural people is the foremost.
However, without proper assessment of such projects it is impossible to determine if, and to what
extent, these objectives are achieved.
Although there have been many general studies on rural electrification as it relates to
development (Barnes, Peskin and Fitzgerald 2003; Barnes 1988; Butler, Poe and Tendler 1980;
Fluitman 1983; Saunders and others 1975), there have not been many systematic impact studies of
particular rural electrification projects and this includes Vietnam. Most of the past evaluation works
on specific rural electrification projects has concentrated on project outputs (for example, number
of communities or households connected). Such assessments usually do not measure the nature and
extent of the accrued benefits, let alone establish the causality as to whether the measured benefits
are attributable to electrification.
In recent years the World Bank initiated impact studies and monitoring and evaluation
(M&E) of its own projects. This paper, supported by the Development Infrastructure
Monitoring and Evaluation (DIME) initiative of the World Bank, attempts to investigate impacts of
the World Bank financed Rural Electrification project (REI) in Vietnam on household welfare using
panel surveys fielded in 2002 and 2005. The survey data covered communes already having
electricity, those that would receive electricity under the RE project, and areas which were not
scheduled to receive electricity within a 5 year time frame and hence are treated as control.
However, many of the areas that did not have grid electricity use electricity from other sources such
as pico-hyrdo and small generating systems. So, besides estimating the impacts of rural
electrification, this study also investigates if impacts are different for project and non-project
electrification. Using rigorous estimation techniques, this study estimates the benefits of both
commune and household electrification.
This paper is organized as follows. In section 2 there is a description of rural electrification
in Vietnam, and in particular the role of EVN (Electricity of Vietnam). In section 3 we describe the
sample used for this analysis. It also addresses the attrition issue that may have affected the sample
and analysis. Attrition results from not being able to retrace or match first round households with
the follow-up sample. After a rigorous analysis, it is found that attrition is not a major issue for this
analysis. Section 4 covers the electricity use pattern of rural residents of Vietnam during both survey
years. In this section three important aspects are highlighted. Namely, it is documented that there

3
has been a significant and unexpected growth in grid electrification to all unconnected 2002
communes of the survey area by 2005. Second, it mentions that many rural households in areas that
did not have grid electricity in 2002 used a variety of sources for their electricity needs, including
batteries and pico-hydro electricity systems. Third, in this section, the demand for electricity is
estimated using a fixed-effects regression model. Section 5 discusses alternative impact assessment
methodologies used in this paper to quantify electrification benefits, including their advantages and
disadvantages. The results of electrification impact assessment are reported in Section 6. In Section
7, we examine whether longer term exposure to electricity use (measured by duration of electricity
use) affects the impacts of electricity on development outcomes. Finally, section 8 concludes the
paper with lessons learned and policy recommendations.
2. Rural electrification in Vietnam: What do we know?
Historically, electrification among the poor households in rural Vietnam was very low – only 2.5
percent at the beginning of post-Vietnam war era (1975) according to the estimates of regional
electricity supply companies (EVN 2001). From mid-1980s, however, electrification started to rise –
thanks mostly to major extensions of grid network with the construction of 35 kV distribution lines.
Among rural poor, the use of electricity rose to 14 percent by 1990 and to 49 percent by 1993.
Although these figures indicate a considerable progress in rural electrification, the effort consisted
more of connecting households in already electrified communes and less of extending grid to
previously un-electrified areas (World Bank 1994). Moreover, electrification was tied to the
objectives of national economic programs focusing on commercial aspects, such as production of
food, consumer goods and export commodities (Hanh 1992). That is, connecting agricultural areas,
industry, transport, etc. took precedence over residential connection in rural areas. At that time,
administration of the electric power sector of Vietnam was under the Ministry of Energy (MoE), and
planning and development were done by the Institute of Energy Vietnam (IEV), while generation,
transmission and distribution were the responsibility of the regional power companies. Each regional
power company had electricity offices at the provincial level and branch offices at the district level.
A major structural reform took place in 1995, with the establishment of Electricity of
Vietnam (EVN) – an entity under which many electricity sector activities were consolidated. EVN,
located in Ministry of Industry, was created by merging the Ministry of Energy, Ministry of Light

4
Industry, and the Ministry of Heavy Industry. This reform was implemented with certain main
objectives:
� Rationalize power sector institutions and functions;
� Commercialize the operations of sector entities through financial and management
restructuring;
� Introduce an appropriate legal and regulatory framework for the sector;
� Encourage and introduce private sector capital and direct participation in the sector; and
� Prepare and implement a plan to bring electricity to rural areas.
It is evident from the last objective that rural electrification became a priority. In fact, EVN
established a separate rural electrification department to take care of the approval of rural
electrification projects which were implemented by the regional companies. In 1997, the power
sector policy was further updated and the focus of rural electrification shifted more from agriculture
and small industries to households.
The establishment of EVN and its targeted rural electrification efforts resulted in a
significant increase in electrification levels and higher electrification rates for the poor households.
From a pre-reform rate of less than 50 percent, the electrification rate jumped to 77 percent in 2001.
The completion of the 500 kV line, which stretches from north to south of the country, was a major
contributing factor to increasing overall electrification rates. Furthermore, various approaches by
EVN to managing rural electricity resulted in increased electrification in rural areas (Shrestha and
others 2004). At present, rural electrification in Vietnam is managed through a network of various
entities. First, power companies sell generated electricity to the local entities at substation level at a
wholesale price determined by the government. From the substation level, local entities distribute
electricity at the retail level. To assist the Government of Vietnam in expanding rural electrification
in the country, the World Bank funded a rural electrification project in 2000 (REI). Under this
project, grid connection was expected to extend to 900 previously un-electrified communes. More
than 600 communes were connected in initial phase during 2000-2004. The second phase (REII)
began in 2005 to connect the remaining communes. Today the household electrification rate in

5
Vietnam is well over 90 percent, and this is a testament to the dedication and commitment of the
government in making access to electricity a development priority for the country.
3. Panel survey design, sample attrition, and data characteristics
The World Bank, in collaboration with Institute of Sociology (IOS) of Vietnamese Academy of
Social Sciences, initiated a study in 2001 of its RE projects in Vietnam to demonstrate how living
standards have changed over time in communes with electricity provided through the project. The
survey design framework was prepared by the World Bank and ECL (Empower Consultants). As
part of the design, a stratified random sample technique was utilized to identify households for the
survey interviews. Two stratification criteria were adopted: regional and geographical variation, and
electrification status of the commune. To make the sample nationally representative, all 8
geographical regions of Vietnam were initially considered. However, two regions (Red River delta
and North East South regions) were excluded because they did not have any communes that were
electrified under the RE project. Thus, 6 regions were considered for the study - North East, North
West, North Central Coast, South Central Coast, Central Highlands, and Mekong River delta (Table
1).2 Seven provinces were randomly selected from these 6 regions, and in each of these provinces 6
communes were to be randomly selected as follows: one commune that already had electricity (not
funded by World Bank projects), three communes that were identified as part of the electrification
project (no electricity yet in commune but eligible to be electrified under the World Bank project),
and two non-project communes without electricity (not projected to receive electricity until after
2005).
A representative sample of 30 households was drawn from each of the 42 communes,
making up 1262 households.3 Initially, three rounds of surveys were planned with two-year intervals
in 2001, 2003 and 2005. However, the first survey was not conducted until in 2002 and the follow-
up in 2005, with the third round planned for 2008. During the 2005 follow-up survey, 74
households could not be retraced, leaving 1,186 households from the first round to make up the
2 Further details on the sample selection can be found in IOS (2005). 3 The survey team consulted commune leaders in selecting the households. First, commune leaders ranked all households into three income levels: poorest, middle and upper. Then, survey team picked 10 households randomly from each level.
6
panel. Moreover, 68 more households were discarded from panel analysis during the data cleaning
process, leaving eventually 1,120 households from 41 communes.
There is a large body of literature that demonstrates that even a high attrition rate is a non-
issue as long as it is random (Alderman and others 2000; Fitzgerald, Gottschalk and Moffitt 1998;
Thomas, Frankenberg and Smith 2001; Ziliak and Kniesner 1998). For example, Fitzgerald,
Gottschalk and Moffitt (1998) found from Michigan Panel Study of Income Dynamics (PSID) that
households with lower earnings, lower educational levels and lower marriage propensities are more
prone to attrition. Their dataset had a high 50 percent attrition rate, still they found that there is no
relationship between attrition rate and magnitude of attrition bias and that even large attrition causes
unbiased estimation if attrition is random.
This study has been quite successful in keeping attrition of the sample to moderately low.
Altogether 142 households from 2002 were not available for panel analysis, implying an attrition rate
of 11.3 percent. We can formally test if attrition biases our estimates, namely, if reduced sample size
because of attrition matters in our estimation. We investigate the issue of attrition in two ways. The
first includes investigating the determinants of household attrition and the second is to analyze to
what extent attrition biases the estimates. To estimate the determinants of attrition, a probit
regression is run with attrition dummy (1 for households that were in first round but not the follow-
up survey, and 0 otherwise) as dependent variable and household- and commune-level
characteristics observed in 2002 data as explanatory variables (Appendix Table A1). As evident
from Table A1, attrition in our Vietnam data has very little to do with observed household and
commune characteristics.
To test attrition bias further, we regress outcome variables of the first round survey on the
exogenous X-variables (age, sex and education of household head, maximum education of
household’s adult males and females, community variables and so on), attrition dummy and attrition
dummy interacted with X-variables. Since our purpose is to determine whether coefficients of the
explanatory variables differ for those households that were lost from those that were re-interviewed,
we performed a joint significant test (F-test) of the attrition dummy and its interaction variables.
From the results we see that at 5 percent level, only the coefficients of boys’ schooling variables are
significantly different for those households that were lost from those that were re-interviewed

7
(Appendix Table A2). So, out of 8 outcome variables, attrition bias barely matters only for 2 of
them. Thus we conclude that overall, attrition bias is not an issue for our study.
4. The demand for rural electrification
Overall, household electrification rose three times in survey areas between the two surveys – from
26.1 percent to 79.7 percent (Table 2). Project communes experienced the highest growth in
electrification (from 49 households to 476, an almost ten-fold growth), followed by non-project
communes (from 77 households to 229, a three times growth). So we see that rural electrification in
survey areas were both extensive and intensive, both in project and non-project areas. We would
investigate the general impacts of grid electrification first and then examine if there is any difference
between the intervention effects of World Bank project and entities external to World Bank project.
The trends and transitions in grid electrification of communes and households between 2002
and 2005 indicate that there was a considerable shift in commune status of electrification compared
to what was expected during survey design phase (Table 2). By the time the first round of survey was
fielded in 2002, 7 communes in the project area already had received electricity by the project. In
addition, 8 communes in non-project area which were supposed to be the control sample were
provided with electricity through activities not related to the World Bank project. And these two
types contributed to 11.3 percent electrification of the 2002 household sample (4.4 percent in
project communes and 6.9 percent in non-project communes). Finally, by 2005 all 42 communes
had received grid electricity, including those designated as non-project by the World Bank project.
There was a significant shift in household’s electricity use pattern between the survey years
(Table 3). The rate of grid electrification jumped from 26 percent in 2002 to almost 80 percent in
2005, while the share of households without any form of electricity dropped from 55.6 percent to 12
percent during the same period. The share of households that use off-grid electricity also dropped
from 18.4 percent to 8.4 percent. Households use grid electricity mostly for lighting, followed by
watching TV, some reading, and other activities. Even those households that have home-based
business or enterprise use electricity predominantly for lighting and seldom for production or other
business operations. A recent study finds that only 9 percent rural households in Vietnam use
electricity for business or production purpose (IOS 2005).

8
Many households that did not have grid connectivity in 2002 seemed to have resorted to
alternate sources for electricity. For example, households in Ha Giang province had the lowest rate
of grid connectivity in 2002 (14.5 percent), and their off-grid electricity use, not surprisingly, was the
highest (more than 41 percent). Moreover, they experienced highest growth in grid connectivity
between the survey years – from 14.5 percent to almost 92 percent. Composition of the ‘Others’
category (last column in Table 3) is not very clear - this could be a unit driven by a generator (own
or rental), geothermal, or wind power.
Unlike the rural households in many other developing countries who get their electricity
from grid, a good number of rural Vietnamese uses a variety of sources, notable among which are
mini grid, pico-hydro, and diesel. A mini grid system uses a mechanism that diverts some of the
water flow of a river through civil works (intake weir, fore bay, etc.). Mini grid technology is simple,
and so is its operation and maintenance. It can be built locally at a low cost and has a moderately
reasonable capacity to serve private investors.4 A pico (also known as pico-hydroelectric) power
plant is of very small capacity (1 kilowatt or less), uses a technology similar to that of mini grid and
incorporates all of the electro-mechanical elements into a portable device. It is easy to install and the
power output is sufficient for a single house or small business. A diesel engine can provide a wide
range of power (from several hundred watts to 20 megawatts), has a low initial cost, is easy to install,
and is reliable enough to be extensively used. Besides these three sources, generator (own or rental),
geothermal, or wind power are also used by a small number of households.5
Given the proliferation of household electrification, it is worth investigating what factors
determine a household’s grid connectivity. A household’s decision to get grid electricity may be
influenced by factors of its own and its commune, including availability of electricity at the
commune level. An equation for household’s access to grid can take the following form:
(1)
where t denotes time of survey (0 for baseline and 1 for follow-up), is the electricity access
variable (1 if household has grid connection and 0 otherwise) for the i-th household of the j-th 4 A mini grid can provide as much as 5 megawatt of capacity. 5 An extensive discussion of a wide range of electrification technologies can be found in World Bank (2006).
9
village, is a vector of household characteristics (for example, head’s age, gender, household
landholding, etc.), is a vector of commune characteristics (for example, infrastructure and price
variables, including the commune-level prices of alternative sources of energy such as firewood and
electricity), , and are parameters to be determined, and is the non-systematic error. Note
that the error structures may include unobserved commune and household factors that may make
simple OLS biased. Since there is repeated observations both at the household and commune level,
we will use a fixed-effects (FE) method to estimate the demand equation (1).6
In Vietnam as expected the household’s own observable characteristics play little role in
household’s decision to get connection. The policy in Vietnam has been to provide electricity to
those communes that are more productive and more densely populated, but to encourage all
households to connect to the grid once it is available in the commune. Thus, only adult male’s
education in the household has some positive significance (Table 4). Interestingly, household’s
landholding, an important indicator of household’s prosperity and income, has no significant impact
on household’s grid connectivity. On the other hand, also as expected, commune characteristics are
important. For example, a household from a commune with motorable roads is 62 percent more
likely to have electricity than one in a commune without motorable roads. Commune distance to
state or national grid line is negatively related to household’s grid connectivity. Overall, households
from a developed commune are likely to get grid connection more than households from an under-
developed commune. This finding suggests that once a commune gets grid, poor households do not
necessarily fall behind the rich households in connecting to grid. This is probably because poor
households that cannot afford full connection fee get subsidized rates from commune, district and
province authorities.7 This relative equality in the rate at which rural households connect to the
electricity grid within communes makes it easier to sort out some of the development impacts of
rural electrification among the rich and the poor. This is because household income and therefore
the affordability of electricity in most countries have a confounding effect on the analysis of 6 As the outcome is a binary variable we should run a logit regression. Unfortunately an FE logit cannot be run because it drops a large number of observations since the outcome variable does not change across years. We therefore used linear FE method to estimate the demand equation. 7 Because of the socialistic mode of governance, commune leaders have long upheld a notion of equal treatment for all members. So communes help defray connection costs for poor households. Communes maintain a list of households that meet eligibility criteria for such special treatment. Our data, however, do not contain any information about connection subsidies.

10
electricity’s impact on income because one needs to be careful as to whether income leads to
adoption of electricity or adoption of electricity improves income.
5. An applied methodology for assessing the benefits of electrification:
Assessing the impact of electrification involves estimating the following conditional outcome
equation:
(2)
where Y is outcome variable such as income and expenditure. The problem in estimating the impact
of electrification (E) on outcome (Y) is that the demand for electricity (as shown in equation 1) and
the outcomes of interest such as income or expenditure (Y) in (2) are jointly determined by the same
set of both observed and unobserved characteristics. More specifically, is a composite error
term having three components:
(3)
Where and are respectively commune and household level unobserved determinants of the
outcome, and is the non-systematic error uncorrelated with other error terms or regressors. In
this case, both E and Y are determined by the systematic unobserved commune and household
characteristics.
Moreover, because of joint determination of Y and E, it is not clear how electrification (E)
affects an outcome such as income (Y), as we postulate in equation (2). In fact, one can also
postulate that household income (Y) can influence a household’s electricity (E) status, given that a
commune has electricity, thereby making E dependent on Y, unlike the relationship in equation (2).
Such a joint determination of Y and E raises an issue of what causes what.
Following the consumer theory of demand, the equation (2) states a conditional demand
function, where household outcomes such as income and consumption depend on other exogenous
household- and commune-level characteristics, conditional on the availability of electricity. The fact
11
is that there may be some unobserved EVN policy variables that affect provision of electricity at the
commune level and hence, household’s access to electricity. Also the exogenous provision of
commune-level electricity by EVN affects only household’s electricity use but not its income or
consumption expenditure directly. That is, although the demand for electricity (E) is determined by
the same factors that affect income or consumption, there is an element of exogenous policy that
affects the provision of electricity at the commune level, and hence, household use of electricity.
This makes income or consumption dependent partially on the exogenous provision of electricity.
With this assumption, electricity consumption can be distinguished from household income or non-
electricity consumption.8 Our next question is how to estimate the impact of electricity on outcomes
of interest.
The impact evaluation of such an intervention attempts to measure changes in welfare
indicators (like consumption expenditure and schooling attainment) that can be attributed to the
policy intervention. Simply taking the difference of an outcome such as income before and after the
electricity connection does not yield the desired impact. That is because, such differences capture -
besides the policy intervention effects - effects due to factors affecting the household’s
electrification status (for example, unobserved agroclimatic endowments of an area or the
entrepreneurial ability of the heads of households electrified), which may also affect the outcome.
Since and are unobserved, any influence of them on the outcome cannot be determined
and the estimated impacts of electrification would be biased. In that case, household’s decision to
have electricity may be correlated with the error term, , giving rise to possible endogeneity. We
need to find a way to separate policy intervention impacts of electrification from the unobserved
extraneous effects.
i) Difference-in-difference (DD)
For simplicity, we assume that outcomes of interest (Y) depends only a household’s electrification
status (E), given the conditional policy of whether the commune has been electrified, plus the fixed
unobserved characteristics, ) and ( . That is,
8 Note also that we do not regress electricity demand on income as in equation (10 above but the ultimate determinants of income such as fixed assets and educational endowments. In fact, these physical and social endowments influence income and electricity use in both short- and long-term.

12
(4)
Ideally, the way to measure the impact of electricity connection is to take the difference
between the outcome after the intervention and that which would have resulted in without the
intervention, a situation called the counterfactual. But a true counterfactual does not exist since a
sample either gets the intervention or not. In absence of a true counterfactual, we simulate it with
the help of a comparison group, and the most common and simplest method to do so is the so-
called difference-in-difference or double difference (DD) method that combines a ‘with and
without’ approach with a ‘before and after’ approach using baseline (assumed pre-intervention) and
follow-up data (assumed post-intervention). If all variables are observable (that is, and are
absent), DD would determine, without bias, the impact of household electrification.
That is, the impact of grid electrification using DD method is given by,
IO = (YT2 – Y T1) – (YC2 – Y C1), (5)
where,
YT1 = Outcome of the treated group in 2002
YT2 = Outcome of the treated group in 2005,
YC1 = Outcome of the comparison group in 2002,
YC2 = Outcome of the comparison group in 2005.
Using this differencing technique, we cancel the role of unobserved factors such as ) and ( .
So the two difference terms can be explained as,
(YC2 – Y C1) = Change in outcome for the comparison group that is due to time
trend plus extraneous factors,
(YT2 – Y T1) = Change in outcome for the treatment group that is due to time trend,
extraneous factors and of course treatment

13
and the second difference (YT2 – Y T1) – (YC2 – Y C1), denoted by IO in equation (5), gives the
treatment effect ( ) for the treated group.
However, instead of taking manual difference of the outcomes, DD can be implemented
using a simple regression given by:
(6)
where T is the treatment variable, t is the time dummy, and the DD, coefficient of the interaction of
T and t , gives the estimate of the impact of treatment on outcome Y. For DD method to work it is
assumed that treated and comparison groups are similar so that effects of extraneous factors are the
same on both of them.
ii) DD with fixed effects (FE) regression
Simple DD controls for time invariant unobserved characteristics but does not control for various
observed household and commune characteristics that may influence the impacts. For example,
households with more land are more likely to have higher income than households with less land.
With panel data, we therefore implement a household-level fixed effects (FE) regression technique
that controls for both the observed and unobserved characteristics that possibly influence the
outcomes. Let us assume that outcome of a particular kind (such as consumption or income)
conditional on the treatment of household electrification can be expressed as follows:
(7)
where, the subscript t denotes time of survey (0 for baseline and 1 for follow-up), is the welfare
outcome of the i-th household of the j-th commune, and are vectors of household and
commune characteristics, T is the treatment variable indicating household’s access to grid electricity
(with a value 1 when household has access, or 0 when it does not), , , are parameters to be
estimated, DD gives the treatment effect as before, and is the composite error term as defined
above. As the errors are assumed time-invariant, a household fixed-effects estimate would get rid of
bias due to unobserved heterogeneity. So we consider DD with FE model technically better than
simple DD for assessment of grid electrification impacts.

14
iii) Propensity score matching with double difference (PSM-DD)
As shown above, the key assumption for the FE regression or simple DD is that the unobserved
factors remain fixed over time. However, for certain reasons, the unobserved characteristics
( and ) may change over time and that the FE does not control for time varying household or
commune level heterogeneity. For example, the time-trend and extraneous effects are assumed to
work the same way on both the comparison and treated groups. But this may not be true, as there
may be fundamental difference in initial characteristics between the households with grid and those
without, which might in turn lead to varying time-trend unobserved effects. In other words, and
become time varying and thus, the composite error structure, , loses its property of being
independent of outcomes.
The bias due to endogeneity of unobserved heterogeneity may be addressed in two possible
ways. The first way is the so-called instrumental variable method (IV) where treatment can be
regressed against all X and V variables plus some observed characteristics such as an exogenous
eligibility condition set by EVN that only affect treatment but not the outcomes. However, in
practice EVN does not have such eligibility conditions, and instruments are thus indeed difficult to
find to resolve this bias. The second way to address time-varying unobserved heterogeneity is to
control for initial conditions. Indeed a major source identified for making the error structure vary
over time is the differential initial condition (Ravallion 2005). The resulting bias can then be
controlled for by adopting a so-called propensity score matching (PSM) technique along with the
DD method.
The PSM is the most commonly used matching technique used for impact assessment.
Instead of directly matching observable characteristics of the two groups, PSM calculates the
probability of treatment (called propensity score) for both treatment and comparison groups based
on their baseline observable characteristics, and then keeps only a subset of original sample where
propensity score of a comparison unit matches that of a treatment unit. After that DD-technique is
applied to the reduced sample to calculate the impacts. Formally, the propensity Score is defined by
Rosenbaum and Rubin (1983) as the conditional probability of receiving a treatment given pre-
treatment characteristics:

15
(8)
where is the treatment variable and is the vector of pre-treatment observable
characteristics. Rosenbaum and Rubin (1983) show that if treatment is random within cells defined
by , it is also random within cells defined by the values of the propensity score . So, if the
propensity score is known, the impact of the treatment (which they call Average effect of
Treatment on the Treated or ATT) can be estimated as follows:
(9)
where the outer expectation is over the distribution of ( ) and and are the
outcomes in the two counterfactual situations of (respectively) treatment and no treatment. More on
propensity PSM technique can be found in Becker and Ichino (2002).
The advantage of PSM is that it does not assume a predefined functional relationship
between the outcome and control variables, a limitation of any regression model. However the
limitation of PSM is that it cannot screen the sample for unobservable characteristics. Another
shortcoming of PSM is, if a good portion of the original sample is discarded due to matching, the
remaining sample may become unrepresentative of the population.
In this paper, we used PSM to identify a matched sample of panel data, not to estimate
treatment impacts. This is done using the baseline data (that is, treated and untreated households are
matched based on baseline characteristics) and then same households included from the follow-up
survey data to form panel. Finally, DD method is applied to the panel. To be more specific, we
apply FE regression on this matched panel sample to control for biases due to unobservable
characteristics (assuming they are time-invariant). We report the results of all three techniques
discussed above which give us a broader perspective on the extent and nature of impacts of
electrification on household welfare.

16
6. Findings: benefits of rural electrification
i) Benefits of commune electrification
As we have seen before, all sample communes have been connected to grid by 2005, making no
comparison group available at commune level in the follow-up survey. So a true DD method cannot
be implemented to estimate the benefits of commune-level access to grid electrification. But we still
can make use of the data to see commune-level effects for differences in the years of electrification
exposure.
Two types of outcomes are considered: economic (income and expenditure) and educational
(school participation and completed schooling years). Unfortunately, our data, particularly that of
2002, collected information only on cash income and expenditure. So we use cash income and
expenditure, instead of total income and expenditure, in our analysis.9,10
Summary statistics are presented in Table 5 for the outcome variables by commune-level
grid connectivity in 2002 and 2005. Outcomes of treated and comparison communes in 2002 clearly
show that grid-connected communes are better off than those without grid. This result was to be
expected because the extension of rural electrification to communes during that period was done
based on a combination of factors, including economic factors, availability of local infrastructure,
and population density. However, there may also be some impacts due to a community having
electricity. Thus, as expected, households in communes with grid have higher cash income (in real
terms) and better schooling outcomes than those in non-grid communes. And almost all outcomes
improved from 2002 to 2005, except for farm and total income which dropped slightly.
The availability of the panel data for Vietnam makes possible three types of comparisons
(Table 6). The first that we examine is the difference of outcomes between the communes with and
without electricity in 2002 gives a with-and-without estimate (second column). The with-and-
without estimates show that households in communes with electricity are better than those in
communes without electricity in 2002 in all economic measures and the differences are all
significant. For example, total income and per capita expenditure in grid-connected communes are
9The major source of households’ non-cash income and expenditure is their farm production which the households consume themselves. Unlike the 2002 survey, 2005 survey collected information on non-cash consumption that the households produce, and they account for only 13 and 11 percent of total income and expenditure. So if we assume similar pattern for 2002, we can infer that the trends in income and expenditure benefits from electrification are also similar. However, in cases where households switch between non-cash and cash intensive activities between the survey years, benefits in cash income and expenditure due to electrification may not reflect well the patterns in total income and expenditure. 10 The monetary figures of 2005 throughout this paper have been adjusted by inflation rate with base year being 2002.

17
over 80 percent higher than those is communes without grid. Among the educational outcomes,
only boys’ enrollment gain is significant, while girls’ is not. As indicated, this may be due to a
combination of the way the communes were selected as part of the rural electrification plan and may
also be the result of the impact of electrification as well.
The second method of analysis is made by examining the difference between 2002- and
2005-outcomes for communes that were without grid in 2002 but got electricity in 2005 gives a
before-and-after estimate (third column). These effects are just as strong as the with-and-without
electricity results for both economic measures and educational outcomes. For instance, school
enrollment increased 17.1 percent for boys and 14.8 percent for girls in communes that received grid
between 2002 and 2005.
Finally in the third method we compare the difference between 2002- and 2005-outcomes
for communes that have grid in both years. This provides an estimate of benefits due to continued
exposure to electricity.11 Unfortunately, because our control communes lost their control status for
being electrified by 2005, we could not apply the standard double difference (DD) method to
measure the average treatment effect of commune-level electrification by comparing this group to
those without electricity for both years. Also it should be kept in mind that there are only three
years between the survey years, so large changes were not expected. In fact, this is confirmed
because the durational benefits of electricity are not very strong or consistent for economic
outcomes. Only per capita expenditure registered a positive growth, and non-farm income in fact
dropped for grid-connected communes during 2002-2005. However, all schooling outcomes
improved in these communes – more for girls than for boys. Although these estimates suggest that
communes with grid do better than those without grid, these benefits may simply indicate a trend
and can not be attributed to grid connectivity as there is no real control group of communes without
electricity for both years. In the next and subsequent sections, we will shift our focus to the benefits
of household-level connection to grid electricity and a longer term analysis of the durational benefits
of electrification.
ii) Benefits of household electrification
One unique feature of this study is the availability of comparison groups for both households with
and without electricity for the years 2002 and 2005. This enables us to use a variety of evaluation
techniques, including the double-difference method. Before we use such techniques we look at the
outcome variables by electrification status in both years. In order to observe the change in outcome
11The economic outcomes are expressed in log form from now on so that their difference gives a percentage change.

18
variables by electrification and year, households are categorized into three groups: those without grid
in either year (we call them group 1 households), those without grid in 2002 but with grid in 2005
(group 2), and those with grid in both years (group 3). Table 7 shows that both farm and total cash
income increased between the survey years for group 1 households, while they went down for
households in group 3. This may simply mean that households without grid electricity are more
engaged in cash transactions than those with grid, or there are other factors than grid connectivity
that can influence household income. Isolating the effect of grid connection from those factors is
the key to any impact study, which we will do soon. Like the households in group 1, those in group
3 (with grid in both years) experienced a growth in farm and total income. Only households in
group 2 saw their non-farm cash income go up. Cash expenditure for all three types of households
went up. Education outcomes went up for all households. Households in group 3 are distinctly
better of in education outcomes than the others in both 2002 and 2005.
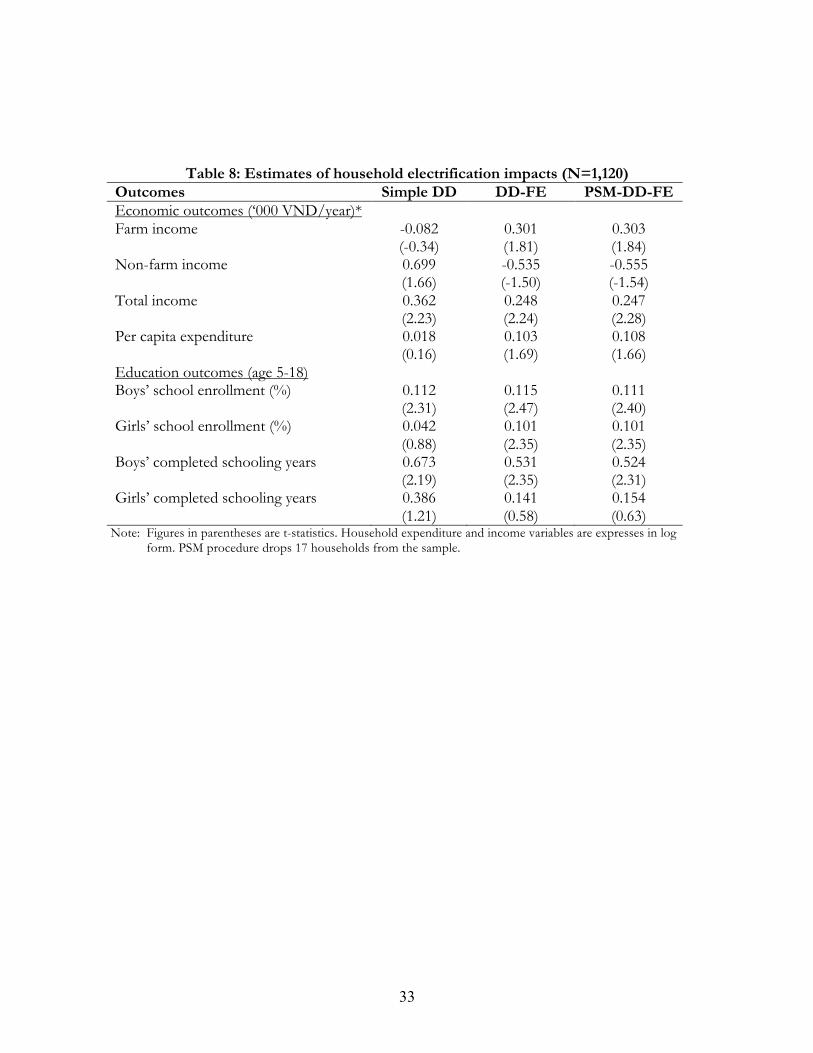
Now, we look at grid electrification impacts using a simple double-difference technique.
After controlling for time-trend effects and time-invariant unobserved factors, significant impacts
are observed only on non-farm and total income among the economic outcomes (Table 8). Grid
electrification increases household’s total income by 36 percent, but surprisingly there are no
impacts on expenditure. For this method, the findings on educational outcomes indicated that only
boys benefit from rural electrification. Boys’ school enrollment goes up by 11 percent and
schoolings years by 0.67 as a result of the household connecting to the grid. For this method at least,
the impacts on girls’ schooling achievements are not significant. But as we will see, there are some
differences between the findings of the various statistical techniques.
Next two models improve upon the simple double-difference method. The results of fixed-
effects estimates actually extend the double-difference technique by adding household- and
commune-level covariates as additional dependent variables. This type of fixed effects regression
controls for biases due to observed and unobserved characteristics. Taking this method again one
step further, we refine the results of fixed-effects model by using a propensity score matching
techniques. The technique involves matching household with similar characteristics with the
exception of having electricity and then using the fixed effects methods for samples of these

19
households who are closed comparators. The results of these two methods are very similar as
shown in Table 8.12
Electrification impacts from the more rigorous fixed-effects models are different from
simple double-difference estimates. According to fixed-effects estimates, electrification increases
household’s cash farm income by 30 percent, with no effect on non-farm income. This is actually
somewhat contrary to what many perceive as the impact of rural electrification in Vietnam. The
explanation may be that household that connect to the grid have the possibility of using electric
pumps, and the use of electric pumps can dramatically improve farm productivity.13 But non-farm
activities are not significantly related to the adoption of electricity. As for the household’s total
income, there is an increase of about 25 percent due household electrification. As opposed to the
simple DD method, in this model per capita expenditure increases by almost 10 percent due to
electricity adoption. There also are some notable differences for school enrollment. The enrollment
in school improves in similar fashion for both girls and boys as a consequence of rural
electrification.
The original purpose of the surveys was to be able to examine the impact of the World Bank
rural electrification project. However, as indicated many households in the sample received
electricity (from other sources) due to the overall increase in efforts of the electricity companies in
Vietnam. Having established the fact that grid electrification in general improves household’s
welfare outcomes, it is interesting to find out if World Bank project makes any unique difference
compared to the non-World Bank rural electrification.
To investigate this issue, we use the FE equation in following format:
(10)
where, additional interactions are added for World Bank project (P) and non-project areas (NP) to
separate impacts for project- and non-project-funded electrification. The parameters DDp and DDnp
12 The baseline characteristics considered here are same as those used in the household’s electrification demand equation. The probit estimate used for matching is shown in the Appendix Table A3. 13 Ownership and use of electric pumps depend not necessarily on household’s grid connectivity but on grid connectivity in the commune and provision for irrigation use of electricity. Our data shows a much higher level of use of electric pumps by grid households (11.4 percent) than by non-grid households (0.7 percent).

20
capture those effects respectively, and equation (10) is implemented by using fixed-effects model
(Table 9).
Although there are some slight differences in the estimates of the project and the non-
project rural electrification, the differences are not enough to be significant. The conclusion is that
from the households’ perspective it is the electricity that matters regardless of the source of funds.
Rural electrification is carried out in the same way by the same country, so we would have been very
surprised if there had been a difference between electricity provided by the World Bank project
compared to the more general program by the government.
7. Differential returns by exposure to grid electrification
Until this point, we have examined the impact of rural electrification only according to whether or
not a household has a connection. This does not take into consideration any difference in the length
of time that a household has had electricity. In fact it is quite likely that a household that has had
electricity for few months may not reap the same benefit as one that has had it for 10 years. After
all, it does take time for the household to purchase appliances. The addition of a television, radio,
fan or extra lights increases the benefits no doubt, but that also requires that a household have
enough income for the purchase of such items. These expenses in all likelihood will be spread over
a longer period of time. In this section we are going to investigate whether the length of time a
household has electricity matters in terms of the level of benefits.
Household’s electricity consumption goes up as households acquire more and more
electricity appliances (Table 10). Although lighting is the most significant use of electricity,
households, as indicated, gradually diversify their electricity use patterns. The applications might
include entertainment (radio, television), space conditioning (fans, refrigerators) and other domestic
appliances, thus increasing electricity consumption. To examine this impact, households are grouped
according to the length of time their household has had electricity.14 As expected, the use of
electricity increases with the duration of having electricity. Interestingly, the rate of electricity use
increases at a fairly high rate until about the 6th year, then levels off 8th year, after which
consumption again begins to grow. At the second year of having electricity a household consumes
about 36 kwh per month, and by the 9th year it increases to about 60 kwh/month.
14 This exercise is restricted to grid users of 2005 only.

21
Before turning to the modeling results, we first examine the cross-sectional relationship
between duration of electricity use and household outcomes. It should be kept in mind that these
cross-sectional results are influenced by the fact that electricity distribution companies generally
extend electricity to more developed communes and then only later move on to more remote and
generally poorer ones. Thus, it might be expected that these cross-sectional results may have an
inherent bias against the more recently connected rural households. However, the results do not
totally bear this assumption out. There is no steady trend in economic outcomes as the length of
time that a household has electricity increases (Table 11). However, those households with grid
electricity for more than 10 years are distinctly better off than the rest, and this is probably due to a
combination of being better off at the outset and then making income gains over the years. The
findings for education are quite different with both school enrollment and years of completed
schooling consistently improving with increasing duration of having electricity in the home. For
instance, for those households with electricity 10 or more years boys have a 100 percent enrollment
rate, while girls’ enrollment rate is 93 percent.
Having observed a trend in electricity consumption and welfare indicators as the exposure to
electricity increases, it is now worth exploring the benefits of electrification by such exposure. For
example, the first round data of 2002 in our sample already contains some electricity users;
therefore, we can make a distinction between those households that got electricity in or before 2002
and those received electricity after 2002, and investigate the difference in benefits between them. A
comparative assessment of benefits of these two types of beneficiaries can be done using the triple
difference (DDD) estimation technique, which is basically the difference between double-
differenced benefits for early and recent connectors. It is formally given by,
IO = [(YTL2 – Y TL1) – (YC2 – Y C1)] – [(YTE2 – Y TE1) – (YC2 – Y C1)] (11)
where,
YTE1 = 2002 outcome of treated group who got electricity in or before 2002
YTE2 = 2005 outcome of treated group who got electricity in or before 2002
YTL1 = 2002 outcome of treated group who got electricity after 2002
YTL2 = 2005 outcome of treated group who got electricity after 2002

22
YC1 = 2002 outcome of comparison group who never received electricity
YC2 = 2005 outcome of comparison group who never received electricity
and the two difference terms can be explained as,
(YC2 – Y C1) = Change in outcome for the comparison group,
(YTE2 – Y TE1) = Change in outcome for early entrant treatment group,
(YTL2 – Y TL1) = Change in outcome for late entrant treatment group,
(YTE2 – Y TE1) – (YC2 – Y C1) = DD estimate of electrification impacts for early connectors
(YTL2 – Y TL1) – (YC2 – Y C1) = DD estimate of electrification impacts for late connectors.
Like DD estimates, DDD can also be implemented using a simple regression given by:
(12)
where TE and TL are the treatment variables for early and late connectors, t is the time dummy, and
the difference in coefficients of the interactions of T and t, that is, (DDE–DDL) gives the DDD
estimate of the impact of treatment on outcome Y. However, instead of using simple regression we
extend it with other covariates and run FE similar to equation (7).
Table 12 reports the results of the DDD estimates. The results show that the returns of
early connectors are higher over late connectors in the case of farm income and per capita
expenditure. For example, the impact on per capita expenditure of early connectors is 25.6 percent
higher than that of late connectors. We do not observe any impact differential on schooling
outcomes between the two groups.
Since returns of electrification are higher for early connectors than for late connectors, it is
possible that returns on electrification are diminishing in the long run, which eventually reaches a
plateau. This scenario is depicted in Figure 1, where outcome (Y) is plotted against duration (D). As
the graph shows, the outcome increases as duration increases until a point is reached (point C on the
curve) when outcome becomes flat. The tangent on the curve at this point is horizontal (parallel to
X-axis) and turns from positive to zero. The duration at which this transition takes place is
given by the expression, .

23
Figure 1: Long-term relationship of household outcome and duration of electricity
To determine the quantitative relationship of this nature, we model an equation that
expresses outcome as a function of duration of electricity exposure and its squared term among
other covariates,
(13)
The squared term is included to investigate the long-term trend in benefits. For this exercise we look
at the returns in income since income is the most important economic outcome. The results in Table
13 show that duration has significant positive impacts on household’s income - an additional year of
electricity use increases household’s income by 7.4 percent. However, as evidenced from the
negative sign of the squared term of the duration, return on income is diminishing. Net impact on
income is less than 7.4 percent and given by the expression (�-2�), which is 6.6 percent based on
Table 13. An important aspect of this exercise is, by differentiating equation (13) with respect to
Duration (D) Dc
Outcome (Y)
�
�
C

24
duration D and setting to 0, we get the duration at which benefits cease to increase, as shown in
Figure 1. From the results shown in Table 13, this duration is found to be 9.25 years. So we
conclude that households continuously enjoy electrification benefits for a fairly long time until
benefits reach a saturation point because of diminishing returns.
8. Conclusions
The rural electrification project in Vietnam has had a significant impact on rural welfare. In this
study we have been able to use panel estimation to carry out a more detailed analysis of the impact
of rural electrification on income, expenditures, and children’s education. The direct impact of rural
electrification on income comes through a variety of channels, including farm and non-farm income.
These welfare impacts are persistent even though there is no strong evidence that there are
additional rural industries in the survey areas that are benefiting from rural electrification. In
addition to affecting income, rural electrification probably has its strongest impact on school
attendance by children in households adopting electricity and this is true for both boys and girls.
These impacts obviously have a long term influence on the welfare of the country as a whole as
these children move into the workforce both at higher and more productive levels.
One unique feature of this study, which is in part due to the way the sample was designed, is
the scope for distinguishing electrification impacts of World Bank-funded projects from those of
projects funded by external sources. We were able to determine that in the case of Vietnam the
World Bank rural electrification project has the same impact as the projects funded by other sources.
This was expected because the government carried out both the World Bank project and other
projects in essentially the same way.
We also were able to address the issue of whether rural electrification benefits are
diminishing in the long run. The impacts are higher during first few years after a household receives
electricity, and incremental benefits eventually level off after about 9 years of electricity use. During
this time frame, the use of electricity and the adoption of appliances increase year after year.
Even with this evidence of the impact of rural electrification on household welfare, it
remains to be seen what effects these benefits have on rural economy as a whole. It must be
remembered that rural electrification is a necessary but not sufficient condition for improvement of
local economy. From policy perspective, a broad-based approach should address other

25
infrastructural developments as well. Second, EVN provides electricity for commercial and industrial
customers in rural areas, besides residential customers. It would be worth exploring the
electrification benefits for those customers as well – to get a measure of the overall rural economic
growth due to electrification. It is well documented that farm productivity improves with the use of
electric pumps for irrigation. Non-farm productivity in both small commercial and home businesses
also may increase due to the ability keep working or stay open after dark. This improved
productivity may be the result of having electric lighting during the evening hours or more efficient
electric tools and machinery.
Nevertheless, this first panel analysis the impact of rural electrification in Vietnam has
documented what many have been speculating on for many years. The investments in rural
electrification in Vietnam will have an impact for many years to come both in terms of improved
income and better education of the country’s population. The indirect or direct impacts on the
overall economy of Vietnam will be hard to assess, but the evidence at the household level is both
strong and consistent with much other work that is emerging on the impact of infrastructure in the
developing world.

26
References
Alderman, Harold, Jere R. Behrman, Hans-Peter Kohler, John A. Maluccio and Susan C.
Watkins. 2000. “Attrition in Longitudinal Household Survey Data: Some Tests for
Three Developing-Country Samples.” Policy Research Working Paper No. 2447, The
World Bank, Washington D.C.
Barnes, Douglas, Henry Peskin, and Kevin Fitzgerald. 2003. The Benefits of Rural
Electrification in India: Implications for Education, Household Lighting, and Irrigation. Draft
paper prepared for South Asia Energy and Infrastructure, the World Bank,
Washington, DC.
Barnes, Douglas. 1988. Electric Power for Rural Growth: How Electricity Affects Rural Life in
Developing Countries. Boulder, CO: Westview Press.
Becker, S. O. and Ichino, A., 2002, “Estimation of average treatment effects based on
propensity scores”, The Stata Journal, Vol.2, No.4, pp. 358-377.
Butler, Edward, Karen Poe, and Judith Tendler. 1980. “Bolivia: Rural Electrification”, U.S.
Agency for International Development (USAID) project impact evaluation.
Washington, DC: U.S. Agency for International Development.
Cabraal, Anil, and Douglas Barnes. 2006. “Productive Uses of energy for Rural
Development,” Annual Review of environment and Resources. vol. 30 pp. 117-144.
Electricity of Vietnam (EVN). 2001. Electricity of Vietnam Annual Report 2001, Vietnam.
Fluitman, Fred. 1983. “The Socioeconomic Impact of Rural Electrification in Developing
Countries: A Review of Evidence”, International Labour Organisation (ILO)
working paper
Filmer, Deon, and Lant Pritchett. 1998. The Effect of Household Wealth on Educational Attainment
around the World: Demographic and Health Survey Evidence. The World Bank Institute
Development Studies, Washington, DC.
Fitzgerald, John, Peter Gottschalk, and Robert Mofitt. 1998. “An Analysis of Sample
Attrition in Panel Data.” The Journal of Human Resources Vol. 33 (2), 251-299.
Hanh N. V. 1992. “Rural Electrification in Vietnam”, Rural Electrification Guidebook for Asia
and the Pacific, Economic and Social Commission for Asia and Pacific, Asian Institute
of Technology Commission of the European Communities, Bangkok, Thailand, pp.
456-469.

27
IOS. 2005. Rural Electrification Impact Study and Analysis, Institute of Sociology, Vietnam
Academy of Social Sciences, Hanoi, Vietnam (mimeo).
Khandker, Shahidur R. 1996. Education Achievenments and School Efficiency in Rural Bangladesh,
World Bank Discussion Paper No. 319, Washington, DC
Kulkarni, Veena, and Douglas Barnes. 2004. The Impact of Electrification on School
Participation in Rural Nicaragua. Working paper, University of Maryland, MD.
Ravallion, Martin. 2005. “Evaluating Anti-Poverty Programs,” World Bank Policy Research
Working Paper No. 3625.
Roddis, Suzanne. 2000. Poverty Reduction and Energy: The Links Between Electricity and Education.
The World Bank, Washington, DC (mimeo).
Rosebaum, P.R., and D. B. Rubin, 1983, “The Central Role of the Propensity Score in
Observational Studies for Causal Effects”, Biometrika, Vol.70, No.1, pp.41-55
Saunders, John, J. Michael Davis, Galen C. Moses, and James E. Ross. 1975. Rural
Electrification and Development: Social and Economic Impact in Costa Rica and Colombia.
Boulder, CO: Westview Press.
Shrestha, Ram M., S. Kumar, M. J. Todoc, and Sudhir Sharma. 2004. Institutional Reforms and
Their Impact on Rural Electrification: Case Studies in South and Southeast Asia, Sub-regional
Technical Report by Asian Institute of Technology, Prepared for Global Network on
Energy for Sustainable Development (GNESD), Thailand.
Thomas, Duncan., Elizabeth Frankenberg, and James P. Smith. 2001. “Lost but not
Forgotten: Attrition and Follow-up in the Indonesian Family Life Survey.” Journal of
Human Resources, Vol. 36 (3): 556-592.
World Bank. 2006. Technical and Economic Assessment of Off-Grid, Mini-Grid and Grid
Electrification Technologies Summary Report, Energy Unit, Energy Transport & Water
Department, The World Bank, Washington, DC.
———. 2002. Rural Electrification and Development in the Philippines: Measuring the Social and
Economic Benefits. Energy Sector Management Assistance Programme (ESMAP)
Report No. 255/02. Washington, DC: World Bank.
______. 1994. Vietnam Rural and Household Energy Issues and Options, World Bank Final Report
No. 161/94, Washington, DC.
Ziliak, James P. and Thomas J. Knieser. 1998. “The Importance of Sample Attrition in Life
Cycle labor Supply Estimation.” The Journal of Human Resources Vol. 33 (2), 507-3.

28
Tables
Table 1: Sample frame for the panel surveys: 2002 and 2005 Provinces Regions selected Communes
selected Households
selected Ha Giang North East 6 159 Lai Chau North West 6 147 Hoa Binh North West 6 161 Quang Binh North Central Coast 6 172 Quang Nam South Central Coast 6 166 Dac Lac Central Highlands 6 172 Soc Trang Mekong River Delta 5 143 Total
16
41
1,120
Table 2: Transition of grid electrification status between 2002 and 2005 (N=1,120) Commune
type Commune distribution
Household distribution
Communes electrified in
2002
Households electrified in
2002
Communes electrified
in 2005
Households electrified in
2005 Electrified 7
(16.7) 197
(17.6) 7
(16.7) 166
(14.8) 7
(16.7) 188
(16.8) Project 22
(52.3) 590
(52.7) 7
(16.7) 49
(4.4) 22
(52.3) 476
(42.5) Non-project 13
(31.0) 333
(29.7) 8
(19.0) 77
(6.9) 13
(31.0) 229
(20.4) Overall 42
(100.0) 1,120
(100.0) 22
(52.4) 292
(26.1) 42
(100.0) 893
(79.7) Note: Figures in parentheses are percentage of respective figures in total (42 for commune and 1,120 for households).

29
Table 3: Distribution of households by electrification type in sample provinces (N=1,120)
No electricity
National grid
Mini grid Pico Diesel Others
2002 Ha Giang 44.0 14.5 0 40.9 0 0.6 Lai Chau 44.2 21.1 0 30.6 4.1 0 Hoa Binh 47.8 32.9 0.6 17.4 0 1.3 Quang Binh 65.7 34.3 0 0 0 Quang Nam 38.6 34.3 11.4 0 0.6 15.1 Dac Lac 73.3 21.5 1.2 0.6 1.7 1.7 Soc Trang 75.5 22.4 0.7 0 0 1.4 Whole sample 55.0 26.1 2.1 12.4 0.9 3.0 2005
Ha Giang 7.6 91.8 0.6 0 0 0 Lai Chau 2.7 89.8 0.7 6.8 0 0 Hoa Binh 15.5 81.4 2.5 0 0.6 0 Quang Binh 1.2 90.1 8.7 0 0 0 Quang Nam 6.0 66.9 27.1 0 0 0 Dac Lac 18.6 75.0 4.1 0.6 0.5 1.2 Soc Trang 34.3 62.2 2.1 0 0.7 0.7 Whole sample 12.0 79.6 6.8 1.0 0.3 0.3
Table 4: FE estimates of household’s access to grid electricity (N=1,120) Explanatory variables HH’s access to grid
Year (2005=1, 2002=0) 0.156 (3.16)
Sex of HH head (M=1, F=0) 0.007 (0.17)
Age of HH head (years) 0.004 (1.42)
Education of HH head (years) 0.001 (0.21)
Highest education among HH males (years) 0.009 (1.66)
Highest education among HH females (years) 0.003 (0.69)
Log of HH landholding (acres) -0.002 (-0.11)

30
HH has running water (1=Yes, 0=No) -0.013 (-0.35)
Commune price of firewood (‘000 VND/kg) 0.003 (1.80)
Commune price of kerosene (‘000 VND/liter) -0.012 (-1.54)
Commune has electricity (1=Yes, 0=No) 0.573 (14.88)
Commune has motorable roads (1=Yes, 0=No) 0.620 (6.37)
Commune distance to state/national grid (km) -0.003 (-8.84)
R2 (pseudo R2) 0.430 Note: Figures in parentheses are t-statistics. Explanatory variables additionally include commune price of common food items.
Table 5: Summary statistics of household welfare outcomes by commune
electrification status: 2002 and 2005 2002 2005 Outcomes Communes
without grid electricity
Communes with grid electricity
All communes
All communes
Economic outcomes (‘000 VND/year)* Farm income 5,685.1 22,685.2 15,733.4 14,317.5 Non-farm income 1,354.7 3,755.6 2,773.8 2,791.3 Total income 7,039.9 26,440.9 18,507.3 17,108.8 Per capita expenditure 1,124.7 2,954.4 2,206.2 2,561.5
Number of households 458 662 1,120 1,120 Education outcomes (age 5-18)
Boys’ school enrollment (%) 51.5 (N=553)
56.6 (N=715)
54.4 (1,268)
65.0 (N=1,117)
Girls’ school enrollment (%) 57.0 (N=540)
58.3 (N=734)
57.8 (N=1,274)
70.7 (N=1,144)
Boys’ completed schooling years 4.40 (N=553)
4.55 (N=715)
4.48 (N=1,268)
5.45 (N=1,117)
Girls’ completed schooling years 4.37 (N=540)
4.55 (N=734)
4.47 (N=1,274)
5.53 (N=1,144)
Number of households 458 662 1,120 1,120
*Only cash items are considered here and in subsequent analyses.

31
Table 6: Benefits of commune electrification (single difference)
Outcomes With and without (in 2002)
Before and after for HHs adopting grid between 2002
and 2005
Continued exposure for HHS having grid in both
2002 and 2005
Economic outcomes (‘000 VND/year)* Farm income 0.584
(4.24) 0.622 (5.02)
0.160 (1.17)
Non-farm income 0.773 (3.21)
0.176 (0.69)
-0.418 (-1.83)
Total income 0.822 (9.38)
0.532 (5.71)
0.118 (-1.34)
Per capita expenditure 0.802 (11.76)
0.722 (11.68)
0.241 (4.18)
Number of households 1,120 916 1,324
Education outcomes (age 5-18) Boys’ school enrollment (1=yes, 0=no) 0.051
(1.81) 0.171 (5.65)
0.056 (2.11)
Girls’ school enrollment (1=yes, 0=no) 0.013 (-0.45)
0.148 (4.98)
0.116 (4.52)
Boys’ completed schooling years (11-18) 0.154 (0.91)
1.34 (6.95)
0.698 (3.96)
Girls’ completed schooling years (11-18)
0.178 (-1.02)
1.38 (7.11)
0.820 (4.63)
Number of households 1,120 916 1,324 Note: Figures in parentheses are t-statistics. Household expenditure and income variables are expresses in log
form.

32
Table 7: Summary statistics of household welfare outcomes by household’s grid connectivity: 2002 and 2005 2002 2005 Outcome variables (1)
No grid in 2002 and in 2005 (N=227)
(2) No grid in 2002 and grid in
2005 (N=601)
(3) Grid in 2002 and in 2005 (N=292)
(4) No grid in 2002
and in 2005 (N=227)
(5) No grid in 2002 and grid in
2005 (N=601)
(6) Grid in 2002 and in 2005 (N=292)
Economic outcomes Yearly farm cash income (‘000 VND) 12,869.7 18,801.8 11,644.3 17,888.4 11,955.2 16,403.6 Yearly non-farm cash income (‘000 VND) 1,402.7 1,967.4 5,499.5 1,291.8 2,876.0 3,782.6 Yearly total cash income (‘000 VND) 14,272.5 20,769.2 17,143.8 19,180.2 14,831.2 20,186.2 Yearly per capita cash expenditure (‘000 VND)
2,552.5 1,945.6 2,473.3 2,787.1 2,455.0 2,605.2
Education outcomes School enrollment for boys (5-18) 48.3 50.8 68.0 50.4 66.8 75.6 School enrollment for girls (5-18) 48.8 53.1 74.8 58.8 70.0 83.2 Boys’ completed schooling years (5-18) 3.37 4.39 5.64 3.85 5.66 6.59 Girls’ completed schooling years (5-18) 3.52 4.31 5.56 4.31 5.61 6.49
33
Table 8: Estimates of household electrification impacts (N=1,120) Outcomes Simple DD DD-FE PSM-DD-FE Economic outcomes (‘000 VND/year)* Farm income -0.082
(-0.34) 0.301 (1.81)
0.303 (1.84)
Non-farm income 0.699 (1.66)
-0.535 (-1.50)
-0.555 (-1.54)
Total income 0.362 (2.23)
0.248 (2.24)
0.247 (2.28)
Per capita expenditure
0.018 (0.16)
0.103 (1.69)
0.108 (1.66)
Education outcomes (age 5-18) Boys’ school enrollment (%) 0.112
(2.31) 0.115 (2.47)
0.111 (2.40)
Girls’ school enrollment (%) 0.042 (0.88)
0.101 (2.35)
0.101 (2.35)
Boys’ completed schooling years 0.673 (2.19)
0.531 (2.35)
0.524 (2.31)
Girls’ completed schooling years 0.386 (1.21)
0.141 (0.58)
0.154 (0.63)
Note: Figures in parentheses are t-statistics. Household expenditure and income variables are expresses in log form. PSM procedure drops 17 households from the sample.

34
Table 9: DD-FE estimates of World Bank project and non-project electrification impacts Explanatory variables
Farm income
(‘000 VND/year)
Non-farm income
(‘000 VND/year)
Total income
(‘000 VND/year)
Per capita expenditure
(‘000 VND/year)
Boys’ enrollment
Girls’ enrollment
Boys’ completed schooling
years
Girls’ completed schooling
years Grid electrification by World Bank projects
0.264 (1.67)
-0.724 (-1.47)
0.227 (1.88)
0.091 (1.28)
0.135 (2.66)
0.116 (2.46)
0.498 (2.01)
0.174 (0.65)
Grid electrification non-project entities
0.378 (1.70)
-0.137 (-0.29)
0.293 (1.98)
0.127 (1.45)
0.079 (1.35)
0.075 (1.38)
0.586 (2.06)
0.086 (0.28)
Test for equality between project and non-project electrification
F(1, 1097) = 0.27
P>F=0.603
F(1, 1097) = 1.58
P>F=0.210
F(1, 1097) = 0.21
P>F=0.648
F(1, 1097) = 0.18
P>F=0.675
F(1, 1506) = 0.99
P>F=0.320
F(1, 1550) = 0.62
P>F=0.430
F(1, 1506) = 0.10
P>F=0.749
F(1, 1550) = 0.09
P>F=0.768
N 1,120 1,120 1,120 1,120 856 845 856 845 Note: Figures in parentheses are t-statistics. Household expenditure and income variables are expresses in log

35
Table 10: Grid electricity use by duration of grid connection
(N=893) Duration Percentage
of households Electricity use (kwh/month)
Duration<2 years 29.4 36.0 2 years>=Duration<4 years 48.4 43.7 4 years>=Duration<6 years 9.3 52.1 6 years>=Duration<8 years 5.7 52.7 8 years>=Duration<10 years 4.3 59.4 Duration>=10 years 2.9 83.8 All electrified households (average duration=3.22 years)
100.0 44.5
Note: Sample consists only of 2005 households who have grid electricity.
Table 11: Household welfare outcomes by duration of electricity use Outcomes 1 2 3 4 5 6 Economic outcomes (‘000 VND/year)* Farm income 14,197.7 11,926.8 13,055.4 13,004.5 6,870.3 41,564.4 Non-farm income 2,351.5 3,244.8 2,877.3 3,833.8 5,377.2 6,699.1 Total income 16,549.1 1,5171.5 15,932.7 16,838.4 12,247.5 48,263.5 Per capita expenditure
2,600.9 2,438.7 2,176.5 2,380.7 2,752.3 3,537.4
Education outcomes (age 5-18) Boys’ school enrollment (%) 0.583 0.716 0.747 0.792 0.905 1.000 Girls’ school enrollment (%) 0.595 0.772 0.814 0.889 0.875 0.929 Boys’ completed schooling years 5.21 6.09 7.00 5.90 6.00 7.71 Girls’ completed schooling years 4.90 6.03 6.48 7.33 7.25 6.71
Note: Sample consists of only 2005 households who have grid electricity. The column heading denotes the following: 1=less than 2 years, 2=2-4 years, 3=4-6 years, 4=6-8 years, 5=8-10 years, and 6=more than 10 years

36
Table 12: Relative impacts of new connectors compared to old connectors
(DDD estimates) (N=1,120) Outcomes DDD estimates Economic outcomes (‘000 VND/year)* Farm income 0.540
(1.77) Non-farm income -0.873
(-1.33) Total income 0.297
(1.46) Per capita expenditure
0.256 (2.13)
Education outcomes (age 5-18) Boys’ school enrollment (%) 0.050
(0.58) Girls’ school enrollment (%) 0.036
(0.47) Boys’ completed schooling years 0.285
(0.69) Girls’ completed schooling years 0.011
(0.03) Note: Figures in parentheses are t-statistics. Household expenditure and income variables are expresses in log form.
Table 13: FE estimates of duration of grid use (N=1,120) Explanatory variables Estimates
Duration of grid use (years) 0.074 (1.92)
Duration of grid use squared -0.004 (-1.64)
Year (2005=1, 2002=0) -0.357 (-1.60)
Sex of HH head (M=1, F=0) -0.088 (-0.54)
Age of HH head (years) -0.019 (-1.70)
Education of HH head (years) 0.001 (0.05)
Highest education among HH males (years) 0.018 (0.84)
Highest education among HH females (years) 0.017 (0.87)
Log of HH landholding (acres) 0.170 (2.49)
HH has running water (1=Yes, 0=No) -0.225

37
(-1.54) Commune price of firewood (‘000 VND/kg) -0.013
(-1.89) Commune price of kerosene (‘000 VND/liter) -0.067
(-2.12) Commune has electricity (1=Yes, 0=No) 0.451
(2.88) Commune has motorable roads (1=Yes, 0=No) -0.121
(-0.30) Commune distance to state/national grid (km) -0.031
(-1.04) R2 0.130
Note: Figures in parentheses are t-statistics. Explanatory variables additionally include commune price of common food items.

38
Appendix
Table A1: Probit estimates of household attrition between 2002 and 2005 (N=1,262) Explanatory variables HH attrition
Sex of HH head (M=1, F=0) -0.018 (-0.15)
Age of HH head (years) 0.004 (0.75)
Education of HH head (years) 0.005 (0.22)
Highest education among HH males (years) 0.006 (0.25)
Highest education among HH females (years) -0.015 (-0.79)
Log of HH landholding (decimals) -0.060 (-0.70)
HH has running water (1=Yes, 0=No) -0.239 (-1.03)
Commune price of firewood (‘000 VND/kg) 0.106 (2.12)
Commune price of kerosene (‘000 VND/liter) 0.078 (0.70)
Commune has motorable roads (1=Yes, 0=No) -0.329 (-1.51)
Pseudo R2 0.084 Note: Explanatory variables additionally include commune price of common food items.
Table A2: Test of bias due to household attrition from 2002 and 2005 Outcome variables F (or �2)value p>F (or p>�2)
Economic outcomes (‘000 VND/year)* Farm income F(22,1218)=1.12 0.316 Non-farm income F(22,1218)=0.55 0.955 Total income F(22,1218)=0.54 0.959 Per capita expenditure
F(22,1218)=1.31 0.155
Education outcomes (age 5-18) Boys’ school enrollment (%) �2(20)=32.65 0.037 Girls’ school enrollment (%) �2(21)=23.17 0.335 Boys’ completed schooling years F(22,1377)=1.57 0.044 Girls’ completed schooling years F(22,1361)=0.75 0.787

39
Table A3: Probit estimates used PSM technique (N=1,120) Explanatory variables HH’s access to grid
Sex of HH head (M=1, F=0) 0.048 (0.32)
Age of HH head (years) 0.003 (0.56)
Education of HH head (years) 0.053 (2.27)
Highest education among HH males (years) 0.102 (4.19)
Highest education among HH females (years) 0.073 (3.51)
Log of HH landholding (decimals) -0.225 (-0.56)
HH has running water (1=Yes, 0=No) 0.040 (0.15)
Commune price of firewood (‘000 VND/kg) -0.030 (-4.03)
Commune price of kerosene (‘000 VND/liter) 0.083 (0.72)
Commune has motorable roads (1=Yes, 0=No) -1.579 (-3.16)
Pseudo R2 0.355 Note: Explanatory variables additionally include commune price of common food items.
Number of blocks =6 Number of matched households=1,103