welding research effects of fusion zone size on failure modes and
TRANSCRIPT

WELDING RESEARCH
NOVEMBER 2004-S308
ABSTRACT. This paper examines the ef-fects of fusion zone size on failure modes,static strength, and energy absorption ofaluminum spot welded samples using acombined experimental, statistical, andanalytical approach. The main failuremodes for aluminum spot welds arenugget pullout and interfacial fracture.First, static strength tests using couponconfigurations of lap shear, cross tension,and coach peel were performed on thejoint populations with a controlled fusionzone size. Thirty replicate static strengthtests were performed for each couponconfiguration. The resulting peak loadand energy absorption levels associatedwith each failure mode were studied usingstatistical models. Next, an analyticalmodel was developed to determine thefailure mode of an aluminum resistancespot weld based on limit load analyses. Itwas found that fusion zone size, sheetthickness, and the level and location ofweld porosity/defects are the main factorsinfluencing the cross-tension failure modeof an aluminum spot weld. Two additionalspot weld populations with different fu-sion zone sizes were then fabricated to val-idate the analytical failure mode model.Static cross-tension tests were again per-formed, and the experimental observa-tions confirmed the analytically predictedfailure modes for each population.
Introduction
Resistance spot welding (RSW) hasbeen used for decades by automotive andother industries for fabricating sheetmetal assemblies. Resistance spot weldingis easy to operate, automate, control, andperform, and thus is an ideal joining tech-nology for mass production. Over theyears, RSW technology has been per-fected for various steel grades and sheetmetal thicknesses to deliver high-quality,durable structural joints (Refs. 1–3).
Recently, because of their light weight andrelatively high strength, more and morealuminum alloys have been used in theconstruction of automobile body andpanel parts to reduce weight and thereforeenhance fuel efficiency. As one of the pri-mary joining methods in the automotiveindustry, the RSW process for aluminumalloys has been studied intensively overthe past two decades (Refs. 4–8).
Spot welding of aluminum alloysshares the same overall Joule heatingprinciple as spot welding of steel. How-ever, because of the relatively low densityand high thermal and electrical conductiv-ity of aluminum alloys, aluminum spotwelding also presents some unique chal-lenges to the automotive industry. Higherwelding currents, typically two to threetimes those of steel, and only one-third ofthe welding duration are used. The issuesassociated with production welding of alu-minum alloys include weld porosity, weldexpulsion, electrode wear, and inconsis-tency in failure mode during coupon-leveljoint quality evaluation (Refs. 17, 18).
As a means of quality control, the do-mestic automotive industry historicallyhas adopted an approach and criterion foraluminum spot welds similar to those usedin spot welds of mild steel; that is, a peeltest to determine whether a satisfactoryweld has been produced. The common cri-terion is borrowed from the conventionalspot weld criterion for mild steel, in whichthe minimum weld button diameter (D)should be equal to or larger than 4Vt (t de-fined as material thickness in mm) (Ref.
9). Undersized welds have an averageweld button diameter larger than 2Vt, butless than 4Vt. Defective welds have aver-age weld button diameters less than orequal to 2Vt. Any weld that fails in the in-terfacial fracture mode would be consid-ered a “bad” weld and would be rejectedby the quality control inspector.
This criterion works relatively well formild steel spot welds because the weldnugget has a significantly higher hardnesslevel (therefore yield strength) than thebase material; hence, the nugget pulloutmode would produce the highest jointstrength. On the other hand, the effective-ness of this criterion for the quality evalu-ation of aluminum spot welds and ad-vanced high-strength steel spot welds hasnot been adequately studied by the auto-motive welding community; it wasadopted from mild steel spot welds with-out much in-depth study. Because of themore frequent occurrence of interfacialfracture, many domestic automotive com-panies do not have confidence in alu-minum spot welds and are now pursuingalternative, yet more expensive, joiningtechniques such as riveting and/orclinching.
The purpose of this paper is to studythe effects of fusion zone size and failuremodes on the peak load and energy ab-sorption levels of aluminum spot welds.First, two sample weld populations wereconsidered:
1) Weld population ID14: RSW of 2-mm 5182-O to 2-mm 5182-O
2) Weld population ID15: RSW of 2-mm 5182-O to 2-mm 6111-T4.
For each weld population, threecoupon configurations were included inthe static tests: lap shear, cross tension,and coach peel. See Figs. 1–3 for specimendesign, dimensions, and fixture design.For each static test, a load vs. displace-ment curve was recorded, as were the fail-ure mode and nugget size/fusion zone sizeof the joint sample. The total energy ab-sorption, which is represented by the areaunder the load vs. displacement curve, wasthen calculated through numerical inte-gration. Thirty identical static strengthtests were performed for each joint con-
Effects of Fusion Zone Size on Failure Modes and Static Strength of
Aluminum Resistance Spot WeldsA larger weld size creates a higher level of peak load and energy absorption
BY X. SUN, E. V. STEPHENS, R. W. DAVIES, M. A. KHALEEL, AND D. J. SPINELLA
X. SUN, E. V. STEPHENS, R. W. DAVIES, andM. A. KHALEEL are with Pacific NorthwestNational Laboratory, Richland, Wash. D. J.SPINELLA is with Alcoa Technical Center,Alcoa Center, Pa.
KEY WORDS
Resistance Spot WeldingAluminum Sheet MetalFusion Zone SizeWeld Failure ModesCoach Peel TestLap Shear TestCross-Tension TestWeibull Distribution
sun qwk corr 10/7/04 9:17 AM Page 308

WELDING RESEARCH
-S309WELDING JOURNAL
figuration, and statistical analyses wereperformed to study the effects of differentfailure modes on the peak load and energyabsorption of the weld joints.
Next, a simple, limit-load-basedanalytical model was derived to rational-ize the experimental observed failuremodes for aluminum spot welds with theaid of microhardness measurements of theweld samples. Two additional weld popu-lations with different fusion zone sizeswere then fabricated and tested to validatethe analytical model. The goal of this studyis to provide welding engineers with someinsights on the anticipated joint failuremodes for a given weld population withcertain weld attributes, and to discuss theeffects of weld size and weld porosity (irregularity) level on the anticipated lev-els of weld strength and failure mode.
Experimental Study
The initial experimental work in thisinvestigation consisted of quasistatic testsof lap shear, coach peel, and cross tensionof ID14 and ID15. The specimen and testfixture designs are shown in Figs. 1–3. TheRSW specimens were fabricated at theAlcoa Technical Center. The followingwelding parameters were used in thecoupon fabrication process:
Electrodes: 0.370-in. face diameter truncated electrode
Current: ~34.0 kA, 80% current, ACwelding machine
Force: 1050 lbfWeld time: 8 cyclesWater flow rate: 2.6 gal/min.
Special efforts were made to ensure
that the location of thewelds was in the widthcenter of the specimens.Electrode tips weredressed every 15 welds toensure weld consistency.Peel tests and metallo-graphic cross sectionswere used to maintain anugget diameter of ~8mm for all specimens.Figure 4 shows the typicalweld metallurgical crosssections for ID14 andID15, respectively.
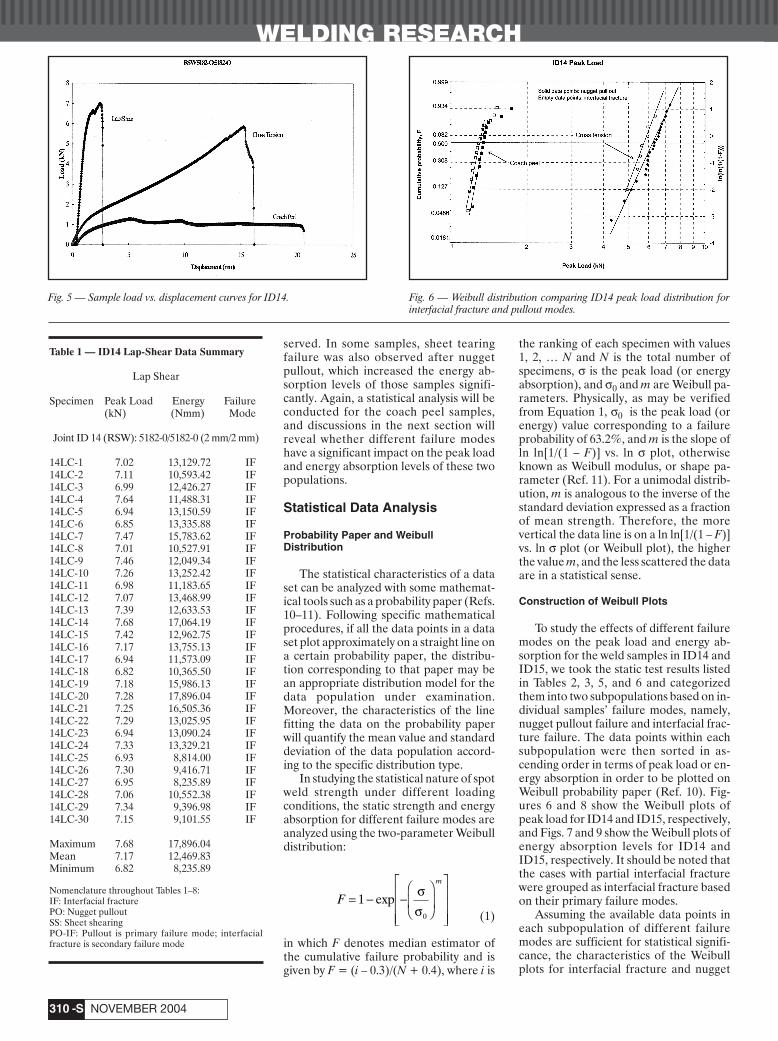
Quasistatic tests at arate of 10 mm/min wereperformed on these speci-mens to determine their load vs. displace-ment curves. Figure 5 shows the typical ex-perimental results for ID14 under the threeloading configurations. Thirty static testswere performed for each joint populationand each loading configuration. Tables 1–6tabulate the test results with peak load, fail-ure mode, and energy absorption for eachpopulation and each loading configuration.Nomenclatures used in defining differentfailure modes are also included at the endof Table 1.
Lap Shear Tests
For lap shear samples of both popula-tions ID14 and ID15, interfacial fracturewas the only failure mode observed. Theaverage peak failure load for ID14 was7.16 kN, and the average peak failure loadfor ID15 was 7.17 kN, with no significantamount of sheet bending deformation observed for either population.
Cross-Tension Tests
Both nugget pullout and interfacialfracture modes were observed for thecross-tension samples of ID14 and ID15,and the majority of the samples failed inpullout mode. The average peak loadswere 6.05 and 5.95 kN for ID14 and ID15,respectively. A detailed statistical analysiswill be presented in the next section tostudy whether different failure modeshave a significant influence on the peakfailure loads for these two populations.
Coach Peel Tests
Similar to the cross-tension samples,the failure modes for coach peel sampleswere also a combination of nugget pulloutand interfacial fracture. However, incoach peel samples, interfacial fractureand partial interfacial fracture (a combi-nation of interfacial fracture and laterstage nugget pullout) were more often ob-
Fig. 1 — Lap-shear coupon design and test fixture.
Fig. 3 — Coach peel coupon design and fixture.
Fig. 4 — Typical metallurgical cross sections for ID14 and ID15.
Fig. 2 — Cross-tension coupon design and test fixture.
sun qwk corr 10/7/04 9:18 AM Page 309
WELDING RESEARCH
NOVEMBER 2004-S310
served. In some samples, sheet tearingfailure was also observed after nuggetpullout, which increased the energy ab-sorption levels of those samples signifi-cantly. Again, a statistical analysis will beconducted for the coach peel samples,and discussions in the next section will reveal whether different failure modeshave a significant impact on the peak loadand energy absorption levels of these twopopulations.
Statistical Data Analysis
Probability Paper and WeibullDistribution
The statistical characteristics of a dataset can be analyzed with some mathemat-ical tools such as a probability paper (Refs.10–11). Following specific mathematicalprocedures, if all the data points in a dataset plot approximately on a straight line ona certain probability paper, the distribu-tion corresponding to that paper may bean appropriate distribution model for thedata population under examination.Moreover, the characteristics of the linefitting the data on the probability paperwill quantify the mean value and standarddeviation of the data population accord-ing to the specific distribution type.
In studying the statistical nature of spotweld strength under different loadingconditions, the static strength and energyabsorption for different failure modes areanalyzed using the two-parameter Weibulldistribution:
(1)
in which F denotes median estimator ofthe cumulative failure probability and isgiven by F = (i – 0.3)/(N + 0.4), where i is
the ranking of each specimen with values1, 2, … N and N is the total number ofspecimens, σ is the peak load (or energyabsorption), and σ0 and m are Weibull pa-rameters. Physically, as may be verifiedfrom Equation 1, σ0 is the peak load (orenergy) value corresponding to a failureprobability of 63.2%, and m is the slope ofln ln[1/(1 – F)] vs. ln σ plot, otherwiseknown as Weibull modulus, or shape pa-rameter (Ref. 11). For a unimodal distrib-ution, m is analogous to the inverse of thestandard deviation expressed as a fractionof mean strength. Therefore, the morevertical the data line is on a ln ln[1/(1 – F)]vs. ln σ plot (or Weibull plot), the higherthe value m, and the less scattered the dataare in a statistical sense.
Construction of Weibull Plots
To study the effects of different failuremodes on the peak load and energy ab-sorption for the weld samples in ID14 andID15, we took the static test results listedin Tables 2, 3, 5, and 6 and categorizedthem into two subpopulations based on in-dividual samples’ failure modes, namely,nugget pullout failure and interfacial frac-ture failure. The data points within eachsubpopulation were then sorted in as-cending order in terms of peak load or en-ergy absorption in order to be plotted onWeibull probability paper (Ref. 10). Fig-ures 6 and 8 show the Weibull plots ofpeak load for ID14 and ID15, respectively,and Figs. 7 and 9 show the Weibull plots ofenergy absorption levels for ID14 andID15, respectively. It should be noted thatthe cases with partial interfacial fracturewere grouped as interfacial fracture basedon their primary failure modes.
Assuming the available data points ineach subpopulation of different failuremodes are sufficient for statistical signifi-cance, the characteristics of the Weibullplots for interfacial fracture and nugget
F
m
= − −
10
expσσ
Fig. 5 — Sample load vs. displacement curves for ID14. Fig. 6 — Weibull distribution comparing ID14 peak load distribution for interfacial fracture and pullout modes.
Table 1 — ID14 Lap-Shear Data Summary
Lap Shear
Specimen Peak Load Energy Failure(kN) (Nmm) Mode
Joint ID 14 (RSW): 5182-0/5182-0 (2 mm/2 mm)
14LC-1 7.02 13,129.72 IF14LC-2 7.11 10,593.42 IF14LC-3 6.99 12,426.27 IF14LC-4 7.64 11,488.31 IF14LC-5 6.94 13,150.59 IF14LC-6 6.85 13,335.88 IF14LC-7 7.47 15,783.62 IF14LC-8 7.01 10,527.91 IF14LC-9 7.46 12,049.34 IF14LC-10 7.26 13,252.42 IF14LC-11 6.98 11,183.65 IF14LC-12 7.07 13,468.99 IF14LC-13 7.39 12,633.53 IF14LC-14 7.68 17,064.19 IF14LC-15 7.42 12,962.75 IF14LC-16 7.17 13,755.13 IF14LC-17 6.94 11,573.09 IF14LC-18 6.82 10,365.50 IF14LC-19 7.18 15,986.13 IF14LC-20 7.28 17,896.04 IF14LC-21 7.25 16,505.36 IF14LC-22 7.29 13,025.95 IF14LC-23 6.94 13,090.24 IF14LC-24 7.33 13,329.21 IF14LC-25 6.93 8,814.00 IF14LC-26 7.30 9,416.71 IF14LC-27 6.95 8,235.89 IF14LC-28 7.06 10,552.38 IF14LC-29 7.34 9,396.98 IF14LC-30 7.15 9,101.55 IF
Maximum 7.68 17,896.04Mean 7.17 12,469.83Minimum 6.82 8,235.89
Nomenclature throughout Tables 1–8:IF: Interfacial fracturePO: Nugget pulloutSS: Sheet shearingPO-IF: Pullout is primary failure mode; interfacialfracture is secondary failure mode
sun qwk corr 10/7/04 9:18 AM Page 310

WELDING RESEARCH
-S311WELDING JOURNAL
pullout modes can provide the medianvalue as well as the degree of scatter foreach failure mode. It should be noted thatsince interfacial fracture was the only fail-ure mode observed for all the lap shearsamples of ID14 and ID15, no statisticalstudy was performed on the data listed inTables 1 and 4.
Cross Tension
The linearity of curve fittings for pull-out and interfacial fracture failure modesin Figs. 6–9 suggests that the peak loadand energy distribution under cross ten-sion for ID14 and ID15 can be modeledapproximately with Weibull distributionswith different shape parameters.
For ID14 under cross tension, theWeibull plots in Fig. 6 show that the me-dian peak load for interfacial fracture isabout 10% lower than the median peakload for pullout failure. Consistently, themedian energy absorption for interfacialfracture is about 10% lower than that ofpullout mode for this population. Sincethe fitted straight lines in Fig. 6 are almostparallel, it is concluded that the interfacialfracture and pullout failure modes havethe same shape parameters for Weibulldistribution, and therefore the degree ofpeak load and energy scatter is about thesame for these two failure modes for ID14.
For ID15 under cross tension, theWeibull plots in Fig. 8 show that the me-dian peak load levels for the two failuremodes are almost identical. However, theinterfacial fracture mode shows a higherlevel of scatter on peak load than the pull-out mode. Similar observations can bemade for the energy absorption levels forthe two failure modes for ID15 undercross tension — Fig. 9.
Coach Peel
Under coach peel loading configura-
tion, the lack of linearity of the data pointsfor ID14 and ID15 indicates that a uni-modal Weibull distribution cannot be usedto correctly model the entire data popula-tion — Figs. 6–9. However, the few casesin the peak load distributions that do notfit on the straight lines are mostly the caseswith combined failure modes of nuggetpullout and sheet tearing. If we were toconsider the majority cases represented bythe straight lines, consistent conclusionson peak load distributions under thecoach peel condition can again be reachedfor the two weld populations as thoseunder cross tension: the median peak loadfor interfacial fracture mode is lower thanthat for the nugget pullout mode. But themedian value difference for the two fail-ure modes is less than 10%.
The distributions for energy absorp-tion under coach peel loading conditionsfor ID14 and ID15 have a bilinear nature.Therefore, bimodal Weibull distributionsmay be more suitable for these energy dis-tributions. In Fig. 7, the cases with sheettearing have distinguishable higher energylevels due to the additional energy ab-sorbed by base metal tearing deformation.
In conclusion, the above statisticalanalyses indicate that the median peakload for the cases that failed in interfacialfracture mode is about 10% lower thanthat of the cases that failed in pulloutmode for ID14, and that the median peakload is about the same for ID15 with dif-ferent shape parameters. Similar conclu-sions can also be reached for the energyabsorption levels. These results indicatethat, for weld populations ID14 and ID15,the differences in failure modes undercross-tension and coach peel conditionsdo not produce a significant difference inthe specimens’ peak load and energy ab-sorption levels. Nugget pullout mode onlyproduces slightly higher peak load and en-ergy absorption.
It should also be noted that, in general,
Fig. 7 — Weibull distribution comparing ID14 energy absorption for interfa-cial fracture and pullout modes.
Fig. 8 — Weibull distribution comparing ID15 peak load distribution for in-terfacial fracture and pullout modes.
Table 2 — ID14 Cross-Tension DataSummary
Cross Tension
Specimen Peak Energy FailureLoad (Nmm) Mode(kN)
Joint ID 14 (RSW): 5182-O/5182-O (2 mm/2mm)
14TC-1 5.58 40,970.85 IF14TC-2 6.88 62,010.95 PO14TC-3 5.95 49,615.49 PO14TC-4 6.63 62,404.24 PO14TC-5 6.23 54,467.28 PO14TC-6 6.05 50,141.73 PO14TC-7 6.57 59,254.26 PO14TC-8 6.99 66,002.44 PO14TC-9 5.95 51,533.12 IF-PO14TC-10 4.82 37,281.09 PO14TC-11 6.43 59,179.87 PO14TC-12 5.83 52,073.55 PO14TC-13 6.68 59,364.00 PO14TC-14 5.43 45,128.99 IF-PO14TC-15 4.93 37,263.02 IF-PO14TC-16 5.92 48,008.35 PO14TC-17 5.62 49,457.98 IF-PO14TC-18 4.28 34,930.96 PO14TC-19 5.13 39,341.73 PO14TC-20 6.31 55,954.47 PO14TC-21 6.35 64,342.24 IF-PO14TC-22 5.86 52,734.13 PO14TC-23 7.26 66,047.73 PO14TC-24 6.75 62,165.33 PO14TC-25 5.96 57,083.67 PO14TC-26 6.54 59,019.29 PO14TC-27 6.28 55,635.41 PO14TC-28 5.38 41,779.10 PO14TC-29 5.94 46,972.13 IF-PO14TC-30 7.06 61,131.00 PO
Maximum 7.26 66,047.73Mean 6.05 52,709.81Minimum 4.28 34,930.96
sun qwk corr 10/7/04 9:18 AM Page 311
WELDING RESEARCH
NOVEMBER 2004-S312
the estimator F should be selected care-fully according to the circumstances in theWeibull analysis. In studying our test data,
we have also tried using two other types ofestimators, i.e., F = i/(N + 1) and F =(i – 0.5)/N, and the resulting data distrib-ution characteristics do not change significantly.
Influence of Weld Size on PeakLoad and Energy Absorption
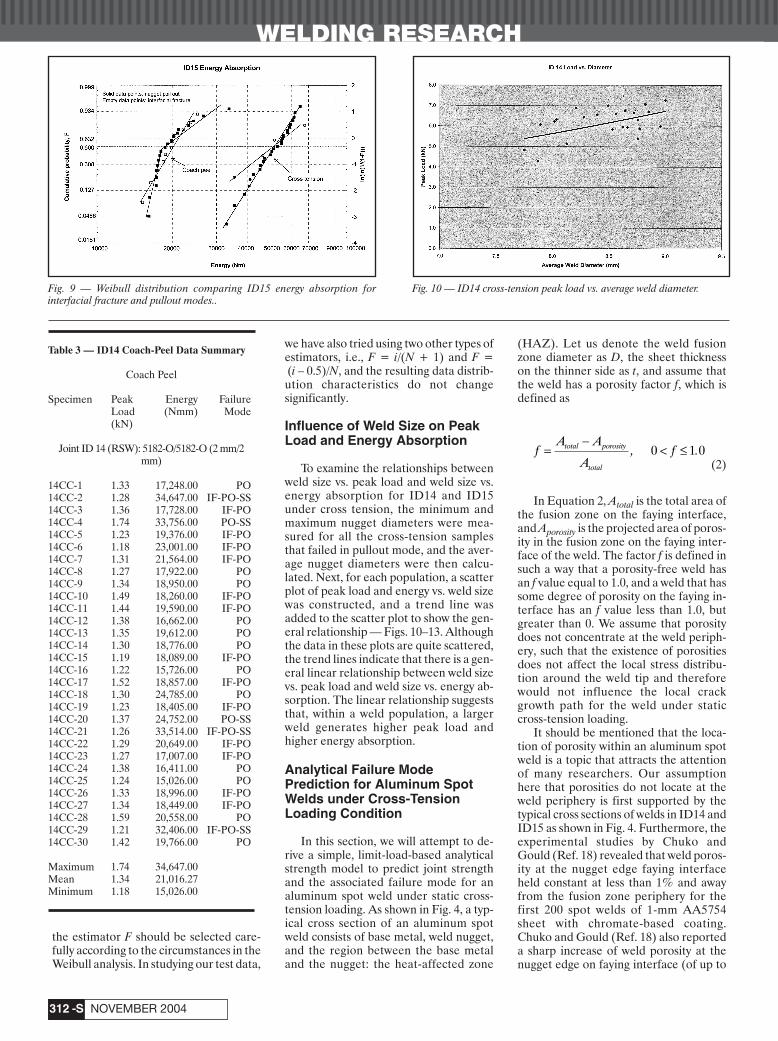
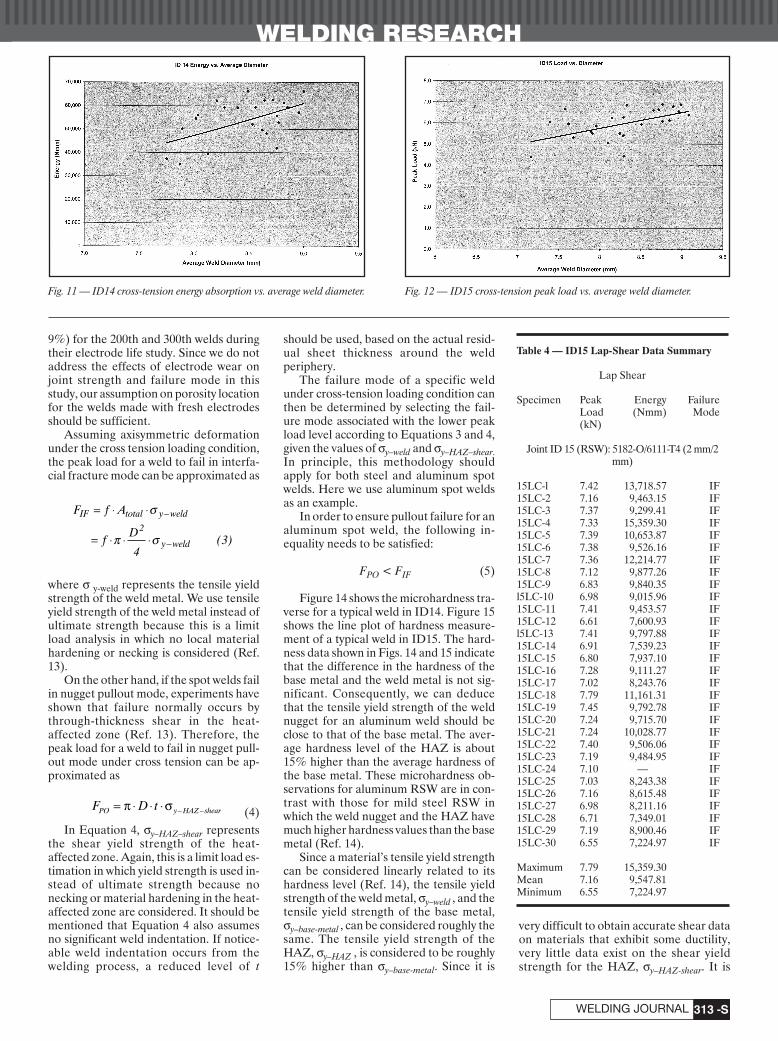
To examine the relationships betweenweld size vs. peak load and weld size vs.energy absorption for ID14 and ID15under cross tension, the minimum andmaximum nugget diameters were mea-sured for all the cross-tension samplesthat failed in pullout mode, and the aver-age nugget diameters were then calcu-lated. Next, for each population, a scatterplot of peak load and energy vs. weld sizewas constructed, and a trend line wasadded to the scatter plot to show the gen-eral relationship — Figs. 10–13. Althoughthe data in these plots are quite scattered,the trend lines indicate that there is a gen-eral linear relationship between weld sizevs. peak load and weld size vs. energy ab-sorption. The linear relationship suggeststhat, within a weld population, a largerweld generates higher peak load andhigher energy absorption.
Analytical Failure Mode Prediction for Aluminum SpotWelds under Cross-TensionLoading Condition
In this section, we will attempt to de-rive a simple, limit-load-based analyticalstrength model to predict joint strengthand the associated failure mode for analuminum spot weld under static cross-tension loading. As shown in Fig. 4, a typ-ical cross section of an aluminum spotweld consists of base metal, weld nugget,and the region between the base metaland the nugget: the heat-affected zone
(HAZ). Let us denote the weld fusionzone diameter as D, the sheet thicknesson the thinner side as t, and assume thatthe weld has a porosity factor f, which isdefined as
(2)
In Equation 2, Atotal is the total area ofthe fusion zone on the faying interface,and Aporosity is the projected area of poros-ity in the fusion zone on the faying inter-face of the weld. The factor f is defined insuch a way that a porosity-free weld hasan f value equal to 1.0, and a weld that hassome degree of porosity on the faying in-terface has an f value less than 1.0, butgreater than 0. We assume that porositydoes not concentrate at the weld periph-ery, such that the existence of porositiesdoes not affect the local stress distribu-tion around the weld tip and thereforewould not influence the local crackgrowth path for the weld under staticcross-tension loading.
It should be mentioned that the loca-tion of porosity within an aluminum spotweld is a topic that attracts the attentionof many researchers. Our assumptionhere that porosities do not locate at theweld periphery is first supported by thetypical cross sections of welds in ID14 andID15 as shown in Fig. 4. Furthermore, theexperimental studies by Chuko andGould (Ref. 18) revealed that weld poros-ity at the nugget edge faying interfaceheld constant at less than 1% and awayfrom the fusion zone periphery for thefirst 200 spot welds of 1-mm AA5754sheet with chromate-based coating.Chuko and Gould (Ref. 18) also reporteda sharp increase of weld porosity at thenugget edge on faying interface (of up to
f
A A
Aftotal porosity
total
=−
< ≤, .0 1 0
Fig. 9 — Weibull distribution comparing ID15 energy absorption forinterfacial fracture and pullout modes..
Fig. 10 — ID14 cross-tension peak load vs. average weld diameter.
Table 3 — ID14 Coach-Peel Data Summary
Coach Peel
Specimen Peak Energy FailureLoad (Nmm) Mode(kN)
Joint ID 14 (RSW): 5182-O/5182-O (2 mm/2mm)
14CC-1 1.33 17,248.00 PO14CC-2 1.28 34,647.00 IF-PO-SS14CC-3 1.36 17,728.00 IF-PO14CC-4 1.74 33,756.00 PO-SS14CC-5 1.23 19,376.00 IF-PO14CC-6 1.18 23,001.00 IF-PO14CC-7 1.31 21,564.00 IF-PO14CC-8 1.27 17,922.00 PO14CC-9 1.34 18,950.00 PO14CC-10 1.49 18,260.00 IF-PO14CC-11 1.44 19,590.00 IF-PO14CC-12 1.38 16,662.00 PO14CC-13 1.35 19,612.00 PO14CC-14 1.30 18,776.00 PO14CC-15 1.19 18,089.00 IF-PO14CC-16 1.22 15,726.00 PO14CC-17 1.52 18,857.00 IF-PO14CC-18 1.30 24,785.00 PO14CC-19 1.23 18,405.00 IF-PO14CC-20 1.37 24,752.00 PO-SS14CC-21 1.26 33,514.00 IF-PO-SS14CC-22 1.29 20,649.00 IF-PO14CC-23 1.27 17,007.00 IF-PO14CC-24 1.38 16,411.00 PO14CC-25 1.24 15,026.00 PO14CC-26 1.33 18,996.00 IF-PO14CC-27 1.34 18,449.00 IF-PO14CC-28 1.59 20,558.00 PO14CC-29 1.21 32,406.00 IF-PO-SS14CC-30 1.42 19,766.00 PO
Maximum 1.74 34,647.00Mean 1.34 21,016.27Minimum 1.18 15,026.00
sun qwk corr 10/7/04 9:18 AM Page 312
WELDING RESEARCH
-S313WELDING JOURNAL
9%) for the 200th and 300th welds duringtheir electrode life study. Since we do notaddress the effects of electrode wear onjoint strength and failure mode in thisstudy, our assumption on porosity locationfor the welds made with fresh electrodesshould be sufficient.
Assuming axisymmetric deformationunder the cross tension loading condition,the peak load for a weld to fail in interfa-cial fracture mode can be approximated as
where σ y-weld represents the tensile yieldstrength of the weld metal. We use tensileyield strength of the weld metal instead ofultimate strength because this is a limitload analysis in which no local materialhardening or necking is considered (Ref.13).
On the other hand, if the spot welds failin nugget pullout mode, experiments haveshown that failure normally occurs bythrough-thickness shear in the heat-affected zone (Ref. 13). Therefore, thepeak load for a weld to fail in nugget pull-out mode under cross tension can be ap-proximated as
(4)In Equation 4, σy–HAZ–shear represents
the shear yield strength of the heat-affected zone. Again, this is a limit load es-timation in which yield strength is used in-stead of ultimate strength because nonecking or material hardening in the heat-affected zone are considered. It should bementioned that Equation 4 also assumesno significant weld indentation. If notice-able weld indentation occurs from thewelding process, a reduced level of t
should be used, based on the actual resid-ual sheet thickness around the weld periphery.
The failure mode of a specific weldunder cross-tension loading condition canthen be determined by selecting the fail-ure mode associated with the lower peakload level according to Equations 3 and 4,given the values of σy–weld and σy–HAZ–shear.In principle, this methodology shouldapply for both steel and aluminum spotwelds. Here we use aluminum spot weldsas an example.
In order to ensure pullout failure for analuminum spot weld, the following in-equality needs to be satisfied:
FPO < FIF (5)
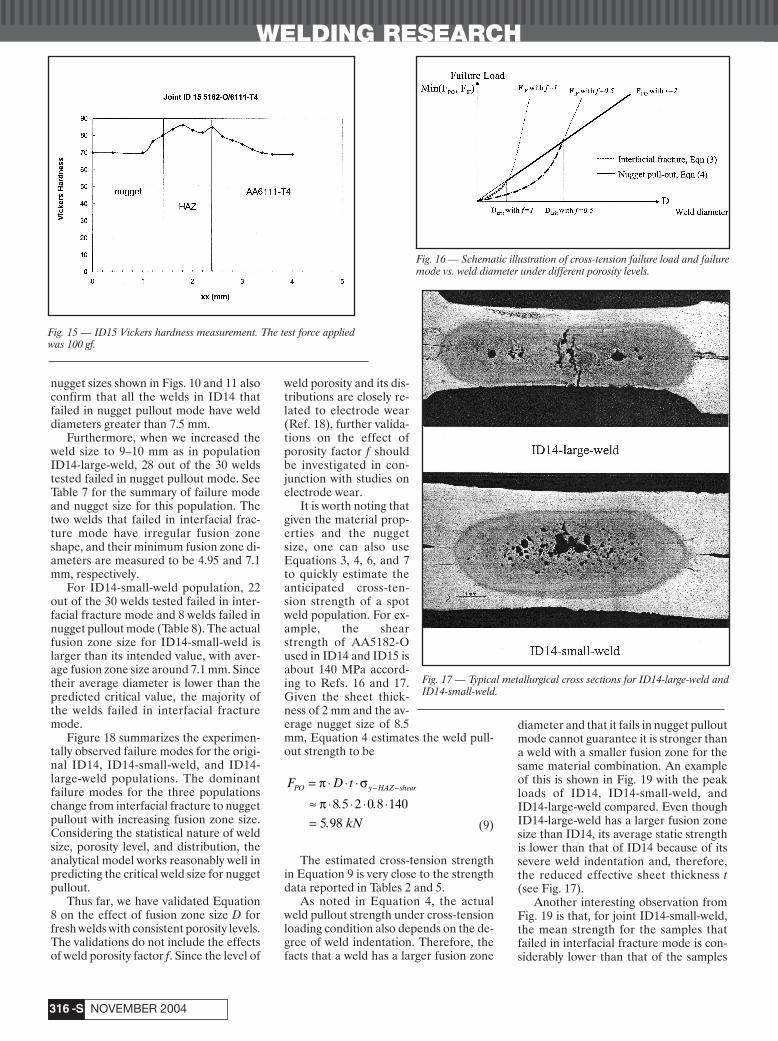
Figure 14 shows the microhardness tra-verse for a typical weld in ID14. Figure 15shows the line plot of hardness measure-ment of a typical weld in ID15. The hard-ness data shown in Figs. 14 and 15 indicatethat the difference in the hardness of thebase metal and the weld metal is not sig-nificant. Consequently, we can deducethat the tensile yield strength of the weldnugget for an aluminum weld should beclose to that of the base metal. The aver-age hardness level of the HAZ is about15% higher than the average hardness ofthe base metal. These microhardness ob-servations for aluminum RSW are in con-trast with those for mild steel RSW inwhich the weld nugget and the HAZ havemuch higher hardness values than the basemetal (Ref. 14).
Since a material’s tensile yield strengthcan be considered linearly related to itshardness level (Ref. 14), the tensile yieldstrength of the weld metal, σy–weld , and thetensile yield strength of the base metal,σy–base-metal , can be considered roughly thesame. The tensile yield strength of theHAZ, σy–HAZ , is considered to be roughly15% higher than σy–base-metal. Since it is
very difficult to obtain accurate shear dataon materials that exhibit some ductility,very little data exist on the shear yieldstrength for the HAZ, σy–HAZ-shear. It is
F D tPO y HAZ shear= ⋅ ⋅ ⋅ − −π σ
F f A
fD
IF total y weld
y weld
= ⋅ ⋅
= ⋅ ⋅ ⋅
−
−
σ
π σ ( )2
43
Fig. 11 — ID14 cross-tension energy absorption vs. average weld diameter. Fig. 12 — ID15 cross-tension peak load vs. average weld diameter.
Table 4 — ID15 Lap-Shear Data Summary
Lap Shear
Specimen Peak Energy FailureLoad (Nmm) Mode(kN)
Joint ID 15 (RSW): 5182-O/6111-T4 (2 mm/2mm)
15LC-l 7.42 13,718.57 IF15LC-2 7.16 9,463.15 IF15LC-3 7.37 9,299.41 IF15LC-4 7.33 15,359.30 IF15LC-5 7.39 10,653.87 IF15LC-6 7.38 9,526.16 IF15LC-7 7.36 12,214.77 IF15LC-8 7.12 9,877.26 IF15LC-9 6.83 9,840.35 IFl5LC-10 6.98 9,015.96 IF15LC-11 7.41 9,453.57 IF15LC-12 6.61 7,600.93 IFl5LC-13 7.41 9,797.88 IF15LC-14 6.91 7,539.23 IF15LC-15 6.80 7,937.10 IF15LC-16 7.28 9,111.27 IF15LC-17 7.02 8,243.76 IF15LC-18 7.79 11,161.31 IF15LC-19 7.45 9,792.78 IF15LC-20 7.24 9,715.70 IF15LC-21 7.24 10,028.77 IF15LC-22 7.40 9,506.06 IF15LC-23 7.19 9,484.95 IF15LC-24 7.10 — IF15LC-25 7.03 8,243.38 IF15LC-26 7.16 8,615.48 IF15LC-27 6.98 8,211.16 IF15LC-28 6.71 7,349.01 IF15LC-29 7.19 8,900.46 IF15LC-30 6.55 7,224.97 IF
Maximum 7.79 15,359.30Mean 7.16 9,547.81Minimum 6.55 7,224.97
sun qwk corr 10/8/04 2:05 PM Page 313

WELDING RESEARCH
NOVEMBER 2004-S314
generally agreed that the shear yieldstrength of ductile cast iron is about 0.6 to0.7 times its tensile yield strength (Ref.
15). Taking a similar approach, we assumehere that the shear yield strength of theHAZ is about 70% of its tensile yield
strength. Summarizing the above yieldstrength analyses, we have
σy–weld = σy–base-metal (6)
σy–HAZ-shear = 0.7 · σy–HAZ
= 0.7 · 115% · σy–base-metal
≈ 0.8 · σy–base-metal (7)
Substituting Equations 6, 7, 3, and 4into Inequality 5 produces the conditionunder which pullout failure mode can beensured:
(8)
Therefore, for a certain sheet thick-ness, t, and weld porosity factor, f, thelarger the weld diameter D, the better thechance for ensuring a pullout mode of fail-ure. Also, for a certain sheet thickness, t,the lower the value f, i.e., the higher theporosity level, the larger the nugget diam-eter D is needed to ensure pullout failure.
The failure mode prediction method-ology described above can also be illus-trated schematically as shown in Fig. 16, inwhich the heavier lines indicate the pre-dicted failure mode. Given a certain ma-terial thickness, t, and porosity factor, f,when D is smaller than Dcritical , FIF < FPO.Therefore, interfacial fracture would bethe dominant failure mode under crosstension. On the other hand, when D isgreater than Dcritical, FPO < FIF. Therefore,nugget pullout would be the dominantfailure mode under cross-tension loading.
If one assumes f=1.0, i.e., perfect qual-ity aluminum spot welds with no porosityand irregularity, the predicted nugget sizeof 3.2t for pullout mode can be compared
D
t
fcritical > 3 2.
Fig. 13 — ID15 cross-tension energy absorption vs. average weld diameter.
Table 5 — ID15 Cross-Tension Data Summary
Cross TensionSpecimen Peak Load (kN) Energy (Nmm) Failure Mode Nugget Side
Joint ID 15 RSW: 5182-O/6111-T4 (2 mm/2 mm)
15TC-1 5.84 54,744.00 PO 5xxx15TC-2 6.86 61,808.00 PO 6xxx15TC-3 6.77 61,245.00 PO 6xxx15TC-4 6.97 67,526.00 IF-PO 6xxx15TC-5 5.94` 50,020.00 PO 5xxx15TC-6 6.83 64,767.00 PO 5xxx15TC-7 4.42 35,325.00 PO 5xxx15TC-8 4.38 33,004.00 PO 6xxx15TC-9 5.49 44,818.00 PO 5xxx15TC-10 6.25 57,750.00 PO 6xxx15TC-11 5.59 55,457.00 PO 6xxx15TC-12 6.07 52,514.00 PO 6xxx15TC-13 6.59 60,647.00 PO 5xxx15TC-14 6.37 54,782.00 PO 5xxx15TC-15 5.84 45,983.00 IF-PO 6xxx15TC-16 5.05 38,761.00 PO 5xxx15TC-17 6.22 49,426.00 PO 5xxx15TC-18 6.53 55,274.00 PO 6xxx15TC-19 6.65 57,700.00 PO 5xxx15TC-20 5.50 46,349.00 PO 5xxx15TC-21 5.29 40,516.00 PO 6xxx15TC-22 6.10 50,830.00 PO 6xxx15TC-23 5.91 45,109.00 PO 5xxx15TC-24 6.88 58,865.00 PO 5xxx15TC-25 6.03 46,745.00 PO 5xxx15TC-26 5.39 40,903.00 PO 5xxx15TC-27 5.25 42,237.00 PO 6xxx15TC-28 4.92 35,422.00 IF-PO 6xxx15TC-29 6.62 59,261.00 PO 6xxx15TC-30 6.04 51,240.00 IF-PO 5xxx
Maximum 6.97 67,526.00Mean 5.95 50,634.27Minimum 4.38 33,004.00
Fig. 14— Hardness traverse for ID14.
sun qwk corr 10/7/04 9:18 AM Page 314

WELDING RESEARCH
-S315WELDING JOURNAL
with the conventional recommended mini-mal nugget size of 4√t. If the thickness of thealuminum sheet being welded is less than1.5625 mm, then the conventional minimalnugget size recommendation of 4√t is suffi-cient to ensure nugget pullout. On the otherhand, if the aluminum sheet thickness isgreater than 1.5625 mm, the recommendedminimal nugget size of 4√t is smaller than3.2t. Therefore, the recommended minimalweld size of 4√t is not sufficient to ensurenugget pullout failure under cross-tensionloading condition. If one were to take intoconsideration weld porosity and irregularityof the actual production welds, the nuggetsize needs to be further increased to ensurenugget pullout.
From another perspective, Fig. 16 alsoindicates that the cross-tension strength ofthe weld depends primarily on the weld di-ameter D under a certain level of porosity.For weld diameters smaller than Dcritical,interfacial fracture failure mode would bedominant, and the peak failure load wouldincrease in a parabolic fashion with re-spect to the weld diameter. For weld di-
ameters greater than Dcritical, nugget pull-out would be the dominant failure mode,and peak failure load increases linearlywith the weld diameter. This conclusionvalidates the observations obtained in theprevious section on the effect of weld size.It is also consistent with the observationsreported in Ref. 12, which stated that weldsize is an influencing factor in determiningthe different failure modes for spot weldsof 6XXX series of aluminum alloys.
Model Validation andDiscussions
In order to validate the above analyti-cal failure mode model, two additionalpopulations of aluminum spot welds with2-mm AA5182-O were fabricated forcross-tension loading condition. Our in-tention was to make one sample popula-tion with a weld size smaller than the orig-inal ID14, and another sample populationwith a weld size larger than ID14. We labeled these populations as ID14-small-weld and ID14-large-weld. The intended
fusion zone diameter for the ID14-small-weld population was 5.5 to 6.1 mm, andthe intended fusion zone size for the ID14-large-weld population was 9 to 10.6 mm.Typical weld cross sections for ID14-small-weld and ID14-large-weld are shown inFig. 17. Note that the small weld popula-tion has the desired weld size of 4√ t (Ref.9). Again, 30 replicates of quasistaticcross-tension tests were conducted foreach population, and the resulting peakload and joint failure modes wererecorded.
According to Figs. 4 and 17, the areapercentage of porosity on the faying inter-face can be estimated as ~15 to 20% for atypical weld in ID14, ID14-small-weld,and ID14-large-weld. Assuming the samelevel of f=0.85 for all three populations,we derive Dcritical =7.5 mm according toEquation 8 for 2-mm AA5182-O sheet.Since the weld sizes for the samples inID14 were controlled to be around 8 mm,this may explain why the majority of thecross-tension samples in ID14 failed innugget pullout mode. The recorded
Table 6 — ID15 Coach-Peel Data Summary
Coach PeelSpecimen Peak Load (kN) Energy (Nmm) Failure Mode Nugget Side
Joint ID 15 RSW: 5182-O/6111-T4 (2 mm/2 mm)
15CC-1 1.44 22,079.00 IF-PO 5xxx15CC-2 1.28 16,117.00 PO 5xxx15CC-3 1.51 20,058.00 IF-PO 6xxx15CC-4 1.39 17,839.00 PO 5xxx15CC-5 1.54 17,220.00 PO-IF 5xxx15CC-6 1.11 15,215.00 IF-PO 6xxx15CC-7 1.41 16,403.00 IF-PO 5xxx15CC-8 1.27 20,466.00 IF-PO-SS 5xxx15CC-9 1.62 33,712.00 PO 6xxx15CC-10 1.35 23,679.00 IF-PO 6xxx15CC-11 1.24 17,252.00 PO-IF 5xxx15CC-12 1.26 20,947.00 PO-IF 6xxx15CC-13 1.39 21,142.00 PO-IF 5xxx15CC-14 1.38 19,875.00 IF-PO 5xxx15CC-15 1.34 17,472.00 PO-IF 6xxx15CC-16 1.25 18,398.00 IF-PO 6xxx15CC-17 1.43 17,619.00 PO 5xxx15CC-18 1.39 18,026.00 PO-IF 5xxx15CC-19 1.45 24,309.00 PO-IF 5xxx15CC-20 1.45 23,302.00 PO 6xxx15CC-21 1.27 18,699.00 PO-IF 6xxx15CC-22 1.42 26,706.00 PO-SS 5xxx15CC-23 1.31 25,215.00 IF-PO 5xxx15CC-24 1.48 20,285.00 PO-IF 6xxx15CC-25 1.37 19,796.00 PO-IF 6xxx15CC-26 1.38 17,241.00 PO 6xxx15CC-27 1.40 19,160.00 PO-IF 6xxx15CC-28 1.39 18,771.00 IF-PO 5xxx15CC-29 1.19 17,390.00 IF-PO 6xxx15CC-30 1.28 16,200.00 PO-IF 5xxx
Maximum 1.62 33,712.00Mean 1.37 20,019.77Minimum 1.11 15,215.00
Table 7 — ID14 Large-Weld Cross-TensionData Summary
Cross TensionSpecimen Peak Load Energy Failure
(kN) (Nmm) Mode
14TC-31 5.8960 47,934 PO14TC-32 3.7940 24,434 PO14TC-33 3.7920 29,558 PO14TC-34 3.0790 17,537 PO14TC-35 3.6790 24,214 PO14TC-36 6.0510 57,769 IF/PO14TC-37 5.5320 54,446 PO14TC-38 4.2370 34,481 PO14TC-39 4.1860 35,231 PO14TC-40 5.4160 45,078 PO14TC-41 4.4860 37,030 PO14TC-42 2.6590 15,563 PO14TC-43 3.3660 23,930 IF/PO14TC-44 3.8260 31,079 PO14TC-45 5.6170 50,370 PO14TC-46 4.7980 44,482 PO14TC-47 3.1540 20,415 PO14TC-48 5.2200 52,467 PO14TC-49 6.4430 66,594 PO14TC-50 6.4450 64,080 PO14TC-51 6.6860 79,861 PO14TC-52 3.8140 38,295 PO14TC-53 2.6400 16,322 PO14TC-54 3.5170 27,666 PO14TC-55 3.2680 24,078 PO14TC-56 4.5170 42,731 PO14TC-57 5.9270 61,015 PO14TC-58 5.4690 60,233 PO14TC-59 6.5870 63,327 PO14TC-60 5.7880 54,103 PO
Maximum 6.6860 79,861.00Mean 4.6630 41,477.43Minimum 2.6400 15,563.00
sun qwk corr 10/7/04 9:18 AM Page 315
WELDING RESEARCH
NOVEMBER 2004-S316
nugget sizes shown in Figs. 10 and 11 alsoconfirm that all the welds in ID14 thatfailed in nugget pullout mode have welddiameters greater than 7.5 mm.
Furthermore, when we increased theweld size to 9–10 mm as in populationID14-large-weld, 28 out of the 30 weldstested failed in nugget pullout mode. SeeTable 7 for the summary of failure modeand nugget size for this population. Thetwo welds that failed in interfacial frac-ture mode have irregular fusion zoneshape, and their minimum fusion zone di-ameters are measured to be 4.95 and 7.1mm, respectively.
For ID14-small-weld population, 22out of the 30 welds tested failed in inter-facial fracture mode and 8 welds failed innugget pullout mode (Table 8). The actualfusion zone size for ID14-small-weld islarger than its intended value, with aver-age fusion zone size around 7.1 mm. Sincetheir average diameter is lower than thepredicted critical value, the majority ofthe welds failed in interfacial fracturemode.
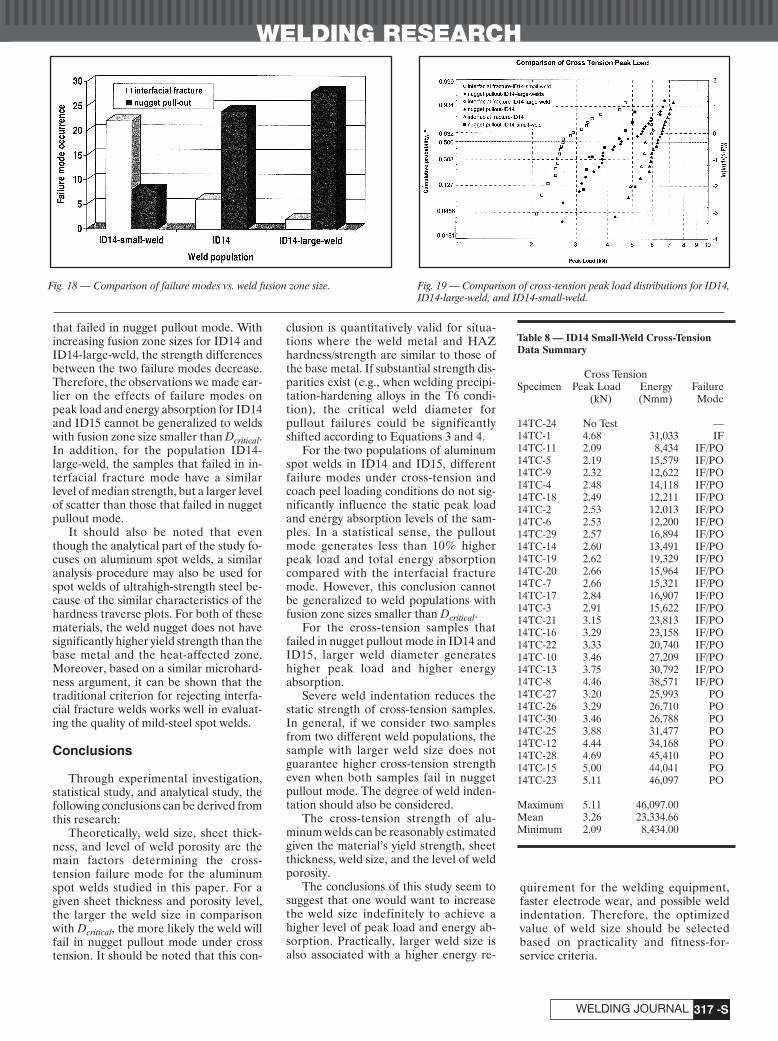
Figure 18 summarizes the experimen-tally observed failure modes for the origi-nal ID14, ID14-small-weld, and ID14-large-weld populations. The dominantfailure modes for the three populationschange from interfacial fracture to nuggetpullout with increasing fusion zone size.Considering the statistical nature of weldsize, porosity level, and distribution, theanalytical model works reasonably well inpredicting the critical weld size for nuggetpullout.
Thus far, we have validated Equation8 on the effect of fusion zone size D forfresh welds with consistent porosity levels.The validations do not include the effectsof weld porosity factor f. Since the level of
weld porosity and its dis-tributions are closely re-lated to electrode wear(Ref. 18), further valida-tions on the effect ofporosity factor f shouldbe investigated in con-junction with studies onelectrode wear.
It is worth noting thatgiven the material prop-erties and the nuggetsize, one can also useEquations 3, 4, 6, and 7to quickly estimate theanticipated cross-ten-sion strength of a spotweld population. For ex-ample, the shearstrength of AA5182-Oused in ID14 and ID15 isabout 140 MPa accord-ing to Refs. 16 and 17.Given the sheet thick-ness of 2 mm and the av-erage nugget size of 8.5mm, Equation 4 estimates the weld pull-out strength to be
(9)
The estimated cross-tension strengthin Equation 9 is very close to the strengthdata reported in Tables 2 and 5.
As noted in Equation 4, the actualweld pullout strength under cross-tensionloading condition also depends on the de-gree of weld indentation. Therefore, thefacts that a weld has a larger fusion zone
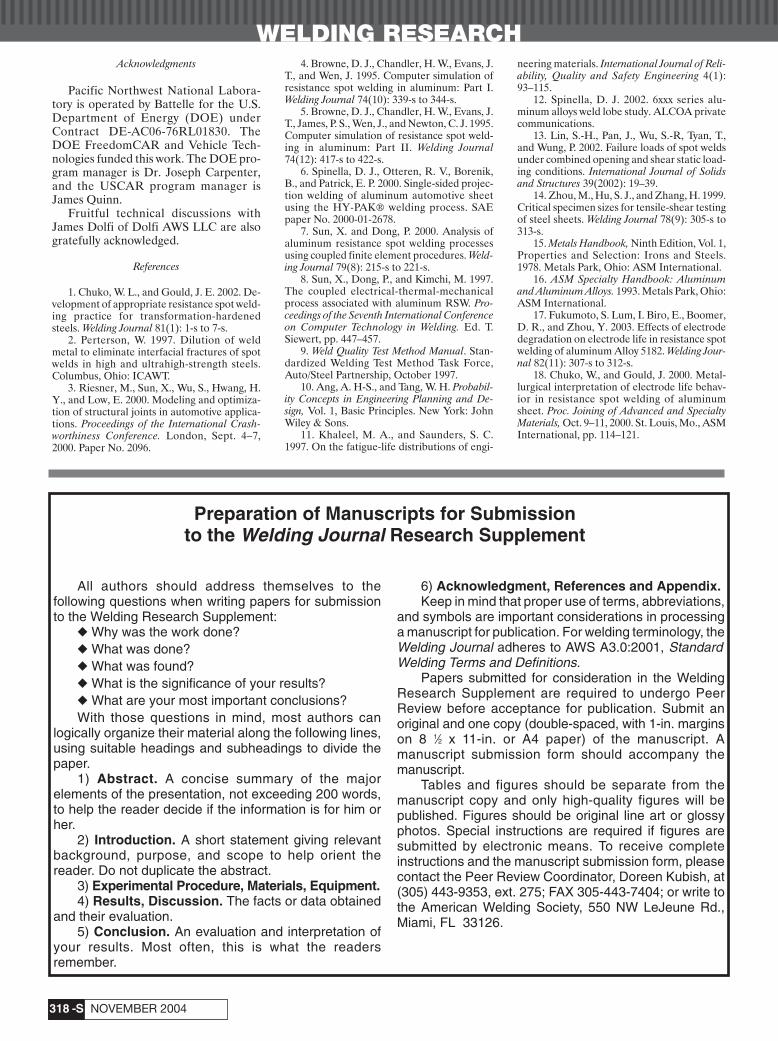
diameter and that it fails in nugget pulloutmode cannot guarantee it is stronger thana weld with a smaller fusion zone for thesame material combination. An exampleof this is shown in Fig. 19 with the peakloads of ID14, ID14-small-weld, andID14-large-weld compared. Even thoughID14-large-weld has a larger fusion zonesize than ID14, its average static strengthis lower than that of ID14 because of itssevere weld indentation and, therefore,the reduced effective sheet thickness t(see Fig. 17).
Another interesting observation fromFig. 19 is that, for joint ID14-small-weld,the mean strength for the samples thatfailed in interfacial fracture mode is con-siderably lower than that of the samples
F D t
kN
PO y HAZ shear= ⋅ ⋅ ⋅
≈ ⋅ ⋅ ⋅ ⋅=
− −π σ
π . .
.
8 5 2 0 8 1405 98
Fig. 15 — ID15 Vickers hardness measurement. The test force appliedwas 100 gf.
Fig. 16 — Schematic illustration of cross-tension failure load and failuremode vs. weld diameter under different porosity levels.
Fig. 17 — Typical metallurgical cross sections for ID14-large-weld andID14-small-weld.
sun qwk corr 10/7/04 9:18 AM Page 316
WELDING RESEARCH
-S317WELDING JOURNAL
that failed in nugget pullout mode. Withincreasing fusion zone sizes for ID14 andID14-large-weld, the strength differencesbetween the two failure modes decrease.Therefore, the observations we made ear-lier on the effects of failure modes onpeak load and energy absorption for ID14and ID15 cannot be generalized to weldswith fusion zone size smaller than Dcritical.In addition, for the population ID14-large-weld, the samples that failed in in-terfacial fracture mode have a similarlevel of median strength, but a larger levelof scatter than those that failed in nuggetpullout mode.
It should also be noted that eventhough the analytical part of the study fo-cuses on aluminum spot welds, a similaranalysis procedure may also be used forspot welds of ultrahigh-strength steel be-cause of the similar characteristics of thehardness traverse plots. For both of thesematerials, the weld nugget does not havesignificantly higher yield strength than thebase metal and the heat-affected zone.Moreover, based on a similar microhard-ness argument, it can be shown that thetraditional criterion for rejecting interfa-cial fracture welds works well in evaluat-ing the quality of mild-steel spot welds.
Conclusions
Through experimental investigation,statistical study, and analytical study, thefollowing conclusions can be derived fromthis research:
Theoretically, weld size, sheet thick-ness, and level of weld porosity are themain factors determining the cross-tension failure mode for the aluminumspot welds studied in this paper. For agiven sheet thickness and porosity level,the larger the weld size in comparisonwith Dcritical, the more likely the weld willfail in nugget pullout mode under crosstension. It should be noted that this con-
clusion is quantitatively valid for situa-tions where the weld metal and HAZhardness/strength are similar to those ofthe base metal. If substantial strength dis-parities exist (e.g., when welding precipi-tation-hardening alloys in the T6 condi-tion), the critical weld diameter forpullout failures could be significantlyshifted according to Equations 3 and 4.
For the two populations of aluminumspot welds in ID14 and ID15, differentfailure modes under cross-tension andcoach peel loading conditions do not sig-nificantly influence the static peak loadand energy absorption levels of the sam-ples. In a statistical sense, the pulloutmode generates less than 10% higherpeak load and total energy absorptioncompared with the interfacial fracturemode. However, this conclusion cannotbe generalized to weld populations withfusion zone sizes smaller than Dcritical.
For the cross-tension samples thatfailed in nugget pullout mode in ID14 andID15, larger weld diameter generateshigher peak load and higher energy absorption.
Severe weld indentation reduces thestatic strength of cross-tension samples.In general, if we consider two samplesfrom two different weld populations, thesample with larger weld size does notguarantee higher cross-tension strengtheven when both samples fail in nuggetpullout mode. The degree of weld inden-tation should also be considered.
The cross-tension strength of alu-minum welds can be reasonably estimatedgiven the material’s yield strength, sheetthickness, weld size, and the level of weldporosity.
The conclusions of this study seem tosuggest that one would want to increasethe weld size indefinitely to achieve ahigher level of peak load and energy ab-sorption. Practically, larger weld size isalso associated with a higher energy re-
quirement for the welding equipment,faster electrode wear, and possible weldindentation. Therefore, the optimizedvalue of weld size should be selectedbased on practicality and fitness-for-service criteria.
Table 8 — ID14 Small-Weld Cross-TensionData Summary
Cross TensionSpecimen Peak Load Energy Failure
(kN) (Nmm) Mode
14TC-24 No Test —14TC-1 4.68 31,033 IF14TC-11 2.09 8,434 IF/PO14TC-5 2.19 15,579 IF/PO14TC-9 2.32 12,622 IF/PO14TC-4 2.48 14,118 IF/PO14TC-18 2.49 12,211 IF/PO14TC-2 2.53 12,013 IF/PO14TC-6 2.53 12,200 IF/PO14TC-29 2.57 16,894 IF/PO14TC-14 2.60 13,491 IF/PO14TC-19 2.62 19,329 IF/PO14TC-20 2.66 15,964 IF/PO14TC-7 2.66 15,321 IF/PO14TC-17 2.84 16,907 IF/PO14TC-3 2.91 15,622 IF/PO14TC-21 3.15 23,813 IF/PO14TC-16 3.29 23,158 IF/PO14TC-22 3.33 20,740 IF/PO14TC-10 3.46 27,209 IF/PO14TC-13 3.75 30,792 IF/PO14TC-8 4.46 38,571 IF/PO14TC-27 3.20 25,993 PO14TC-26 3.29 26,710 PO14TC-30 3.46 26,788 PO14TC-25 3.88 31,477 PO14TC-12 4.44 34,168 PO14TC-28 4.69 45,410 PO14TC-15 5.00 44,041 PO14TC-23 5.11 46,097 PO
Maximum 5.11 46,097.00Mean 3.26 23,334.66Minimum 2.09 8,434.00
Fig. 18 — Comparison of failure modes vs. weld fusion zone size. Fig. 19 — Comparison of cross-tension peak load distributions for ID14,ID14-large-weld, and ID14-small-weld.
sun qwk corr 10/7/04 9:19 AM Page 317
WELDING RESEARCH
NOVEMBER 2004-S318
Acknowledgments
Pacific Northwest National Labora-tory is operated by Battelle for the U.S.Department of Energy (DOE) underContract DE-AC06-76RL01830. TheDOE FreedomCAR and Vehicle Tech-nologies funded this work. The DOE pro-gram manager is Dr. Joseph Carpenter,and the USCAR program manager isJames Quinn.
Fruitful technical discussions withJames Dolfi of Dolfi AWS LLC are alsogratefully acknowledged.
References
1. Chuko, W. L., and Gould, J. E. 2002. De-velopment of appropriate resistance spot weld-ing practice for transformation-hardenedsteels. Welding Journal 81(1): 1-s to 7-s.
2. Perterson, W. 1997. Dilution of weldmetal to eliminate interfacial fractures of spotwelds in high and ultrahigh-strength steels.Columbus, Ohio: ICAWT.
3. Riesner, M., Sun, X., Wu, S., Hwang, H.Y., and Low, E. 2000. Modeling and optimiza-tion of structural joints in automotive applica-tions. Proceedings of the International Crash-worthiness Conference. London, Sept. 4–7,2000. Paper No. 2096.
4. Browne, D. J., Chandler, H. W., Evans, J.T., and Wen, J. 1995. Computer simulation ofresistance spot welding in aluminum: Part I.Welding Journal 74(10): 339-s to 344-s.
5. Browne, D. J., Chandler, H. W., Evans, J.T., James, P. S., Wen, J., and Newton, C. J. 1995.Computer simulation of resistance spot weld-ing in aluminum: Part II. Welding Journal74(12): 417-s to 422-s.
6. Spinella, D. J., Otteren, R. V., Borenik,B., and Patrick, E. P. 2000. Single-sided projec-tion welding of aluminum automotive sheetusing the HY-PAK® welding process. SAEpaper No. 2000-01-2678.
7. Sun, X. and Dong, P. 2000. Analysis ofaluminum resistance spot welding processesusing coupled finite element procedures. Weld-ing Journal 79(8): 215-s to 221-s.
8. Sun, X., Dong, P., and Kimchi, M. 1997.The coupled electrical-thermal-mechanicalprocess associated with aluminum RSW. Pro-ceedings of the Seventh International Conferenceon Computer Technology in Welding. Ed. T. Siewert, pp. 447–457.
9. Weld Quality Test Method Manual. Stan-dardized Welding Test Method Task Force,Auto/Steel Partnership, October 1997.
10. Ang, A. H-S., and Tang, W. H. Probabil-ity Concepts in Engineering Planning and De-sign, Vol. 1, Basic Principles. New York: JohnWiley & Sons.
11. Khaleel, M. A., and Saunders, S. C.1997. On the fatigue-life distributions of engi-
neering materials. International Journal of Reli-ability, Quality and Safety Engineering 4(1):93–115.
12. Spinella, D. J. 2002. 6xxx series alu-minum alloys weld lobe study. ALCOA privatecommunications.
13. Lin, S.-H., Pan, J., Wu, S.-R, Tyan, T.,and Wung, P. 2002. Failure loads of spot weldsunder combined opening and shear static load-ing conditions. International Journal of Solidsand Structures 39(2002): 19–39.
14. Zhou, M., Hu, S. J., and Zhang, H. 1999.Critical specimen sizes for tensile-shear testingof steel sheets. Welding Journal 78(9): 305-s to313-s.
15. Metals Handbook, Ninth Edition, Vol. 1,Properties and Selection: Irons and Steels.1978. Metals Park, Ohio: ASM International.
16. ASM Specialty Handbook: Aluminumand Aluminum Alloys. 1993. Metals Park, Ohio:ASM International.
17. Fukumoto, S. Lum, I. Biro, E., Boomer,D. R., and Zhou, Y. 2003. Effects of electrodedegradation on electrode life in resistance spotwelding of aluminum Alloy 5182. Welding Jour-nal 82(11): 307-s to 312-s.
18. Chuko, W., and Gould, J. 2000. Metal-lurgical interpretation of electrode life behav-ior in resistance spot welding of aluminumsheet. Proc. Joining of Advanced and SpecialtyMaterials, Oct. 9–11, 2000. St. Louis, Mo., ASMInternational, pp. 114–121.
All authors should address themselves to thefollowing questions when writing papers for submissionto the Welding Research Supplement:
◆ Why was the work done?◆ What was done?◆ What was found?◆ What is the significance of your results?◆ What are your most important conclusions?With those questions in mind, most authors can
logically organize their material along the following lines,using suitable headings and subheadings to divide thepaper.
1) Abstract. A concise summary of the majorelements of the presentation, not exceeding 200 words,to help the reader decide if the information is for him orher.
2) Introduction. A short statement giving relevantbackground, purpose, and scope to help orient thereader. Do not duplicate the abstract.
3) Experimental Procedure, Materials, Equipment.4) Results, Discussion. The facts or data obtained
and their evaluation.5) Conclusion. An evaluation and interpretation of
your results. Most often, this is what the readersremember.
6) Acknowledgment, References and Appendix.Keep in mind that proper use of terms, abbreviations,
and symbols are important considerations in processinga manuscript for publication. For welding terminology, theWelding Journal adheres to AWS A3.0:2001, StandardWelding Terms and Definitions.
Papers submitted for consideration in the WeldingResearch Supplement are required to undergo PeerReview before acceptance for publication. Submit anoriginal and one copy (double-spaced, with 1-in. marginson 8 1⁄2 x 11-in. or A4 paper) of the manuscript. Amanuscript submission form should accompany themanuscript.
Tables and figures should be separate from themanuscript copy and only high-quality figures will bepublished. Figures should be original line art or glossyphotos. Special instructions are required if figures aresubmitted by electronic means. To receive completeinstructions and the manuscript submission form, pleasecontact the Peer Review Coordinator, Doreen Kubish, at(305) 443-9353, ext. 275; FAX 305-443-7404; or write tothe American Welding Society, 550 NW LeJeune Rd.,Miami, FL 33126.
Preparation of Manuscripts for Submissionto the Welding Journal Research Supplement
sun qwk corr 10/7/04 9:19 AM Page 318