welding productivity - s3.us-east-1.amazonaws.com
TRANSCRIPT
Welding ProductivityPresented by Robert Fox
Marketing Specialist @ Hobart Brothers LLC

Topics of Discussion
• Components of Weld Cost
• Components of Cycle Time
• Calculating Weld Cost & Cycle Time
• Information Gathering
• Reducing Weld Cost & Cycle Time
• Process Optimization
• Metal Cored Wires
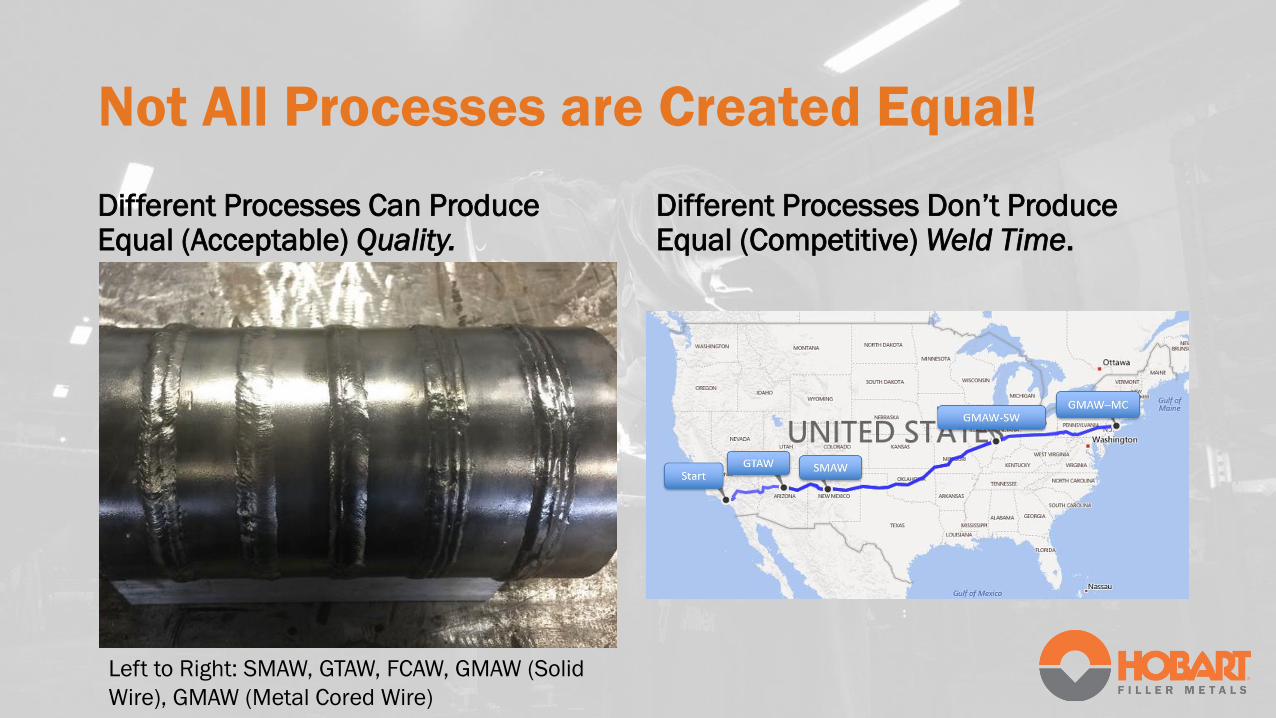
Not All Processes are Created Equal!
Different Processes Can Produce Equal (Acceptable) Quality.
Different Processes Don’t Produce Equal (Competitive) Weld Time.
Left to Right: SMAW, GTAW, FCAW, GMAW (Solid
Wire), GMAW (Metal Cored Wire)

Contributors to Weld Cost: Identification & Measurement
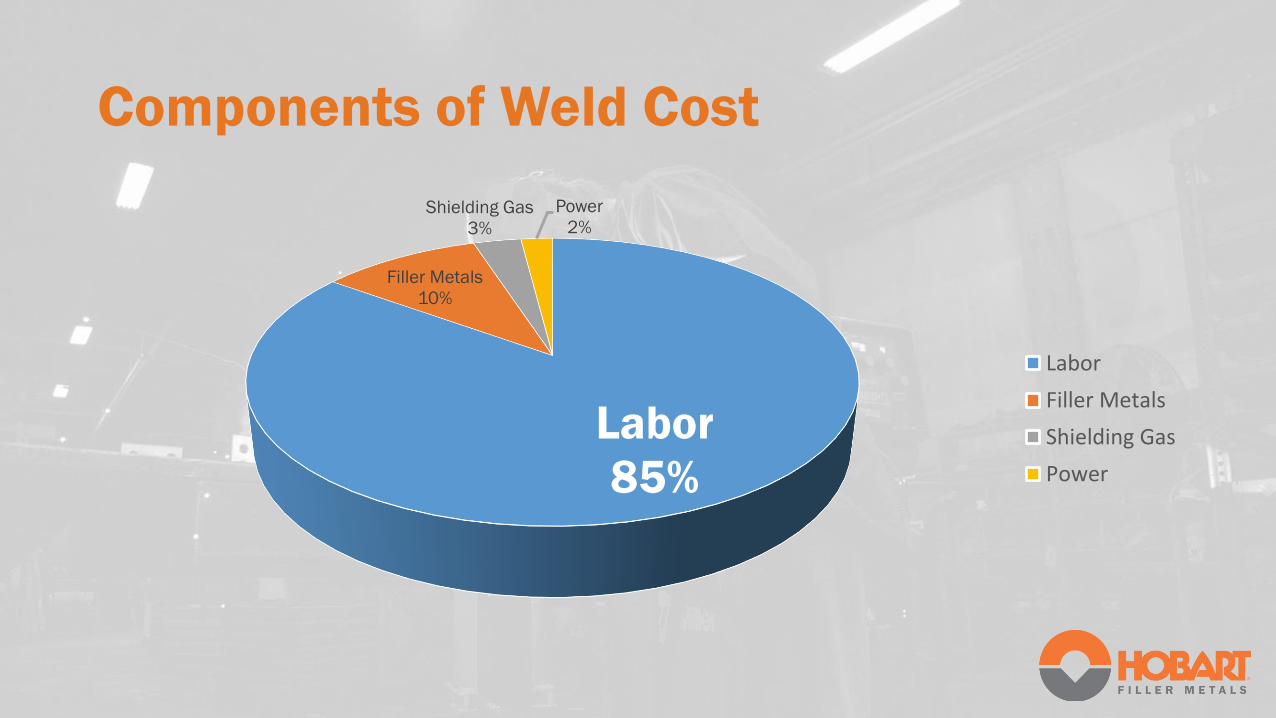
Components of Weld Cost
Labor
85%
Filler Metals
10%
Shielding Gas
3%
Power
2%
Labor
Filler Metals
Shielding Gas
Power
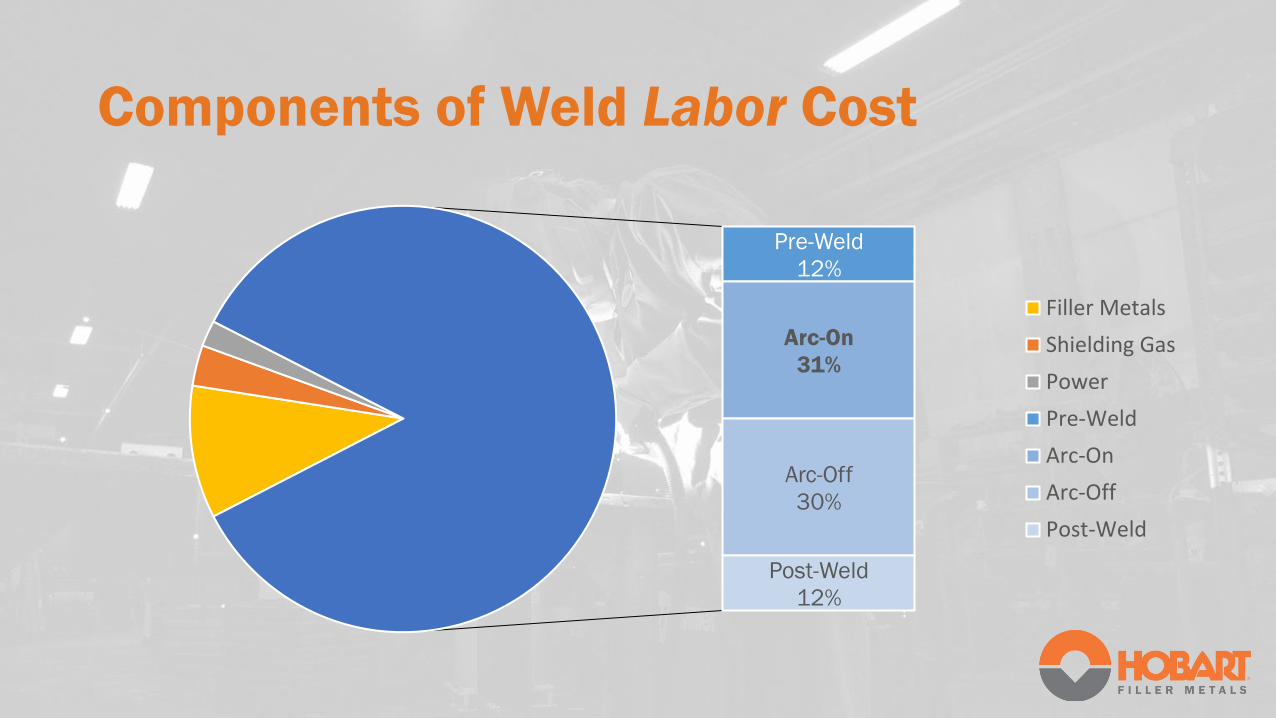
Components of Weld Labor Cost
Pre-Weld
12%
Arc-On
31%
Arc-Off
30%
Post-Weld
12%
Filler Metals
Shielding Gas
Power
Pre-Weld
Arc-On
Arc-Off
Post-Weld

Components of Weld Labor Cost
Phase Examples Value Added?
Pre-Weld • Mill Scale/Coating Removal
• Anti-Spatter Application
• Preheat Application
• Pre-cambering
• Repair
• Fixture Loading
• Part Movement
No
Arc-On Welding Yes
Arc-Off • Slag/Silicon Removal
• Interpass Temperature
• Part Movement
• Interpass Repair
• Consumable Changeover
• Air Movement
No
Post-Weld • Slag/Silicon Removal
• Spatter Removal
• Weld Finishing
• PWHT?
• Repair
• Part Distortion
• Weld Quality
• Fixture Unloading
• Part Movement
No

Determining Weld Cost

Example Spreadsheet is Available(Includes Calculation Formulas)
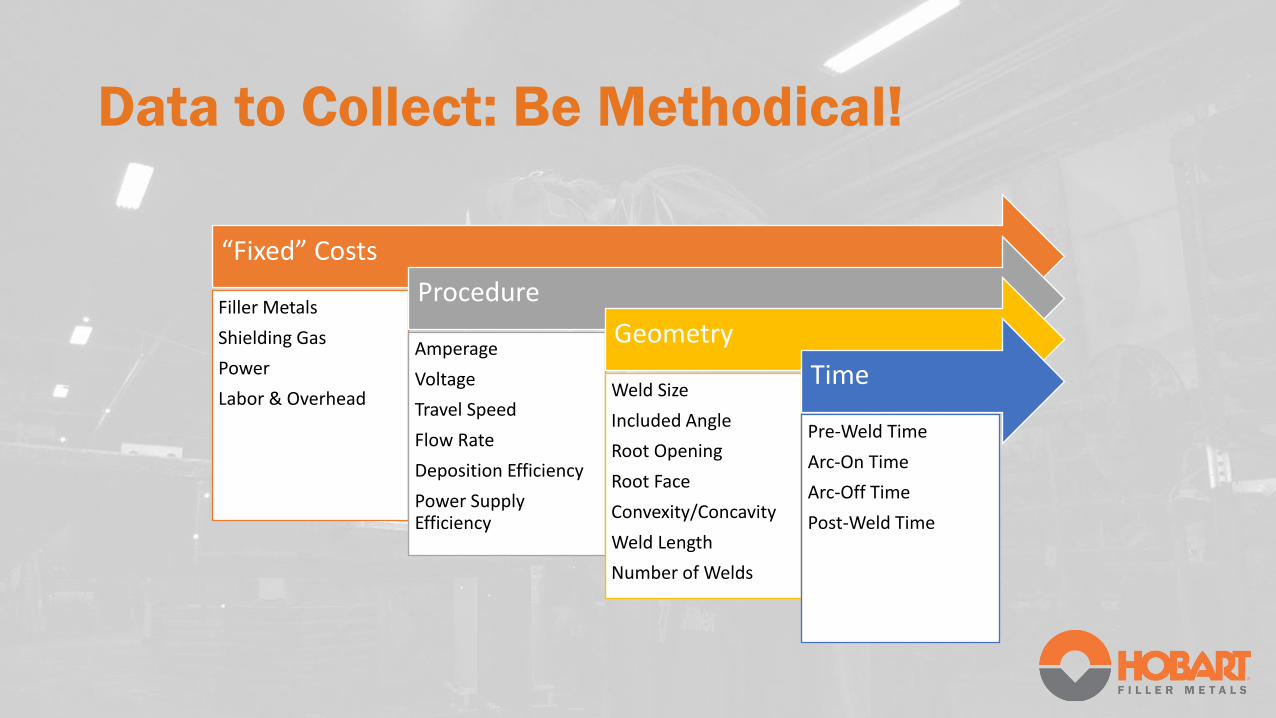
Data to Collect: Be Methodical!
“Fixed” Costs
Filler Metals
Shielding Gas
Power
Labor & Overhead
Procedure
Amperage
Voltage
Travel Speed
Flow Rate
Deposition Efficiency
Power Supply Efficiency
Geometry
Weld Size
Included Angle
Root Opening
Root Face
Convexity/Concavity
Weld Length
Number of Welds
Time
Pre-Weld Time
Arc-On Time
Arc-Off Time
Post-Weld Time

Tools of the Trade: Measuring Arc Time
Simple Enhanced Integrated
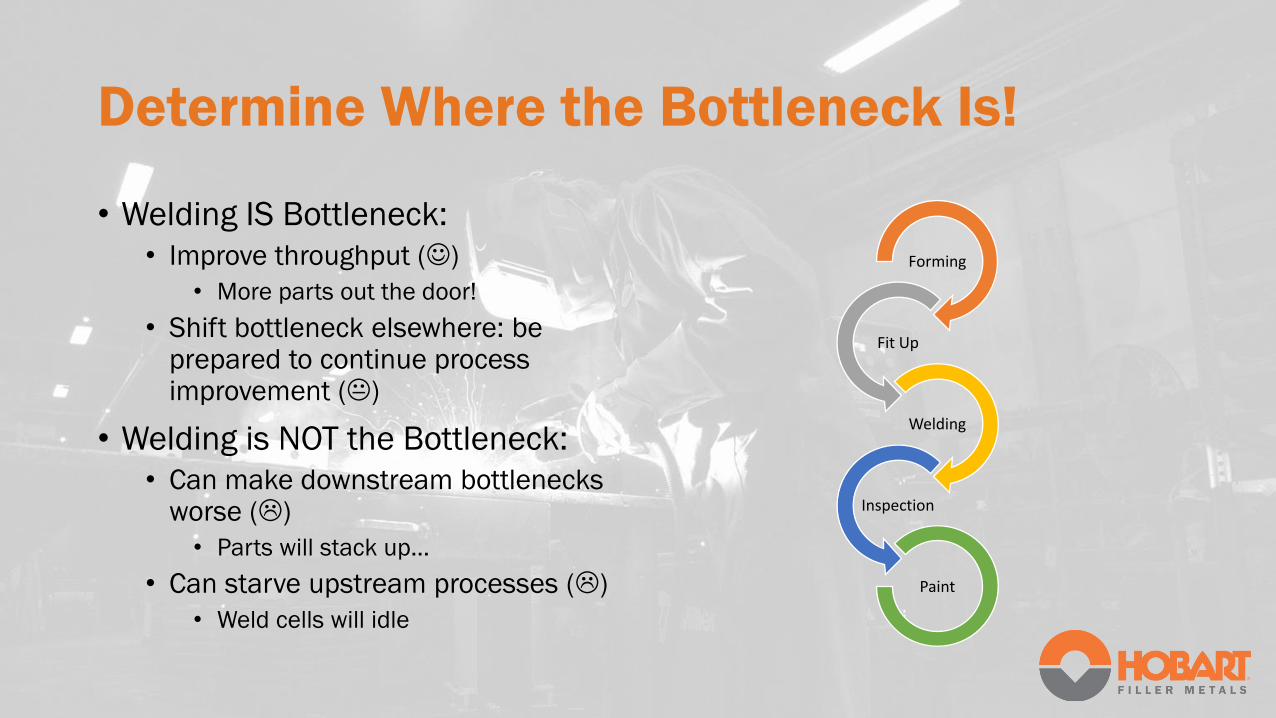
Determine Where the Bottleneck Is!
• Welding IS Bottleneck:
• Improve throughput (☺)
• More parts out the door!
• Shift bottleneck elsewhere: be prepared to continue process improvement ()
• Welding is NOT the Bottleneck:
• Can make downstream bottlenecks worse ()
• Parts will stack up…
• Can starve upstream processes ()
• Weld cells will idle
Forming
Fit Up
Welding
Inspection
Paint

Reduce Arc-On Time
↑ WFS (SMAW = Amps)
↑ Deposition Rate
↑ Travel
Speed ↓ # of Passes
↓ Arc-On Time
Increased Output
$AVINGS

Operator Factor
• Definition
• The ratio of the amount of time a welding operator spends welding to the total welding operation time
• Operator Factor (%) = Arc-On Time/Total Time x 100
• Process (Total) Time = Arc-On Time/Operator Factor
SMAW GMAW-MC
Arc-Off 22.5 3.9
Arc-On 26.2 9.2
0
10
20
30
40
50
60
Tim
e (
Min
ute
s)
6” Pipe Root to Cap Total Process Time:
Arc-On Time vs. Arc-Off Time
Arc-On Arc-Off
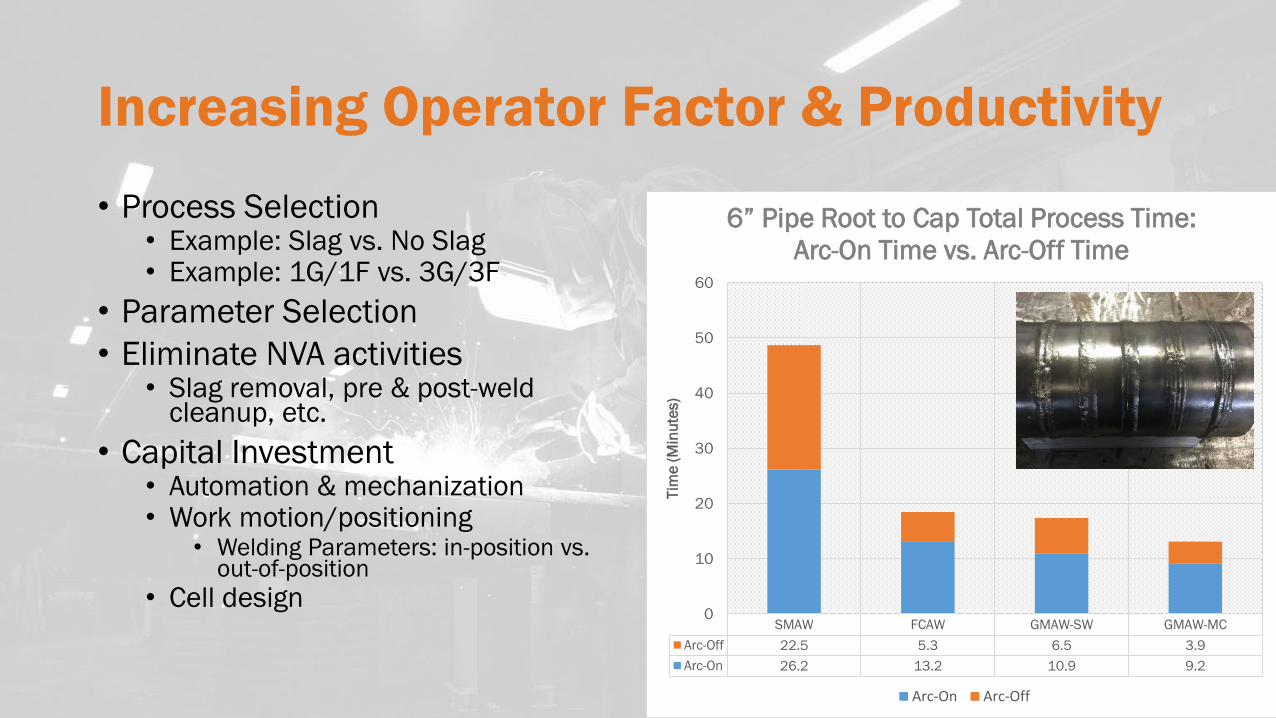
Increasing Operator Factor & Productivity
• Process Selection• Example: Slag vs. No Slag• Example: 1G/1F vs. 3G/3F
• Parameter Selection
• Eliminate NVA activities• Slag removal, pre & post-weld
cleanup, etc.
• Capital Investment• Automation & mechanization• Work motion/positioning
• Welding Parameters: in-position vs. out-of-position
• Cell designSMAW FCAW GMAW-SW GMAW-MC
Arc-Off 22.5 5.3 6.5 3.9
Arc-On 26.2 13.2 10.9 9.2
0
10
20
30
40
50
60
Tim
e (
Min
ute
s)
6” Pipe Root to Cap Total Process Time:
Arc-On Time vs. Arc-Off Time
Arc-On Arc-Off

Shielding Gas Consumption & Cost
• Typical Shielding Gas Cost =
• Arc-On Time (Hours) * Flow Rate (Cubic Feet per Hour) * Shielding Gas Cost ($/Cubic Foot)
• Consider weldment, pre- & post-weld purge similarly
• Gas Cost per Cylinder ($/ft3)
• (Pressure (psi) * Cylinder Volume (ft3)/(14.7(psi) * Cylinder Cost)

Shielding Gas Price Influencers
• Gas Composition
• As argon content increases, so does price
• REMEMBER: use consumable features to reduce LABOR cost
• Delivery System Type & Condition
• Point of Use Size
• Point of Use vs. Bulk Systems
• Account Volume
Composition
Example Price
(per 300-Size
Cylinder)
Example Price
($/ft3)
90% Argon
10% Carbon
Dioxide
$70.02 0.298
75% Argon
25% Carbon
Dioxide
$53.00 0.226
100% Carbon
Dioxide$48.17 0.205
Filler Metals
10%
Shielding Gas
3%
Power
2%

Filler Metal Price Influencers
• Process/Type• Example: Solid Wire vs. Flux Cored Wire
vs. Seamless Flux Cored Wire
• Product Capabilities/Positioning• Improved features often requires unique
formulations• REMEMBER: use consumable features
to reduce LABOR cost
• Diameter• As diameter decreases, cost increases
• Packaging: Spools vs. Coils vs. Drums• Consider changeover cost!
• Account Volume

Filler Metal Changeover Cost

Filler Metal Consumption & Cost
• Step 1: Calculate Weld CSA
• Step 2: Calculate Weld Volume (Weld CSA * Weld Length)
• Step 3: Calculate Weld Weight (Weld Volume * Weld Density)
• Aluminum Density = ~0.096 lbs/in3
• Steel Density = ~0.283 lbs/in3
• Step 4: Calculate Filler Metal Consumption
• Weld Weight/Deposition Efficiency
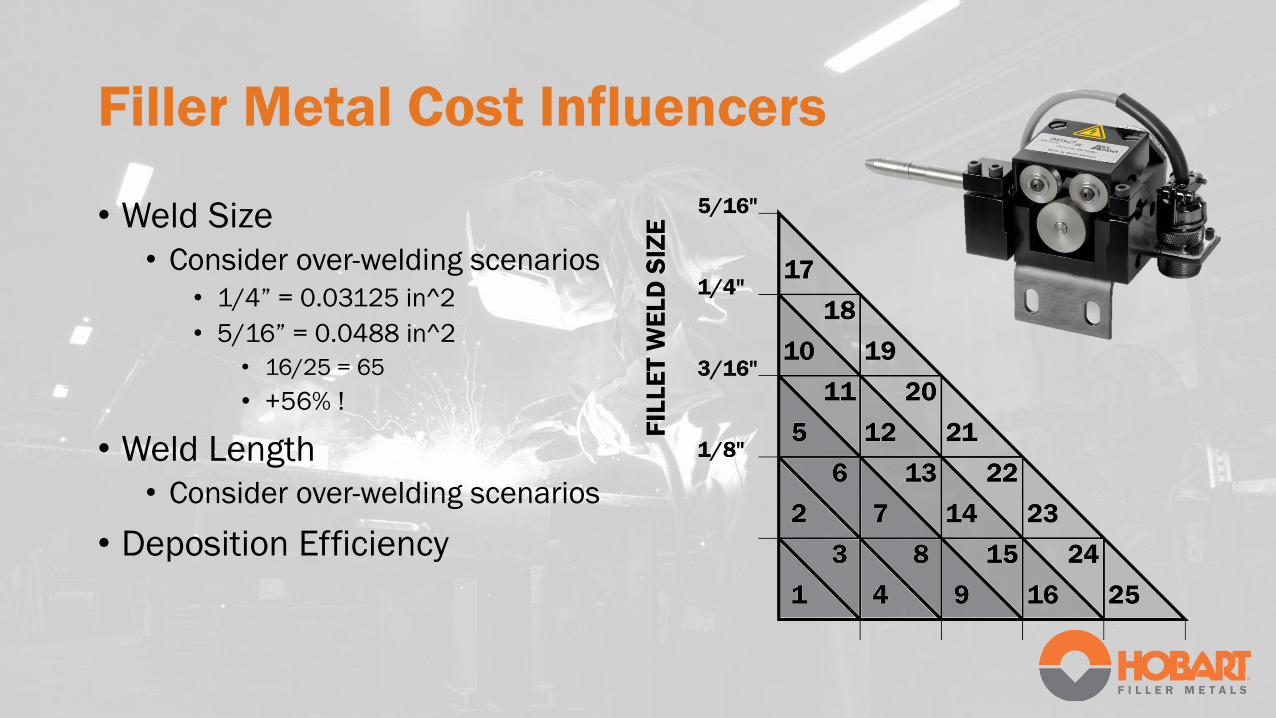
Filler Metal Cost Influencers
• Weld Size
• Consider over-welding scenarios
• 1/4” = 0.03125 in^2
• 5/16” = 0.0488 in^2
• 16/25 = 65
• +56% !
• Weld Length
• Consider over-welding scenarios
• Deposition Efficiency

Filler MetalCost Influencers
Consider Joint Type Consider Included Angle
0.000
0.500
1.000
1.500
2.000
2.500
3.000
3.500
4.000
0.5 0.75 1 1.25 1.5
Cro
ss-S
ecti
on
al A
rea
(in
^2
)
Material Thickness (in.)
Included Angle vs. Cross-Sectional Area(0.125" Root Opening, 0.0625" Root Face)
60 deg. Included Angle 45 deg. Included Angle
0.000
0.500
1.000
1.500
2.000
2.500
3.000
3.500
4.000
0.5 0.75 1 1.25 1.5
Cro
ss S
ecti
on
al A
rea
(in
^2
)
Material Thickness (in.)
Joint Design vs. Cross Sectional Area(0.125" Root Opening, 0.0625" Root Face, 60°
Included Angle)
Double V Single VSingle Double

Calculating Weld Cross Sectional Area
Divide the Weld into Primitive Geometric Shapes
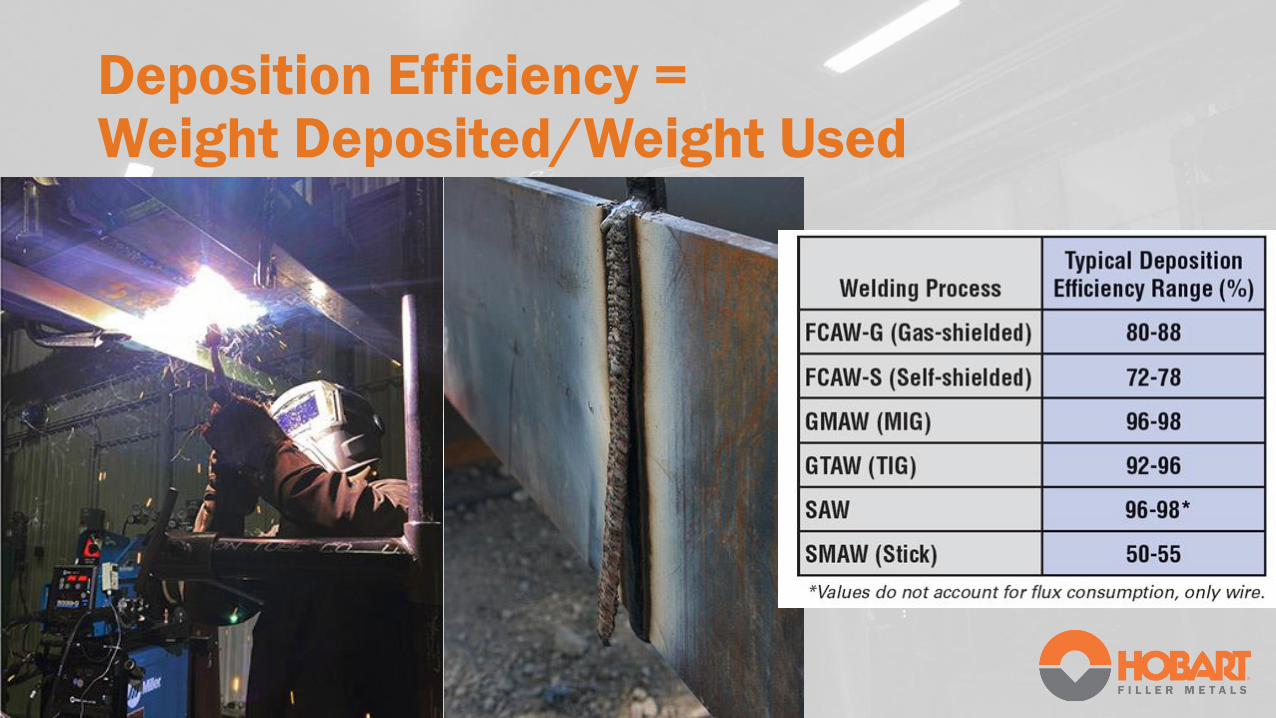
Deposition Efficiency = Weight Deposited/Weight Used
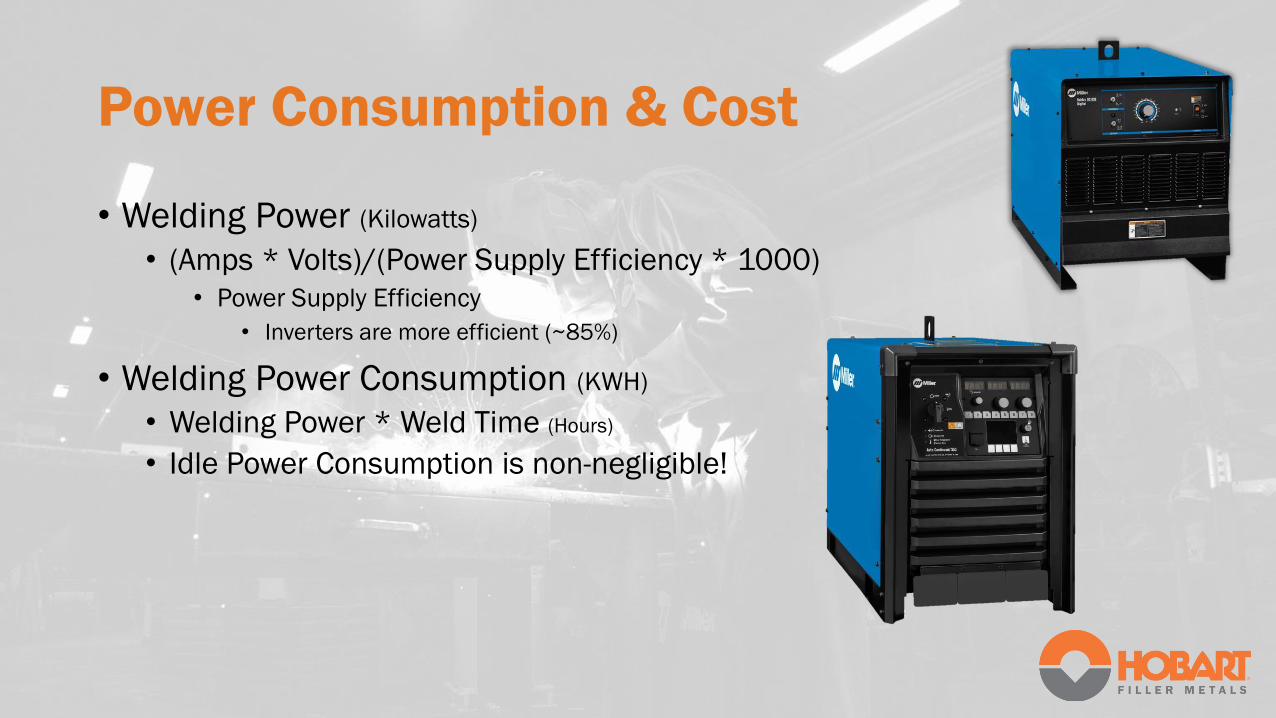
Power Consumption & Cost
• Welding Power (Kilowatts)
• (Amps * Volts)/(Power Supply Efficiency * 1000)
• Power Supply Efficiency
• Inverters are more efficient (~85%)
• Welding Power Consumption (KWH)
• Welding Power * Weld Time (Hours)
• Idle Power Consumption is non-negligible!

Suggested Reading
• WELDING HANDBOOK VOLUME 1 - WELDING AND CUTTING SCIENCE AND TECHNOLOGY (AWS
WHB-1.10)
• The American Welding Society
• Print—ISBN: 978-1-64322-014-7 PDF—ISBN: 978-1-64322-015-4
• PRINICIPLES OF INDUSTRIAL WELDING• The James F. Lincoln Arc Welding
Foundation
• ISBN: 0-937390-17-8
Metal Cored Wires

The Manufacture of Metal Cored Wires

Metal Cored Wire Benefits

How Metal Cored Wire Works
↓ Conductive Area
↑ Current Density
↑ Wire Feed Speed
↑ Deposition Rate

Deposition Rate Comparison
0
5
10
15
20
25
30
35
40
45
400 A 500 A 600 A 700 A 800 A
De
po
siti
on
Rat
e (
lbs/
hr)
3.2 MM SW 3.2 MM MC 4.0 MM SW 4.0 MM MC
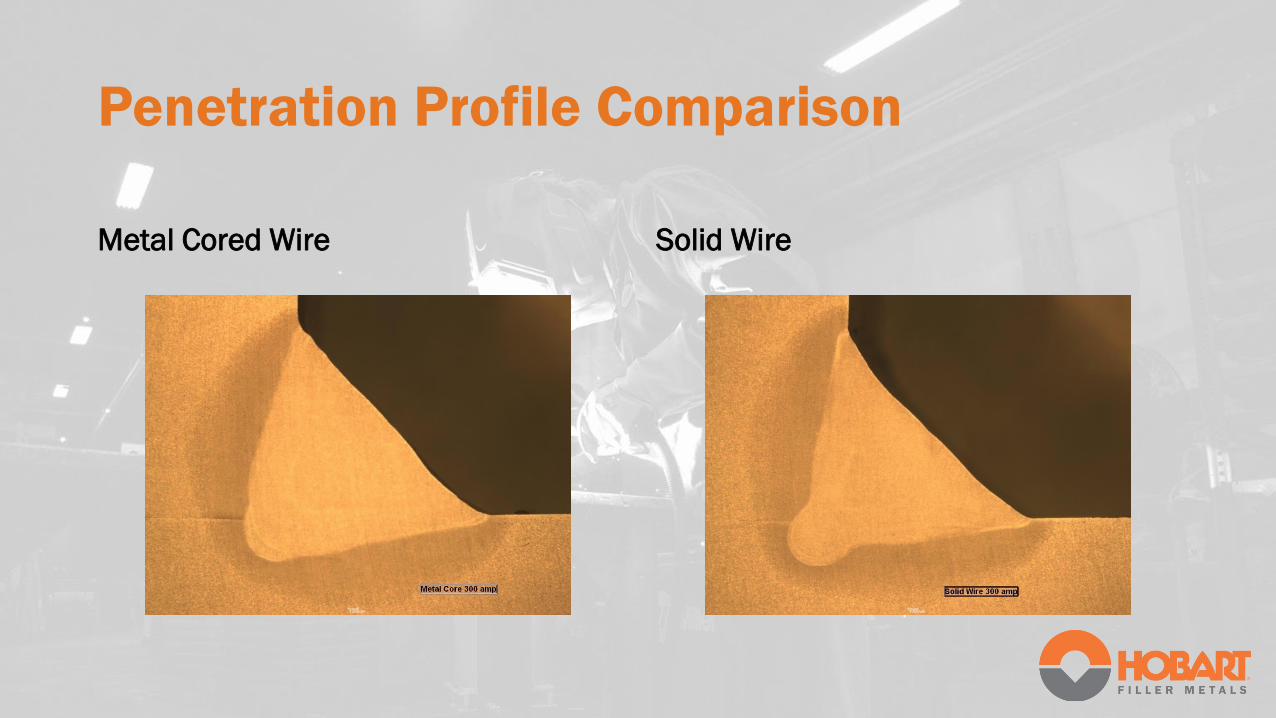
Penetration Profile Comparison
Metal Cored Wire Solid Wire

Penetration Profile Advantages
Wire Placement Forgiveness Improved Gap Bridging

Wire Placement
Metal Cored Wire Solid Wire

Gap Bridging Capability
Metal Cored Wire Solid Wire

Suggested Reading
• WELDING HANDBOOK VOLUME 2 - PART 1: WELDING PROCESSES (AWS WHB-2.9)
• The American Welding Society
• A5.18/A5.18M:2017 ERRATA SPECIFICATION FOR CARBON STEEL ELECTRODES AND RODS FOR GAS SHIELDED ARC WELDING
• A5.28/A5.28M:2020 SPECIFICATION FOR LOW-ALLOY STEEL ELECTRODES AND RODS FOR GAS SHIELDED ARC WELDING

AWS Certified Welding Supervisor

Questions & Discussion

Thank You!