welcome to the october edition of the 2021 m&r seminar series
TRANSCRIPT

Welcome to the October Edition of the 2021 M&R Seminar Series

NOTES FOR SEMINAR ATTENDEES
• All attendees’ audio lines have been muted to minimize background noise.
• A question and answer session will follow the presentation.
• Please use the “Chat” feature to ask a question via text to “All Panelists.”
• The presentation slides will be posted on the MWRD website after the
seminar.
• This seminar has been approved by the ISPE for one PDH and approved
by the IEPA for one TCH. Certificates will only be issued to participants
who attend the entire presentation.

DR. LEON DOWNING, P.E.PRINCIPAL PROCESS ENGINEER/INNOVATION LEADER
BLACK & VEATCH
Dr. Leon Downing is a Principal Process Engineer and Innovation Leader with Black & Veatch. Dr. Downing provides technology leadership in support of Black & Veatch process engineering and applied research projects globally. Dr. Downing has spent the last 15 years working with process and operational changes focused on energy efficiency, nutrient removal, and resource recovery. He is currently serving as the Principal Investigator for Water Research Project 4975, which focuses on developing practical considerations for fermentative enhanced biological phosphorus removal. Dr. Downing is also a co‐Principal Investigator on Water Research Project 5083, where low energy biological nutrient removal processes are being investigated. Between these two research projects, design guidelines for the next generation of biological nutrient removal facilities will be developed for the industry.

© 2021 The Water Research Foundation. ALL RIGHTS RESERVED. No part of this presentation may be copied, reproduced, or otherwise utilized without permission.
Best Practices in Kinetic Rate Testing and Data Interpretation to Measure EBPR Health – A Water
Research Foundation Study
Leon Downing, PhD, PE
Patrick Dunlap, PE
Yueyun Tse, PhD, PE
April Gu, PhD, PE

© 2021 The Water Research Foundation. ALL RIGHTS RESERVED. 5
Agenda/Presentation
• EBPR health
• Rate testing to inform EBPR optimization
• RAS fermentation case study

© 2021 The Water Research Foundation. ALL RIGHTS RESERVED. 6
WRF 4975 is focused on practical considerations for sidestream enhanced biological phosphorus removal
• 21 participating utilities globally
• $1.3 M research project value
• Identified as one of the top 10 Water Innovations for 2020
• Principal Investigator: Leon Downing, BV
• Co-PI: April Gu, University of Cornell
• Goals:
– Develop design criteria for the processes
– Identify operational tools for EBPR
– Recommend process modeling guidelines

© 2021 The Water Research Foundation. ALL RIGHTS RESERVED. 7
EBPR Health

© 2021 The Water Research Foundation. ALL RIGHTS RESERVED. 8
How do we better understand EBPR limitations?
“In biology, nothing is clear…Nature is anything but simple.” Richard Preston, Author of The Hot Zone
© 2021 The Water Research Foundation. ALL RIGHTS RESERVED. 9
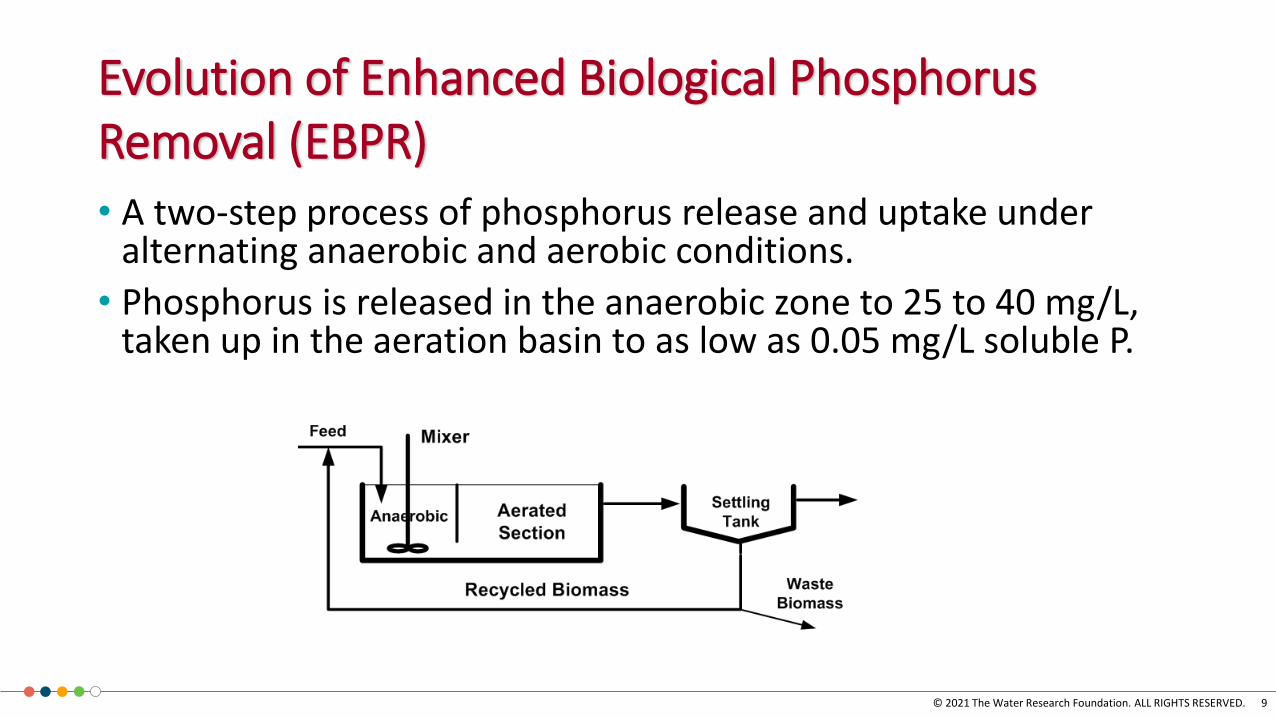
Evolution of Enhanced Biological Phosphorus Removal (EBPR)
• A two-step process of phosphorus release and uptake under alternating anaerobic and aerobic conditions.
• Phosphorus is released in the anaerobic zone to 25 to 40 mg/L, taken up in the aeration basin to as low as 0.05 mg/L soluble P.
9

© 2021 The Water Research Foundation. ALL RIGHTS RESERVED. 10
Initial pilot testing by James Barnard indicated the importance of influent VFA and influent selector• Note orthophosphates profile through plant with high release in 2nd Anoxic zone
• Performance could not be replicated in laboratory
• Barnard postulated that organisms (PAO) should pass through anaerobic phase with low ORP and P release, which triggered EBPR
• Suggested Phoredox process by adding anaerobic zone up front
Barnard 100 m3/d pilot 1972

© 2021 The Water Research Foundation. ALL RIGHTS RESERVED. 11
Proposed flow schematics were developed based on original thinking
These were followed by others such as UCT, JHB & Westbank

© 2021 The Water Research Foundation. ALL RIGHTS RESERVED. 12
S2EBPR generates carbon from biomass to drive EBPR
• Deep ORP selects for a more diverse PAO ecology, which provides access to a wider range of COD fractions
12

© 2021 The Water Research Foundation. ALL RIGHTS RESERVED. 13
Phosphate Accumulating Organisms (PAOS) are Focused on BOD Storage in Anaerobic Conditions
1313
PolyP
Anaerobic Conditions Aerobic Conditions
How do we better understand what is limiting PAO function?
PAO Cell
Glycogen
PolyPPHA
PO4PolyP
PAO Cell
Glycogen
PolyPPO4
O2VFA
PHA

© 2021 The Water Research Foundation. ALL RIGHTS RESERVED. 14
Optimizing EBPR requires more than effluent monitoring
• Several different mechanisms for PAOs
• Effluent performance can suffer days after event that creates increased effluent
• Simple rate testing can be used for monitoring PAO health
• Modeling can be used to inform optimization efforts

© 2021 The Water Research Foundation. ALL RIGHTS RESERVED. 15
Rate Testing to Understand PAO Health

© 2021 The Water Research Foundation. ALL RIGHTS RESERVED. 16
Can we use rate testing to better understand PAO function?
Are we achieving PHA storage and phosphorus release?
Is phosphorus uptake and PHA breakdown occurring?
How much extra PHA is available at the end of aeration?

© 2021 The Water Research Foundation. ALL RIGHTS RESERVED. 17Black &Veatch 17
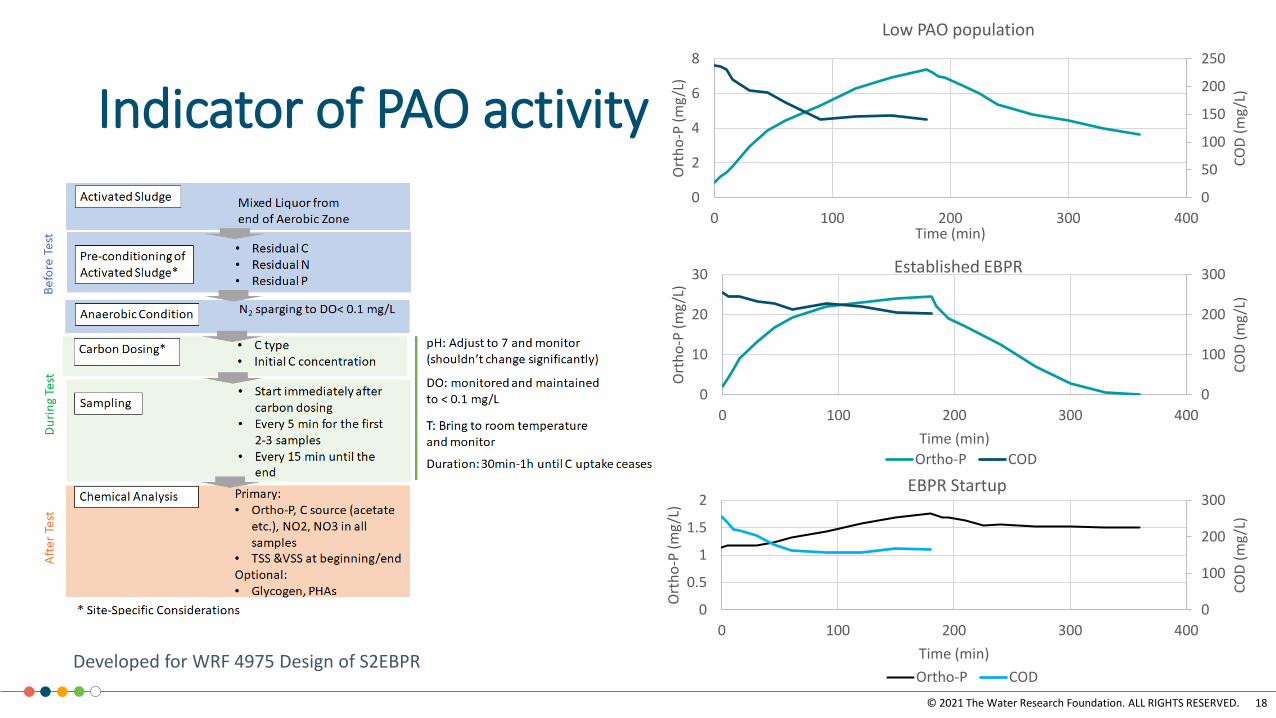
Release and uptake rate testing can be used as indicators of PAO population and activity
Sample from end of aeration basin, spike with acetate, measure phosphorus, then aerate to measure uptake rate
© 2021 The Water Research Foundation. ALL RIGHTS RESERVED. 18
Indicator of PAO activity
Developed for WRF 4975 Design of S2EBPR
0
50
100
150
200
250
0
2
4
6
8
0 100 200 300 400
CO
D (
mg
/L)
Ort
ho
-P (
mg
/L)
Time (min)
Low PAO population
0
100
200
300
0
10
20
30
0 100 200 300 400
CO
D (
mg
/L)
Ort
ho
-P (
mg
/L)
Time (min)
Established EBPR
Ortho-P COD
0
100
200
300
0
0.5
1
1.5
2
0 100 200 300 400
CO
D (
mg
/L)
Ort
ho
-P (
mg
/L)
Time (min)
EBPR Startup
Ortho-P COD

© 2021 The Water Research Foundation. ALL RIGHTS RESERVED. 19Black &Veatch 19
Residual phosphorus uptake rate can be implemented to understand PHA reservoir for phosphorus uptake
Sample from end of aeration basin, spike with phosphorus, measure uptake rate

© 2021 The Water Research Foundation. ALL RIGHTS RESERVED. 20
Indicator of how much PHA is stored
0
2
4
6
8
10
12
0 50 100 150 200 250
PO
43
- -P
(m
g/L
)
Time (min)
MLSS Residual Phosphorus Uptake 9/3/21

© 2021 The Water Research Foundation. ALL RIGHTS RESERVED. 21
Residual phosphorus uptake rate testing can be an indicator of PHA limitation
0
0.0005
0.001
0.0015
0.002
0.0025
0.003
0.0035
0.004
0.0045
9:07 10:19 11:31 12:43 13:55 15:07
mgO
P/m
gTSS
2-June 9-Jun 16-Jun 23-Jun
0
0.5
1
1.5
2
2.5
June 2 June 9 June 16 June 23
Residual P Uptake Rate (mgP/mgTS-hr)
0
0.05
0.1
0.15
0.2
0.25
0.3
5/29 6/3 6/8 6/13 6/18 6/23 6/28
Effluent OP (mg/L)

© 2021 The Water Research Foundation. ALL RIGHTS RESERVED. 22Black &Veatch 22
Fermentation rate can help identify the availability of carbon in the RAS of the system
Sample from RAS prior to selector zones

© 2021 The Water Research Foundation. ALL RIGHTS RESERVED. 23
Fermentation rate testing can identify P release and carbon release from RAS
0
50
100
150
200
250
300
350
400
0
5
10
15
20
25
30
0 20 40 60 80
CO
D (
mg/
L)
PO
43
- -P
(mg/
L)
Time (hr)
Ortho-P COD
Generate a RAS fermentation rate in mgCOD/gVSS-hr

© 2021 The Water Research Foundation. ALL RIGHTS RESERVED. 24
Case Study

© 2021 The Water Research Foundation. ALL RIGHTS RESERVED. 25
Wisconsin Rapids WWTP, Wisconsin Rapids, Wisconsin
Average flow: 3.5 mgdPeak day flow: 12 mgdFuture effluent P limit: 0.36 mg/LCurrent P Removal: PACl dosing

© 2021 The Water Research Foundation. ALL RIGHTS RESERVED. 26
RAS fermentation testing design
RAS fermentation zone is returned to the aeration basins, not the MBBR
x
Cranberry wastewater feed to the fermentation zone

© 2021 The Water Research Foundation. ALL RIGHTS RESERVED. 27
Overall performance has improved over time:RAS concentration and effluent
0
0.2
0.4
0.6
0.8
1
1.2
1.4
1.6
1.8
0
1000
2000
3000
4000
5000
6000
7000
8000
9000
4/14/2021 5/4/2021 5/24/2021 6/13/2021 7/3/2021 7/23/2021 8/12/2021 9/1/2021 9/21/2021 10/11/2021
Effl
uen
t O
P (
mg/
L)
RA
S TS
S (m
g/L)
RAS TSS and Effluent Ortho-P
RAS TSS Effluent Ortho-P
PACl stopped
© 2021 The Water Research Foundation. ALL RIGHTS RESERVED. 28
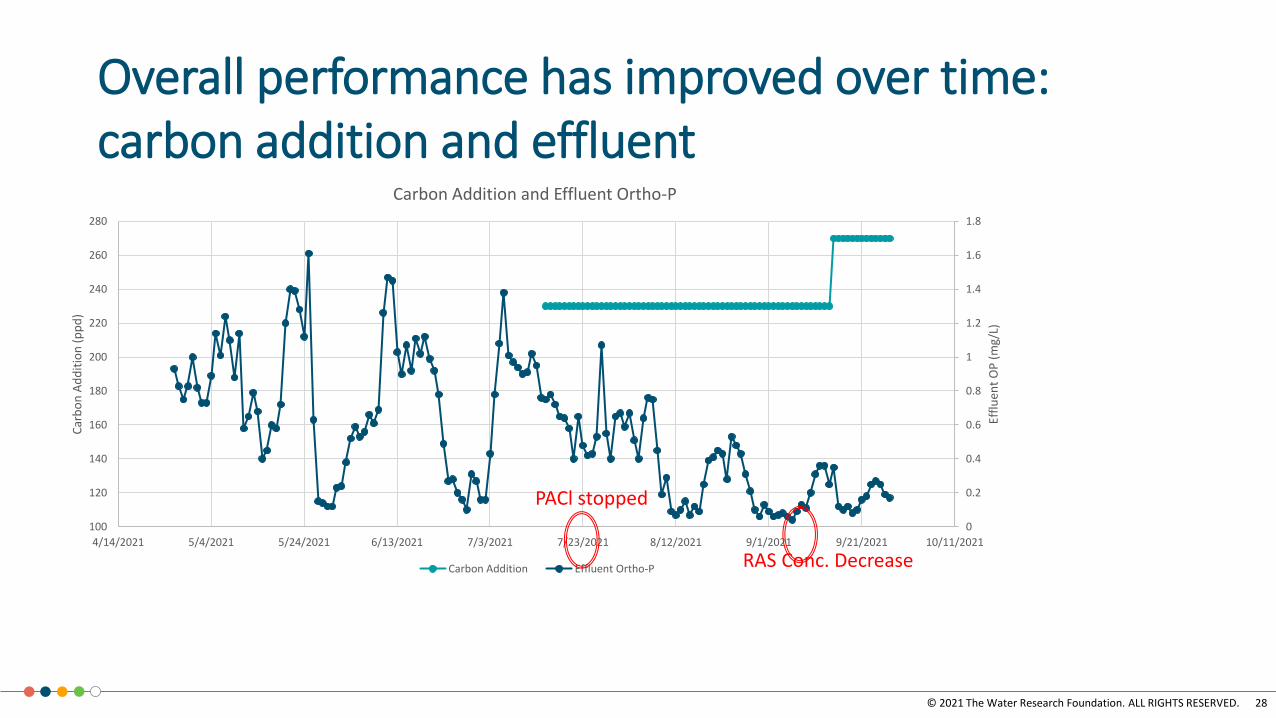
Overall performance has improved over time:carbon addition and effluent
0
0.2
0.4
0.6
0.8
1
1.2
1.4
1.6
1.8
100
120
140
160
180
200
220
240
260
280
4/14/2021 5/4/2021 5/24/2021 6/13/2021 7/3/2021 7/23/2021 8/12/2021 9/1/2021 9/21/2021 10/11/2021
Effl
uen
t O
P (
mg/
L)
Car
bo
n A
dd
itio
n (
pp
d)
Carbon Addition and Effluent Ortho-P
Carbon Addition Effluent Ortho-P
PACl stopped
RAS Conc. Decrease

© 2021 The Water Research Foundation. ALL RIGHTS RESERVED. 29
Can we think in terms of carbon needs for PAOs?
• System needs 420 to 570 ppd of carbon for EBPR
• RAS nitrate is 10 mg/L, which requires an additional 50 ppd of carbon
0
200
400
600
800
1000
1200
1400
1600
1800
5000 5500 6000 6500 7000 7500 8000 8500
sbC
OD
Pro
du
ctio
n (
pp
d)
RAS Concentration (mg/L)
1 2 3 4Ferm. Rate (mgCOD/gVSS-hr)
0
200
400
600
800
1000
1200
1400
1600
1800
20 30 40 50 60 70 80
sbC
OD
Req
uir
ed (
pp
d)
Phosphorus Load (ppd)
COD:P 11 COD:P 12 COD:P 13 COD:P 14
Average load during testing

© 2021 The Water Research Foundation. ALL RIGHTS RESERVED. 30
RAS fermentation rate has been measured over time
• Average rate: ~1 mgCOD/gVSS-hr
0
0.2
0.4
0.6
0.8
1
1.2
1.4
1.6
1.8
2
24-May 13-Jun 3-Jul 23-Jul 12-Aug 1-Sep 21-Sep 11-Oct
Avg
Rat
e (m
gCO
D/g
VSS
-d)
RAS Fermentation
0
50
100
150
200
250
300
350
400
0
5
10
15
20
25
30
0 10 20 30 40 50 60 70 80
CO
D (
mg/
L)
Ort
ho
-P (
mg/
L)
Time (hr)
RAS Fermentation 9/7/21
Ortho-P COD

© 2021 The Water Research Foundation. ALL RIGHTS RESERVED. 31
Can we think in terms of carbon needs for PAOs?
• Rate testing and mass balance would indicate an average shortage of ~235 ppd of carbon
0
200
400
600
800
1000
1200
1400
1600
1800
5000 5500 6000 6500 7000 7500 8000 8500
sbC
OD
Pro
du
ctio
n (
pp
d)
RAS Concentration (mg/L)
1Ferm. Rate (mgCOD/gVSS-hr)
0
200
400
600
800
1000
1200
1400
1600
1800
20 30 40 50 60 70 80
sbC
OD
Req
uir
ed (
pp
d)
Phosphorus Load (ppd)
COD:P 11 COD:P 12 COD:P 13 COD:P 14
Average load during testingProduction: 340 ppd
Need: 575 ppd

© 2021 The Water Research Foundation. ALL RIGHTS RESERVED. 32
Carbon balance is correlating to overall process performance
0
0.2
0.4
0.6
0.8
1
1.2
1.4
1.6
-800
-600
-400
-200
0
200
400
5/15/2021 6/5/2021 6/26/2021 7/17/2021 8/7/2021 8/28/2021 9/18/2021 10/9/2021
Effl
uen
t O
P (
mg/
L)
sbC
OD
Def
fici
ency
(pp
d)
COD Defficiency (ppd) Effluent Ortho-P (mg/L)
Carbon addition began
PAClOff

© 2021 The Water Research Foundation. ALL RIGHTS RESERVED. 33
Release and uptake can also be monitored over time to assess carbon efficiency
0
2
4
6
8
10
12
14
16
18
0
1
2
3
4
5
24-May 13-Jun 3-Jul 23-Jul 12-Aug 1-Sep 21-Sep 11-Oct
PO
43
- -P
(m
g/L)
Rat
e (
mgP
/gV
SS-h
r)
P Release P Uptake Fermenter Ortho-P

© 2021 The Water Research Foundation. ALL RIGHTS RESERVED. 34
Carbon source impact has also been investigated with bench-scale testing
0
50
100
150
200
250
300
0
2
4
6
8
10
12
14
16
18
0 100 200 300 400
CO
D (
mg/
L)
PO
43
- -P
(m
g/L)
Time (min)
MLSS Phosphorus Release & Uptake Using Cranberry on 9/23/21
Ortho-P COD
0
50
100
150
200
250
300
0
2
4
6
8
10
12
14
16
18
0 100 200 300 400 500
CO
D (
mg/
L)
PO
43
- -P
(m
g/L)
Time (min)
MLSS Phosphorus Release & Uptake Using MicroC on 9/22/22
Ortho-P COD
0
50
100
150
200
250
300
0
2
4
6
8
10
12
14
16
18
0 100 200 300 400
CO
D (
mg/
L)
Ort
ho
-P (
mg/
L)
Time (min)
MLSS P Release and Uptake Using Acetate 8/18/21
Ortho-P COD

© 2021 The Water Research Foundation. ALL RIGHTS RESERVED. 35
Is the RAS fermenter ecology adapted to cranberry juice (a.k.a. sugars)?
0.00
0.20
0.40
0.60
0.80
1.00
1.20
1.40
1.60
1.80
2.00
Cranberry Acetate MicroC
Ave
rage
Rel
ease
Rat
e (m
gP/g
VSS
-hr)
© 2021 The Water Research Foundation. ALL RIGHTS RESERVED. 36
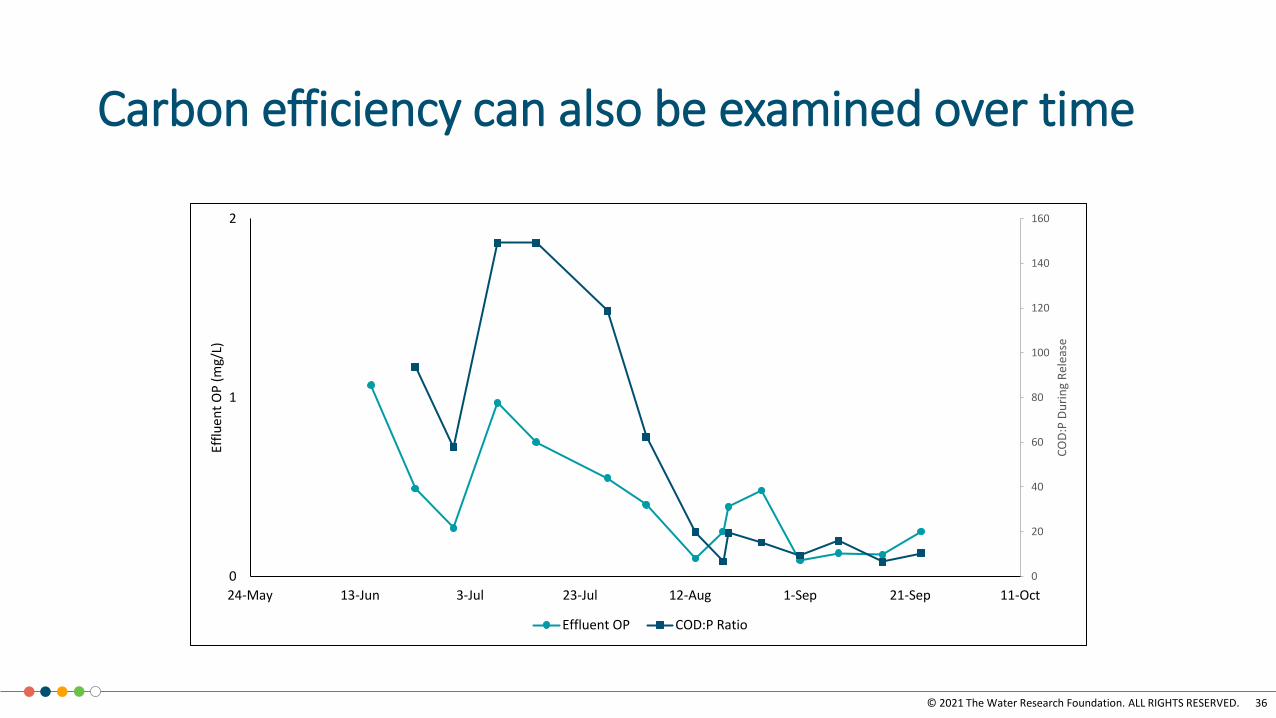
Carbon efficiency can also be examined over time
0
20
40
60
80
100
120
140
160
0
1
2
24-May 13-Jun 3-Jul 23-Jul 12-Aug 1-Sep 21-Sep 11-Oct
CO
D:P
Du
rin
g R
elea
se
Effl
uen
t O
P (
mg/
L)
Effluent OP COD:P Ratio

© 2021 The Water Research Foundation. ALL RIGHTS RESERVED. 37
Residual phosphorus uptake can also foreshadow carbon shortage
0
0.2
0.4
0.6
0.8
1
1.2
1.4
0.00
0.20
0.40
0.60
0.80
1.00
1.20
1.40
1.60
1.80
2.00
13-Jul 23-Jul 2-Aug 12-Aug 22-Aug 1-Sep 11-Sep 21-Sep 1-Oct
Effl
uen
t P
O4
3- -
P (
mg/
L)
Rat
e (
mgP
/gV
SS-h
r)
Rate Effluent Ortho-P

© 2021 The Water Research Foundation. ALL RIGHTS RESERVED. 38
Summary

© 2021 The Water Research Foundation. ALL RIGHTS RESERVED. 39
EBPR health should focus on assessing carboncycling in PAOs
3939
PolyP
Anaerobic Conditions Aerobic Conditions
How do we better understand what is limiting PAO function?
PAO Cell
Glycogen
PolyPPHA
PO4PolyP
PAO Cell
Glycogen
PolyPPO4
O2VFA
PHA

© 2021 The Water Research Foundation. ALL RIGHTS RESERVED. 40
Knowledge of the Whole Plant COD Balance is critical for EBPR (especially S2EBPR)
40How many pounds of COD do we need for PHA charging & how do we get that COD?
PRIMARY CLARIFIER
PRIMARY SLUDGEFERMENTER
ACTIVATED SLUDGE
Influent rbCOD & VFA• Influent selector zone
AnaerobicAerobic
Secondary Clarifier
Carbon addition (via primary sludge fermentate or external source)
• Controlled dosing to sidestream tank
RAS FERMENTER
COD available from VSS in RAS• Sufficient relative to influent P
• Impacted by influent characteristics, RAS nitrate, aerobic SRT
• Ability to produce 1 to 4 mgCOD/gVSS-hr
3
1
2

© 2021 The Water Research Foundation. ALL RIGHTS RESERVED. 41
Relatively simple rate testing can providecritical carbon balance information
• Simple apparatus
• Chemical needs: carbon source and orthophosphate
• Analytics: COD, phosphorus, nitrate
• Largest challenge: sample filtration

© 2021 The Water Research Foundation. ALL RIGHTS RESERVED. No part of this presentation may be copied, reproduced, or otherwise utilized without permission.
Thank you
Comments or questions, please contact:
Leon Downing: [email protected]
For more information, visit www.waterrf.org