welcome to vibrationdata · energy harvesting from ambient vibration sources page 8 welcome to...
TRANSCRIPT
1
Acoustics •••• Shock •••• Vibration •••• Signal Processing August 2004 Newsletter
Ahoy! Noise, Vibration, and Harshness (NVH) are important areas in automotive engineering.The goal is to minimize sound and vibration forpassenger comfort and for component reliability. Automobiles have an increasing amount of electronics which may be sensitiveto vibration fatigue. These components must be designed and tested accordingly. The component test specifications should be based on data collected during field tests of instrumented vehicles. The first article presents some sample accelerometer data that I measured on my own vehicle, as I drove over a highway and a dirt road. On another topic, researchers at UC Berkeley and Sandia are working on techniques for harvesting electrical energy from ambient vibration sources. This harvesting method is also referred to as scavenging. The goal is toconvert this energy for low-power electronic devices. The second article provides some data from my own harvesting science project using a vibration shaker. Sincerely,
Tom Irvine Email: [email protected]
Feature Articles
Automobile Vibration page 2
Energy Harvesting from Ambient Vibration Sources page 8
Welcome to Vibrationdata
2
Automobile Vibration By Tom Irvine
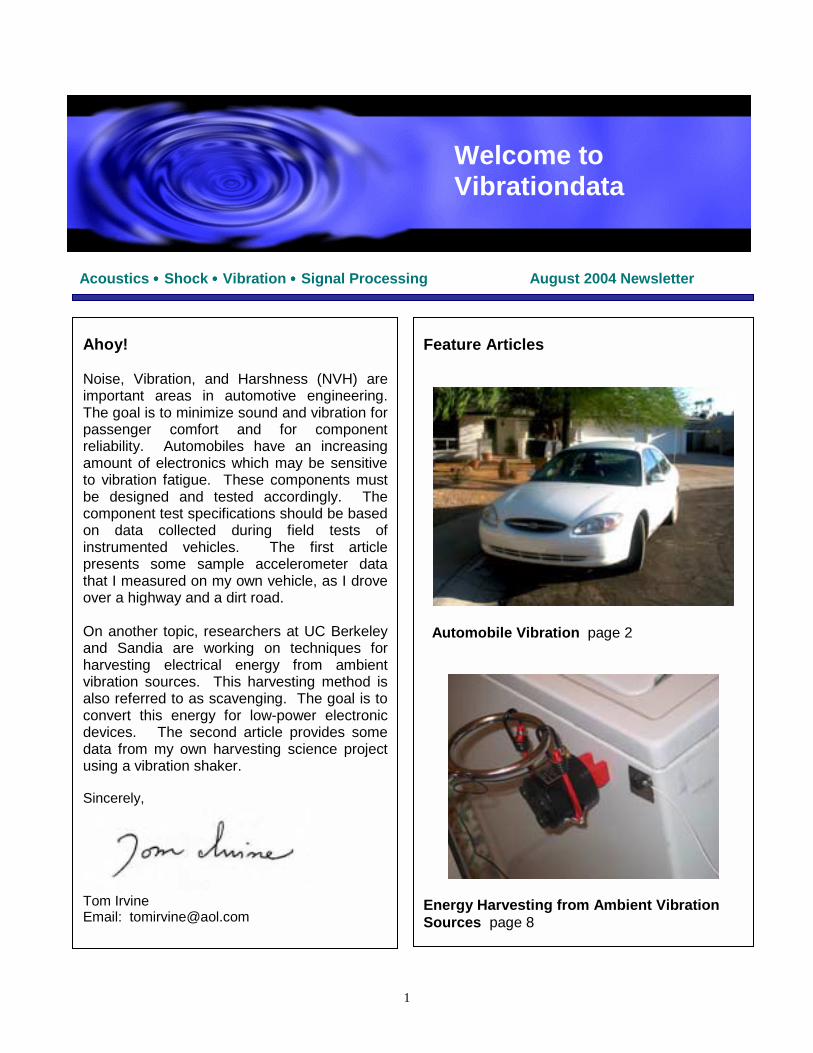
Figure 1. Accelerometer Location The accelerometer is located at the end of the white cable. It measured vibration in the vertical axis.
Introduction The question arises, “Is there a published vibration specification for testing automotive components?” Reference 1 provides some sample specifications. The proper method, however, is to take accelerometer measurements on a representative vehicle at the component mounting location. The vehicle should be driven over a variety of road surfaces and at various speeds. This can be done at a proving ground, such as the Bosch test facility in New Carlisle, Indiana. The vehicle could also be driven on actual highways or rough roads as appropriate. Component test levels can then be derived from the field data. The test levels may include margin for statistical uncertainty.
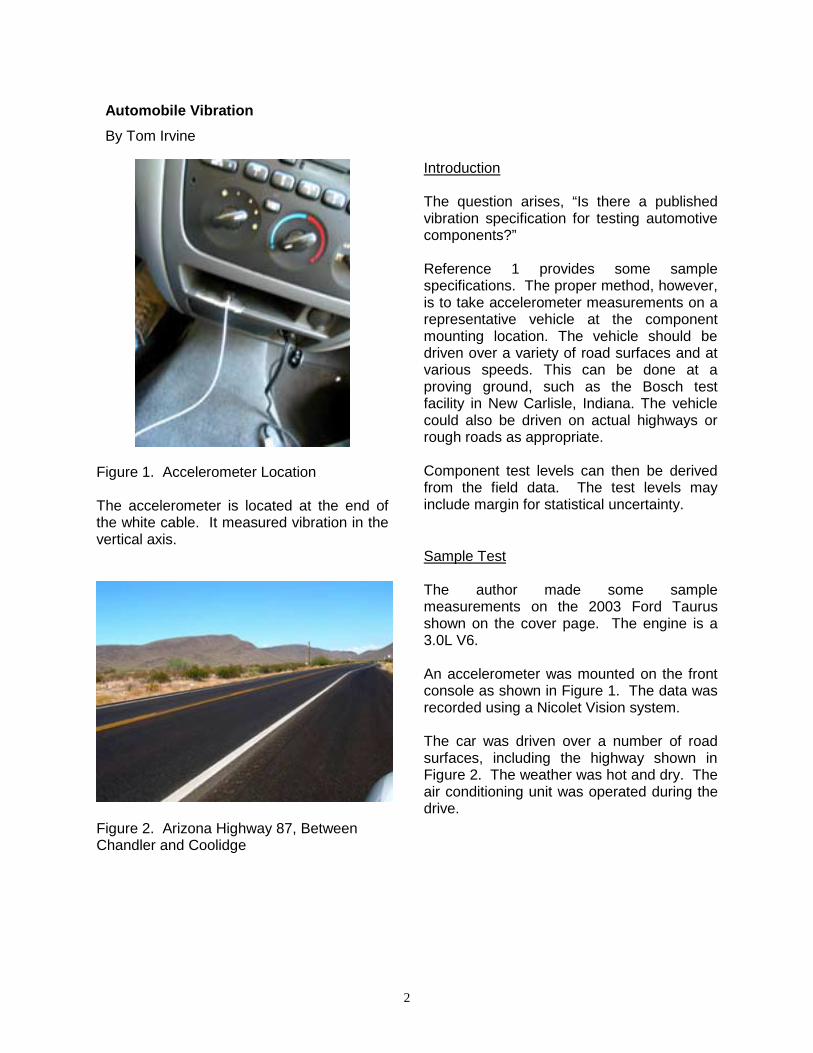
Figure 2. Arizona Highway 87, Between Chandler and Coolidge
Sample Test The author made some sample measurements on the 2003 Ford Taurus shown on the cover page. The engine is a 3.0L V6. An accelerometer was mounted on the front console as shown in Figure 1. The data was recorded using a Nicolet Vision system. The car was driven over a number of road surfaces, including the highway shown in Figure 2. The weather was hot and dry. The air conditioning unit was operated during the drive.
3
10-7
10-6
10-5
10-4
10-3
1 10 100 500
FREQUENCY (Hz)
ACC
EL (G
2 /Hz)
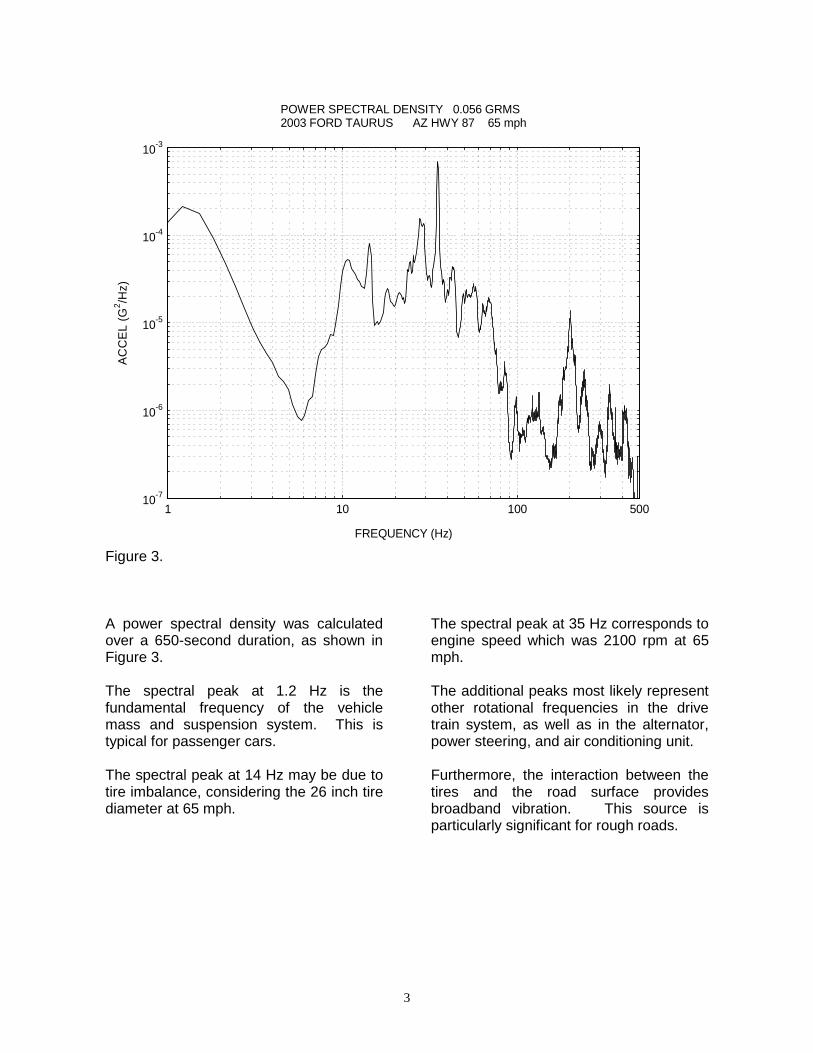
POWER SPECTRAL DENSITY 0.056 GRMS 2003 FORD TAURUS AZ HWY 87 65 mph
Figure 3. A power spectral density was calculated over a 650-second duration, as shown in Figure 3. The spectral peak at 1.2 Hz is the fundamental frequency of the vehicle mass and suspension system. This is typical for passenger cars. The spectral peak at 14 Hz may be due to tire imbalance, considering the 26 inch tire diameter at 65 mph.
The spectral peak at 35 Hz corresponds to engine speed which was 2100 rpm at 65 mph. The additional peaks most likely represent other rotational frequencies in the drive train system, as well as in the alternator, power steering, and air conditioning unit. Furthermore, the interaction between the tires and the road surface provides broadband vibration. This source is particularly significant for rough roads.
4
0
0.05
0.10
0.15
0.20
0.25
0 100 200 300 400 500 600
TIME (SEC)
STD
DEV
(G)
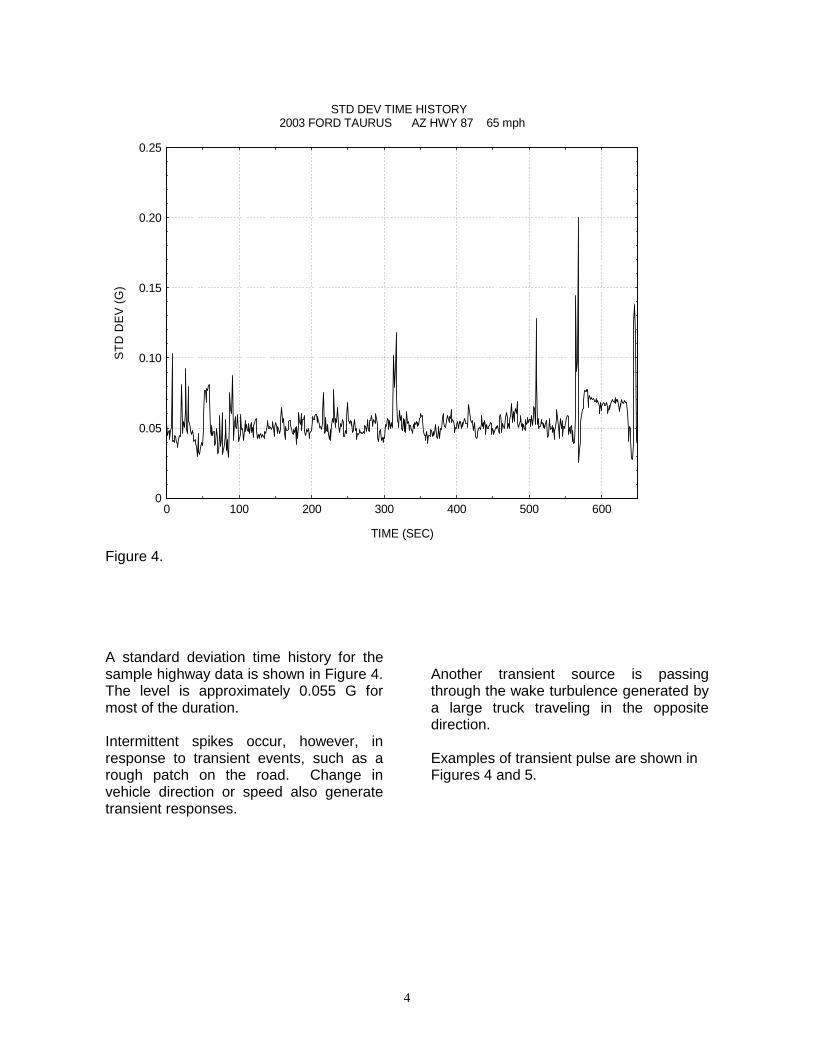
STD DEV TIME HISTORY 2003 FORD TAURUS AZ HWY 87 65 mph
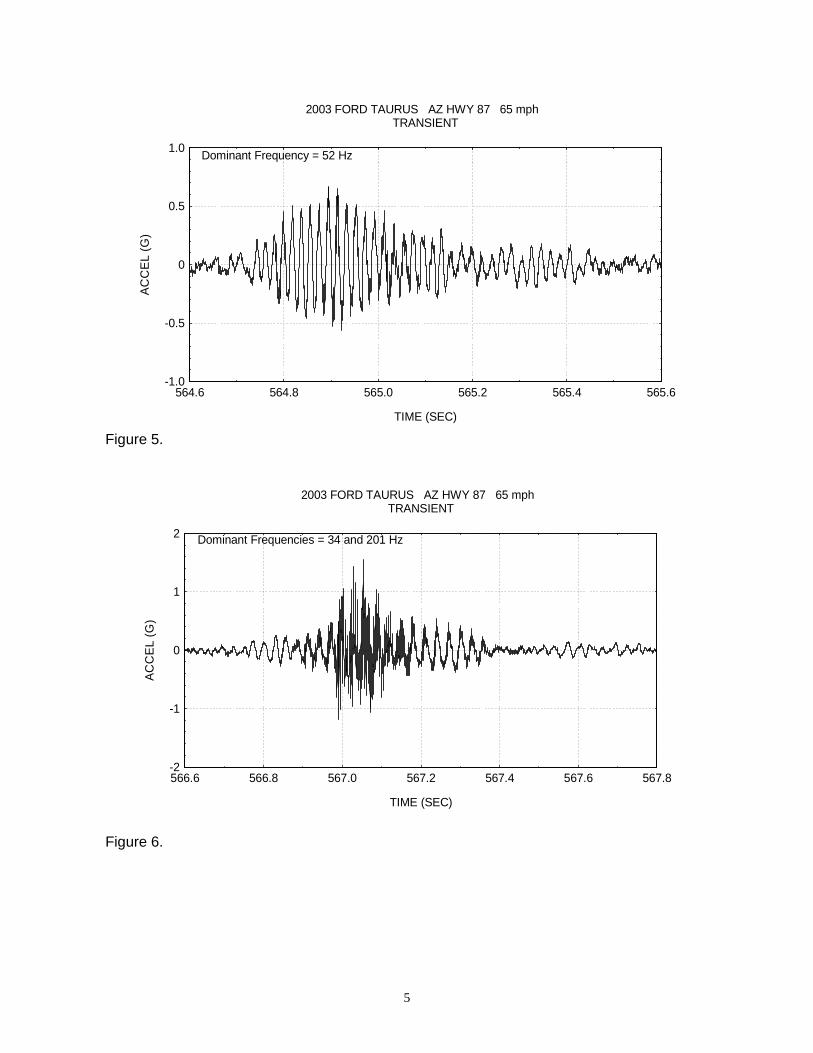
Figure 4. A standard deviation time history for the sample highway data is shown in Figure 4. The level is approximately 0.055 G for most of the duration. Intermittent spikes occur, however, in response to transient events, such as a rough patch on the road. Change in vehicle direction or speed also generate transient responses.
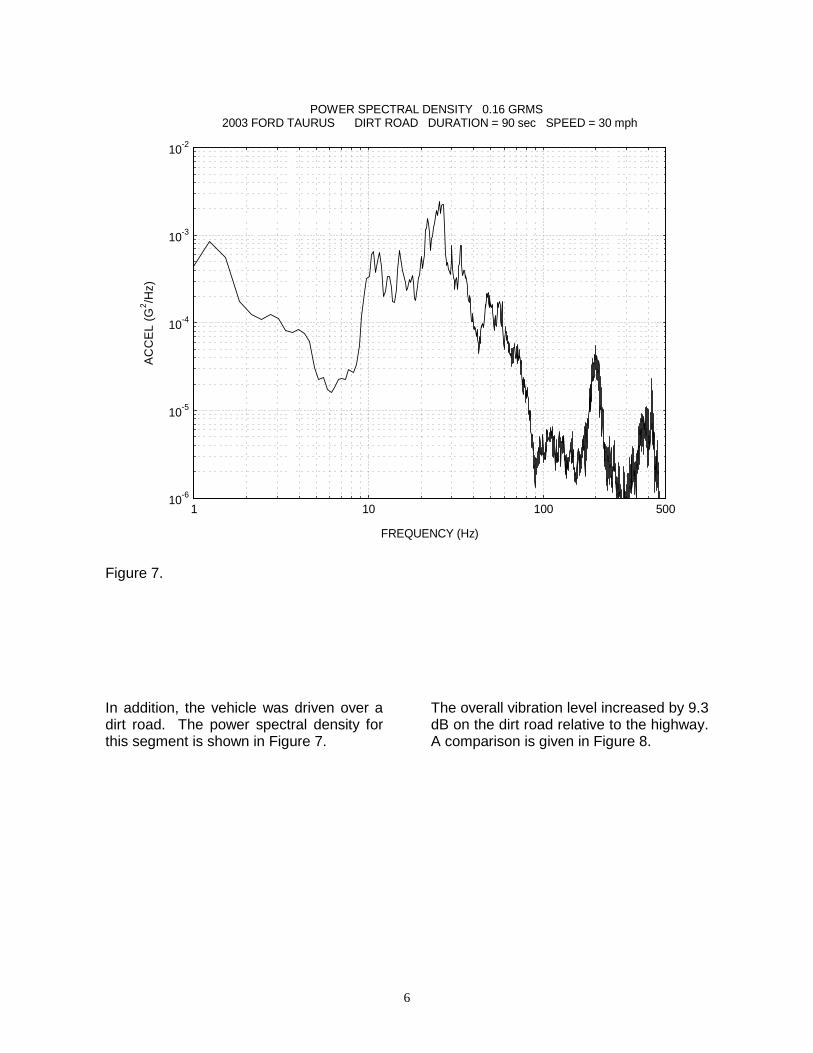
Another transient source is passing through the wake turbulence generated by a large truck traveling in the opposite direction. Examples of transient pulse are shown in Figures 4 and 5.
5
-1.0
-0.5
0
0.5
1.0
564.6 564.8 565.0 565.2 565.4 565.6
Dominant Frequency = 52 Hz
TIME (SEC)
ACC
EL (G
)
2003 FORD TAURUS AZ HWY 87 65 mph TRANSIENT
Figure 5.
-2
-1
0
1
2
566.6 566.8 567.0 567.2 567.4 567.6 567.8
Dominant Frequencies = 34 and 201 Hz
TIME (SEC)
ACC
EL (G
)
2003 FORD TAURUS AZ HWY 87 65 mph TRANSIENT
Figure 6.
6
10-6
10-5
10-4
10-3
10-2
1 10 100 500
FREQUENCY (Hz)
ACC
EL (G
2 /Hz)
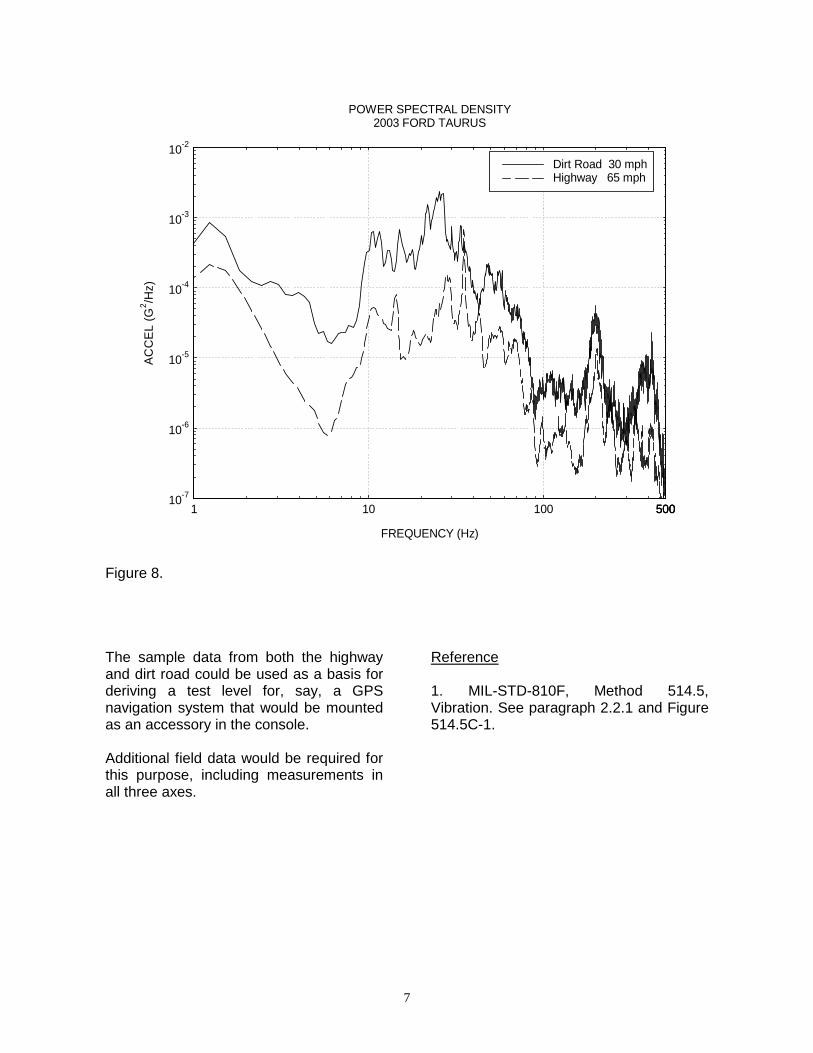
POWER SPECTRAL DENSITY 0.16 GRMS 2003 FORD TAURUS DIRT ROAD DURATION = 90 sec SPEED = 30 mph
Figure 7. In addition, the vehicle was driven over a dirt road. The power spectral density for this segment is shown in Figure 7.
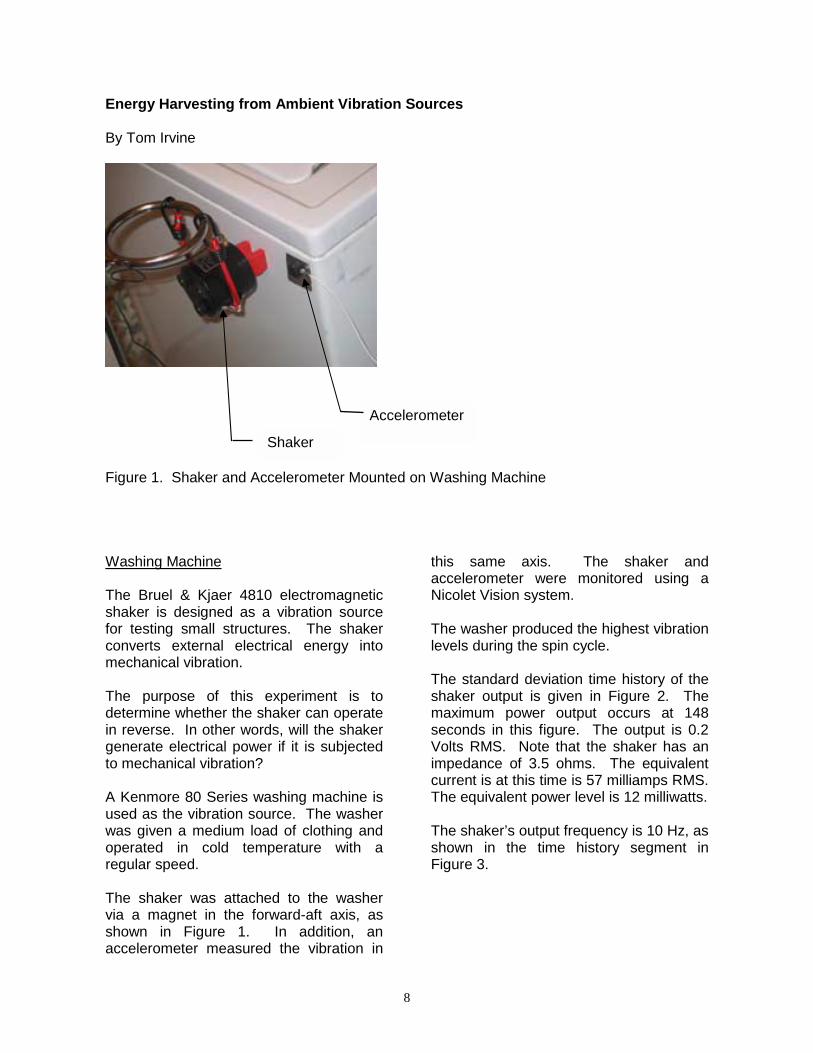
The overall vibration level increased by 9.3 dB on the dirt road relative to the highway. A comparison is given in Figure 8.
7
10-7
10-6
10-5
10-4
10-3
10-2
1 10 100 500500500
Dirt Road 30 mphHighway 65 mph
FREQUENCY (Hz)
ACC
EL (G
2 /Hz)
POWER SPECTRAL DENSITY2003 FORD TAURUS
Figure 8. The sample data from both the highway and dirt road could be used as a basis for deriving a test level for, say, a GPS navigation system that would be mounted as an accessory in the console. Additional field data would be required for this purpose, including measurements in all three axes.
Reference 1. MIL-STD-810F, Method 514.5, Vibration. See paragraph 2.2.1 and Figure 514.5C-1.
8
Energy Harvesting from Ambient Vibration Sources By Tom Irvine
Figure 1. Shaker and Accelerometer Mounted on Washing Machine Washing Machine The Bruel & Kjaer 4810 electromagnetic shaker is designed as a vibration source for testing small structures. The shaker converts external electrical energy into mechanical vibration. The purpose of this experiment is to determine whether the shaker can operate in reverse. In other words, will the shaker generate electrical power if it is subjected to mechanical vibration? A Kenmore 80 Series washing machine is used as the vibration source. The washer was given a medium load of clothing and operated in cold temperature with a regular speed. The shaker was attached to the washer via a magnet in the forward-aft axis, as shown in Figure 1. In addition, an accelerometer measured the vibration in
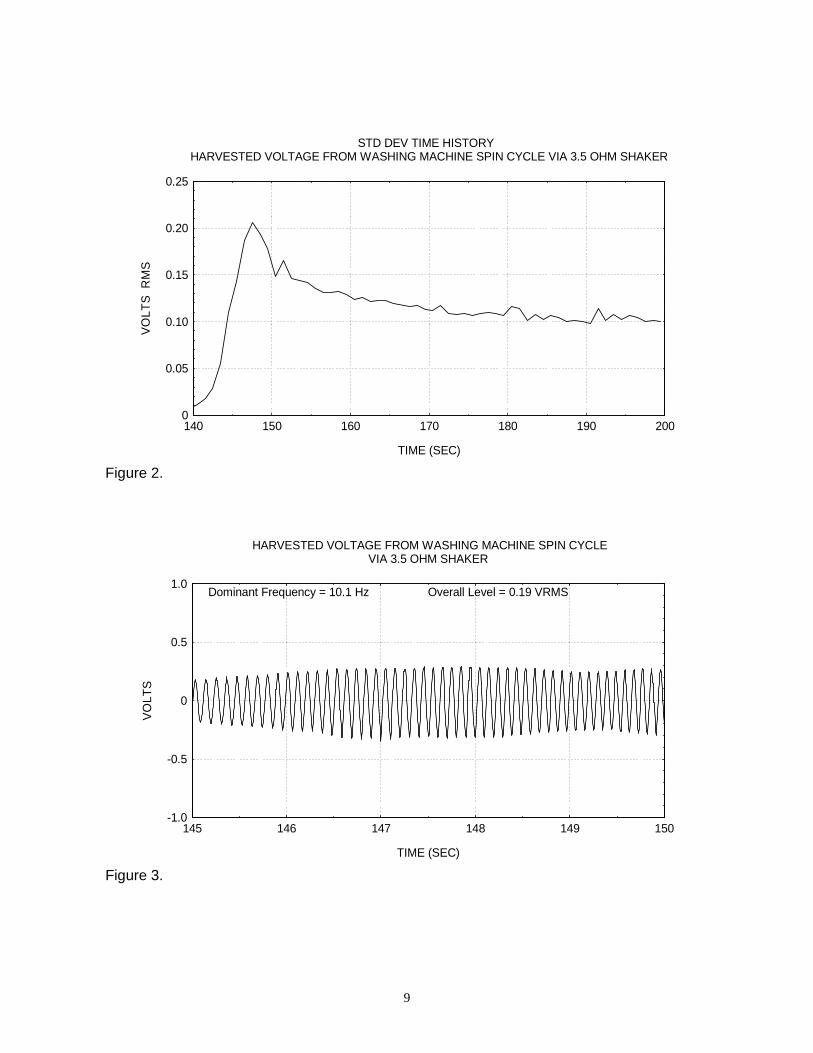
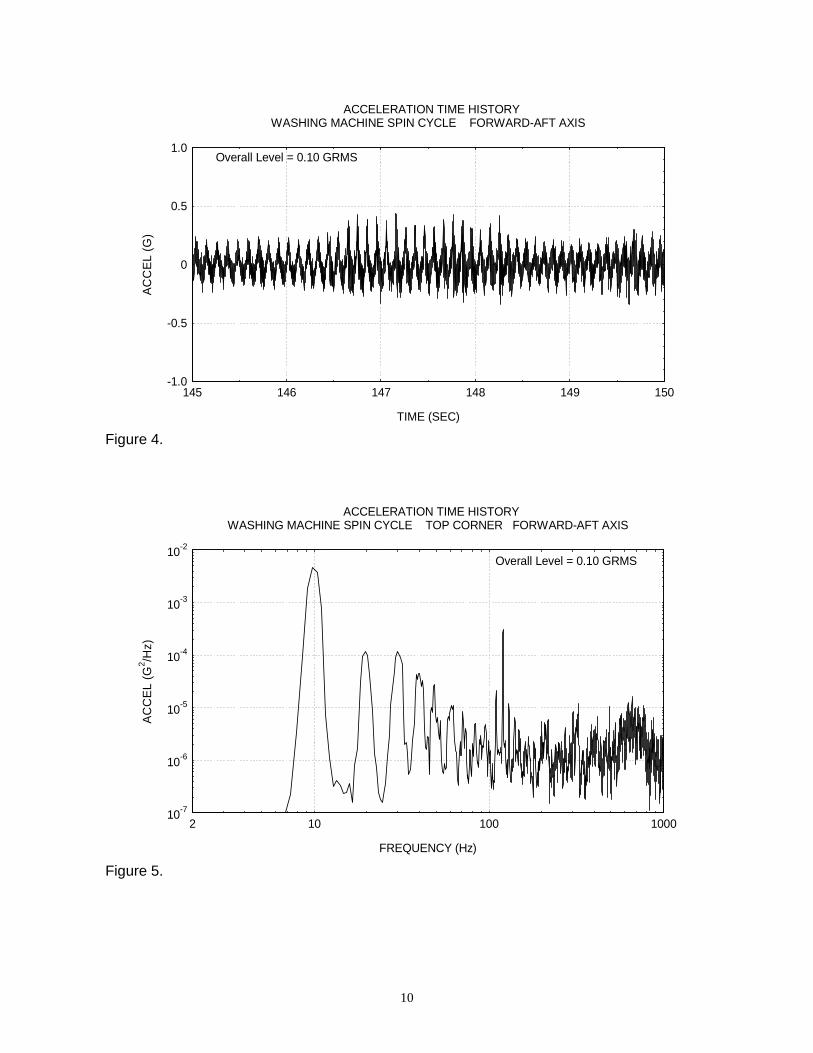
this same axis. The shaker and accelerometer were monitored using a Nicolet Vision system. The washer produced the highest vibration levels during the spin cycle. The standard deviation time history of the shaker output is given in Figure 2. The maximum power output occurs at 148 seconds in this figure. The output is 0.2 Volts RMS. Note that the shaker has an impedance of 3.5 ohms. The equivalent current is at this time is 57 milliamps RMS. The equivalent power level is 12 milliwatts. The shaker’s output frequency is 10 Hz, as shown in the time history segment in Figure 3.
Shaker
Accelerometer
9
0
0.05
0.10
0.15
0.20
0.25
140 150 160 170 180 190 200
TIME (SEC)
VOLT
S R
MS
STD DEV TIME HISTORY HARVESTED VOLTAGE FROM WASHING MACHINE SPIN CYCLE VIA 3.5 OHM SHAKER
Figure 2.
-1.0
-0.5
0
0.5
1.0
145 146 147 148 149 150
Dominant Frequency = 10.1 Hz Overall Level = 0.19 VRMS
TIME (SEC)
VOLT
S
HARVESTED VOLTAGE FROM WASHING MACHINE SPIN CYCLE VIA 3.5 OHM SHAKER
Figure 3.
10
-1.0
-0.5
0
0.5
1.0
145 146 147 148 149 150
Overall Level = 0.10 GRMS
TIME (SEC)
ACC
EL (G
)
ACCELERATION TIME HISTORYWASHING MACHINE SPIN CYCLE FORWARD-AFT AXIS
Figure 4.
10-7
10-6
10-5
10-4
10-3
10-2
10 100 10002
Overall Level = 0.10 GRMS
FREQUENCY (Hz)
AC
CEL
(G2 /H
z)
ACCELERATION TIME HISTORYWASHING MACHINE SPIN CYCLE TOP CORNER FORWARD-AFT AXIS
Figure 5.
11
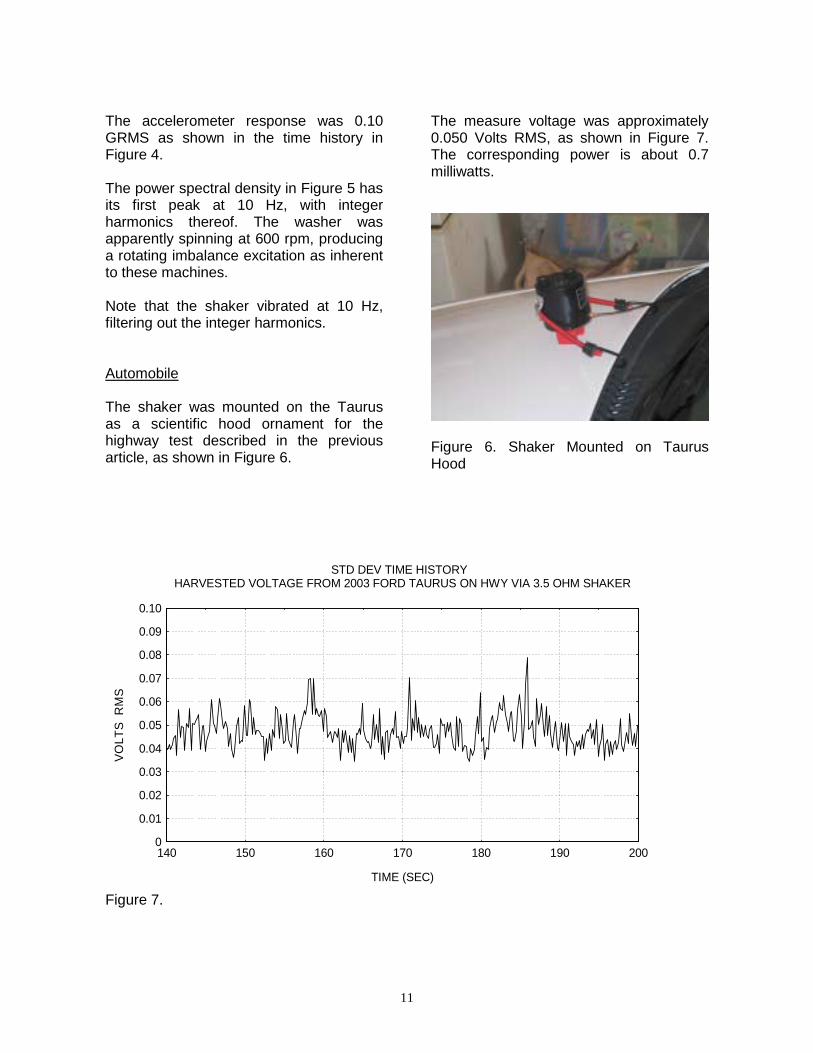
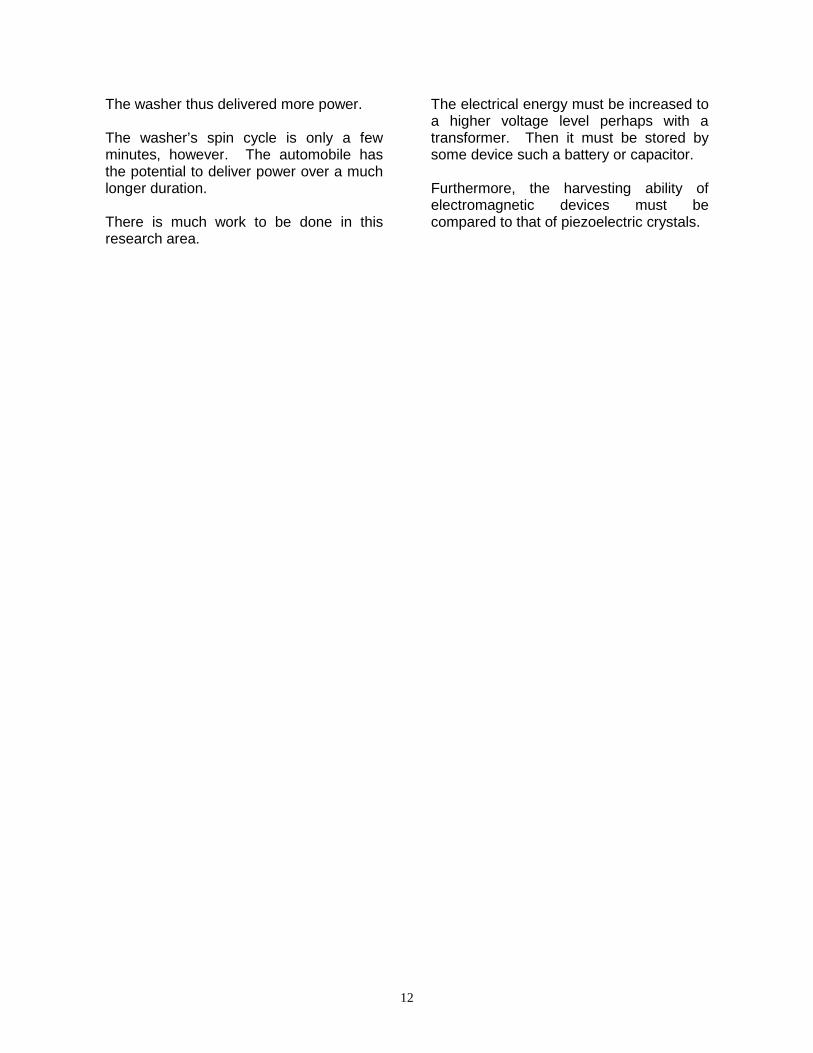
The accelerometer response was 0.10 GRMS as shown in the time history in Figure 4. The power spectral density in Figure 5 has its first peak at 10 Hz, with integer harmonics thereof. The washer was apparently spinning at 600 rpm, producing a rotating imbalance excitation as inherent to these machines. Note that the shaker vibrated at 10 Hz, filtering out the integer harmonics. Automobile The shaker was mounted on the Taurus as a scientific hood ornament for the highway test described in the previous article, as shown in Figure 6.
The measure voltage was approximately 0.050 Volts RMS, as shown in Figure 7. The corresponding power is about 0.7 milliwatts.
Figure 6. Shaker Mounted on Taurus Hood
0
0.01
0.02
0.03
0.04
0.05
0.06
0.07
0.08
0.09
0.10
140 150 160 170 180 190 200
TIME (SEC)
VOLT
S R
MS
STD DEV TIME HISTORY HARVESTED VOLTAGE FROM 2003 FORD TAURUS ON HWY VIA 3.5 OHM SHAKER
Figure 7.
12
The washer thus delivered more power. The washer’s spin cycle is only a few minutes, however. The automobile has the potential to deliver power over a much longer duration. There is much work to be done in this research area.
The electrical energy must be increased to a higher voltage level perhaps with a transformer. Then it must be stored by some device such a battery or capacitor. Furthermore, the harvesting ability of electromagnetic devices must be compared to that of piezoelectric crystals.