weipert et al-wind shear detection using radar and lidar ... · erad 2014 abstract id 058 3 figure...
TRANSCRIPT

ERAD 2014 - THE EIGHTH EUROPEAN CONFERENCE ON RADAR IN METEOROLOGY AND HYDROLOGY
ERAD 2014 Abstract ID 058 1 [email protected]
1 Introduction
At the German international airports of Frankfurt and Munich, low-level wind shear detection systems consisting of an X-
band polarimetric scanning radar and an IR scanning lidar have been installed in 2013. The systems perform 3D volume
scans at a repetition time of 5 minutes and 2D PPI scans using the glide slope angle of 3 degrees every minute. Non-
meteorological echoes are removed from radar data using various signal processor filters and a polarimetric fuzzy-logic radar
echo and hydrometeor classification. Lidar radial velocity and filtered radar radial velocity data are used to derive low-level
wind shear alerts using
(a) gust front (GF), microburst (MB) and runway-oriented shear (ROSHEAR) algorithms for horizontal wind shear
alerts; and
(b) a volume velocity processing (VVP) algorithm for vertical wind shear alerts
The first section of this paper illustrates the system setup and data processing. In the next section, methods to calculate the
data availability are explained. Results for Munich and Frankfurt are presented thereafter.
2 System Overview and Data Processing
The systems at both airports consist of a Meteor 50DX X-band polarimetric radar from Selex ES GmbH, Germany, and a
WindTracer 1.6 µm lidar from Lockheed Martin Coherent Technologies, Colorado, USA. The most important system and
scan characteristics are listed in table 1. Figure 1 shows photos of the system (in Frankfurt).
Table 1:System and scan characteristics.
Parameter Radar Lidar
Wavelength 3.2 cm 1.6 µm
PRF 2000:1600 Hz 750 Hz
Scan speed 18 deg/sec (3D scan up to 36 deg/sec) 14 deg/sec
Scan range 75 km 12-15 km
Radial resolution 0.15 km 0.10-0.12 km
Azimuthal resolution 1 deg ≈2.5 deg
Scan once per minute PPI @ 3 deg PPI @ 3 deg
Scan once per 5 minutes 3D scan (11 PPIs from 1.0 to 60.0 deg);
PPI scan @ 150 km range @ 0.5 deg
3D scan (5 PPIs from 1.5 to 20.0 deg);
1-2 RHI scans
Wind shear detection using radar and lidar at
Frankfurt and Munich airports
André Weipert1, Sebastian Kauczok
1, Ronald Hannesen
1, Thomas Ernsdorf
2 and Bernd Stiller
3
1Selex ES GmbH, Raiffeisenstr. 10, 41470 Neuss, Germany 2Deutscher Wetterdienst, Abteilung Flugmeteorologie, Frankfurter Str. 135, 63067 Offenbach am Main,
Germany 3Deutscher Wetterdienst, Abteilung Forschung und Entwicklung, Am Observatorium 12, 15848
Tauche/Lindenberg, Germany
(Dated: 15 July 2014)
Ronald Hannesen

ERAD 2014 - THE EIGHTH EUROPEAN CONFERENCE ON RADAR IN METEOROLOGY AND HYDROLOGY
ERAD 2014 Abstract ID 058 2
Figure 1: Radar (left) and lidar (right) in Frankfurt.
Polar radar moment data are provided by a GDRX signal processor, using (among other features) a DFT clutter filter, a
multi-trip-echo filter and an interference filter. Moment data are then processed using a two-step polarimetric fuzzy-logic
radar echo and hydrometeor classification (ECLASS; Selex ES, 2013):
1. Meteo-/Non-meteo classification
2. Hydrometeor-classification of the Meteo data
From the first step, corrected polar moment data are obtained with all non-meteorological data being removed.
The main purpose of the systems is detection of low-level wind shear. Thus lidar data and corrected radar data are used to
automatically generate a couple of products (separately for each sensor):
• Vertical wind profiles using the Volume Velocity Processing (VVP) algorithm (Waldteufel and Corbin, 1979),
providing vertical wind shear information (every 5 minutes)
• Microburst detection, providing horizontal wind shear information (every 5 minutes). For radar data, this is based
on Campbell (1989); for lidar data a simplified algorithm based on divergence detection is used (Selex ES, 2013)
• Gust front detection, based on Eilts et al. (1991), providing horizontal wind shear information (every 5 minutes)
• Runway-oriented wind shear detection (ROSHEAR; Selex ES, 2013), providing horizontal wind shear information
(every minute)
Due to its high update rate, the runway-oriented wind shear detection is the most useful one for air traffic control (ATC).
It essentially provides information on loss and gain of aircraft lift when approaching to or departing from the airport. It is
therefore recommended to have the sensors located in such a way that scanning directions are rather along the runways.
Figure 2 illustrates the geometry (From Selex ES, 2013): Results are best when the angle difference between the orientation
angle β of the runway and the azimuth angle α is close to zero or 180 degrees. Figure 3 shows an example of the situation in
Frankfurt. Most runway and flight segments are oriented rather parallel with the direction of observation.

ERAD 2014 - THE EIGHTH EUROPEAN CONFERENCE ON RADAR IN METEOROLOGY AND HYDROLOGY
ERAD 2014 Abstract ID 058 3
Figure 2: Geometry of the runway-oriented wind shear calculation
Figure 3: ROSHEAR example of Frankfurt (6th August 2013, 14:06 UTC) illustrating the optimized sensor location (left); and
corresponding radar radial velocity data (right)
In the last step, products from both sensors (radar and lidar) are merged into a single product. For each point of interested
in the product, radar and lidar data are combined:
• If data are available from radar only, these are used
• If data are available from lidar only, these are used
• If data are available from both radar and lidar, the final value is calculated as a weighted average, where various
quality control (QC) parameters influence the weights.
This last step requires having the sensors rather co-located. In Frankfurt, the distance between radar and lidar is about 20
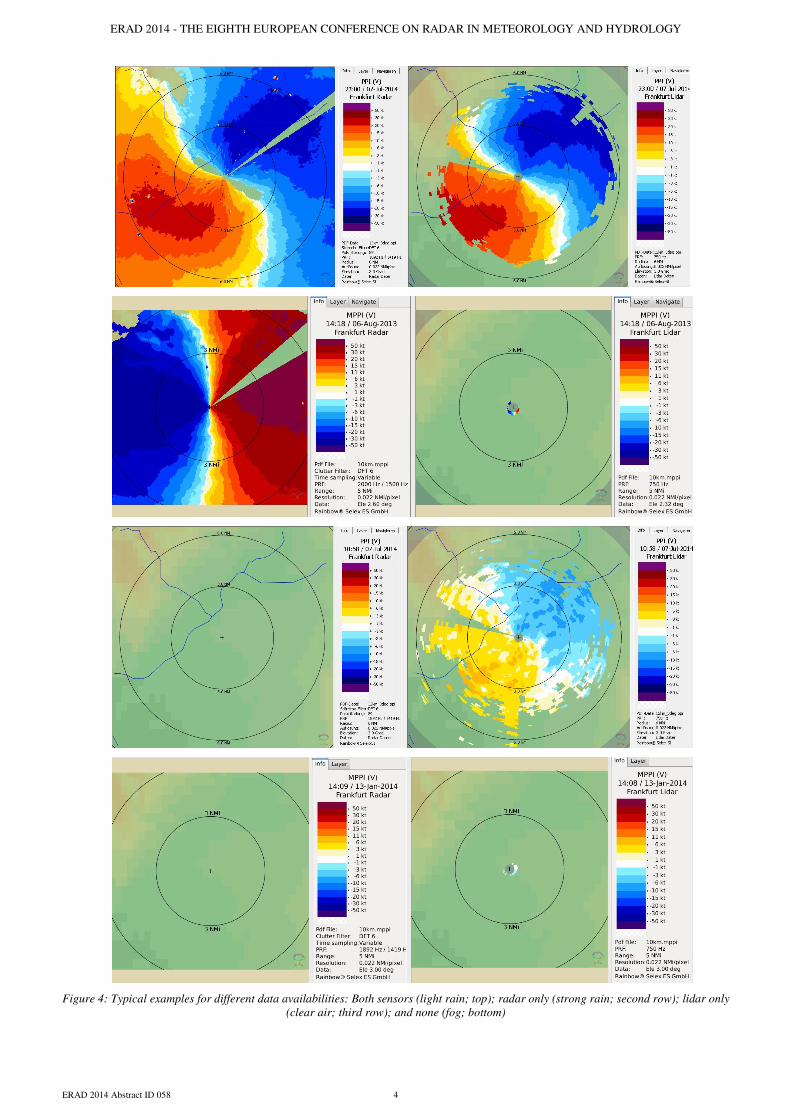
meters, and in Munich about 15 meters. Figure 4 shows typical examples for various situations where either both sensors, or
one sensor only, or no sensor contain data.
ERAD 2014 - THE EIGHTH EUROPEAN CONFERENCE ON RADAR IN METEOROLOGY AND HYDROLOGY
ERAD 2014 Abstract ID 058 4
Figure 4: Typical examples for different data availabilities: Both sensors (light rain; top); radar only (strong rain; second row); lidar only
(clear air; third row); and none (fog; bottom)

ERAD 2014 - THE EIGHTH EUROPEAN CONFERENCE ON RADAR IN METEOROLOGY AND HYDROLOGY
ERAD 2014 Abstract ID 058 5
3 Data availability calculation
Due to the main purpose of the system, the analysis is focused on the availability of polar radial velocity data in the 3deg
PPI scans, and the availability of data in the VVP and ROSHEAR products.
For the polar data in the 3deg PPI scans the lidar is used as reference (due to its much coarser azimuthal resolution). Radar
data of the nearest matching scan at the closest neighboring range gate are used for comparison.
For VVP, horizontal wind speed and direction are available for 30 layers in steps of 100 Ft (approximately 30 meters).
Results are considered valid only if a sophisticated QC was passed (Selex, 2013).
For ROSHEAR, flight-segment’s loss and gain are available for approximately 45 flight segments in Frankfurt and
approximately 25 flight segments in Munich. Again, results are considered valid only if a sophisticated QC was passed
(Selex, 2013).
For all products, the number of cases to be distinguished are four:
1. Both: valid data are available from both sensors
2. Radar only: valid data are available from radar, but not from lidar
3. Lidar only: valid data are available from lidar, but not from radar
4. None: valid data are neither available from radar, nor from lidar
All statistics in this study were first derived per month and then combined to overall statistics and to season-based
statistics. Additionally, the number of horizontal wind shear alerts from the ROSHEAR products and the number of vertical
wind shear alerts from the VVP products were counted. For this analysis, the case ‘both’ was considered if wind shear was
existing for the respective products, no matter if exactly at the same position.
To exclude periods of sensor maintenance or other periods of temporary shutdown of one sensor, data are only counted if
scans and products from both sensors are available. For radar, only ECLASS-filtered data are considered. As indicated above
in section 2, this includes rejection of all non-meteorological echoes. On the other hand, clear-air radar returns from insects
appear frequently, in particular in summer. Using such data also for the statistics would significantly increase the
availability, as can be seen in Figure 5. But Hannesen et al. (2014) demonstrated that radar radial velocity data from insects
can differ by several meters per second from true radial wind data. For this reason, the radar data were limited to
meteorological echoes only, in order to ensure a stable and reliable derivation of wind data and wind shear alerts so that ATC
requirements are met.
Figure 5: Availability of 3-deg PPI radial velocity data as a function of range (Munich; summer season). For the left figure,
meteorological and insect returns were considered in radar data, for the right figure meteorological data only.

ERAD 2014 - THE EIGHTH EUROPEAN CONFERENCE ON RADAR IN METEOROLOGY AND HYDROLOGY
ERAD 2014 Abstract ID 058 6
4 Results for Munich
4.1 3-deg PPI data
Figure 6 shows the availability of 3-deg PPI radial velocity data as a function of range, for an 11-month period. Figure 7
shows the same while distinguishing between summer season (5 months) and winter season (5 months).
Figure 6: Availability of 3-deg PPI radial velocity data as a function of range (Munich)
Figure 7: Same as Figure 6, but distinguishing between summer (left) and winter (right).

ERAD 2014 - THE EIGHTH EUROPEAN CONFERENCE ON RADAR IN METEOROLOGY AND HYDROLOGY
ERAD 2014 Abstract ID 058 7
Radar data (i.e. meteorological radar data) are available about 10 percent of the time. This is rather independent of range
(except for the first kilometer). This means that at about 10 percent of the time precipitation occurs. In other climatic
regimes, this figure may be better or worse. Lidar data are available at more than 90 percent of the time at small ranges and
below 50 percent of the time at distances above 10 kilometers. Again, this figure may be better or worse in different climatic
regimes. Also, the availability depends on various scan parameters, which were not changed during the study period.
Figure 8 shows the dependency on azimuth; for a ranges of 2 and 6 kilometers. Sectors of frequent blocking from various
obstacles can be identified in this figure.
Figure 8: Availability of 3-deg PPI radial velocity data as a function of azimuth (Munich) for ranges of 2 km (top) and 6 km (bottom)

ERAD 2014 - THE EIGHTH EUROPEAN CONFERENCE ON RADAR IN METEOROLOGY AND HYDROLOGY
ERAD 2014 Abstract ID 058 8
The data availability is also depending on time of day, as can be seen from Figure 9. For radar data in summer, a
significant dependency on the time of day can be found due to higher convective activity in the afternoon with higher chance
of precipitation. In winter, the availability of lidar data significantly depends on time of day, with a minimum around early
morning when the chance of fog is highest.
Figure 9: Availability of 3-deg PPI radial velocity data as a function of azimuth (Munich): summer (top) and winter (bottom)

ERAD 2014 - THE EIGHTH EUROPEAN CONFERENCE ON RADAR IN METEOROLOGY AND HYDROLOGY
ERAD 2014 Abstract ID 058 9
4.2 ROSHEAR data
The range dependency of data availability can also be found in the ROSHEAR data, Figure 10. Radar data are available in
about 10 percent of the time (almost independent of distance); lidar data more often, but with significant reduction at larger
distances.
Figure 10: Availability of ROSHEAR data from May 2013 until March 2014 (Munich): All cases (left); runways segments and flight
segments up to 3 NMi (center); and flight segments beyond 3 NMI (right)
In 443 cases from May 2013 until March 2014, a horizontal wind shear alert was issued from the ROSHEAR algorithm.
In such case, the loss or gain exceeded 15 Kt in at least one runway or fight segment. About 25 percent of such cases were
observed in the radar data; which is a significantly higher figure than for wind data and ROSHEAR data in general.
Figure 11: Availability of ROSHEAR horizontal wind shear alerts (May 2013 until March 2014; Munich)

ERAD 2014 - THE EIGHTH EUROPEAN CONFERENCE ON RADAR IN METEOROLOGY AND HYDROLOGY
ERAD 2014 Abstract ID 058 10
4.3 VVP data
For low-level wind profiles using the VVP algorithm, data availability is rather constant with height (exhibiting a slight
decrease with increasing height for the lidar data). Figure 12 also shows the over-all availability.
Figure 12: Availability of VVP data from May 2013 until March 2014 (Munich): All cases (top); as a function of layer height (bottom)
Figure 13 shows the data availability as function of the VVP horizontal wind speed. Here, the total number of cases is
given. In that figure, “COMBI 2” represents cases where both sensors provide valid data, and “COMBI 1” where at least one
sensor provides valid data. The layers L1, L3 and L5 represent the altitudes 1000 to 600 Ft above ground, 1300 to 1800 Ft,

ERAD 2014 - THE EIGHTH EUROPEAN CONFERENCE ON RADAR IN METEOROLOGY AND HYDROLOGY
ERAD 2014 Abstract ID 058 11
and 2500 to 3000 Ft above ground, respectively. The figure firstly demonstrates that small wind speeds appear in low levels
more often than in high levels, and vice-versa for high wind speeds above about 10 m/s. Secondly, low wind speed data are
available from lidar about ten times more often than from radar, whereas the fraction of radar counts increases with wind
speed, and for speeds above about 25 m/s at higher levels, the amount of counts from radar and from lidar are almost the
same. The reason is that strong winds often occur in bad weather conditions with higher chance of precipitation.
Figure 13: Availability of VVP data as a function of wind speed (August 2013 until June 2014; Munich)
In 751 cases from May 2013 until March 2014, a vertical wind shear alert was issued from the VVP algorithm. In such
cases, the vertical shear of the horizontal wind vector exceeded 5 Kt / 100 Ft in at least one layer. Almost all these cases are
from lidar data (see Figure 14); most of them happen in rather clear nights with low-level temperature inversion and low-
level-jet.
Figure 14: Availability of VVP vertical wind shear alerts (May 2013 until March 2014; Munich)

ERAD 2014 - THE EIGHTH EUROPEAN CONFERENCE ON RADAR IN METEOROLOGY AND HYDROLOGY
ERAD 2014 Abstract ID 058 12
5 Results for Frankfurt
5.1 3-deg PPI data
Figure 15 shows the availability of 3-deg PPI radial velocity data as a function of range, for a 7-month period from
December 2013 until June 2014. The distribution is similar to that from Munich in winter; see Figure 7.
Figure 15: Availability of 3-deg PPI radial velocity data as a function of range (Frankfurt)

ERAD 2014 - THE EIGHTH EUROPEAN CONFERENCE ON RADAR IN METEOROLOGY AND HYDROLOGY
ERAD 2014 Abstract ID 058 13
5.2 ROSHEAR data
The range dependency of data availability can also be found in the ROSHEAR data. Figure 16 shows the results for an 11-
month period. Radar data are available in about 10 percent of the time (almost independent of distance), while lidar data are
available more often, but with significant reduction at larger distances.
Figure 16: Availability of ROSHEAR data from August 2013 until June 2014 (Frankfurt): All cases (left); runways segments and flight
segments up to 3 NMi (center); and flight segments beyond 3 NMI (right)
In 1160 cases from August 2013 until June 2014, a horizontal wind shear alert was issued from the ROSHEAR algorithm.
In such case, the loss or gain exceeded 15 Kt in at least one runway or fight segment. More than 75 percent of such cases
were observed in the radar data. This is a significantly higher figure than for wind data and ROSHEAR data in general and
indicates that a large amount of horizontal wind shear is related to precipitation, in particular to convective one.
Figure 17: Availability of ROSHEAR horizontal wind shear alerts (August 2013 until June 2014; Frankfurt)

ERAD 2014 - THE EIGHTH EUROPEAN CONFERENCE ON RADAR IN METEOROLOGY AND HYDROLOGY
ERAD 2014 Abstract ID 058 14
5.3 VVP data
Similar to Munich, data availability is rather constant with height for low-level wind profiles using the VVP algorithm
(exhibiting a slight decrease with increasing height for the lidar data). Figure 18 also shows the over-all availability.
Figure 18: Availability of VVP data from August 2013 until June 2014 (Frankfurt): All cases (top); as function of layer height (bottom)
Similar to Figure 13, Figure 19 shows the data availability as a function of the VVP horizontal wind speed. The figure
confirms the results from Munich: Firstly, small wind speeds appear at low levels more often than at high levels, and vice-
versa for wind speeds above about 10 m/s. Secondly, low wind speed data are available from lidar about ten times more
often than from radar, whereas the fraction of radar counts increases with wind speed, and for speeds above about 25 m/s at
higher levels, the number of counts from radar and from lidar are almost the same.

ERAD 2014 - THE EIGHTH EUROPEAN CONFERENCE ON RADAR IN METEOROLOGY AND HYDROLOGY
ERAD 2014 Abstract ID 058 15
Figure 19: Availability of VVP data as function of wind speed (August 2013 until June 2014; Frankfurt)
In 354 cases from August 2013 until June 2014, a vertical wind shear alert was issued by the VVP algorithm. In such
cases, the vertical shear of the horizontal wind vector exceeded 5 Kt / 100 Ft in at least one layer. Similar to Munich, the
large majority of cases are from lidar data (see Figure 20). Most of them happen in rather clear nights with low-level
temperature inversion and low-level-jet.
Figure 20: Availability of VVP vertical wind shear alerts (August 2013 until June 2014; Frankfurt)

ERAD 2014 - THE EIGHTH EUROPEAN CONFERENCE ON RADAR IN METEOROLOGY AND HYDROLOGY
ERAD 2014 Abstract ID 058 16
6 Summary and conclusions
Approximately one year’s data measured by low-level wind shear alert systems at Frankfurt and Munich airports, each
one consisting of an X-band polarimetric radar and an IR lidar, were analyzed. At small ranges up to about 3 kilometers,
lidar data are available at more than 90 percent of the time. For larger ranges, this figure decreases rapidly to below 50
percent at more than 10 kilometers distance. Radar data from meteorological echoes are available at about 10 percent of the
time, rather independent of range. The data availability depends on season, in particular for lidar. Also, a dependence of the
data availability on the time of day can be found. Data availabilities of runway oriented shear (ROSHEAR) and low-level
VVP wind profiles are similar to that.
Considering horizontal wind shear alerts from the ROSHEAR algorithm, the fraction of alerts resulting from radar data is
higher than that of raw wind data. In Frankfurt, about 75 percent of the alerts are resulting from radar data only and about 20
percent from lidar data only. This means that a relatively large amount of horizontal wind shear is related to precipitation.
The large majority of vertical wind shear alerts, obtained from low-level VVP wind profiles, is based on lidar data only.
Just a few percent of the cases result from radar data. The reason is that most low-level wind shear events happen in rather
clear nights with low-level temperature inversion and low-level-jet.
Limiting the radar data to meteorological echoes only, as done for the results of this study, ensures a stable and reliable
derivation of wind data and wind shear alerts. However, in particular in summer, a lot of clear air radar data resulting from
insects are available which were not considered for this study. If done otherwise, the amount of radar data would be
significantly higher than presented in sections 4 and 5. Figure 5 in section 3 illustrates that during up to about 50 percent of
the time, radar data would then be available. But it has been shown that radial velocity data from insects can differ by several
meters per second from true radial wind data (Hannesen et al., 2014); thus such clear air data have not been considered in
this study.
References
Campbell, S.D. (1989): Use of features aloft in the TDWR microburst recognition algorithm. 24th
Conf. on Radar Meteorol.,
Tallahassee, USA, pp. 167 – 170.
Eilts, M.D., Olson, S.H., Stumpf, G.J., Hermes L.G., Abrevaya, A., Culbert, J., Thomas, K.W., Hondl, K., and Klinge-
Wilson, D. (1991): an improved gust front detection algorithm for the TDWR. 25th Conf. on Radar Meteorol., Paris, France,
pp. J37 – J42.
Hannesen, R., Kauczok, S., and Weipert, A. (2014): Quality of clear-air radar radial velocity data: Do insects matter? 8th
Europ. Conf. on Radar in Meteorol. and Hydrol., Garmisch-Partenkirchen, Germany.
Selex ES (2013): Software Manual Rainbow®5. Products and Algorthms. Release 5.39.0, September 2013.
Waldteufel P. and Corbin H. (1979): On the analysis of single Doppler data. J. Appl. Meteorol. Vol. 18. - pp. 532 - 542.